Coweta County, GA
Coweta County Map
Coweta County Overview
147,449
TOTAL POPULATION
71,903
MALE POPULATION
75,546
FEMALE POPULATION
95.18
MALES / 100 FEMALES
105.07
FEMALES / 100 MALES
39.1
MEDIAN AGE
3.1
AVG FAMILY SIZE
2.7
AVG HOUSEHOLD SIZE
$41,373
PER CAPITA INCOME
$105,403
AVG FAMILY INCOME
$90,031
AVG HOUSEHOLD INCOME
32.4%
WAGE / INCOME GAP [ % ]
67.6¢/ $1
WAGE / INCOME GAP [ $ ]
$9,182
FAMILY INCOME DEFICIT
0.42
INEQUALITY / GINI INDEX
75,437
LABOR FORCE [ PEOPLE ]
64.4%
PERCENT IN LABOR FORCE
2.8%
UNEMPLOYMENT RATE
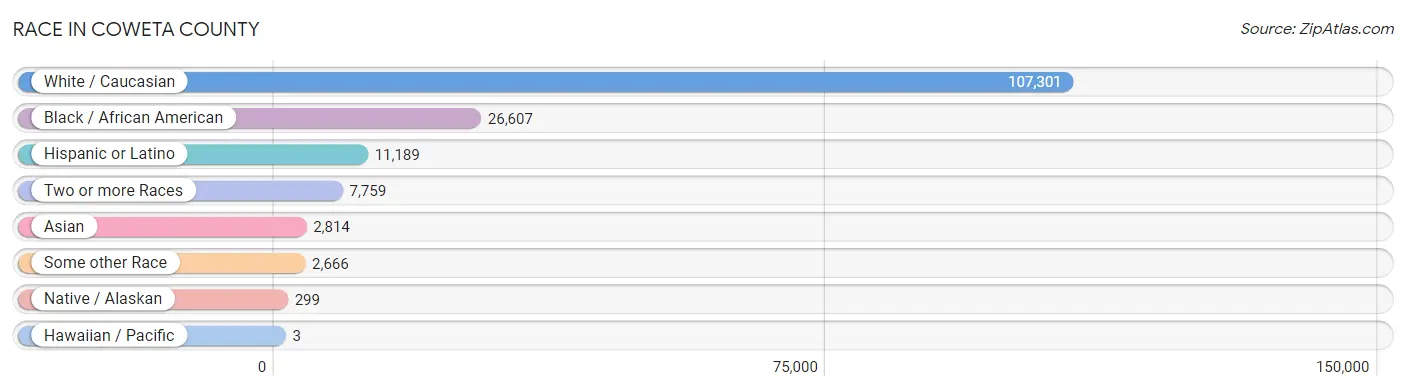
Race in Coweta County
The most populous races in Coweta County are White / Caucasian (107,301 | 72.8%), Black / African American (26,607 | 18.0%), and Hispanic or Latino (11,189 | 7.6%).
| Race | # Population | % Population |
| Asian | 2,814 | 1.9% |
| Black / African American | 26,607 | 18.0% |
| Hawaiian / Pacific | 3 | 0.0% |
| Hispanic or Latino | 11,189 | 7.6% |
| Native / Alaskan | 299 | 0.2% |
| White / Caucasian | 107,301 | 72.8% |
| Two or more Races | 7,759 | 5.3% |
| Some other Race | 2,666 | 1.8% |
| Total | 147,449 | 100.0% |
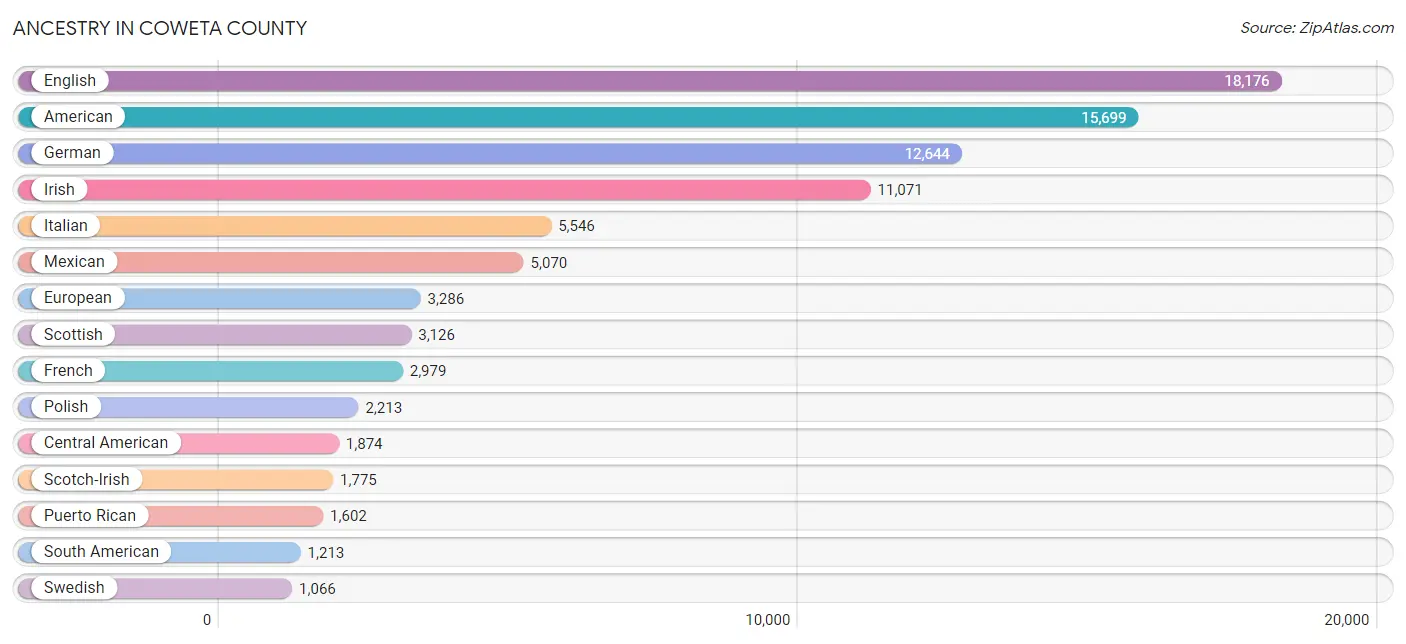
Ancestry in Coweta County
The most populous ancestries reported in Coweta County are English (18,176 | 12.3%), American (15,699 | 10.6%), German (12,644 | 8.6%), Irish (11,071 | 7.5%), and Italian (5,546 | 3.8%), together accounting for 42.8% of all Coweta County residents.
| Ancestry | # Population | % Population |
| African | 642 | 0.4% |
| Albanian | 215 | 0.2% |
| American | 15,699 | 10.6% |
| Apache | 35 | 0.0% |
| Arab | 428 | 0.3% |
| Argentinean | 100 | 0.1% |
| Australian | 15 | 0.0% |
| Austrian | 197 | 0.1% |
| Bahamian | 18 | 0.0% |
| Belgian | 192 | 0.1% |
| Belizean | 69 | 0.1% |
| Bermudan | 24 | 0.0% |
| Bhutanese | 506 | 0.3% |
| Blackfeet | 18 | 0.0% |
| Bolivian | 116 | 0.1% |
| Brazilian | 69 | 0.1% |
| British | 996 | 0.7% |
| British West Indian | 596 | 0.4% |
| Burmese | 654 | 0.4% |
| Cajun | 13 | 0.0% |
| Canadian | 233 | 0.2% |
| Central American | 1,874 | 1.3% |
| Central American Indian | 77 | 0.1% |
| Cherokee | 547 | 0.4% |
| Chilean | 26 | 0.0% |
| Chippewa | 15 | 0.0% |
| Choctaw | 43 | 0.0% |
| Colombian | 421 | 0.3% |
| Costa Rican | 185 | 0.1% |
| Cree | 4 | 0.0% |
| Creek | 21 | 0.0% |
| Croatian | 103 | 0.1% |
| Cuban | 366 | 0.3% |
| Czech | 89 | 0.1% |
| Czechoslovakian | 103 | 0.1% |
| Danish | 281 | 0.2% |
| Dominican | 262 | 0.2% |
| Dutch | 1,009 | 0.7% |
| Eastern European | 296 | 0.2% |
| Ecuadorian | 71 | 0.1% |
| Egyptian | 70 | 0.1% |
| English | 18,176 | 12.3% |
| Ethiopian | 272 | 0.2% |
| European | 3,286 | 2.2% |
| Filipino | 9 | 0.0% |
| Finnish | 144 | 0.1% |
| French | 2,979 | 2.0% |
| French Canadian | 418 | 0.3% |
| German | 12,644 | 8.6% |
| Greek | 640 | 0.4% |
| Guamanian / Chamorro | 18 | 0.0% |
| Guatemalan | 705 | 0.5% |
| Haitian | 156 | 0.1% |
| Honduran | 473 | 0.3% |
| Hungarian | 286 | 0.2% |
| Icelander | 14 | 0.0% |
| Indian (Asian) | 795 | 0.5% |
| Iranian | 29 | 0.0% |
| Irish | 11,071 | 7.5% |
| Iroquois | 19 | 0.0% |
| Italian | 5,546 | 3.8% |
| Jamaican | 568 | 0.4% |
| Korean | 724 | 0.5% |
| Lebanese | 221 | 0.2% |
| Lithuanian | 72 | 0.1% |
| Lumbee | 37 | 0.0% |
| Malaysian | 17 | 0.0% |
| Mexican | 5,070 | 3.4% |
| Mexican American Indian | 96 | 0.1% |
| Native Hawaiian | 87 | 0.1% |
| Navajo | 54 | 0.0% |
| Nicaraguan | 263 | 0.2% |
| Nigerian | 15 | 0.0% |
| Northern European | 33 | 0.0% |
| Norwegian | 1,033 | 0.7% |
| Panamanian | 138 | 0.1% |
| Pennsylvania German | 14 | 0.0% |
| Peruvian | 307 | 0.2% |
| Polish | 2,213 | 1.5% |
| Portuguese | 241 | 0.2% |
| Puerto Rican | 1,602 | 1.1% |
| Romanian | 32 | 0.0% |
| Russian | 434 | 0.3% |
| Salvadoran | 110 | 0.1% |
| Scandinavian | 409 | 0.3% |
| Scotch-Irish | 1,775 | 1.2% |
| Scottish | 3,126 | 2.1% |
| Seminole | 101 | 0.1% |
| Serbian | 15 | 0.0% |
| Slavic | 15 | 0.0% |
| Slovak | 162 | 0.1% |
| Slovene | 12 | 0.0% |
| South American | 1,213 | 0.8% |
| Spaniard | 161 | 0.1% |
| Spanish | 261 | 0.2% |
| Sri Lankan | 548 | 0.4% |
| Subsaharan African | 1,063 | 0.7% |
| Swedish | 1,066 | 0.7% |
| Swiss | 179 | 0.1% |
| Syrian | 45 | 0.0% |
| Thai | 885 | 0.6% |
| Trinidadian and Tobagonian | 128 | 0.1% |
| Turkish | 54 | 0.0% |
| U.S. Virgin Islander | 26 | 0.0% |
| Ukrainian | 170 | 0.1% |
| Uruguayan | 119 | 0.1% |
| Venezuelan | 53 | 0.0% |
| Welsh | 966 | 0.7% |
| West Indian | 95 | 0.1% | View All 109 Rows |
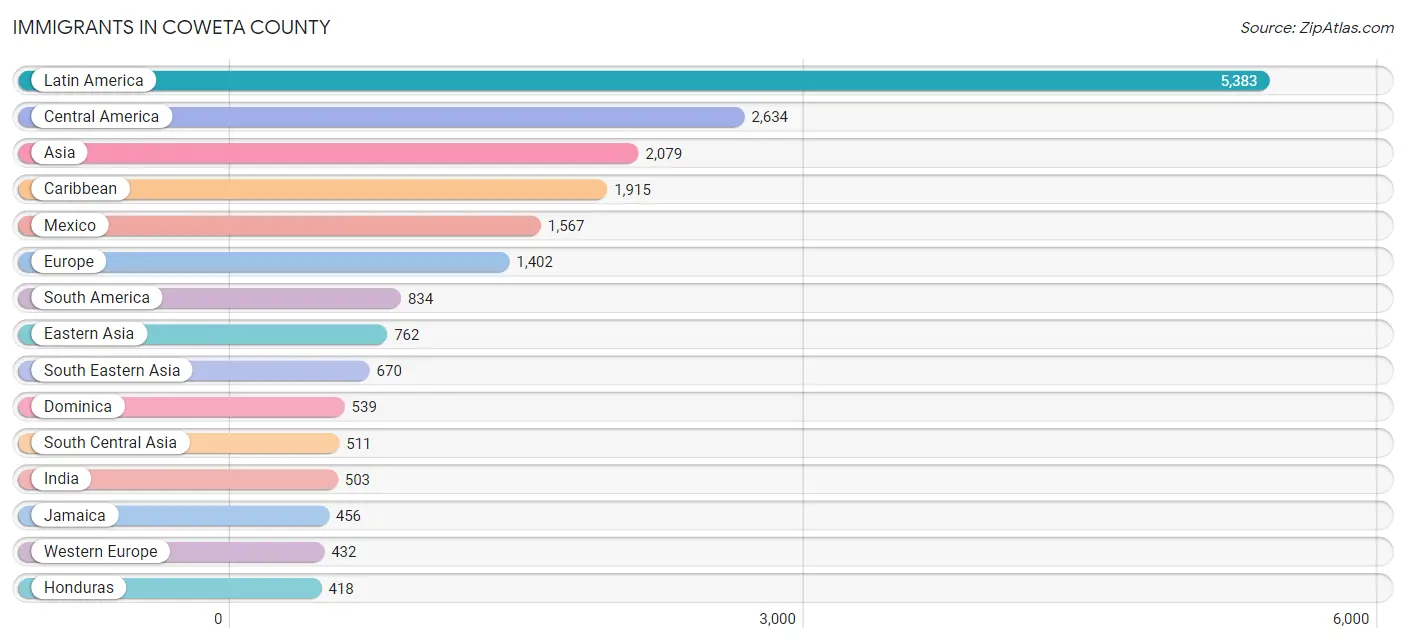
Immigrants in Coweta County
The most numerous immigrant groups reported in Coweta County came from Latin America (5,383 | 3.6%), Central America (2,634 | 1.8%), Asia (2,079 | 1.4%), Caribbean (1,915 | 1.3%), and Mexico (1,567 | 1.1%), together accounting for 9.2% of all Coweta County residents.
| Immigration Origin | # Population | % Population |
| Africa | 216 | 0.2% |
| Argentina | 65 | 0.0% |
| Asia | 2,079 | 1.4% |
| Australia | 10 | 0.0% |
| Austria | 15 | 0.0% |
| Bahamas | 18 | 0.0% |
| Barbados | 13 | 0.0% |
| Belgium | 127 | 0.1% |
| Belize | 36 | 0.0% |
| Bolivia | 146 | 0.1% |
| Brazil | 52 | 0.0% |
| Canada | 328 | 0.2% |
| Caribbean | 1,915 | 1.3% |
| Central America | 2,634 | 1.8% |
| Chile | 26 | 0.0% |
| China | 326 | 0.2% |
| Colombia | 291 | 0.2% |
| Costa Rica | 107 | 0.1% |
| Cuba | 66 | 0.0% |
| Czechoslovakia | 89 | 0.1% |
| Dominica | 539 | 0.4% |
| Dominican Republic | 1 | 0.0% |
| Eastern Africa | 10 | 0.0% |
| Eastern Asia | 762 | 0.5% |
| Eastern Europe | 234 | 0.2% |
| Ecuador | 26 | 0.0% |
| El Salvador | 110 | 0.1% |
| England | 163 | 0.1% |
| Ethiopia | 10 | 0.0% |
| Europe | 1,402 | 0.9% |
| France | 94 | 0.1% |
| Germany | 153 | 0.1% |
| Ghana | 54 | 0.0% |
| Greece | 174 | 0.1% |
| Guatemala | 348 | 0.2% |
| Haiti | 137 | 0.1% |
| Honduras | 418 | 0.3% |
| Hong Kong | 30 | 0.0% |
| Hungary | 16 | 0.0% |
| India | 503 | 0.3% |
| Iran | 8 | 0.0% |
| Italy | 39 | 0.0% |
| Jamaica | 456 | 0.3% |
| Japan | 39 | 0.0% |
| Korea | 397 | 0.3% |
| Laos | 17 | 0.0% |
| Latin America | 5,383 | 3.6% |
| Lebanon | 24 | 0.0% |
| Malaysia | 30 | 0.0% |
| Mexico | 1,567 | 1.1% |
| Netherlands | 35 | 0.0% |
| Nicaragua | 4 | 0.0% |
| Northern Europe | 331 | 0.2% |
| Norway | 9 | 0.0% |
| Oceania | 10 | 0.0% |
| Panama | 44 | 0.0% |
| Peru | 151 | 0.1% |
| Philippines | 223 | 0.2% |
| Poland | 52 | 0.0% |
| Portugal | 81 | 0.1% |
| Romania | 16 | 0.0% |
| Russia | 9 | 0.0% |
| Scotland | 90 | 0.1% |
| South America | 834 | 0.6% |
| South Central Asia | 511 | 0.4% |
| South Eastern Asia | 670 | 0.4% |
| Southern Europe | 361 | 0.2% |
| Spain | 67 | 0.1% |
| Sweden | 13 | 0.0% |
| Switzerland | 8 | 0.0% |
| Syria | 73 | 0.1% |
| Taiwan | 68 | 0.1% |
| Trinidad and Tobago | 107 | 0.1% |
| Turkey | 39 | 0.0% |
| Uruguay | 48 | 0.0% |
| Vietnam | 400 | 0.3% |
| Western Africa | 206 | 0.1% |
| Western Asia | 136 | 0.1% |
| Western Europe | 432 | 0.3% | View All 79 Rows |
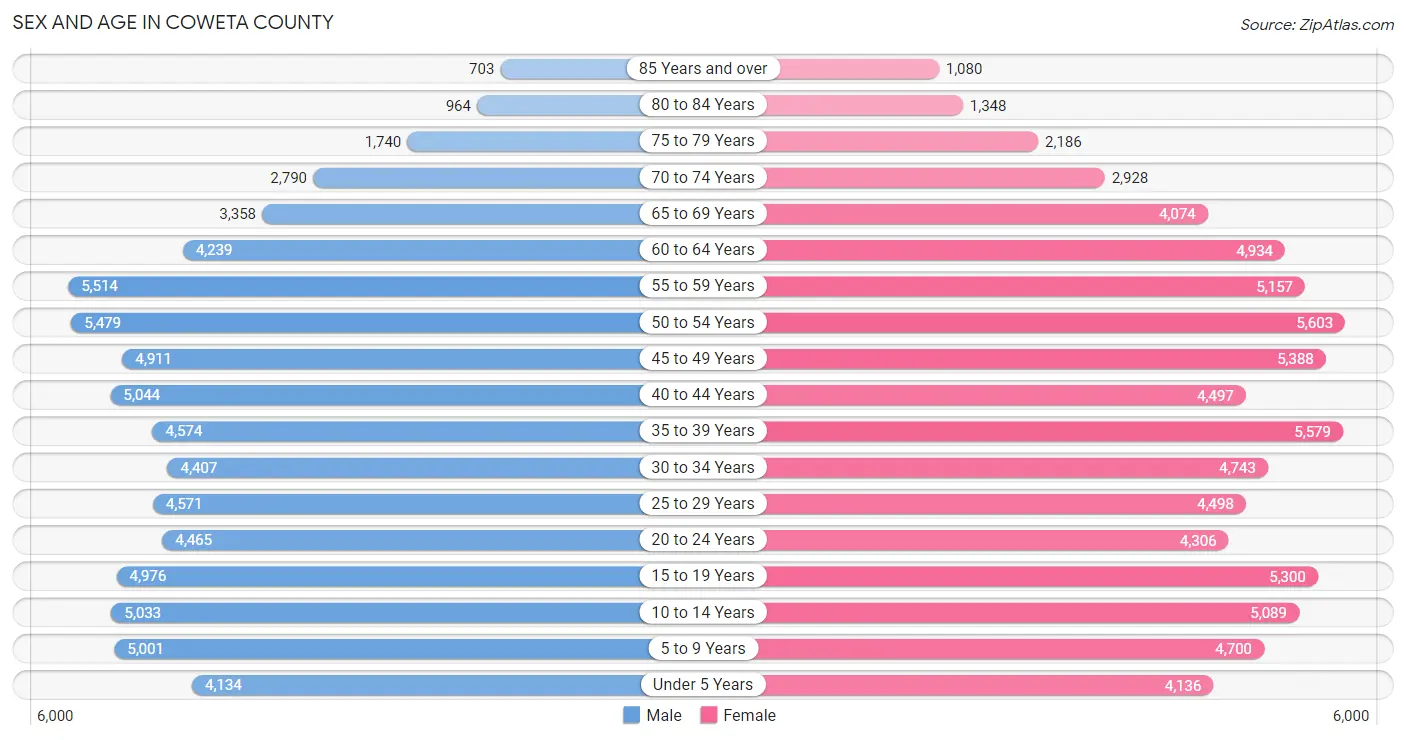
Sex and Age in Coweta County
Sex and Age in Coweta County
The most populous age groups in Coweta County are 55 to 59 Years (5,514 | 7.7%) for men and 50 to 54 Years (5,603 | 7.4%) for women.
| Age Bracket | Male | Female |
| Under 5 Years | 4,134 (5.8%) | 4,136 (5.5%) |
| 5 to 9 Years | 5,001 (7.0%) | 4,700 (6.2%) |
| 10 to 14 Years | 5,033 (7.0%) | 5,089 (6.7%) |
| 15 to 19 Years | 4,976 (6.9%) | 5,300 (7.0%) |
| 20 to 24 Years | 4,465 (6.2%) | 4,306 (5.7%) |
| 25 to 29 Years | 4,571 (6.4%) | 4,498 (5.9%) |
| 30 to 34 Years | 4,407 (6.1%) | 4,743 (6.3%) |
| 35 to 39 Years | 4,574 (6.4%) | 5,579 (7.4%) |
| 40 to 44 Years | 5,044 (7.0%) | 4,497 (5.9%) |
| 45 to 49 Years | 4,911 (6.8%) | 5,388 (7.1%) |
| 50 to 54 Years | 5,479 (7.6%) | 5,603 (7.4%) |
| 55 to 59 Years | 5,514 (7.7%) | 5,157 (6.8%) |
| 60 to 64 Years | 4,239 (5.9%) | 4,934 (6.5%) |
| 65 to 69 Years | 3,358 (4.7%) | 4,074 (5.4%) |
| 70 to 74 Years | 2,790 (3.9%) | 2,928 (3.9%) |
| 75 to 79 Years | 1,740 (2.4%) | 2,186 (2.9%) |
| 80 to 84 Years | 964 (1.3%) | 1,348 (1.8%) |
| 85 Years and over | 703 (1.0%) | 1,080 (1.4%) |
| Total | 71,903 (100.0%) | 75,546 (100.0%) |
Families and Households in Coweta County
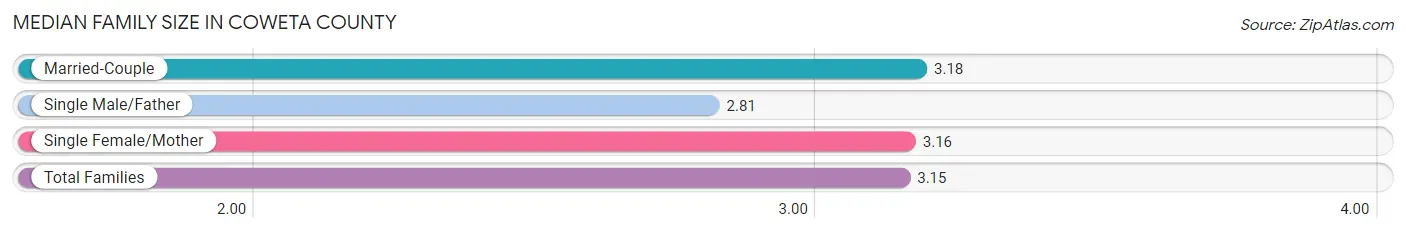
Median Family Size in Coweta County
The median family size in Coweta County is 3.15 persons per family, with married-couple families (31,411 | 77.7%) accounting for the largest median family size of 3.18 persons per family. On the other hand, single male/father families (2,254 | 5.6%) represent the smallest median family size with 2.81 persons per family.
| Family Type | # Families | Family Size |
| Married-Couple | 31,411 (77.7%) | 3.18 |
| Single Male/Father | 2,254 (5.6%) | 2.81 |
| Single Female/Mother | 6,778 (16.8%) | 3.16 |
| Total Families | 40,443 (100.0%) | 3.15 |
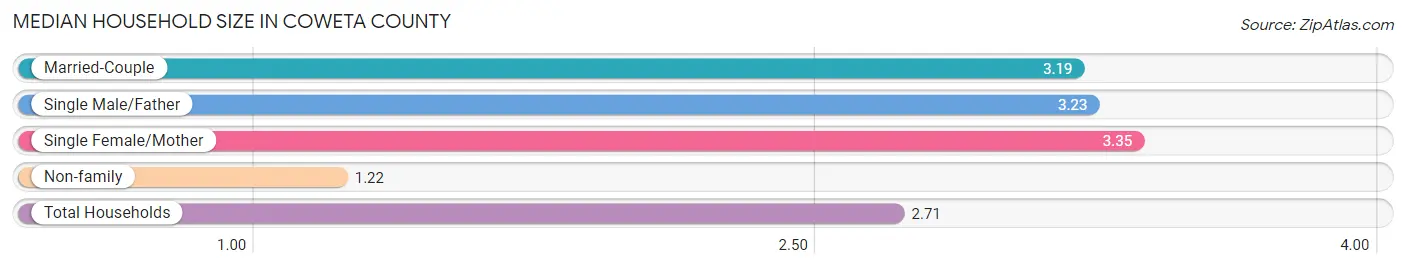
Median Household Size in Coweta County
The median household size in Coweta County is 2.71 persons per household, with single female/mother households (6,778 | 12.5%) accounting for the largest median household size of 3.35 persons per household. non-family households (13,734 | 25.4%) represent the smallest median household size with 1.22 persons per household.
| Household Type | # Households | Household Size |
| Married-Couple | 31,411 (58.0%) | 3.19 |
| Single Male/Father | 2,254 (4.2%) | 3.23 |
| Single Female/Mother | 6,778 (12.5%) | 3.35 |
| Non-family | 13,734 (25.4%) | 1.22 |
| Total Households | 54,177 (100.0%) | 2.71 |
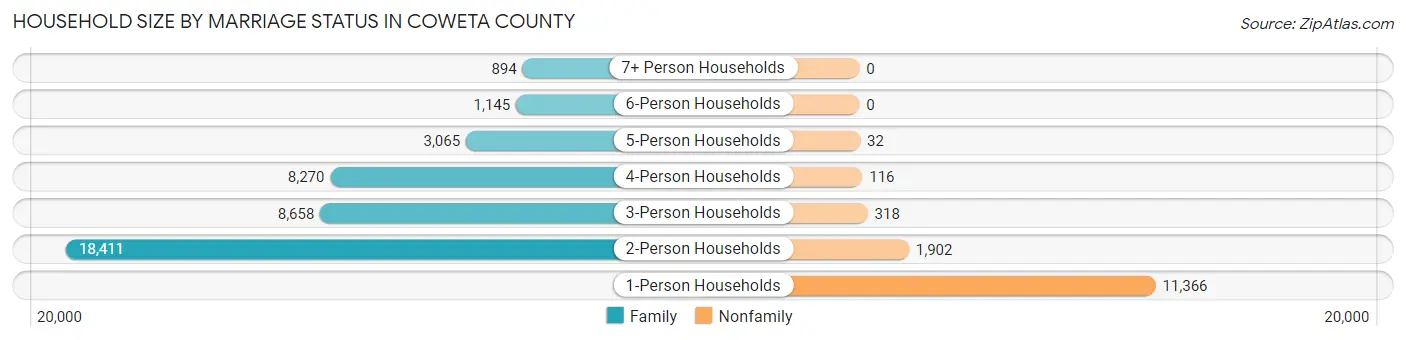
Household Size by Marriage Status in Coweta County
Out of a total of 54,177 households in Coweta County, 40,443 (74.7%) are family households, while 13,734 (25.4%) are nonfamily households. The most numerous type of family households are 2-person households, comprising 18,411, and the most common type of nonfamily households are 1-person households, comprising 11,366.
| Household Size | Family Households | Nonfamily Households |
| 1-Person Households | - | 11,366 (21.0%) |
| 2-Person Households | 18,411 (34.0%) | 1,902 (3.5%) |
| 3-Person Households | 8,658 (16.0%) | 318 (0.6%) |
| 4-Person Households | 8,270 (15.3%) | 116 (0.2%) |
| 5-Person Households | 3,065 (5.7%) | 32 (0.1%) |
| 6-Person Households | 1,145 (2.1%) | 0 (0.0%) |
| 7+ Person Households | 894 (1.7%) | 0 (0.0%) |
| Total | 40,443 (74.7%) | 13,734 (25.4%) |
Female Fertility in Coweta County
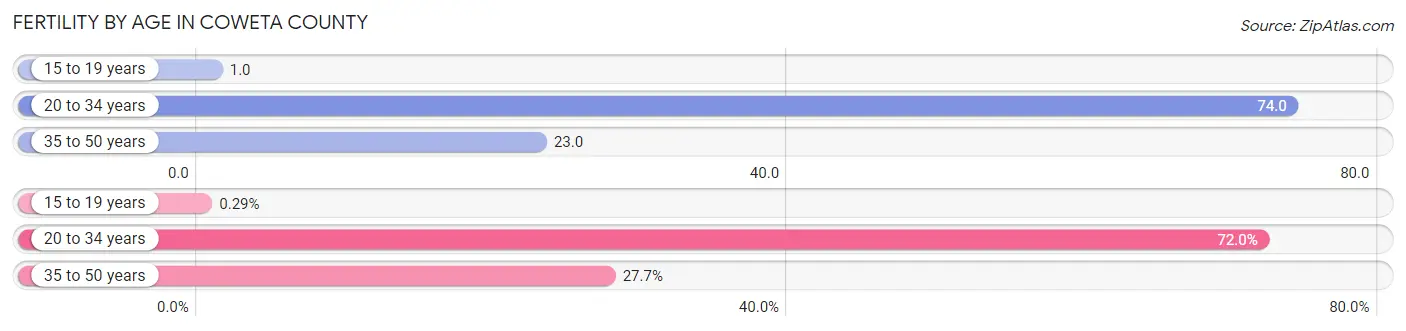
Fertility by Age in Coweta County
Average fertility rate in Coweta County is 39.0 births per 1,000 women. Women in the age bracket of 20 to 34 years have the highest fertility rate with 74.0 births per 1,000 women. Women in the age bracket of 20 to 34 years acount for 72.0% of all women with births.
| Age Bracket | Women with Births | Births / 1,000 Women |
| 15 to 19 years | 4 (0.3%) | 1.0 |
| 20 to 34 years | 997 (72.0%) | 74.0 |
| 35 to 50 years | 383 (27.7%) | 23.0 |
| Total | 1,384 (100.0%) | 39.0 |
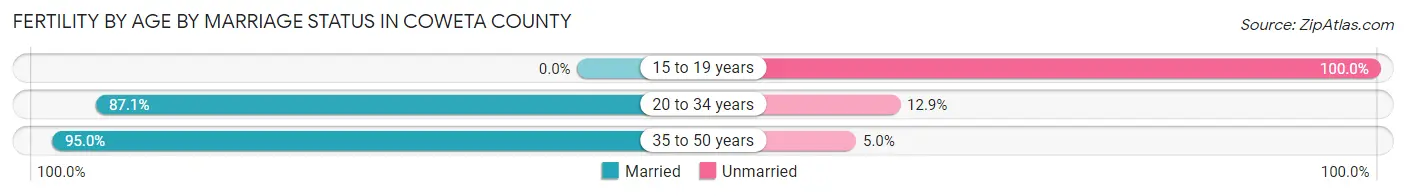
Fertility by Age by Marriage Status in Coweta County
89.0% of women with births (1,384) in Coweta County are married. The highest percentage of unmarried women with births falls into 15 to 19 years age bracket with 100.0% of them unmarried at the time of birth, while the lowest percentage of unmarried women with births belong to 35 to 50 years age bracket with 5.0% of them unmarried.
| Age Bracket | Married | Unmarried |
| 15 to 19 years | 0 (0.0%) | 4 (100.0%) |
| 20 to 34 years | 868 (87.1%) | 129 (12.9%) |
| 35 to 50 years | 364 (95.0%) | 19 (5.0%) |
| Total | 1,232 (89.0%) | 152 (11.0%) |
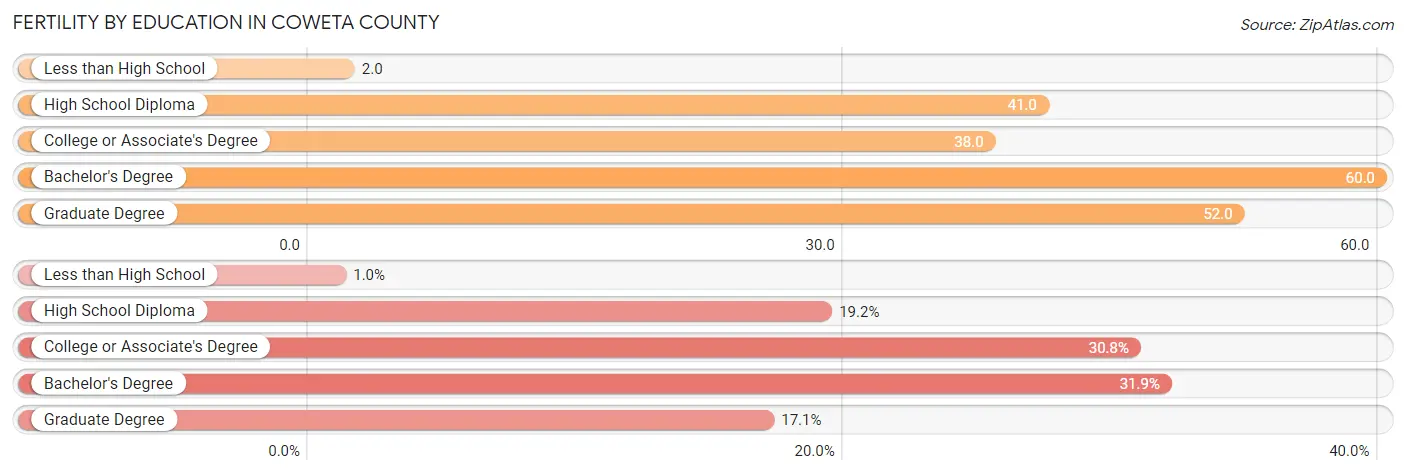
Fertility by Education in Coweta County
Average fertility rate in Coweta County is 39.0 births per 1,000 women. Women with the education attainment of bachelor's degree have the highest fertility rate of 60.0 births per 1,000 women, while women with the education attainment of less than high school have the lowest fertility at 2.0 births per 1,000 women. Women with the education attainment of bachelor's degree represent 31.9% of all women with births.
| Educational Attainment | Women with Births | Births / 1,000 Women |
| Less than High School | 14 (1.0%) | 2.0 |
| High School Diploma | 266 (19.2%) | 41.0 |
| College or Associate's Degree | 426 (30.8%) | 38.0 |
| Bachelor's Degree | 442 (31.9%) | 60.0 |
| Graduate Degree | 236 (17.1%) | 52.0 |
| Total | 1,384 (100.0%) | 39.0 |
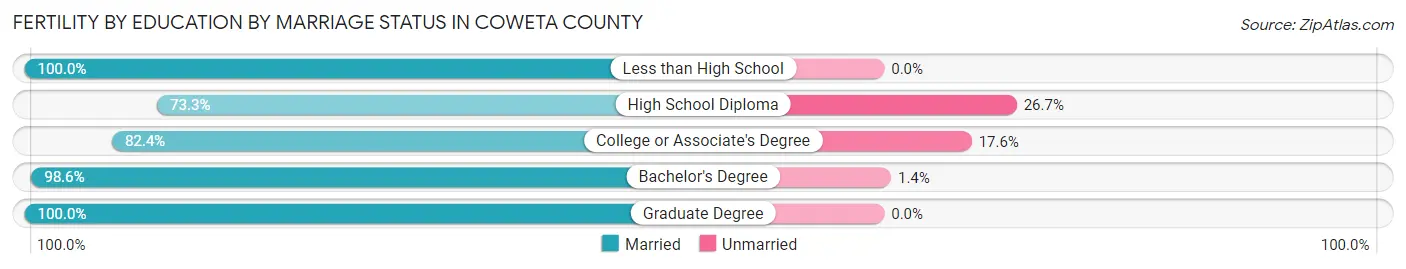
Fertility by Education by Marriage Status in Coweta County
11.0% of women with births in Coweta County are unmarried. Women with the educational attainment of less than high school are most likely to be married with 100.0% of them married at childbirth, while women with the educational attainment of high school diploma are least likely to be married with 26.7% of them unmarried at childbirth.
| Educational Attainment | Married | Unmarried |
| Less than High School | 14 (100.0%) | 0 (0.0%) |
| High School Diploma | 195 (73.3%) | 71 (26.7%) |
| College or Associate's Degree | 351 (82.4%) | 75 (17.6%) |
| Bachelor's Degree | 436 (98.6%) | 6 (1.4%) |
| Graduate Degree | 236 (100.0%) | 0 (0.0%) |
| Total | 1,232 (89.0%) | 152 (11.0%) |
Income in Coweta County
Income Overview in Coweta County
Per Capita Income in Coweta County is $41,373, while median incomes of families and households are $105,403 and $90,031 respectively.
| Characteristic | Number | Measure |
| Per Capita Income | 147,449 | $41,373 |
| Median Family Income | 40,443 | $105,403 |
| Mean Family Income | 40,443 | $125,587 |
| Median Household Income | 54,177 | $90,031 |
| Mean Household Income | 54,177 | $111,379 |
| Income Deficit | 40,443 | $9,182 |
| Wage / Income Gap (%) | 147,449 | 32.35% |
| Wage / Income Gap ($) | 147,449 | 67.65¢ per $1 |
| Gini / Inequality Index | 147,449 | 0.42 |
Earnings by Sex in Coweta County
Average Earnings in Coweta County are $46,537, $55,987 for men and $37,873 for women, a difference of 32.4%.
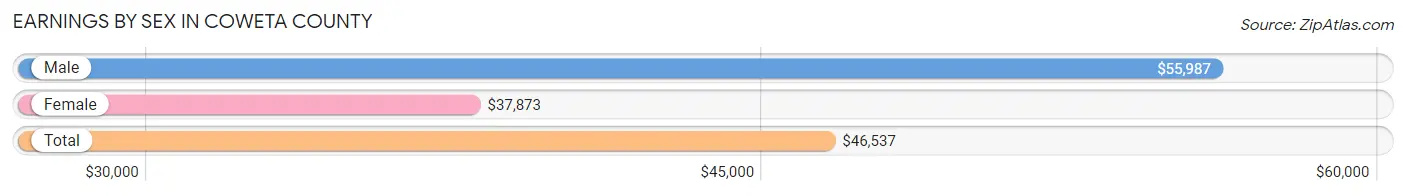
| Sex | Number | Average Earnings |
| Male | 41,860 (53.4%) | $55,987 |
| Female | 36,485 (46.6%) | $37,873 |
| Total | 78,345 (100.0%) | $46,537 |
Earnings by Sex by Income Bracket in Coweta County
The most common earnings brackets in Coweta County are $100,000+ for men (10,201 | 24.4%) and $100,000+ for women (3,657 | 10.0%).
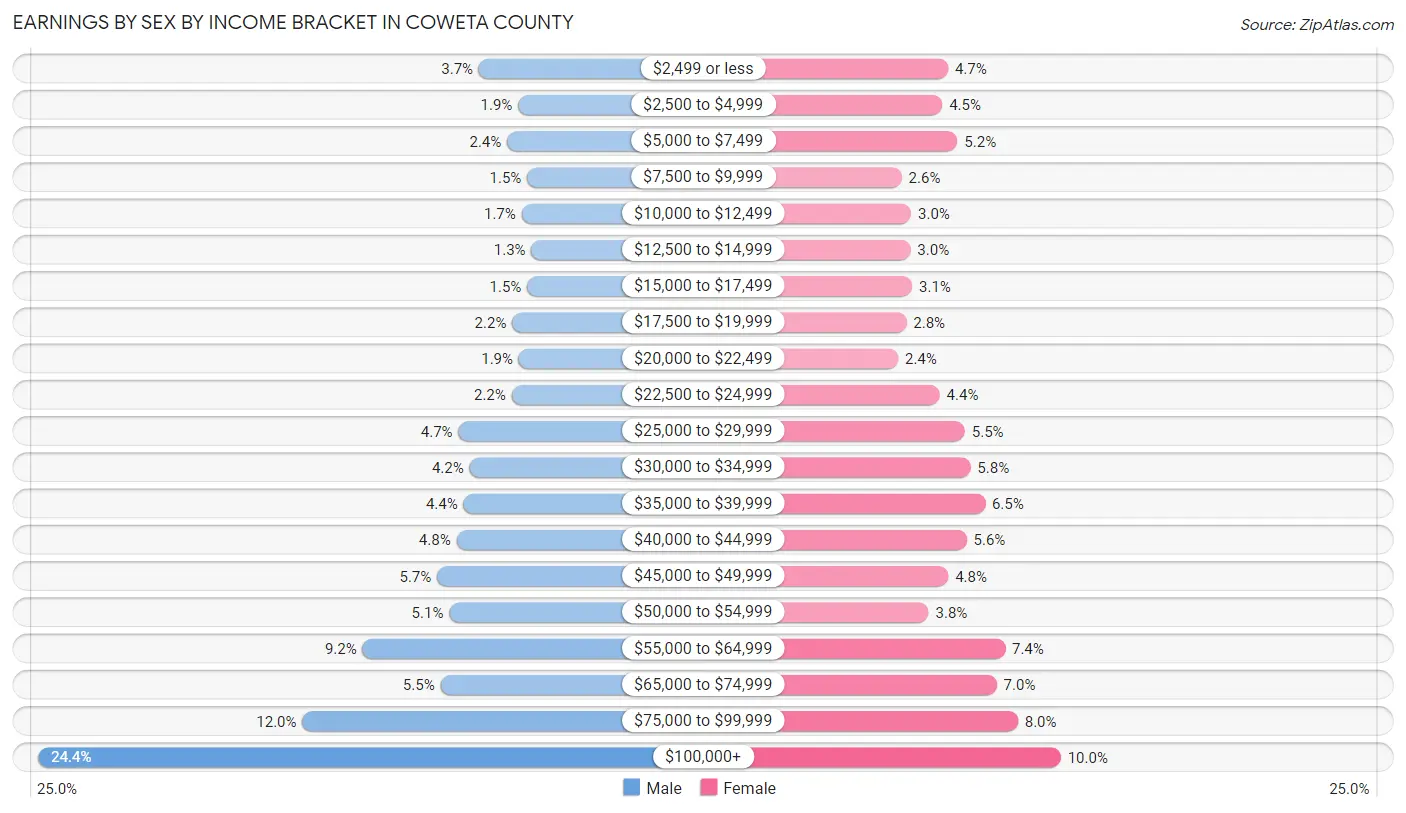
| Income | Male | Female |
| $2,499 or less | 1,559 (3.7%) | 1,731 (4.7%) |
| $2,500 to $4,999 | 789 (1.9%) | 1,631 (4.5%) |
| $5,000 to $7,499 | 1,006 (2.4%) | 1,891 (5.2%) |
| $7,500 to $9,999 | 611 (1.5%) | 936 (2.6%) |
| $10,000 to $12,499 | 722 (1.7%) | 1,100 (3.0%) |
| $12,500 to $14,999 | 527 (1.3%) | 1,089 (3.0%) |
| $15,000 to $17,499 | 612 (1.5%) | 1,116 (3.1%) |
| $17,500 to $19,999 | 904 (2.2%) | 1,017 (2.8%) |
| $20,000 to $22,499 | 773 (1.8%) | 877 (2.4%) |
| $22,500 to $24,999 | 917 (2.2%) | 1,588 (4.3%) |
| $25,000 to $29,999 | 1,958 (4.7%) | 2,016 (5.5%) |
| $30,000 to $34,999 | 1,742 (4.2%) | 2,113 (5.8%) |
| $35,000 to $39,999 | 1,858 (4.4%) | 2,359 (6.5%) |
| $40,000 to $44,999 | 1,995 (4.8%) | 2,048 (5.6%) |
| $45,000 to $49,999 | 2,379 (5.7%) | 1,733 (4.8%) |
| $50,000 to $54,999 | 2,138 (5.1%) | 1,397 (3.8%) |
| $55,000 to $64,999 | 3,840 (9.2%) | 2,702 (7.4%) |
| $65,000 to $74,999 | 2,309 (5.5%) | 2,560 (7.0%) |
| $75,000 to $99,999 | 5,020 (12.0%) | 2,924 (8.0%) |
| $100,000+ | 10,201 (24.4%) | 3,657 (10.0%) |
| Total | 41,860 (100.0%) | 36,485 (100.0%) |
Earnings by Sex by Educational Attainment in Coweta County
Average earnings in Coweta County are $63,252 for men and $42,135 for women, a difference of 33.4%. Men with an educational attainment of graduate degree enjoy the highest average annual earnings of $114,123, while those with less than high school education earn the least with $35,500. Women with an educational attainment of graduate degree earn the most with the average annual earnings of $71,727, while those with less than high school education have the smallest earnings of $28,480.
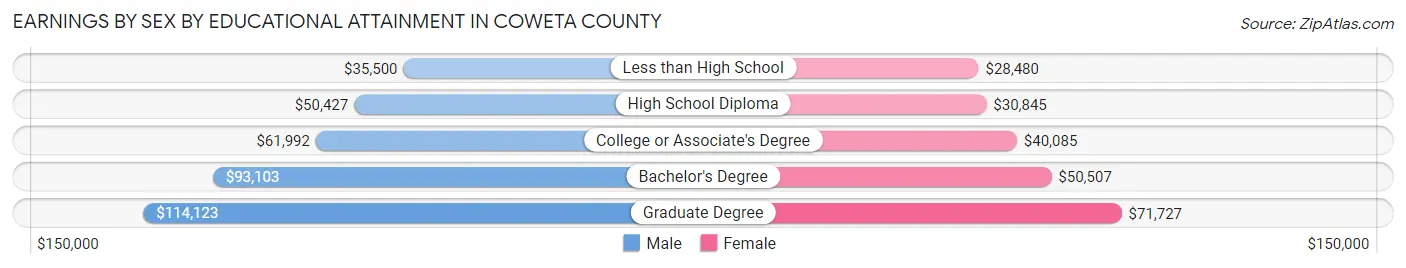
| Educational Attainment | Male Income | Female Income |
| Less than High School | $35,500 | $28,480 |
| High School Diploma | $50,427 | $30,845 |
| College or Associate's Degree | $61,992 | $40,085 |
| Bachelor's Degree | $93,103 | $50,507 |
| Graduate Degree | $114,123 | $71,727 |
| Total | $63,252 | $42,135 |
Family Income in Coweta County
Family Income Brackets in Coweta County
According to the Coweta County family income data, there are 9,787 families falling into the $100,000 to $149,999 income range, which is the most common income bracket and makes up 24.2% of all families. Conversely, the $10,000 to $14,999 income bracket is the least frequent group with only 404 families (1.0%) belonging to this category.
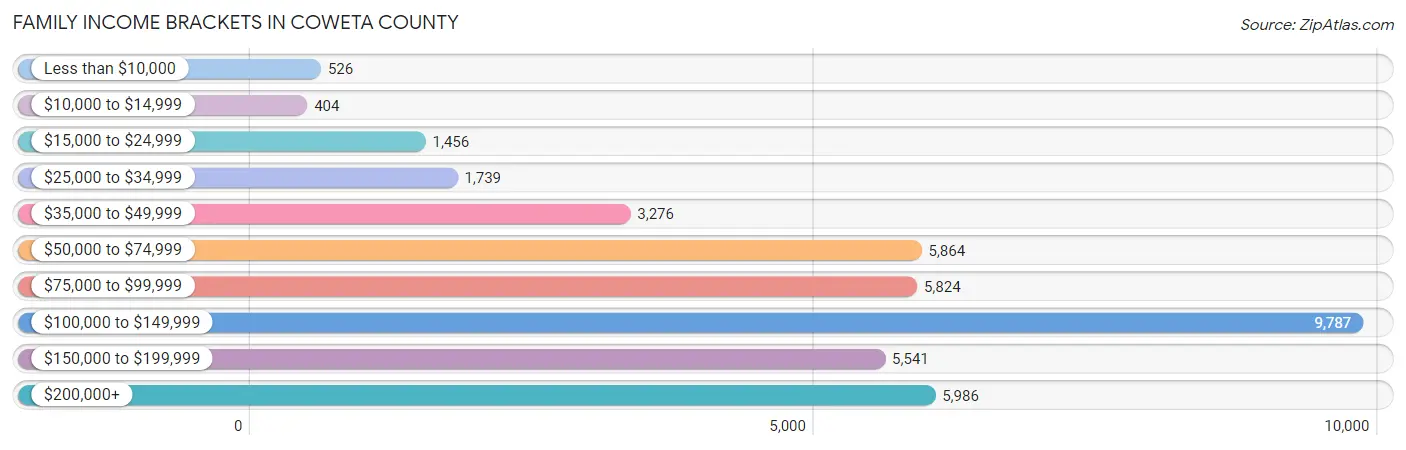
| Income Bracket | # Families | % Families |
| Less than $10,000 | 526 | 1.3% |
| $10,000 to $14,999 | 404 | 1.0% |
| $15,000 to $24,999 | 1,456 | 3.6% |
| $25,000 to $34,999 | 1,739 | 4.3% |
| $35,000 to $49,999 | 3,276 | 8.1% |
| $50,000 to $74,999 | 5,864 | 14.5% |
| $75,000 to $99,999 | 5,824 | 14.4% |
| $100,000 to $149,999 | 9,787 | 24.2% |
| $150,000 to $199,999 | 5,541 | 13.7% |
| $200,000+ | 5,986 | 14.8% |
Family Income by Famaliy Size in Coweta County
7+ person families (683 | 1.7%) account for the highest median family income in Coweta County with $138,945 per family, while 2-person families (19,091 | 47.2%) have the highest median income of $48,270 per family member.
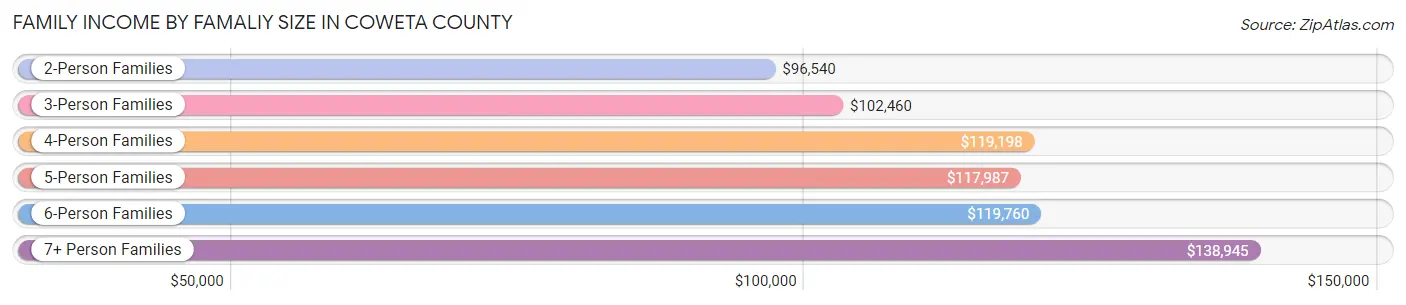
| Income Bracket | # Families | Median Income |
| 2-Person Families | 19,091 (47.2%) | $96,540 |
| 3-Person Families | 8,976 (22.2%) | $102,460 |
| 4-Person Families | 7,693 (19.0%) | $119,198 |
| 5-Person Families | 2,793 (6.9%) | $117,987 |
| 6-Person Families | 1,207 (3.0%) | $119,760 |
| 7+ Person Families | 683 (1.7%) | $138,945 |
| Total | 40,443 (100.0%) | $105,403 |
Family Income by Number of Earners in Coweta County
The median family income in Coweta County is $105,403, with families comprising 3+ earners (4,315) having the highest median family income of $150,830, while families with no earners (5,437) have the lowest median family income of $56,655, accounting for 10.7% and 13.4% of families, respectively.
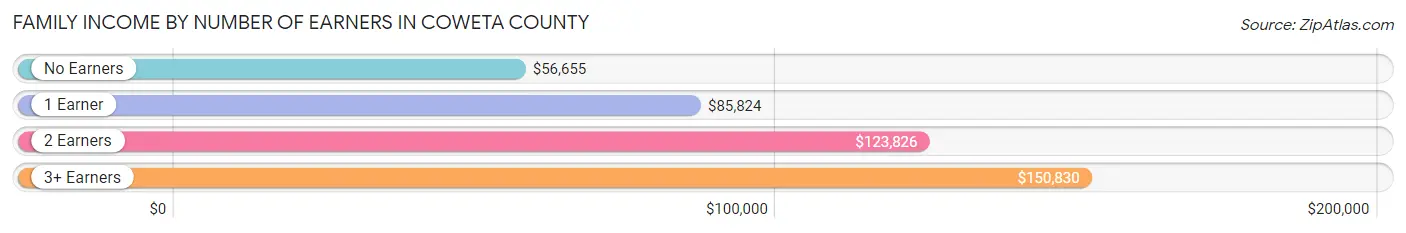
| Number of Earners | # Families | Median Income |
| No Earners | 5,437 (13.4%) | $56,655 |
| 1 Earner | 12,890 (31.9%) | $85,824 |
| 2 Earners | 17,801 (44.0%) | $123,826 |
| 3+ Earners | 4,315 (10.7%) | $150,830 |
| Total | 40,443 (100.0%) | $105,403 |
Household Income in Coweta County
Household Income Brackets in Coweta County
With 11,269 households falling in the category, the $100,000 to $149,999 income range is the most frequent in Coweta County, accounting for 20.8% of all households. In contrast, only 1,192 households (2.2%) fall into the $10,000 to $14,999 income bracket, making it the least populous group.
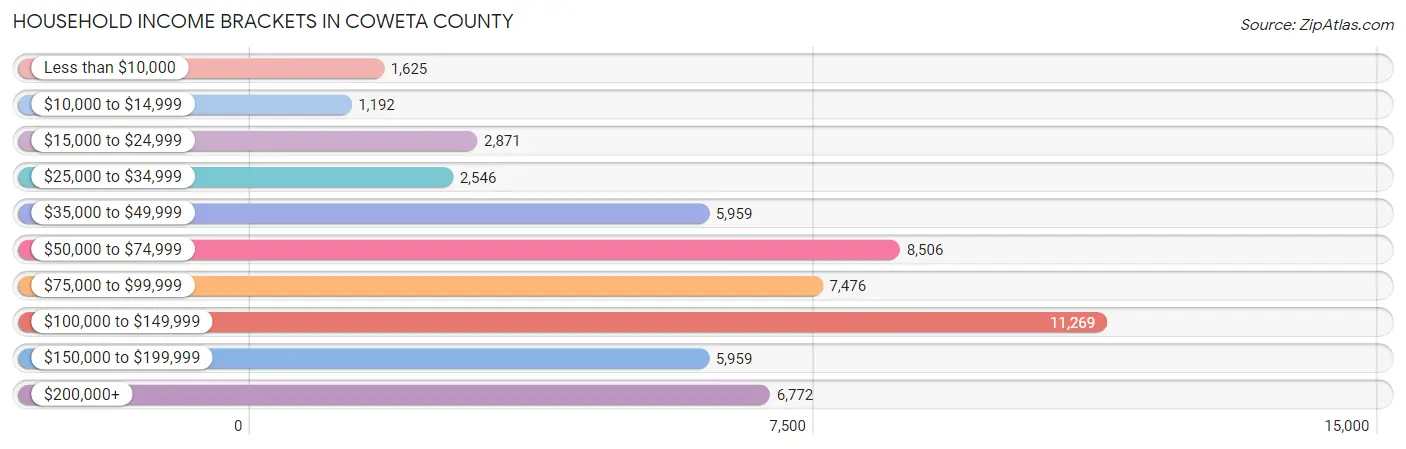
| Income Bracket | # Households | % Households |
| Less than $10,000 | 1,625 | 3.0% |
| $10,000 to $14,999 | 1,192 | 2.2% |
| $15,000 to $24,999 | 2,871 | 5.3% |
| $25,000 to $34,999 | 2,546 | 4.7% |
| $35,000 to $49,999 | 5,959 | 11.0% |
| $50,000 to $74,999 | 8,506 | 15.7% |
| $75,000 to $99,999 | 7,476 | 13.8% |
| $100,000 to $149,999 | 11,269 | 20.8% |
| $150,000 to $199,999 | 5,959 | 11.0% |
| $200,000+ | 6,772 | 12.5% |
Household Income by Householder Age in Coweta County
The median household income in Coweta County is $90,031, with the highest median household income of $109,426 found in the 45 to 64 years age bracket for the primary householder. A total of 22,831 households (42.1%) fall into this category. Meanwhile, the 15 to 24 years age bracket for the primary householder has the lowest median household income of $56,761, with 1,070 households (2.0%) in this group.
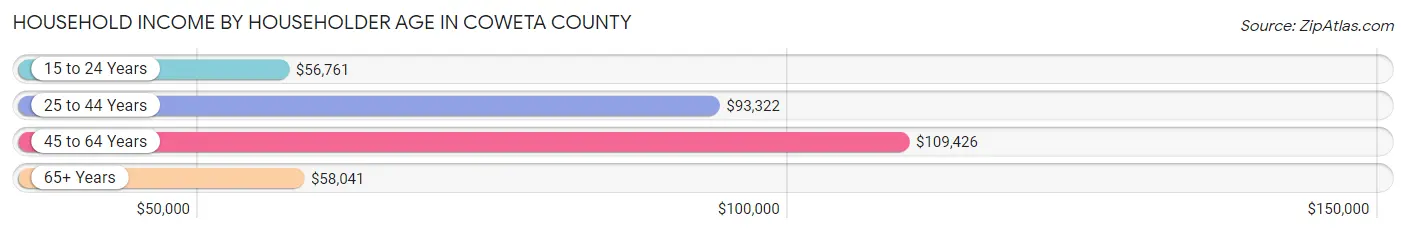
| Income Bracket | # Households | Median Income |
| 15 to 24 Years | 1,070 (2.0%) | $56,761 |
| 25 to 44 Years | 17,380 (32.1%) | $93,322 |
| 45 to 64 Years | 22,831 (42.1%) | $109,426 |
| 65+ Years | 12,896 (23.8%) | $58,041 |
| Total | 54,177 (100.0%) | $90,031 |
Poverty in Coweta County
Income Below Poverty by Sex and Age in Coweta County
With 7.2% poverty level for males and 9.4% for females among the residents of Coweta County, 5 year old males and 15 year old females are the most vulnerable to poverty, with 115 males (13.7%) and 272 females (20.7%) in their respective age groups living below the poverty level.
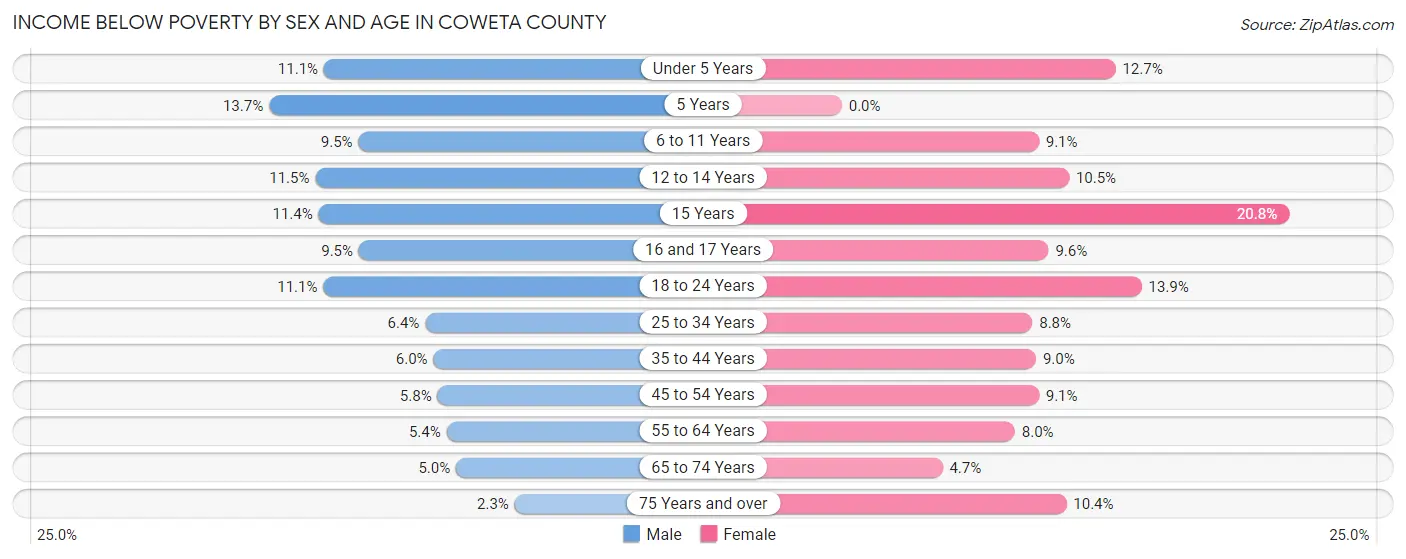
| Age Bracket | Male | Female |
| Under 5 Years | 457 (11.1%) | 509 (12.7%) |
| 5 Years | 115 (13.7%) | 0 (0.0%) |
| 6 to 11 Years | 577 (9.5%) | 548 (9.1%) |
| 12 to 14 Years | 347 (11.5%) | 324 (10.5%) |
| 15 Years | 103 (11.4%) | 272 (20.7%) |
| 16 and 17 Years | 220 (9.5%) | 201 (9.6%) |
| 18 to 24 Years | 683 (11.1%) | 860 (13.9%) |
| 25 to 34 Years | 567 (6.4%) | 815 (8.8%) |
| 35 to 44 Years | 577 (6.0%) | 908 (9.0%) |
| 45 to 54 Years | 604 (5.8%) | 1,004 (9.1%) |
| 55 to 64 Years | 528 (5.4%) | 810 (8.0%) |
| 65 to 74 Years | 305 (5.0%) | 325 (4.7%) |
| 75 Years and over | 76 (2.3%) | 474 (10.4%) |
| Total | 5,159 (7.2%) | 7,050 (9.4%) |
Income Above Poverty by Sex and Age in Coweta County
According to the poverty statistics in Coweta County, males aged 75 years and over and females aged 5 years are the age groups that are most secure financially, with 97.7% of males and 100.0% of females in these age groups living above the poverty line.
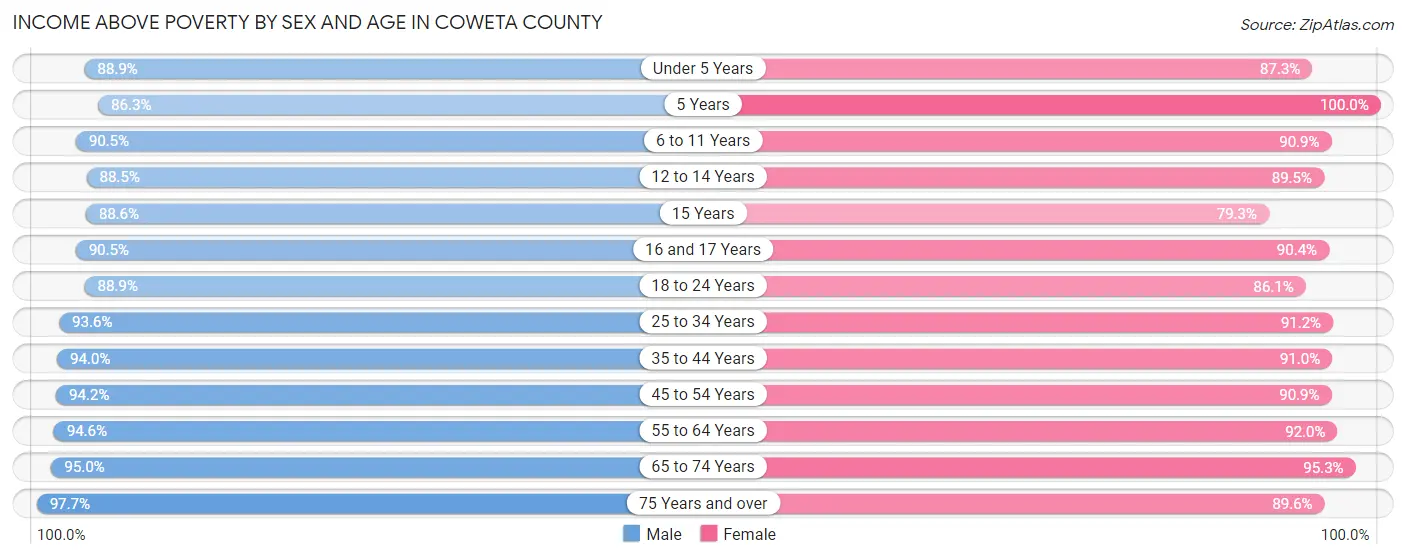
| Age Bracket | Male | Female |
| Under 5 Years | 3,655 (88.9%) | 3,500 (87.3%) |
| 5 Years | 727 (86.3%) | 683 (100.0%) |
| 6 to 11 Years | 5,491 (90.5%) | 5,447 (90.9%) |
| 12 to 14 Years | 2,667 (88.5%) | 2,750 (89.5%) |
| 15 Years | 804 (88.6%) | 1,039 (79.2%) |
| 16 and 17 Years | 2,098 (90.5%) | 1,896 (90.4%) |
| 18 to 24 Years | 5,446 (88.9%) | 5,324 (86.1%) |
| 25 to 34 Years | 8,279 (93.6%) | 8,408 (91.2%) |
| 35 to 44 Years | 8,990 (94.0%) | 9,165 (91.0%) |
| 45 to 54 Years | 9,732 (94.2%) | 9,977 (90.9%) |
| 55 to 64 Years | 9,217 (94.6%) | 9,281 (92.0%) |
| 65 to 74 Years | 5,824 (95.0%) | 6,630 (95.3%) |
| 75 Years and over | 3,293 (97.7%) | 4,075 (89.6%) |
| Total | 66,223 (92.8%) | 68,175 (90.6%) |
Income Below Poverty Among Married-Couple Families in Coweta County
The poverty statistics for married-couple families in Coweta County show that 3.0% or 942 of the total 31,411 families live below the poverty line. Families with 5 or more children have the highest poverty rate of 19.6%, comprising of 45 families. On the other hand, families with no children have the lowest poverty rate of 2.3%, which includes 423 families.
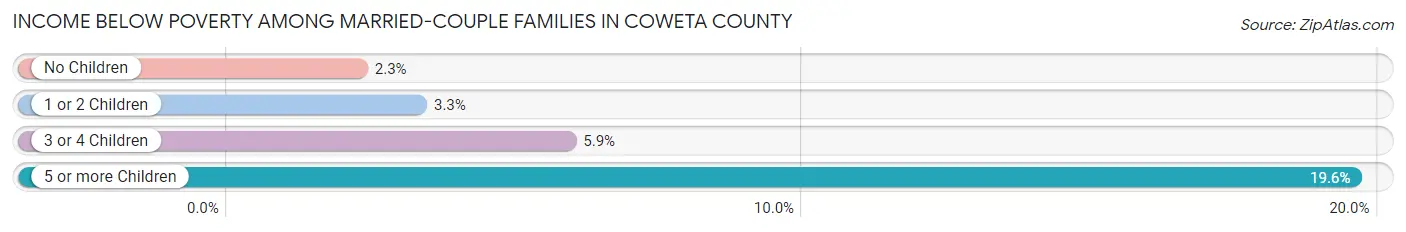
| Children | Above Poverty | Below Poverty |
| No Children | 18,282 (97.7%) | 423 (2.3%) |
| 1 or 2 Children | 9,703 (96.7%) | 330 (3.3%) |
| 3 or 4 Children | 2,299 (94.1%) | 144 (5.9%) |
| 5 or more Children | 185 (80.4%) | 45 (19.6%) |
| Total | 30,469 (97.0%) | 942 (3.0%) |
Income Below Poverty Among Single-Parent Households in Coweta County
According to the poverty data in Coweta County, 9.2% or 207 single-father households and 16.0% or 1,084 single-mother households are living below the poverty line. Among single-father households, those with 1 or 2 children have the highest poverty rate, with 192 households (21.5%) experiencing poverty. Likewise, among single-mother households, those with 5 or more children have the highest poverty rate, with 23 households (100.0%) falling below the poverty line.
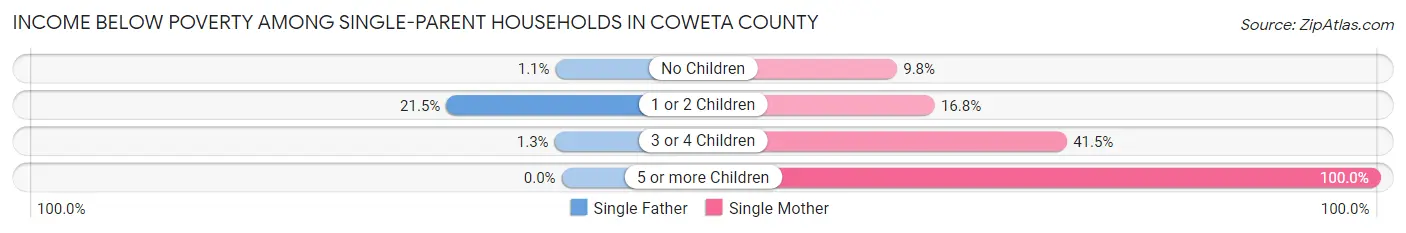
| Children | Single Father | Single Mother |
| No Children | 13 (1.1%) | 248 (9.8%) |
| 1 or 2 Children | 192 (21.5%) | 641 (16.8%) |
| 3 or 4 Children | 2 (1.3%) | 172 (41.4%) |
| 5 or more Children | 0 (0.0%) | 23 (100.0%) |
| Total | 207 (9.2%) | 1,084 (16.0%) |
Income Below Poverty Among Married-Couple vs Single-Parent Households in Coweta County
The poverty data for Coweta County shows that 942 of the married-couple family households (3.0%) and 1,291 of the single-parent households (14.3%) are living below the poverty level. Within the married-couple family households, those with 5 or more children have the highest poverty rate, with 45 households (19.6%) falling below the poverty line. Among the single-parent households, those with 3 or 4 children have the highest poverty rate, with 174 household (30.7%) living below poverty.
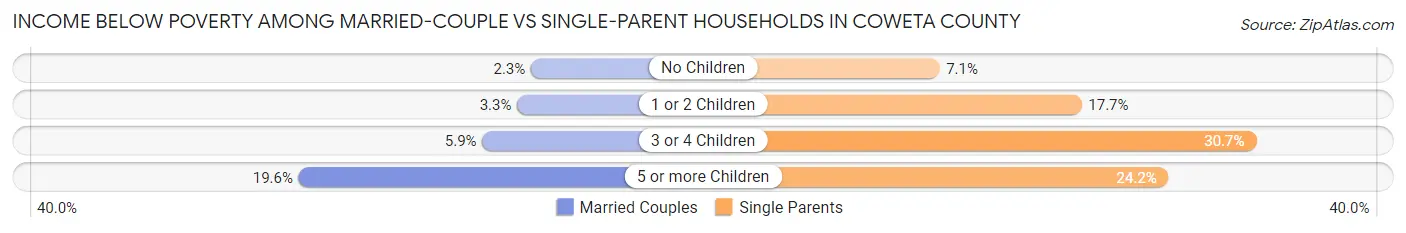
| Children | Married-Couple Families | Single-Parent Households |
| No Children | 423 (2.3%) | 261 (7.1%) |
| 1 or 2 Children | 330 (3.3%) | 833 (17.7%) |
| 3 or 4 Children | 144 (5.9%) | 174 (30.7%) |
| 5 or more Children | 45 (19.6%) | 23 (24.2%) |
| Total | 942 (3.0%) | 1,291 (14.3%) |
Employment Characteristics in Coweta County
Employment by Class of Employer in Coweta County
Among the 72,084 employed individuals in Coweta County, private company employees (51,352 | 71.2%), local government employees (6,191 | 8.6%), and not-for-profit organizations (4,265 | 5.9%) make up the most common classes of employment.
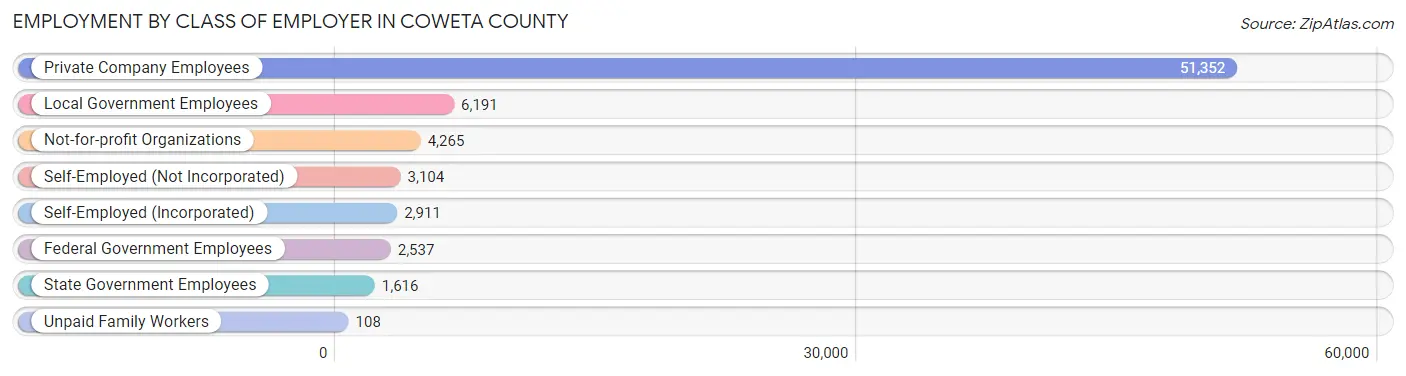
| Employer Class | # Employees | % Employees |
| Private Company Employees | 51,352 | 71.2% |
| Self-Employed (Incorporated) | 2,911 | 4.0% |
| Self-Employed (Not Incorporated) | 3,104 | 4.3% |
| Not-for-profit Organizations | 4,265 | 5.9% |
| Local Government Employees | 6,191 | 8.6% |
| State Government Employees | 1,616 | 2.2% |
| Federal Government Employees | 2,537 | 3.5% |
| Unpaid Family Workers | 108 | 0.2% |
| Total | 72,084 | 100.0% |
Employment Status by Age in Coweta County
According to the labor force statistics for Coweta County, out of the total population over 16 years of age (117,138), 64.4% or 75,437 individuals are in the labor force, with 2.8% or 2,112 of them unemployed. The age group with the highest labor force participation rate is 25 to 29 years, with 85.1% or 7,718 individuals in the labor force. Within the labor force, the 16 to 19 years age range has the highest percentage of unemployed individuals, with 8.6% or 317 of them being unemployed.
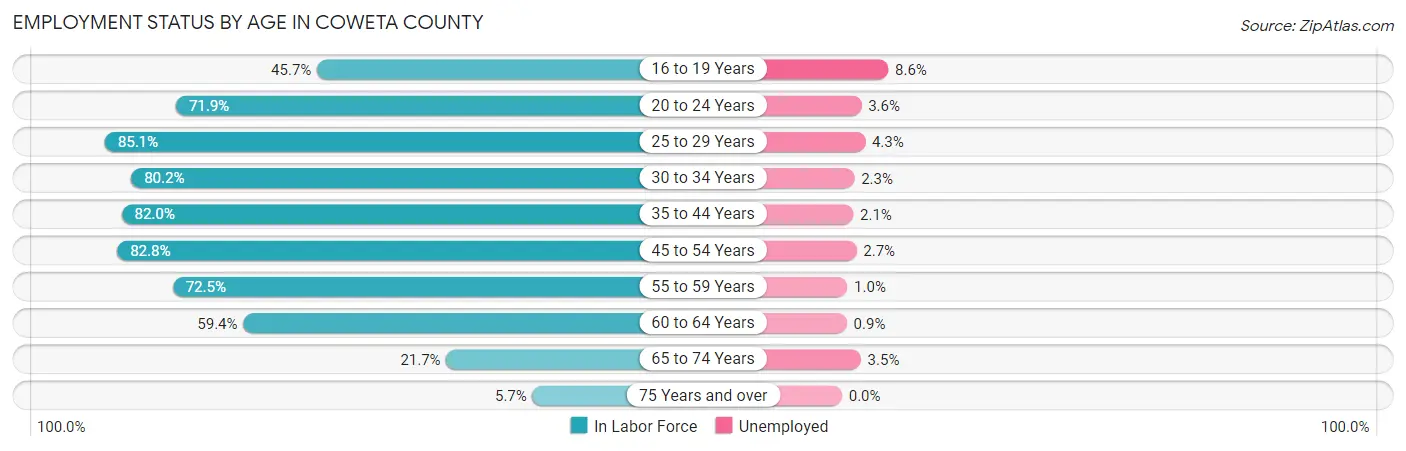
| Age Bracket | In Labor Force | Unemployed |
| 16 to 19 Years | 3,683 (45.7%) | 317 (8.6%) |
| 20 to 24 Years | 6,306 (71.9%) | 227 (3.6%) |
| 25 to 29 Years | 7,718 (85.1%) | 332 (4.3%) |
| 30 to 34 Years | 7,338 (80.2%) | 169 (2.3%) |
| 35 to 44 Years | 16,149 (82.0%) | 339 (2.1%) |
| 45 to 54 Years | 17,703 (82.8%) | 478 (2.7%) |
| 55 to 59 Years | 7,736 (72.5%) | 77 (1.0%) |
| 60 to 64 Years | 5,449 (59.4%) | 49 (0.9%) |
| 65 to 74 Years | 2,854 (21.7%) | 100 (3.5%) |
| 75 Years and over | 457 (5.7%) | 0 (0.0%) |
| Total | 75,437 (64.4%) | 2,112 (2.8%) |
Employment Status by Educational Attainment in Coweta County
According to labor force statistics for Coweta County, 78.5% of individuals (62,123) out of the total population between 25 and 64 years of age (79,138) are in the labor force, with 2.3% or 1,429 of them being unemployed. The group with the highest labor force participation rate are those with the educational attainment of bachelor's degree or higher, with 85.4% or 24,588 individuals in the labor force. Within the labor force, individuals with college / associate degree education have the highest percentage of unemployment, with 2.9% or 544 of them being unemployed.
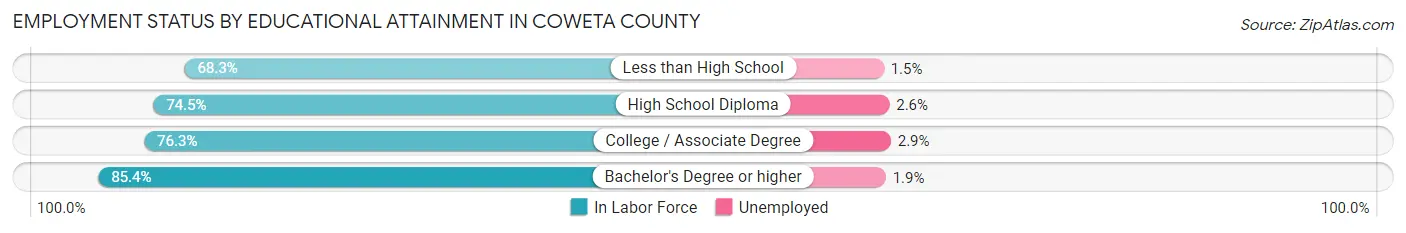
| Educational Attainment | In Labor Force | Unemployed |
| Less than High School | 4,776 (68.3%) | 105 (1.5%) |
| High School Diploma | 13,988 (74.5%) | 488 (2.6%) |
| College / Associate Degree | 18,754 (76.3%) | 713 (2.9%) |
| Bachelor's Degree or higher | 24,588 (85.4%) | 547 (1.9%) |
| Total | 62,123 (78.5%) | 1,820 (2.3%) |
Employment Occupations by Sex in Coweta County
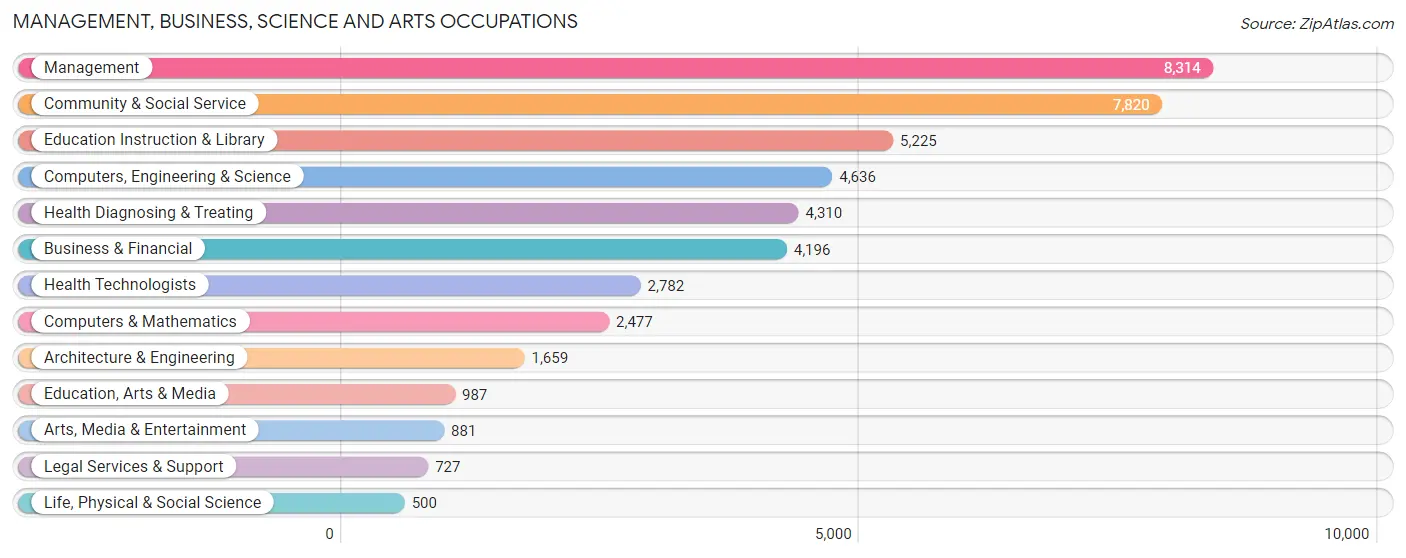
Management, Business, Science and Arts Occupations
The most common Management, Business, Science and Arts occupations in Coweta County are Management (8,314 | 11.4%), Community & Social Service (7,820 | 10.7%), Education Instruction & Library (5,225 | 7.1%), Computers, Engineering & Science (4,636 | 6.3%), and Health Diagnosing & Treating (4,310 | 5.9%).
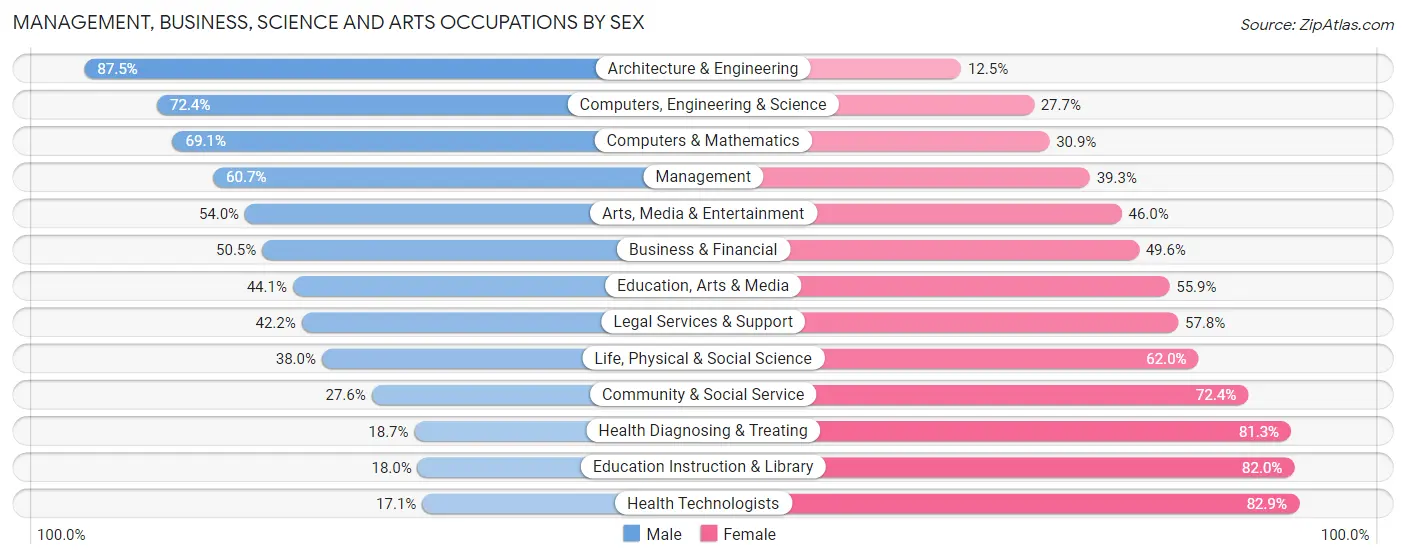
Management, Business, Science and Arts Occupations by Sex
Within the Management, Business, Science and Arts occupations in Coweta County, the most male-oriented occupations are Architecture & Engineering (87.5%), Computers, Engineering & Science (72.4%), and Computers & Mathematics (69.1%), while the most female-oriented occupations are Health Technologists (82.9%), Education Instruction & Library (82.0%), and Health Diagnosing & Treating (81.3%).
| Occupation | Male | Female |
| Management | 5,043 (60.7%) | 3,271 (39.3%) |
| Business & Financial | 2,117 (50.4%) | 2,079 (49.5%) |
| Computers, Engineering & Science | 3,354 (72.4%) | 1,282 (27.7%) |
| Computers & Mathematics | 1,712 (69.1%) | 765 (30.9%) |
| Architecture & Engineering | 1,452 (87.5%) | 207 (12.5%) |
| Life, Physical & Social Science | 190 (38.0%) | 310 (62.0%) |
| Community & Social Service | 2,160 (27.6%) | 5,660 (72.4%) |
| Education, Arts & Media | 435 (44.1%) | 552 (55.9%) |
| Legal Services & Support | 307 (42.2%) | 420 (57.8%) |
| Education Instruction & Library | 942 (18.0%) | 4,283 (82.0%) |
| Arts, Media & Entertainment | 476 (54.0%) | 405 (46.0%) |
| Health Diagnosing & Treating | 806 (18.7%) | 3,504 (81.3%) |
| Health Technologists | 475 (17.1%) | 2,307 (82.9%) |
| Total (Category) | 13,480 (46.0%) | 15,796 (54.0%) |
| Total (Overall) | 39,314 (53.7%) | 33,824 (46.3%) |
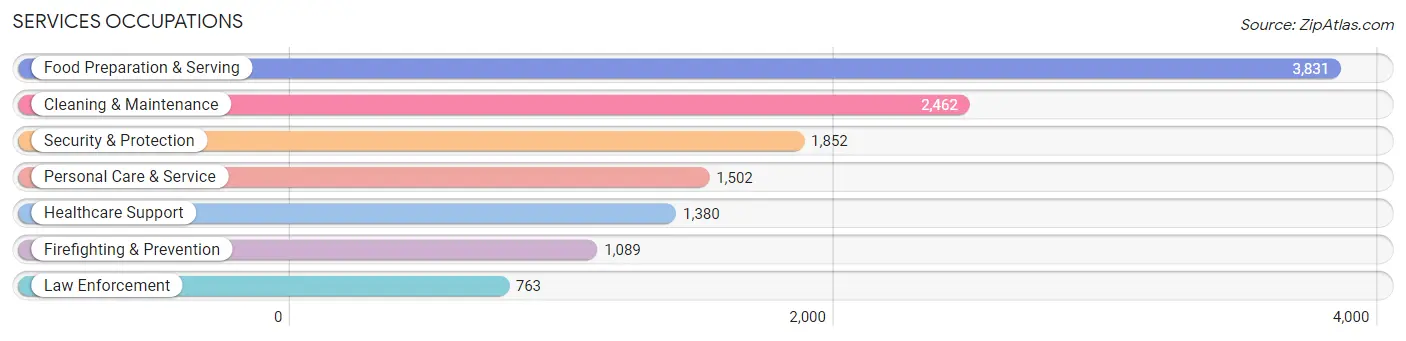
Services Occupations
The most common Services occupations in Coweta County are Food Preparation & Serving (3,831 | 5.2%), Cleaning & Maintenance (2,462 | 3.4%), Security & Protection (1,852 | 2.5%), Personal Care & Service (1,502 | 2.1%), and Healthcare Support (1,380 | 1.9%).
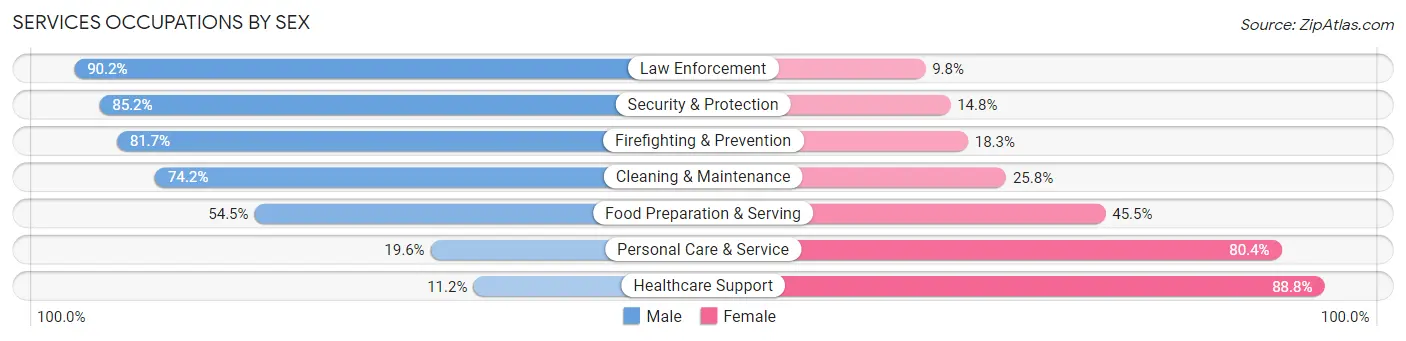
Services Occupations by Sex
Within the Services occupations in Coweta County, the most male-oriented occupations are Law Enforcement (90.2%), Security & Protection (85.2%), and Firefighting & Prevention (81.7%), while the most female-oriented occupations are Healthcare Support (88.8%), Personal Care & Service (80.4%), and Food Preparation & Serving (45.5%).
| Occupation | Male | Female |
| Healthcare Support | 154 (11.2%) | 1,226 (88.8%) |
| Security & Protection | 1,578 (85.2%) | 274 (14.8%) |
| Firefighting & Prevention | 890 (81.7%) | 199 (18.3%) |
| Law Enforcement | 688 (90.2%) | 75 (9.8%) |
| Food Preparation & Serving | 2,088 (54.5%) | 1,743 (45.5%) |
| Cleaning & Maintenance | 1,826 (74.2%) | 636 (25.8%) |
| Personal Care & Service | 295 (19.6%) | 1,207 (80.4%) |
| Total (Category) | 5,941 (53.9%) | 5,086 (46.1%) |
| Total (Overall) | 39,314 (53.7%) | 33,824 (46.3%) |
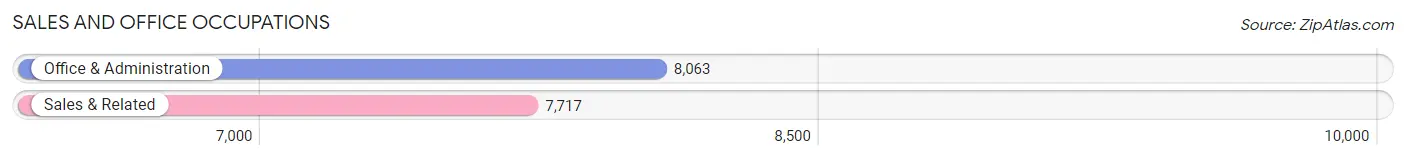
Sales and Office Occupations
The most common Sales and Office occupations in Coweta County are Office & Administration (8,063 | 11.0%), and Sales & Related (7,717 | 10.5%).
Sales and Office Occupations by Sex
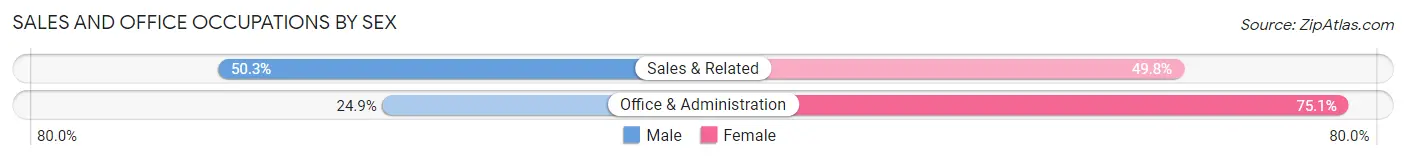
| Occupation | Male | Female |
| Sales & Related | 3,878 (50.2%) | 3,839 (49.7%) |
| Office & Administration | 2,010 (24.9%) | 6,053 (75.1%) |
| Total (Category) | 5,888 (37.3%) | 9,892 (62.7%) |
| Total (Overall) | 39,314 (53.7%) | 33,824 (46.3%) |
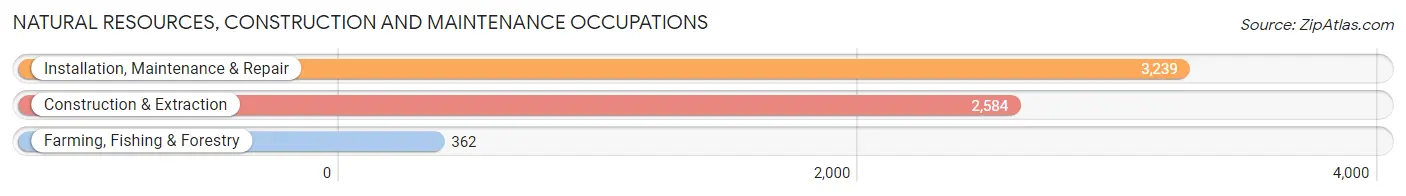
Natural Resources, Construction and Maintenance Occupations
The most common Natural Resources, Construction and Maintenance occupations in Coweta County are Installation, Maintenance & Repair (3,239 | 4.4%), Construction & Extraction (2,584 | 3.5%), and Farming, Fishing & Forestry (362 | 0.5%).
Natural Resources, Construction and Maintenance Occupations by Sex
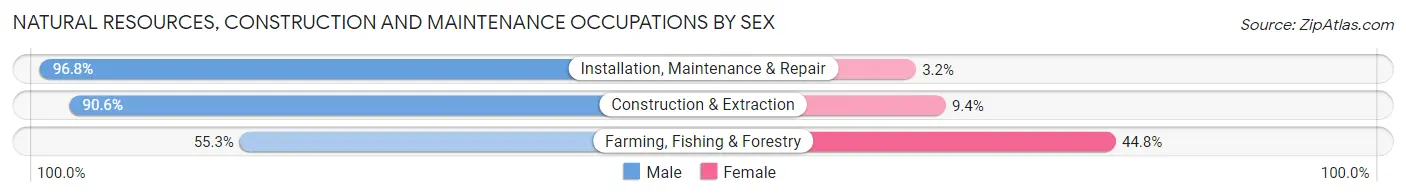
| Occupation | Male | Female |
| Farming, Fishing & Forestry | 200 (55.2%) | 162 (44.8%) |
| Construction & Extraction | 2,342 (90.6%) | 242 (9.4%) |
| Installation, Maintenance & Repair | 3,136 (96.8%) | 103 (3.2%) |
| Total (Category) | 5,678 (91.8%) | 507 (8.2%) |
| Total (Overall) | 39,314 (53.7%) | 33,824 (46.3%) |
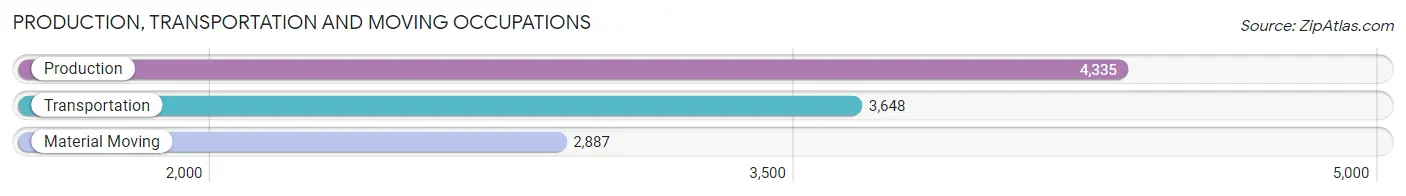
Production, Transportation and Moving Occupations
The most common Production, Transportation and Moving occupations in Coweta County are Production (4,335 | 5.9%), Transportation (3,648 | 5.0%), and Material Moving (2,887 | 4.0%).
Production, Transportation and Moving Occupations by Sex
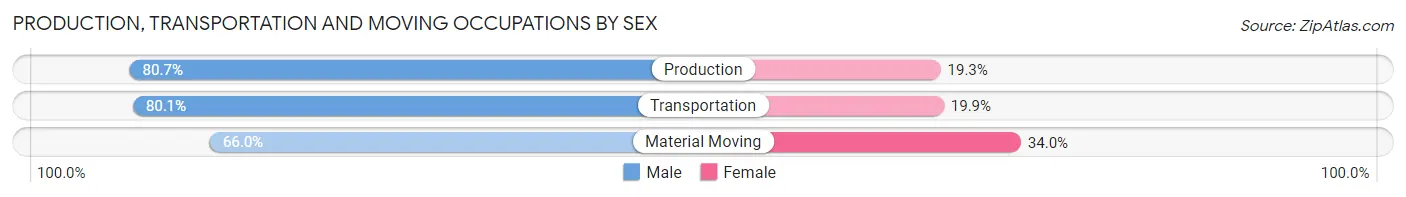
| Occupation | Male | Female |
| Production | 3,499 (80.7%) | 836 (19.3%) |
| Transportation | 2,923 (80.1%) | 725 (19.9%) |
| Material Moving | 1,905 (66.0%) | 982 (34.0%) |
| Total (Category) | 8,327 (76.6%) | 2,543 (23.4%) |
| Total (Overall) | 39,314 (53.7%) | 33,824 (46.3%) |
Employment Industries by Sex in Coweta County
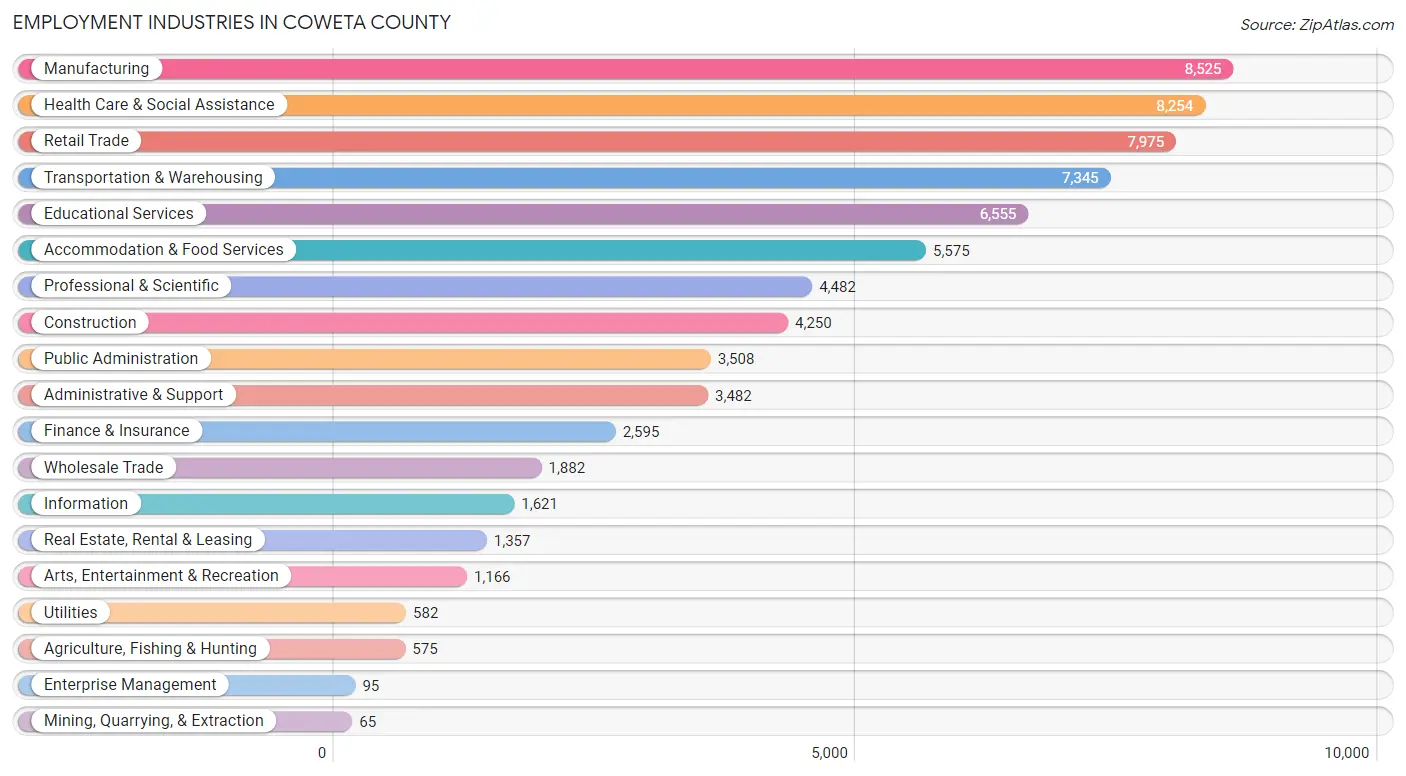
Employment Industries in Coweta County
The major employment industries in Coweta County include Manufacturing (8,525 | 11.7%), Health Care & Social Assistance (8,254 | 11.3%), Retail Trade (7,975 | 10.9%), Transportation & Warehousing (7,345 | 10.0%), and Educational Services (6,555 | 9.0%).
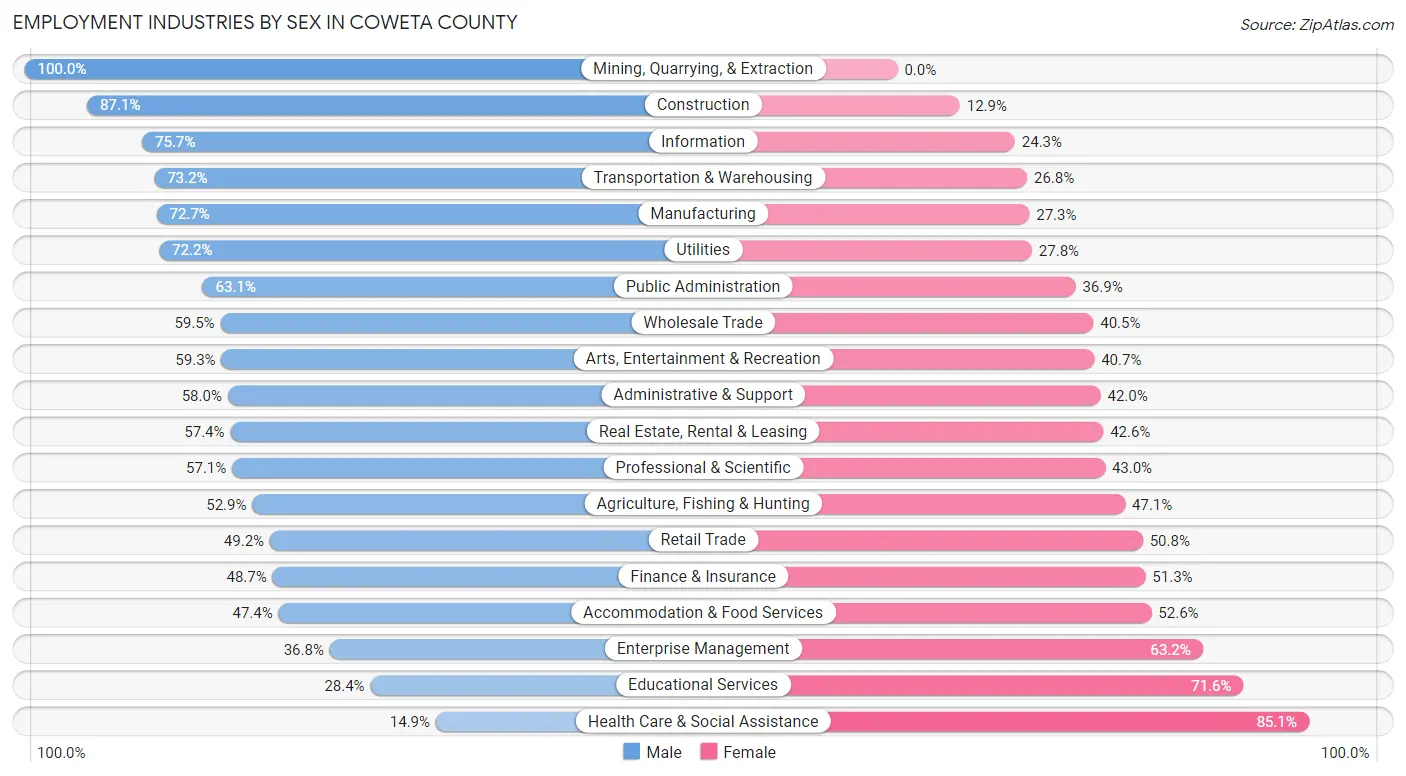
Employment Industries by Sex in Coweta County
The Coweta County industries that see more men than women are Mining, Quarrying, & Extraction (100.0%), Construction (87.1%), and Information (75.7%), whereas the industries that tend to have a higher number of women are Health Care & Social Assistance (85.1%), Educational Services (71.6%), and Enterprise Management (63.2%).
| Industry | Male | Female |
| Agriculture, Fishing & Hunting | 304 (52.9%) | 271 (47.1%) |
| Mining, Quarrying, & Extraction | 65 (100.0%) | 0 (0.0%) |
| Construction | 3,701 (87.1%) | 549 (12.9%) |
| Manufacturing | 6,198 (72.7%) | 2,327 (27.3%) |
| Wholesale Trade | 1,119 (59.5%) | 763 (40.5%) |
| Retail Trade | 3,925 (49.2%) | 4,050 (50.8%) |
| Transportation & Warehousing | 5,374 (73.2%) | 1,971 (26.8%) |
| Utilities | 420 (72.2%) | 162 (27.8%) |
| Information | 1,227 (75.7%) | 394 (24.3%) |
| Finance & Insurance | 1,263 (48.7%) | 1,332 (51.3%) |
| Real Estate, Rental & Leasing | 779 (57.4%) | 578 (42.6%) |
| Professional & Scientific | 2,557 (57.1%) | 1,925 (42.9%) |
| Enterprise Management | 35 (36.8%) | 60 (63.2%) |
| Administrative & Support | 2,018 (58.0%) | 1,464 (42.0%) |
| Educational Services | 1,863 (28.4%) | 4,692 (71.6%) |
| Health Care & Social Assistance | 1,227 (14.9%) | 7,027 (85.1%) |
| Arts, Entertainment & Recreation | 691 (59.3%) | 475 (40.7%) |
| Accommodation & Food Services | 2,644 (47.4%) | 2,931 (52.6%) |
| Public Administration | 2,215 (63.1%) | 1,293 (36.9%) |
| Total | 39,314 (53.7%) | 33,824 (46.3%) |
Education in Coweta County
School Enrollment in Coweta County
The most common levels of schooling among the 36,601 students in Coweta County are high school (9,018 | 24.6%), middle school (8,306 | 22.7%), and elementary school (8,016 | 21.9%).
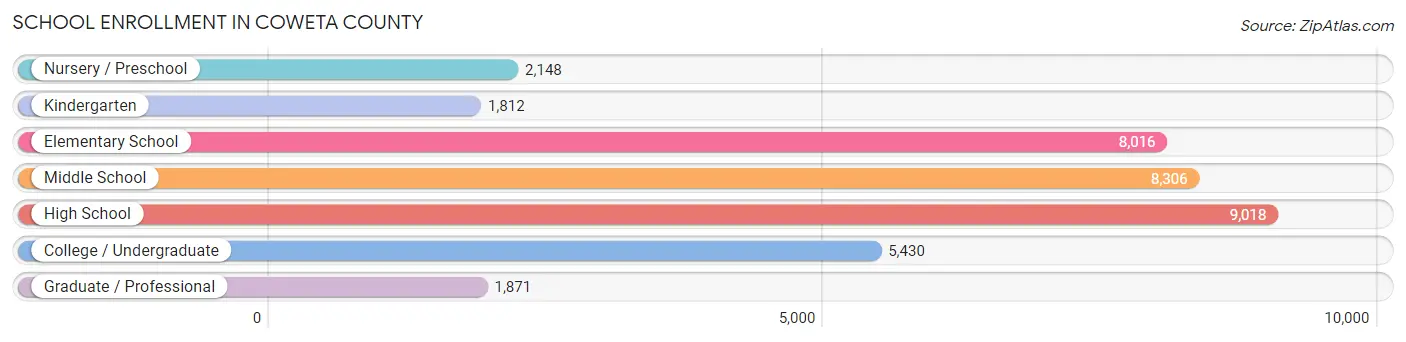
| School Level | # Students | % Students |
| Nursery / Preschool | 2,148 | 5.9% |
| Kindergarten | 1,812 | 5.0% |
| Elementary School | 8,016 | 21.9% |
| Middle School | 8,306 | 22.7% |
| High School | 9,018 | 24.6% |
| College / Undergraduate | 5,430 | 14.8% |
| Graduate / Professional | 1,871 | 5.1% |
| Total | 36,601 | 100.0% |
School Enrollment by Age by Funding Source in Coweta County
Out of a total of 36,601 students who are enrolled in schools in Coweta County, 7,430 (20.3%) attend a private institution, while the remaining 29,171 (79.7%) are enrolled in public schools. The age group of 3 to 4 year olds has the highest likelihood of being enrolled in private schools, with 885 (54.3% in the age bracket) enrolled. Conversely, the age group of 15 to 17 year olds has the lowest likelihood of being enrolled in a private school, with 5,461 (84.5% in the age bracket) attending a public institution.
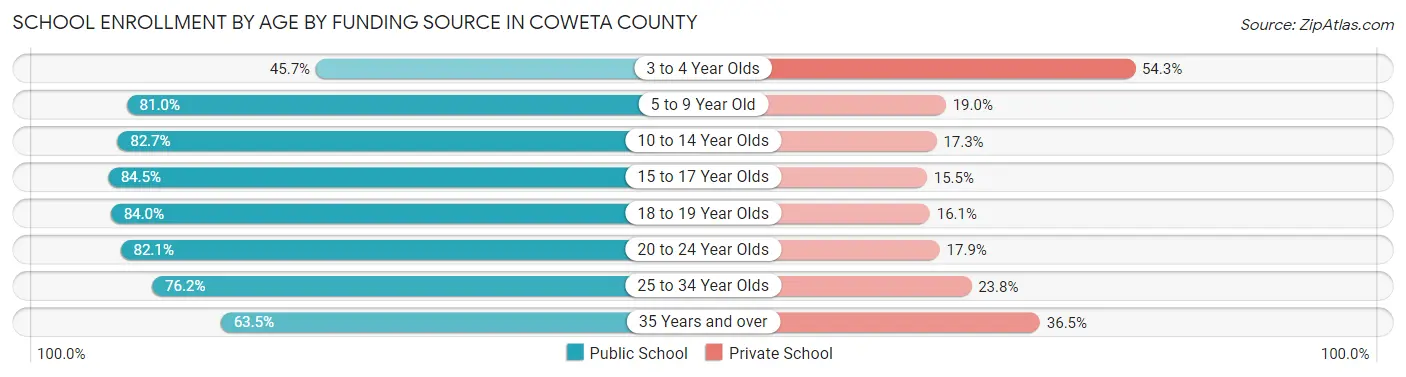
| Age Bracket | Public School | Private School |
| 3 to 4 Year Olds | 746 (45.7%) | 885 (54.3%) |
| 5 to 9 Year Old | 7,590 (81.0%) | 1,782 (19.0%) |
| 10 to 14 Year Olds | 8,313 (82.7%) | 1,736 (17.3%) |
| 15 to 17 Year Olds | 5,461 (84.5%) | 1,000 (15.5%) |
| 18 to 19 Year Olds | 1,956 (84.0%) | 374 (16.1%) |
| 20 to 24 Year Olds | 2,659 (82.1%) | 579 (17.9%) |
| 25 to 34 Year Olds | 1,290 (76.2%) | 402 (23.8%) |
| 35 Years and over | 1,160 (63.5%) | 668 (36.5%) |
| Total | 29,171 (79.7%) | 7,430 (20.3%) |
Educational Attainment by Field of Study in Coweta County
Business (7,801 | 21.2%), education (5,088 | 13.8%), science & technology (3,353 | 9.1%), arts & humanities (3,252 | 8.8%), and computers & mathematics (2,711 | 7.4%) are the most common fields of study among 36,828 individuals in Coweta County who have obtained a bachelor's degree or higher.
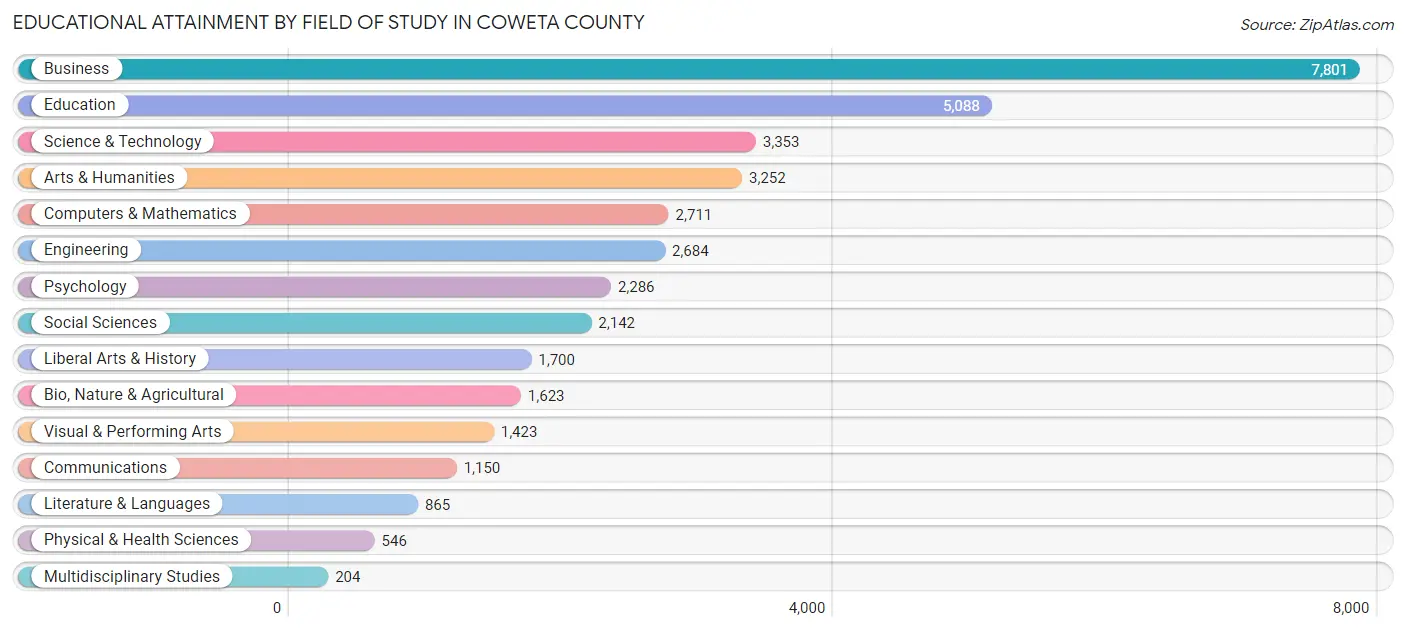
| Field of Study | # Graduates | % Graduates |
| Computers & Mathematics | 2,711 | 7.4% |
| Bio, Nature & Agricultural | 1,623 | 4.4% |
| Physical & Health Sciences | 546 | 1.5% |
| Psychology | 2,286 | 6.2% |
| Social Sciences | 2,142 | 5.8% |
| Engineering | 2,684 | 7.3% |
| Multidisciplinary Studies | 204 | 0.5% |
| Science & Technology | 3,353 | 9.1% |
| Business | 7,801 | 21.2% |
| Education | 5,088 | 13.8% |
| Literature & Languages | 865 | 2.4% |
| Liberal Arts & History | 1,700 | 4.6% |
| Visual & Performing Arts | 1,423 | 3.9% |
| Communications | 1,150 | 3.1% |
| Arts & Humanities | 3,252 | 8.8% |
| Total | 36,828 | 100.0% |
Transportation & Commute in Coweta County
Vehicle Availability by Sex in Coweta County
The most prevalent vehicle ownership categories in Coweta County are males with 2 vehicles (15,854, accounting for 40.8%) and females with 2 vehicles (13,557, making up 47.7%).
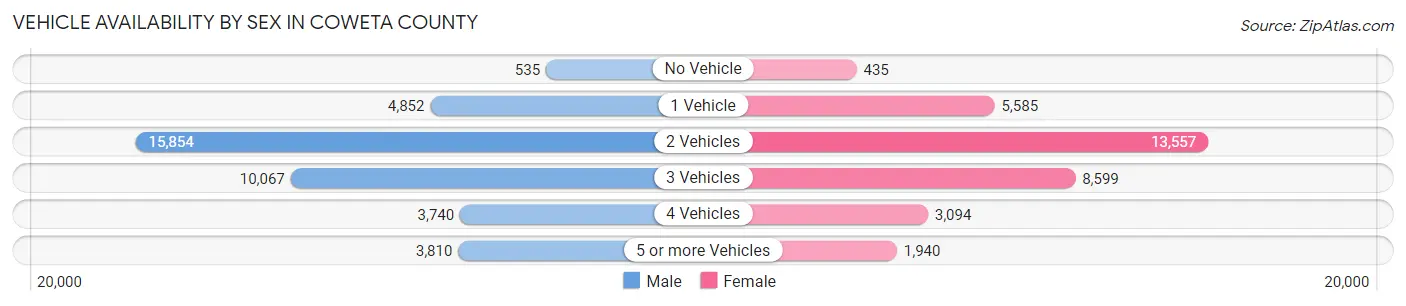
| Vehicles Available | Male | Female |
| No Vehicle | 535 (1.4%) | 435 (1.3%) |
| 1 Vehicle | 4,852 (12.5%) | 5,585 (16.8%) |
| 2 Vehicles | 15,854 (40.8%) | 13,557 (40.8%) |
| 3 Vehicles | 10,067 (25.9%) | 8,599 (25.9%) |
| 4 Vehicles | 3,740 (9.6%) | 3,094 (9.3%) |
| 5 or more Vehicles | 3,810 (9.8%) | 1,940 (5.8%) |
| Total | 38,858 (100.0%) | 33,210 (100.0%) |
Commute Time in Coweta County
The most frequently occuring commute durations in Coweta County are 15 to 19 minutes (9,851 commuters, 15.3%), 30 to 34 minutes (9,424 commuters, 14.6%), and 20 to 24 minutes (8,364 commuters, 13.0%).
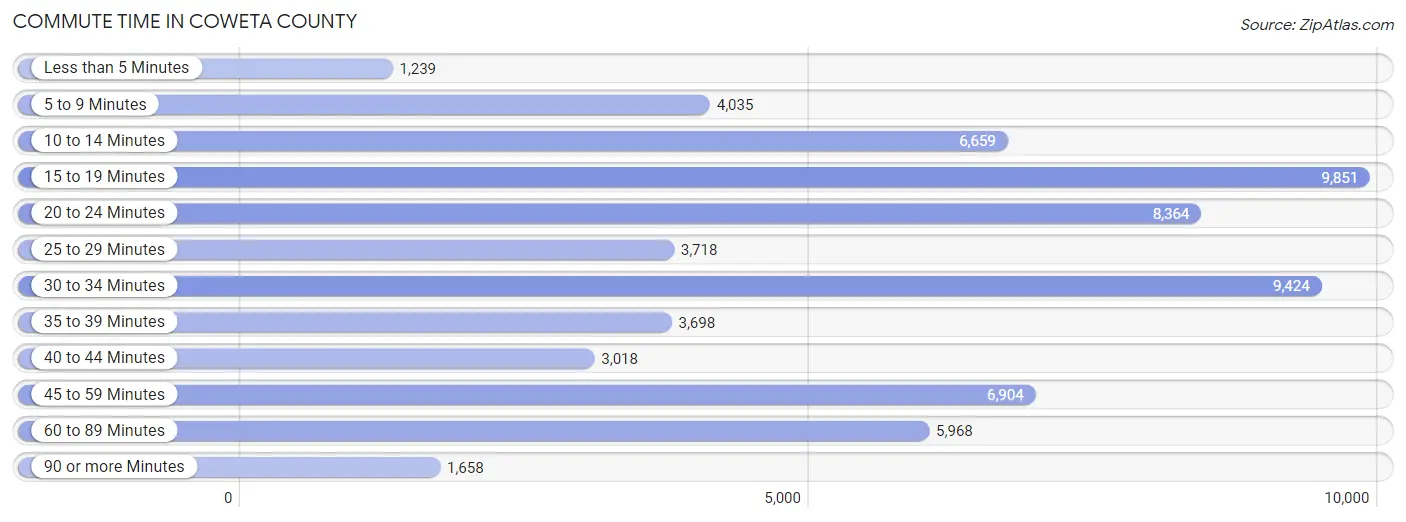
| Commute Time | # Commuters | % Commuters |
| Less than 5 Minutes | 1,239 | 1.9% |
| 5 to 9 Minutes | 4,035 | 6.2% |
| 10 to 14 Minutes | 6,659 | 10.3% |
| 15 to 19 Minutes | 9,851 | 15.3% |
| 20 to 24 Minutes | 8,364 | 13.0% |
| 25 to 29 Minutes | 3,718 | 5.8% |
| 30 to 34 Minutes | 9,424 | 14.6% |
| 35 to 39 Minutes | 3,698 | 5.7% |
| 40 to 44 Minutes | 3,018 | 4.7% |
| 45 to 59 Minutes | 6,904 | 10.7% |
| 60 to 89 Minutes | 5,968 | 9.2% |
| 90 or more Minutes | 1,658 | 2.6% |
Commute Time by Sex in Coweta County
The most common commute times in Coweta County are 30 to 34 minutes (5,204 commuters, 14.6%) for males and 15 to 19 minutes (4,851 commuters, 16.8%) for females.
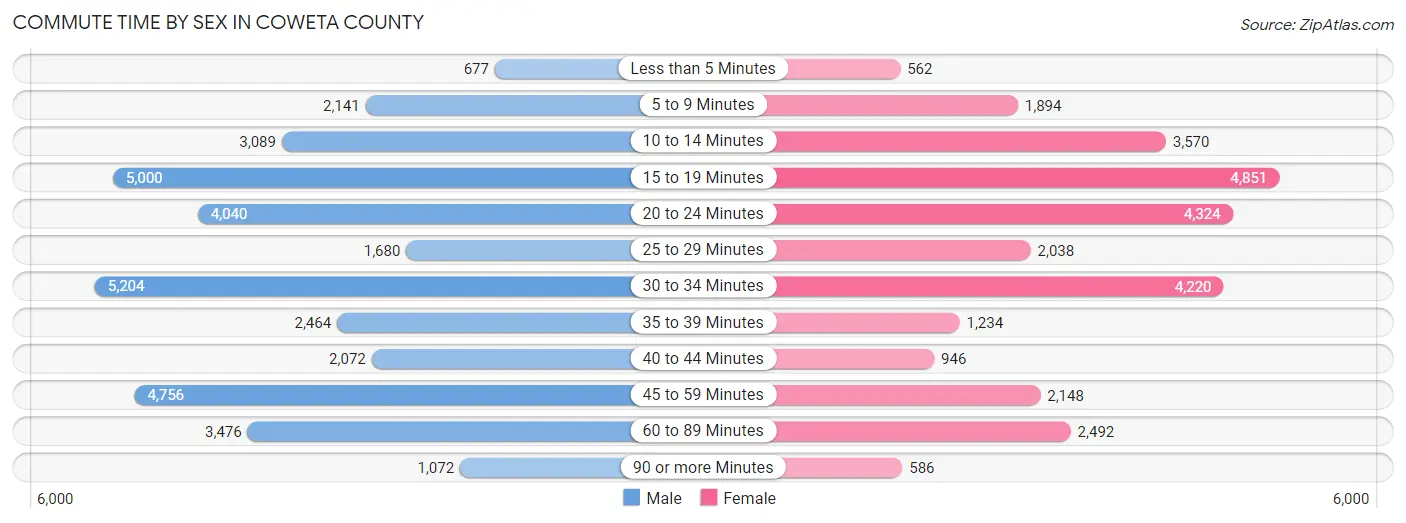
| Commute Time | Male | Female |
| Less than 5 Minutes | 677 (1.9%) | 562 (1.9%) |
| 5 to 9 Minutes | 2,141 (6.0%) | 1,894 (6.6%) |
| 10 to 14 Minutes | 3,089 (8.7%) | 3,570 (12.4%) |
| 15 to 19 Minutes | 5,000 (14.0%) | 4,851 (16.8%) |
| 20 to 24 Minutes | 4,040 (11.3%) | 4,324 (15.0%) |
| 25 to 29 Minutes | 1,680 (4.7%) | 2,038 (7.1%) |
| 30 to 34 Minutes | 5,204 (14.6%) | 4,220 (14.6%) |
| 35 to 39 Minutes | 2,464 (6.9%) | 1,234 (4.3%) |
| 40 to 44 Minutes | 2,072 (5.8%) | 946 (3.3%) |
| 45 to 59 Minutes | 4,756 (13.3%) | 2,148 (7.4%) |
| 60 to 89 Minutes | 3,476 (9.7%) | 2,492 (8.6%) |
| 90 or more Minutes | 1,072 (3.0%) | 586 (2.0%) |
Time of Departure to Work by Sex in Coweta County
The most frequent times of departure to work in Coweta County are 7:00 AM to 7:29 AM (5,428, 15.2%) for males and 7:00 AM to 7:29 AM (5,131, 17.8%) for females.
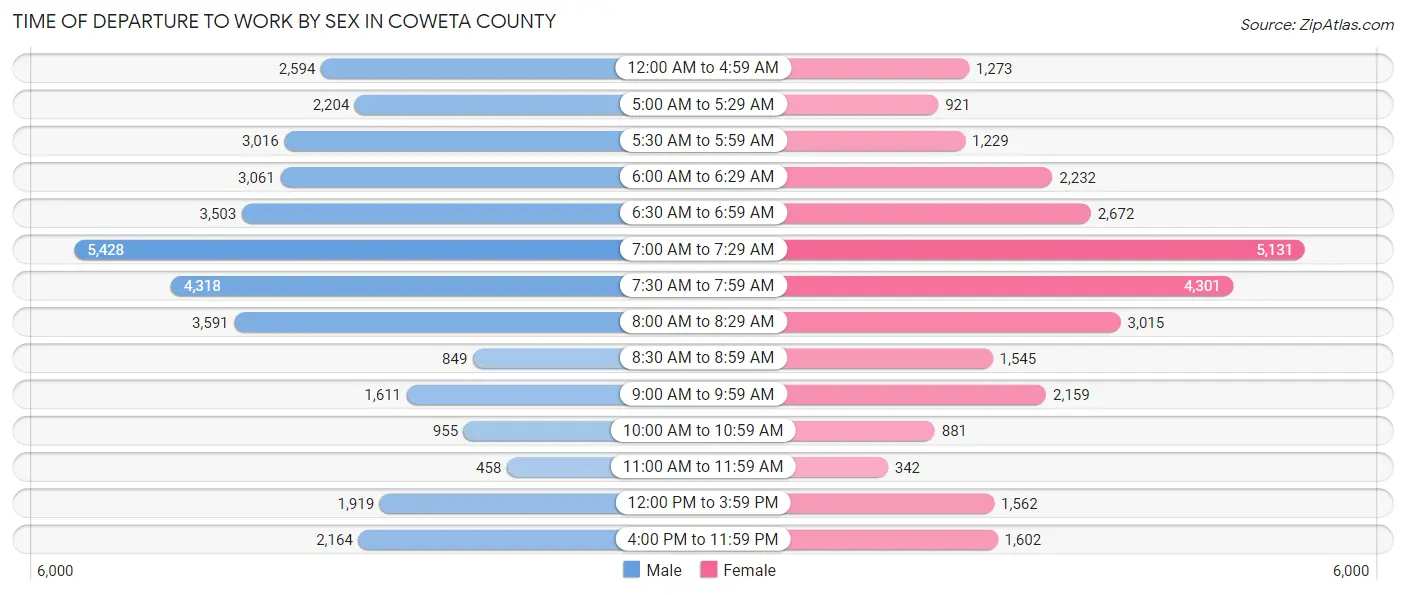
| Time of Departure | Male | Female |
| 12:00 AM to 4:59 AM | 2,594 (7.3%) | 1,273 (4.4%) |
| 5:00 AM to 5:29 AM | 2,204 (6.2%) | 921 (3.2%) |
| 5:30 AM to 5:59 AM | 3,016 (8.5%) | 1,229 (4.3%) |
| 6:00 AM to 6:29 AM | 3,061 (8.6%) | 2,232 (7.7%) |
| 6:30 AM to 6:59 AM | 3,503 (9.8%) | 2,672 (9.3%) |
| 7:00 AM to 7:29 AM | 5,428 (15.2%) | 5,131 (17.8%) |
| 7:30 AM to 7:59 AM | 4,318 (12.1%) | 4,301 (14.9%) |
| 8:00 AM to 8:29 AM | 3,591 (10.1%) | 3,015 (10.4%) |
| 8:30 AM to 8:59 AM | 849 (2.4%) | 1,545 (5.3%) |
| 9:00 AM to 9:59 AM | 1,611 (4.5%) | 2,159 (7.5%) |
| 10:00 AM to 10:59 AM | 955 (2.7%) | 881 (3.0%) |
| 11:00 AM to 11:59 AM | 458 (1.3%) | 342 (1.2%) |
| 12:00 PM to 3:59 PM | 1,919 (5.4%) | 1,562 (5.4%) |
| 4:00 PM to 11:59 PM | 2,164 (6.1%) | 1,602 (5.6%) |
| Total | 35,671 (100.0%) | 28,865 (100.0%) |
Housing Occupancy in Coweta County
Occupancy by Ownership in Coweta County
Of the total 54,177 dwellings in Coweta County, owner-occupied units account for 41,273 (76.2%), while renter-occupied units make up 12,904 (23.8%).
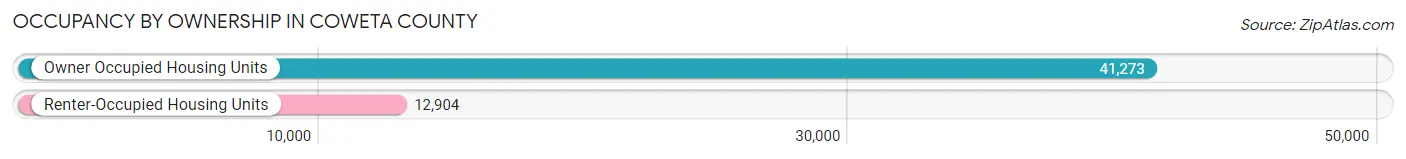
| Occupancy | # Housing Units | % Housing Units |
| Owner Occupied Housing Units | 41,273 | 76.2% |
| Renter-Occupied Housing Units | 12,904 | 23.8% |
| Total Occupied Housing Units | 54,177 | 100.0% |
Occupancy by Household Size in Coweta County
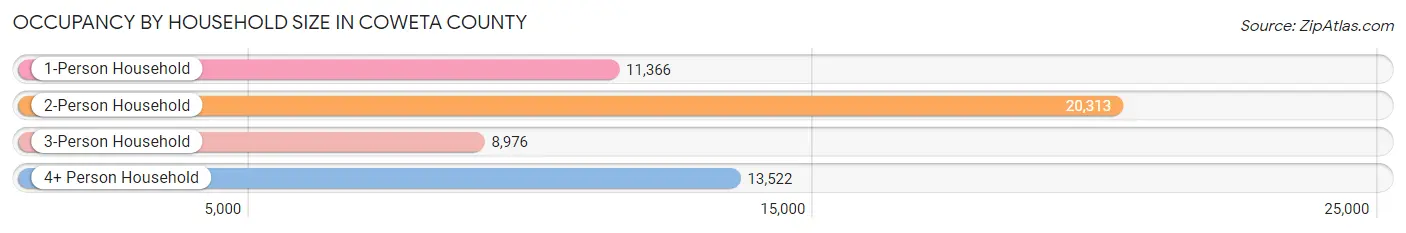
| Household Size | # Housing Units | % Housing Units |
| 1-Person Household | 11,366 | 21.0% |
| 2-Person Household | 20,313 | 37.5% |
| 3-Person Household | 8,976 | 16.6% |
| 4+ Person Household | 13,522 | 25.0% |
| Total Housing Units | 54,177 | 100.0% |
Occupancy by Ownership by Household Size in Coweta County
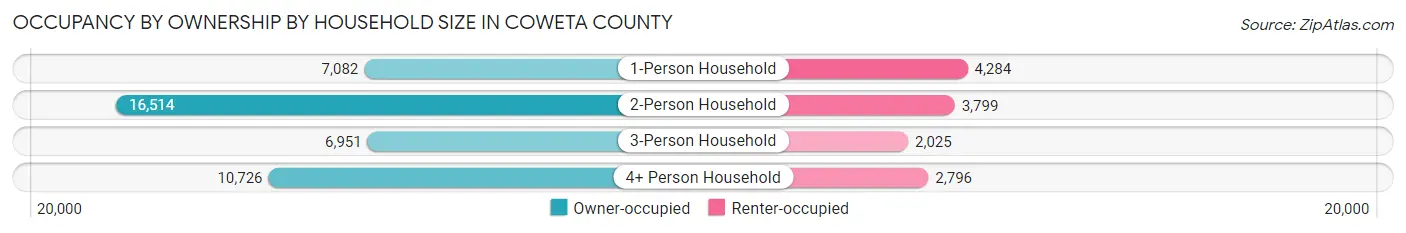
| Household Size | Owner-occupied | Renter-occupied |
| 1-Person Household | 7,082 (62.3%) | 4,284 (37.7%) |
| 2-Person Household | 16,514 (81.3%) | 3,799 (18.7%) |
| 3-Person Household | 6,951 (77.4%) | 2,025 (22.6%) |
| 4+ Person Household | 10,726 (79.3%) | 2,796 (20.7%) |
| Total Housing Units | 41,273 (76.2%) | 12,904 (23.8%) |
Occupancy by Educational Attainment in Coweta County
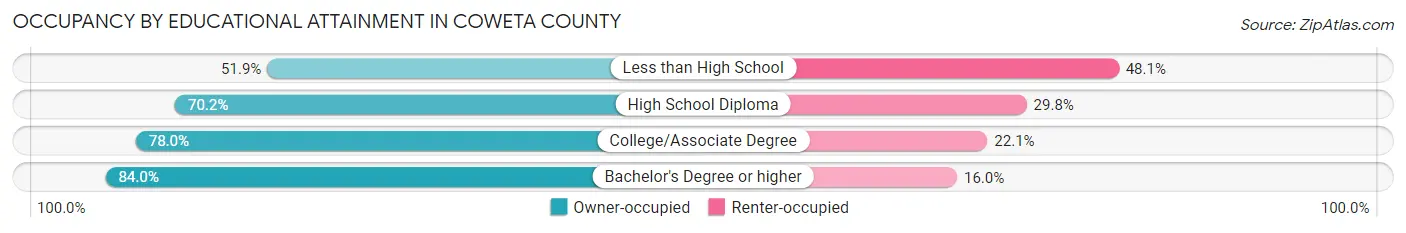
| Household Size | Owner-occupied | Renter-occupied |
| Less than High School | 2,256 (51.9%) | 2,090 (48.1%) |
| High School Diploma | 8,993 (70.2%) | 3,825 (29.8%) |
| College/Associate Degree | 13,643 (77.9%) | 3,860 (22.1%) |
| Bachelor's Degree or higher | 16,381 (84.0%) | 3,129 (16.0%) |
Occupancy by Age of Householder in Coweta County
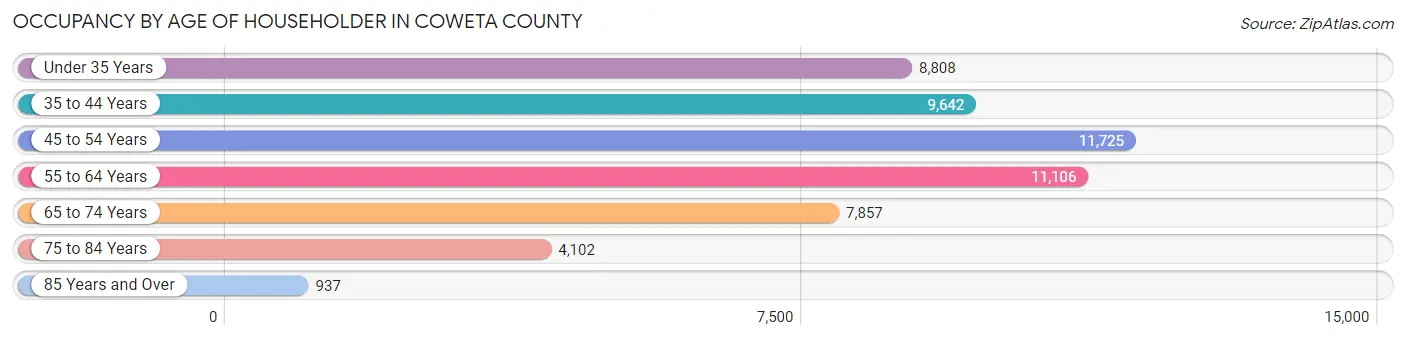
| Age Bracket | # Households | % Households |
| Under 35 Years | 8,808 | 16.3% |
| 35 to 44 Years | 9,642 | 17.8% |
| 45 to 54 Years | 11,725 | 21.6% |
| 55 to 64 Years | 11,106 | 20.5% |
| 65 to 74 Years | 7,857 | 14.5% |
| 75 to 84 Years | 4,102 | 7.6% |
| 85 Years and Over | 937 | 1.7% |
| Total | 54,177 | 100.0% |
Housing Finances in Coweta County
Median Income by Occupancy in Coweta County
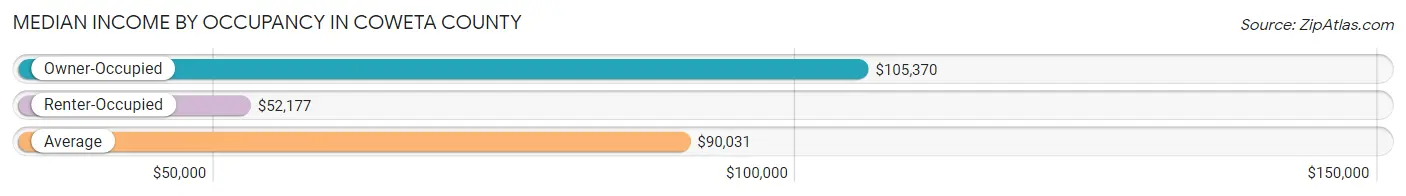
| Occupancy Type | # Households | Median Income |
| Owner-Occupied | 41,273 (76.2%) | $105,370 |
| Renter-Occupied | 12,904 (23.8%) | $52,177 |
| Average | 54,177 (100.0%) | $90,031 |
Occupancy by Householder Income Bracket in Coweta County
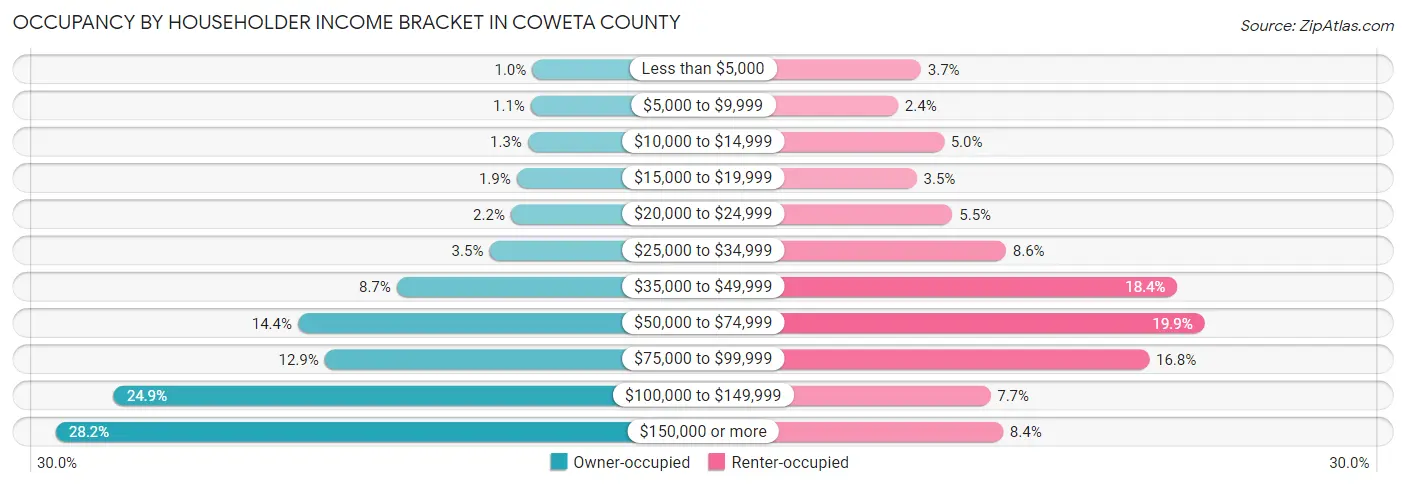
| Income Bracket | Owner-occupied | Renter-occupied |
| Less than $5,000 | 412 (1.0%) | 481 (3.7%) |
| $5,000 to $9,999 | 444 (1.1%) | 312 (2.4%) |
| $10,000 to $14,999 | 517 (1.3%) | 651 (5.0%) |
| $15,000 to $19,999 | 782 (1.9%) | 450 (3.5%) |
| $20,000 to $24,999 | 915 (2.2%) | 713 (5.5%) |
| $25,000 to $34,999 | 1,425 (3.5%) | 1,108 (8.6%) |
| $35,000 to $49,999 | 3,608 (8.7%) | 2,373 (18.4%) |
| $50,000 to $74,999 | 5,941 (14.4%) | 2,573 (19.9%) |
| $75,000 to $99,999 | 5,307 (12.9%) | 2,164 (16.8%) |
| $100,000 to $149,999 | 10,277 (24.9%) | 993 (7.7%) |
| $150,000 or more | 11,645 (28.2%) | 1,086 (8.4%) |
| Total | 41,273 (100.0%) | 12,904 (100.0%) |
Monthly Housing Cost Tiers in Coweta County
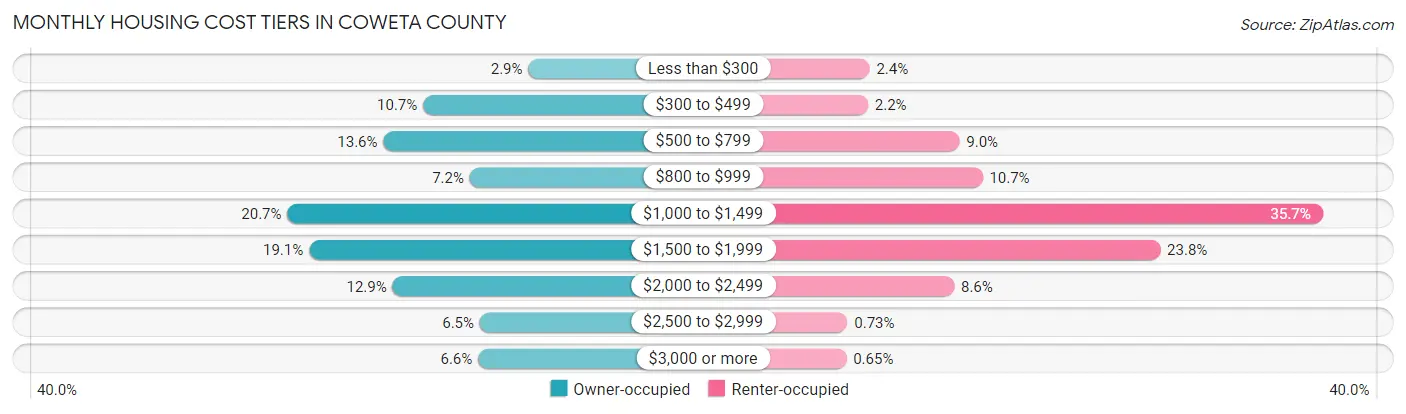
| Monthly Cost | Owner-occupied | Renter-occupied |
| Less than $300 | 1,198 (2.9%) | 304 (2.4%) |
| $300 to $499 | 4,394 (10.6%) | 289 (2.2%) |
| $500 to $799 | 5,603 (13.6%) | 1,159 (9.0%) |
| $800 to $999 | 2,975 (7.2%) | 1,378 (10.7%) |
| $1,000 to $1,499 | 8,524 (20.6%) | 4,611 (35.7%) |
| $1,500 to $1,999 | 7,863 (19.1%) | 3,067 (23.8%) |
| $2,000 to $2,499 | 5,324 (12.9%) | 1,109 (8.6%) |
| $2,500 to $2,999 | 2,670 (6.5%) | 94 (0.7%) |
| $3,000 or more | 2,722 (6.6%) | 84 (0.6%) |
| Total | 41,273 (100.0%) | 12,904 (100.0%) |
Physical Housing Characteristics in Coweta County
Housing Structures in Coweta County
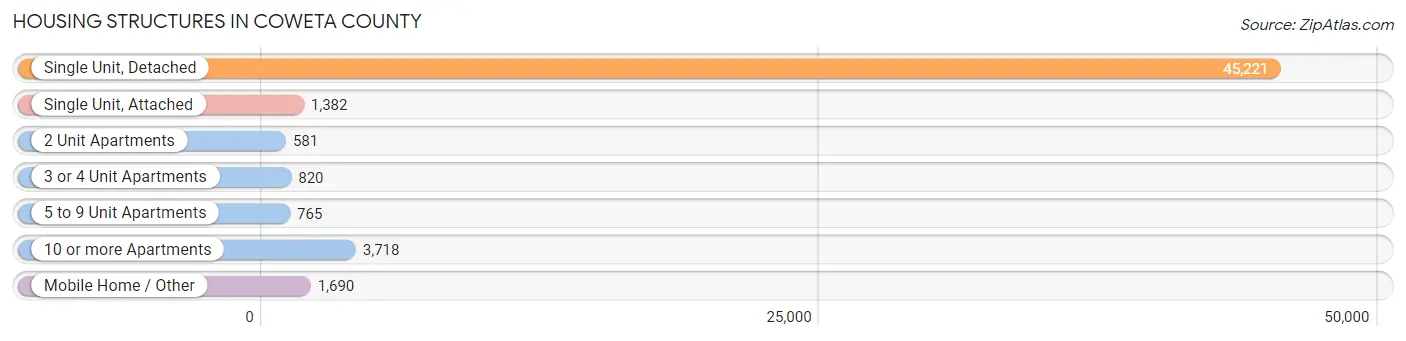
| Structure Type | # Housing Units | % Housing Units |
| Single Unit, Detached | 45,221 | 83.5% |
| Single Unit, Attached | 1,382 | 2.5% |
| 2 Unit Apartments | 581 | 1.1% |
| 3 or 4 Unit Apartments | 820 | 1.5% |
| 5 to 9 Unit Apartments | 765 | 1.4% |
| 10 or more Apartments | 3,718 | 6.9% |
| Mobile Home / Other | 1,690 | 3.1% |
| Total | 54,177 | 100.0% |
Housing Structures by Occupancy in Coweta County
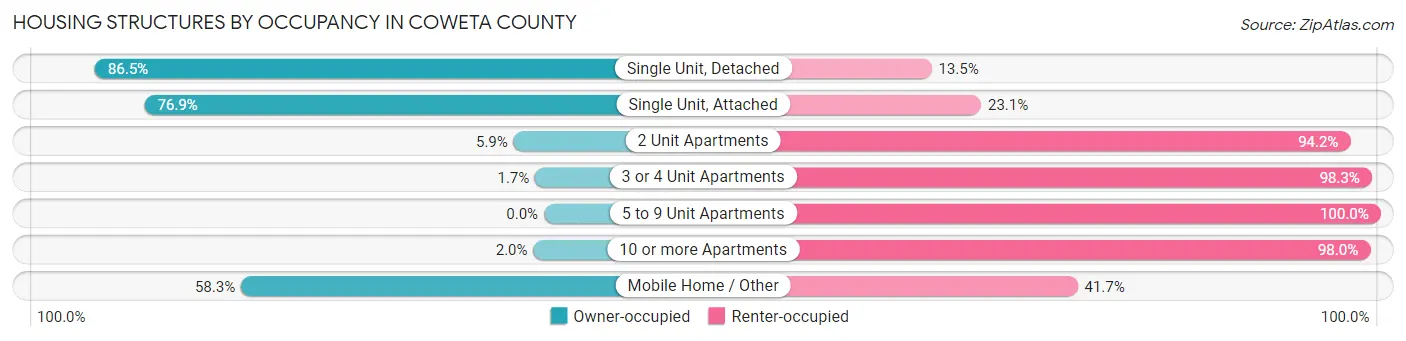
| Structure Type | Owner-occupied | Renter-occupied |
| Single Unit, Detached | 39,100 (86.5%) | 6,121 (13.5%) |
| Single Unit, Attached | 1,063 (76.9%) | 319 (23.1%) |
| 2 Unit Apartments | 34 (5.9%) | 547 (94.2%) |
| 3 or 4 Unit Apartments | 14 (1.7%) | 806 (98.3%) |
| 5 to 9 Unit Apartments | 0 (0.0%) | 765 (100.0%) |
| 10 or more Apartments | 76 (2.0%) | 3,642 (98.0%) |
| Mobile Home / Other | 986 (58.3%) | 704 (41.7%) |
| Total | 41,273 (76.2%) | 12,904 (23.8%) |
Housing Structures by Number of Rooms in Coweta County
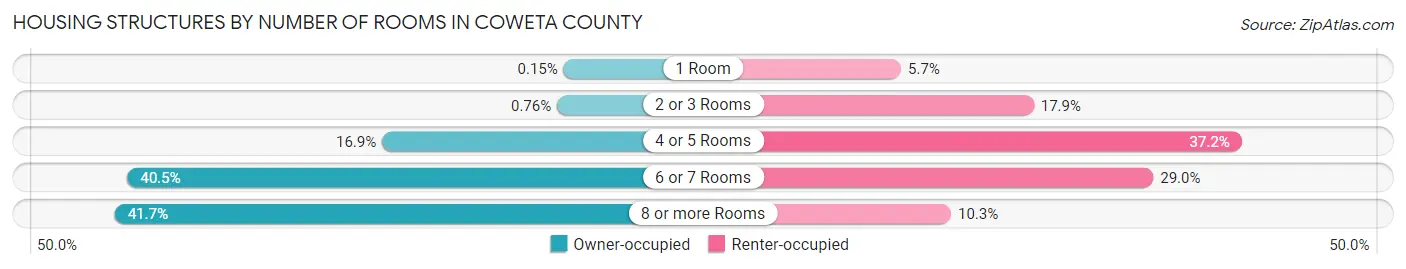
| Number of Rooms | Owner-occupied | Renter-occupied |
| 1 Room | 61 (0.2%) | 731 (5.7%) |
| 2 or 3 Rooms | 314 (0.8%) | 2,314 (17.9%) |
| 4 or 5 Rooms | 6,991 (16.9%) | 4,794 (37.1%) |
| 6 or 7 Rooms | 16,714 (40.5%) | 3,739 (29.0%) |
| 8 or more Rooms | 17,193 (41.7%) | 1,326 (10.3%) |
| Total | 41,273 (100.0%) | 12,904 (100.0%) |
Housing Structure by Heating Type in Coweta County
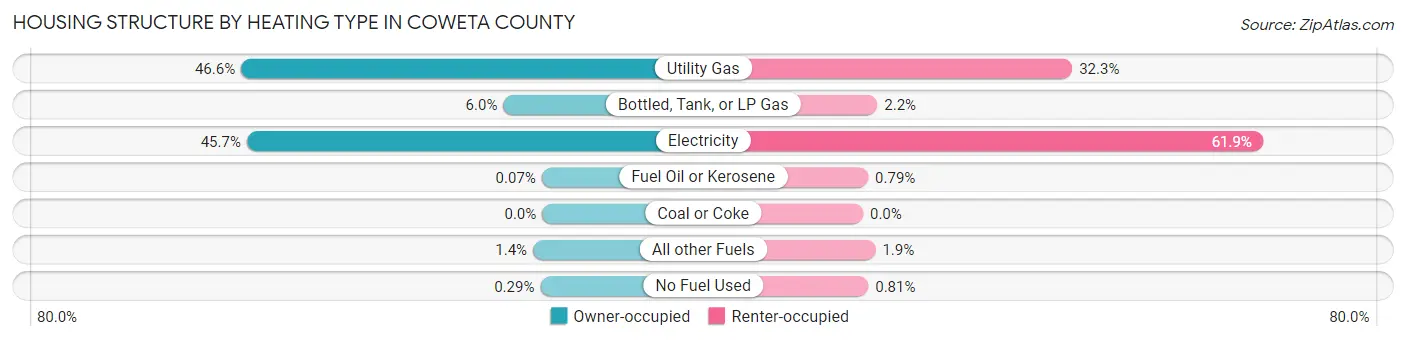
| Heating Type | Owner-occupied | Renter-occupied |
| Utility Gas | 19,214 (46.6%) | 4,173 (32.3%) |
| Bottled, Tank, or LP Gas | 2,481 (6.0%) | 285 (2.2%) |
| Electricity | 18,845 (45.7%) | 7,991 (61.9%) |
| Fuel Oil or Kerosene | 27 (0.1%) | 102 (0.8%) |
| Coal or Coke | 0 (0.0%) | 0 (0.0%) |
| All other Fuels | 588 (1.4%) | 248 (1.9%) |
| No Fuel Used | 118 (0.3%) | 105 (0.8%) |
| Total | 41,273 (100.0%) | 12,904 (100.0%) |
Household Vehicle Usage in Coweta County
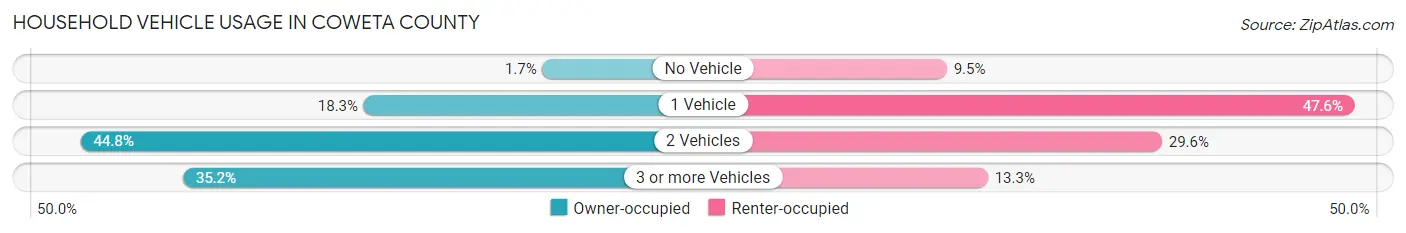
| Vehicles per Household | Owner-occupied | Renter-occupied |
| No Vehicle | 682 (1.7%) | 1,226 (9.5%) |
| 1 Vehicle | 7,566 (18.3%) | 6,141 (47.6%) |
| 2 Vehicles | 18,484 (44.8%) | 3,817 (29.6%) |
| 3 or more Vehicles | 14,541 (35.2%) | 1,720 (13.3%) |
| Total | 41,273 (100.0%) | 12,904 (100.0%) |
Real Estate & Mortgages in Coweta County
Real Estate and Mortgage Overview in Coweta County
| Characteristic | Without Mortgage | With Mortgage |
| Housing Units | 12,507 | 28,766 |
| Median Property Value | $262,500 | $307,700 |
| Median Household Income | $74,387 | $9,180 |
| Monthly Housing Costs | $548 | $2,698 |
| Real Estate Taxes | $1,844 | $356 |
Property Value by Mortgage Status in Coweta County
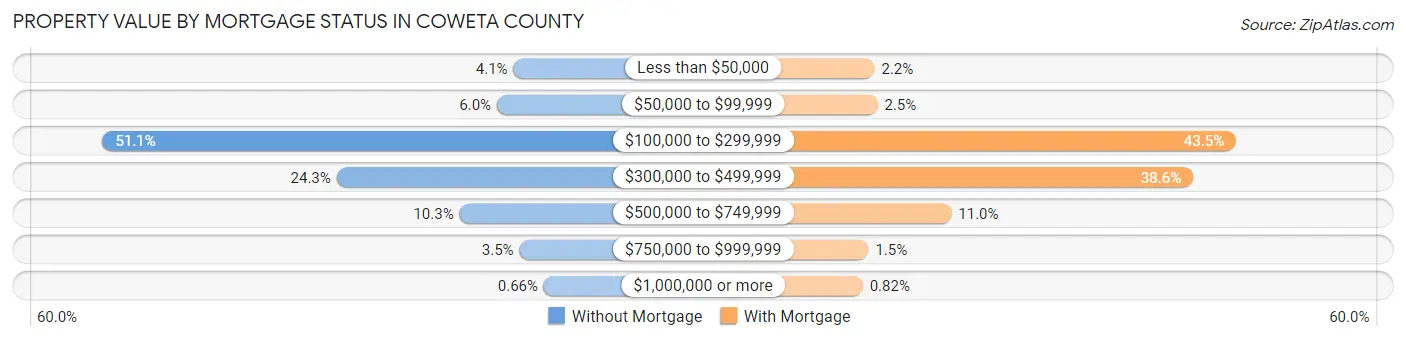
| Property Value | Without Mortgage | With Mortgage |
| Less than $50,000 | 516 (4.1%) | 624 (2.2%) |
| $50,000 to $99,999 | 753 (6.0%) | 723 (2.5%) |
| $100,000 to $299,999 | 6,392 (51.1%) | 12,511 (43.5%) |
| $300,000 to $499,999 | 3,044 (24.3%) | 11,093 (38.6%) |
| $500,000 to $749,999 | 1,288 (10.3%) | 3,151 (11.0%) |
| $750,000 to $999,999 | 432 (3.5%) | 427 (1.5%) |
| $1,000,000 or more | 82 (0.7%) | 237 (0.8%) |
| Total | 12,507 (100.0%) | 28,766 (100.0%) |
Household Income by Mortgage Status in Coweta County
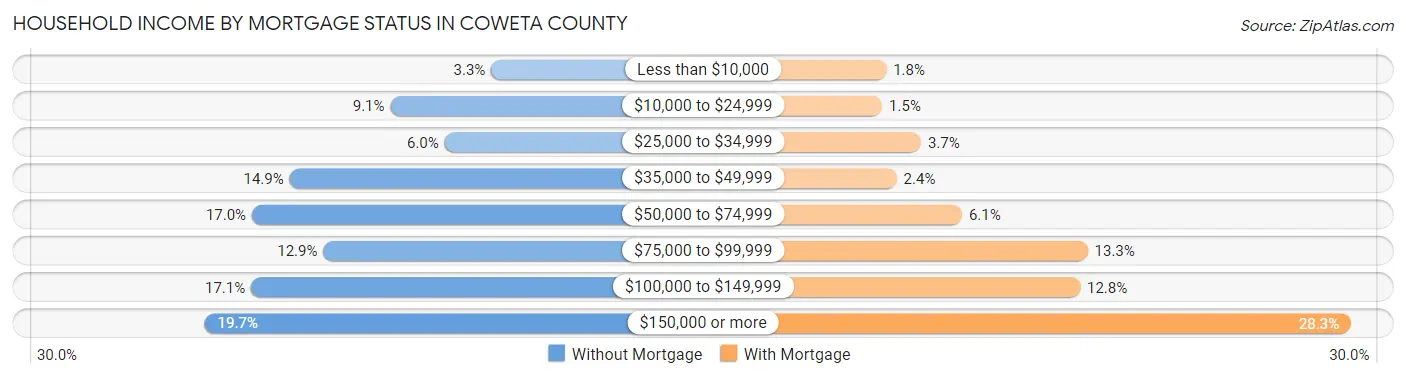
| Household Income | Without Mortgage | With Mortgage |
| Less than $10,000 | 418 (3.3%) | 502 (1.8%) |
| $10,000 to $24,999 | 1,138 (9.1%) | 438 (1.5%) |
| $25,000 to $34,999 | 750 (6.0%) | 1,076 (3.7%) |
| $35,000 to $49,999 | 1,858 (14.9%) | 675 (2.4%) |
| $50,000 to $74,999 | 2,127 (17.0%) | 1,750 (6.1%) |
| $75,000 to $99,999 | 1,617 (12.9%) | 3,814 (13.3%) |
| $100,000 to $149,999 | 2,134 (17.1%) | 3,690 (12.8%) |
| $150,000 or more | 2,465 (19.7%) | 8,143 (28.3%) |
| Total | 12,507 (100.0%) | 28,766 (100.0%) |
Property Value to Household Income Ratio in Coweta County
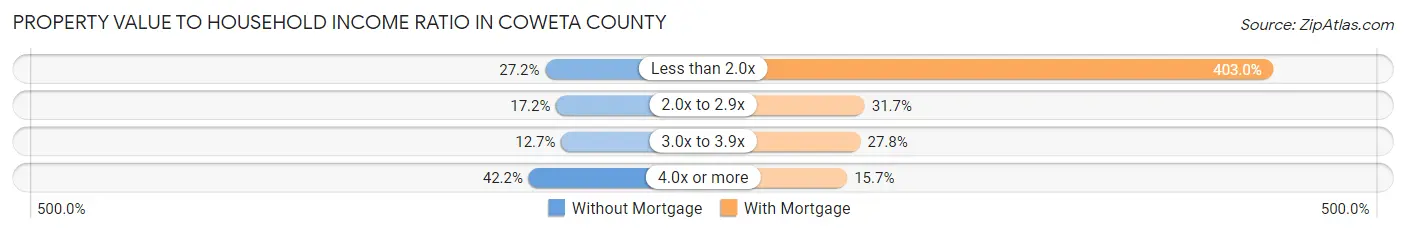
| Value-to-Income Ratio | Without Mortgage | With Mortgage |
| Less than 2.0x | 3,399 (27.2%) | 115,913 (402.9%) |
| 2.0x to 2.9x | 2,149 (17.2%) | 9,106 (31.7%) |
| 3.0x to 3.9x | 1,583 (12.7%) | 7,997 (27.8%) |
| 4.0x or more | 5,277 (42.2%) | 4,516 (15.7%) |
| Total | 12,507 (100.0%) | 28,766 (100.0%) |
Real Estate Taxes by Mortgage Status in Coweta County
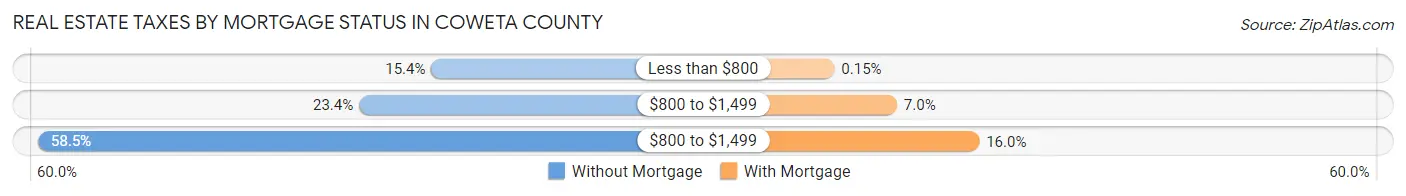
| Property Taxes | Without Mortgage | With Mortgage |
| Less than $800 | 1,930 (15.4%) | 42 (0.2%) |
| $800 to $1,499 | 2,920 (23.4%) | 2,013 (7.0%) |
| $800 to $1,499 | 7,321 (58.5%) | 4,609 (16.0%) |
| Total | 12,507 (100.0%) | 28,766 (100.0%) |
Health & Disability in Coweta County
Health Insurance Coverage by Age in Coweta County
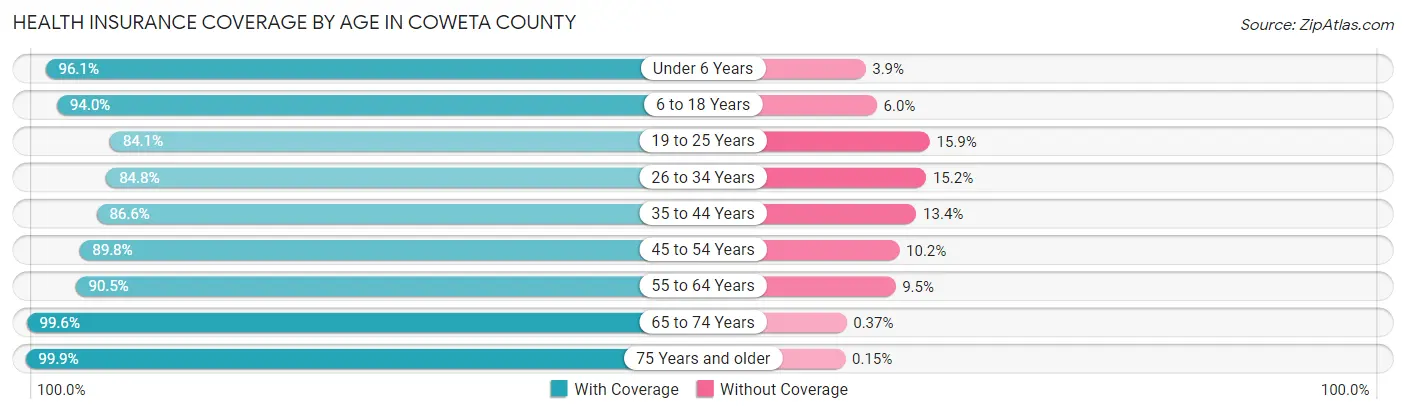
| Age Bracket | With Coverage | Without Coverage |
| Under 6 Years | 9,412 (96.1%) | 383 (3.9%) |
| 6 to 18 Years | 25,483 (94.0%) | 1,634 (6.0%) |
| 19 to 25 Years | 10,317 (84.1%) | 1,950 (15.9%) |
| 26 to 34 Years | 13,433 (84.8%) | 2,413 (15.2%) |
| 35 to 44 Years | 16,940 (86.6%) | 2,622 (13.4%) |
| 45 to 54 Years | 19,113 (89.8%) | 2,175 (10.2%) |
| 55 to 64 Years | 17,949 (90.5%) | 1,882 (9.5%) |
| 65 to 74 Years | 13,035 (99.6%) | 49 (0.4%) |
| 75 Years and older | 7,906 (99.9%) | 12 (0.2%) |
| Total | 133,588 (91.1%) | 13,120 (8.9%) |
Health Insurance Coverage by Citizenship Status in Coweta County
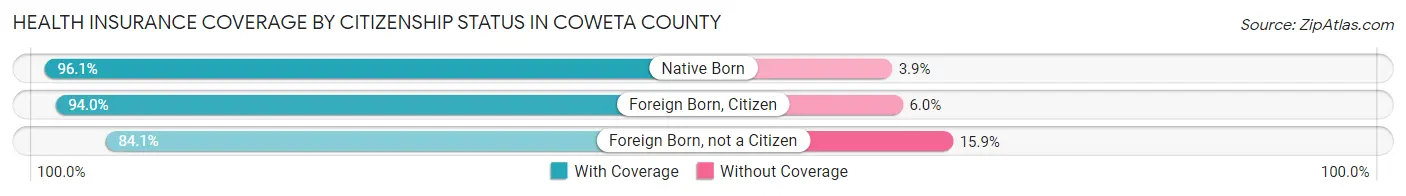
| Citizenship Status | With Coverage | Without Coverage |
| Native Born | 9,412 (96.1%) | 383 (3.9%) |
| Foreign Born, Citizen | 25,483 (94.0%) | 1,634 (6.0%) |
| Foreign Born, not a Citizen | 10,317 (84.1%) | 1,950 (15.9%) |
Health Insurance Coverage by Household Income in Coweta County
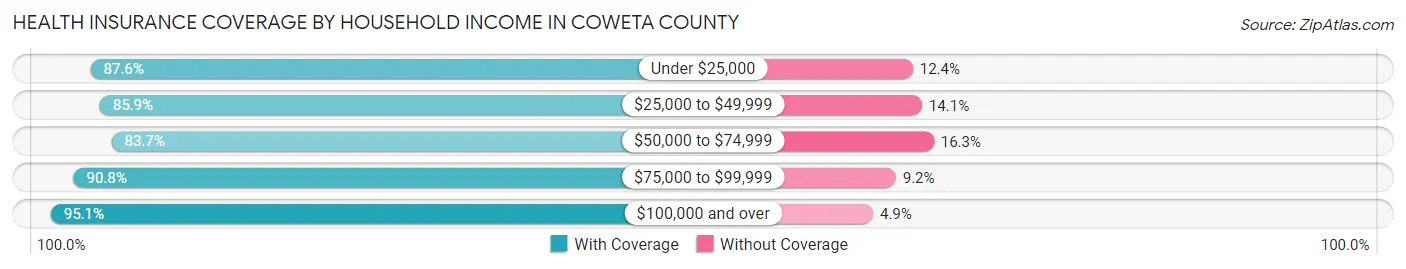
| Household Income | With Coverage | Without Coverage |
| Under $25,000 | 9,154 (87.6%) | 1,292 (12.4%) |
| $25,000 to $49,999 | 16,501 (85.9%) | 2,706 (14.1%) |
| $50,000 to $74,999 | 18,015 (83.7%) | 3,509 (16.3%) |
| $75,000 to $99,999 | 19,394 (90.8%) | 1,961 (9.2%) |
| $100,000 and over | 70,483 (95.1%) | 3,647 (4.9%) |
Public vs Private Health Insurance Coverage by Age in Coweta County
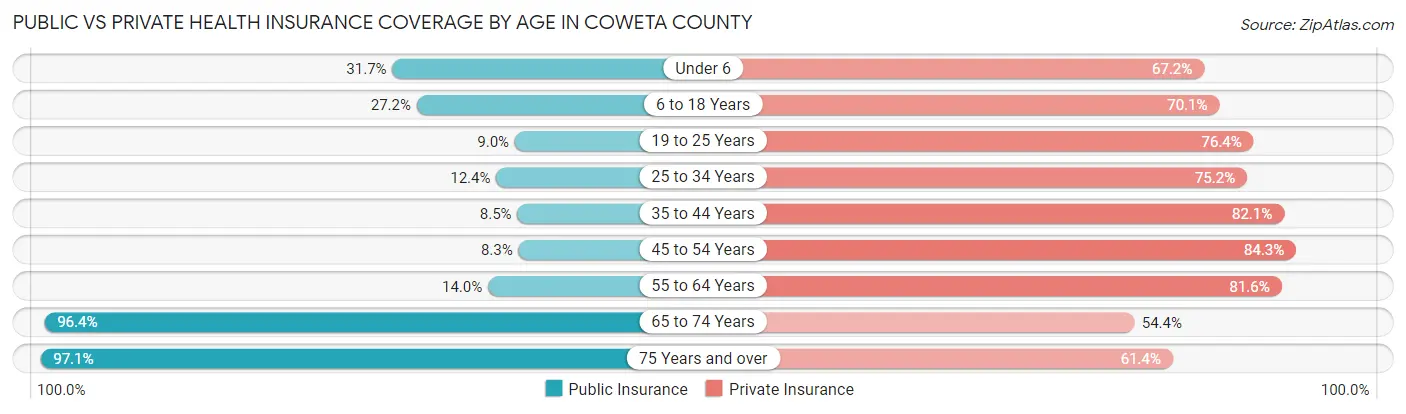
| Age Bracket | Public Insurance | Private Insurance |
| Under 6 | 3,108 (31.7%) | 6,586 (67.2%) |
| 6 to 18 Years | 7,375 (27.2%) | 19,001 (70.1%) |
| 19 to 25 Years | 1,102 (9.0%) | 9,376 (76.4%) |
| 25 to 34 Years | 1,971 (12.4%) | 11,916 (75.2%) |
| 35 to 44 Years | 1,669 (8.5%) | 16,057 (82.1%) |
| 45 to 54 Years | 1,768 (8.3%) | 17,949 (84.3%) |
| 55 to 64 Years | 2,773 (14.0%) | 16,187 (81.6%) |
| 65 to 74 Years | 12,607 (96.4%) | 7,116 (54.4%) |
| 75 Years and over | 7,687 (97.1%) | 4,864 (61.4%) |
| Total | 40,060 (27.3%) | 109,052 (74.3%) |
Disability Status by Sex by Age in Coweta County
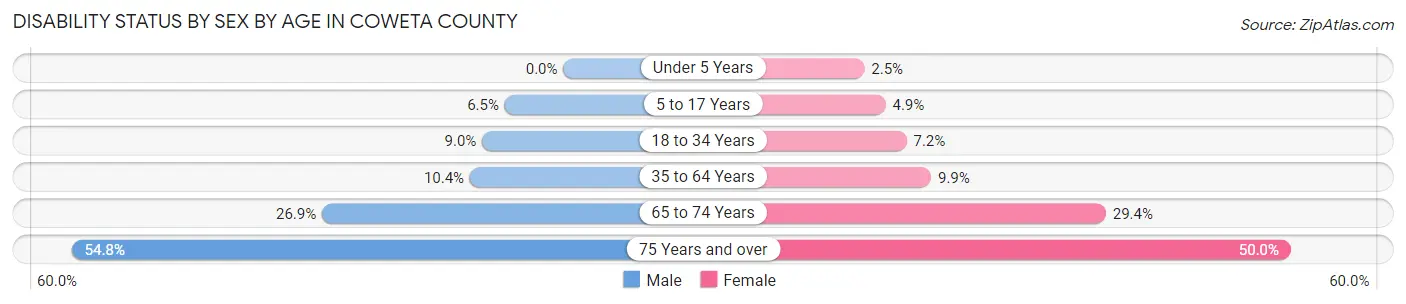
| Age Bracket | Male | Female |
| Under 5 Years | 0 (0.0%) | 104 (2.5%) |
| 5 to 17 Years | 865 (6.5%) | 643 (4.9%) |
| 18 to 34 Years | 1,352 (9.0%) | 1,106 (7.2%) |
| 35 to 64 Years | 3,073 (10.4%) | 3,096 (9.9%) |
| 65 to 74 Years | 1,647 (26.9%) | 2,045 (29.4%) |
| 75 Years and over | 1,845 (54.8%) | 2,275 (50.0%) |
Disability Class by Sex by Age in Coweta County
Disability Class: Hearing Difficulty
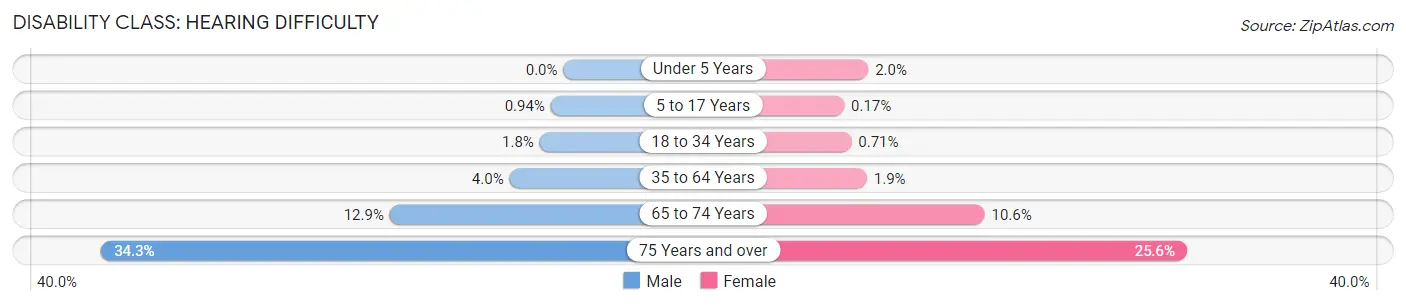
| Age Bracket | Male | Female |
| Under 5 Years | 0 (0.0%) | 81 (2.0%) |
| 5 to 17 Years | 125 (0.9%) | 22 (0.2%) |
| 18 to 34 Years | 263 (1.8%) | 109 (0.7%) |
| 35 to 64 Years | 1,180 (4.0%) | 578 (1.9%) |
| 65 to 74 Years | 790 (12.9%) | 737 (10.6%) |
| 75 Years and over | 1,156 (34.3%) | 1,165 (25.6%) |
Disability Class: Vision Difficulty
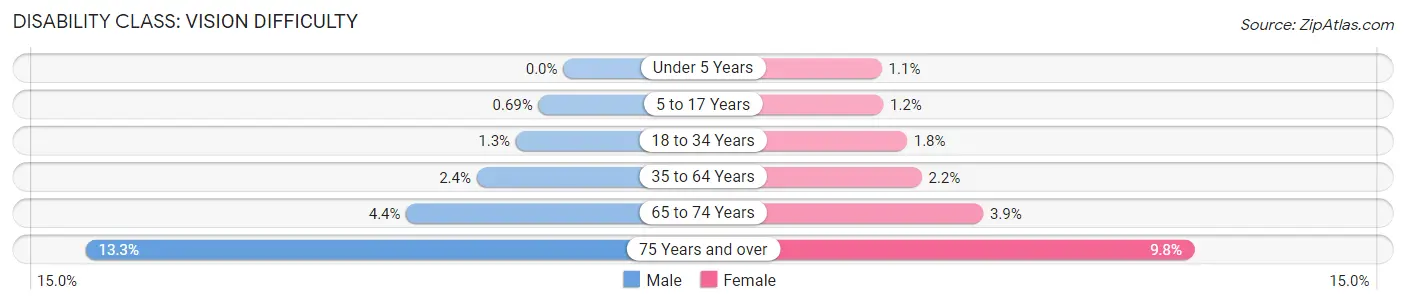
| Age Bracket | Male | Female |
| Under 5 Years | 0 (0.0%) | 46 (1.1%) |
| 5 to 17 Years | 92 (0.7%) | 152 (1.1%) |
| 18 to 34 Years | 198 (1.3%) | 278 (1.8%) |
| 35 to 64 Years | 712 (2.4%) | 691 (2.2%) |
| 65 to 74 Years | 268 (4.4%) | 273 (3.9%) |
| 75 Years and over | 448 (13.3%) | 446 (9.8%) |
Disability Class: Cognitive Difficulty
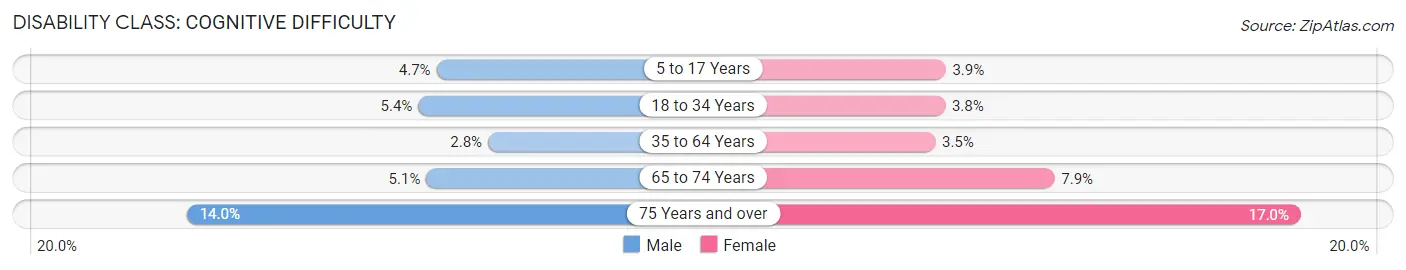
| Age Bracket | Male | Female |
| 5 to 17 Years | 624 (4.7%) | 508 (3.8%) |
| 18 to 34 Years | 806 (5.4%) | 588 (3.8%) |
| 35 to 64 Years | 826 (2.8%) | 1,079 (3.5%) |
| 65 to 74 Years | 312 (5.1%) | 549 (7.9%) |
| 75 Years and over | 471 (14.0%) | 775 (17.0%) |
Disability Class: Ambulatory Difficulty
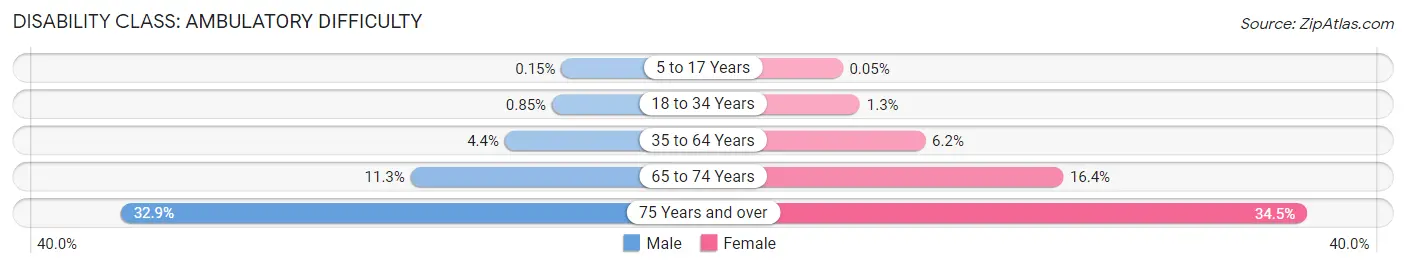
| Age Bracket | Male | Female |
| 5 to 17 Years | 20 (0.2%) | 7 (0.1%) |
| 18 to 34 Years | 127 (0.9%) | 206 (1.3%) |
| 35 to 64 Years | 1,284 (4.3%) | 1,928 (6.2%) |
| 65 to 74 Years | 695 (11.3%) | 1,142 (16.4%) |
| 75 Years and over | 1,107 (32.9%) | 1,571 (34.5%) |
Disability Class: Self-Care Difficulty
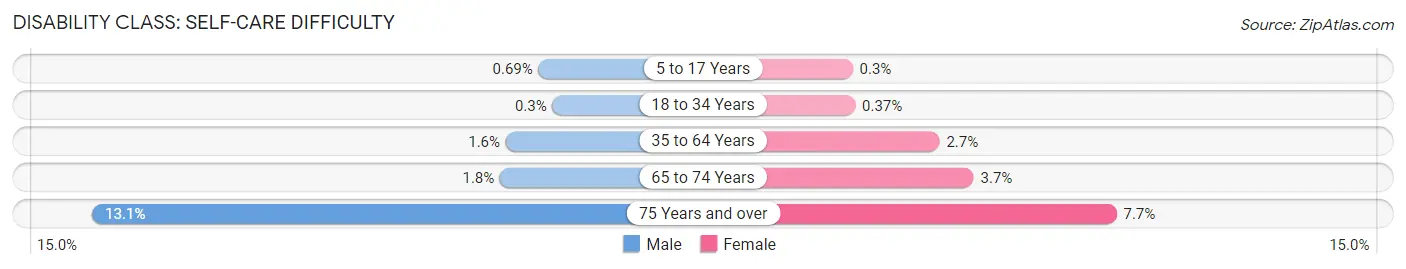
| Age Bracket | Male | Female |
| 5 to 17 Years | 92 (0.7%) | 39 (0.3%) |
| 18 to 34 Years | 45 (0.3%) | 57 (0.4%) |
| 35 to 64 Years | 473 (1.6%) | 848 (2.7%) |
| 65 to 74 Years | 108 (1.8%) | 255 (3.7%) |
| 75 Years and over | 442 (13.1%) | 348 (7.6%) |
Technology Access in Coweta County
Computing Device Access in Coweta County
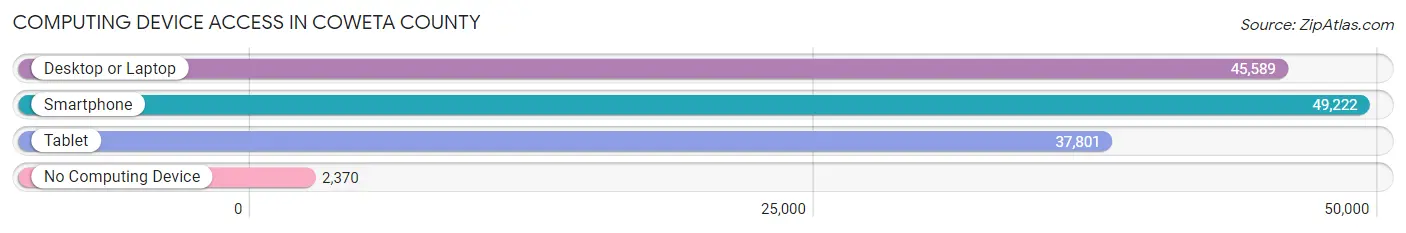
| Device Type | # Households | % Households |
| Desktop or Laptop | 45,589 | 84.2% |
| Smartphone | 49,222 | 90.8% |
| Tablet | 37,801 | 69.8% |
| No Computing Device | 2,370 | 4.4% |
| Total | 54,177 | 100.0% |
Internet Access in Coweta County
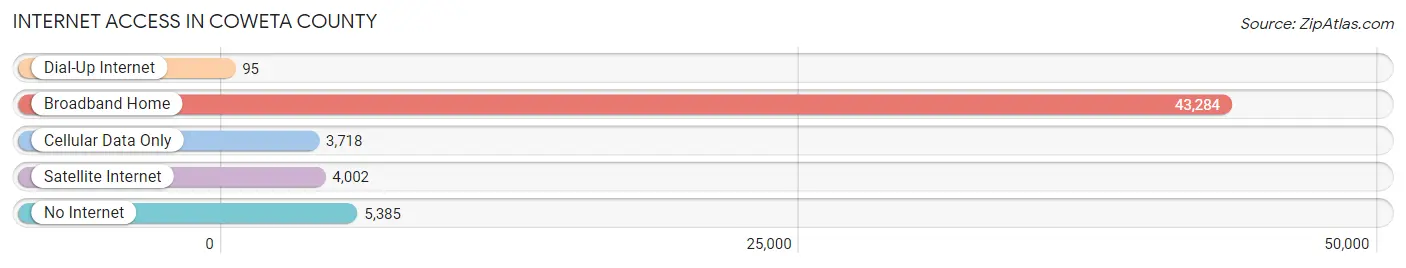
| Internet Type | # Households | % Households |
| Dial-Up Internet | 95 | 0.2% |
| Broadband Home | 43,284 | 79.9% |
| Cellular Data Only | 3,718 | 6.9% |
| Satellite Internet | 4,002 | 7.4% |
| No Internet | 5,385 | 9.9% |
| Total | 54,177 | 100.0% |
Coweta County Summary
Geography
Coweta County is located in the west-central part of the state of Georgia, in the foothills of the Appalachian Mountains. It is bordered by Carroll, Heard, Meriwether, Fayette, and Troup counties. The county covers an area of 437 square miles, with the majority of the land being used for agricultural purposes. The county is home to several rivers, including the Chattahoochee, Flint, and Ocmulgee. The county is also home to several lakes, including Lake Coweta, Lake McIntosh, and Lake Redwine.
The county is divided into two distinct regions: the Piedmont Plateau and the Appalachian Plateau. The Piedmont Plateau is located in the northern part of the county and is characterized by rolling hills and valleys. The Appalachian Plateau is located in the southern part of the county and is characterized by steep, rugged terrain.
History
Coweta County was created in 1826 from parts of Carroll, Fayette, and Troup counties. It was named after the Coweta Indians, who were a part of the Creek Nation. The county was originally home to several Native American tribes, including the Creek, Cherokee, and Choctaw.
The county was home to several prominent figures in the early days of the United States, including William McIntosh, a Creek leader who signed the Treaty of Indian Springs in 1825, and William H. Crawford, a United States Senator and Secretary of War.
The county was also home to several prominent Civil War battles, including the Battle of Brown's Mill and the Battle of Newnan.
Economy
The economy of Coweta County is largely based on agriculture. The county is home to several large farms, including the Coweta County Farm Bureau, which is the largest farm in the county. The county is also home to several large manufacturing companies, including the Newnan Manufacturing Company, which produces automotive parts, and the Coweta County Textile Company, which produces textiles.
The county is also home to several large retail stores including Walmart Target and Home Depot
Demographics
As of the 2010 census, the population of Coweta County was 127,317. The population is made up of a diverse mix of races and ethnicities, including White (77.2%), African American (17.2%), Hispanic or Latino (3.7%), and Asian (1.3%).
The median household income in the county is $50,945, and the median home value is $164,400. The unemployment rate in the county is 4.2%.
Conclusion
Coweta County is a diverse and vibrant county located in the west-central part of the state of Georgia. The county is home to several rivers, lakes, and mountains, and is divided into two distinct regions: the Piedmont Plateau and the Appalachian Plateau. The county was created in 1826 and was named after the Coweta Indians. The economy of the county is largely based on agriculture, and the county is home to several large farms and manufacturing companies. The population of the county is made up of a diverse mix of races and ethnicities, and the median household income is $50,945.
Common Questions
What is the Total Population of Coweta County?
Total Population of Coweta County is 147,449.
What is the Total Male Population of Coweta County?
Total Male Population of Coweta County is 71,903.
What is the Total Female Population of Coweta County?
Total Female Population of Coweta County is 75,546.
What is the Ratio of Males per 100 Females in Coweta County?
There are 95.18 Males per 100 Females in Coweta County.
What is the Ratio of Females per 100 Males in Coweta County?
There are 105.07 Females per 100 Males in Coweta County.
What is the Median Population Age in Coweta County?
Median Population Age in Coweta County is 39.1 Years.
What is the Average Family Size in Coweta County
Average Family Size in Coweta County is 3.1 People.
What is the Average Household Size in Coweta County
Average Household Size in Coweta County is 2.7 People.
What is Per Capita Income in Coweta County?
Per Capita income in Coweta County is $41,373.
What is the Median Family Income in Coweta County?
Median Family Income in Coweta County is $105,403.
What is the Median Household income in Coweta County?
Median Household Income in Coweta County is $90,031.
What is Income or Wage Gap in Coweta County?
Income or Wage Gap in Coweta County is 32.4%.
Women in Coweta County earn 67.6 cents for every dollar earned by a man.
What is Family Income Deficit in Coweta County?
Family Income Deficit in Coweta County is $9,182.
Families that are below poverty line in Coweta County earn $9,182 less on average than the poverty threshold level.
What is Inequality or Gini Index in Coweta County?
Inequality or Gini Index in Coweta County is 0.42.
How Large is the Labor Force in Coweta County?
There are 75,437 People in the Labor Forcein in Coweta County.
What is the Percentage of People in the Labor Force in Coweta County?
64.4% of People are in the Labor Force in Coweta County.
What is the Unemployment Rate in Coweta County?
Unemployment Rate in Coweta County is 2.8%.