Forsyth County, GA
Forsyth County Overview
253,225
TOTAL POPULATION
126,773
MALE POPULATION
126,452
FEMALE POPULATION
100.25
MALES / 100 FEMALES
99.75
FEMALES / 100 MALES
39.2
MEDIAN AGE
3.3
AVG FAMILY SIZE
3.0
AVG HOUSEHOLD SIZE
$54,002
PER CAPITA INCOME
$144,747
AVG FAMILY INCOME
$131,660
AVG HOUSEHOLD INCOME
44.1%
WAGE / INCOME GAP [ % ]
55.9¢/ $1
WAGE / INCOME GAP [ $ ]
$11,638
FAMILY INCOME DEFICIT
0.39
INEQUALITY / GINI INDEX
135,435
LABOR FORCE [ PEOPLE ]
69.6%
PERCENT IN LABOR FORCE
3.7%
UNEMPLOYMENT RATE
Race in Forsyth County
The most populous races in Forsyth County are White / Caucasian (176,237 | 69.6%), Asian (42,032 | 16.6%), and Hispanic or Latino (24,347 | 9.6%).
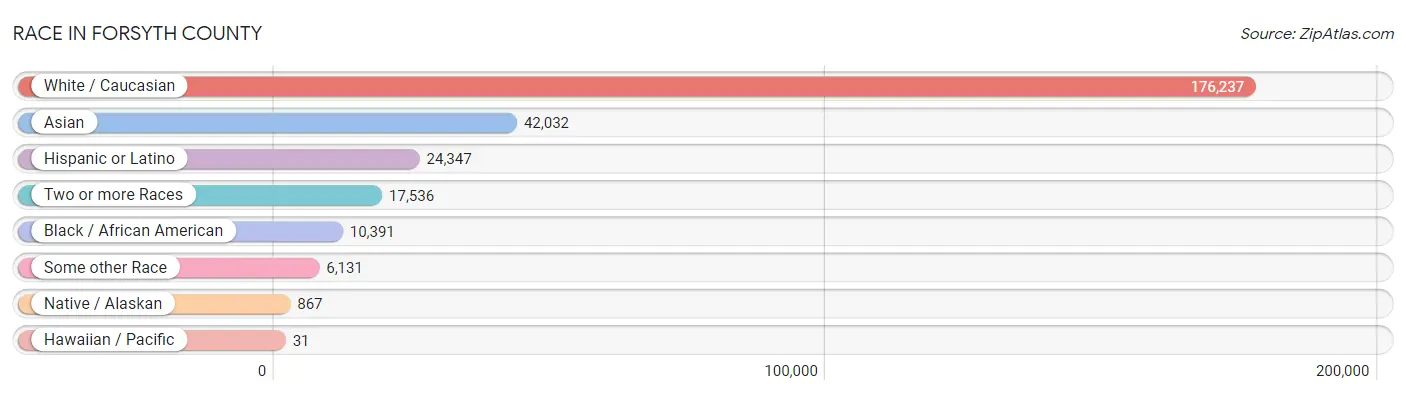
| Race | # Population | % Population |
| Asian | 42,032 | 16.6% |
| Black / African American | 10,391 | 4.1% |
| Hawaiian / Pacific | 31 | 0.0% |
| Hispanic or Latino | 24,347 | 9.6% |
| Native / Alaskan | 867 | 0.3% |
| White / Caucasian | 176,237 | 69.6% |
| Two or more Races | 17,536 | 6.9% |
| Some other Race | 6,131 | 2.4% |
| Total | 253,225 | 100.0% |
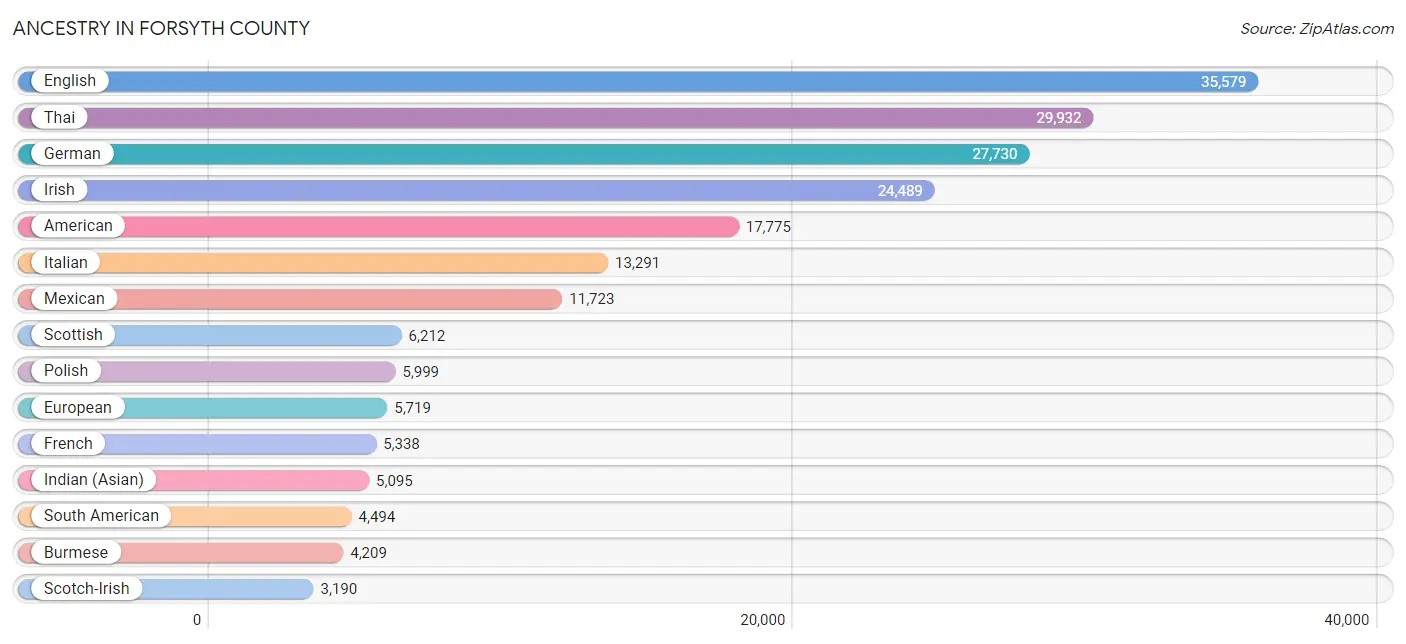
Ancestry in Forsyth County
The most populous ancestries reported in Forsyth County are English (35,579 | 14.1%), Thai (29,932 | 11.8%), German (27,730 | 11.0%), Irish (24,489 | 9.7%), and American (17,775 | 7.0%), together accounting for 53.5% of all Forsyth County residents.
| Ancestry | # Population | % Population |
| Afghan | 33 | 0.0% |
| African | 216 | 0.1% |
| Albanian | 11 | 0.0% |
| Alsatian | 9 | 0.0% |
| American | 17,775 | 7.0% |
| Apache | 17 | 0.0% |
| Arab | 1,811 | 0.7% |
| Argentinean | 186 | 0.1% |
| Armenian | 101 | 0.0% |
| Australian | 22 | 0.0% |
| Austrian | 779 | 0.3% |
| Bangladeshi | 13 | 0.0% |
| Barbadian | 88 | 0.0% |
| Belgian | 274 | 0.1% |
| Bhutanese | 678 | 0.3% |
| Blackfeet | 25 | 0.0% |
| Bolivian | 55 | 0.0% |
| Brazilian | 1,082 | 0.4% |
| British | 2,143 | 0.9% |
| British West Indian | 39 | 0.0% |
| Bulgarian | 162 | 0.1% |
| Burmese | 4,209 | 1.7% |
| Cajun | 59 | 0.0% |
| Cambodian | 16 | 0.0% |
| Canadian | 370 | 0.2% |
| Cape Verdean | 13 | 0.0% |
| Central American | 2,972 | 1.2% |
| Central American Indian | 293 | 0.1% |
| Cherokee | 491 | 0.2% |
| Chickasaw | 13 | 0.0% |
| Chilean | 95 | 0.0% |
| Chinese | 29 | 0.0% |
| Chippewa | 19 | 0.0% |
| Choctaw | 173 | 0.1% |
| Colombian | 2,225 | 0.9% |
| Costa Rican | 71 | 0.0% |
| Creek | 36 | 0.0% |
| Croatian | 198 | 0.1% |
| Cuban | 668 | 0.3% |
| Czech | 754 | 0.3% |
| Czechoslovakian | 119 | 0.1% |
| Danish | 977 | 0.4% |
| Dominican | 330 | 0.1% |
| Dutch | 2,011 | 0.8% |
| Dutch West Indian | 9 | 0.0% |
| Eastern European | 678 | 0.3% |
| Ecuadorian | 552 | 0.2% |
| Egyptian | 97 | 0.0% |
| English | 35,579 | 14.1% |
| Ethiopian | 102 | 0.0% |
| European | 5,719 | 2.3% |
| Filipino | 263 | 0.1% |
| Finnish | 401 | 0.2% |
| French | 5,338 | 2.1% |
| French American Indian | 11 | 0.0% |
| French Canadian | 865 | 0.3% |
| German | 27,730 | 11.0% |
| German Russian | 13 | 0.0% |
| Ghanaian | 146 | 0.1% |
| Greek | 1,449 | 0.6% |
| Guamanian / Chamorro | 56 | 0.0% |
| Guatemalan | 966 | 0.4% |
| Guyanese | 45 | 0.0% |
| Haitian | 296 | 0.1% |
| Honduran | 1,070 | 0.4% |
| Hungarian | 833 | 0.3% |
| Indian (Asian) | 5,095 | 2.0% |
| Indonesian | 4 | 0.0% |
| Iranian | 816 | 0.3% |
| Iraqi | 558 | 0.2% |
| Irish | 24,489 | 9.7% |
| Iroquois | 4 | 0.0% |
| Italian | 13,291 | 5.2% |
| Jamaican | 644 | 0.3% |
| Japanese | 152 | 0.1% |
| Kenyan | 29 | 0.0% |
| Korean | 2,293 | 0.9% |
| Laotian | 41 | 0.0% |
| Latvian | 244 | 0.1% |
| Lebanese | 417 | 0.2% |
| Lithuanian | 343 | 0.1% |
| Lumbee | 18 | 0.0% |
| Malaysian | 295 | 0.1% |
| Maltese | 4 | 0.0% |
| Menominee | 1 | 0.0% |
| Mexican | 11,723 | 4.6% |
| Mexican American Indian | 33 | 0.0% |
| Mongolian | 30 | 0.0% |
| Moroccan | 50 | 0.0% |
| Native Hawaiian | 282 | 0.1% |
| Navajo | 83 | 0.0% |
| Nicaraguan | 258 | 0.1% |
| Nigerian | 850 | 0.3% |
| Northern European | 540 | 0.2% |
| Norwegian | 1,661 | 0.7% |
| Pakistani | 129 | 0.1% |
| Palestinian | 40 | 0.0% |
| Panamanian | 161 | 0.1% |
| Pennsylvania German | 32 | 0.0% |
| Peruvian | 692 | 0.3% |
| Polish | 5,999 | 2.4% |
| Portuguese | 544 | 0.2% |
| Puerto Rican | 2,741 | 1.1% |
| Romanian | 520 | 0.2% |
| Russian | 1,478 | 0.6% |
| Salvadoran | 446 | 0.2% |
| Scandinavian | 495 | 0.2% |
| Scotch-Irish | 3,190 | 1.3% |
| Scottish | 6,212 | 2.5% |
| Senegalese | 14 | 0.0% |
| Serbian | 147 | 0.1% |
| Sioux | 120 | 0.1% |
| Slavic | 194 | 0.1% |
| Slovak | 419 | 0.2% |
| Slovene | 173 | 0.1% |
| South African | 617 | 0.2% |
| South American | 4,494 | 1.8% |
| South American Indian | 174 | 0.1% |
| Spaniard | 671 | 0.3% |
| Spanish | 203 | 0.1% |
| Sri Lankan | 1,382 | 0.5% |
| Subsaharan African | 2,154 | 0.9% |
| Swedish | 1,888 | 0.7% |
| Swiss | 590 | 0.2% |
| Syrian | 166 | 0.1% |
| Thai | 29,932 | 11.8% |
| Trinidadian and Tobagonian | 106 | 0.0% |
| Turkish | 368 | 0.2% |
| Ukrainian | 859 | 0.3% |
| Uruguayan | 120 | 0.1% |
| Ute | 7 | 0.0% |
| Venezuelan | 569 | 0.2% |
| Vietnamese | 82 | 0.0% |
| Welsh | 1,879 | 0.7% |
| West Indian | 348 | 0.1% |
| Yugoslavian | 585 | 0.2% | View All 136 Rows |
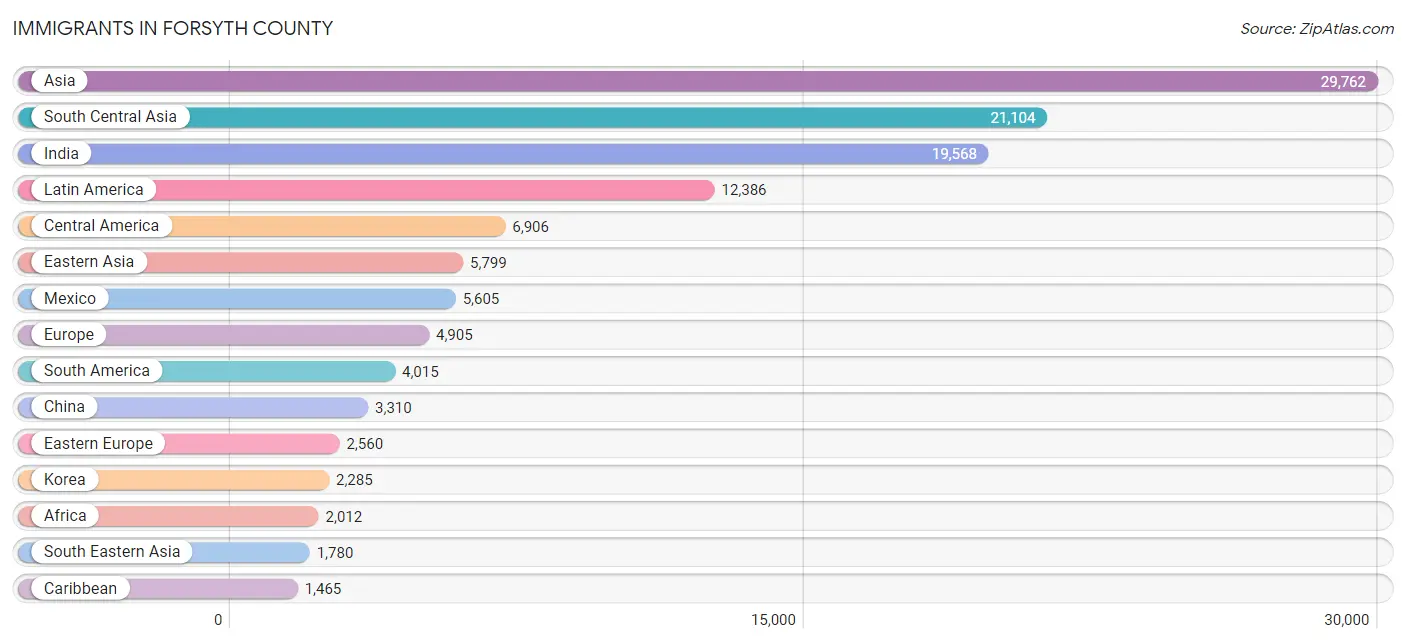
Immigrants in Forsyth County
The most numerous immigrant groups reported in Forsyth County came from Asia (29,762 | 11.7%), South Central Asia (21,104 | 8.3%), India (19,568 | 7.7%), Latin America (12,386 | 4.9%), and Central America (6,906 | 2.7%), together accounting for 35.4% of all Forsyth County residents.
| Immigration Origin | # Population | % Population |
| Afghanistan | 19 | 0.0% |
| Africa | 2,012 | 0.8% |
| Argentina | 136 | 0.1% |
| Asia | 29,762 | 11.7% |
| Australia | 40 | 0.0% |
| Austria | 64 | 0.0% |
| Azores | 16 | 0.0% |
| Bangladesh | 71 | 0.0% |
| Barbados | 17 | 0.0% |
| Belarus | 86 | 0.0% |
| Belgium | 73 | 0.0% |
| Belize | 10 | 0.0% |
| Bolivia | 9 | 0.0% |
| Bosnia and Herzegovina | 401 | 0.2% |
| Brazil | 1,044 | 0.4% |
| Bulgaria | 100 | 0.0% |
| Cambodia | 101 | 0.0% |
| Canada | 1,270 | 0.5% |
| Caribbean | 1,465 | 0.6% |
| Central America | 6,906 | 2.7% |
| Chile | 35 | 0.0% |
| China | 3,310 | 1.3% |
| Colombia | 1,358 | 0.5% |
| Congo | 32 | 0.0% |
| Costa Rica | 52 | 0.0% |
| Croatia | 39 | 0.0% |
| Cuba | 223 | 0.1% |
| Czechoslovakia | 60 | 0.0% |
| Denmark | 22 | 0.0% |
| Dominican Republic | 266 | 0.1% |
| Eastern Africa | 270 | 0.1% |
| Eastern Asia | 5,799 | 2.3% |
| Eastern Europe | 2,560 | 1.0% |
| Ecuador | 382 | 0.2% |
| Egypt | 245 | 0.1% |
| El Salvador | 147 | 0.1% |
| England | 330 | 0.1% |
| Eritrea | 27 | 0.0% |
| Ethiopia | 32 | 0.0% |
| Europe | 4,905 | 1.9% |
| Fiji | 4 | 0.0% |
| France | 132 | 0.1% |
| Germany | 462 | 0.2% |
| Ghana | 589 | 0.2% |
| Greece | 12 | 0.0% |
| Guatemala | 494 | 0.2% |
| Guyana | 145 | 0.1% |
| Haiti | 181 | 0.1% |
| Honduras | 387 | 0.2% |
| Hong Kong | 81 | 0.0% |
| Hungary | 25 | 0.0% |
| India | 19,568 | 7.7% |
| Indonesia | 46 | 0.0% |
| Iran | 393 | 0.2% |
| Iraq | 363 | 0.1% |
| Ireland | 129 | 0.1% |
| Israel | 202 | 0.1% |
| Italy | 142 | 0.1% |
| Jamaica | 455 | 0.2% |
| Japan | 204 | 0.1% |
| Jordan | 17 | 0.0% |
| Kazakhstan | 40 | 0.0% |
| Kenya | 42 | 0.0% |
| Korea | 2,285 | 0.9% |
| Kuwait | 20 | 0.0% |
| Laos | 110 | 0.0% |
| Latin America | 12,386 | 4.9% |
| Latvia | 126 | 0.1% |
| Lebanon | 87 | 0.0% |
| Lithuania | 5 | 0.0% |
| Malaysia | 40 | 0.0% |
| Mexico | 5,605 | 2.2% |
| Middle Africa | 32 | 0.0% |
| Moldova | 49 | 0.0% |
| Morocco | 31 | 0.0% |
| Nepal | 149 | 0.1% |
| Netherlands | 156 | 0.1% |
| Nicaragua | 109 | 0.0% |
| Nigeria | 326 | 0.1% |
| Northern Africa | 276 | 0.1% |
| Northern Europe | 1,061 | 0.4% |
| Norway | 12 | 0.0% |
| Oceania | 56 | 0.0% |
| Pakistan | 733 | 0.3% |
| Panama | 102 | 0.0% |
| Peru | 394 | 0.2% |
| Philippines | 725 | 0.3% |
| Poland | 268 | 0.1% |
| Portugal | 28 | 0.0% |
| Romania | 337 | 0.1% |
| Russia | 421 | 0.2% |
| Saudi Arabia | 68 | 0.0% |
| Scotland | 108 | 0.0% |
| Senegal | 10 | 0.0% |
| Serbia | 26 | 0.0% |
| Singapore | 32 | 0.0% |
| South Africa | 463 | 0.2% |
| South America | 4,015 | 1.6% |
| South Central Asia | 21,104 | 8.3% |
| South Eastern Asia | 1,780 | 0.7% |
| Southern Europe | 325 | 0.1% |
| Spain | 143 | 0.1% |
| Sri Lanka | 72 | 0.0% |
| Sweden | 27 | 0.0% |
| Switzerland | 48 | 0.0% |
| Syria | 60 | 0.0% |
| Taiwan | 372 | 0.2% |
| Thailand | 137 | 0.1% |
| Trinidad and Tobago | 306 | 0.1% |
| Turkey | 155 | 0.1% |
| Uganda | 9 | 0.0% |
| Ukraine | 403 | 0.2% |
| Uruguay | 48 | 0.0% |
| Uzbekistan | 59 | 0.0% |
| Venezuela | 456 | 0.2% |
| Vietnam | 569 | 0.2% |
| West Indies | 17 | 0.0% |
| Western Africa | 939 | 0.4% |
| Western Asia | 1,079 | 0.4% |
| Western Europe | 935 | 0.4% |
| Yemen | 14 | 0.0% |
| Zimbabwe | 11 | 0.0% | View All 122 Rows |
Sex and Age in Forsyth County
Sex and Age in Forsyth County
The most populous age groups in Forsyth County are 45 to 49 Years (11,438 | 9.0%) for men and 40 to 44 Years (10,603 | 8.4%) for women.
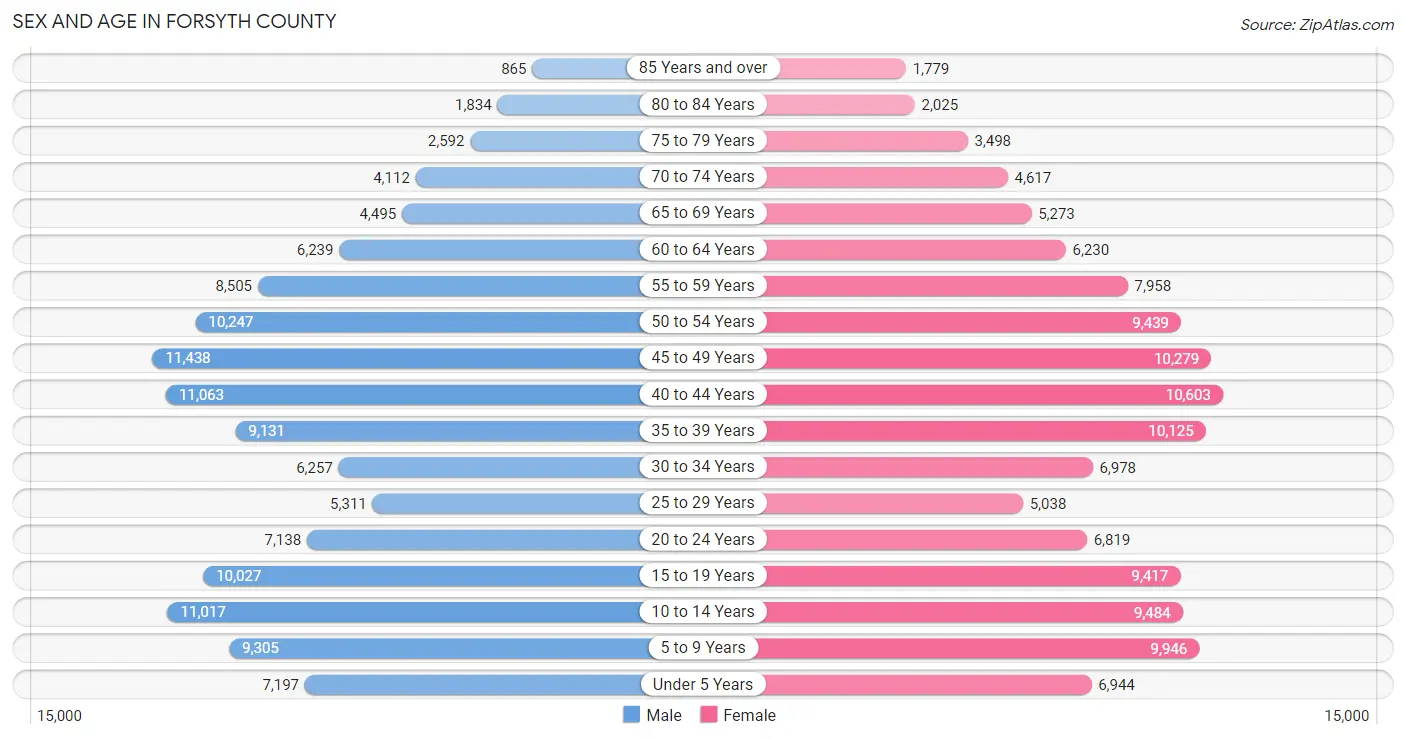
| Age Bracket | Male | Female |
| Under 5 Years | 7,197 (5.7%) | 6,944 (5.5%) |
| 5 to 9 Years | 9,305 (7.3%) | 9,946 (7.9%) |
| 10 to 14 Years | 11,017 (8.7%) | 9,484 (7.5%) |
| 15 to 19 Years | 10,027 (7.9%) | 9,417 (7.4%) |
| 20 to 24 Years | 7,138 (5.6%) | 6,819 (5.4%) |
| 25 to 29 Years | 5,311 (4.2%) | 5,038 (4.0%) |
| 30 to 34 Years | 6,257 (4.9%) | 6,978 (5.5%) |
| 35 to 39 Years | 9,131 (7.2%) | 10,125 (8.0%) |
| 40 to 44 Years | 11,063 (8.7%) | 10,603 (8.4%) |
| 45 to 49 Years | 11,438 (9.0%) | 10,279 (8.1%) |
| 50 to 54 Years | 10,247 (8.1%) | 9,439 (7.5%) |
| 55 to 59 Years | 8,505 (6.7%) | 7,958 (6.3%) |
| 60 to 64 Years | 6,239 (4.9%) | 6,230 (4.9%) |
| 65 to 69 Years | 4,495 (3.5%) | 5,273 (4.2%) |
| 70 to 74 Years | 4,112 (3.2%) | 4,617 (3.6%) |
| 75 to 79 Years | 2,592 (2.0%) | 3,498 (2.8%) |
| 80 to 84 Years | 1,834 (1.5%) | 2,025 (1.6%) |
| 85 Years and over | 865 (0.7%) | 1,779 (1.4%) |
| Total | 126,773 (100.0%) | 126,452 (100.0%) |
Families and Households in Forsyth County
Median Family Size in Forsyth County
The median family size in Forsyth County is 3.31 persons per family, with married-couple families (59,764 | 86.7%) accounting for the largest median family size of 3.36 persons per family. On the other hand, single male/father families (3,244 | 4.7%) represent the smallest median family size with 2.73 persons per family.
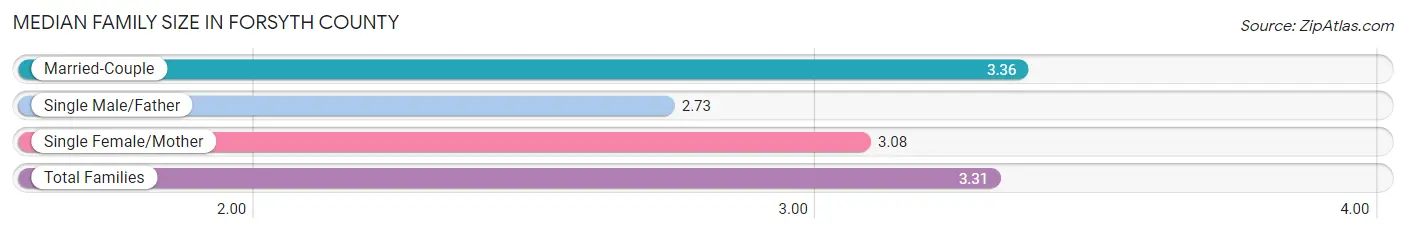
| Family Type | # Families | Family Size |
| Married-Couple | 59,764 (86.7%) | 3.36 |
| Single Male/Father | 3,244 (4.7%) | 2.73 |
| Single Female/Mother | 5,940 (8.6%) | 3.08 |
| Total Families | 68,948 (100.0%) | 3.31 |
Median Household Size in Forsyth County
The median household size in Forsyth County is 2.98 persons per household, with married-couple households (59,764 | 70.6%) accounting for the largest median household size of 3.38 persons per household. non-family households (15,714 | 18.6%) represent the smallest median household size with 1.30 persons per household.
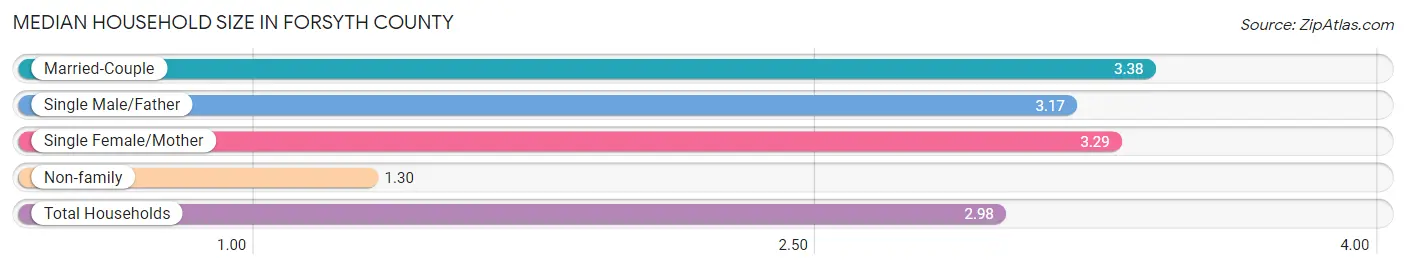
| Household Type | # Households | Household Size |
| Married-Couple | 59,764 (70.6%) | 3.38 |
| Single Male/Father | 3,244 (3.8%) | 3.17 |
| Single Female/Mother | 5,940 (7.0%) | 3.29 |
| Non-family | 15,714 (18.6%) | 1.30 |
| Total Households | 84,662 (100.0%) | 2.98 |
Household Size by Marriage Status in Forsyth County
Out of a total of 84,662 households in Forsyth County, 68,948 (81.4%) are family households, while 15,714 (18.6%) are nonfamily households. The most numerous type of family households are 2-person households, comprising 23,914, and the most common type of nonfamily households are 1-person households, comprising 12,815.
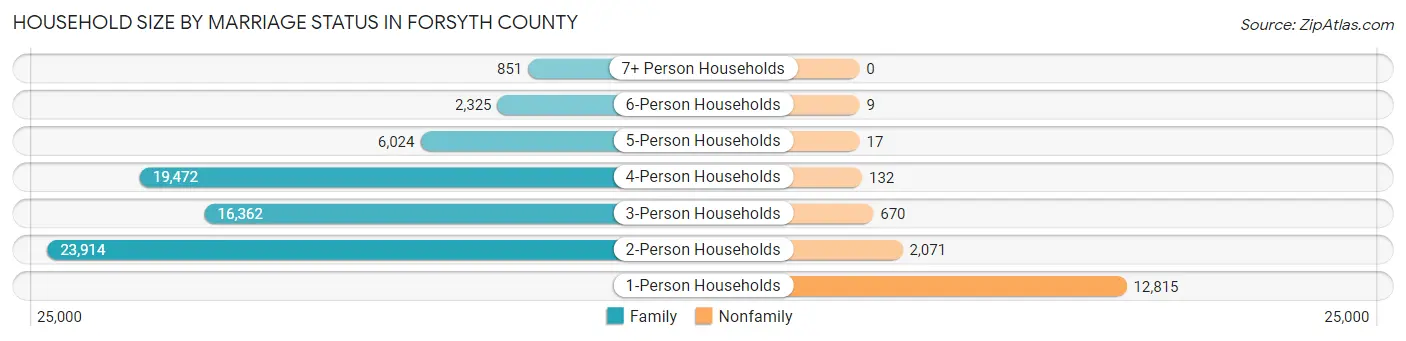
| Household Size | Family Households | Nonfamily Households |
| 1-Person Households | - | 12,815 (15.1%) |
| 2-Person Households | 23,914 (28.2%) | 2,071 (2.5%) |
| 3-Person Households | 16,362 (19.3%) | 670 (0.8%) |
| 4-Person Households | 19,472 (23.0%) | 132 (0.2%) |
| 5-Person Households | 6,024 (7.1%) | 17 (0.0%) |
| 6-Person Households | 2,325 (2.8%) | 9 (0.0%) |
| 7+ Person Households | 851 (1.0%) | 0 (0.0%) |
| Total | 68,948 (81.4%) | 15,714 (18.6%) |
Female Fertility in Forsyth County
Fertility by Age in Forsyth County
Average fertility rate in Forsyth County is 52.0 births per 1,000 women. Women in the age bracket of 20 to 34 years have the highest fertility rate with 115.0 births per 1,000 women. Women in the age bracket of 20 to 34 years acount for 68.8% of all women with births.
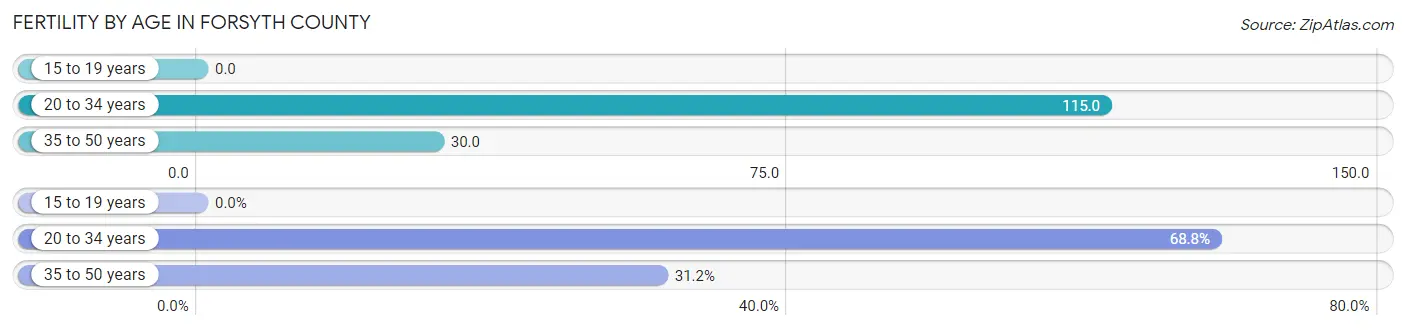
| Age Bracket | Women with Births | Births / 1,000 Women |
| 15 to 19 years | 0 (0.0%) | 0.0 |
| 20 to 34 years | 2,170 (68.8%) | 115.0 |
| 35 to 50 years | 984 (31.2%) | 30.0 |
| Total | 3,154 (100.0%) | 52.0 |
Fertility by Age by Marriage Status in Forsyth County
88.3% of women with births (3,154) in Forsyth County are married. The highest percentage of unmarried women with births falls into 20 to 34 years age bracket with 11.7% of them unmarried at the time of birth, while the lowest percentage of unmarried women with births belong to 35 to 50 years age bracket with 11.6% of them unmarried.
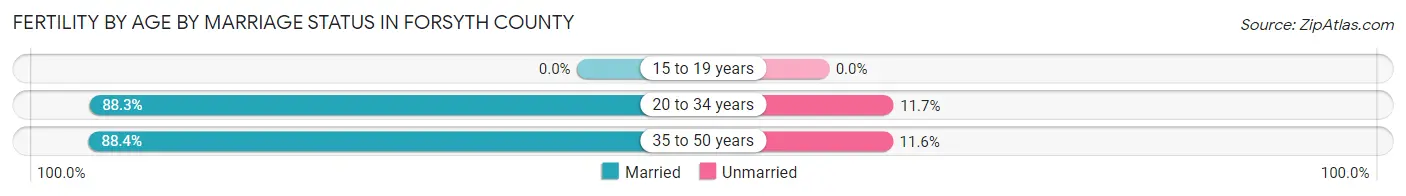
| Age Bracket | Married | Unmarried |
| 15 to 19 years | 0 (0.0%) | 0 (0.0%) |
| 20 to 34 years | 1,916 (88.3%) | 254 (11.7%) |
| 35 to 50 years | 870 (88.4%) | 114 (11.6%) |
| Total | 2,785 (88.3%) | 369 (11.7%) |
Fertility by Education in Forsyth County
Average fertility rate in Forsyth County is 52.0 births per 1,000 women. Women with the education attainment of bachelor's degree have the highest fertility rate of 69.0 births per 1,000 women, while women with the education attainment of less than high school have the lowest fertility at 25.0 births per 1,000 women. Women with the education attainment of bachelor's degree represent 41.8% of all women with births.
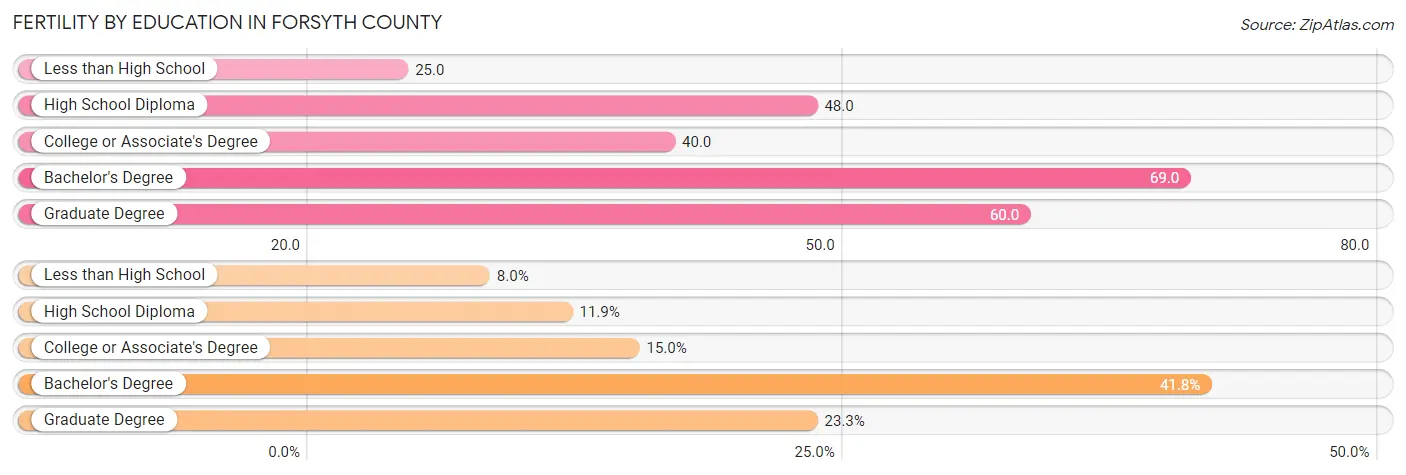
| Educational Attainment | Women with Births | Births / 1,000 Women |
| Less than High School | 252 (8.0%) | 25.0 |
| High School Diploma | 374 (11.9%) | 48.0 |
| College or Associate's Degree | 473 (15.0%) | 40.0 |
| Bachelor's Degree | 1,319 (41.8%) | 69.0 |
| Graduate Degree | 736 (23.3%) | 60.0 |
| Total | 3,154 (100.0%) | 52.0 |
Fertility by Education by Marriage Status in Forsyth County
11.7% of women with births in Forsyth County are unmarried. Women with the educational attainment of bachelor's degree are most likely to be married with 98.4% of them married at childbirth, while women with the educational attainment of college or associate's degree are least likely to be married with 35.9% of them unmarried at childbirth.
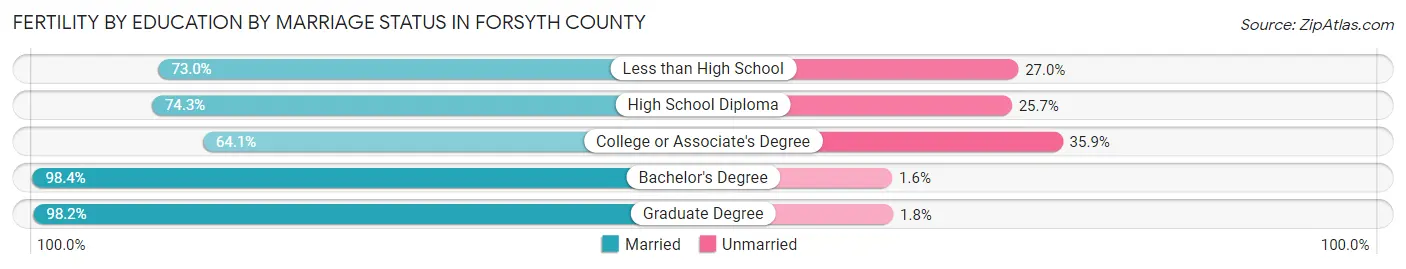
| Educational Attainment | Married | Unmarried |
| Less than High School | 184 (73.0%) | 68 (27.0%) |
| High School Diploma | 278 (74.3%) | 96 (25.7%) |
| College or Associate's Degree | 303 (64.1%) | 170 (35.9%) |
| Bachelor's Degree | 1,298 (98.4%) | 21 (1.6%) |
| Graduate Degree | 723 (98.2%) | 13 (1.8%) |
| Total | 2,785 (88.3%) | 369 (11.7%) |
Income in Forsyth County
Income Overview in Forsyth County
Per Capita Income in Forsyth County is $54,002, while median incomes of families and households are $144,747 and $131,660 respectively.
| Characteristic | Number | Measure |
| Per Capita Income | 253,225 | $54,002 |
| Median Family Income | 68,948 | $144,747 |
| Mean Family Income | 68,948 | $170,108 |
| Median Household Income | 84,662 | $131,660 |
| Mean Household Income | 84,662 | $158,520 |
| Income Deficit | 68,948 | $11,638 |
| Wage / Income Gap (%) | 253,225 | 44.09% |
| Wage / Income Gap ($) | 253,225 | 55.91¢ per $1 |
| Gini / Inequality Index | 253,225 | 0.39 |
Earnings by Sex in Forsyth County
Average Earnings in Forsyth County are $60,400, $78,885 for men and $44,106 for women, a difference of 44.1%.
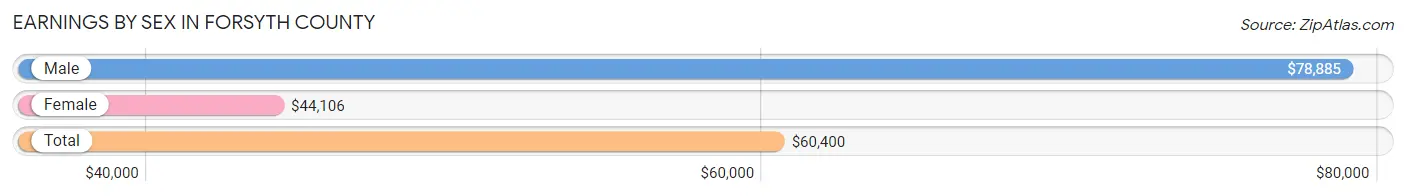
| Sex | Number | Average Earnings |
| Male | 79,535 (55.9%) | $78,885 |
| Female | 62,757 (44.1%) | $44,106 |
| Total | 142,292 (100.0%) | $60,400 |
Earnings by Sex by Income Bracket in Forsyth County
The most common earnings brackets in Forsyth County are $100,000+ for men (33,742 | 42.4%) and $100,000+ for women (11,560 | 18.4%).
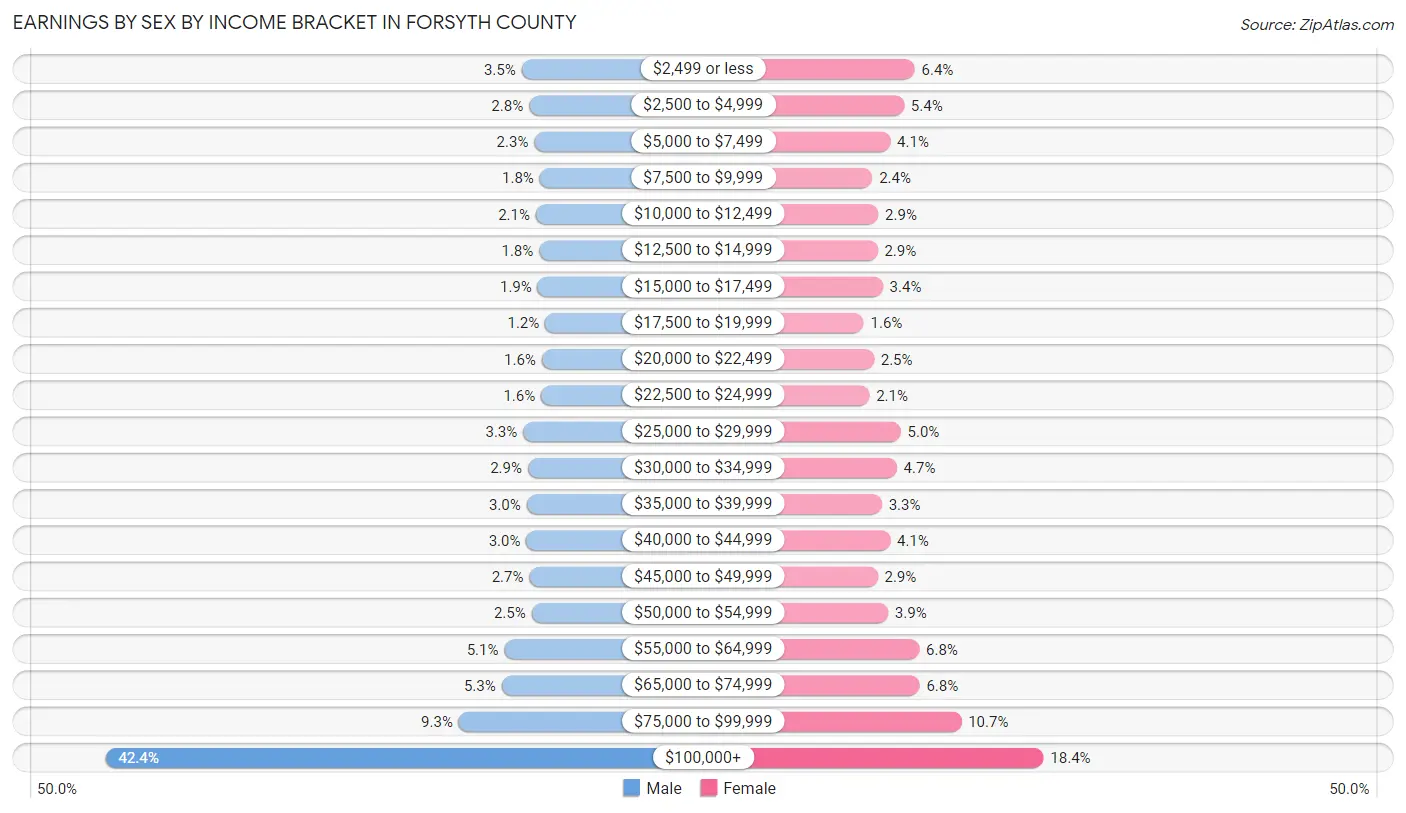
| Income | Male | Female |
| $2,499 or less | 2,743 (3.5%) | 3,984 (6.4%) |
| $2,500 to $4,999 | 2,187 (2.8%) | 3,359 (5.3%) |
| $5,000 to $7,499 | 1,796 (2.3%) | 2,550 (4.1%) |
| $7,500 to $9,999 | 1,389 (1.8%) | 1,496 (2.4%) |
| $10,000 to $12,499 | 1,682 (2.1%) | 1,847 (2.9%) |
| $12,500 to $14,999 | 1,429 (1.8%) | 1,802 (2.9%) |
| $15,000 to $17,499 | 1,544 (1.9%) | 2,109 (3.4%) |
| $17,500 to $19,999 | 984 (1.2%) | 986 (1.6%) |
| $20,000 to $22,499 | 1,244 (1.6%) | 1,587 (2.5%) |
| $22,500 to $24,999 | 1,292 (1.6%) | 1,317 (2.1%) |
| $25,000 to $29,999 | 2,628 (3.3%) | 3,165 (5.0%) |
| $30,000 to $34,999 | 2,274 (2.9%) | 2,929 (4.7%) |
| $35,000 to $39,999 | 2,373 (3.0%) | 2,050 (3.3%) |
| $40,000 to $44,999 | 2,390 (3.0%) | 2,539 (4.1%) |
| $45,000 to $49,999 | 2,166 (2.7%) | 1,810 (2.9%) |
| $50,000 to $54,999 | 1,993 (2.5%) | 2,416 (3.8%) |
| $55,000 to $64,999 | 4,025 (5.1%) | 4,248 (6.8%) |
| $65,000 to $74,999 | 4,234 (5.3%) | 4,273 (6.8%) |
| $75,000 to $99,999 | 7,420 (9.3%) | 6,730 (10.7%) |
| $100,000+ | 33,742 (42.4%) | 11,560 (18.4%) |
| Total | 79,535 (100.0%) | 62,757 (100.0%) |
Earnings by Sex by Educational Attainment in Forsyth County
Average earnings in Forsyth County are $95,526 for men and $55,076 for women, a difference of 42.3%. Men with an educational attainment of graduate degree enjoy the highest average annual earnings of $128,604, while those with less than high school education earn the least with $35,915. Women with an educational attainment of graduate degree earn the most with the average annual earnings of $74,854, while those with less than high school education have the smallest earnings of $23,714.
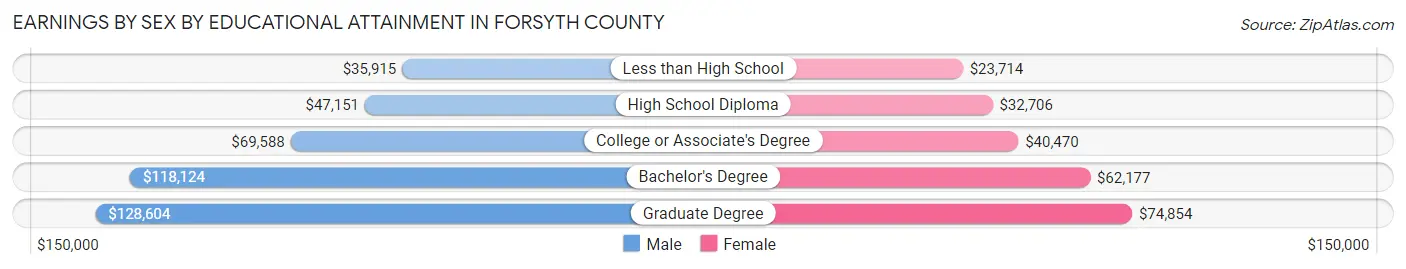
| Educational Attainment | Male Income | Female Income |
| Less than High School | $35,915 | $23,714 |
| High School Diploma | $47,151 | $32,706 |
| College or Associate's Degree | $69,588 | $40,470 |
| Bachelor's Degree | $118,124 | $62,177 |
| Graduate Degree | $128,604 | $74,854 |
| Total | $95,526 | $55,076 |
Family Income in Forsyth County
Family Income Brackets in Forsyth County
According to the Forsyth County family income data, there are 20,822 families falling into the $200,000+ income range, which is the most common income bracket and makes up 30.2% of all families. Conversely, the $10,000 to $14,999 income bracket is the least frequent group with only 345 families (0.5%) belonging to this category.
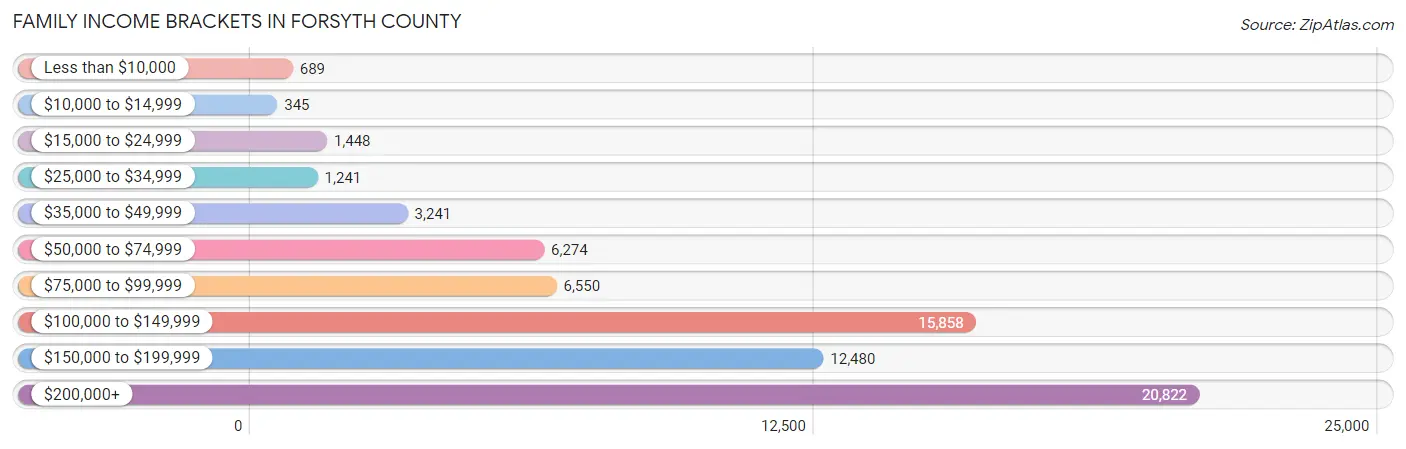
| Income Bracket | # Families | % Families |
| Less than $10,000 | 689 | 1.0% |
| $10,000 to $14,999 | 345 | 0.5% |
| $15,000 to $24,999 | 1,448 | 2.1% |
| $25,000 to $34,999 | 1,241 | 1.8% |
| $35,000 to $49,999 | 3,241 | 4.7% |
| $50,000 to $74,999 | 6,274 | 9.1% |
| $75,000 to $99,999 | 6,550 | 9.5% |
| $100,000 to $149,999 | 15,858 | 23.0% |
| $150,000 to $199,999 | 12,480 | 18.1% |
| $200,000+ | 20,822 | 30.2% |
Family Income by Famaliy Size in Forsyth County
4-person families (18,968 | 27.5%) account for the highest median family income in Forsyth County with $173,706 per family, while 2-person families (25,307 | 36.7%) have the highest median income of $58,170 per family member.
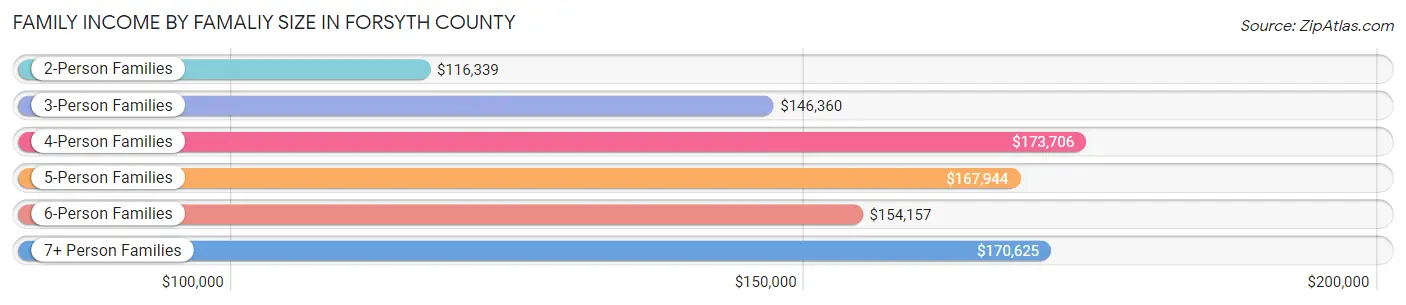
| Income Bracket | # Families | Median Income |
| 2-Person Families | 25,307 (36.7%) | $116,339 |
| 3-Person Families | 15,935 (23.1%) | $146,360 |
| 4-Person Families | 18,968 (27.5%) | $173,706 |
| 5-Person Families | 5,785 (8.4%) | $167,944 |
| 6-Person Families | 2,258 (3.3%) | $154,157 |
| 7+ Person Families | 695 (1.0%) | $170,625 |
| Total | 68,948 (100.0%) | $144,747 |
Family Income by Number of Earners in Forsyth County
The median family income in Forsyth County is $144,747, with families comprising 3+ earners (9,215) having the highest median family income of $176,688, while families with no earners (6,045) have the lowest median family income of $66,349, accounting for 13.4% and 8.8% of families, respectively.
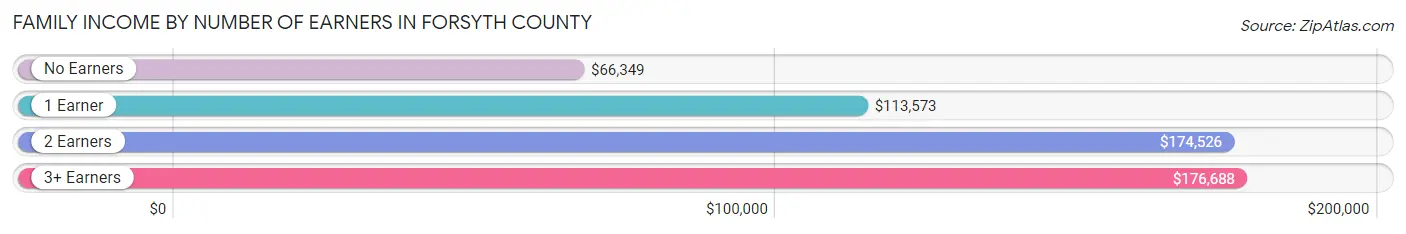
| Number of Earners | # Families | Median Income |
| No Earners | 6,045 (8.8%) | $66,349 |
| 1 Earner | 19,894 (28.8%) | $113,573 |
| 2 Earners | 33,794 (49.0%) | $174,526 |
| 3+ Earners | 9,215 (13.4%) | $176,688 |
| Total | 68,948 (100.0%) | $144,747 |
Household Income in Forsyth County
Household Income Brackets in Forsyth County
With 22,605 households falling in the category, the $200,000+ income range is the most frequent in Forsyth County, accounting for 26.7% of all households. In contrast, only 847 households (1.0%) fall into the $10,000 to $14,999 income bracket, making it the least populous group.
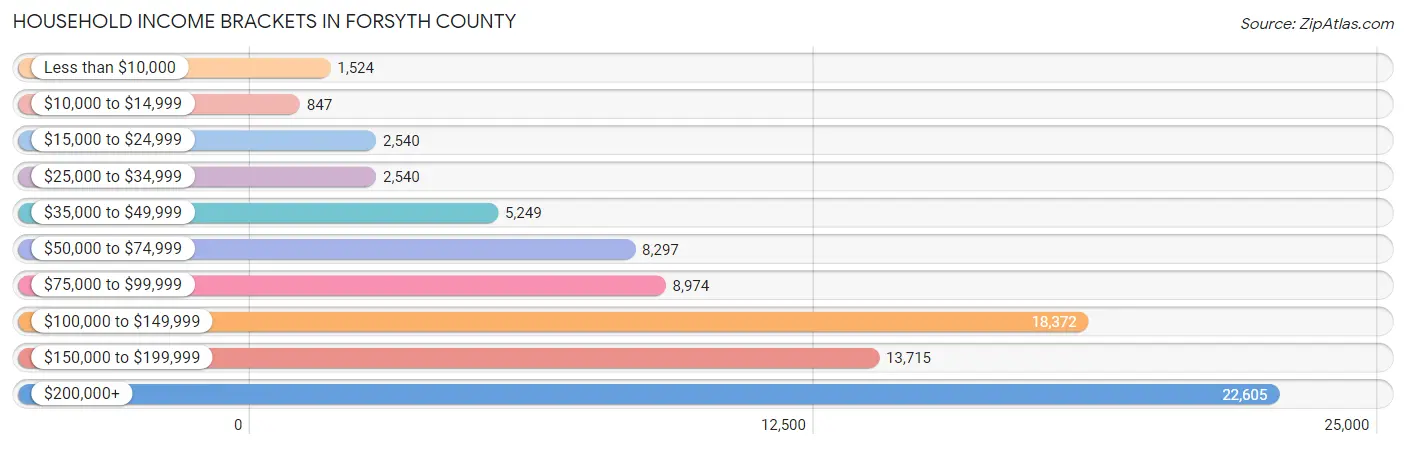
| Income Bracket | # Households | % Households |
| Less than $10,000 | 1,524 | 1.8% |
| $10,000 to $14,999 | 847 | 1.0% |
| $15,000 to $24,999 | 2,540 | 3.0% |
| $25,000 to $34,999 | 2,540 | 3.0% |
| $35,000 to $49,999 | 5,249 | 6.2% |
| $50,000 to $74,999 | 8,297 | 9.8% |
| $75,000 to $99,999 | 8,974 | 10.6% |
| $100,000 to $149,999 | 18,372 | 21.7% |
| $150,000 to $199,999 | 13,715 | 16.2% |
| $200,000+ | 22,605 | 26.7% |
Household Income by Householder Age in Forsyth County
The median household income in Forsyth County is $131,660, with the highest median household income of $152,739 found in the 45 to 64 years age bracket for the primary householder. A total of 39,030 households (46.1%) fall into this category. Meanwhile, the 65+ years age bracket for the primary householder has the lowest median household income of $75,522, with 16,598 households (19.6%) in this group.
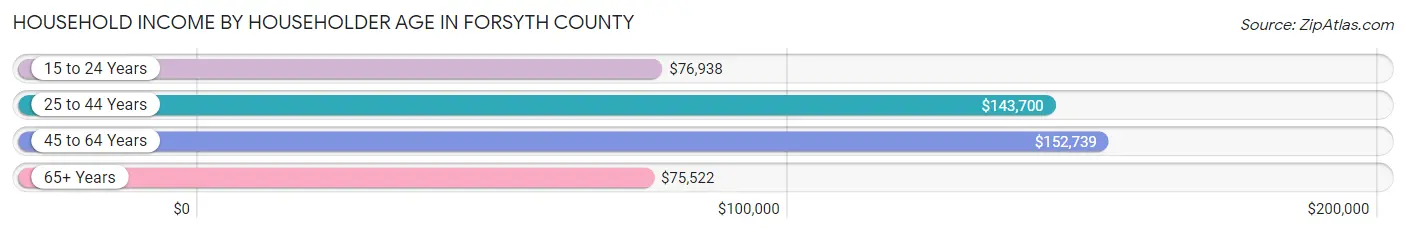
| Income Bracket | # Households | Median Income |
| 15 to 24 Years | 868 (1.0%) | $76,938 |
| 25 to 44 Years | 28,166 (33.3%) | $143,700 |
| 45 to 64 Years | 39,030 (46.1%) | $152,739 |
| 65+ Years | 16,598 (19.6%) | $75,522 |
| Total | 84,662 (100.0%) | $131,660 |
Poverty in Forsyth County
Income Below Poverty by Sex and Age in Forsyth County
With 4.2% poverty level for males and 5.1% for females among the residents of Forsyth County, under 5 year old males and 75 year old and over females are the most vulnerable to poverty, with 523 males (7.3%) and 576 females (8.1%) in their respective age groups living below the poverty level.
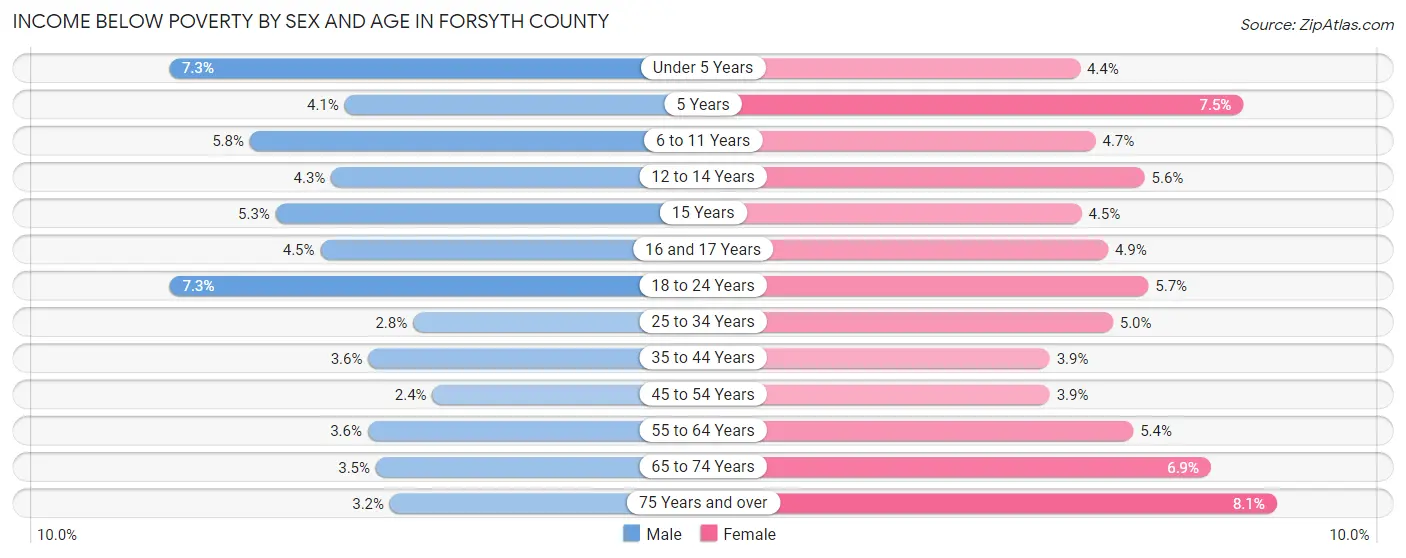
| Age Bracket | Male | Female |
| Under 5 Years | 523 (7.3%) | 306 (4.4%) |
| 5 Years | 64 (4.1%) | 128 (7.4%) |
| 6 to 11 Years | 707 (5.8%) | 564 (4.7%) |
| 12 to 14 Years | 275 (4.3%) | 320 (5.6%) |
| 15 Years | 121 (5.3%) | 110 (4.4%) |
| 16 and 17 Years | 198 (4.5%) | 190 (4.9%) |
| 18 to 24 Years | 766 (7.3%) | 564 (5.7%) |
| 25 to 34 Years | 320 (2.8%) | 603 (5.0%) |
| 35 to 44 Years | 729 (3.6%) | 800 (3.9%) |
| 45 to 54 Years | 526 (2.4%) | 762 (3.9%) |
| 55 to 64 Years | 534 (3.6%) | 766 (5.4%) |
| 65 to 74 Years | 298 (3.5%) | 673 (6.9%) |
| 75 Years and over | 168 (3.2%) | 576 (8.1%) |
| Total | 5,229 (4.2%) | 6,362 (5.1%) |
Income Above Poverty by Sex and Age in Forsyth County
According to the poverty statistics in Forsyth County, males aged 45 to 54 years and females aged 35 to 44 years are the age groups that are most secure financially, with 97.6% of males and 96.1% of females in these age groups living above the poverty line.
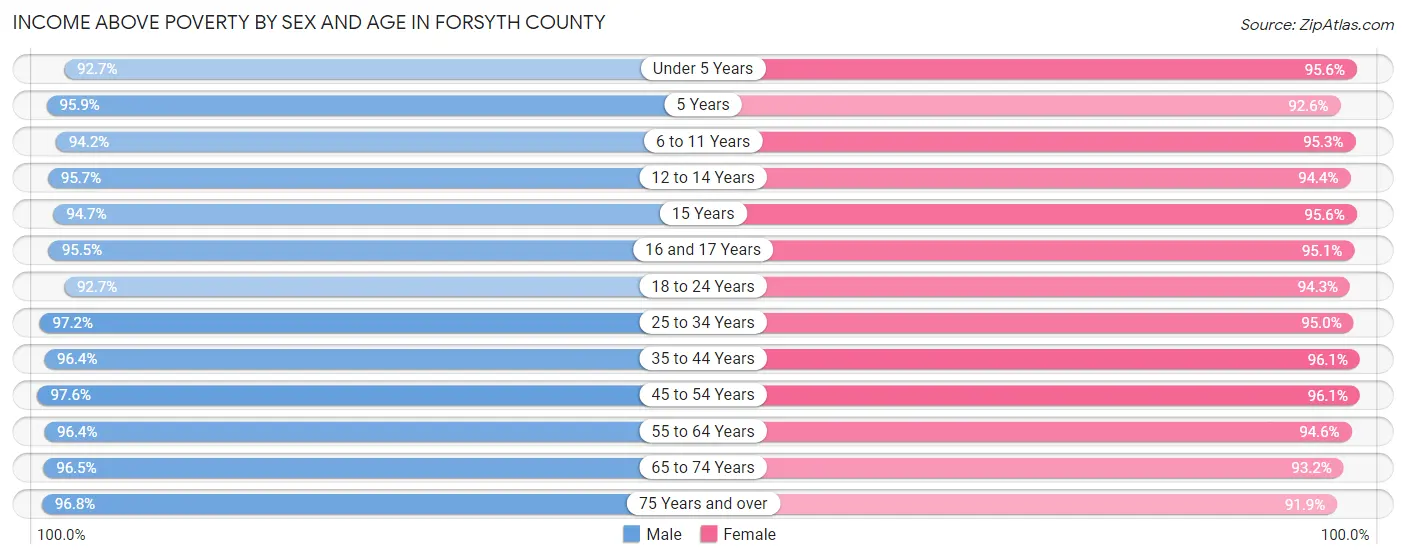
| Age Bracket | Male | Female |
| Under 5 Years | 6,617 (92.7%) | 6,624 (95.6%) |
| 5 Years | 1,512 (95.9%) | 1,589 (92.5%) |
| 6 to 11 Years | 11,436 (94.2%) | 11,398 (95.3%) |
| 12 to 14 Years | 6,109 (95.7%) | 5,370 (94.4%) |
| 15 Years | 2,147 (94.7%) | 2,364 (95.6%) |
| 16 and 17 Years | 4,195 (95.5%) | 3,658 (95.1%) |
| 18 to 24 Years | 9,706 (92.7%) | 9,346 (94.3%) |
| 25 to 34 Years | 11,159 (97.2%) | 11,392 (95.0%) |
| 35 to 44 Years | 19,392 (96.4%) | 19,928 (96.1%) |
| 45 to 54 Years | 21,126 (97.6%) | 18,956 (96.1%) |
| 55 to 64 Years | 14,184 (96.4%) | 13,403 (94.6%) |
| 65 to 74 Years | 8,266 (96.5%) | 9,151 (93.1%) |
| 75 Years and over | 5,055 (96.8%) | 6,558 (91.9%) |
| Total | 120,904 (95.9%) | 119,737 (95.0%) |
Income Below Poverty Among Married-Couple Families in Forsyth County
The poverty statistics for married-couple families in Forsyth County show that 2.0% or 1,194 of the total 59,764 families live below the poverty line. Families with 3 or 4 children have the highest poverty rate of 5.0%, comprising of 248 families. On the other hand, families with 5 or more children have the lowest poverty rate of 0.0%, which includes 0 families.
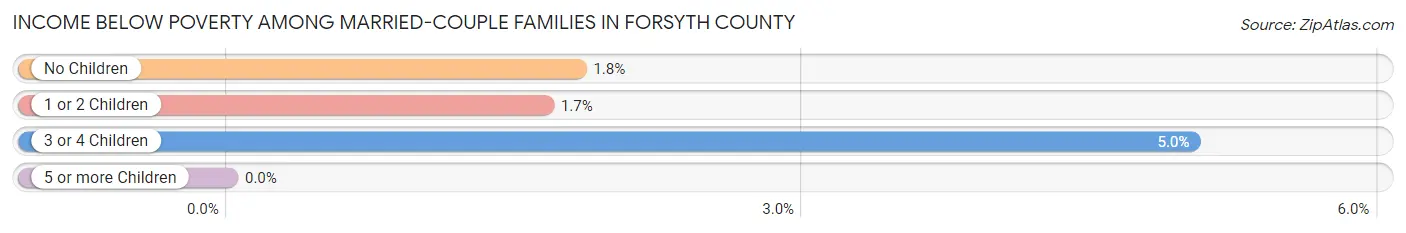
| Children | Above Poverty | Below Poverty |
| No Children | 26,369 (98.2%) | 488 (1.8%) |
| 1 or 2 Children | 27,323 (98.4%) | 458 (1.7%) |
| 3 or 4 Children | 4,680 (95.0%) | 248 (5.0%) |
| 5 or more Children | 198 (100.0%) | 0 (0.0%) |
| Total | 58,570 (98.0%) | 1,194 (2.0%) |
Income Below Poverty Among Single-Parent Households in Forsyth County
According to the poverty data in Forsyth County, 6.1% or 197 single-father households and 13.4% or 795 single-mother households are living below the poverty line. Among single-father households, those with 3 or 4 children have the highest poverty rate, with 21 households (9.8%) experiencing poverty. Likewise, among single-mother households, those with 5 or more children have the highest poverty rate, with 177 households (100.0%) falling below the poverty line.
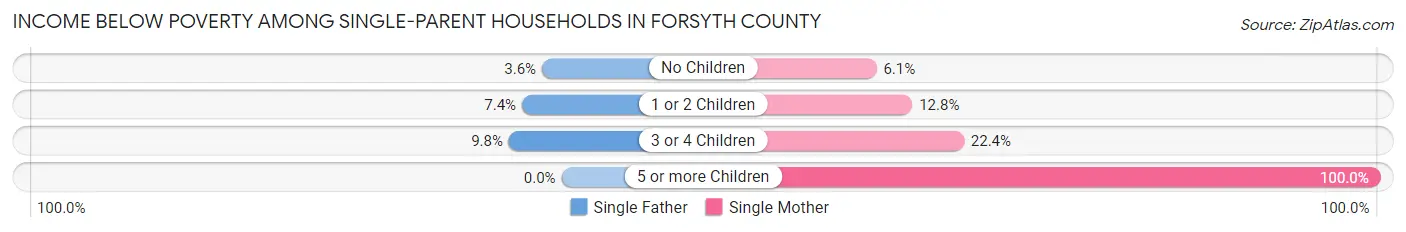
| Children | Single Father | Single Mother |
| No Children | 46 (3.6%) | 144 (6.1%) |
| 1 or 2 Children | 130 (7.4%) | 384 (12.8%) |
| 3 or 4 Children | 21 (9.8%) | 90 (22.4%) |
| 5 or more Children | 0 (0.0%) | 177 (100.0%) |
| Total | 197 (6.1%) | 795 (13.4%) |
Income Below Poverty Among Married-Couple vs Single-Parent Households in Forsyth County
The poverty data for Forsyth County shows that 1,194 of the married-couple family households (2.0%) and 992 of the single-parent households (10.8%) are living below the poverty level. Within the married-couple family households, those with 3 or 4 children have the highest poverty rate, with 248 households (5.0%) falling below the poverty line. Among the single-parent households, those with 5 or more children have the highest poverty rate, with 177 household (100.0%) living below poverty.
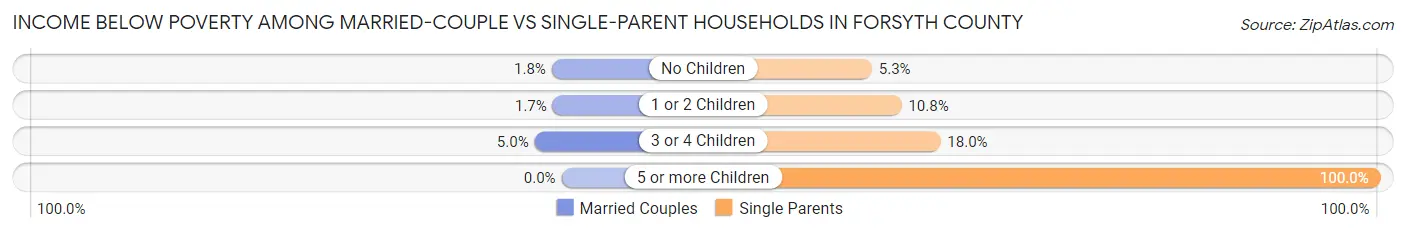
| Children | Married-Couple Families | Single-Parent Households |
| No Children | 488 (1.8%) | 190 (5.2%) |
| 1 or 2 Children | 458 (1.7%) | 514 (10.8%) |
| 3 or 4 Children | 248 (5.0%) | 111 (18.0%) |
| 5 or more Children | 0 (0.0%) | 177 (100.0%) |
| Total | 1,194 (2.0%) | 992 (10.8%) |
Employment Characteristics in Forsyth County
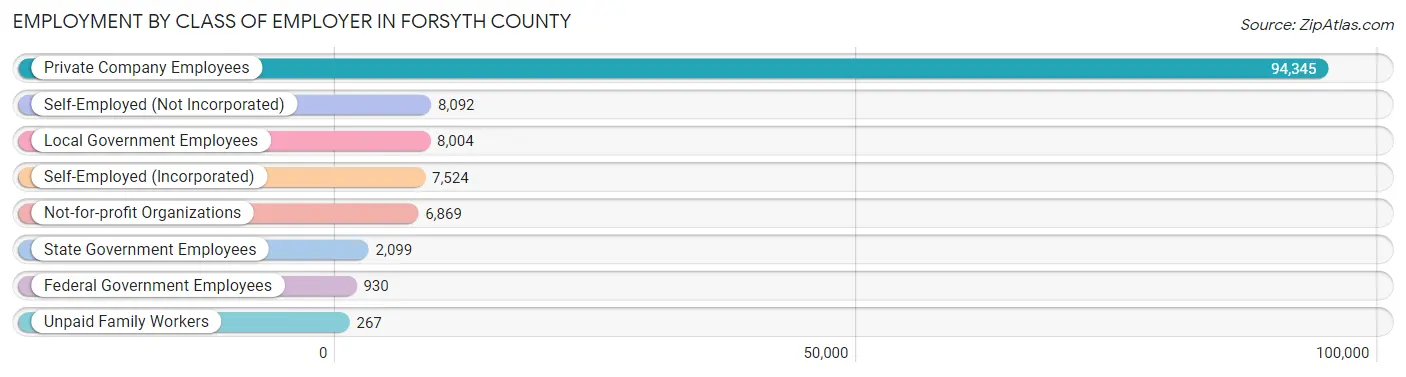
Employment by Class of Employer in Forsyth County
Among the 128,130 employed individuals in Forsyth County, private company employees (94,345 | 73.6%), self-employed (not incorporated) (8,092 | 6.3%), and local government employees (8,004 | 6.2%) make up the most common classes of employment.
| Employer Class | # Employees | % Employees |
| Private Company Employees | 94,345 | 73.6% |
| Self-Employed (Incorporated) | 7,524 | 5.9% |
| Self-Employed (Not Incorporated) | 8,092 | 6.3% |
| Not-for-profit Organizations | 6,869 | 5.4% |
| Local Government Employees | 8,004 | 6.2% |
| State Government Employees | 2,099 | 1.6% |
| Federal Government Employees | 930 | 0.7% |
| Unpaid Family Workers | 267 | 0.2% |
| Total | 128,130 | 100.0% |
Employment Status by Age in Forsyth County
According to the labor force statistics for Forsyth County, out of the total population over 16 years of age (194,590), 69.6% or 135,435 individuals are in the labor force, with 3.7% or 5,011 of them unemployed. The age group with the highest labor force participation rate is 45 to 54 years, with 85.9% or 35,565 individuals in the labor force. Within the labor force, the 20 to 24 years age range has the highest percentage of unemployed individuals, with 7.7% or 848 of them being unemployed.
| Age Bracket | In Labor Force | Unemployed |
| 16 to 19 Years | 6,248 (42.5%) | 275 (4.4%) |
| 20 to 24 Years | 11,012 (78.9%) | 848 (7.7%) |
| 25 to 29 Years | 8,766 (84.7%) | 675 (7.7%) |
| 30 to 34 Years | 11,091 (83.8%) | 244 (2.2%) |
| 35 to 44 Years | 34,702 (84.8%) | 1,041 (3.0%) |
| 45 to 54 Years | 35,565 (85.9%) | 1,067 (3.0%) |
| 55 to 59 Years | 13,417 (81.5%) | 376 (2.8%) |
| 60 to 64 Years | 8,629 (69.2%) | 207 (2.4%) |
| 65 to 74 Years | 5,068 (27.4%) | 294 (5.8%) |
| 75 Years and over | 932 (7.4%) | 18 (1.9%) |
| Total | 135,435 (69.6%) | 5,011 (3.7%) |
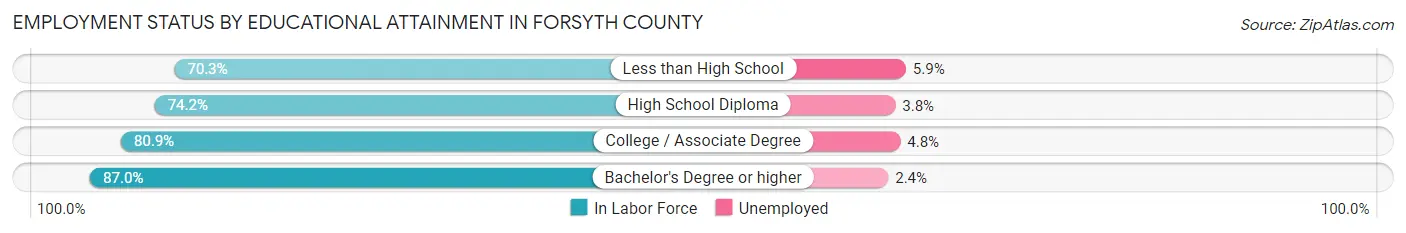
Employment Status by Educational Attainment in Forsyth County
According to labor force statistics for Forsyth County, 83.2% of individuals (112,188) out of the total population between 25 and 64 years of age (134,841) are in the labor force, with 3.2% or 3,590 of them being unemployed. The group with the highest labor force participation rate are those with the educational attainment of bachelor's degree or higher, with 87.0% or 71,088 individuals in the labor force. Within the labor force, individuals with less than high school education have the highest percentage of unemployment, with 5.9% or 295 of them being unemployed.
| Educational Attainment | In Labor Force | Unemployed |
| Less than High School | 5,000 (70.3%) | 420 (5.9%) |
| High School Diploma | 12,636 (74.2%) | 647 (3.8%) |
| College / Associate Degree | 23,452 (80.9%) | 1,391 (4.8%) |
| Bachelor's Degree or higher | 71,088 (87.0%) | 1,961 (2.4%) |
| Total | 112,188 (83.2%) | 4,315 (3.2%) |
Employment Occupations by Sex in Forsyth County
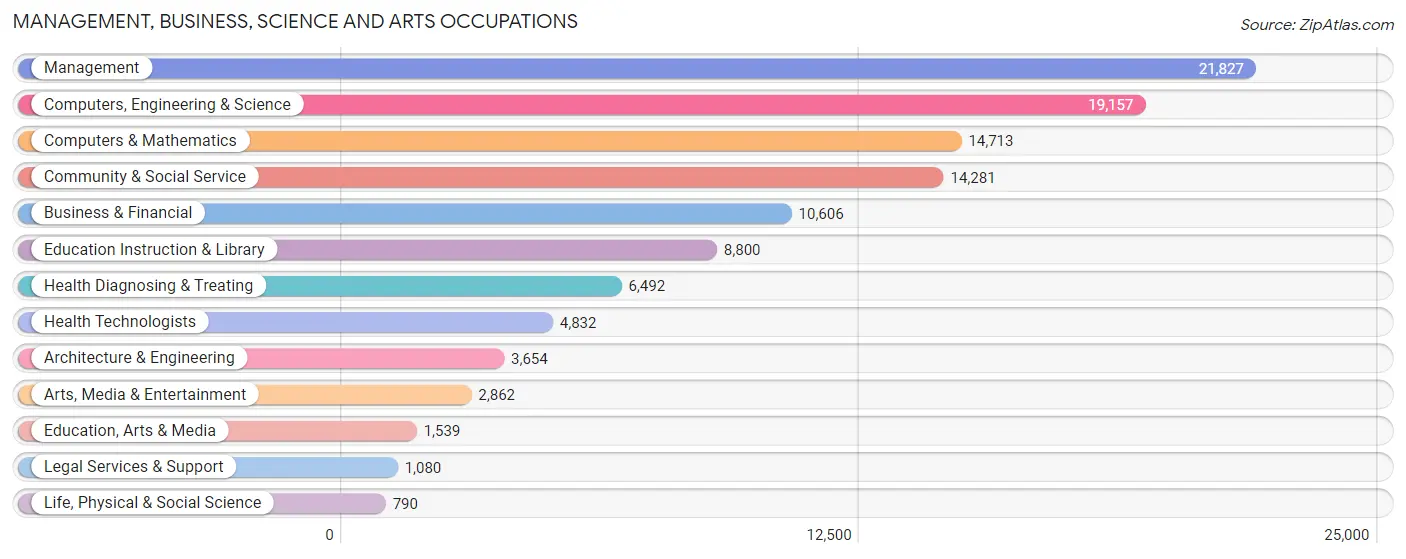
Management, Business, Science and Arts Occupations
The most common Management, Business, Science and Arts occupations in Forsyth County are Management (21,827 | 16.8%), Computers, Engineering & Science (19,157 | 14.7%), Computers & Mathematics (14,713 | 11.3%), Community & Social Service (14,281 | 11.0%), and Business & Financial (10,606 | 8.1%).
Management, Business, Science and Arts Occupations by Sex
Within the Management, Business, Science and Arts occupations in Forsyth County, the most male-oriented occupations are Architecture & Engineering (86.5%), Computers, Engineering & Science (76.3%), and Computers & Mathematics (74.6%), while the most female-oriented occupations are Education Instruction & Library (76.7%), Health Diagnosing & Treating (74.7%), and Health Technologists (74.1%).
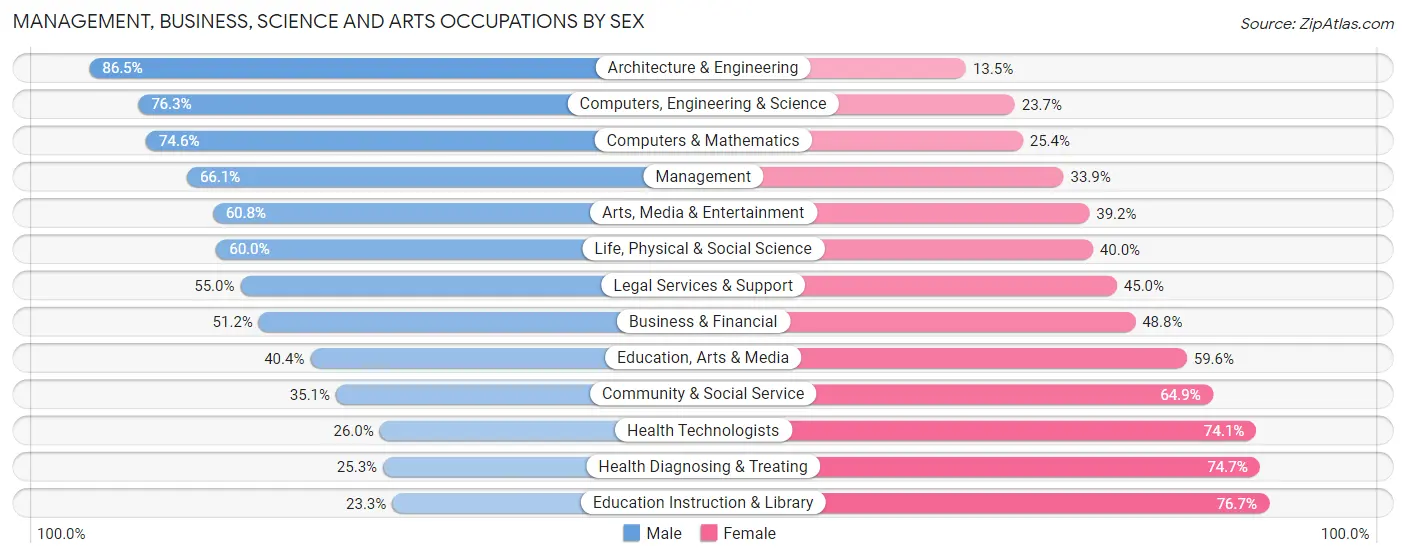
| Occupation | Male | Female |
| Management | 14,435 (66.1%) | 7,392 (33.9%) |
| Business & Financial | 5,427 (51.2%) | 5,179 (48.8%) |
| Computers, Engineering & Science | 14,615 (76.3%) | 4,542 (23.7%) |
| Computers & Mathematics | 10,981 (74.6%) | 3,732 (25.4%) |
| Architecture & Engineering | 3,160 (86.5%) | 494 (13.5%) |
| Life, Physical & Social Science | 474 (60.0%) | 316 (40.0%) |
| Community & Social Service | 5,008 (35.1%) | 9,273 (64.9%) |
| Education, Arts & Media | 622 (40.4%) | 917 (59.6%) |
| Legal Services & Support | 594 (55.0%) | 486 (45.0%) |
| Education Instruction & Library | 2,053 (23.3%) | 6,747 (76.7%) |
| Arts, Media & Entertainment | 1,739 (60.8%) | 1,123 (39.2%) |
| Health Diagnosing & Treating | 1,640 (25.3%) | 4,852 (74.7%) |
| Health Technologists | 1,254 (26.0%) | 3,578 (74.1%) |
| Total (Category) | 41,125 (56.8%) | 31,238 (43.2%) |
| Total (Overall) | 73,676 (56.6%) | 56,541 (43.4%) |
Services Occupations
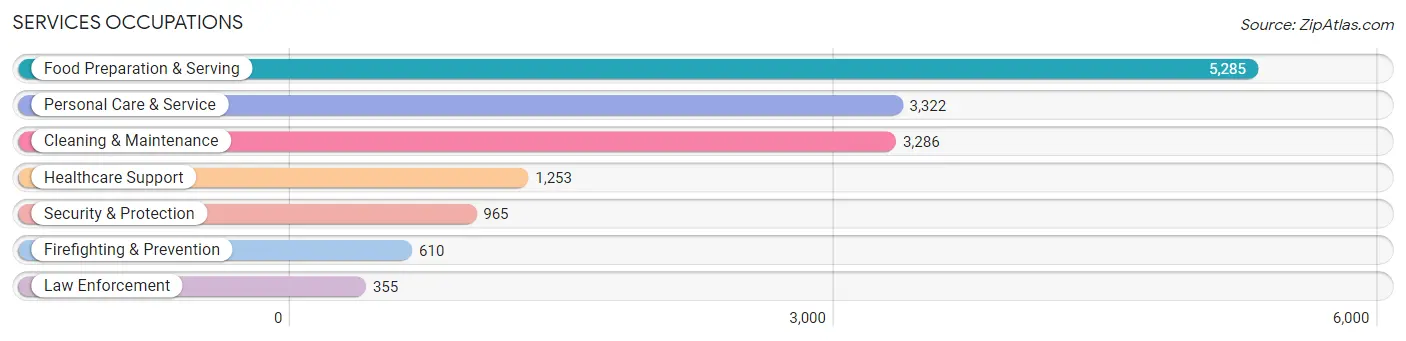
The most common Services occupations in Forsyth County are Food Preparation & Serving (5,285 | 4.1%), Personal Care & Service (3,322 | 2.5%), Cleaning & Maintenance (3,286 | 2.5%), Healthcare Support (1,253 | 1.0%), and Security & Protection (965 | 0.7%).
Services Occupations by Sex
Within the Services occupations in Forsyth County, the most male-oriented occupations are Firefighting & Prevention (88.0%), Security & Protection (86.9%), and Law Enforcement (85.1%), while the most female-oriented occupations are Healthcare Support (90.8%), Personal Care & Service (81.0%), and Food Preparation & Serving (57.6%).
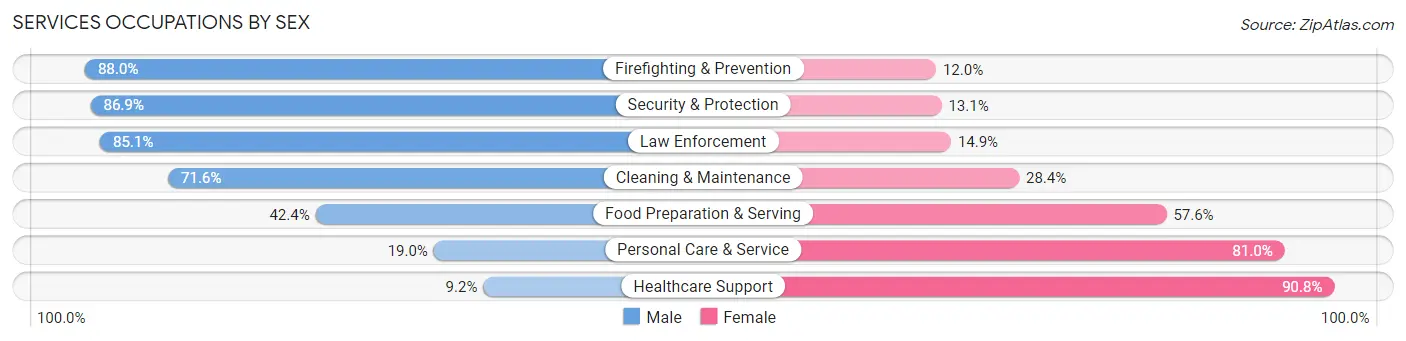
| Occupation | Male | Female |
| Healthcare Support | 115 (9.2%) | 1,138 (90.8%) |
| Security & Protection | 839 (86.9%) | 126 (13.1%) |
| Firefighting & Prevention | 537 (88.0%) | 73 (12.0%) |
| Law Enforcement | 302 (85.1%) | 53 (14.9%) |
| Food Preparation & Serving | 2,241 (42.4%) | 3,044 (57.6%) |
| Cleaning & Maintenance | 2,352 (71.6%) | 934 (28.4%) |
| Personal Care & Service | 631 (19.0%) | 2,691 (81.0%) |
| Total (Category) | 6,178 (43.8%) | 7,933 (56.2%) |
| Total (Overall) | 73,676 (56.6%) | 56,541 (43.4%) |
Sales and Office Occupations
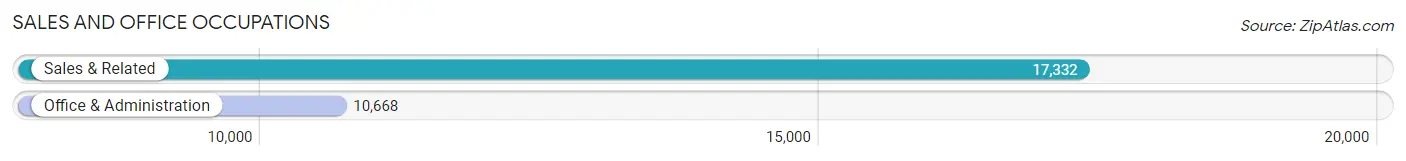
The most common Sales and Office occupations in Forsyth County are Sales & Related (17,332 | 13.3%), and Office & Administration (10,668 | 8.2%).
Sales and Office Occupations by Sex
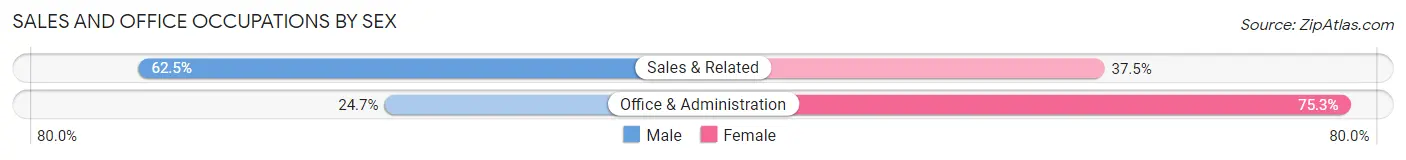
| Occupation | Male | Female |
| Sales & Related | 10,825 (62.5%) | 6,507 (37.5%) |
| Office & Administration | 2,631 (24.7%) | 8,037 (75.3%) |
| Total (Category) | 13,456 (48.1%) | 14,544 (51.9%) |
| Total (Overall) | 73,676 (56.6%) | 56,541 (43.4%) |
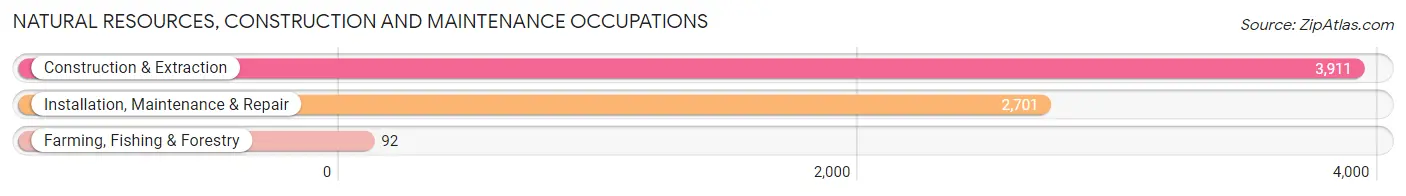
Natural Resources, Construction and Maintenance Occupations
The most common Natural Resources, Construction and Maintenance occupations in Forsyth County are Construction & Extraction (3,911 | 3.0%), Installation, Maintenance & Repair (2,701 | 2.1%), and Farming, Fishing & Forestry (92 | 0.1%).
Natural Resources, Construction and Maintenance Occupations by Sex
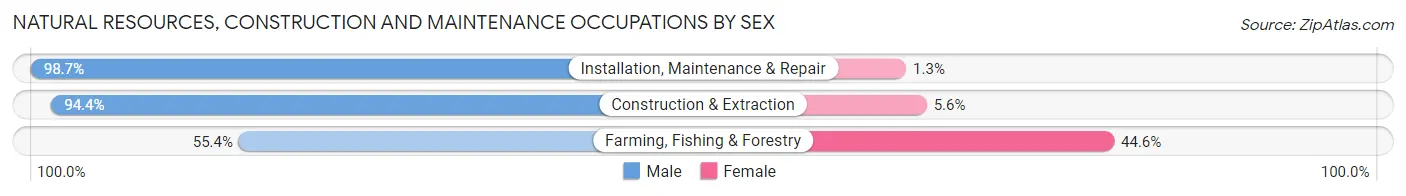
| Occupation | Male | Female |
| Farming, Fishing & Forestry | 51 (55.4%) | 41 (44.6%) |
| Construction & Extraction | 3,693 (94.4%) | 218 (5.6%) |
| Installation, Maintenance & Repair | 2,666 (98.7%) | 35 (1.3%) |
| Total (Category) | 6,410 (95.6%) | 294 (4.4%) |
| Total (Overall) | 73,676 (56.6%) | 56,541 (43.4%) |
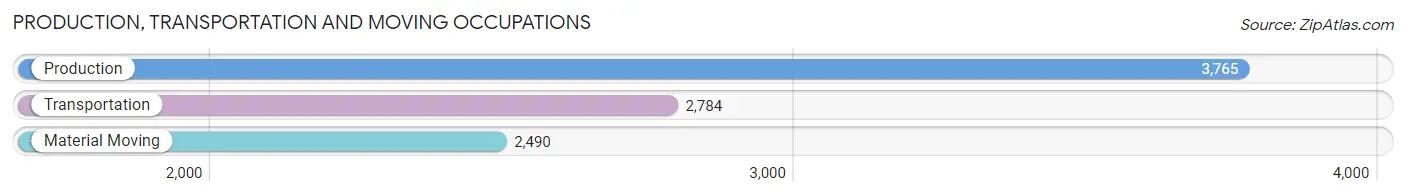
Production, Transportation and Moving Occupations
The most common Production, Transportation and Moving occupations in Forsyth County are Production (3,765 | 2.9%), Transportation (2,784 | 2.1%), and Material Moving (2,490 | 1.9%).
Production, Transportation and Moving Occupations by Sex
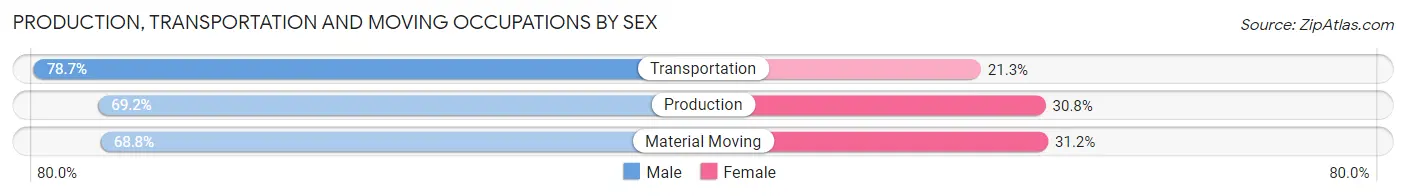
| Occupation | Male | Female |
| Production | 2,604 (69.2%) | 1,161 (30.8%) |
| Transportation | 2,190 (78.7%) | 594 (21.3%) |
| Material Moving | 1,713 (68.8%) | 777 (31.2%) |
| Total (Category) | 6,507 (72.0%) | 2,532 (28.0%) |
| Total (Overall) | 73,676 (56.6%) | 56,541 (43.4%) |
Employment Industries by Sex in Forsyth County
Employment Industries in Forsyth County
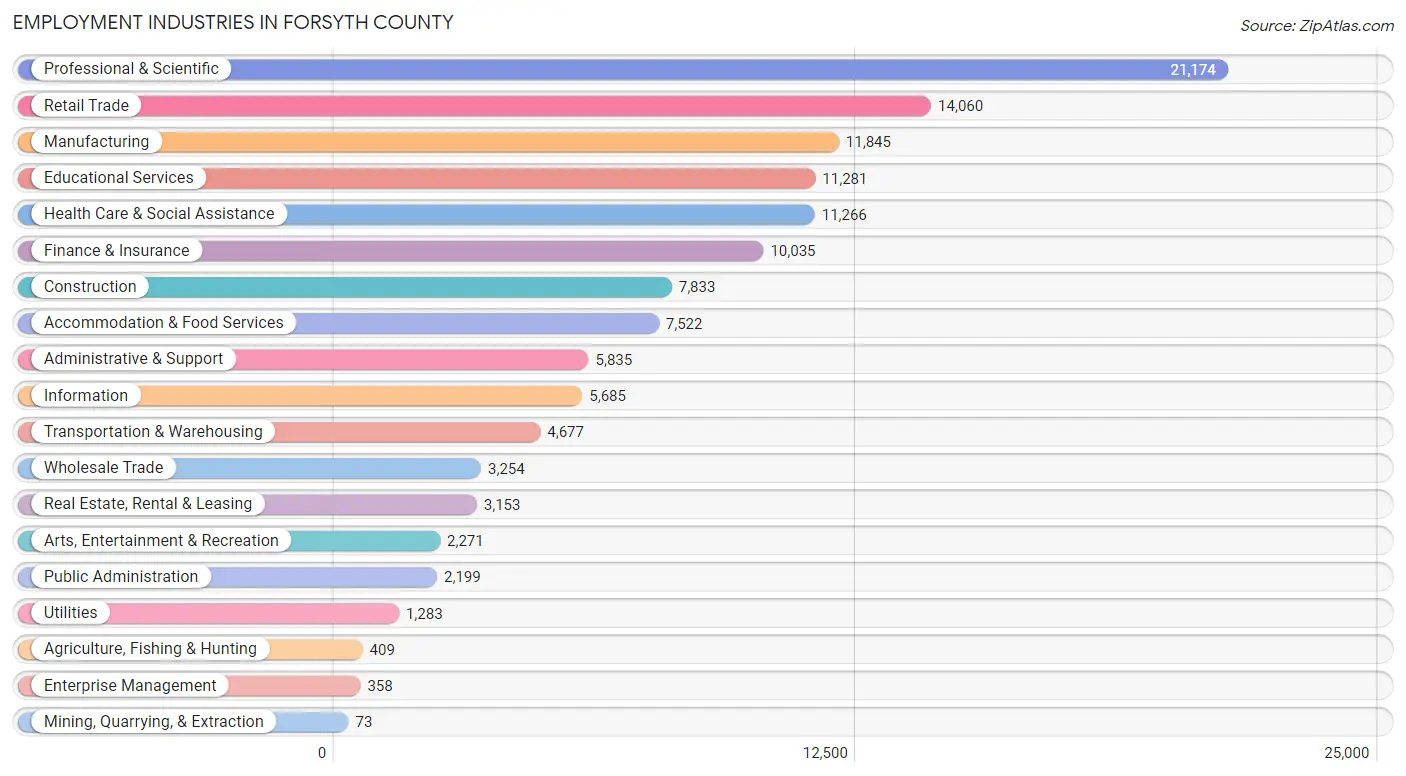
The major employment industries in Forsyth County include Professional & Scientific (21,174 | 16.3%), Retail Trade (14,060 | 10.8%), Manufacturing (11,845 | 9.1%), Educational Services (11,281 | 8.7%), and Health Care & Social Assistance (11,266 | 8.6%).
Employment Industries by Sex in Forsyth County
The Forsyth County industries that see more men than women are Mining, Quarrying, & Extraction (87.7%), Agriculture, Fishing & Hunting (83.6%), and Construction (81.0%), whereas the industries that tend to have a higher number of women are Health Care & Social Assistance (77.3%), Educational Services (68.8%), and Accommodation & Food Services (56.9%).
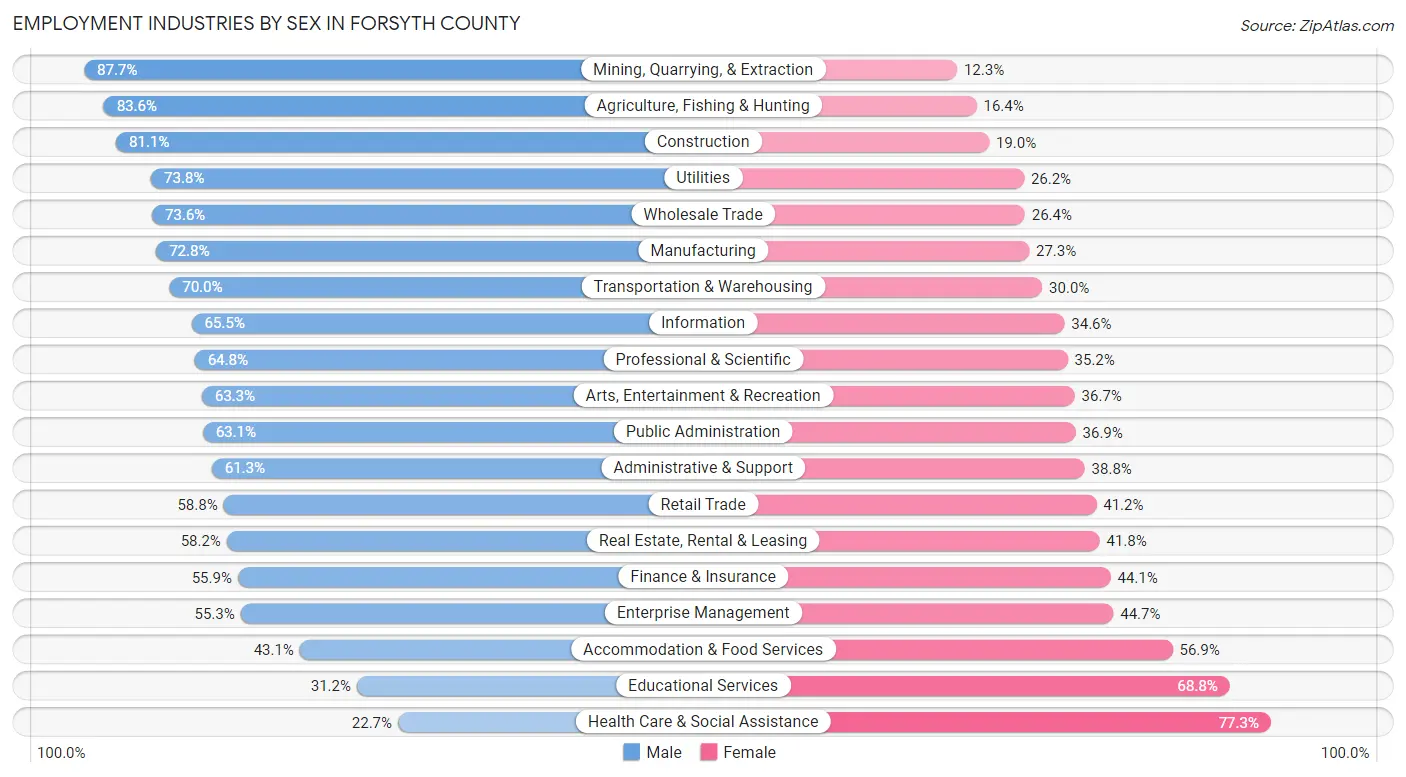
| Industry | Male | Female |
| Agriculture, Fishing & Hunting | 342 (83.6%) | 67 (16.4%) |
| Mining, Quarrying, & Extraction | 64 (87.7%) | 9 (12.3%) |
| Construction | 6,349 (81.0%) | 1,484 (19.0%) |
| Manufacturing | 8,617 (72.8%) | 3,228 (27.3%) |
| Wholesale Trade | 2,396 (73.6%) | 858 (26.4%) |
| Retail Trade | 8,272 (58.8%) | 5,788 (41.2%) |
| Transportation & Warehousing | 3,276 (70.0%) | 1,401 (30.0%) |
| Utilities | 947 (73.8%) | 336 (26.2%) |
| Information | 3,721 (65.4%) | 1,964 (34.5%) |
| Finance & Insurance | 5,608 (55.9%) | 4,427 (44.1%) |
| Real Estate, Rental & Leasing | 1,834 (58.2%) | 1,319 (41.8%) |
| Professional & Scientific | 13,717 (64.8%) | 7,457 (35.2%) |
| Enterprise Management | 198 (55.3%) | 160 (44.7%) |
| Administrative & Support | 3,574 (61.3%) | 2,261 (38.8%) |
| Educational Services | 3,524 (31.2%) | 7,757 (68.8%) |
| Health Care & Social Assistance | 2,562 (22.7%) | 8,704 (77.3%) |
| Arts, Entertainment & Recreation | 1,438 (63.3%) | 833 (36.7%) |
| Accommodation & Food Services | 3,239 (43.1%) | 4,283 (56.9%) |
| Public Administration | 1,388 (63.1%) | 811 (36.9%) |
| Total | 73,676 (56.6%) | 56,541 (43.4%) |
Education in Forsyth County
School Enrollment in Forsyth County
The most common levels of schooling among the 71,429 students in Forsyth County are high school (17,522 | 24.5%), elementary school (16,432 | 23.0%), and middle school (15,618 | 21.9%).
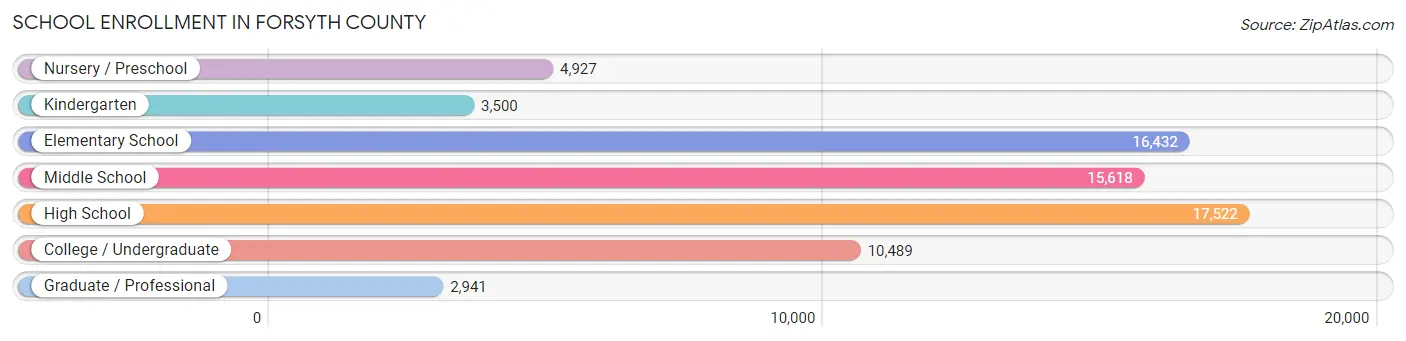
| School Level | # Students | % Students |
| Nursery / Preschool | 4,927 | 6.9% |
| Kindergarten | 3,500 | 4.9% |
| Elementary School | 16,432 | 23.0% |
| Middle School | 15,618 | 21.9% |
| High School | 17,522 | 24.5% |
| College / Undergraduate | 10,489 | 14.7% |
| Graduate / Professional | 2,941 | 4.1% |
| Total | 71,429 | 100.0% |
School Enrollment by Age by Funding Source in Forsyth County
Out of a total of 71,429 students who are enrolled in schools in Forsyth County, 11,500 (16.1%) attend a private institution, while the remaining 59,929 (83.9%) are enrolled in public schools. The age group of 3 to 4 year olds has the highest likelihood of being enrolled in private schools, with 2,486 (68.6% in the age bracket) enrolled. Conversely, the age group of 18 to 19 year olds has the lowest likelihood of being enrolled in a private school, with 4,917 (91.6% in the age bracket) attending a public institution.
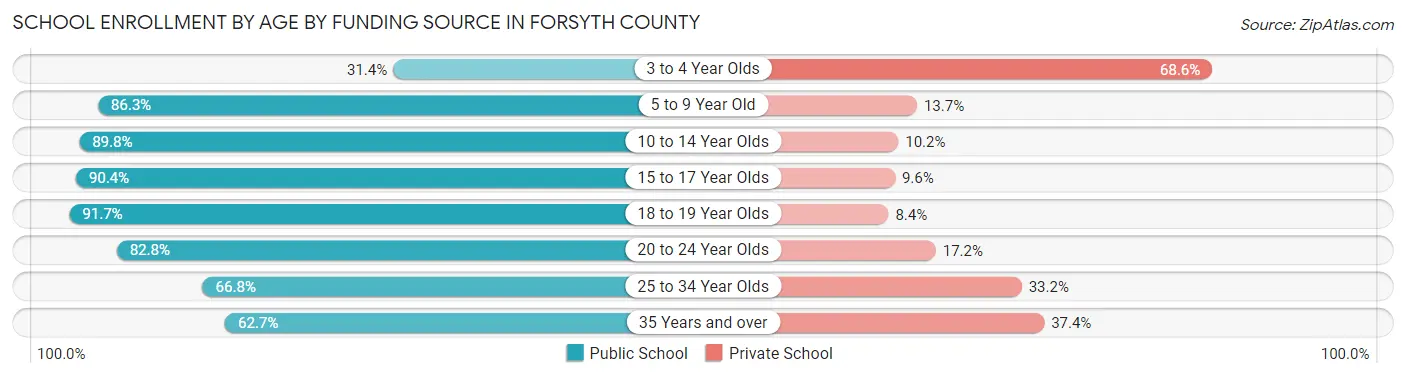
| Age Bracket | Public School | Private School |
| 3 to 4 Year Olds | 1,137 (31.4%) | 2,486 (68.6%) |
| 5 to 9 Year Old | 16,048 (86.3%) | 2,540 (13.7%) |
| 10 to 14 Year Olds | 18,132 (89.8%) | 2,055 (10.2%) |
| 15 to 17 Year Olds | 11,548 (90.4%) | 1,221 (9.6%) |
| 18 to 19 Year Olds | 4,917 (91.6%) | 448 (8.4%) |
| 20 to 24 Year Olds | 4,982 (82.8%) | 1,032 (17.2%) |
| 25 to 34 Year Olds | 1,499 (66.8%) | 744 (33.2%) |
| 35 Years and over | 1,654 (62.6%) | 986 (37.3%) |
| Total | 59,929 (83.9%) | 11,500 (16.1%) |
Educational Attainment by Field of Study in Forsyth County
Business (25,330 | 25.6%), engineering (12,908 | 13.1%), computers & mathematics (10,795 | 10.9%), education (9,047 | 9.1%), and science & technology (8,010 | 8.1%) are the most common fields of study among 98,876 individuals in Forsyth County who have obtained a bachelor's degree or higher.
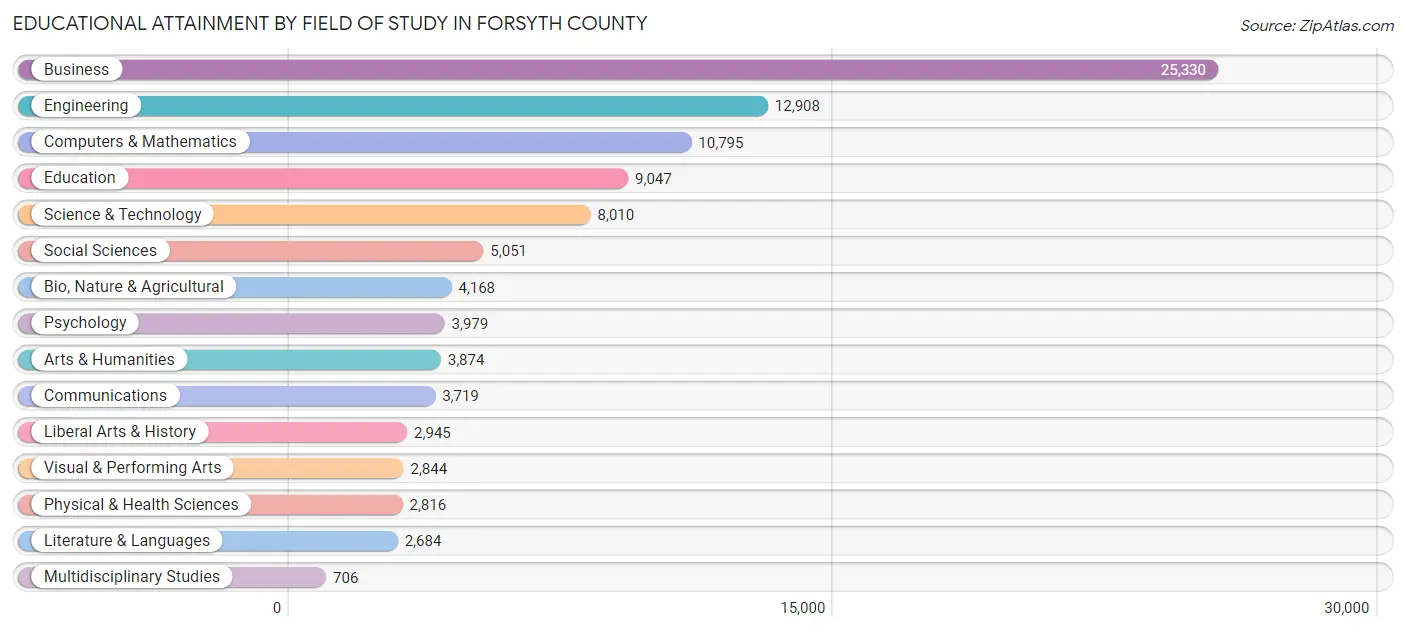
| Field of Study | # Graduates | % Graduates |
| Computers & Mathematics | 10,795 | 10.9% |
| Bio, Nature & Agricultural | 4,168 | 4.2% |
| Physical & Health Sciences | 2,816 | 2.9% |
| Psychology | 3,979 | 4.0% |
| Social Sciences | 5,051 | 5.1% |
| Engineering | 12,908 | 13.1% |
| Multidisciplinary Studies | 706 | 0.7% |
| Science & Technology | 8,010 | 8.1% |
| Business | 25,330 | 25.6% |
| Education | 9,047 | 9.1% |
| Literature & Languages | 2,684 | 2.7% |
| Liberal Arts & History | 2,945 | 3.0% |
| Visual & Performing Arts | 2,844 | 2.9% |
| Communications | 3,719 | 3.8% |
| Arts & Humanities | 3,874 | 3.9% |
| Total | 98,876 | 100.0% |
Transportation & Commute in Forsyth County
Vehicle Availability by Sex in Forsyth County
The most prevalent vehicle ownership categories in Forsyth County are males with 2 vehicles (34,798, accounting for 47.9%) and females with 2 vehicles (26,355, making up 62.7%).
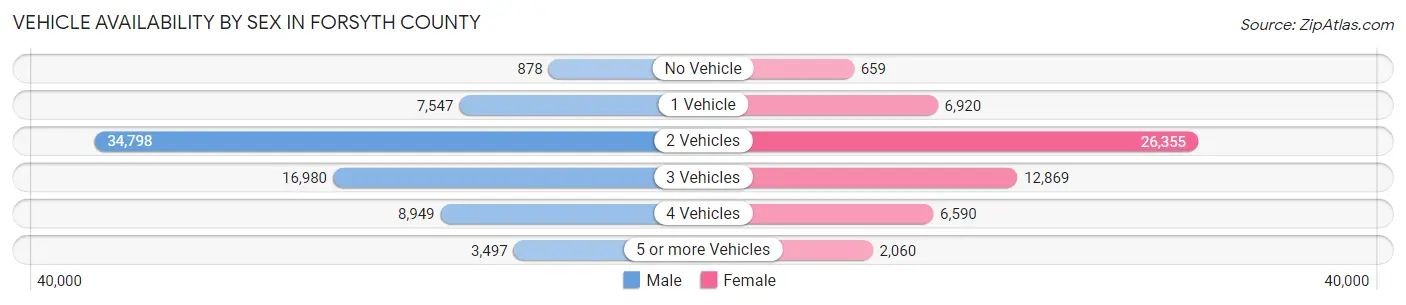
| Vehicles Available | Male | Female |
| No Vehicle | 878 (1.2%) | 659 (1.2%) |
| 1 Vehicle | 7,547 (10.4%) | 6,920 (12.5%) |
| 2 Vehicles | 34,798 (47.9%) | 26,355 (47.5%) |
| 3 Vehicles | 16,980 (23.4%) | 12,869 (23.2%) |
| 4 Vehicles | 8,949 (12.3%) | 6,590 (11.9%) |
| 5 or more Vehicles | 3,497 (4.8%) | 2,060 (3.7%) |
| Total | 72,649 (100.0%) | 55,453 (100.0%) |
Commute Time in Forsyth County
The most frequently occuring commute durations in Forsyth County are 20 to 24 minutes (12,932 commuters, 13.6%), 30 to 34 minutes (12,688 commuters, 13.4%), and 15 to 19 minutes (12,562 commuters, 13.2%).
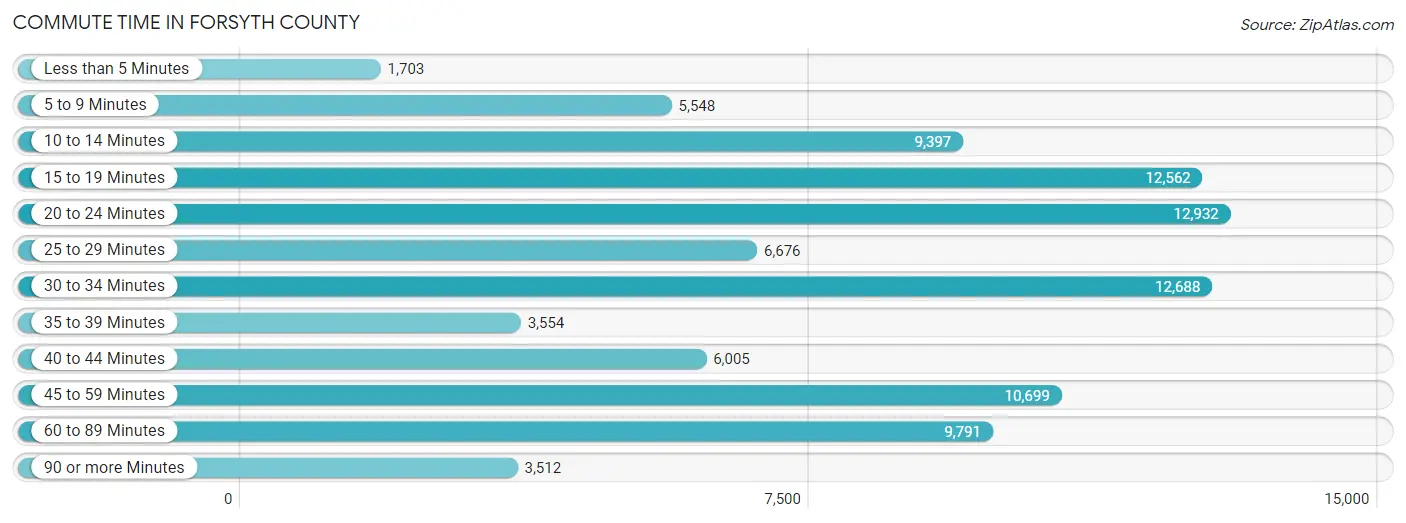
| Commute Time | # Commuters | % Commuters |
| Less than 5 Minutes | 1,703 | 1.8% |
| 5 to 9 Minutes | 5,548 | 5.8% |
| 10 to 14 Minutes | 9,397 | 9.9% |
| 15 to 19 Minutes | 12,562 | 13.2% |
| 20 to 24 Minutes | 12,932 | 13.6% |
| 25 to 29 Minutes | 6,676 | 7.0% |
| 30 to 34 Minutes | 12,688 | 13.4% |
| 35 to 39 Minutes | 3,554 | 3.7% |
| 40 to 44 Minutes | 6,005 | 6.3% |
| 45 to 59 Minutes | 10,699 | 11.3% |
| 60 to 89 Minutes | 9,791 | 10.3% |
| 90 or more Minutes | 3,512 | 3.7% |
Commute Time by Sex in Forsyth County
The most common commute times in Forsyth County are 30 to 34 minutes (7,017 commuters, 13.2%) for males and 20 to 24 minutes (6,200 commuters, 14.8%) for females.
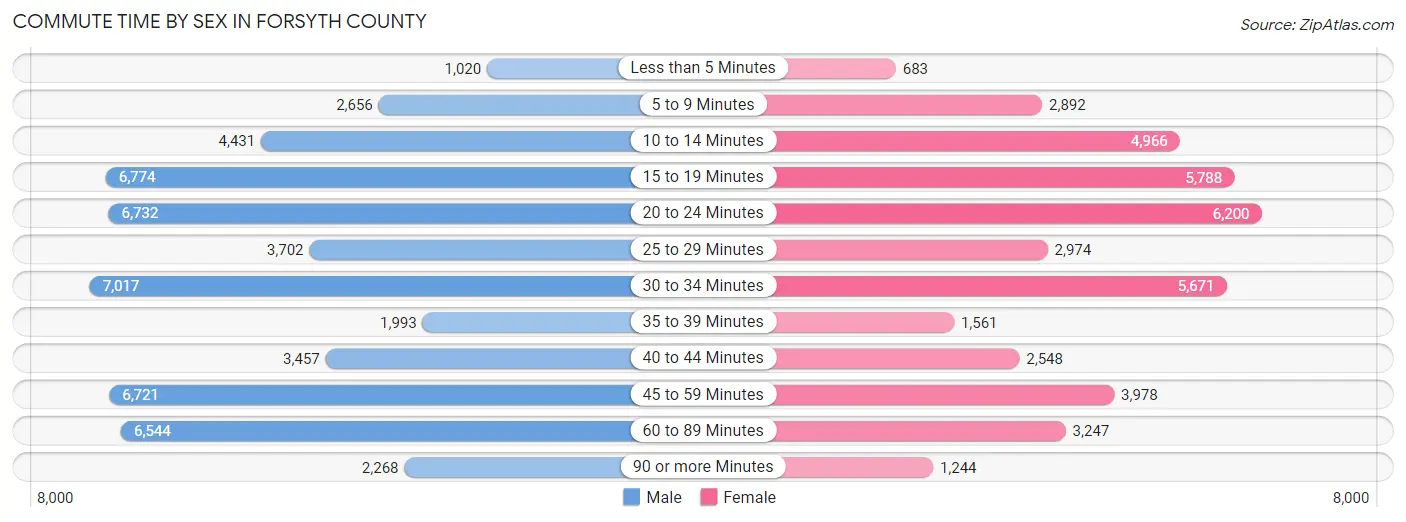
| Commute Time | Male | Female |
| Less than 5 Minutes | 1,020 (1.9%) | 683 (1.6%) |
| 5 to 9 Minutes | 2,656 (5.0%) | 2,892 (6.9%) |
| 10 to 14 Minutes | 4,431 (8.3%) | 4,966 (11.9%) |
| 15 to 19 Minutes | 6,774 (12.7%) | 5,788 (13.9%) |
| 20 to 24 Minutes | 6,732 (12.6%) | 6,200 (14.8%) |
| 25 to 29 Minutes | 3,702 (6.9%) | 2,974 (7.1%) |
| 30 to 34 Minutes | 7,017 (13.2%) | 5,671 (13.6%) |
| 35 to 39 Minutes | 1,993 (3.7%) | 1,561 (3.7%) |
| 40 to 44 Minutes | 3,457 (6.5%) | 2,548 (6.1%) |
| 45 to 59 Minutes | 6,721 (12.6%) | 3,978 (9.5%) |
| 60 to 89 Minutes | 6,544 (12.3%) | 3,247 (7.8%) |
| 90 or more Minutes | 2,268 (4.3%) | 1,244 (3.0%) |
Time of Departure to Work by Sex in Forsyth County
The most frequent times of departure to work in Forsyth County are 8:00 AM to 8:29 AM (8,435, 15.8%) for males and 7:00 AM to 7:29 AM (5,879, 14.1%) for females.
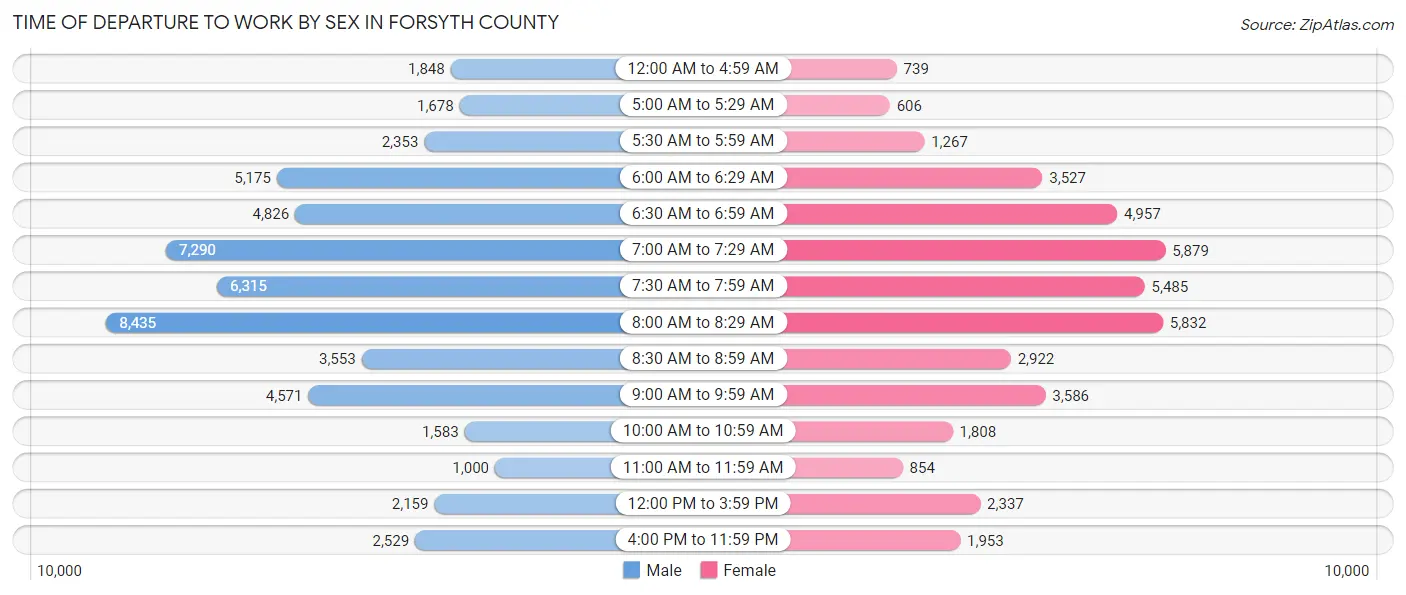
| Time of Departure | Male | Female |
| 12:00 AM to 4:59 AM | 1,848 (3.5%) | 739 (1.8%) |
| 5:00 AM to 5:29 AM | 1,678 (3.2%) | 606 (1.5%) |
| 5:30 AM to 5:59 AM | 2,353 (4.4%) | 1,267 (3.0%) |
| 6:00 AM to 6:29 AM | 5,175 (9.7%) | 3,527 (8.5%) |
| 6:30 AM to 6:59 AM | 4,826 (9.0%) | 4,957 (11.9%) |
| 7:00 AM to 7:29 AM | 7,290 (13.7%) | 5,879 (14.1%) |
| 7:30 AM to 7:59 AM | 6,315 (11.8%) | 5,485 (13.1%) |
| 8:00 AM to 8:29 AM | 8,435 (15.8%) | 5,832 (14.0%) |
| 8:30 AM to 8:59 AM | 3,553 (6.7%) | 2,922 (7.0%) |
| 9:00 AM to 9:59 AM | 4,571 (8.6%) | 3,586 (8.6%) |
| 10:00 AM to 10:59 AM | 1,583 (3.0%) | 1,808 (4.3%) |
| 11:00 AM to 11:59 AM | 1,000 (1.9%) | 854 (2.1%) |
| 12:00 PM to 3:59 PM | 2,159 (4.1%) | 2,337 (5.6%) |
| 4:00 PM to 11:59 PM | 2,529 (4.7%) | 1,953 (4.7%) |
| Total | 53,315 (100.0%) | 41,752 (100.0%) |
Housing Occupancy in Forsyth County
Occupancy by Ownership in Forsyth County
Of the total 84,662 dwellings in Forsyth County, owner-occupied units account for 71,824 (84.8%), while renter-occupied units make up 12,838 (15.2%).
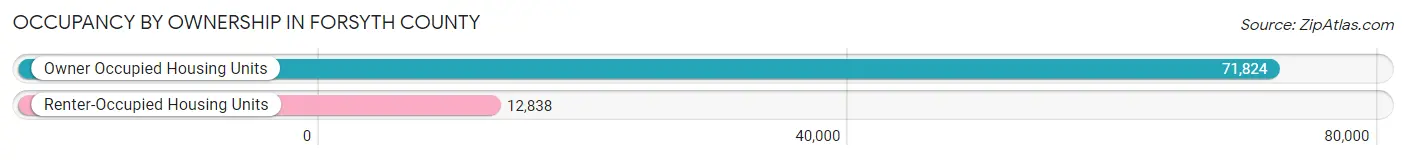
| Occupancy | # Housing Units | % Housing Units |
| Owner Occupied Housing Units | 71,824 | 84.8% |
| Renter-Occupied Housing Units | 12,838 | 15.2% |
| Total Occupied Housing Units | 84,662 | 100.0% |
Occupancy by Household Size in Forsyth County
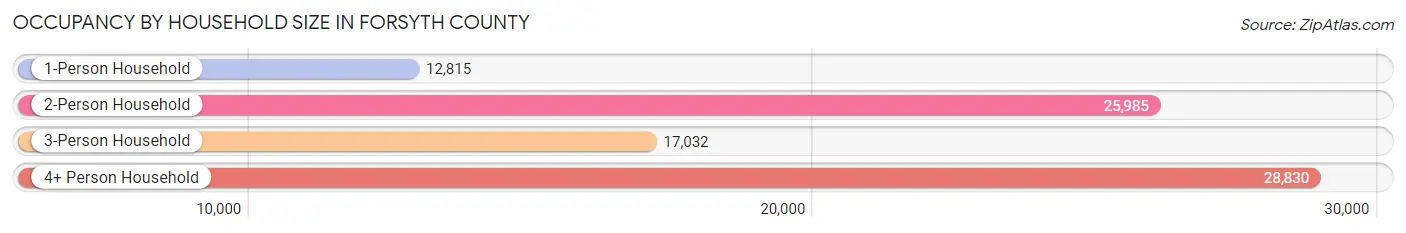
| Household Size | # Housing Units | % Housing Units |
| 1-Person Household | 12,815 | 15.1% |
| 2-Person Household | 25,985 | 30.7% |
| 3-Person Household | 17,032 | 20.1% |
| 4+ Person Household | 28,830 | 34.1% |
| Total Housing Units | 84,662 | 100.0% |
Occupancy by Ownership by Household Size in Forsyth County
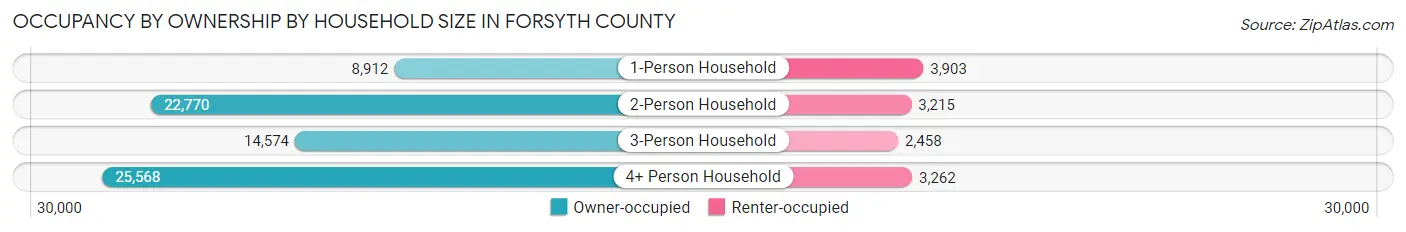
| Household Size | Owner-occupied | Renter-occupied |
| 1-Person Household | 8,912 (69.5%) | 3,903 (30.5%) |
| 2-Person Household | 22,770 (87.6%) | 3,215 (12.4%) |
| 3-Person Household | 14,574 (85.6%) | 2,458 (14.4%) |
| 4+ Person Household | 25,568 (88.7%) | 3,262 (11.3%) |
| Total Housing Units | 71,824 (84.8%) | 12,838 (15.2%) |
Occupancy by Educational Attainment in Forsyth County
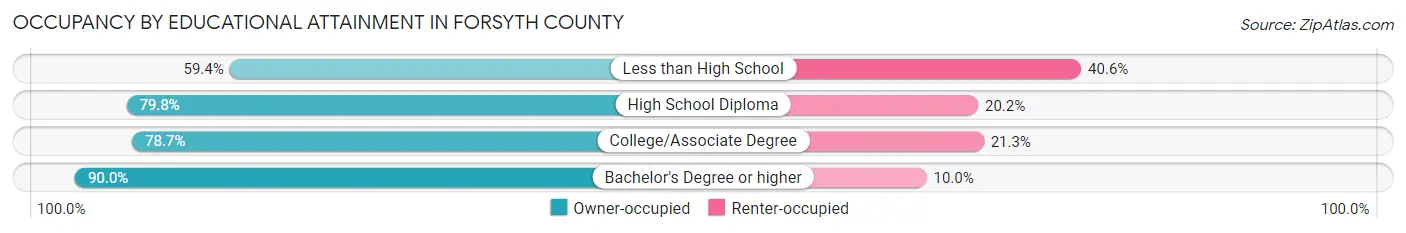
| Household Size | Owner-occupied | Renter-occupied |
| Less than High School | 2,103 (59.4%) | 1,440 (40.6%) |
| High School Diploma | 8,381 (79.8%) | 2,121 (20.2%) |
| College/Associate Degree | 15,455 (78.7%) | 4,187 (21.3%) |
| Bachelor's Degree or higher | 45,885 (90.0%) | 5,090 (10.0%) |
Occupancy by Age of Householder in Forsyth County
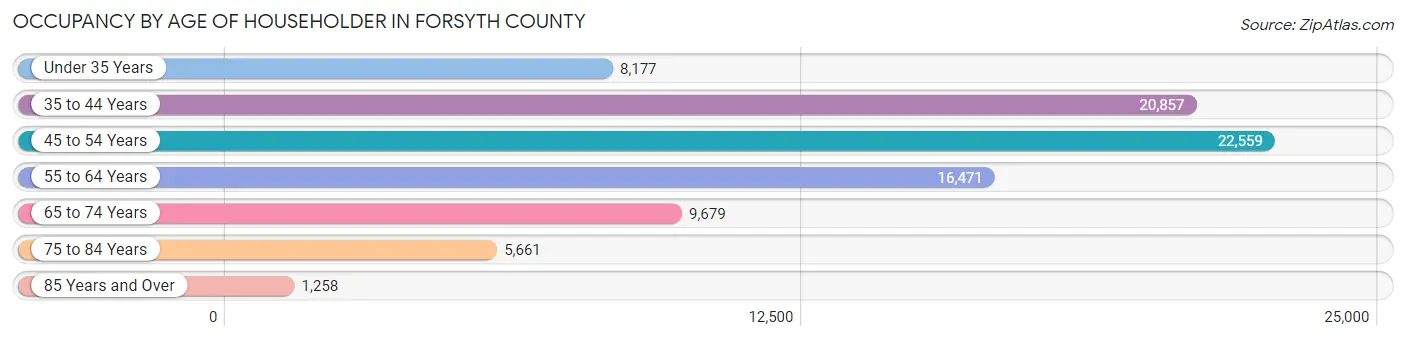
| Age Bracket | # Households | % Households |
| Under 35 Years | 8,177 | 9.7% |
| 35 to 44 Years | 20,857 | 24.6% |
| 45 to 54 Years | 22,559 | 26.7% |
| 55 to 64 Years | 16,471 | 19.5% |
| 65 to 74 Years | 9,679 | 11.4% |
| 75 to 84 Years | 5,661 | 6.7% |
| 85 Years and Over | 1,258 | 1.5% |
| Total | 84,662 | 100.0% |
Housing Finances in Forsyth County
Median Income by Occupancy in Forsyth County
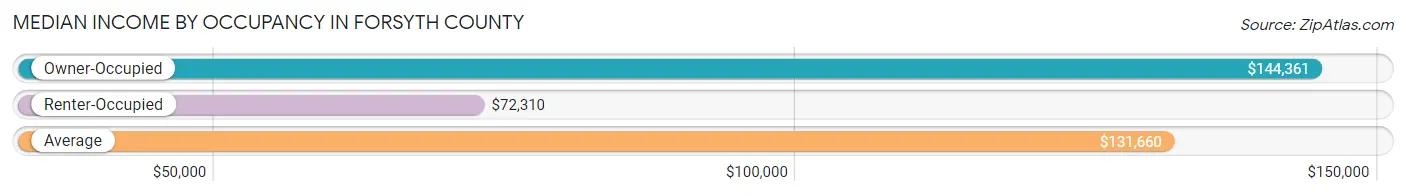
| Occupancy Type | # Households | Median Income |
| Owner-Occupied | 71,824 (84.8%) | $144,361 |
| Renter-Occupied | 12,838 (15.2%) | $72,310 |
| Average | 84,662 (100.0%) | $131,660 |
Occupancy by Householder Income Bracket in Forsyth County
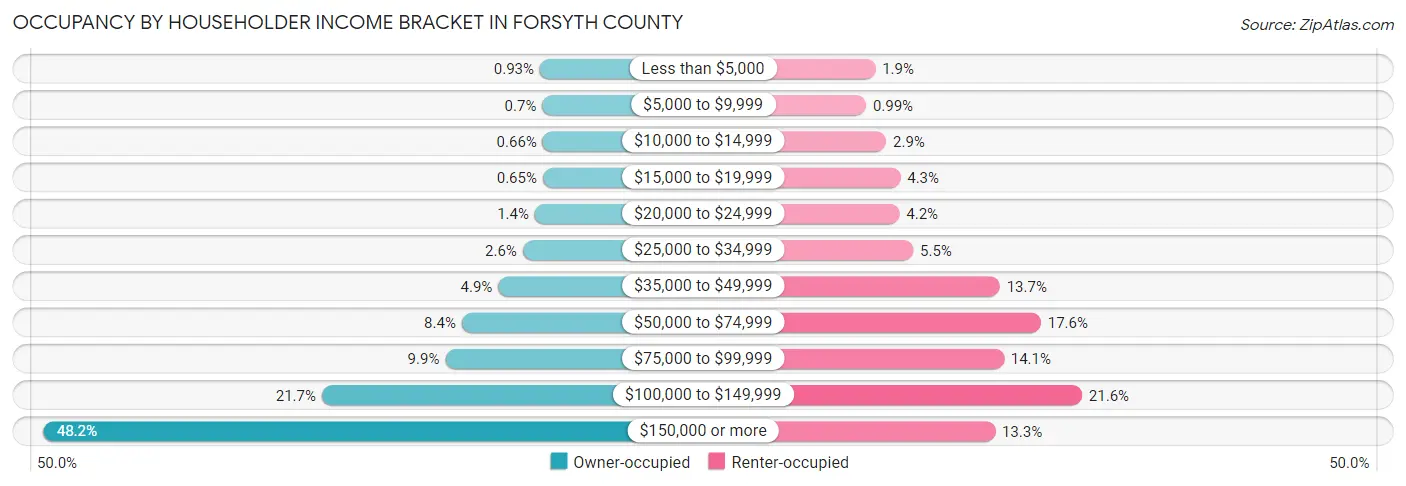
| Income Bracket | Owner-occupied | Renter-occupied |
| Less than $5,000 | 667 (0.9%) | 240 (1.9%) |
| $5,000 to $9,999 | 503 (0.7%) | 127 (1.0%) |
| $10,000 to $14,999 | 472 (0.7%) | 373 (2.9%) |
| $15,000 to $19,999 | 469 (0.6%) | 547 (4.3%) |
| $20,000 to $24,999 | 1,011 (1.4%) | 535 (4.2%) |
| $25,000 to $34,999 | 1,842 (2.6%) | 703 (5.5%) |
| $35,000 to $49,999 | 3,517 (4.9%) | 1,763 (13.7%) |
| $50,000 to $74,999 | 6,014 (8.4%) | 2,264 (17.6%) |
| $75,000 to $99,999 | 7,142 (9.9%) | 1,813 (14.1%) |
| $100,000 to $149,999 | 15,587 (21.7%) | 2,768 (21.6%) |
| $150,000 or more | 34,600 (48.2%) | 1,705 (13.3%) |
| Total | 71,824 (100.0%) | 12,838 (100.0%) |
Monthly Housing Cost Tiers in Forsyth County
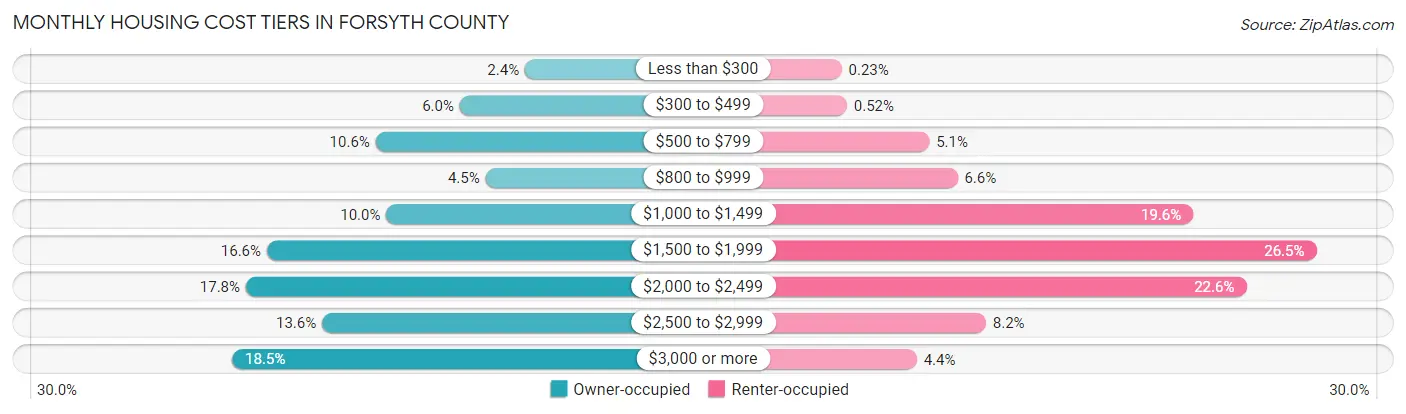
| Monthly Cost | Owner-occupied | Renter-occupied |
| Less than $300 | 1,698 (2.4%) | 30 (0.2%) |
| $300 to $499 | 4,278 (6.0%) | 67 (0.5%) |
| $500 to $799 | 7,617 (10.6%) | 651 (5.1%) |
| $800 to $999 | 3,263 (4.5%) | 851 (6.6%) |
| $1,000 to $1,499 | 7,198 (10.0%) | 2,521 (19.6%) |
| $1,500 to $1,999 | 11,940 (16.6%) | 3,396 (26.5%) |
| $2,000 to $2,499 | 12,771 (17.8%) | 2,899 (22.6%) |
| $2,500 to $2,999 | 9,745 (13.6%) | 1,053 (8.2%) |
| $3,000 or more | 13,314 (18.5%) | 562 (4.4%) |
| Total | 71,824 (100.0%) | 12,838 (100.0%) |
Physical Housing Characteristics in Forsyth County
Housing Structures in Forsyth County
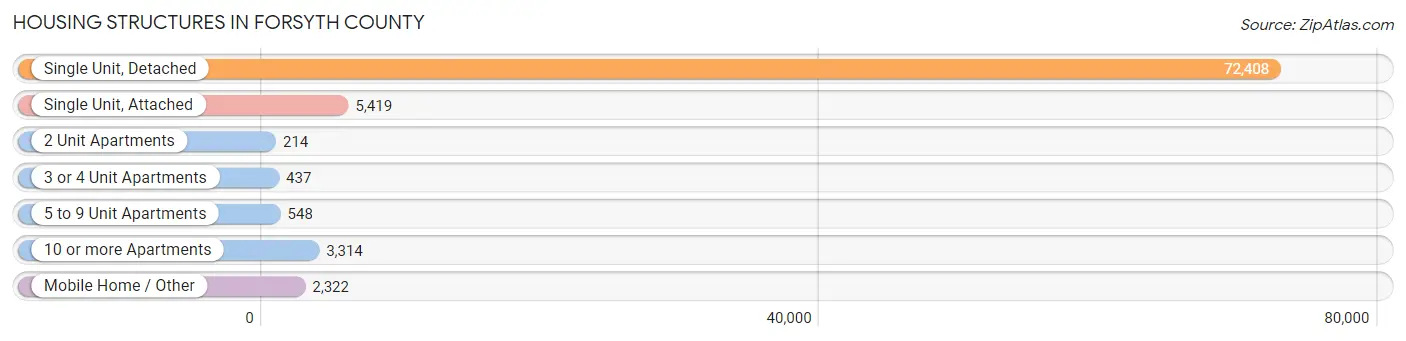
| Structure Type | # Housing Units | % Housing Units |
| Single Unit, Detached | 72,408 | 85.5% |
| Single Unit, Attached | 5,419 | 6.4% |
| 2 Unit Apartments | 214 | 0.3% |
| 3 or 4 Unit Apartments | 437 | 0.5% |
| 5 to 9 Unit Apartments | 548 | 0.6% |
| 10 or more Apartments | 3,314 | 3.9% |
| Mobile Home / Other | 2,322 | 2.7% |
| Total | 84,662 | 100.0% |
Housing Structures by Occupancy in Forsyth County
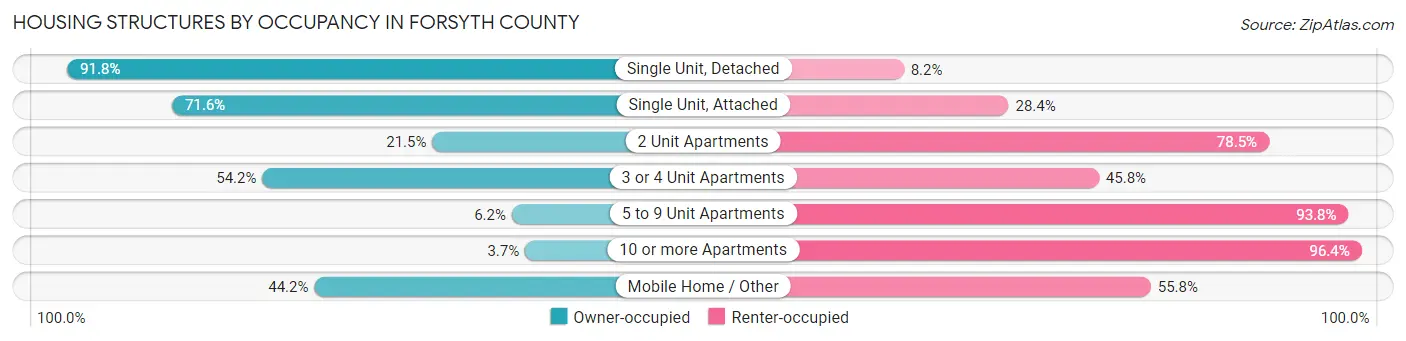
| Structure Type | Owner-occupied | Renter-occupied |
| Single Unit, Detached | 66,478 (91.8%) | 5,930 (8.2%) |
| Single Unit, Attached | 3,881 (71.6%) | 1,538 (28.4%) |
| 2 Unit Apartments | 46 (21.5%) | 168 (78.5%) |
| 3 or 4 Unit Apartments | 237 (54.2%) | 200 (45.8%) |
| 5 to 9 Unit Apartments | 34 (6.2%) | 514 (93.8%) |
| 10 or more Apartments | 121 (3.6%) | 3,193 (96.4%) |
| Mobile Home / Other | 1,027 (44.2%) | 1,295 (55.8%) |
| Total | 71,824 (84.8%) | 12,838 (15.2%) |
Housing Structures by Number of Rooms in Forsyth County
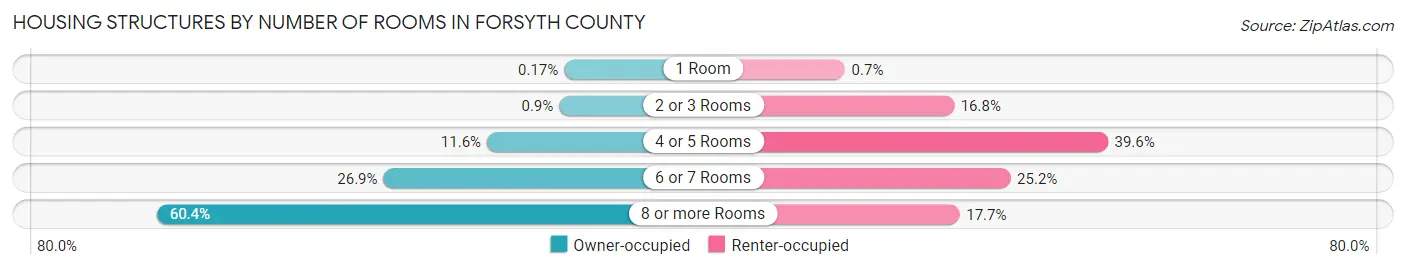
| Number of Rooms | Owner-occupied | Renter-occupied |
| 1 Room | 119 (0.2%) | 90 (0.7%) |
| 2 or 3 Rooms | 647 (0.9%) | 2,162 (16.8%) |
| 4 or 5 Rooms | 8,327 (11.6%) | 5,084 (39.6%) |
| 6 or 7 Rooms | 19,326 (26.9%) | 3,234 (25.2%) |
| 8 or more Rooms | 43,405 (60.4%) | 2,268 (17.7%) |
| Total | 71,824 (100.0%) | 12,838 (100.0%) |
Housing Structure by Heating Type in Forsyth County
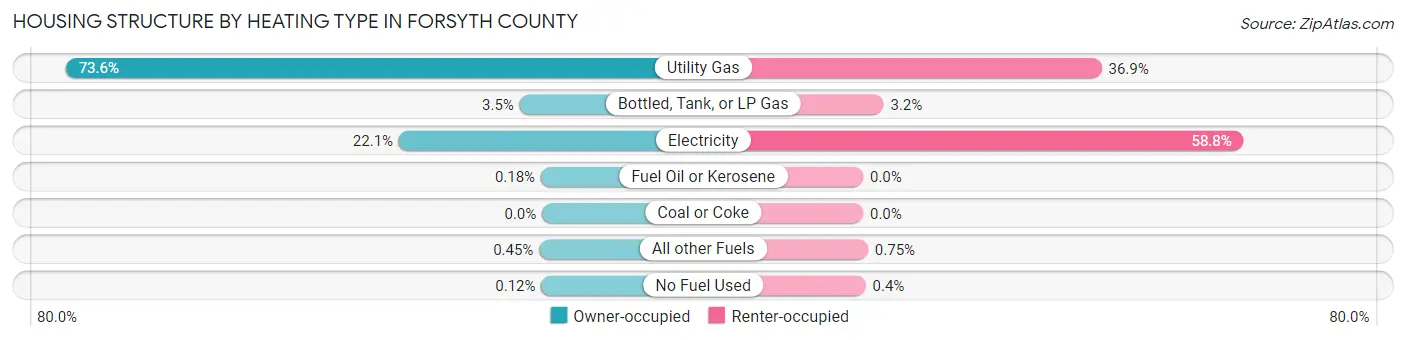
| Heating Type | Owner-occupied | Renter-occupied |
| Utility Gas | 52,892 (73.6%) | 4,733 (36.9%) |
| Bottled, Tank, or LP Gas | 2,494 (3.5%) | 407 (3.2%) |
| Electricity | 15,899 (22.1%) | 7,551 (58.8%) |
| Fuel Oil or Kerosene | 129 (0.2%) | 0 (0.0%) |
| Coal or Coke | 0 (0.0%) | 0 (0.0%) |
| All other Fuels | 325 (0.4%) | 96 (0.7%) |
| No Fuel Used | 85 (0.1%) | 51 (0.4%) |
| Total | 71,824 (100.0%) | 12,838 (100.0%) |
Household Vehicle Usage in Forsyth County
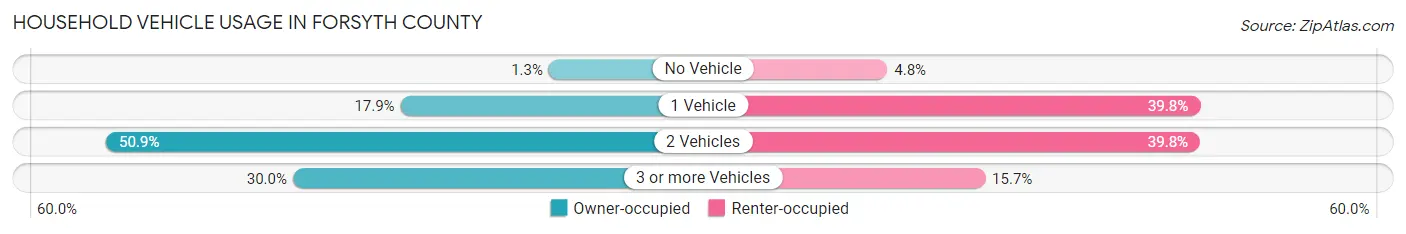
| Vehicles per Household | Owner-occupied | Renter-occupied |
| No Vehicle | 916 (1.3%) | 610 (4.8%) |
| 1 Vehicle | 12,854 (17.9%) | 5,106 (39.8%) |
| 2 Vehicles | 36,537 (50.9%) | 5,105 (39.8%) |
| 3 or more Vehicles | 21,517 (30.0%) | 2,017 (15.7%) |
| Total | 71,824 (100.0%) | 12,838 (100.0%) |
Real Estate & Mortgages in Forsyth County
Real Estate and Mortgage Overview in Forsyth County
| Characteristic | Without Mortgage | With Mortgage |
| Housing Units | 16,852 | 54,972 |
| Median Property Value | $416,700 | $460,600 |
| Median Household Income | $100,586 | $29,473 |
| Monthly Housing Costs | $601 | $13,301 |
| Real Estate Taxes | $2,314 | $442 |
Property Value by Mortgage Status in Forsyth County
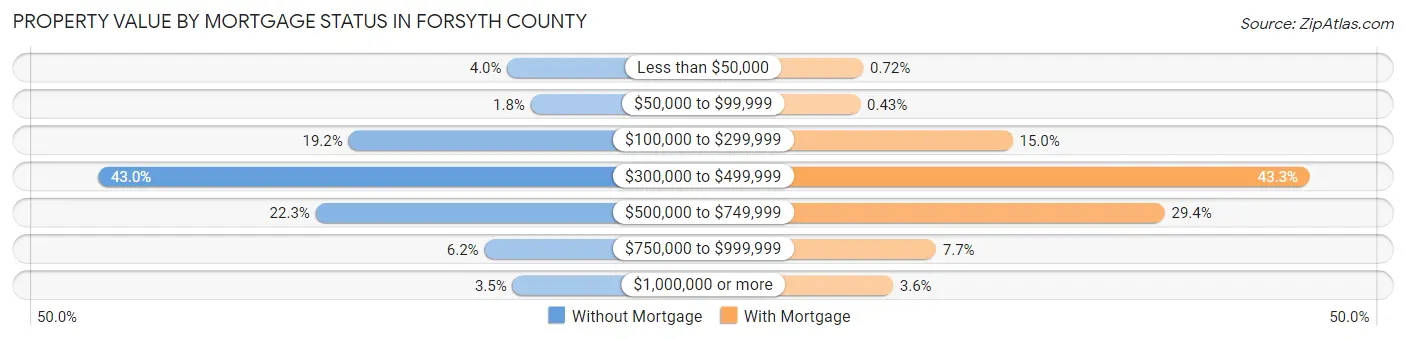
| Property Value | Without Mortgage | With Mortgage |
| Less than $50,000 | 677 (4.0%) | 395 (0.7%) |
| $50,000 to $99,999 | 303 (1.8%) | 236 (0.4%) |
| $100,000 to $299,999 | 3,227 (19.2%) | 8,220 (14.9%) |
| $300,000 to $499,999 | 7,248 (43.0%) | 23,786 (43.3%) |
| $500,000 to $749,999 | 3,755 (22.3%) | 16,177 (29.4%) |
| $750,000 to $999,999 | 1,047 (6.2%) | 4,204 (7.6%) |
| $1,000,000 or more | 595 (3.5%) | 1,954 (3.5%) |
| Total | 16,852 (100.0%) | 54,972 (100.0%) |
Household Income by Mortgage Status in Forsyth County
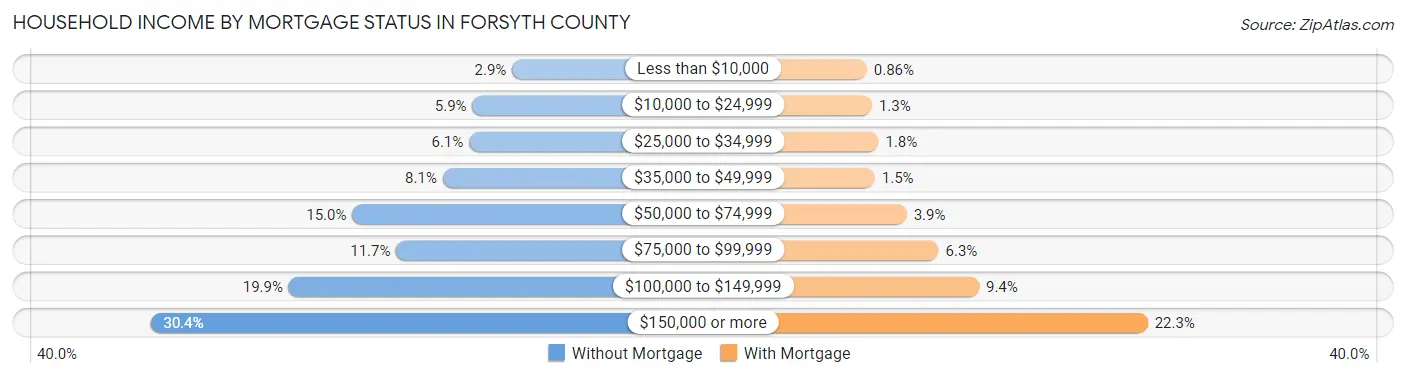
| Household Income | Without Mortgage | With Mortgage |
| Less than $10,000 | 481 (2.9%) | 475 (0.9%) |
| $10,000 to $24,999 | 991 (5.9%) | 689 (1.3%) |
| $25,000 to $34,999 | 1,033 (6.1%) | 961 (1.8%) |
| $35,000 to $49,999 | 1,371 (8.1%) | 809 (1.5%) |
| $50,000 to $74,999 | 2,533 (15.0%) | 2,146 (3.9%) |
| $75,000 to $99,999 | 1,968 (11.7%) | 3,481 (6.3%) |
| $100,000 to $149,999 | 3,348 (19.9%) | 5,174 (9.4%) |
| $150,000 or more | 5,127 (30.4%) | 12,239 (22.3%) |
| Total | 16,852 (100.0%) | 54,972 (100.0%) |
Property Value to Household Income Ratio in Forsyth County
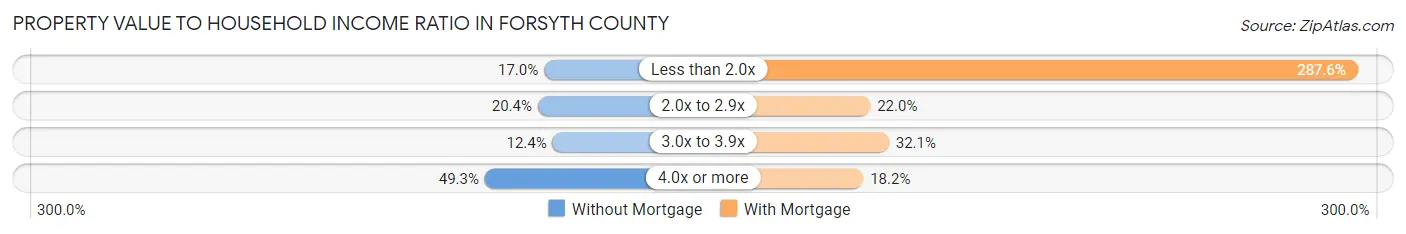
| Value-to-Income Ratio | Without Mortgage | With Mortgage |
| Less than 2.0x | 2,860 (17.0%) | 158,072 (287.6%) |
| 2.0x to 2.9x | 3,440 (20.4%) | 12,074 (22.0%) |
| 3.0x to 3.9x | 2,084 (12.4%) | 17,630 (32.1%) |
| 4.0x or more | 8,299 (49.2%) | 9,981 (18.2%) |
| Total | 16,852 (100.0%) | 54,972 (100.0%) |
Real Estate Taxes by Mortgage Status in Forsyth County
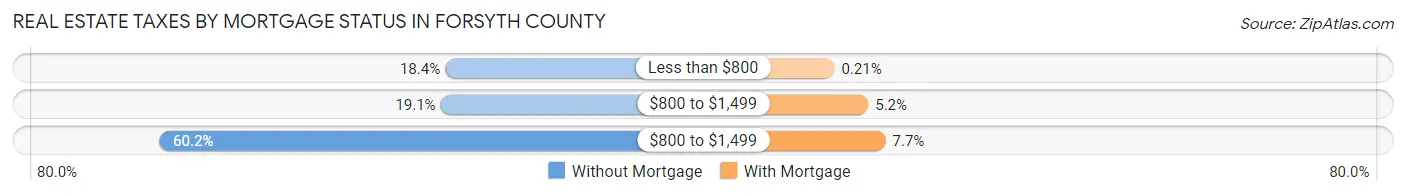
| Property Taxes | Without Mortgage | With Mortgage |
| Less than $800 | 3,105 (18.4%) | 117 (0.2%) |
| $800 to $1,499 | 3,217 (19.1%) | 2,833 (5.1%) |
| $800 to $1,499 | 10,144 (60.2%) | 4,223 (7.7%) |
| Total | 16,852 (100.0%) | 54,972 (100.0%) |
Health & Disability in Forsyth County
Health Insurance Coverage by Age in Forsyth County
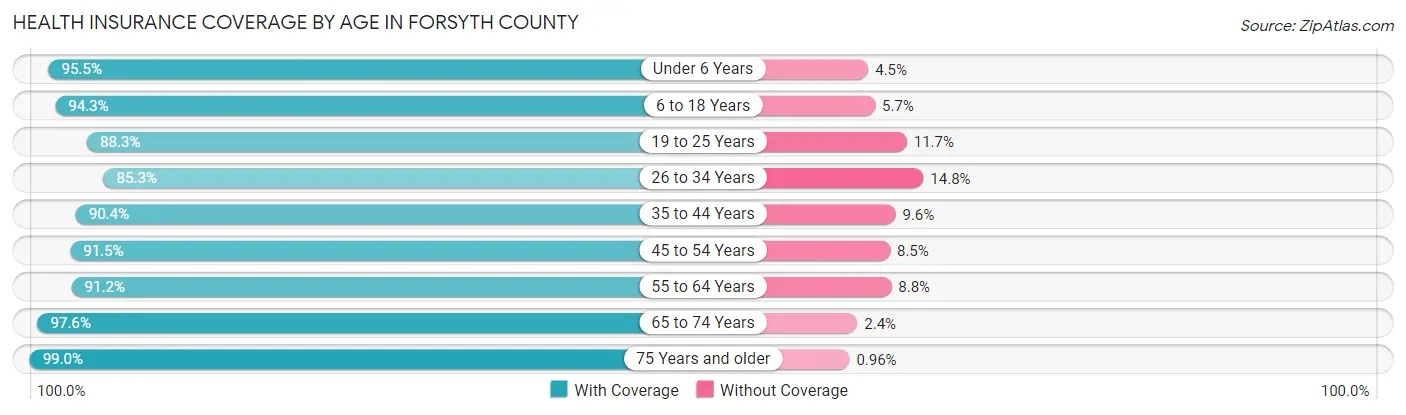
| Age Bracket | With Coverage | Without Coverage |
| Under 6 Years | 16,675 (95.5%) | 781 (4.5%) |
| 6 to 18 Years | 50,145 (94.3%) | 3,055 (5.7%) |
| 19 to 25 Years | 16,267 (88.3%) | 2,148 (11.7%) |
| 26 to 34 Years | 18,382 (85.3%) | 3,181 (14.7%) |
| 35 to 44 Years | 36,911 (90.4%) | 3,900 (9.6%) |
| 45 to 54 Years | 37,817 (91.5%) | 3,528 (8.5%) |
| 55 to 64 Years | 26,352 (91.2%) | 2,535 (8.8%) |
| 65 to 74 Years | 17,941 (97.6%) | 447 (2.4%) |
| 75 Years and older | 12,238 (99.0%) | 119 (1.0%) |
| Total | 232,728 (92.2%) | 19,694 (7.8%) |
Health Insurance Coverage by Citizenship Status in Forsyth County
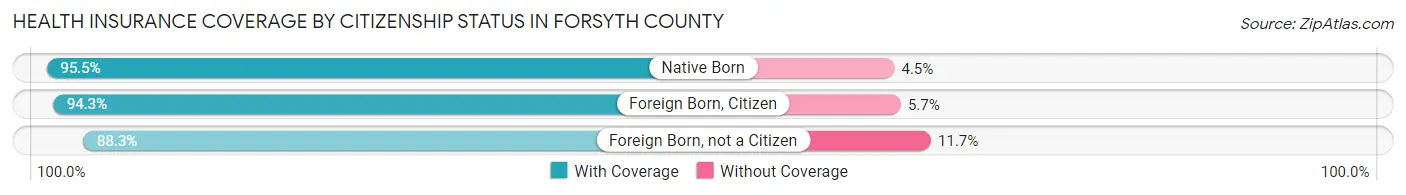
| Citizenship Status | With Coverage | Without Coverage |
| Native Born | 16,675 (95.5%) | 781 (4.5%) |
| Foreign Born, Citizen | 50,145 (94.3%) | 3,055 (5.7%) |
| Foreign Born, not a Citizen | 16,267 (88.3%) | 2,148 (11.7%) |
Health Insurance Coverage by Household Income in Forsyth County
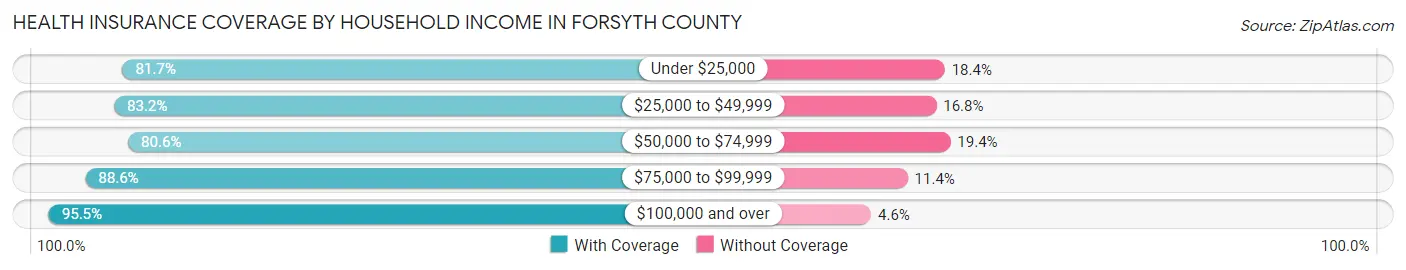
| Household Income | With Coverage | Without Coverage |
| Under $25,000 | 8,421 (81.7%) | 1,892 (18.3%) |
| $25,000 to $49,999 | 13,056 (83.2%) | 2,628 (16.8%) |
| $50,000 to $74,999 | 17,050 (80.6%) | 4,106 (19.4%) |
| $75,000 to $99,999 | 21,779 (88.6%) | 2,802 (11.4%) |
| $100,000 and over | 172,297 (95.5%) | 8,205 (4.5%) |
Public vs Private Health Insurance Coverage by Age in Forsyth County

| Age Bracket | Public Insurance | Private Insurance |
| Under 6 | 2,504 (14.3%) | 14,549 (83.4%) |
| 6 to 18 Years | 6,015 (11.3%) | 45,310 (85.2%) |
| 19 to 25 Years | 1,052 (5.7%) | 15,611 (84.8%) |
| 25 to 34 Years | 685 (3.2%) | 17,932 (83.2%) |
| 35 to 44 Years | 1,420 (3.5%) | 35,907 (88.0%) |
| 45 to 54 Years | 1,747 (4.2%) | 37,055 (89.6%) |
| 55 to 64 Years | 1,753 (6.1%) | 25,097 (86.9%) |
| 65 to 74 Years | 16,902 (91.9%) | 10,679 (58.1%) |
| 75 Years and over | 12,122 (98.1%) | 7,528 (60.9%) |
| Total | 44,200 (17.5%) | 209,668 (83.1%) |
Disability Status by Sex by Age in Forsyth County
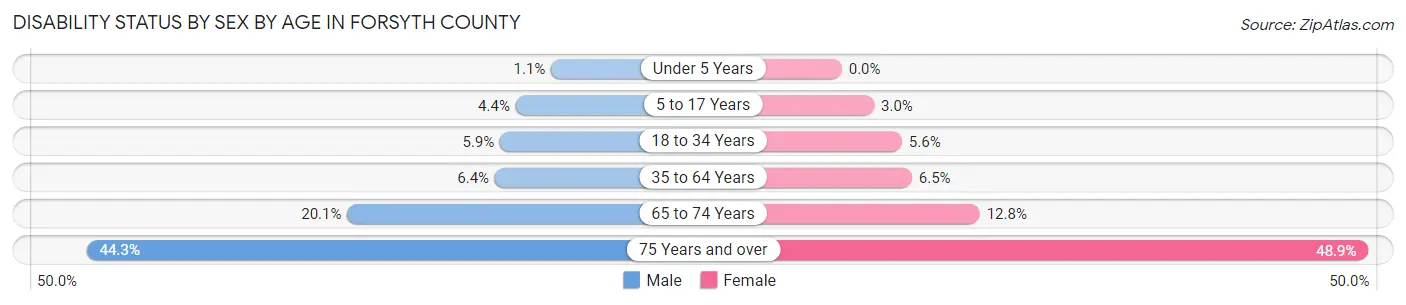
| Age Bracket | Male | Female |
| Under 5 Years | 81 (1.1%) | 0 (0.0%) |
| 5 to 17 Years | 1,193 (4.4%) | 773 (3.0%) |
| 18 to 34 Years | 1,283 (5.9%) | 1,223 (5.6%) |
| 35 to 64 Years | 3,582 (6.4%) | 3,548 (6.5%) |
| 65 to 74 Years | 1,717 (20.1%) | 1,257 (12.8%) |
| 75 Years and over | 2,311 (44.3%) | 3,486 (48.9%) |
Disability Class by Sex by Age in Forsyth County
Disability Class: Hearing Difficulty
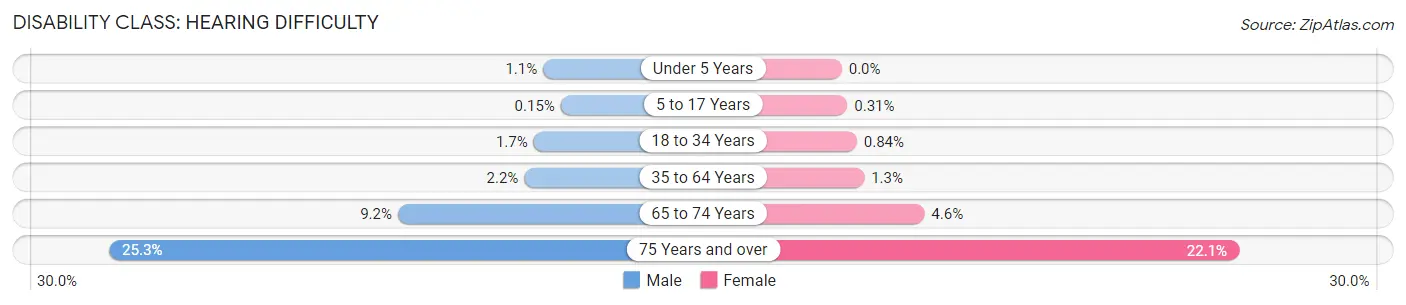
| Age Bracket | Male | Female |
| Under 5 Years | 81 (1.1%) | 0 (0.0%) |
| 5 to 17 Years | 40 (0.2%) | 81 (0.3%) |
| 18 to 34 Years | 362 (1.7%) | 184 (0.8%) |
| 35 to 64 Years | 1,229 (2.2%) | 681 (1.3%) |
| 65 to 74 Years | 790 (9.2%) | 452 (4.6%) |
| 75 Years and over | 1,321 (25.3%) | 1,577 (22.1%) |
Disability Class: Vision Difficulty
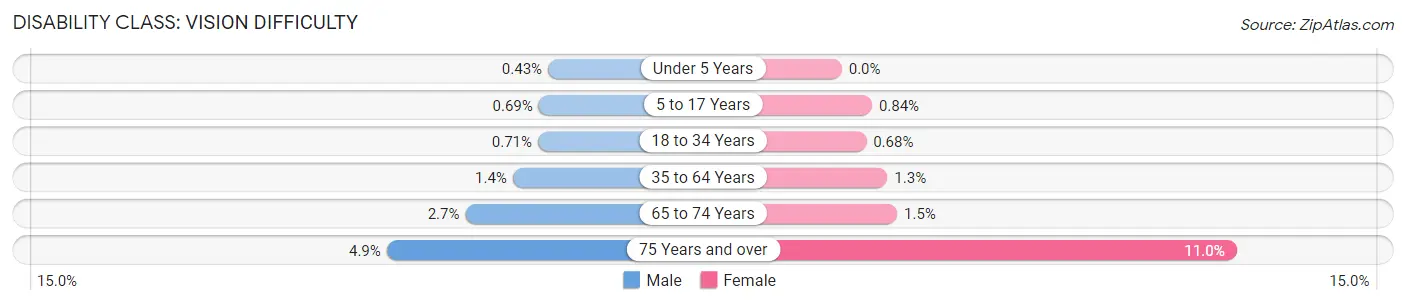
| Age Bracket | Male | Female |
| Under 5 Years | 31 (0.4%) | 0 (0.0%) |
| 5 to 17 Years | 187 (0.7%) | 217 (0.8%) |
| 18 to 34 Years | 156 (0.7%) | 150 (0.7%) |
| 35 to 64 Years | 796 (1.4%) | 692 (1.3%) |
| 65 to 74 Years | 234 (2.7%) | 151 (1.5%) |
| 75 Years and over | 257 (4.9%) | 784 (11.0%) |
Disability Class: Cognitive Difficulty
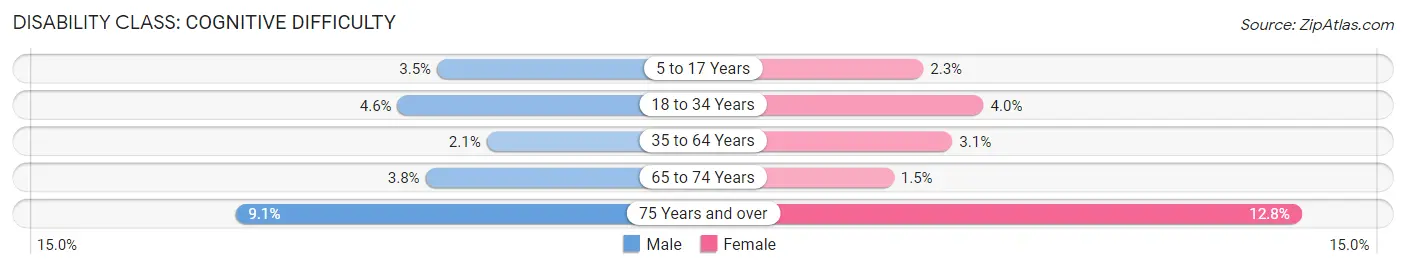
| Age Bracket | Male | Female |
| 5 to 17 Years | 951 (3.5%) | 584 (2.3%) |
| 18 to 34 Years | 1,010 (4.6%) | 865 (4.0%) |
| 35 to 64 Years | 1,208 (2.1%) | 1,682 (3.1%) |
| 65 to 74 Years | 329 (3.8%) | 142 (1.5%) |
| 75 Years and over | 477 (9.1%) | 913 (12.8%) |
Disability Class: Ambulatory Difficulty
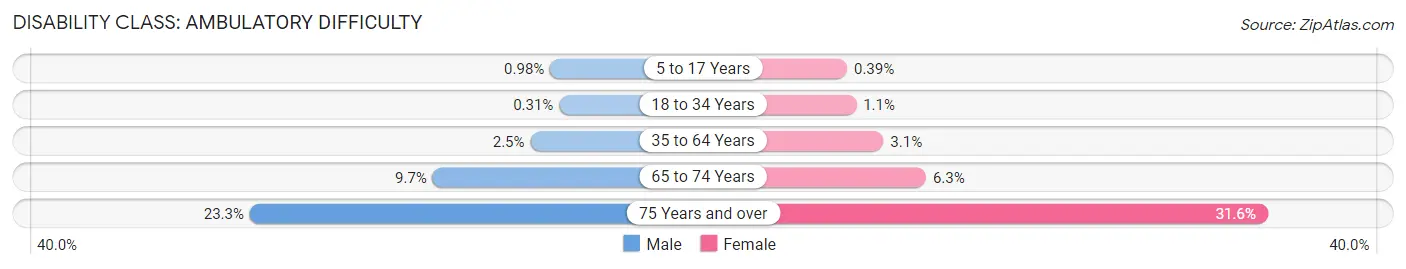
| Age Bracket | Male | Female |
| 5 to 17 Years | 264 (1.0%) | 100 (0.4%) |
| 18 to 34 Years | 67 (0.3%) | 234 (1.1%) |
| 35 to 64 Years | 1,381 (2.5%) | 1,689 (3.1%) |
| 65 to 74 Years | 831 (9.7%) | 614 (6.2%) |
| 75 Years and over | 1,216 (23.3%) | 2,256 (31.6%) |
Disability Class: Self-Care Difficulty
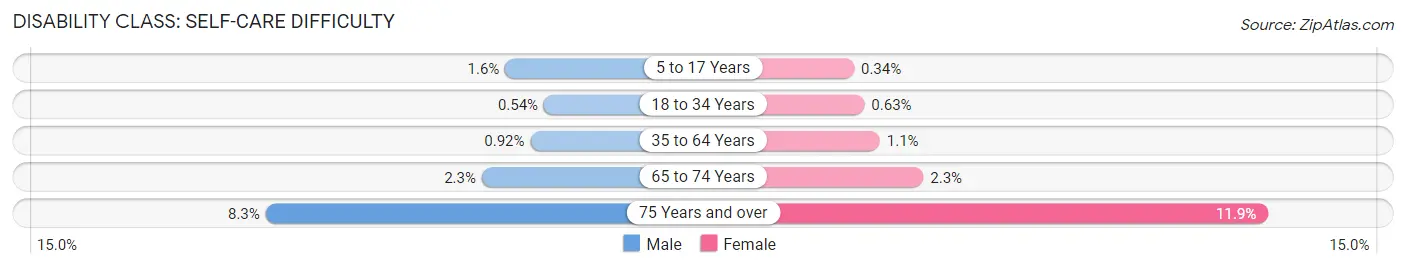
| Age Bracket | Male | Female |
| 5 to 17 Years | 436 (1.6%) | 88 (0.3%) |
| 18 to 34 Years | 119 (0.5%) | 137 (0.6%) |
| 35 to 64 Years | 519 (0.9%) | 580 (1.1%) |
| 65 to 74 Years | 194 (2.3%) | 223 (2.3%) |
| 75 Years and over | 433 (8.3%) | 847 (11.9%) |
Technology Access in Forsyth County
Computing Device Access in Forsyth County
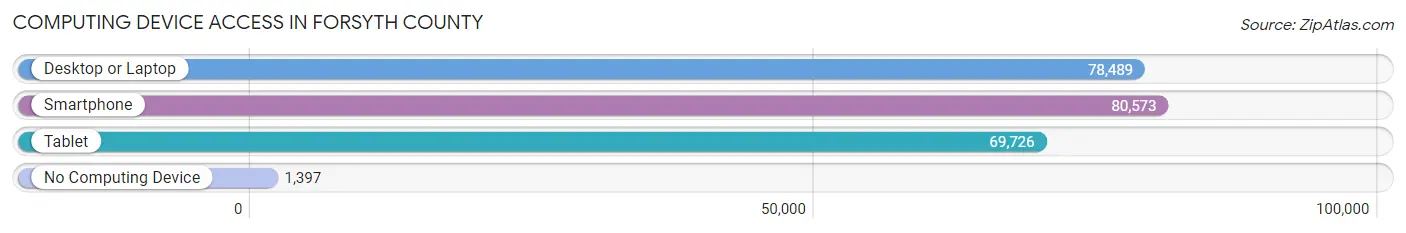
| Device Type | # Households | % Households |
| Desktop or Laptop | 78,489 | 92.7% |
| Smartphone | 80,573 | 95.2% |
| Tablet | 69,726 | 82.4% |
| No Computing Device | 1,397 | 1.7% |
| Total | 84,662 | 100.0% |
Internet Access in Forsyth County
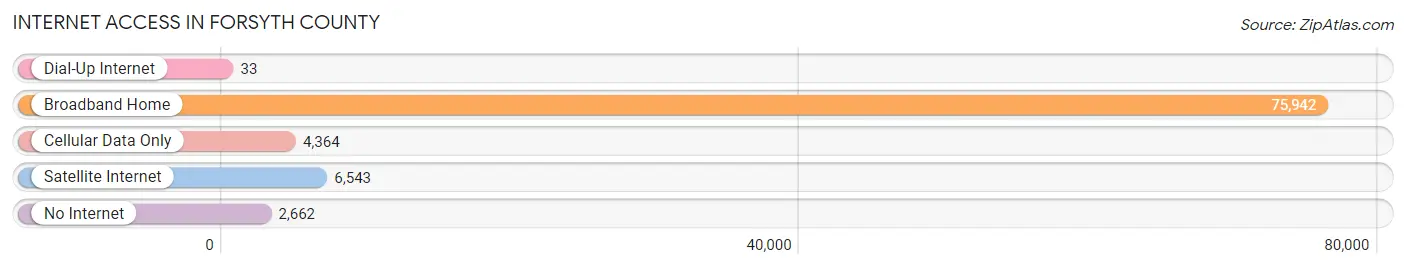
| Internet Type | # Households | % Households |
| Dial-Up Internet | 33 | 0.0% |
| Broadband Home | 75,942 | 89.7% |
| Cellular Data Only | 4,364 | 5.1% |
| Satellite Internet | 6,543 | 7.7% |
| No Internet | 2,662 | 3.1% |
| Total | 84,662 | 100.0% |
Forsyth County Summary
Forsyth County, Georgia is located in the north-central part of the state, about 40 miles north of Atlanta. It is part of the Atlanta metropolitan area and is bordered by Hall, Dawson, Lumpkin, and Cherokee counties. The county seat is Cumming, and the county has a population of over 200,000 people.
History
Forsyth County was created in 1832 from parts of Cherokee and Hall counties. It was named after John Forsyth, who served as Governor of Georgia from 1827 to 1829. The county was originally inhabited by the Cherokee and Creek Native American tribes. In 1838, the Cherokee were forced to leave the area as part of the Trail of Tears.
In the late 19th century, the county became a popular destination for wealthy families from Atlanta and other parts of the state. The county was known for its mineral springs, which were believed to have healing properties. The county also became a popular destination for wealthy families from other parts of the country.
In the early 20th century, the county experienced a period of rapid growth. The population increased from just over 5,000 in 1900 to over 20,000 in 1930. This growth was largely due to the development of the county’s agricultural and industrial sectors.
Geography
Forsyth County is located in the foothills of the Blue Ridge Mountains. The county is mostly rural, with rolling hills and forests. The county is home to several lakes, including Lake Lanier, which is the largest lake in the state. The county is also home to several state parks, including Sawnee Mountain Preserve and Big Creek State Park.
Economy
Forsyth County’s economy is largely based on agriculture and manufacturing. The county is home to several large agricultural operations, including poultry farms and dairy farms. The county is also home to several large manufacturing companies, including carpet and textile manufacturers.
The county is also home to several large retail and commercial businesses. The county is home to several large shopping malls, including The Collection at Forsyth and The Avenue Forsyth. The county is also home to several large corporate headquarters, including the headquarters of the Home Depot and the United Parcel Service.
Demographics
As of the 2010 census, Forsyth County had a population of 175,511. The racial makeup of the county was 79.3% White, 11.3% African American, 0.3% Native American, 4.2% Asian, 0.1% Pacific Islander, 2.7% from other races, and 2.3% from two or more races. Hispanic or Latino of any race were 8.2% of the population.
The median income for a household in the county was $60,872, and the median income for a family was $71,837. The per capita income for the county was $30,945. About 8.2% of families and 11.2% of the population were below the poverty line, including 15.2% of those under age 18 and 8.2% of those age 65 or over.
Common Questions
What is the Total Population of Forsyth County?
Total Population of Forsyth County is 253,225.
What is the Total Male Population of Forsyth County?
Total Male Population of Forsyth County is 126,773.
What is the Total Female Population of Forsyth County?
Total Female Population of Forsyth County is 126,452.
What is the Ratio of Males per 100 Females in Forsyth County?
There are 100.25 Males per 100 Females in Forsyth County.
What is the Ratio of Females per 100 Males in Forsyth County?
There are 99.75 Females per 100 Males in Forsyth County.
What is the Median Population Age in Forsyth County?
Median Population Age in Forsyth County is 39.2 Years.
What is the Average Family Size in Forsyth County
Average Family Size in Forsyth County is 3.3 People.
What is the Average Household Size in Forsyth County
Average Household Size in Forsyth County is 3.0 People.
What is Per Capita Income in Forsyth County?
Per Capita income in Forsyth County is $54,002.
What is the Median Family Income in Forsyth County?
Median Family Income in Forsyth County is $144,747.
What is the Median Household income in Forsyth County?
Median Household Income in Forsyth County is $131,660.
What is Income or Wage Gap in Forsyth County?
Income or Wage Gap in Forsyth County is 44.1%.
Women in Forsyth County earn 55.9 cents for every dollar earned by a man.
What is Family Income Deficit in Forsyth County?
Family Income Deficit in Forsyth County is $11,638.
Families that are below poverty line in Forsyth County earn $11,638 less on average than the poverty threshold level.
What is Inequality or Gini Index in Forsyth County?
Inequality or Gini Index in Forsyth County is 0.39.
How Large is the Labor Force in Forsyth County?
There are 135,435 People in the Labor Forcein in Forsyth County.
What is the Percentage of People in the Labor Force in Forsyth County?
69.6% of People are in the Labor Force in Forsyth County.
What is the Unemployment Rate in Forsyth County?
Unemployment Rate in Forsyth County is 3.7%.