Whitfield County, GA
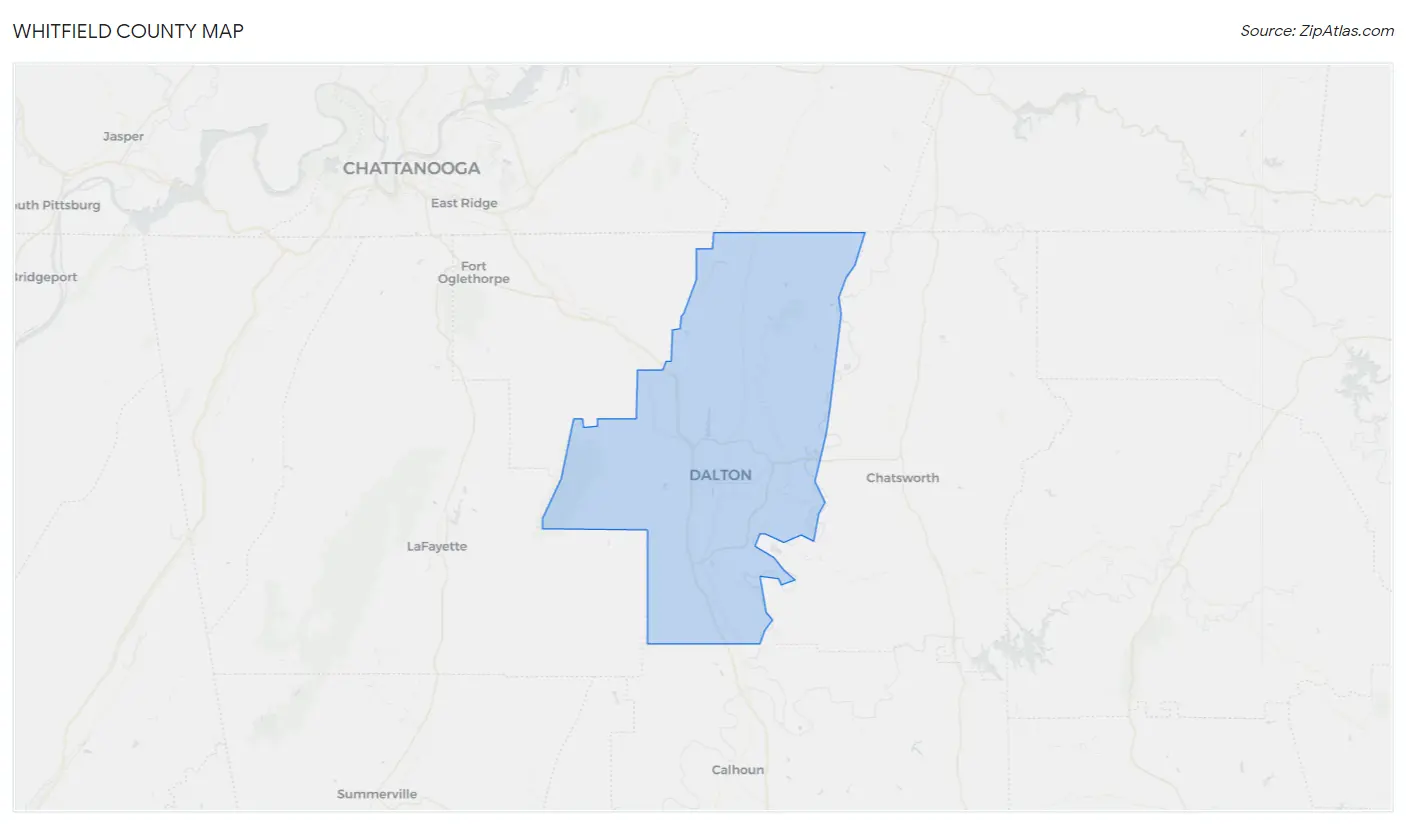
Whitfield County Map
Whitfield County Overview
103,033
TOTAL POPULATION
51,768
MALE POPULATION
51,265
FEMALE POPULATION
100.98
MALES / 100 FEMALES
99.03
FEMALES / 100 MALES
36.4
MEDIAN AGE
3.4
AVG FAMILY SIZE
2.8
AVG HOUSEHOLD SIZE
$28,594
PER CAPITA INCOME
$69,315
AVG FAMILY INCOME
$59,659
AVG HOUSEHOLD INCOME
26.0%
WAGE / INCOME GAP [ % ]
74.0¢/ $1
WAGE / INCOME GAP [ $ ]
$9,911
FAMILY INCOME DEFICIT
0.44
INEQUALITY / GINI INDEX
50,253
LABOR FORCE [ PEOPLE ]
63.0%
PERCENT IN LABOR FORCE
5.7%
UNEMPLOYMENT RATE
Race in Whitfield County
The most populous races in Whitfield County are White / Caucasian (79,165 | 76.8%), Hispanic or Latino (37,885 | 36.8%), and Some other Race (9,269 | 9.0%).
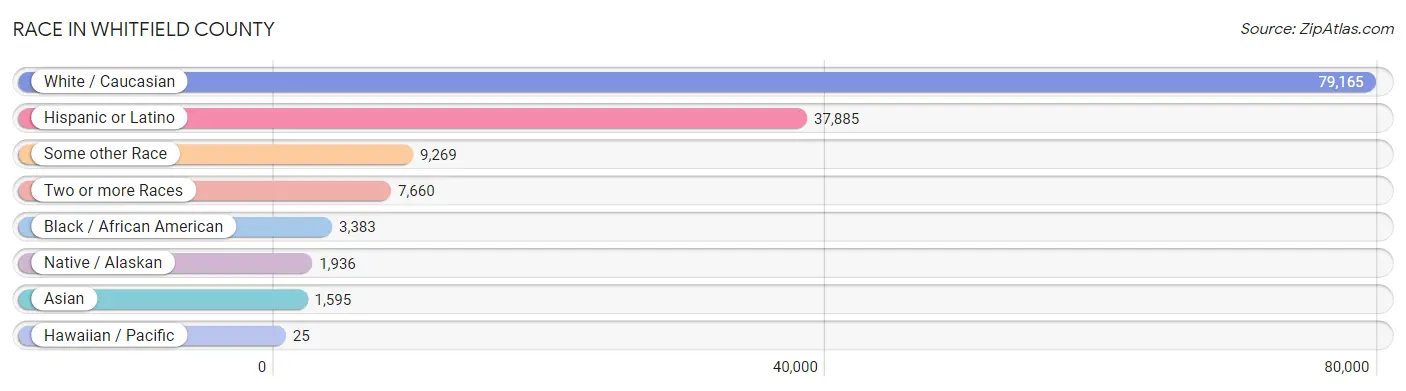
| Race | # Population | % Population |
| Asian | 1,595 | 1.5% |
| Black / African American | 3,383 | 3.3% |
| Hawaiian / Pacific | 25 | 0.0% |
| Hispanic or Latino | 37,885 | 36.8% |
| Native / Alaskan | 1,936 | 1.9% |
| White / Caucasian | 79,165 | 76.8% |
| Two or more Races | 7,660 | 7.4% |
| Some other Race | 9,269 | 9.0% |
| Total | 103,033 | 100.0% |
Ancestry in Whitfield County
The most populous ancestries reported in Whitfield County are Mexican (30,209 | 29.3%), English (22,822 | 22.2%), American (7,520 | 7.3%), Irish (6,355 | 6.2%), and Central American (4,687 | 4.5%), together accounting for 69.5% of all Whitfield County residents.
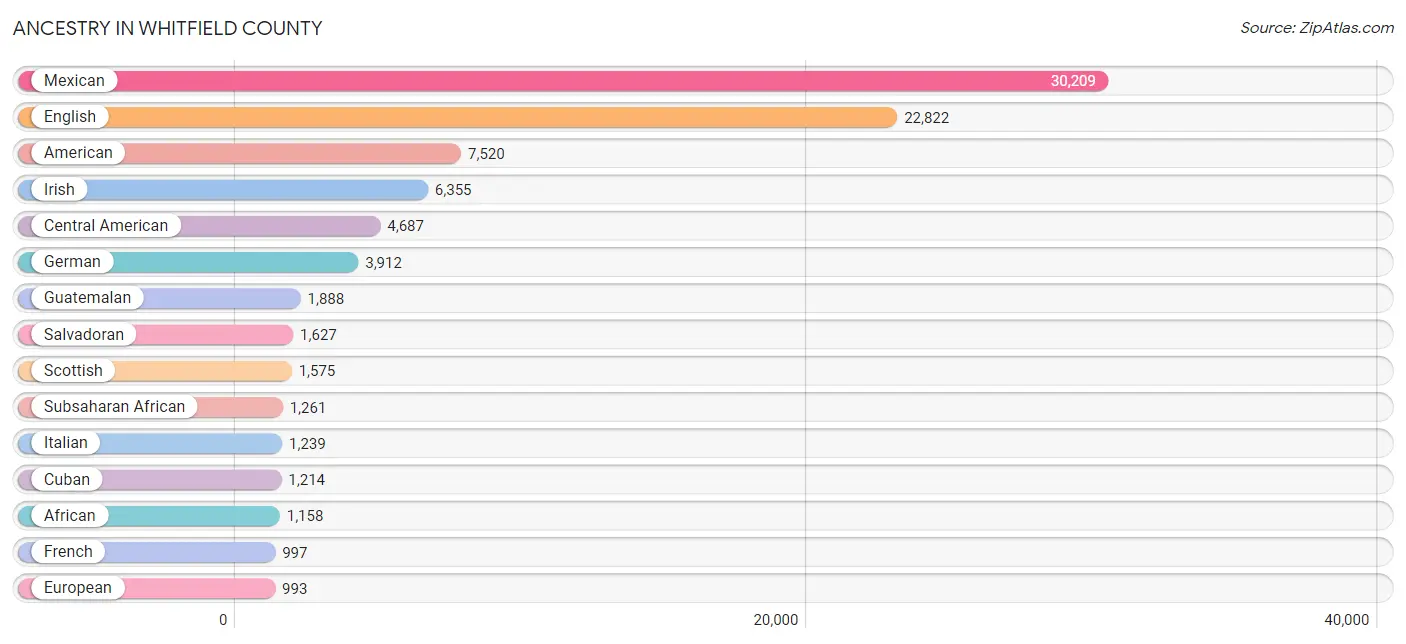
| Ancestry | # Population | % Population |
| African | 1,158 | 1.1% |
| American | 7,520 | 7.3% |
| Arab | 52 | 0.1% |
| Austrian | 37 | 0.0% |
| Barbadian | 11 | 0.0% |
| Belgian | 29 | 0.0% |
| Bhutanese | 178 | 0.2% |
| British | 474 | 0.5% |
| Burmese | 316 | 0.3% |
| Canadian | 67 | 0.1% |
| Central American | 4,687 | 4.5% |
| Central American Indian | 725 | 0.7% |
| Cherokee | 410 | 0.4% |
| Choctaw | 4 | 0.0% |
| Colombian | 181 | 0.2% |
| Costa Rican | 191 | 0.2% |
| Creek | 5 | 0.0% |
| Cuban | 1,214 | 1.2% |
| Czech | 9 | 0.0% |
| Danish | 25 | 0.0% |
| Dominican | 356 | 0.4% |
| Dutch | 409 | 0.4% |
| Eastern European | 211 | 0.2% |
| Ecuadorian | 51 | 0.1% |
| English | 22,822 | 22.2% |
| European | 993 | 1.0% |
| Finnish | 22 | 0.0% |
| French | 997 | 1.0% |
| French Canadian | 11 | 0.0% |
| German | 3,912 | 3.8% |
| Greek | 35 | 0.0% |
| Guamanian / Chamorro | 28 | 0.0% |
| Guatemalan | 1,888 | 1.8% |
| Haitian | 7 | 0.0% |
| Honduran | 643 | 0.6% |
| Hungarian | 105 | 0.1% |
| Indian (Asian) | 189 | 0.2% |
| Irish | 6,355 | 6.2% |
| Italian | 1,239 | 1.2% |
| Jamaican | 71 | 0.1% |
| Korean | 111 | 0.1% |
| Lebanese | 34 | 0.0% |
| Lithuanian | 38 | 0.0% |
| Mexican | 30,209 | 29.3% |
| Mexican American Indian | 659 | 0.6% |
| Moroccan | 3 | 0.0% |
| Native Hawaiian | 51 | 0.1% |
| Navajo | 1 | 0.0% |
| Nicaraguan | 278 | 0.3% |
| Nigerian | 22 | 0.0% |
| Northern European | 60 | 0.1% |
| Norwegian | 57 | 0.1% |
| Pakistani | 25 | 0.0% |
| Pennsylvania German | 18 | 0.0% |
| Peruvian | 54 | 0.1% |
| Polish | 299 | 0.3% |
| Portuguese | 30 | 0.0% |
| Puerto Rican | 678 | 0.7% |
| Romanian | 21 | 0.0% |
| Russian | 38 | 0.0% |
| Salvadoran | 1,627 | 1.6% |
| Samoan | 14 | 0.0% |
| Scandinavian | 102 | 0.1% |
| Scotch-Irish | 531 | 0.5% |
| Scottish | 1,575 | 1.5% |
| South African | 53 | 0.1% |
| South American | 469 | 0.5% |
| South American Indian | 15 | 0.0% |
| Spaniard | 36 | 0.0% |
| Sri Lankan | 387 | 0.4% |
| Subsaharan African | 1,261 | 1.2% |
| Swedish | 508 | 0.5% |
| Swiss | 49 | 0.1% |
| Thai | 481 | 0.5% |
| Trinidadian and Tobagonian | 7 | 0.0% |
| Turkish | 52 | 0.1% |
| Ukrainian | 19 | 0.0% |
| Venezuelan | 183 | 0.2% |
| Welsh | 224 | 0.2% |
| West Indian | 8 | 0.0% |
| Yakama | 2 | 0.0% |
| Yugoslavian | 42 | 0.0% | View All 82 Rows |
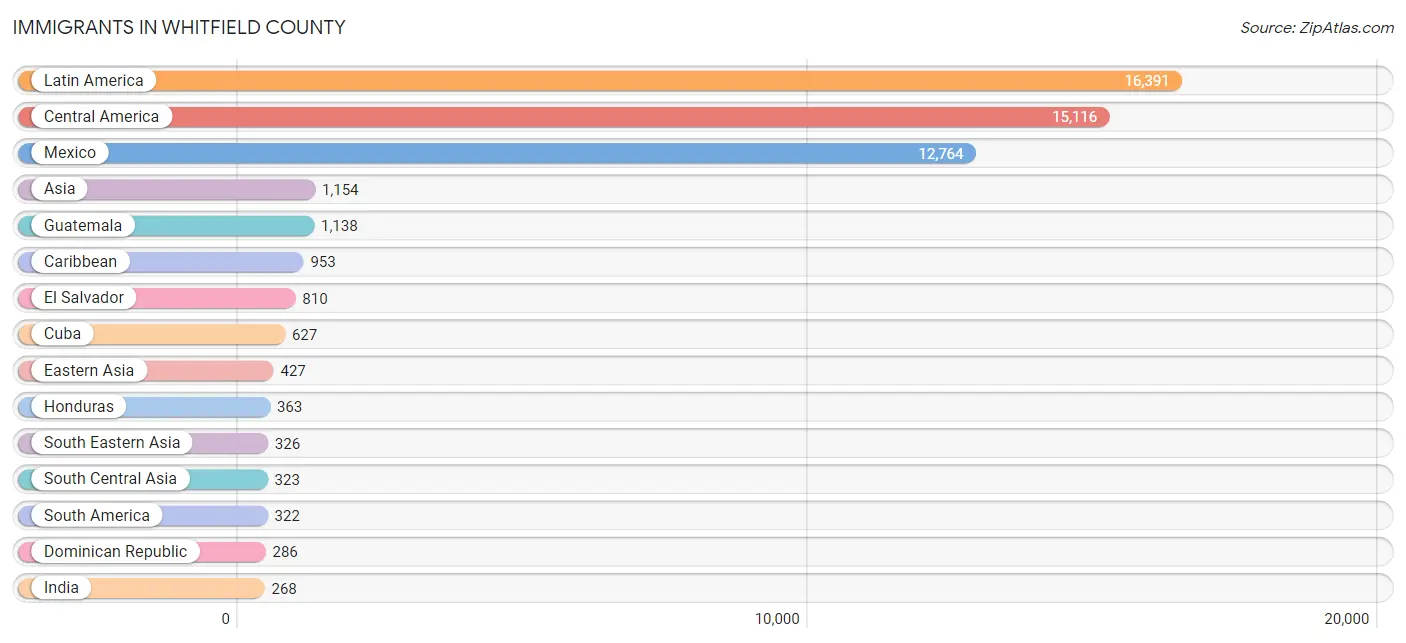
Immigrants in Whitfield County
The most numerous immigrant groups reported in Whitfield County came from Latin America (16,391 | 15.9%), Central America (15,116 | 14.7%), Mexico (12,764 | 12.4%), Asia (1,154 | 1.1%), and Guatemala (1,138 | 1.1%), together accounting for 45.2% of all Whitfield County residents.
| Immigration Origin | # Population | % Population |
| Africa | 149 | 0.1% |
| Asia | 1,154 | 1.1% |
| Barbados | 11 | 0.0% |
| Belgium | 29 | 0.0% |
| Brazil | 6 | 0.0% |
| Canada | 72 | 0.1% |
| Caribbean | 953 | 0.9% |
| Central America | 15,116 | 14.7% |
| China | 115 | 0.1% |
| Colombia | 160 | 0.2% |
| Cuba | 627 | 0.6% |
| Dominican Republic | 286 | 0.3% |
| Eastern Africa | 12 | 0.0% |
| Eastern Asia | 427 | 0.4% |
| Eastern Europe | 10 | 0.0% |
| Ecuador | 51 | 0.1% |
| El Salvador | 810 | 0.8% |
| England | 2 | 0.0% |
| Europe | 158 | 0.2% |
| Fiji | 6 | 0.0% |
| France | 29 | 0.0% |
| Germany | 52 | 0.1% |
| Ghana | 7 | 0.0% |
| Guatemala | 1,138 | 1.1% |
| Haiti | 7 | 0.0% |
| Honduras | 363 | 0.4% |
| India | 268 | 0.3% |
| Japan | 105 | 0.1% |
| Kazakhstan | 8 | 0.0% |
| Korea | 207 | 0.2% |
| Latin America | 16,391 | 15.9% |
| Lebanon | 23 | 0.0% |
| Mexico | 12,764 | 12.4% |
| Nicaragua | 41 | 0.0% |
| Nigeria | 7 | 0.0% |
| Northern Africa | 3 | 0.0% |
| Northern Europe | 31 | 0.0% |
| Oceania | 6 | 0.0% |
| Pakistan | 47 | 0.1% |
| Peru | 54 | 0.1% |
| Philippines | 69 | 0.1% |
| Russia | 10 | 0.0% |
| Saudi Arabia | 20 | 0.0% |
| South Africa | 53 | 0.1% |
| South America | 322 | 0.3% |
| South Central Asia | 323 | 0.3% |
| South Eastern Asia | 326 | 0.3% |
| Southern Europe | 7 | 0.0% |
| Spain | 7 | 0.0% |
| Thailand | 25 | 0.0% |
| Trinidad and Tobago | 7 | 0.0% |
| Turkey | 35 | 0.0% |
| Venezuela | 51 | 0.1% |
| Vietnam | 232 | 0.2% |
| West Indies | 7 | 0.0% |
| Western Africa | 14 | 0.0% |
| Western Asia | 78 | 0.1% |
| Western Europe | 110 | 0.1% | View All 58 Rows |
Sex and Age in Whitfield County
Sex and Age in Whitfield County
The most populous age groups in Whitfield County are 15 to 19 Years (4,139 | 8.0%) for men and 15 to 19 Years (3,731 | 7.3%) for women.
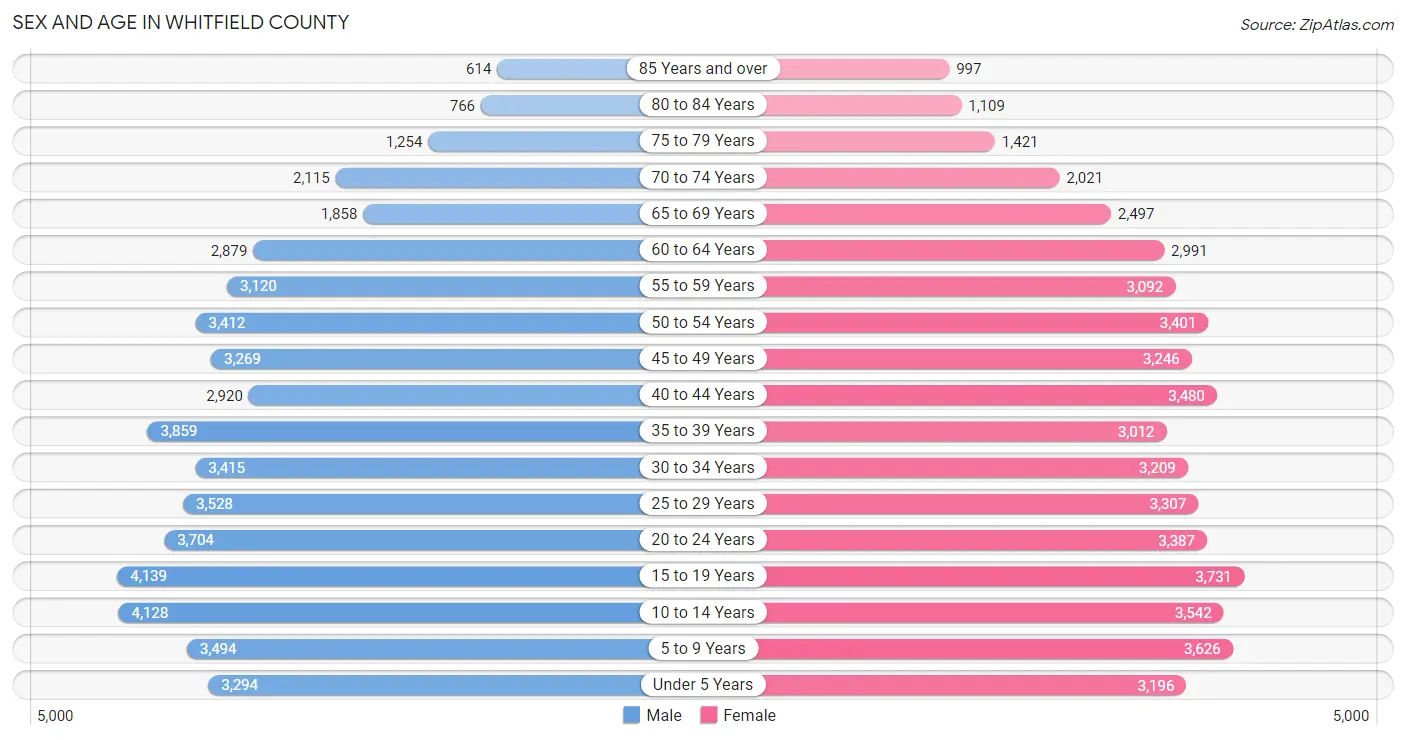
| Age Bracket | Male | Female |
| Under 5 Years | 3,294 (6.4%) | 3,196 (6.2%) |
| 5 to 9 Years | 3,494 (6.8%) | 3,626 (7.1%) |
| 10 to 14 Years | 4,128 (8.0%) | 3,542 (6.9%) |
| 15 to 19 Years | 4,139 (8.0%) | 3,731 (7.3%) |
| 20 to 24 Years | 3,704 (7.1%) | 3,387 (6.6%) |
| 25 to 29 Years | 3,528 (6.8%) | 3,307 (6.5%) |
| 30 to 34 Years | 3,415 (6.6%) | 3,209 (6.3%) |
| 35 to 39 Years | 3,859 (7.4%) | 3,012 (5.9%) |
| 40 to 44 Years | 2,920 (5.6%) | 3,480 (6.8%) |
| 45 to 49 Years | 3,269 (6.3%) | 3,246 (6.3%) |
| 50 to 54 Years | 3,412 (6.6%) | 3,401 (6.6%) |
| 55 to 59 Years | 3,120 (6.0%) | 3,092 (6.0%) |
| 60 to 64 Years | 2,879 (5.6%) | 2,991 (5.8%) |
| 65 to 69 Years | 1,858 (3.6%) | 2,497 (4.9%) |
| 70 to 74 Years | 2,115 (4.1%) | 2,021 (3.9%) |
| 75 to 79 Years | 1,254 (2.4%) | 1,421 (2.8%) |
| 80 to 84 Years | 766 (1.5%) | 1,109 (2.2%) |
| 85 Years and over | 614 (1.2%) | 997 (1.9%) |
| Total | 51,768 (100.0%) | 51,265 (100.0%) |
Families and Households in Whitfield County
Median Family Size in Whitfield County
The median family size in Whitfield County is 3.38 persons per family, with single female/mother families (5,223 | 20.2%) accounting for the largest median family size of 3.47 persons per family. On the other hand, single male/father families (2,723 | 10.5%) represent the smallest median family size with 2.89 persons per family.
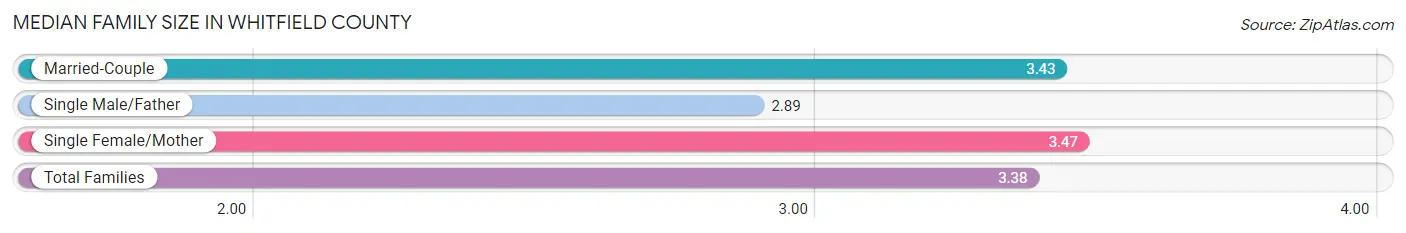
| Family Type | # Families | Family Size |
| Married-Couple | 17,904 (69.3%) | 3.43 |
| Single Male/Father | 2,723 (10.5%) | 2.89 |
| Single Female/Mother | 5,223 (20.2%) | 3.47 |
| Total Families | 25,850 (100.0%) | 3.38 |
Median Household Size in Whitfield County
The median household size in Whitfield County is 2.84 persons per household, with single female/mother households (5,223 | 14.6%) accounting for the largest median household size of 3.6 persons per household. non-family households (9,947 | 27.8%) represent the smallest median household size with 1.20 persons per household.
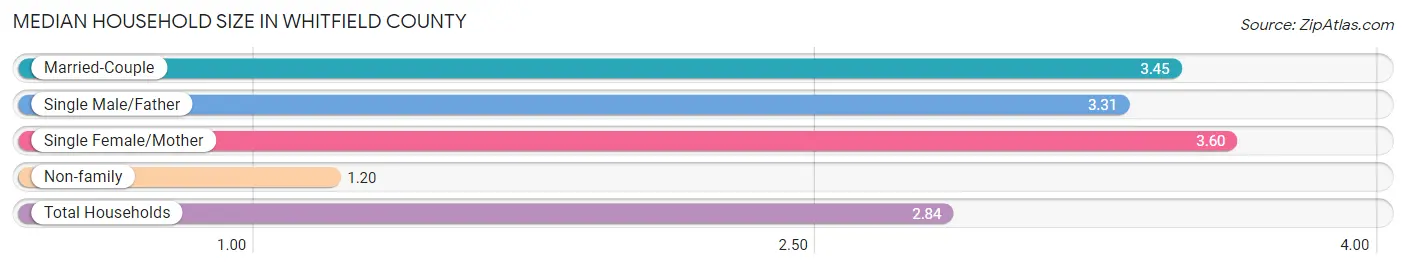
| Household Type | # Households | Household Size |
| Married-Couple | 17,904 (50.0%) | 3.45 |
| Single Male/Father | 2,723 (7.6%) | 3.31 |
| Single Female/Mother | 5,223 (14.6%) | 3.60 |
| Non-family | 9,947 (27.8%) | 1.20 |
| Total Households | 35,797 (100.0%) | 2.84 |
Household Size by Marriage Status in Whitfield County
Out of a total of 35,797 households in Whitfield County, 25,850 (72.2%) are family households, while 9,947 (27.8%) are nonfamily households. The most numerous type of family households are 2-person households, comprising 10,022, and the most common type of nonfamily households are 1-person households, comprising 8,628.
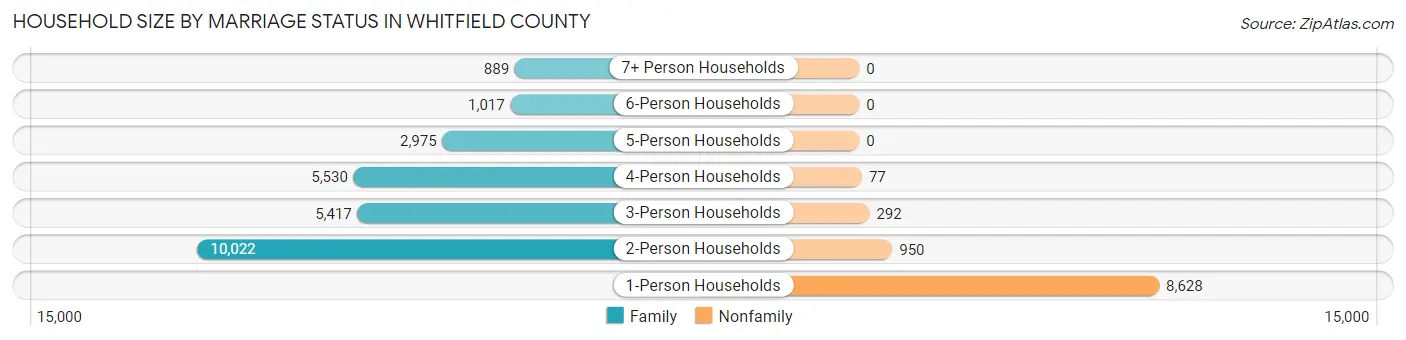
| Household Size | Family Households | Nonfamily Households |
| 1-Person Households | - | 8,628 (24.1%) |
| 2-Person Households | 10,022 (28.0%) | 950 (2.6%) |
| 3-Person Households | 5,417 (15.1%) | 292 (0.8%) |
| 4-Person Households | 5,530 (15.4%) | 77 (0.2%) |
| 5-Person Households | 2,975 (8.3%) | 0 (0.0%) |
| 6-Person Households | 1,017 (2.8%) | 0 (0.0%) |
| 7+ Person Households | 889 (2.5%) | 0 (0.0%) |
| Total | 25,850 (72.2%) | 9,947 (27.8%) |
Female Fertility in Whitfield County
Fertility by Age in Whitfield County
Average fertility rate in Whitfield County is 46.0 births per 1,000 women. Women in the age bracket of 20 to 34 years have the highest fertility rate with 84.0 births per 1,000 women. Women in the age bracket of 20 to 34 years acount for 75.5% of all women with births.
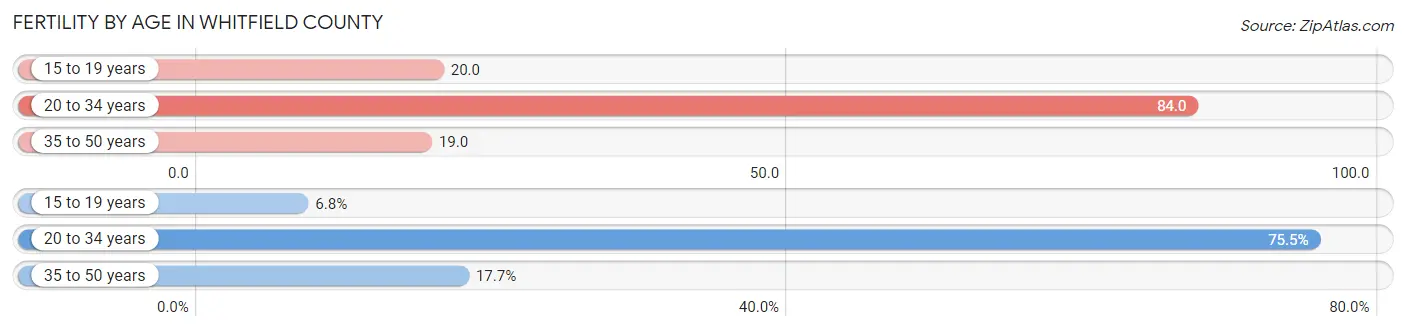
| Age Bracket | Women with Births | Births / 1,000 Women |
| 15 to 19 years | 75 (6.8%) | 20.0 |
| 20 to 34 years | 831 (75.5%) | 84.0 |
| 35 to 50 years | 195 (17.7%) | 19.0 |
| Total | 1,101 (100.0%) | 46.0 |
Fertility by Age by Marriage Status in Whitfield County
73.4% of women with births (1,101) in Whitfield County are married. The highest percentage of unmarried women with births falls into 15 to 19 years age bracket with 100.0% of them unmarried at the time of birth, while the lowest percentage of unmarried women with births belong to 35 to 50 years age bracket with 0.0% of them unmarried.
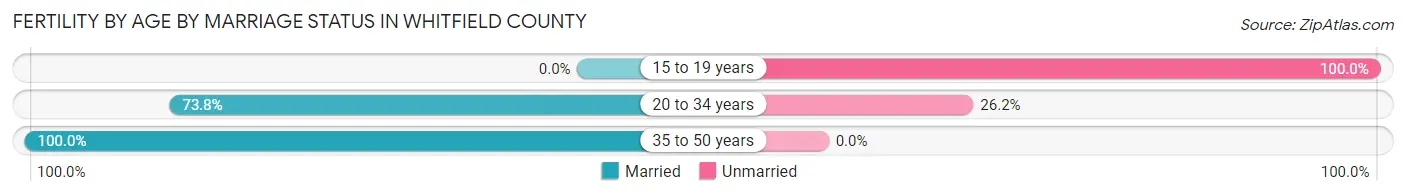
| Age Bracket | Married | Unmarried |
| 15 to 19 years | 0 (0.0%) | 75 (100.0%) |
| 20 to 34 years | 613 (73.8%) | 218 (26.2%) |
| 35 to 50 years | 195 (100.0%) | 0 (0.0%) |
| Total | 808 (73.4%) | 293 (26.6%) |
Fertility by Education in Whitfield County
Average fertility rate in Whitfield County is 46.0 births per 1,000 women. Women with the education attainment of college or associate's degree have the highest fertility rate of 71.0 births per 1,000 women, while women with the education attainment of graduate degree have the lowest fertility at 26.0 births per 1,000 women. Women with the education attainment of college or associate's degree represent 43.3% of all women with births.
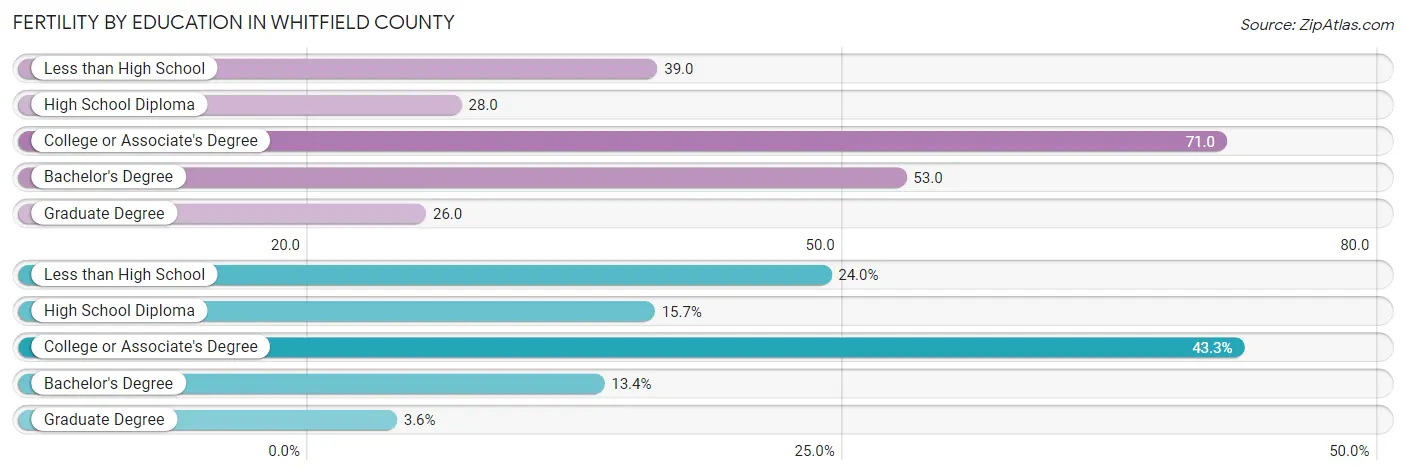
| Educational Attainment | Women with Births | Births / 1,000 Women |
| Less than High School | 264 (24.0%) | 39.0 |
| High School Diploma | 173 (15.7%) | 28.0 |
| College or Associate's Degree | 477 (43.3%) | 71.0 |
| Bachelor's Degree | 147 (13.4%) | 53.0 |
| Graduate Degree | 40 (3.6%) | 26.0 |
| Total | 1,101 (100.0%) | 46.0 |
Fertility by Education by Marriage Status in Whitfield County
26.6% of women with births in Whitfield County are unmarried. Women with the educational attainment of graduate degree are most likely to be married with 100.0% of them married at childbirth, while women with the educational attainment of less than high school are least likely to be married with 41.3% of them unmarried at childbirth.
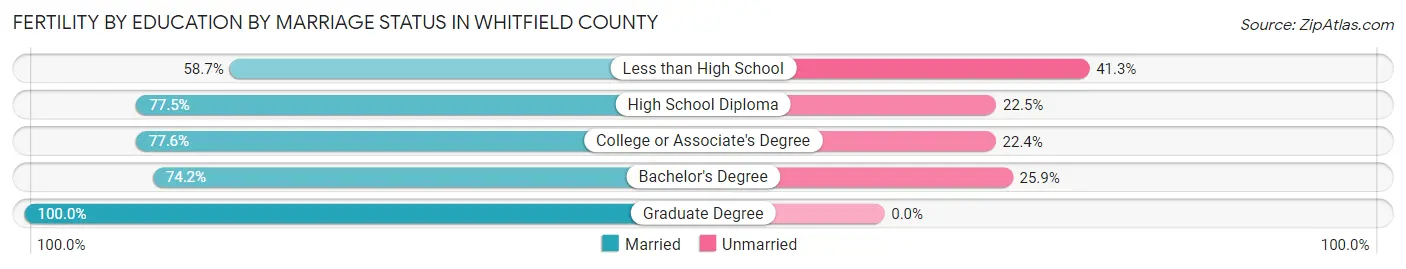
| Educational Attainment | Married | Unmarried |
| Less than High School | 155 (58.7%) | 109 (41.3%) |
| High School Diploma | 134 (77.5%) | 39 (22.5%) |
| College or Associate's Degree | 370 (77.6%) | 107 (22.4%) |
| Bachelor's Degree | 109 (74.2%) | 38 (25.9%) |
| Graduate Degree | 40 (100.0%) | 0 (0.0%) |
| Total | 808 (73.4%) | 293 (26.6%) |
Income in Whitfield County
Income Overview in Whitfield County
Per Capita Income in Whitfield County is $28,594, while median incomes of families and households are $69,315 and $59,659 respectively.
| Characteristic | Number | Measure |
| Per Capita Income | 103,033 | $28,594 |
| Median Family Income | 25,850 | $69,315 |
| Mean Family Income | 25,850 | $90,887 |
| Median Household Income | 35,797 | $59,659 |
| Mean Household Income | 35,797 | $79,537 |
| Income Deficit | 25,850 | $9,911 |
| Wage / Income Gap (%) | 103,033 | 25.99% |
| Wage / Income Gap ($) | 103,033 | 74.01¢ per $1 |
| Gini / Inequality Index | 103,033 | 0.44 |
Earnings by Sex in Whitfield County
Average Earnings in Whitfield County are $34,435, $39,102 for men and $28,939 for women, a difference of 26.0%.
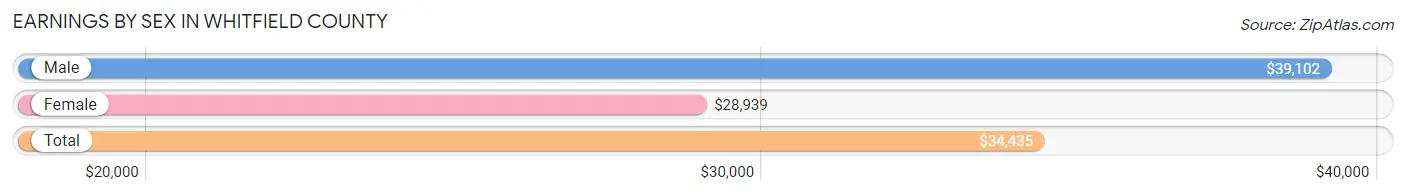
| Sex | Number | Average Earnings |
| Male | 28,458 (54.3%) | $39,102 |
| Female | 23,977 (45.7%) | $28,939 |
| Total | 52,435 (100.0%) | $34,435 |
Earnings by Sex by Income Bracket in Whitfield County
The most common earnings brackets in Whitfield County are $35,000 to $39,999 for men (2,747 | 9.7%) and $25,000 to $29,999 for women (2,738 | 11.4%).
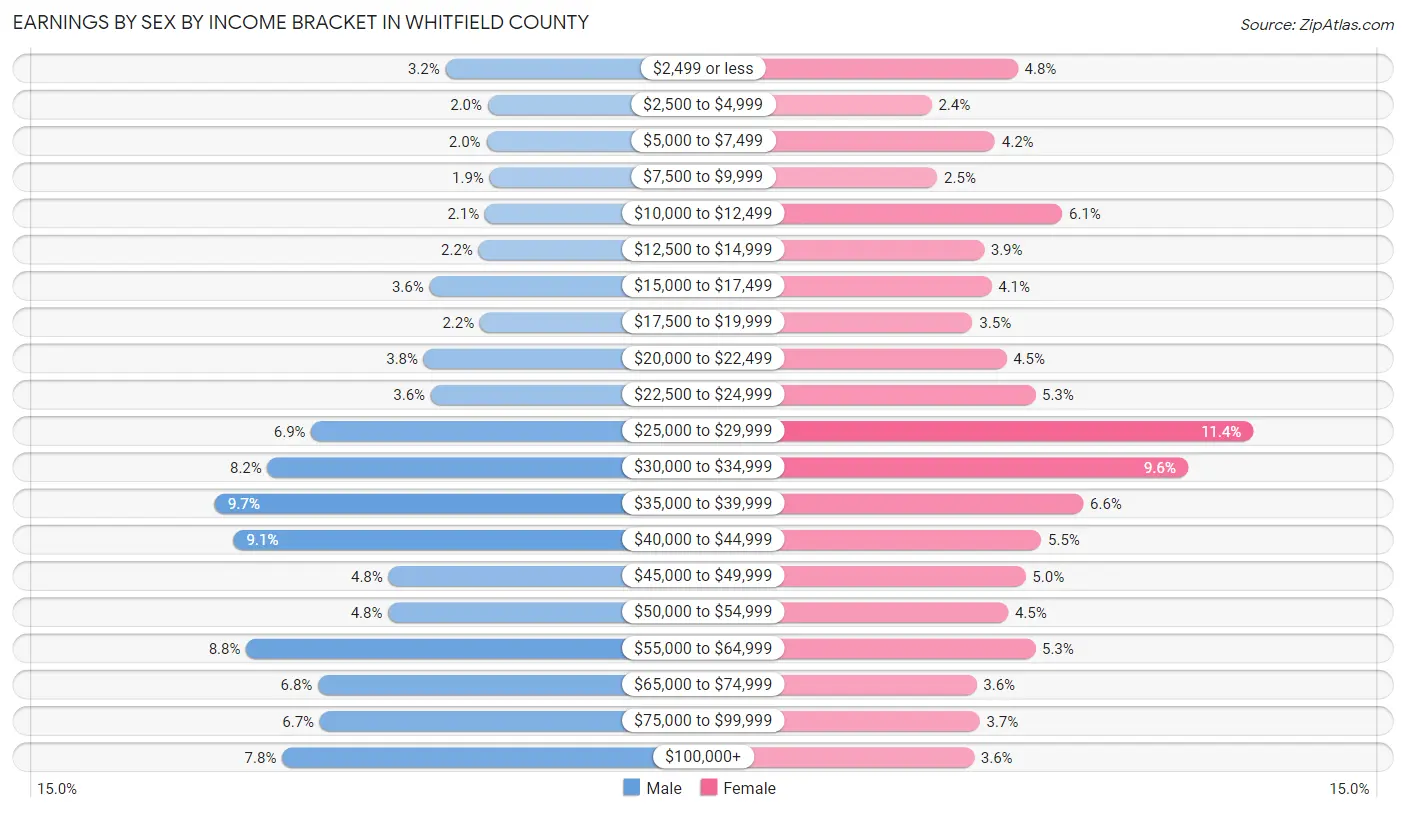
| Income | Male | Female |
| $2,499 or less | 901 (3.2%) | 1,151 (4.8%) |
| $2,500 to $4,999 | 563 (2.0%) | 570 (2.4%) |
| $5,000 to $7,499 | 575 (2.0%) | 998 (4.2%) |
| $7,500 to $9,999 | 550 (1.9%) | 609 (2.5%) |
| $10,000 to $12,499 | 586 (2.1%) | 1,451 (6.0%) |
| $12,500 to $14,999 | 638 (2.2%) | 922 (3.8%) |
| $15,000 to $17,499 | 1,029 (3.6%) | 974 (4.1%) |
| $17,500 to $19,999 | 626 (2.2%) | 847 (3.5%) |
| $20,000 to $22,499 | 1,076 (3.8%) | 1,073 (4.5%) |
| $22,500 to $24,999 | 1,020 (3.6%) | 1,269 (5.3%) |
| $25,000 to $29,999 | 1,976 (6.9%) | 2,738 (11.4%) |
| $30,000 to $34,999 | 2,324 (8.2%) | 2,296 (9.6%) |
| $35,000 to $39,999 | 2,747 (9.7%) | 1,591 (6.6%) |
| $40,000 to $44,999 | 2,598 (9.1%) | 1,308 (5.5%) |
| $45,000 to $49,999 | 1,357 (4.8%) | 1,203 (5.0%) |
| $50,000 to $54,999 | 1,359 (4.8%) | 1,085 (4.5%) |
| $55,000 to $64,999 | 2,496 (8.8%) | 1,269 (5.3%) |
| $65,000 to $74,999 | 1,922 (6.8%) | 873 (3.6%) |
| $75,000 to $99,999 | 1,906 (6.7%) | 895 (3.7%) |
| $100,000+ | 2,209 (7.8%) | 855 (3.6%) |
| Total | 28,458 (100.0%) | 23,977 (100.0%) |
Earnings by Sex by Educational Attainment in Whitfield County
Average earnings in Whitfield County are $42,222 for men and $31,675 for women, a difference of 25.0%. Men with an educational attainment of graduate degree enjoy the highest average annual earnings of $78,472, while those with less than high school education earn the least with $36,787. Women with an educational attainment of graduate degree earn the most with the average annual earnings of $61,257, while those with less than high school education have the smallest earnings of $26,806.
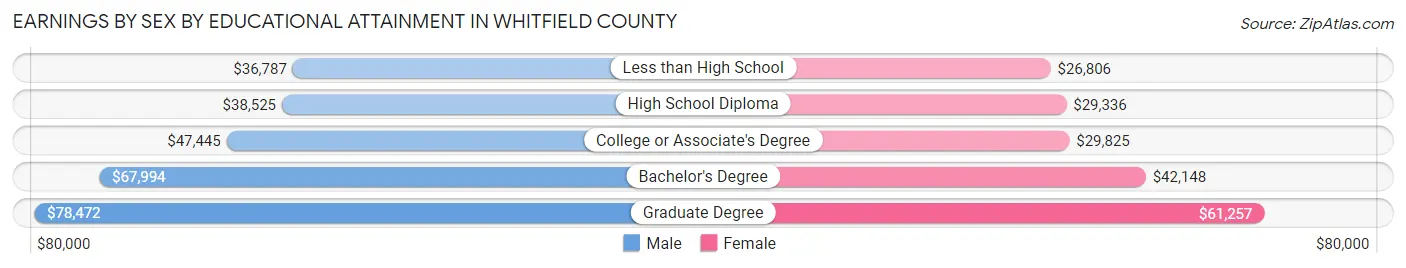
| Educational Attainment | Male Income | Female Income |
| Less than High School | $36,787 | $26,806 |
| High School Diploma | $38,525 | $29,336 |
| College or Associate's Degree | $47,445 | $29,825 |
| Bachelor's Degree | $67,994 | $42,148 |
| Graduate Degree | $78,472 | $61,257 |
| Total | $42,222 | $31,675 |
Family Income in Whitfield County
Family Income Brackets in Whitfield County
According to the Whitfield County family income data, there are 5,428 families falling into the $50,000 to $74,999 income range, which is the most common income bracket and makes up 21.0% of all families. Conversely, the $10,000 to $14,999 income bracket is the least frequent group with only 414 families (1.6%) belonging to this category.
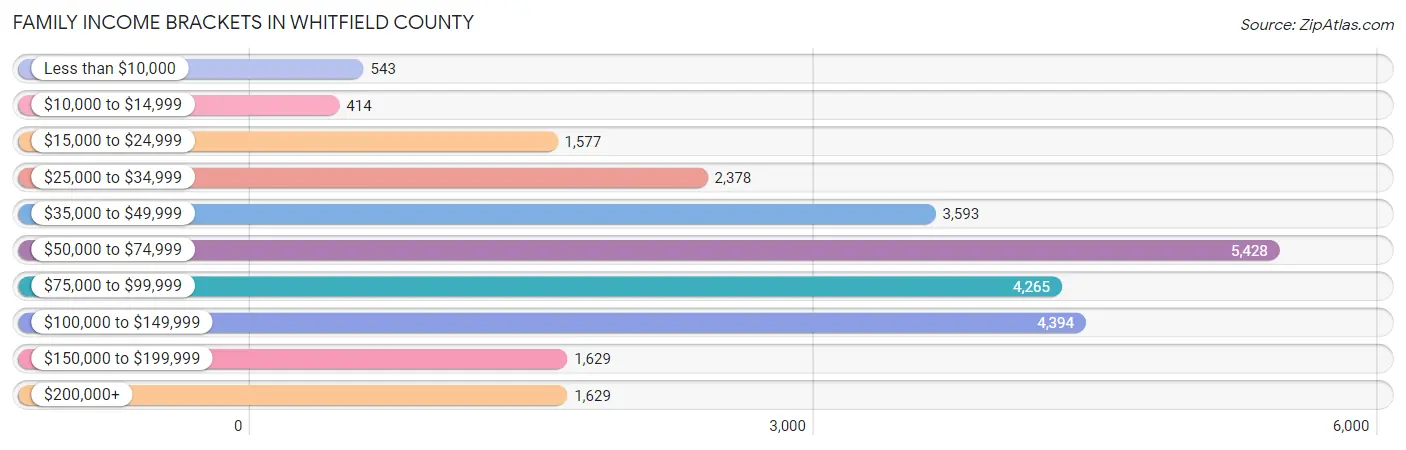
| Income Bracket | # Families | % Families |
| Less than $10,000 | 543 | 2.1% |
| $10,000 to $14,999 | 414 | 1.6% |
| $15,000 to $24,999 | 1,577 | 6.1% |
| $25,000 to $34,999 | 2,378 | 9.2% |
| $35,000 to $49,999 | 3,593 | 13.9% |
| $50,000 to $74,999 | 5,428 | 21.0% |
| $75,000 to $99,999 | 4,265 | 16.5% |
| $100,000 to $149,999 | 4,394 | 17.0% |
| $150,000 to $199,999 | 1,629 | 6.3% |
| $200,000+ | 1,629 | 6.3% |
Family Income by Famaliy Size in Whitfield County
7+ person families (786 | 3.0%) account for the highest median family income in Whitfield County with $104,825 per family, while 2-person families (10,686 | 41.3%) have the highest median income of $30,276 per family member.
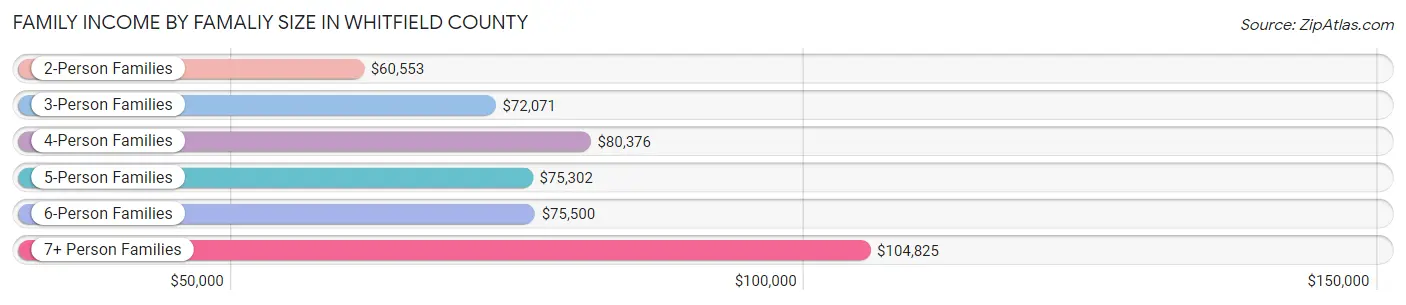
| Income Bracket | # Families | Median Income |
| 2-Person Families | 10,686 (41.3%) | $60,553 |
| 3-Person Families | 5,386 (20.8%) | $72,071 |
| 4-Person Families | 5,285 (20.4%) | $80,376 |
| 5-Person Families | 2,685 (10.4%) | $75,302 |
| 6-Person Families | 1,022 (4.0%) | $75,500 |
| 7+ Person Families | 786 (3.0%) | $104,825 |
| Total | 25,850 (100.0%) | $69,315 |
Family Income by Number of Earners in Whitfield County
The median family income in Whitfield County is $69,315, with families comprising 3+ earners (3,584) having the highest median family income of $109,404, while families with no earners (3,241) have the lowest median family income of $34,231, accounting for 13.9% and 12.5% of families, respectively.
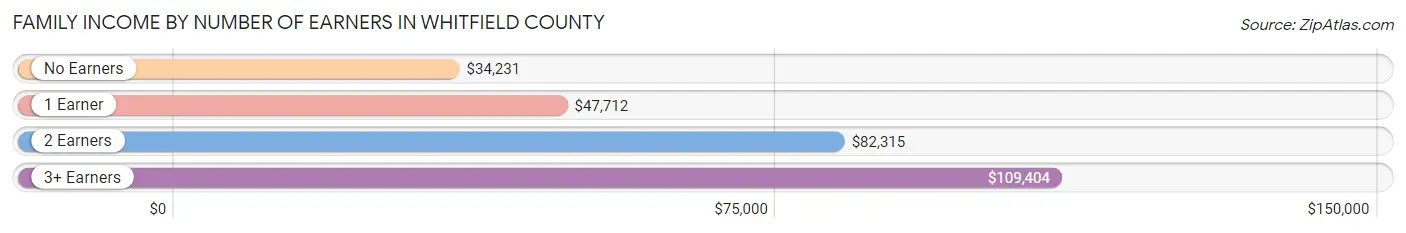
| Number of Earners | # Families | Median Income |
| No Earners | 3,241 (12.5%) | $34,231 |
| 1 Earner | 8,183 (31.7%) | $47,712 |
| 2 Earners | 10,842 (41.9%) | $82,315 |
| 3+ Earners | 3,584 (13.9%) | $109,404 |
| Total | 25,850 (100.0%) | $69,315 |
Household Income in Whitfield County
Household Income Brackets in Whitfield County
With 6,873 households falling in the category, the $50,000 to $74,999 income range is the most frequent in Whitfield County, accounting for 19.2% of all households. In contrast, only 1,289 households (3.6%) fall into the less than $10,000 income bracket, making it the least populous group.
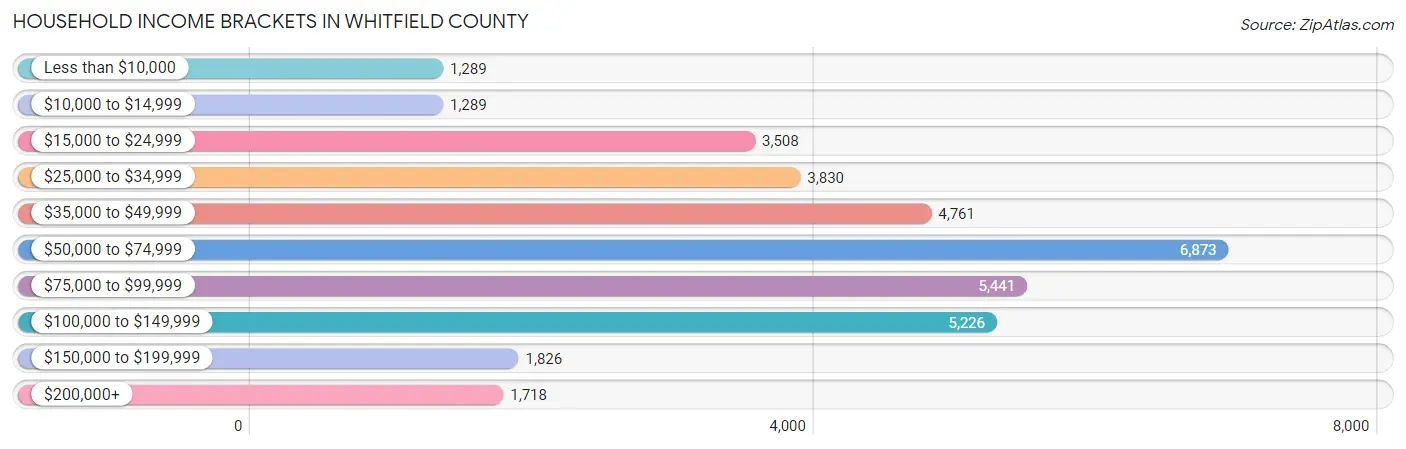
| Income Bracket | # Households | % Households |
| Less than $10,000 | 1,289 | 3.6% |
| $10,000 to $14,999 | 1,289 | 3.6% |
| $15,000 to $24,999 | 3,508 | 9.8% |
| $25,000 to $34,999 | 3,830 | 10.7% |
| $35,000 to $49,999 | 4,761 | 13.3% |
| $50,000 to $74,999 | 6,873 | 19.2% |
| $75,000 to $99,999 | 5,441 | 15.2% |
| $100,000 to $149,999 | 5,226 | 14.6% |
| $150,000 to $199,999 | 1,826 | 5.1% |
| $200,000+ | 1,718 | 4.8% |
Household Income by Householder Age in Whitfield County
The median household income in Whitfield County is $59,659, with the highest median household income of $70,215 found in the 45 to 64 years age bracket for the primary householder. A total of 13,501 households (37.7%) fall into this category. Meanwhile, the 15 to 24 years age bracket for the primary householder has the lowest median household income of $37,964, with 1,279 households (3.6%) in this group.
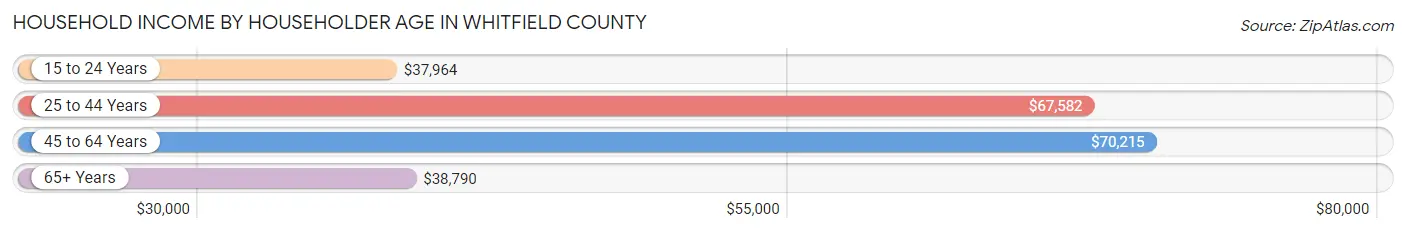
| Income Bracket | # Households | Median Income |
| 15 to 24 Years | 1,279 (3.6%) | $37,964 |
| 25 to 44 Years | 12,198 (34.1%) | $67,582 |
| 45 to 64 Years | 13,501 (37.7%) | $70,215 |
| 65+ Years | 8,819 (24.6%) | $38,790 |
| Total | 35,797 (100.0%) | $59,659 |
Poverty in Whitfield County
Income Below Poverty by Sex and Age in Whitfield County
With 11.8% poverty level for males and 15.2% for females among the residents of Whitfield County, under 5 year old males and 12 to 14 year old females are the most vulnerable to poverty, with 807 males (24.8%) and 525 females (27.4%) in their respective age groups living below the poverty level.
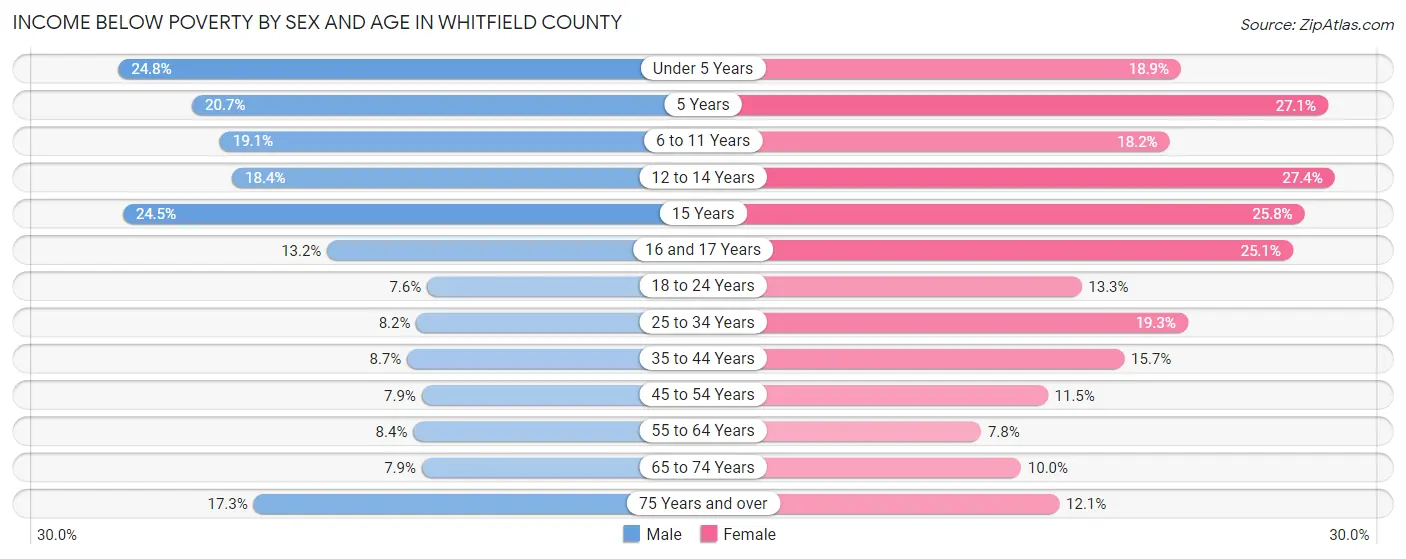
| Age Bracket | Male | Female |
| Under 5 Years | 807 (24.8%) | 603 (18.9%) |
| 5 Years | 148 (20.7%) | 174 (27.1%) |
| 6 to 11 Years | 825 (19.1%) | 817 (18.2%) |
| 12 to 14 Years | 476 (18.4%) | 525 (27.4%) |
| 15 Years | 260 (24.5%) | 238 (25.8%) |
| 16 and 17 Years | 201 (13.2%) | 357 (25.1%) |
| 18 to 24 Years | 389 (7.6%) | 611 (13.3%) |
| 25 to 34 Years | 561 (8.2%) | 1,248 (19.3%) |
| 35 to 44 Years | 580 (8.7%) | 1,018 (15.7%) |
| 45 to 54 Years | 523 (7.9%) | 759 (11.5%) |
| 55 to 64 Years | 494 (8.4%) | 469 (7.7%) |
| 65 to 74 Years | 311 (7.9%) | 447 (10.0%) |
| 75 Years and over | 449 (17.2%) | 405 (12.1%) |
| Total | 6,024 (11.8%) | 7,671 (15.2%) |
Income Above Poverty by Sex and Age in Whitfield County
According to the poverty statistics in Whitfield County, males aged 18 to 24 years and females aged 55 to 64 years are the age groups that are most secure financially, with 92.4% of males and 92.2% of females in these age groups living above the poverty line.
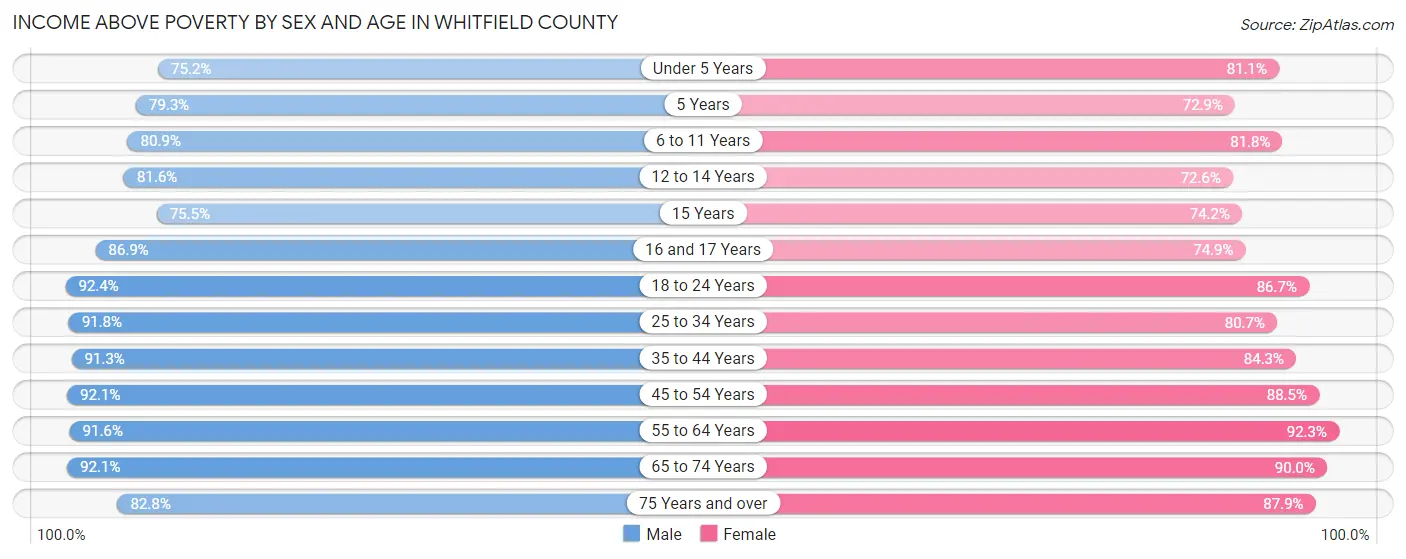
| Age Bracket | Male | Female |
| Under 5 Years | 2,450 (75.2%) | 2,591 (81.1%) |
| 5 Years | 568 (79.3%) | 469 (72.9%) |
| 6 to 11 Years | 3,487 (80.9%) | 3,662 (81.8%) |
| 12 to 14 Years | 2,106 (81.6%) | 1,388 (72.6%) |
| 15 Years | 800 (75.5%) | 686 (74.2%) |
| 16 and 17 Years | 1,328 (86.9%) | 1,065 (74.9%) |
| 18 to 24 Years | 4,733 (92.4%) | 3,968 (86.7%) |
| 25 to 34 Years | 6,287 (91.8%) | 5,231 (80.7%) |
| 35 to 44 Years | 6,084 (91.3%) | 5,456 (84.3%) |
| 45 to 54 Years | 6,108 (92.1%) | 5,866 (88.5%) |
| 55 to 64 Years | 5,412 (91.6%) | 5,579 (92.2%) |
| 65 to 74 Years | 3,637 (92.1%) | 4,038 (90.0%) |
| 75 Years and over | 2,154 (82.8%) | 2,943 (87.9%) |
| Total | 45,154 (88.2%) | 42,942 (84.8%) |
Income Below Poverty Among Married-Couple Families in Whitfield County
The poverty statistics for married-couple families in Whitfield County show that 4.7% or 846 of the total 17,904 families live below the poverty line. Families with 5 or more children have the highest poverty rate of 18.2%, comprising of 44 families. On the other hand, families with no children have the lowest poverty rate of 2.5%, which includes 244 families.
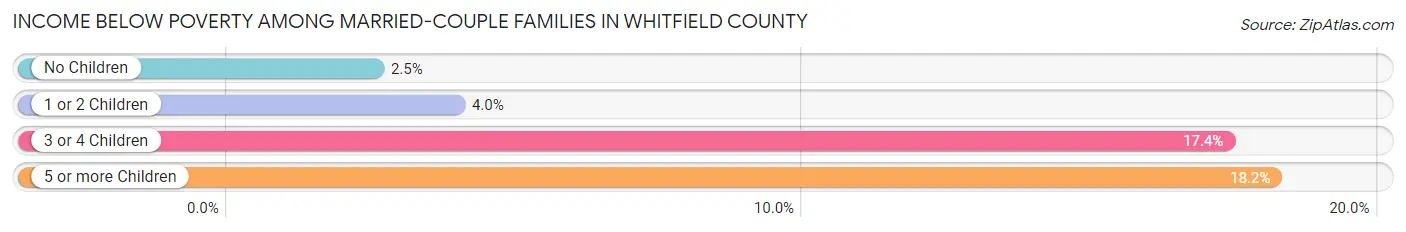
| Children | Above Poverty | Below Poverty |
| No Children | 9,351 (97.5%) | 244 (2.5%) |
| 1 or 2 Children | 6,033 (96.1%) | 248 (4.0%) |
| 3 or 4 Children | 1,476 (82.6%) | 310 (17.4%) |
| 5 or more Children | 198 (81.8%) | 44 (18.2%) |
| Total | 17,058 (95.3%) | 846 (4.7%) |
Income Below Poverty Among Single-Parent Households in Whitfield County
According to the poverty data in Whitfield County, 8.0% or 218 single-father households and 27.0% or 1,411 single-mother households are living below the poverty line. Among single-father households, those with 3 or 4 children have the highest poverty rate, with 61 households (37.2%) experiencing poverty. Likewise, among single-mother households, those with 5 or more children have the highest poverty rate, with 115 households (100.0%) falling below the poverty line.
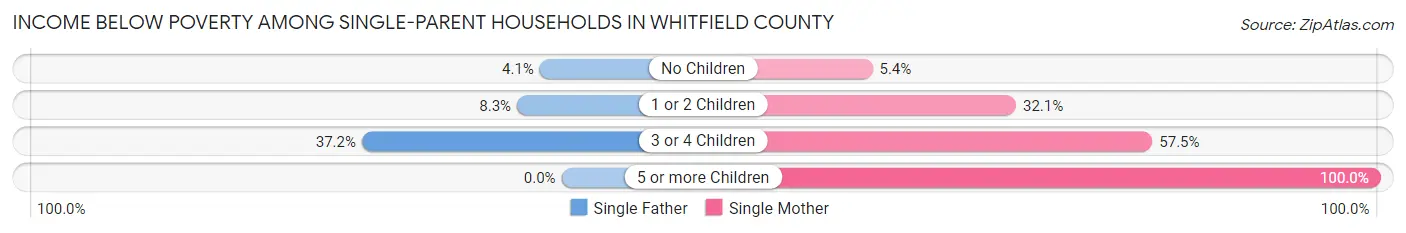
| Children | Single Father | Single Mother |
| No Children | 53 (4.1%) | 114 (5.4%) |
| 1 or 2 Children | 104 (8.3%) | 680 (32.1%) |
| 3 or 4 Children | 61 (37.2%) | 502 (57.5%) |
| 5 or more Children | 0 (0.0%) | 115 (100.0%) |
| Total | 218 (8.0%) | 1,411 (27.0%) |
Income Below Poverty Among Married-Couple vs Single-Parent Households in Whitfield County
The poverty data for Whitfield County shows that 846 of the married-couple family households (4.7%) and 1,629 of the single-parent households (20.5%) are living below the poverty level. Within the married-couple family households, those with 5 or more children have the highest poverty rate, with 44 households (18.2%) falling below the poverty line. Among the single-parent households, those with 5 or more children have the highest poverty rate, with 115 household (100.0%) living below poverty.
| Children | Married-Couple Families | Single-Parent Households |
| No Children | 244 (2.5%) | 167 (4.9%) |
| 1 or 2 Children | 248 (4.0%) | 784 (23.3%) |
| 3 or 4 Children | 310 (17.4%) | 563 (54.3%) |
| 5 or more Children | 44 (18.2%) | 115 (100.0%) |
| Total | 846 (4.7%) | 1,629 (20.5%) |
Employment Characteristics in Whitfield County
Employment by Class of Employer in Whitfield County
Among the 47,067 employed individuals in Whitfield County, private company employees (36,625 | 77.8%), local government employees (3,629 | 7.7%), and not-for-profit organizations (2,354 | 5.0%) make up the most common classes of employment.
| Employer Class | # Employees | % Employees |
| Private Company Employees | 36,625 | 77.8% |
| Self-Employed (Incorporated) | 1,392 | 3.0% |
| Self-Employed (Not Incorporated) | 1,815 | 3.9% |
| Not-for-profit Organizations | 2,354 | 5.0% |
| Local Government Employees | 3,629 | 7.7% |
| State Government Employees | 886 | 1.9% |
| Federal Government Employees | 284 | 0.6% |
| Unpaid Family Workers | 82 | 0.2% |
| Total | 47,067 | 100.0% |
Employment Status by Age in Whitfield County
According to the labor force statistics for Whitfield County, out of the total population over 16 years of age (79,767), 63.0% or 50,253 individuals are in the labor force, with 5.7% or 2,864 of them unemployed. The age group with the highest labor force participation rate is 35 to 44 years, with 83.6% or 11,095 individuals in the labor force. Within the labor force, the 20 to 24 years age range has the highest percentage of unemployed individuals, with 12.3% or 684 of them being unemployed.
| Age Bracket | In Labor Force | Unemployed |
| 16 to 19 Years | 2,512 (42.7%) | 296 (11.8%) |
| 20 to 24 Years | 5,559 (78.4%) | 684 (12.3%) |
| 25 to 29 Years | 5,482 (80.2%) | 214 (3.9%) |
| 30 to 34 Years | 5,438 (82.1%) | 305 (5.6%) |
| 35 to 44 Years | 11,095 (83.6%) | 311 (2.8%) |
| 45 to 54 Years | 10,662 (80.0%) | 661 (6.2%) |
| 55 to 59 Years | 4,423 (71.2%) | 159 (3.6%) |
| 60 to 64 Years | 2,870 (48.9%) | 149 (5.2%) |
| 65 to 74 Years | 1,868 (22.0%) | 90 (4.8%) |
| 75 Years and over | 376 (6.1%) | 0 (0.0%) |
| Total | 50,253 (63.0%) | 2,864 (5.7%) |
Employment Status by Educational Attainment in Whitfield County
According to labor force statistics for Whitfield County, 76.7% of individuals (39,991) out of the total population between 25 and 64 years of age (52,140) are in the labor force, with 4.5% or 1,800 of them being unemployed. The group with the highest labor force participation rate are those with the educational attainment of bachelor's degree or higher, with 91.0% or 8,411 individuals in the labor force. Within the labor force, individuals with college / associate degree education have the highest percentage of unemployment, with 5.7% or 590 of them being unemployed.
| Educational Attainment | In Labor Force | Unemployed |
| Less than High School | 8,742 (65.2%) | 469 (3.5%) |
| High School Diploma | 12,467 (75.1%) | 797 (4.8%) |
| College / Associate Degree | 10,349 (80.3%) | 735 (5.7%) |
| Bachelor's Degree or higher | 8,411 (91.0%) | 324 (3.5%) |
| Total | 39,991 (76.7%) | 2,346 (4.5%) |
Employment Occupations by Sex in Whitfield County
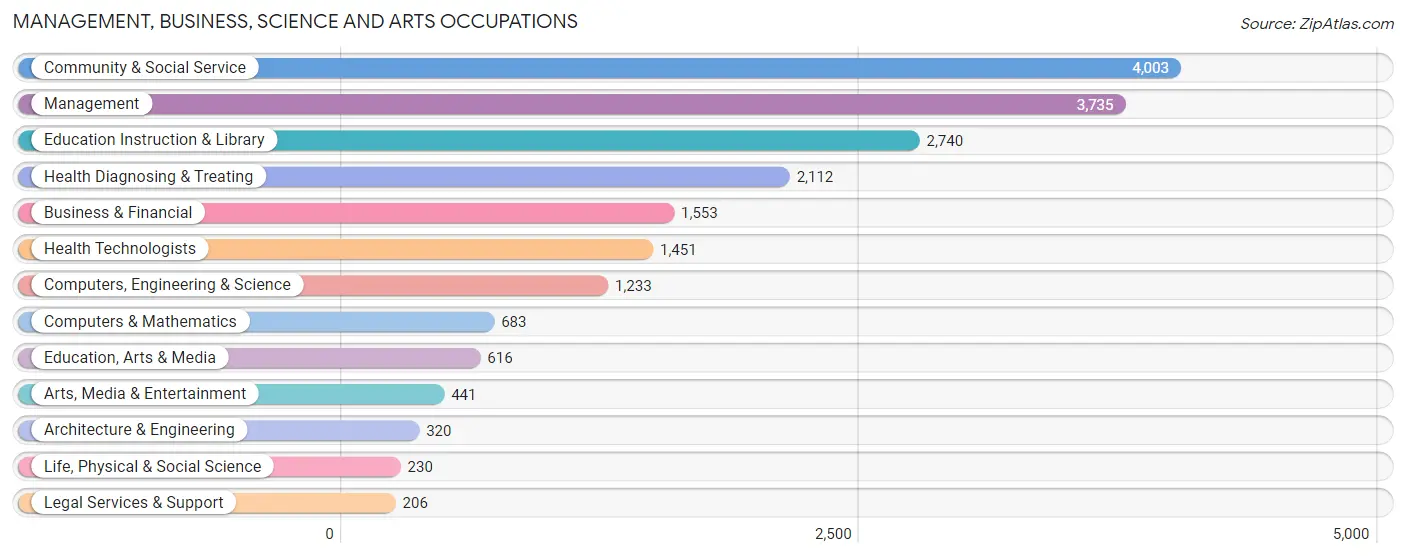
Management, Business, Science and Arts Occupations
The most common Management, Business, Science and Arts occupations in Whitfield County are Community & Social Service (4,003 | 8.4%), Management (3,735 | 7.9%), Education Instruction & Library (2,740 | 5.8%), Health Diagnosing & Treating (2,112 | 4.5%), and Business & Financial (1,553 | 3.3%).
Management, Business, Science and Arts Occupations by Sex
Within the Management, Business, Science and Arts occupations in Whitfield County, the most male-oriented occupations are Computers & Mathematics (84.6%), Architecture & Engineering (83.4%), and Computers, Engineering & Science (82.0%), while the most female-oriented occupations are Education Instruction & Library (80.3%), Health Diagnosing & Treating (76.5%), and Health Technologists (75.5%).
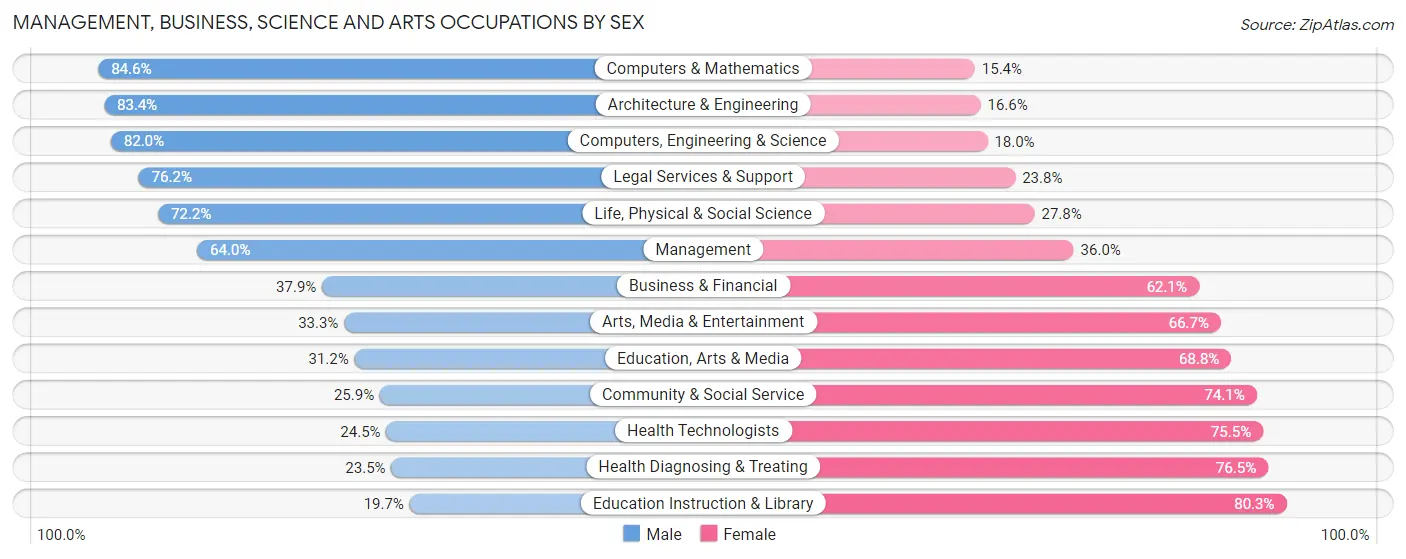
| Occupation | Male | Female |
| Management | 2,391 (64.0%) | 1,344 (36.0%) |
| Business & Financial | 589 (37.9%) | 964 (62.1%) |
| Computers, Engineering & Science | 1,011 (82.0%) | 222 (18.0%) |
| Computers & Mathematics | 578 (84.6%) | 105 (15.4%) |
| Architecture & Engineering | 267 (83.4%) | 53 (16.6%) |
| Life, Physical & Social Science | 166 (72.2%) | 64 (27.8%) |
| Community & Social Service | 1,035 (25.9%) | 2,968 (74.1%) |
| Education, Arts & Media | 192 (31.2%) | 424 (68.8%) |
| Legal Services & Support | 157 (76.2%) | 49 (23.8%) |
| Education Instruction & Library | 539 (19.7%) | 2,201 (80.3%) |
| Arts, Media & Entertainment | 147 (33.3%) | 294 (66.7%) |
| Health Diagnosing & Treating | 496 (23.5%) | 1,616 (76.5%) |
| Health Technologists | 356 (24.5%) | 1,095 (75.5%) |
| Total (Category) | 5,522 (43.7%) | 7,114 (56.3%) |
| Total (Overall) | 25,918 (54.7%) | 21,488 (45.3%) |
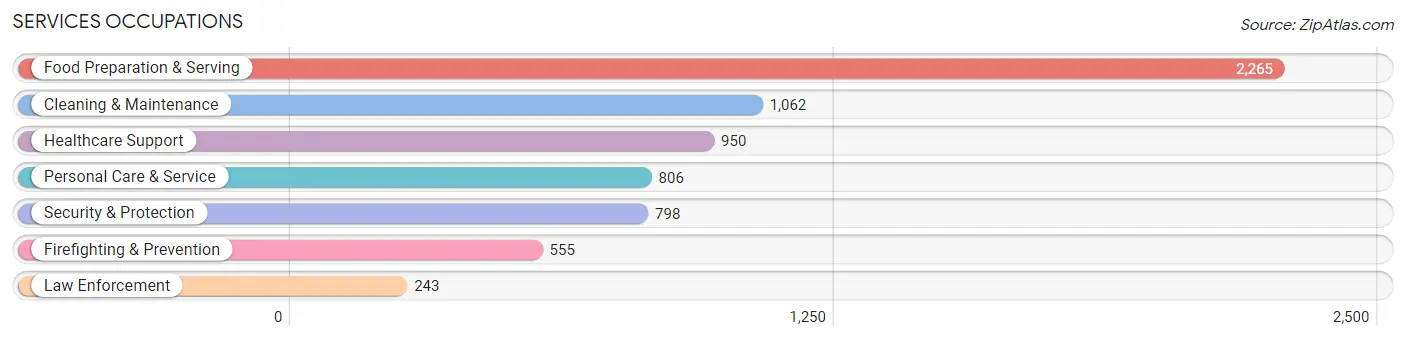
Services Occupations
The most common Services occupations in Whitfield County are Food Preparation & Serving (2,265 | 4.8%), Cleaning & Maintenance (1,062 | 2.2%), Healthcare Support (950 | 2.0%), Personal Care & Service (806 | 1.7%), and Security & Protection (798 | 1.7%).
Services Occupations by Sex
Within the Services occupations in Whitfield County, the most male-oriented occupations are Law Enforcement (70.4%), Security & Protection (62.0%), and Firefighting & Prevention (58.4%), while the most female-oriented occupations are Healthcare Support (94.5%), Personal Care & Service (79.9%), and Food Preparation & Serving (73.1%).
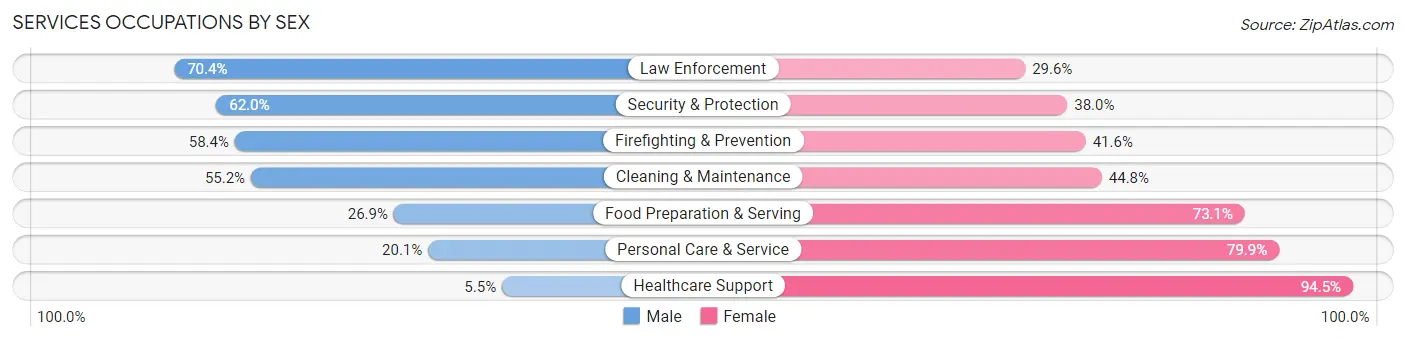
| Occupation | Male | Female |
| Healthcare Support | 52 (5.5%) | 898 (94.5%) |
| Security & Protection | 495 (62.0%) | 303 (38.0%) |
| Firefighting & Prevention | 324 (58.4%) | 231 (41.6%) |
| Law Enforcement | 171 (70.4%) | 72 (29.6%) |
| Food Preparation & Serving | 609 (26.9%) | 1,656 (73.1%) |
| Cleaning & Maintenance | 586 (55.2%) | 476 (44.8%) |
| Personal Care & Service | 162 (20.1%) | 644 (79.9%) |
| Total (Category) | 1,904 (32.4%) | 3,977 (67.6%) |
| Total (Overall) | 25,918 (54.7%) | 21,488 (45.3%) |
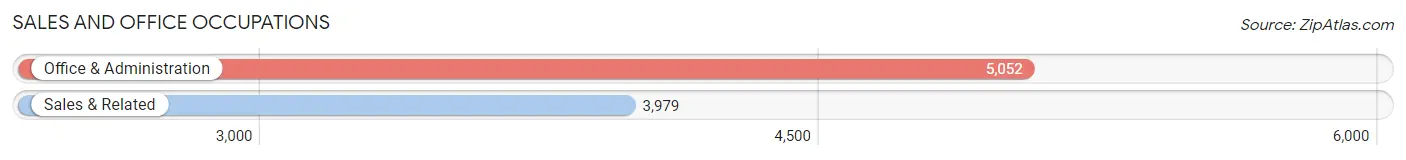
Sales and Office Occupations
The most common Sales and Office occupations in Whitfield County are Office & Administration (5,052 | 10.7%), and Sales & Related (3,979 | 8.4%).
Sales and Office Occupations by Sex
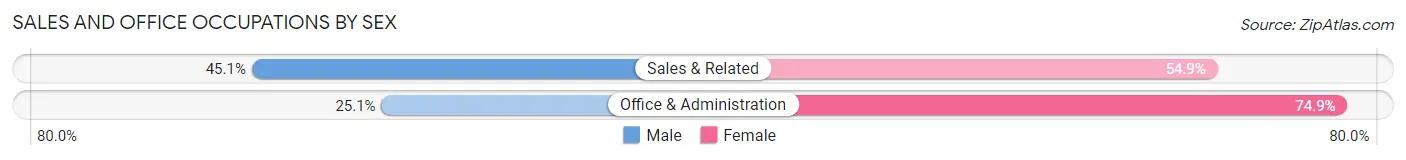
| Occupation | Male | Female |
| Sales & Related | 1,793 (45.1%) | 2,186 (54.9%) |
| Office & Administration | 1,268 (25.1%) | 3,784 (74.9%) |
| Total (Category) | 3,061 (33.9%) | 5,970 (66.1%) |
| Total (Overall) | 25,918 (54.7%) | 21,488 (45.3%) |
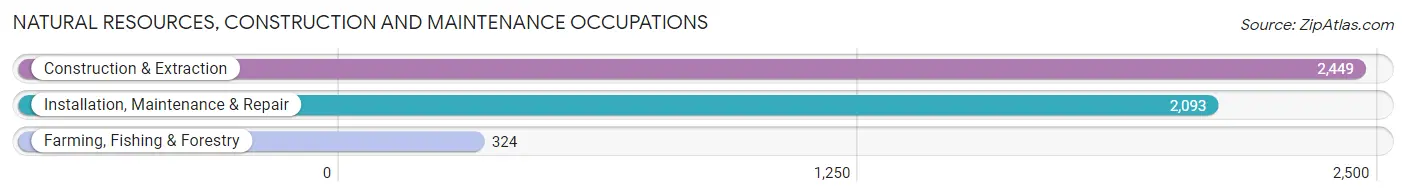
Natural Resources, Construction and Maintenance Occupations
The most common Natural Resources, Construction and Maintenance occupations in Whitfield County are Construction & Extraction (2,449 | 5.2%), Installation, Maintenance & Repair (2,093 | 4.4%), and Farming, Fishing & Forestry (324 | 0.7%).
Natural Resources, Construction and Maintenance Occupations by Sex
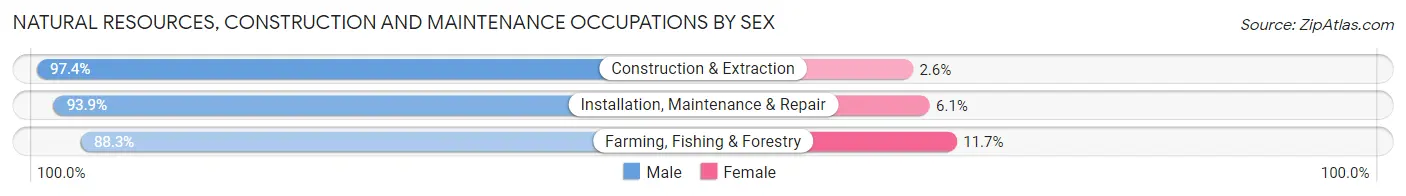
| Occupation | Male | Female |
| Farming, Fishing & Forestry | 286 (88.3%) | 38 (11.7%) |
| Construction & Extraction | 2,385 (97.4%) | 64 (2.6%) |
| Installation, Maintenance & Repair | 1,966 (93.9%) | 127 (6.1%) |
| Total (Category) | 4,637 (95.3%) | 229 (4.7%) |
| Total (Overall) | 25,918 (54.7%) | 21,488 (45.3%) |
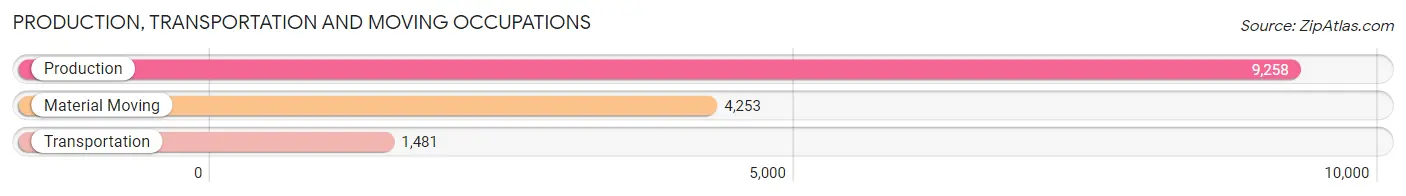
Production, Transportation and Moving Occupations
The most common Production, Transportation and Moving occupations in Whitfield County are Production (9,258 | 19.5%), Material Moving (4,253 | 9.0%), and Transportation (1,481 | 3.1%).
Production, Transportation and Moving Occupations by Sex
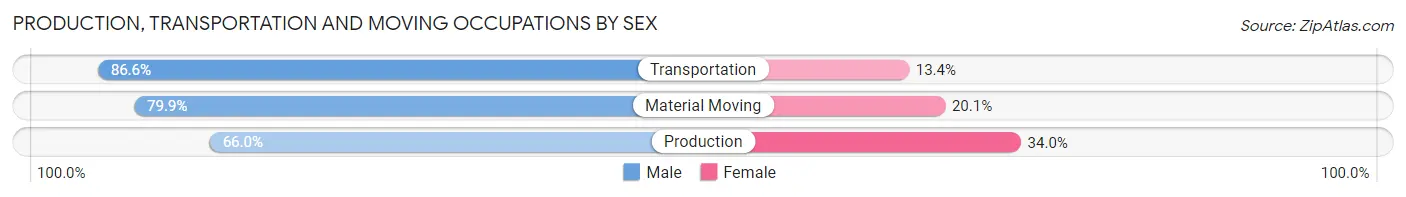
| Occupation | Male | Female |
| Production | 6,113 (66.0%) | 3,145 (34.0%) |
| Transportation | 1,282 (86.6%) | 199 (13.4%) |
| Material Moving | 3,399 (79.9%) | 854 (20.1%) |
| Total (Category) | 10,794 (72.0%) | 4,198 (28.0%) |
| Total (Overall) | 25,918 (54.7%) | 21,488 (45.3%) |
Employment Industries by Sex in Whitfield County
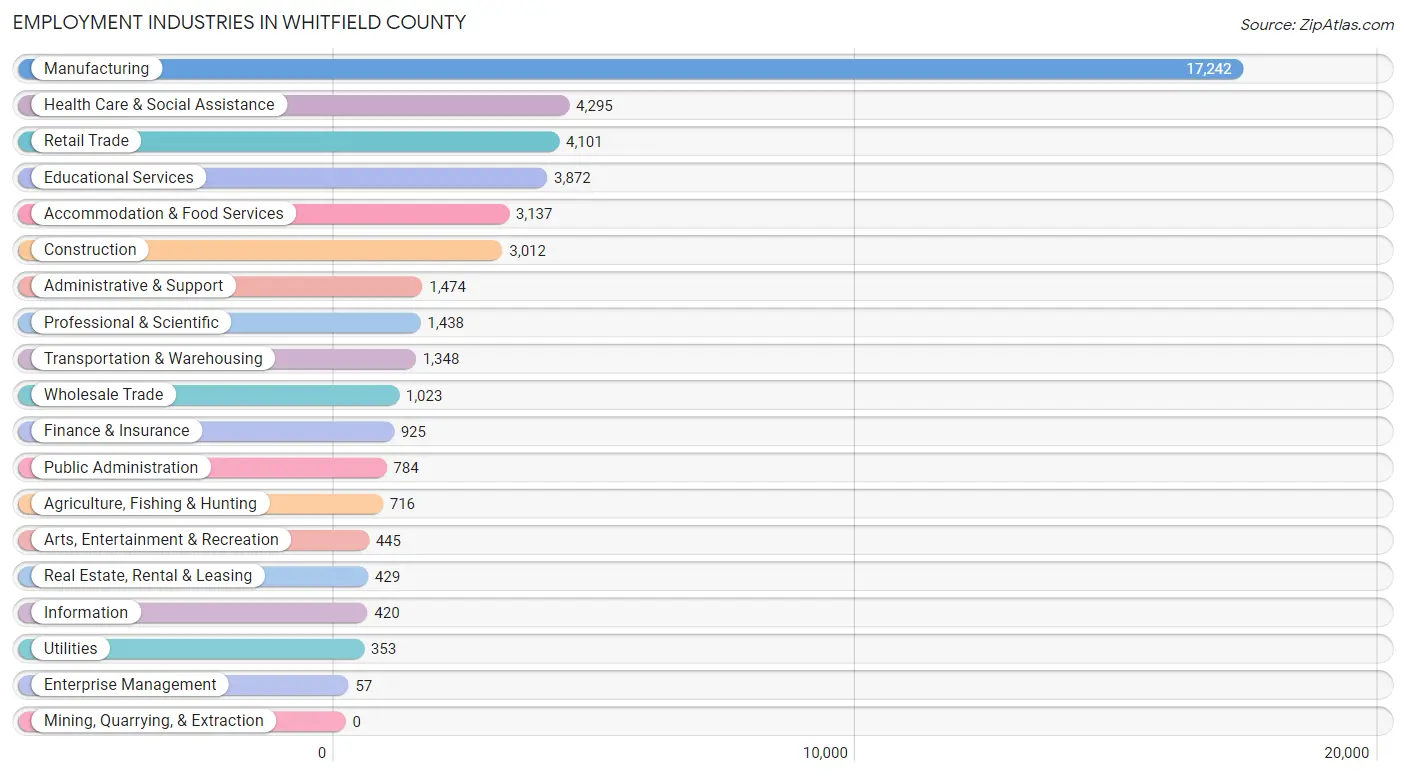
Employment Industries in Whitfield County
The major employment industries in Whitfield County include Manufacturing (17,242 | 36.4%), Health Care & Social Assistance (4,295 | 9.1%), Retail Trade (4,101 | 8.6%), Educational Services (3,872 | 8.2%), and Accommodation & Food Services (3,137 | 6.6%).
Employment Industries by Sex in Whitfield County
The Whitfield County industries that see more men than women are Construction (94.3%), Arts, Entertainment & Recreation (92.4%), and Agriculture, Fishing & Hunting (89.8%), whereas the industries that tend to have a higher number of women are Health Care & Social Assistance (85.0%), Educational Services (78.7%), and Finance & Insurance (76.5%).
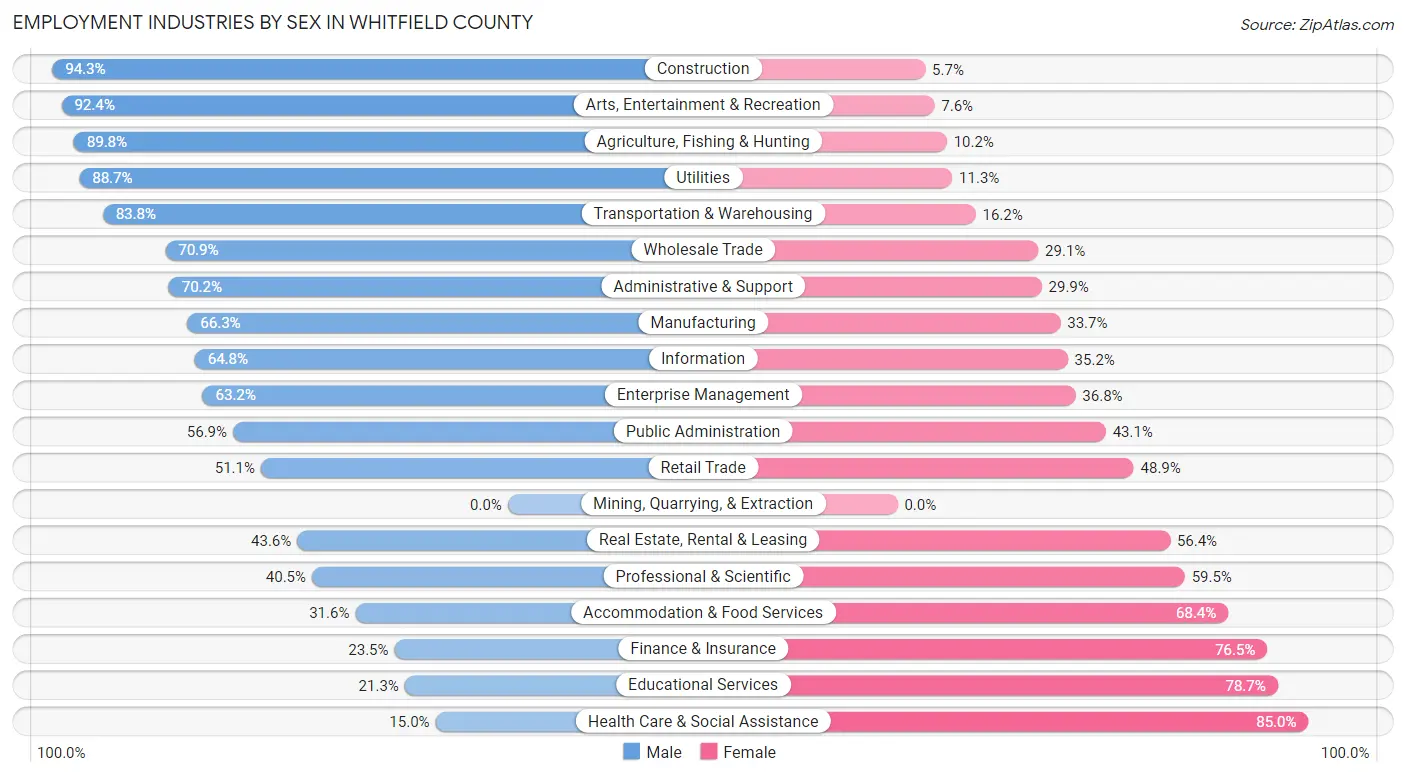
| Industry | Male | Female |
| Agriculture, Fishing & Hunting | 643 (89.8%) | 73 (10.2%) |
| Mining, Quarrying, & Extraction | 0 (0.0%) | 0 (0.0%) |
| Construction | 2,839 (94.3%) | 173 (5.7%) |
| Manufacturing | 11,429 (66.3%) | 5,813 (33.7%) |
| Wholesale Trade | 725 (70.9%) | 298 (29.1%) |
| Retail Trade | 2,096 (51.1%) | 2,005 (48.9%) |
| Transportation & Warehousing | 1,130 (83.8%) | 218 (16.2%) |
| Utilities | 313 (88.7%) | 40 (11.3%) |
| Information | 272 (64.8%) | 148 (35.2%) |
| Finance & Insurance | 217 (23.5%) | 708 (76.5%) |
| Real Estate, Rental & Leasing | 187 (43.6%) | 242 (56.4%) |
| Professional & Scientific | 583 (40.5%) | 855 (59.5%) |
| Enterprise Management | 36 (63.2%) | 21 (36.8%) |
| Administrative & Support | 1,034 (70.2%) | 440 (29.8%) |
| Educational Services | 826 (21.3%) | 3,046 (78.7%) |
| Health Care & Social Assistance | 643 (15.0%) | 3,652 (85.0%) |
| Arts, Entertainment & Recreation | 411 (92.4%) | 34 (7.6%) |
| Accommodation & Food Services | 990 (31.6%) | 2,147 (68.4%) |
| Public Administration | 446 (56.9%) | 338 (43.1%) |
| Total | 25,918 (54.7%) | 21,488 (45.3%) |
Education in Whitfield County
School Enrollment in Whitfield County
The most common levels of schooling among the 25,678 students in Whitfield County are high school (6,498 | 25.3%), middle school (6,219 | 24.2%), and elementary school (5,304 | 20.7%).
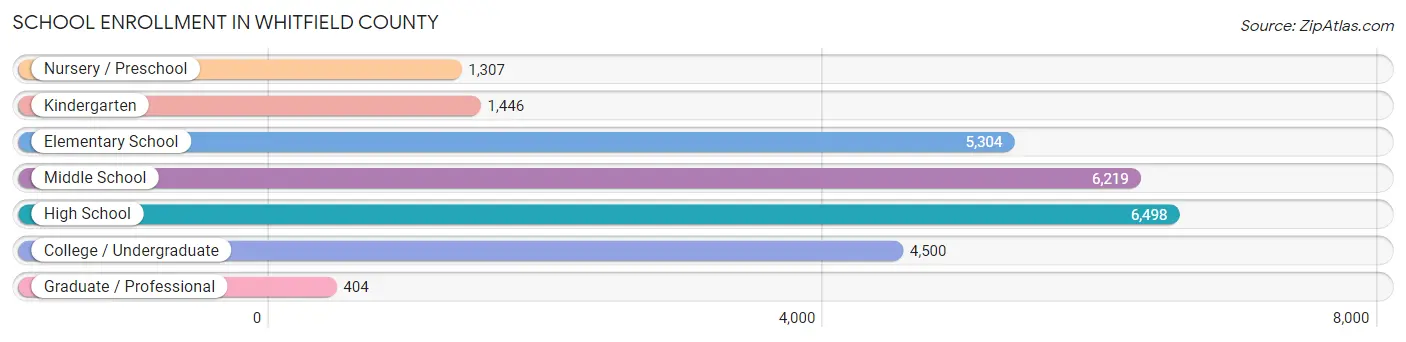
| School Level | # Students | % Students |
| Nursery / Preschool | 1,307 | 5.1% |
| Kindergarten | 1,446 | 5.6% |
| Elementary School | 5,304 | 20.7% |
| Middle School | 6,219 | 24.2% |
| High School | 6,498 | 25.3% |
| College / Undergraduate | 4,500 | 17.5% |
| Graduate / Professional | 404 | 1.6% |
| Total | 25,678 | 100.0% |
School Enrollment by Age by Funding Source in Whitfield County
Out of a total of 25,678 students who are enrolled in schools in Whitfield County, 1,258 (4.9%) attend a private institution, while the remaining 24,420 (95.1%) are enrolled in public schools. The age group of 3 to 4 year olds has the highest likelihood of being enrolled in private schools, with 145 (17.9% in the age bracket) enrolled. Conversely, the age group of 5 to 9 year old has the lowest likelihood of being enrolled in a private school, with 6,520 (97.3% in the age bracket) attending a public institution.
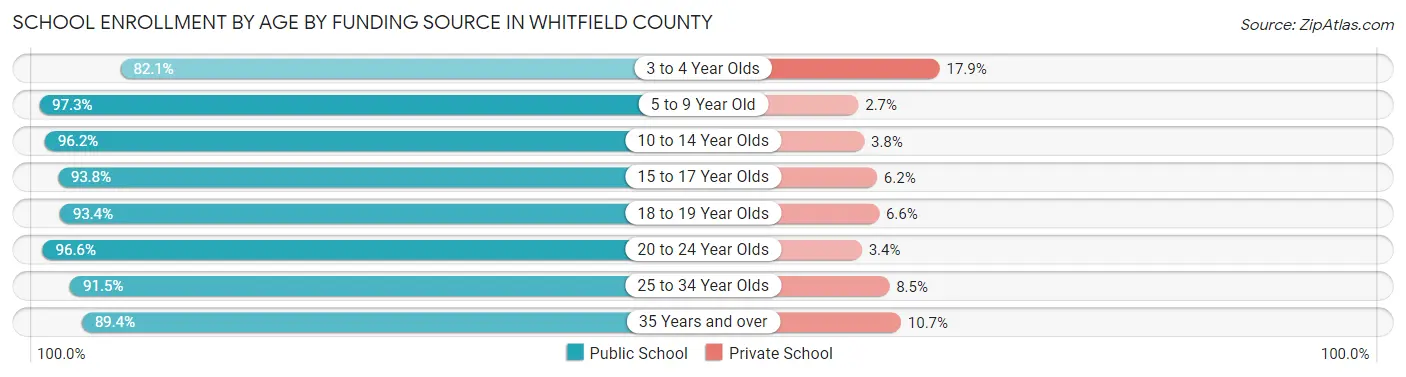
| Age Bracket | Public School | Private School |
| 3 to 4 Year Olds | 667 (82.1%) | 145 (17.9%) |
| 5 to 9 Year Old | 6,520 (97.3%) | 182 (2.7%) |
| 10 to 14 Year Olds | 7,242 (96.2%) | 285 (3.8%) |
| 15 to 17 Year Olds | 4,429 (93.8%) | 292 (6.2%) |
| 18 to 19 Year Olds | 1,778 (93.4%) | 125 (6.6%) |
| 20 to 24 Year Olds | 2,358 (96.6%) | 82 (3.4%) |
| 25 to 34 Year Olds | 907 (91.5%) | 84 (8.5%) |
| 35 Years and over | 520 (89.3%) | 62 (10.6%) |
| Total | 24,420 (95.1%) | 1,258 (4.9%) |
Educational Attainment by Field of Study in Whitfield County
Education (3,008 | 23.3%), business (2,836 | 22.0%), science & technology (1,282 | 9.9%), bio, nature & agricultural (1,020 | 7.9%), and arts & humanities (883 | 6.8%) are the most common fields of study among 12,912 individuals in Whitfield County who have obtained a bachelor's degree or higher.
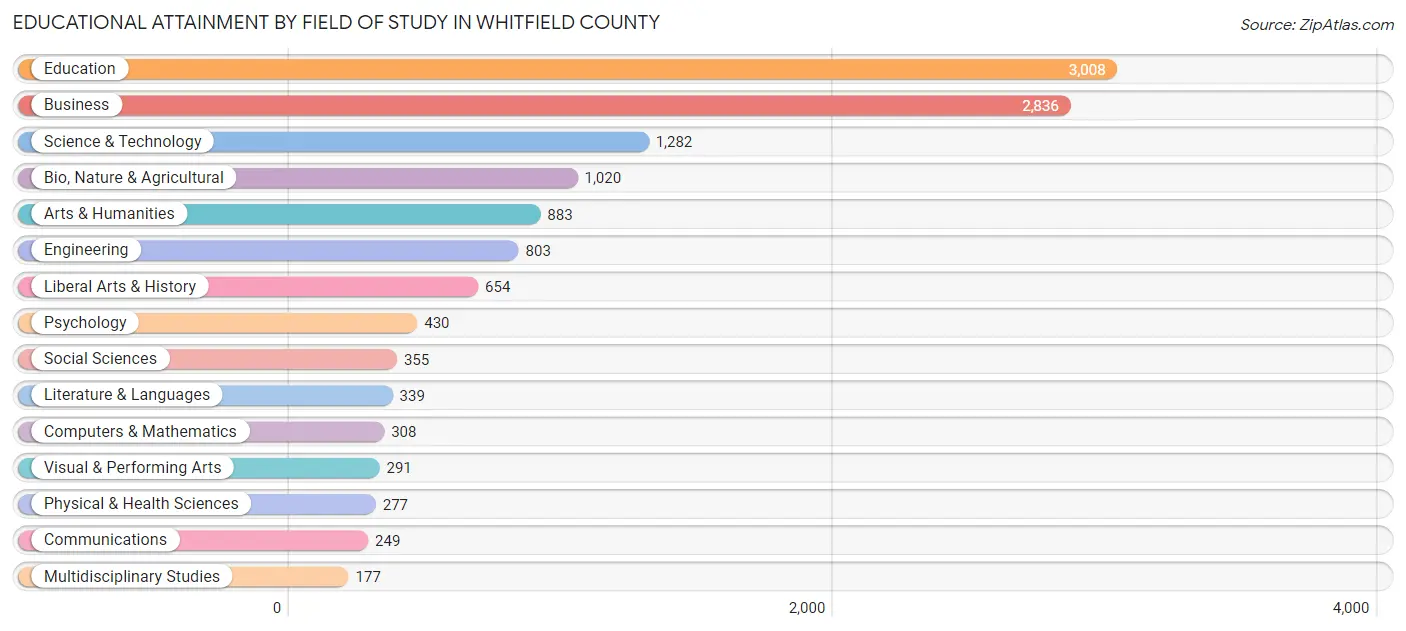
| Field of Study | # Graduates | % Graduates |
| Computers & Mathematics | 308 | 2.4% |
| Bio, Nature & Agricultural | 1,020 | 7.9% |
| Physical & Health Sciences | 277 | 2.1% |
| Psychology | 430 | 3.3% |
| Social Sciences | 355 | 2.8% |
| Engineering | 803 | 6.2% |
| Multidisciplinary Studies | 177 | 1.4% |
| Science & Technology | 1,282 | 9.9% |
| Business | 2,836 | 22.0% |
| Education | 3,008 | 23.3% |
| Literature & Languages | 339 | 2.6% |
| Liberal Arts & History | 654 | 5.1% |
| Visual & Performing Arts | 291 | 2.2% |
| Communications | 249 | 1.9% |
| Arts & Humanities | 883 | 6.8% |
| Total | 12,912 | 100.0% |
Transportation & Commute in Whitfield County
Vehicle Availability by Sex in Whitfield County
The most prevalent vehicle ownership categories in Whitfield County are males with 2 vehicles (9,691, accounting for 37.6%) and females with 2 vehicles (8,311, making up 45.8%).
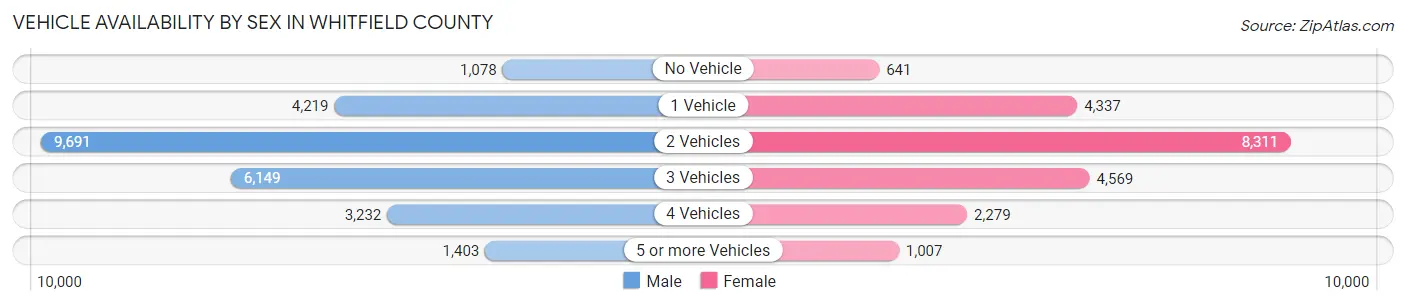
| Vehicles Available | Male | Female |
| No Vehicle | 1,078 (4.2%) | 641 (3.0%) |
| 1 Vehicle | 4,219 (16.4%) | 4,337 (20.5%) |
| 2 Vehicles | 9,691 (37.6%) | 8,311 (39.3%) |
| 3 Vehicles | 6,149 (23.9%) | 4,569 (21.6%) |
| 4 Vehicles | 3,232 (12.5%) | 2,279 (10.8%) |
| 5 or more Vehicles | 1,403 (5.4%) | 1,007 (4.8%) |
| Total | 25,772 (100.0%) | 21,144 (100.0%) |
Commute Time in Whitfield County
The most frequently occuring commute durations in Whitfield County are 15 to 19 minutes (10,847 commuters, 24.0%), 20 to 24 minutes (8,652 commuters, 19.1%), and 10 to 14 minutes (6,831 commuters, 15.1%).
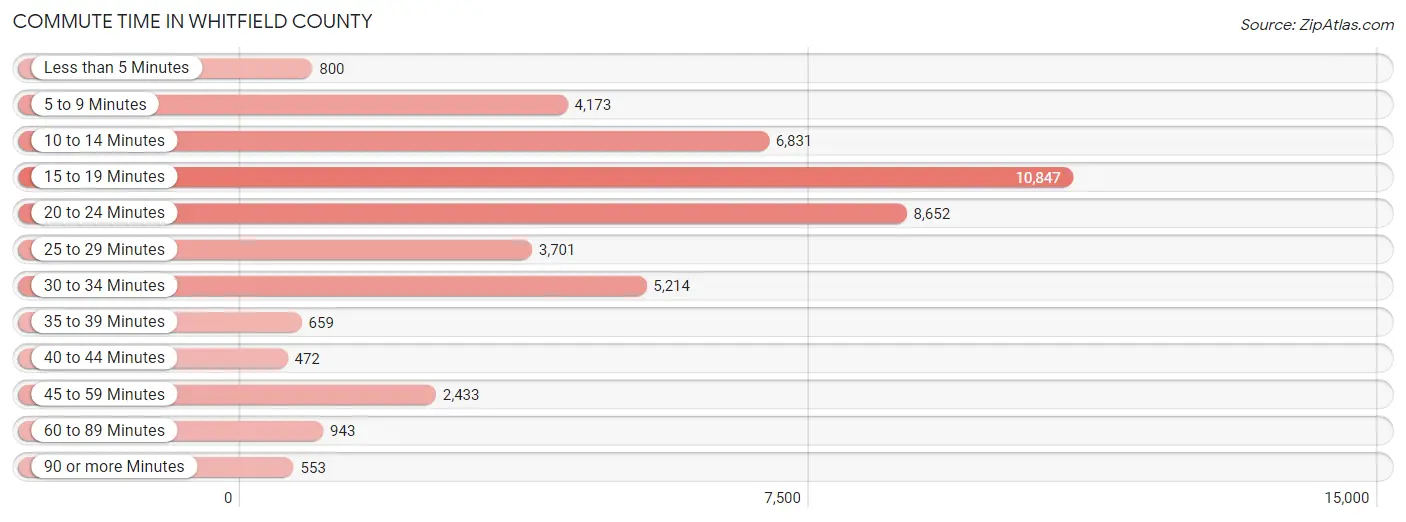
| Commute Time | # Commuters | % Commuters |
| Less than 5 Minutes | 800 | 1.8% |
| 5 to 9 Minutes | 4,173 | 9.2% |
| 10 to 14 Minutes | 6,831 | 15.1% |
| 15 to 19 Minutes | 10,847 | 24.0% |
| 20 to 24 Minutes | 8,652 | 19.1% |
| 25 to 29 Minutes | 3,701 | 8.2% |
| 30 to 34 Minutes | 5,214 | 11.5% |
| 35 to 39 Minutes | 659 | 1.5% |
| 40 to 44 Minutes | 472 | 1.0% |
| 45 to 59 Minutes | 2,433 | 5.4% |
| 60 to 89 Minutes | 943 | 2.1% |
| 90 or more Minutes | 553 | 1.2% |
Commute Time by Sex in Whitfield County
The most common commute times in Whitfield County are 15 to 19 minutes (5,933 commuters, 23.7%) for males and 15 to 19 minutes (4,914 commuters, 24.2%) for females.
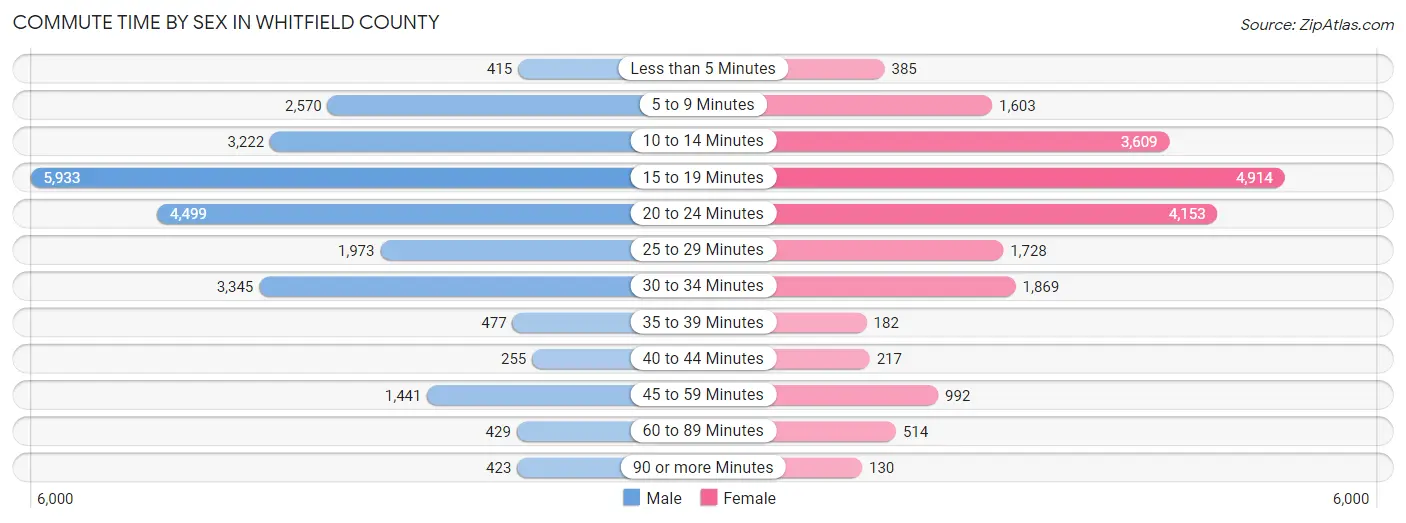
| Commute Time | Male | Female |
| Less than 5 Minutes | 415 (1.7%) | 385 (1.9%) |
| 5 to 9 Minutes | 2,570 (10.3%) | 1,603 (7.9%) |
| 10 to 14 Minutes | 3,222 (12.9%) | 3,609 (17.8%) |
| 15 to 19 Minutes | 5,933 (23.7%) | 4,914 (24.2%) |
| 20 to 24 Minutes | 4,499 (18.0%) | 4,153 (20.5%) |
| 25 to 29 Minutes | 1,973 (7.9%) | 1,728 (8.5%) |
| 30 to 34 Minutes | 3,345 (13.4%) | 1,869 (9.2%) |
| 35 to 39 Minutes | 477 (1.9%) | 182 (0.9%) |
| 40 to 44 Minutes | 255 (1.0%) | 217 (1.1%) |
| 45 to 59 Minutes | 1,441 (5.8%) | 992 (4.9%) |
| 60 to 89 Minutes | 429 (1.7%) | 514 (2.5%) |
| 90 or more Minutes | 423 (1.7%) | 130 (0.6%) |
Time of Departure to Work by Sex in Whitfield County
The most frequent times of departure to work in Whitfield County are 6:00 AM to 6:29 AM (4,904, 19.6%) for males and 7:00 AM to 7:29 AM (4,721, 23.3%) for females.
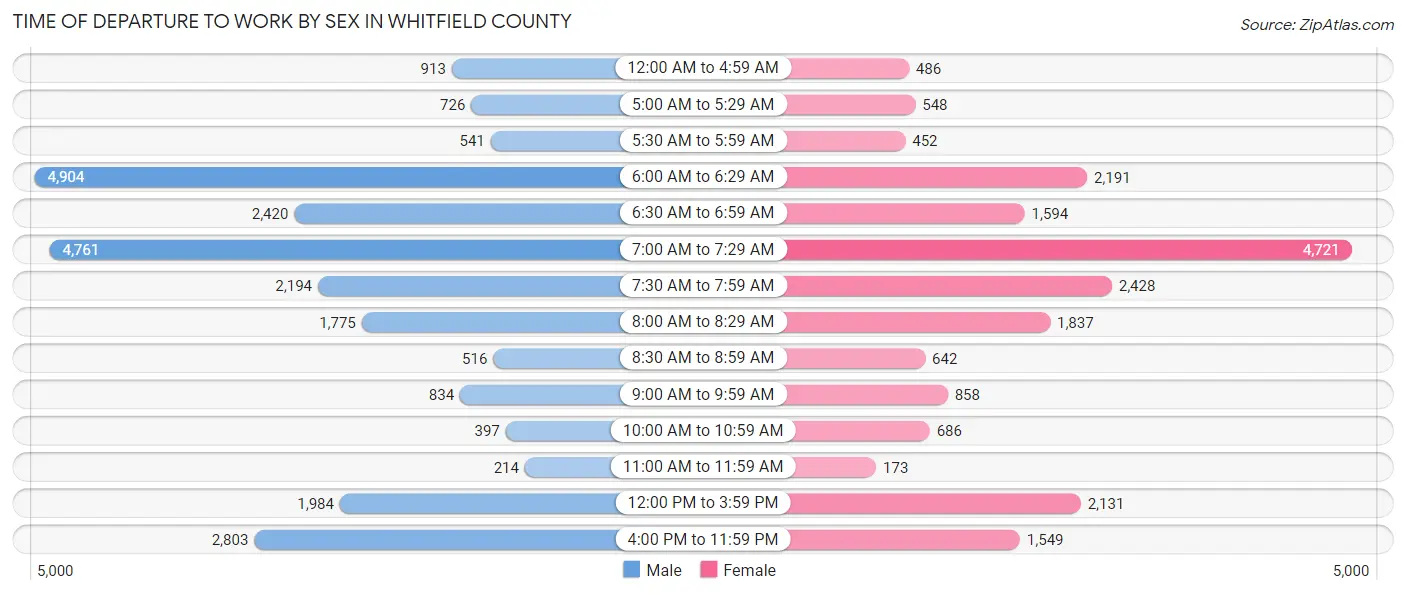
| Time of Departure | Male | Female |
| 12:00 AM to 4:59 AM | 913 (3.6%) | 486 (2.4%) |
| 5:00 AM to 5:29 AM | 726 (2.9%) | 548 (2.7%) |
| 5:30 AM to 5:59 AM | 541 (2.2%) | 452 (2.2%) |
| 6:00 AM to 6:29 AM | 4,904 (19.6%) | 2,191 (10.8%) |
| 6:30 AM to 6:59 AM | 2,420 (9.7%) | 1,594 (7.9%) |
| 7:00 AM to 7:29 AM | 4,761 (19.1%) | 4,721 (23.3%) |
| 7:30 AM to 7:59 AM | 2,194 (8.8%) | 2,428 (12.0%) |
| 8:00 AM to 8:29 AM | 1,775 (7.1%) | 1,837 (9.0%) |
| 8:30 AM to 8:59 AM | 516 (2.1%) | 642 (3.2%) |
| 9:00 AM to 9:59 AM | 834 (3.3%) | 858 (4.2%) |
| 10:00 AM to 10:59 AM | 397 (1.6%) | 686 (3.4%) |
| 11:00 AM to 11:59 AM | 214 (0.9%) | 173 (0.9%) |
| 12:00 PM to 3:59 PM | 1,984 (7.9%) | 2,131 (10.5%) |
| 4:00 PM to 11:59 PM | 2,803 (11.2%) | 1,549 (7.6%) |
| Total | 24,982 (100.0%) | 20,296 (100.0%) |
Housing Occupancy in Whitfield County
Occupancy by Ownership in Whitfield County
Of the total 35,797 dwellings in Whitfield County, owner-occupied units account for 24,307 (67.9%), while renter-occupied units make up 11,490 (32.1%).
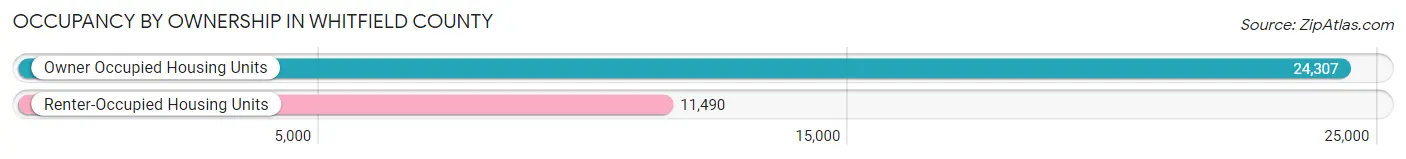
| Occupancy | # Housing Units | % Housing Units |
| Owner Occupied Housing Units | 24,307 | 67.9% |
| Renter-Occupied Housing Units | 11,490 | 32.1% |
| Total Occupied Housing Units | 35,797 | 100.0% |
Occupancy by Household Size in Whitfield County
| Household Size | # Housing Units | % Housing Units |
| 1-Person Household | 8,628 | 24.1% |
| 2-Person Household | 10,972 | 30.6% |
| 3-Person Household | 5,709 | 16.0% |
| 4+ Person Household | 10,488 | 29.3% |
| Total Housing Units | 35,797 | 100.0% |
Occupancy by Ownership by Household Size in Whitfield County
| Household Size | Owner-occupied | Renter-occupied |
| 1-Person Household | 5,034 (58.3%) | 3,594 (41.7%) |
| 2-Person Household | 8,069 (73.5%) | 2,903 (26.5%) |
| 3-Person Household | 4,012 (70.3%) | 1,697 (29.7%) |
| 4+ Person Household | 7,192 (68.6%) | 3,296 (31.4%) |
| Total Housing Units | 24,307 (67.9%) | 11,490 (32.1%) |
Occupancy by Educational Attainment in Whitfield County
| Household Size | Owner-occupied | Renter-occupied |
| Less than High School | 4,946 (61.4%) | 3,105 (38.6%) |
| High School Diploma | 6,835 (62.8%) | 4,046 (37.2%) |
| College/Associate Degree | 6,654 (68.9%) | 3,009 (31.1%) |
| Bachelor's Degree or higher | 5,872 (81.5%) | 1,330 (18.5%) |
Occupancy by Age of Householder in Whitfield County
| Age Bracket | # Households | % Households |
| Under 35 Years | 6,582 | 18.4% |
| 35 to 44 Years | 6,895 | 19.3% |
| 45 to 54 Years | 6,628 | 18.5% |
| 55 to 64 Years | 6,873 | 19.2% |
| 65 to 74 Years | 5,108 | 14.3% |
| 75 to 84 Years | 2,732 | 7.6% |
| 85 Years and Over | 979 | 2.7% |
| Total | 35,797 | 100.0% |
Housing Finances in Whitfield County
Median Income by Occupancy in Whitfield County
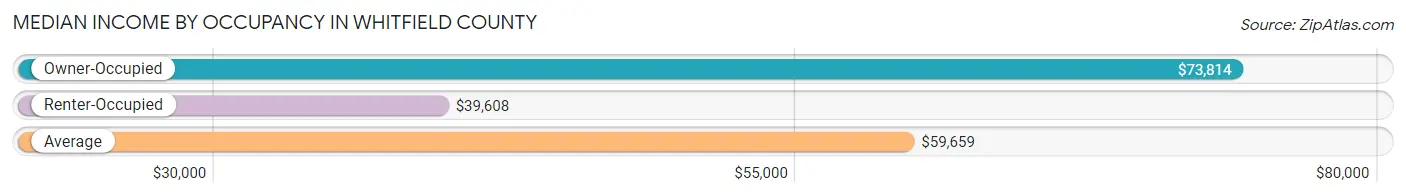
| Occupancy Type | # Households | Median Income |
| Owner-Occupied | 24,307 (67.9%) | $73,814 |
| Renter-Occupied | 11,490 (32.1%) | $39,608 |
| Average | 35,797 (100.0%) | $59,659 |
Occupancy by Householder Income Bracket in Whitfield County
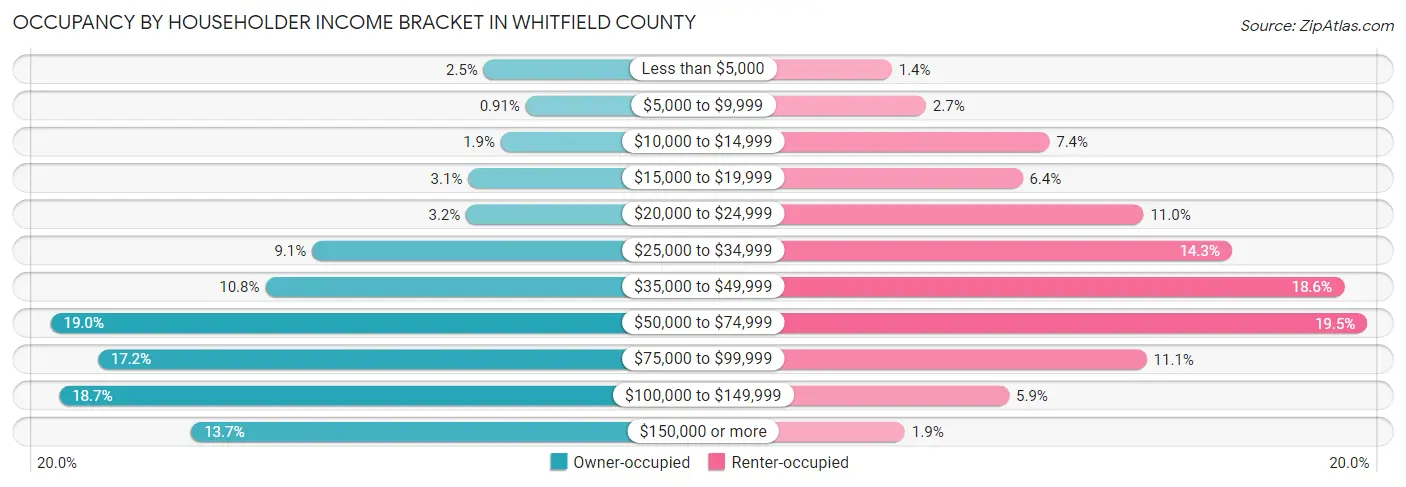
| Income Bracket | Owner-occupied | Renter-occupied |
| Less than $5,000 | 611 (2.5%) | 158 (1.4%) |
| $5,000 to $9,999 | 220 (0.9%) | 308 (2.7%) |
| $10,000 to $14,999 | 453 (1.9%) | 848 (7.4%) |
| $15,000 to $19,999 | 753 (3.1%) | 731 (6.4%) |
| $20,000 to $24,999 | 773 (3.2%) | 1,261 (11.0%) |
| $25,000 to $34,999 | 2,200 (9.0%) | 1,646 (14.3%) |
| $35,000 to $49,999 | 2,633 (10.8%) | 2,137 (18.6%) |
| $50,000 to $74,999 | 4,621 (19.0%) | 2,239 (19.5%) |
| $75,000 to $99,999 | 4,183 (17.2%) | 1,274 (11.1%) |
| $100,000 to $149,999 | 4,541 (18.7%) | 672 (5.9%) |
| $150,000 or more | 3,319 (13.7%) | 216 (1.9%) |
| Total | 24,307 (100.0%) | 11,490 (100.0%) |
Monthly Housing Cost Tiers in Whitfield County
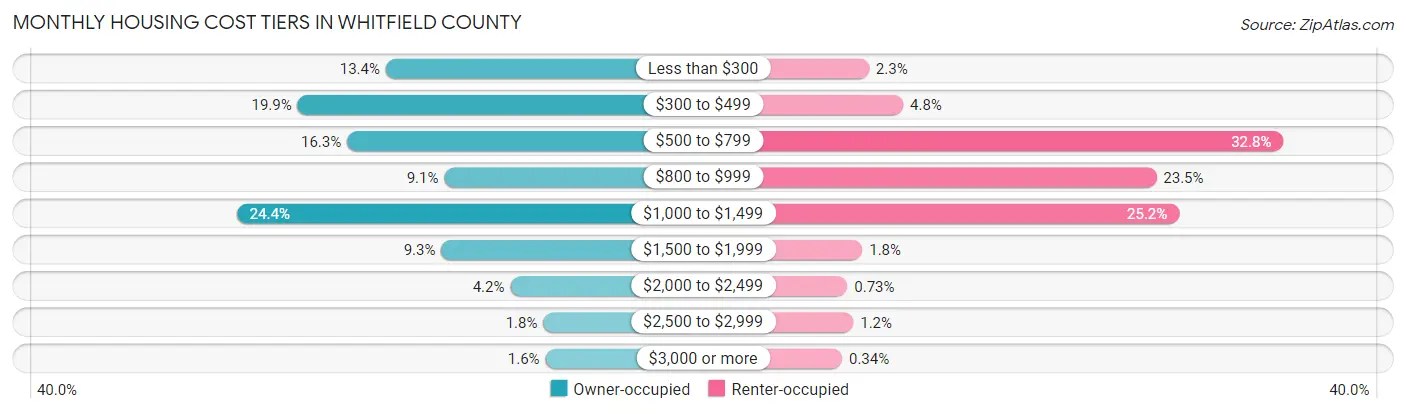
| Monthly Cost | Owner-occupied | Renter-occupied |
| Less than $300 | 3,257 (13.4%) | 266 (2.3%) |
| $300 to $499 | 4,837 (19.9%) | 556 (4.8%) |
| $500 to $799 | 3,949 (16.3%) | 3,772 (32.8%) |
| $800 to $999 | 2,209 (9.1%) | 2,699 (23.5%) |
| $1,000 to $1,499 | 5,927 (24.4%) | 2,891 (25.2%) |
| $1,500 to $1,999 | 2,264 (9.3%) | 210 (1.8%) |
| $2,000 to $2,499 | 1,029 (4.2%) | 84 (0.7%) |
| $2,500 to $2,999 | 437 (1.8%) | 135 (1.2%) |
| $3,000 or more | 398 (1.6%) | 39 (0.3%) |
| Total | 24,307 (100.0%) | 11,490 (100.0%) |
Physical Housing Characteristics in Whitfield County
Housing Structures in Whitfield County
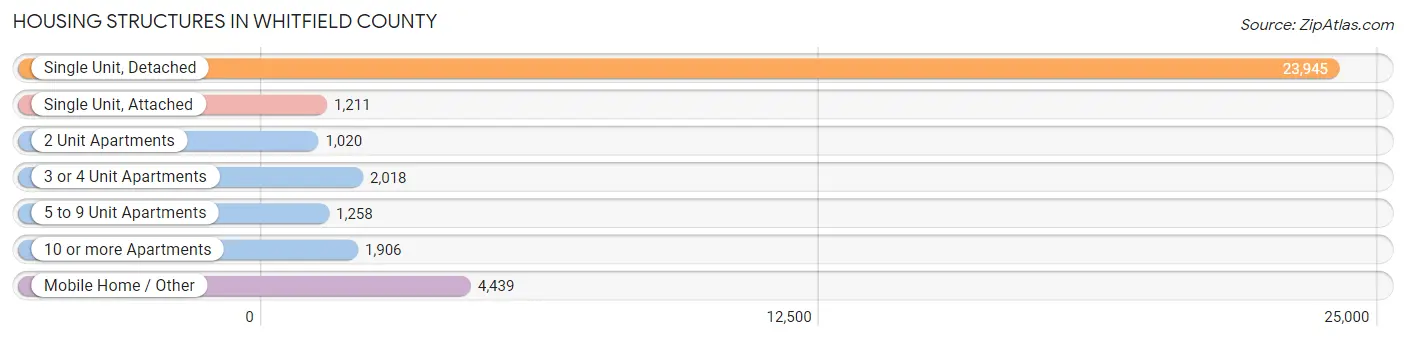
| Structure Type | # Housing Units | % Housing Units |
| Single Unit, Detached | 23,945 | 66.9% |
| Single Unit, Attached | 1,211 | 3.4% |
| 2 Unit Apartments | 1,020 | 2.9% |
| 3 or 4 Unit Apartments | 2,018 | 5.6% |
| 5 to 9 Unit Apartments | 1,258 | 3.5% |
| 10 or more Apartments | 1,906 | 5.3% |
| Mobile Home / Other | 4,439 | 12.4% |
| Total | 35,797 | 100.0% |
Housing Structures by Occupancy in Whitfield County
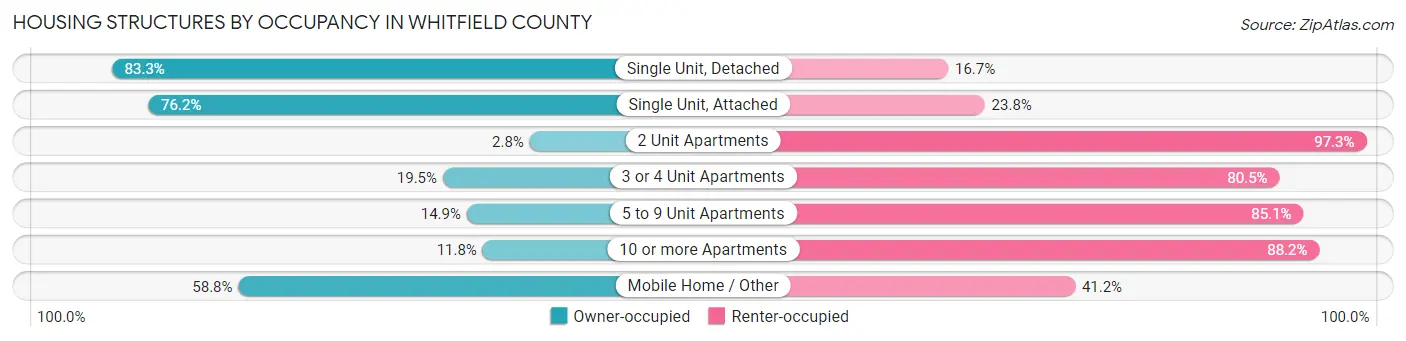
| Structure Type | Owner-occupied | Renter-occupied |
| Single Unit, Detached | 19,939 (83.3%) | 4,006 (16.7%) |
| Single Unit, Attached | 923 (76.2%) | 288 (23.8%) |
| 2 Unit Apartments | 28 (2.8%) | 992 (97.3%) |
| 3 or 4 Unit Apartments | 393 (19.5%) | 1,625 (80.5%) |
| 5 to 9 Unit Apartments | 187 (14.9%) | 1,071 (85.1%) |
| 10 or more Apartments | 225 (11.8%) | 1,681 (88.2%) |
| Mobile Home / Other | 2,612 (58.8%) | 1,827 (41.2%) |
| Total | 24,307 (67.9%) | 11,490 (32.1%) |
Housing Structures by Number of Rooms in Whitfield County
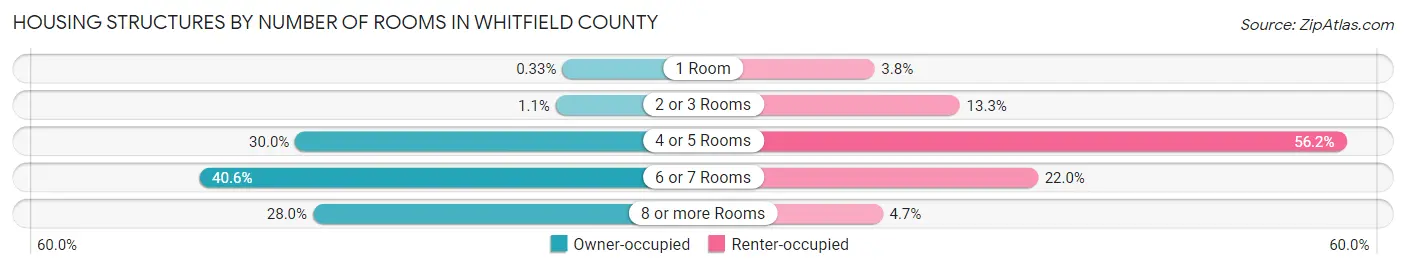
| Number of Rooms | Owner-occupied | Renter-occupied |
| 1 Room | 79 (0.3%) | 440 (3.8%) |
| 2 or 3 Rooms | 258 (1.1%) | 1,527 (13.3%) |
| 4 or 5 Rooms | 7,285 (30.0%) | 6,457 (56.2%) |
| 6 or 7 Rooms | 9,877 (40.6%) | 2,522 (22.0%) |
| 8 or more Rooms | 6,808 (28.0%) | 544 (4.7%) |
| Total | 24,307 (100.0%) | 11,490 (100.0%) |
Housing Structure by Heating Type in Whitfield County
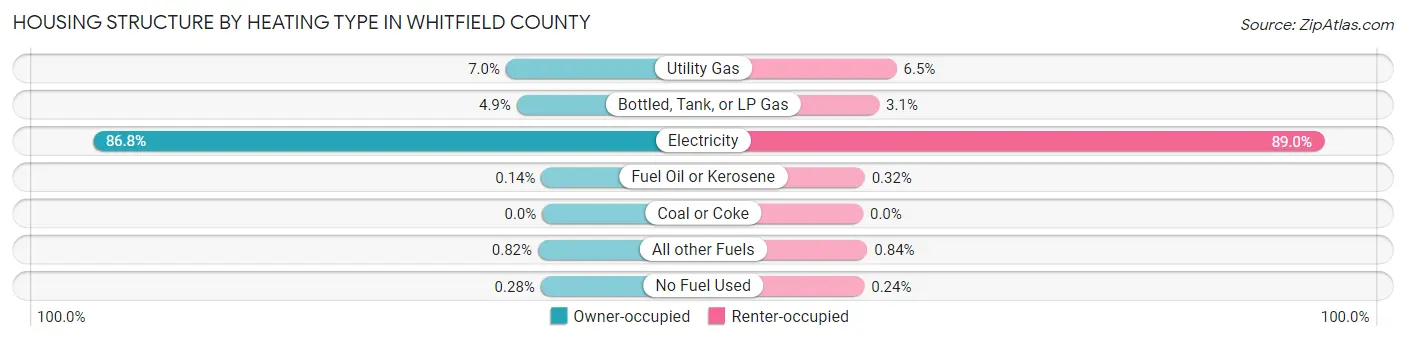
| Heating Type | Owner-occupied | Renter-occupied |
| Utility Gas | 1,704 (7.0%) | 744 (6.5%) |
| Bottled, Tank, or LP Gas | 1,197 (4.9%) | 357 (3.1%) |
| Electricity | 21,105 (86.8%) | 10,227 (89.0%) |
| Fuel Oil or Kerosene | 34 (0.1%) | 37 (0.3%) |
| Coal or Coke | 0 (0.0%) | 0 (0.0%) |
| All other Fuels | 199 (0.8%) | 97 (0.8%) |
| No Fuel Used | 68 (0.3%) | 28 (0.2%) |
| Total | 24,307 (100.0%) | 11,490 (100.0%) |
Household Vehicle Usage in Whitfield County
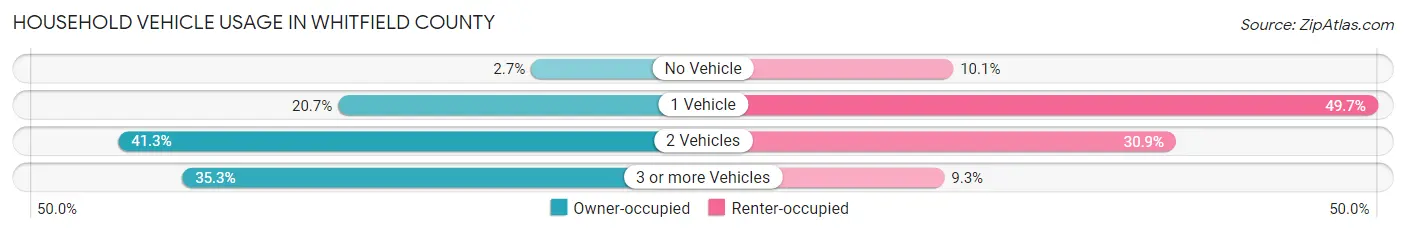
| Vehicles per Household | Owner-occupied | Renter-occupied |
| No Vehicle | 663 (2.7%) | 1,162 (10.1%) |
| 1 Vehicle | 5,042 (20.7%) | 5,713 (49.7%) |
| 2 Vehicles | 10,027 (41.2%) | 3,549 (30.9%) |
| 3 or more Vehicles | 8,575 (35.3%) | 1,066 (9.3%) |
| Total | 24,307 (100.0%) | 11,490 (100.0%) |
Real Estate & Mortgages in Whitfield County
Real Estate and Mortgage Overview in Whitfield County
| Characteristic | Without Mortgage | With Mortgage |
| Housing Units | 11,384 | 12,923 |
| Median Property Value | $158,300 | $186,100 |
| Median Household Income | $54,720 | $2,225 |
| Monthly Housing Costs | $405 | $367 |
| Real Estate Taxes | $998 | $298 |
Property Value by Mortgage Status in Whitfield County
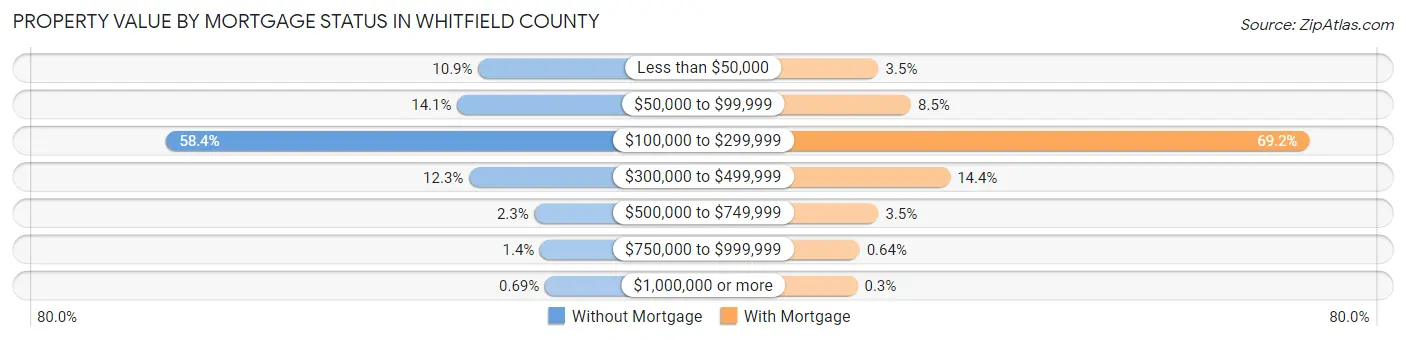
| Property Value | Without Mortgage | With Mortgage |
| Less than $50,000 | 1,236 (10.9%) | 455 (3.5%) |
| $50,000 to $99,999 | 1,601 (14.1%) | 1,094 (8.5%) |
| $100,000 to $299,999 | 6,647 (58.4%) | 8,938 (69.2%) |
| $300,000 to $499,999 | 1,396 (12.3%) | 1,863 (14.4%) |
| $500,000 to $749,999 | 261 (2.3%) | 451 (3.5%) |
| $750,000 to $999,999 | 164 (1.4%) | 83 (0.6%) |
| $1,000,000 or more | 79 (0.7%) | 39 (0.3%) |
| Total | 11,384 (100.0%) | 12,923 (100.0%) |
Household Income by Mortgage Status in Whitfield County
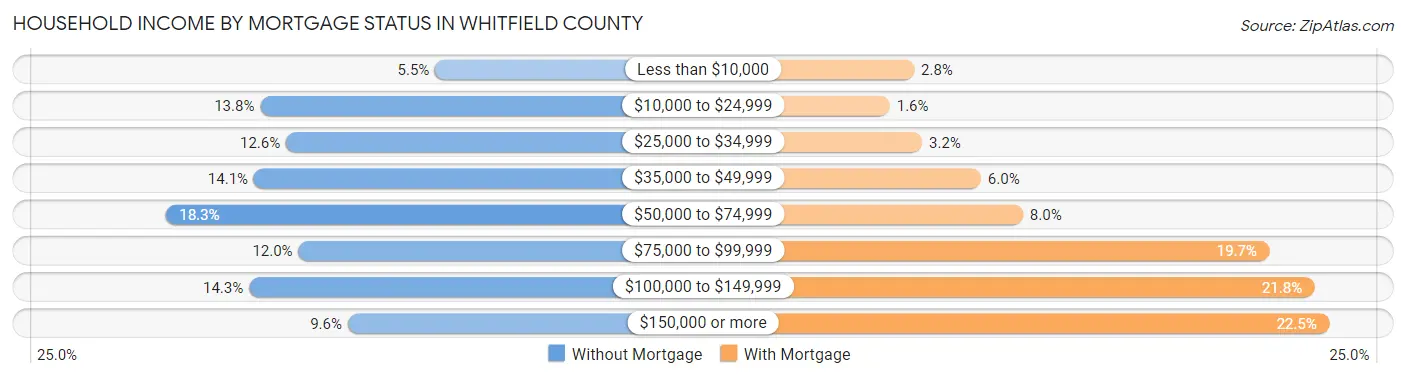
| Household Income | Without Mortgage | With Mortgage |
| Less than $10,000 | 620 (5.4%) | 361 (2.8%) |
| $10,000 to $24,999 | 1,569 (13.8%) | 211 (1.6%) |
| $25,000 to $34,999 | 1,429 (12.6%) | 410 (3.2%) |
| $35,000 to $49,999 | 1,603 (14.1%) | 771 (6.0%) |
| $50,000 to $74,999 | 2,078 (18.2%) | 1,030 (8.0%) |
| $75,000 to $99,999 | 1,362 (12.0%) | 2,543 (19.7%) |
| $100,000 to $149,999 | 1,629 (14.3%) | 2,821 (21.8%) |
| $150,000 or more | 1,094 (9.6%) | 2,912 (22.5%) |
| Total | 11,384 (100.0%) | 12,923 (100.0%) |
Property Value to Household Income Ratio in Whitfield County
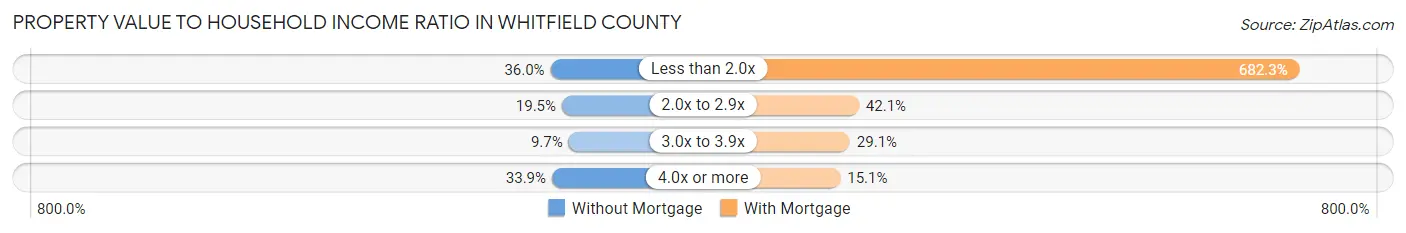
| Value-to-Income Ratio | Without Mortgage | With Mortgage |
| Less than 2.0x | 4,100 (36.0%) | 88,169 (682.3%) |
| 2.0x to 2.9x | 2,214 (19.5%) | 5,441 (42.1%) |
| 3.0x to 3.9x | 1,099 (9.7%) | 3,754 (29.0%) |
| 4.0x or more | 3,861 (33.9%) | 1,954 (15.1%) |
| Total | 11,384 (100.0%) | 12,923 (100.0%) |
Real Estate Taxes by Mortgage Status in Whitfield County
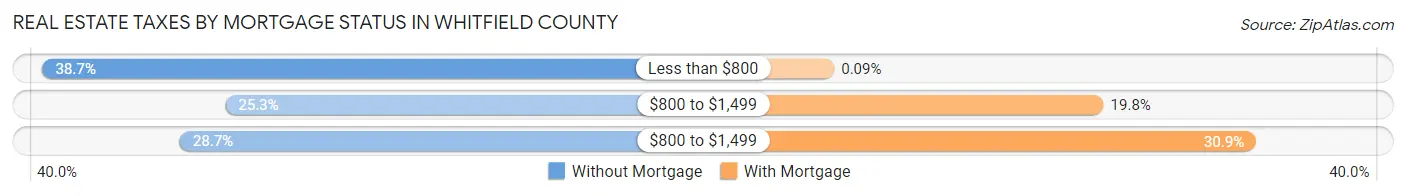
| Property Taxes | Without Mortgage | With Mortgage |
| Less than $800 | 4,404 (38.7%) | 12 (0.1%) |
| $800 to $1,499 | 2,883 (25.3%) | 2,555 (19.8%) |
| $800 to $1,499 | 3,261 (28.6%) | 3,994 (30.9%) |
| Total | 11,384 (100.0%) | 12,923 (100.0%) |
Health & Disability in Whitfield County
Health Insurance Coverage by Age in Whitfield County
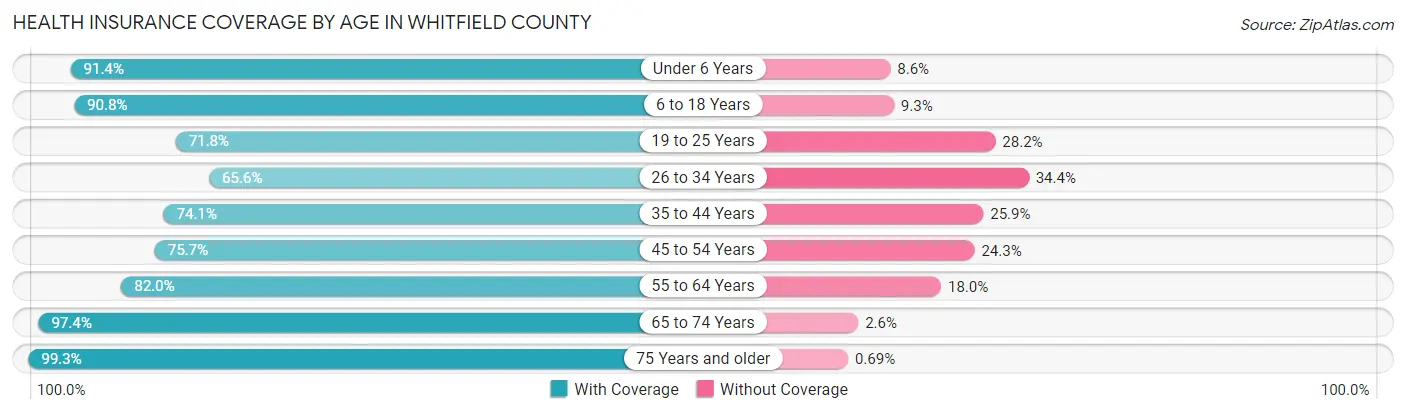
| Age Bracket | With Coverage | Without Coverage |
| Under 6 Years | 7,191 (91.4%) | 676 (8.6%) |
| 6 to 18 Years | 18,122 (90.7%) | 1,847 (9.2%) |
| 19 to 25 Years | 7,301 (71.8%) | 2,864 (28.2%) |
| 26 to 34 Years | 7,523 (65.6%) | 3,944 (34.4%) |
| 35 to 44 Years | 9,732 (74.1%) | 3,406 (25.9%) |
| 45 to 54 Years | 10,037 (75.7%) | 3,219 (24.3%) |
| 55 to 64 Years | 9,798 (82.0%) | 2,156 (18.0%) |
| 65 to 74 Years | 8,214 (97.4%) | 219 (2.6%) |
| 75 Years and older | 5,910 (99.3%) | 41 (0.7%) |
| Total | 83,828 (82.0%) | 18,372 (18.0%) |
Health Insurance Coverage by Citizenship Status in Whitfield County
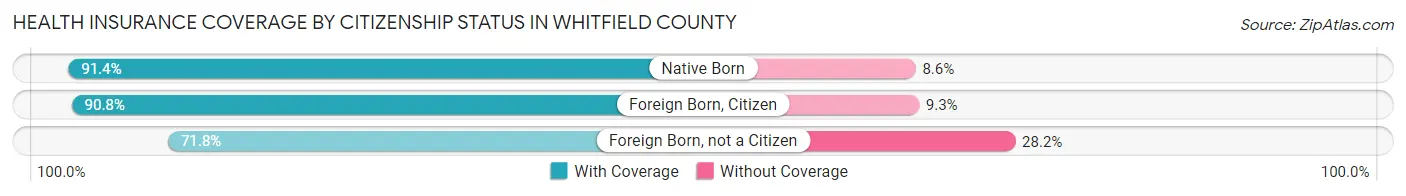
| Citizenship Status | With Coverage | Without Coverage |
| Native Born | 7,191 (91.4%) | 676 (8.6%) |
| Foreign Born, Citizen | 18,122 (90.7%) | 1,847 (9.2%) |
| Foreign Born, not a Citizen | 7,301 (71.8%) | 2,864 (28.2%) |
Health Insurance Coverage by Household Income in Whitfield County
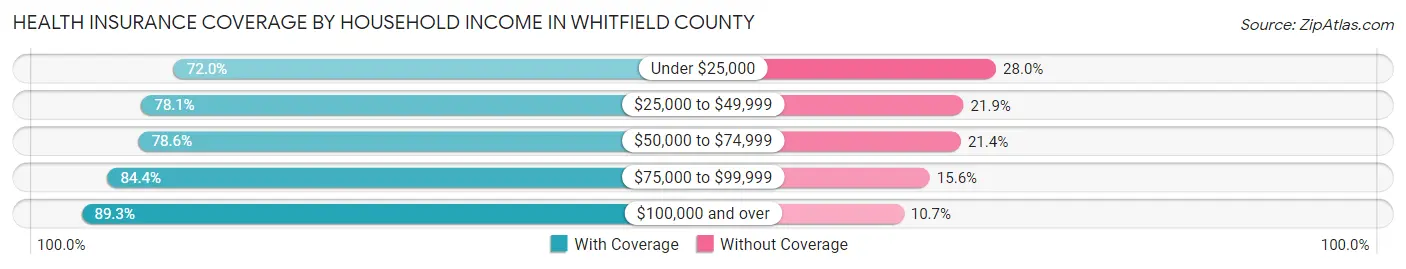
| Household Income | With Coverage | Without Coverage |
| Under $25,000 | 7,965 (72.0%) | 3,095 (28.0%) |
| $25,000 to $49,999 | 16,665 (78.1%) | 4,670 (21.9%) |
| $50,000 to $74,999 | 16,054 (78.6%) | 4,369 (21.4%) |
| $75,000 to $99,999 | 14,732 (84.4%) | 2,716 (15.6%) |
| $100,000 and over | 27,986 (89.3%) | 3,346 (10.7%) |
Public vs Private Health Insurance Coverage by Age in Whitfield County
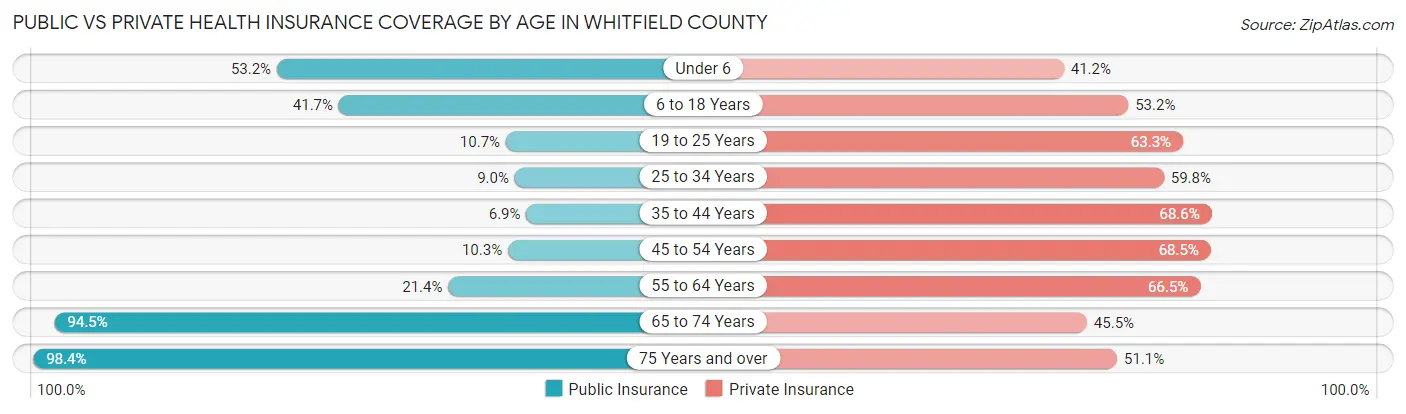
| Age Bracket | Public Insurance | Private Insurance |
| Under 6 | 4,182 (53.2%) | 3,242 (41.2%) |
| 6 to 18 Years | 8,321 (41.7%) | 10,617 (53.2%) |
| 19 to 25 Years | 1,084 (10.7%) | 6,435 (63.3%) |
| 25 to 34 Years | 1,033 (9.0%) | 6,853 (59.8%) |
| 35 to 44 Years | 901 (6.9%) | 9,016 (68.6%) |
| 45 to 54 Years | 1,363 (10.3%) | 9,076 (68.5%) |
| 55 to 64 Years | 2,552 (21.3%) | 7,951 (66.5%) |
| 65 to 74 Years | 7,967 (94.5%) | 3,837 (45.5%) |
| 75 Years and over | 5,856 (98.4%) | 3,041 (51.1%) |
| Total | 33,259 (32.5%) | 60,068 (58.8%) |
Disability Status by Sex by Age in Whitfield County
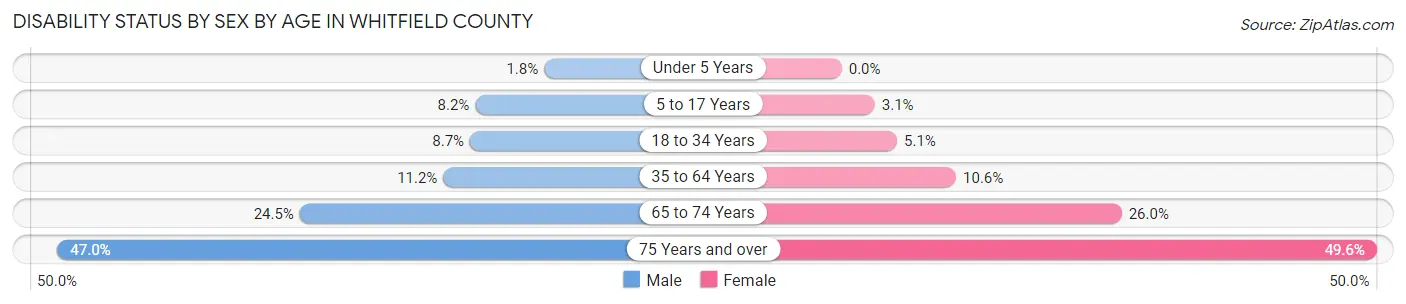
| Age Bracket | Male | Female |
| Under 5 Years | 59 (1.8%) | 0 (0.0%) |
| 5 to 17 Years | 835 (8.2%) | 292 (3.1%) |
| 18 to 34 Years | 1,044 (8.7%) | 576 (5.1%) |
| 35 to 64 Years | 2,141 (11.2%) | 2,031 (10.6%) |
| 65 to 74 Years | 966 (24.5%) | 1,165 (26.0%) |
| 75 Years and over | 1,222 (46.9%) | 1,662 (49.6%) |
Disability Class by Sex by Age in Whitfield County
Disability Class: Hearing Difficulty
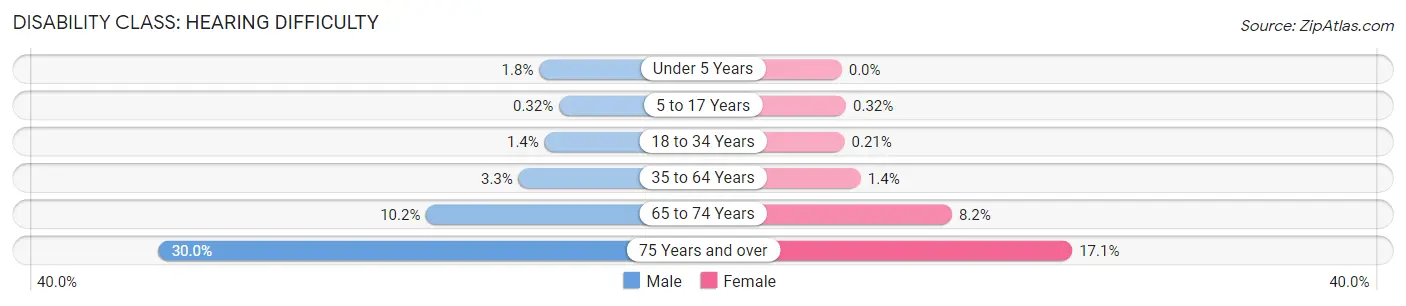
| Age Bracket | Male | Female |
| Under 5 Years | 59 (1.8%) | 0 (0.0%) |
| 5 to 17 Years | 33 (0.3%) | 30 (0.3%) |
| 18 to 34 Years | 167 (1.4%) | 24 (0.2%) |
| 35 to 64 Years | 638 (3.3%) | 271 (1.4%) |
| 65 to 74 Years | 402 (10.2%) | 367 (8.2%) |
| 75 Years and over | 782 (30.0%) | 573 (17.1%) |
Disability Class: Vision Difficulty
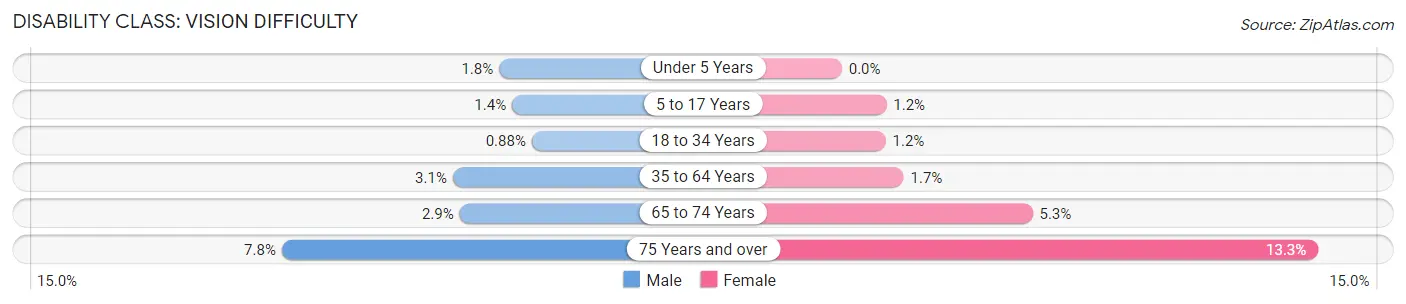
| Age Bracket | Male | Female |
| Under 5 Years | 59 (1.8%) | 0 (0.0%) |
| 5 to 17 Years | 146 (1.4%) | 118 (1.2%) |
| 18 to 34 Years | 106 (0.9%) | 137 (1.2%) |
| 35 to 64 Years | 591 (3.1%) | 330 (1.7%) |
| 65 to 74 Years | 114 (2.9%) | 238 (5.3%) |
| 75 Years and over | 204 (7.8%) | 444 (13.3%) |
Disability Class: Cognitive Difficulty
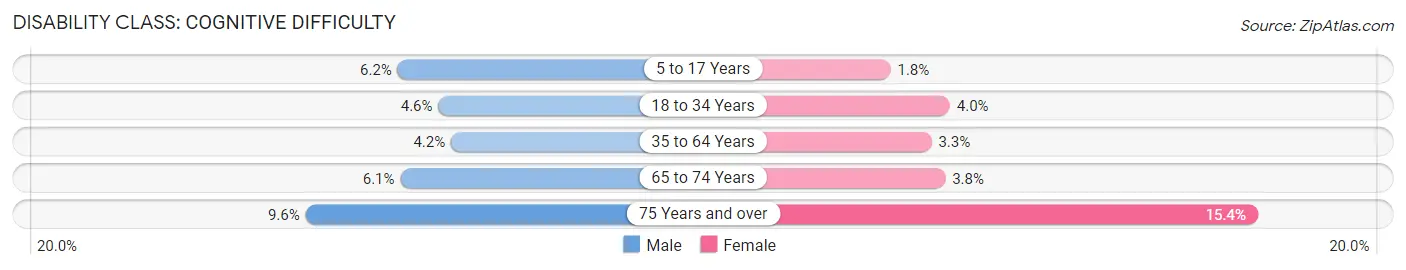
| Age Bracket | Male | Female |
| 5 to 17 Years | 628 (6.1%) | 172 (1.8%) |
| 18 to 34 Years | 559 (4.6%) | 450 (4.0%) |
| 35 to 64 Years | 800 (4.2%) | 638 (3.3%) |
| 65 to 74 Years | 239 (6.0%) | 172 (3.8%) |
| 75 Years and over | 249 (9.6%) | 517 (15.4%) |
Disability Class: Ambulatory Difficulty
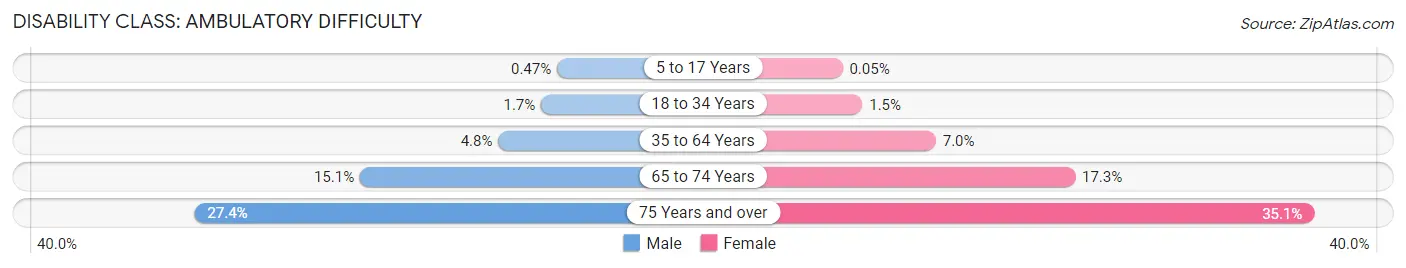
| Age Bracket | Male | Female |
| 5 to 17 Years | 48 (0.5%) | 5 (0.1%) |
| 18 to 34 Years | 198 (1.7%) | 171 (1.5%) |
| 35 to 64 Years | 927 (4.8%) | 1,336 (7.0%) |
| 65 to 74 Years | 596 (15.1%) | 777 (17.3%) |
| 75 Years and over | 713 (27.4%) | 1,174 (35.1%) |
Disability Class: Self-Care Difficulty
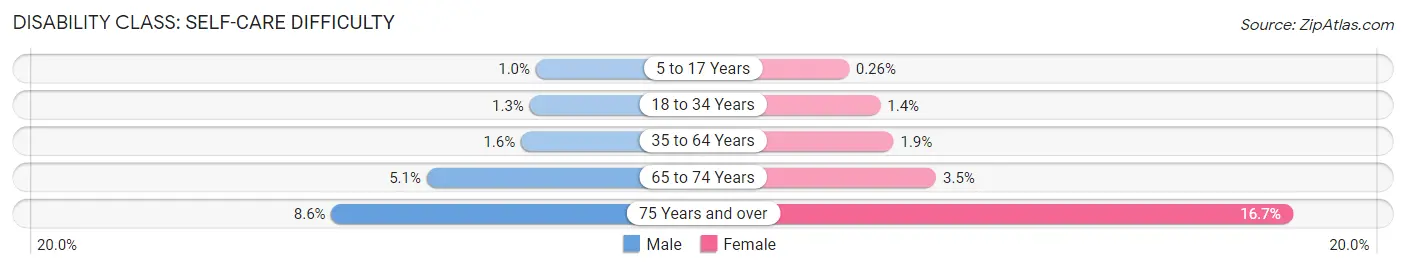
| Age Bracket | Male | Female |
| 5 to 17 Years | 104 (1.0%) | 25 (0.3%) |
| 18 to 34 Years | 150 (1.3%) | 160 (1.4%) |
| 35 to 64 Years | 302 (1.6%) | 367 (1.9%) |
| 65 to 74 Years | 200 (5.1%) | 157 (3.5%) |
| 75 Years and over | 224 (8.6%) | 560 (16.7%) |
Technology Access in Whitfield County
Computing Device Access in Whitfield County
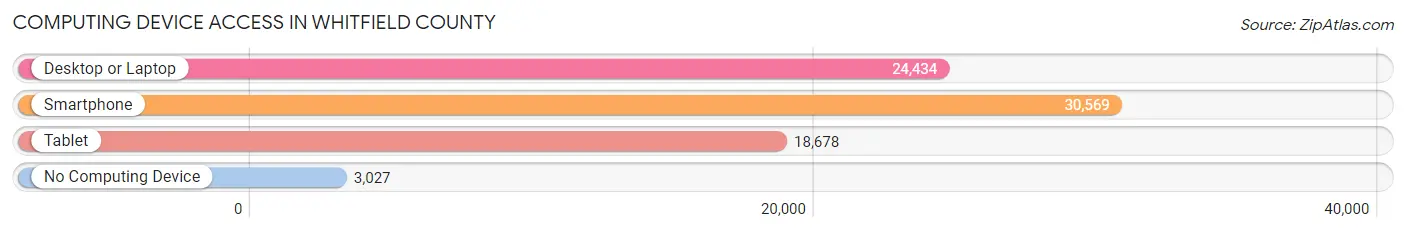
| Device Type | # Households | % Households |
| Desktop or Laptop | 24,434 | 68.3% |
| Smartphone | 30,569 | 85.4% |
| Tablet | 18,678 | 52.2% |
| No Computing Device | 3,027 | 8.5% |
| Total | 35,797 | 100.0% |
Internet Access in Whitfield County
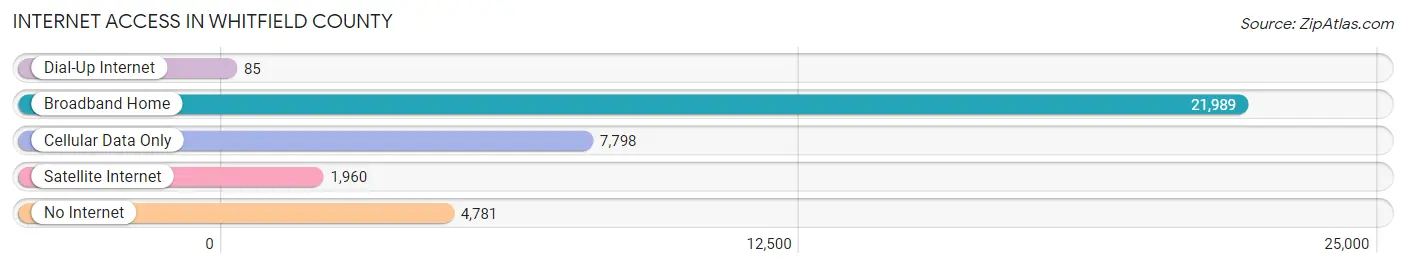
| Internet Type | # Households | % Households |
| Dial-Up Internet | 85 | 0.2% |
| Broadband Home | 21,989 | 61.4% |
| Cellular Data Only | 7,798 | 21.8% |
| Satellite Internet | 1,960 | 5.5% |
| No Internet | 4,781 | 13.4% |
| Total | 35,797 | 100.0% |
Whitfield County Summary
Whitfield County is located in the northwest corner of the state of Georgia, and is part of the Chattanooga, TN-GA Metropolitan Statistical Area. The county was created in 1851 from parts of Murray and Gilmer counties, and was named for George Whitfield, a prominent Georgia politician. The county seat is Dalton, which is also the largest city in the county.
Geography
Whitfield County covers an area of 441 square miles, and is bordered by Murray County to the north, Gordon County to the east, Catoosa County to the south, and Hamilton County, Tennessee to the west. The county is located in the foothills of the Appalachian Mountains, and is part of the Cumberland Plateau. The terrain is mostly hilly, with elevations ranging from 800 to 1,400 feet above sea level. The county is drained by the Conasauga River, which flows through the western part of the county.
Economy
The economy of Whitfield County is largely based on manufacturing and agriculture. The county is home to several large manufacturing plants, including Shaw Industries, which produces carpets and rugs, and Mohawk Industries, which produces flooring products. The county is also home to several poultry processing plants, as well as a number of smaller manufacturing companies. Agriculture is also an important part of the economy, with the county producing a variety of crops, including corn, soybeans, cotton, and tobacco.
Demographics
As of the 2010 census, Whitfield County had a population of 102,599. The racial makeup of the county was 79.2% White, 15.3% African American, 0.7% Native American, 1.2% Asian, 0.1% Pacific Islander, 1.7% from other races, and 1.8% from two or more races. Hispanic or Latino of any race were 4.3% of the population.
The median income for a household in the county was $37,845, and the median income for a family was $45,945. The per capita income for the county was $20,845. About 13.2% of families and 16.7% of the population were below the poverty line, including 22.2% of those under age 18 and 11.2% of those age 65 or over.
Conclusion
Whitfield County is a rural county located in the northwest corner of Georgia. The county is home to several large manufacturing plants, as well as a number of smaller manufacturing companies and poultry processing plants. Agriculture is also an important part of the economy, with the county producing a variety of crops. The population of the county is largely white, with a small African American and Hispanic population. The median income for a household in the county is slightly below the state average, and the poverty rate is slightly higher than the state average.
Common Questions
What is the Total Population of Whitfield County?
Total Population of Whitfield County is 103,033.
What is the Total Male Population of Whitfield County?
Total Male Population of Whitfield County is 51,768.
What is the Total Female Population of Whitfield County?
Total Female Population of Whitfield County is 51,265.
What is the Ratio of Males per 100 Females in Whitfield County?
There are 100.98 Males per 100 Females in Whitfield County.
What is the Ratio of Females per 100 Males in Whitfield County?
There are 99.03 Females per 100 Males in Whitfield County.
What is the Median Population Age in Whitfield County?
Median Population Age in Whitfield County is 36.4 Years.
What is the Average Family Size in Whitfield County
Average Family Size in Whitfield County is 3.4 People.
What is the Average Household Size in Whitfield County
Average Household Size in Whitfield County is 2.8 People.
What is Per Capita Income in Whitfield County?
Per Capita income in Whitfield County is $28,594.
What is the Median Family Income in Whitfield County?
Median Family Income in Whitfield County is $69,315.
What is the Median Household income in Whitfield County?
Median Household Income in Whitfield County is $59,659.
What is Income or Wage Gap in Whitfield County?
Income or Wage Gap in Whitfield County is 26.0%.
Women in Whitfield County earn 74.0 cents for every dollar earned by a man.
What is Family Income Deficit in Whitfield County?
Family Income Deficit in Whitfield County is $9,911.
Families that are below poverty line in Whitfield County earn $9,911 less on average than the poverty threshold level.
What is Inequality or Gini Index in Whitfield County?
Inequality or Gini Index in Whitfield County is 0.44.
How Large is the Labor Force in Whitfield County?
There are 50,253 People in the Labor Forcein in Whitfield County.
What is the Percentage of People in the Labor Force in Whitfield County?
63.0% of People are in the Labor Force in Whitfield County.
What is the Unemployment Rate in Whitfield County?
Unemployment Rate in Whitfield County is 5.7%.