Cherokee County, GA
Cherokee County Map
Cherokee County Overview
268,567
TOTAL POPULATION
132,996
MALE POPULATION
135,571
FEMALE POPULATION
98.10
MALES / 100 FEMALES
101.94
FEMALES / 100 MALES
39.7
MEDIAN AGE
3.2
AVG FAMILY SIZE
2.8
AVG HOUSEHOLD SIZE
$45,334
PER CAPITA INCOME
$113,750
AVG FAMILY INCOME
$100,824
AVG HOUSEHOLD INCOME
32.9%
WAGE / INCOME GAP [ % ]
67.1¢/ $1
WAGE / INCOME GAP [ $ ]
$11,128
FAMILY INCOME DEFICIT
0.41
INEQUALITY / GINI INDEX
146,724
LABOR FORCE [ PEOPLE ]
68.9%
PERCENT IN LABOR FORCE
3.7%
UNEMPLOYMENT RATE
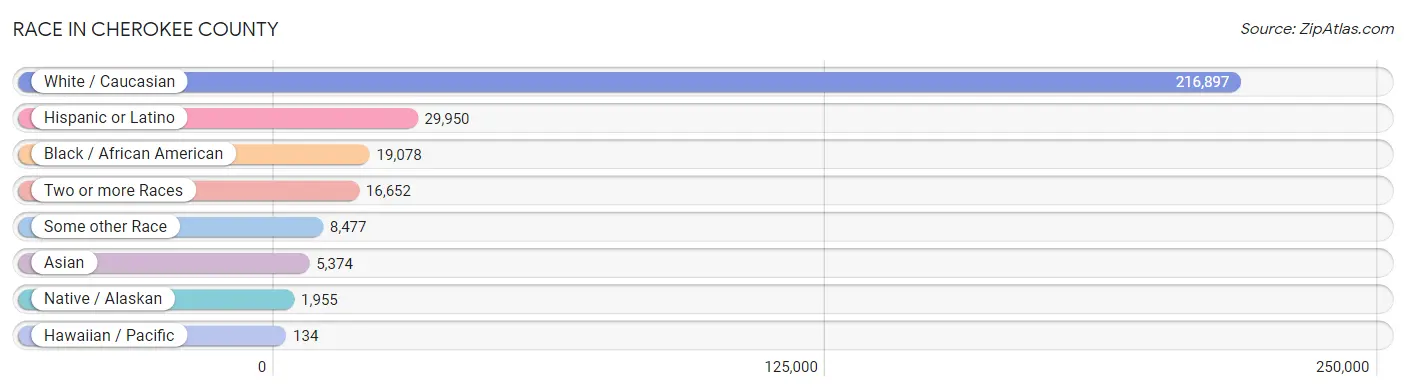
Race in Cherokee County
The most populous races in Cherokee County are White / Caucasian (216,897 | 80.8%), Hispanic or Latino (29,950 | 11.2%), and Black / African American (19,078 | 7.1%).
| Race | # Population | % Population |
| Asian | 5,374 | 2.0% |
| Black / African American | 19,078 | 7.1% |
| Hawaiian / Pacific | 134 | 0.1% |
| Hispanic or Latino | 29,950 | 11.2% |
| Native / Alaskan | 1,955 | 0.7% |
| White / Caucasian | 216,897 | 80.8% |
| Two or more Races | 16,652 | 6.2% |
| Some other Race | 8,477 | 3.2% |
| Total | 268,567 | 100.0% |
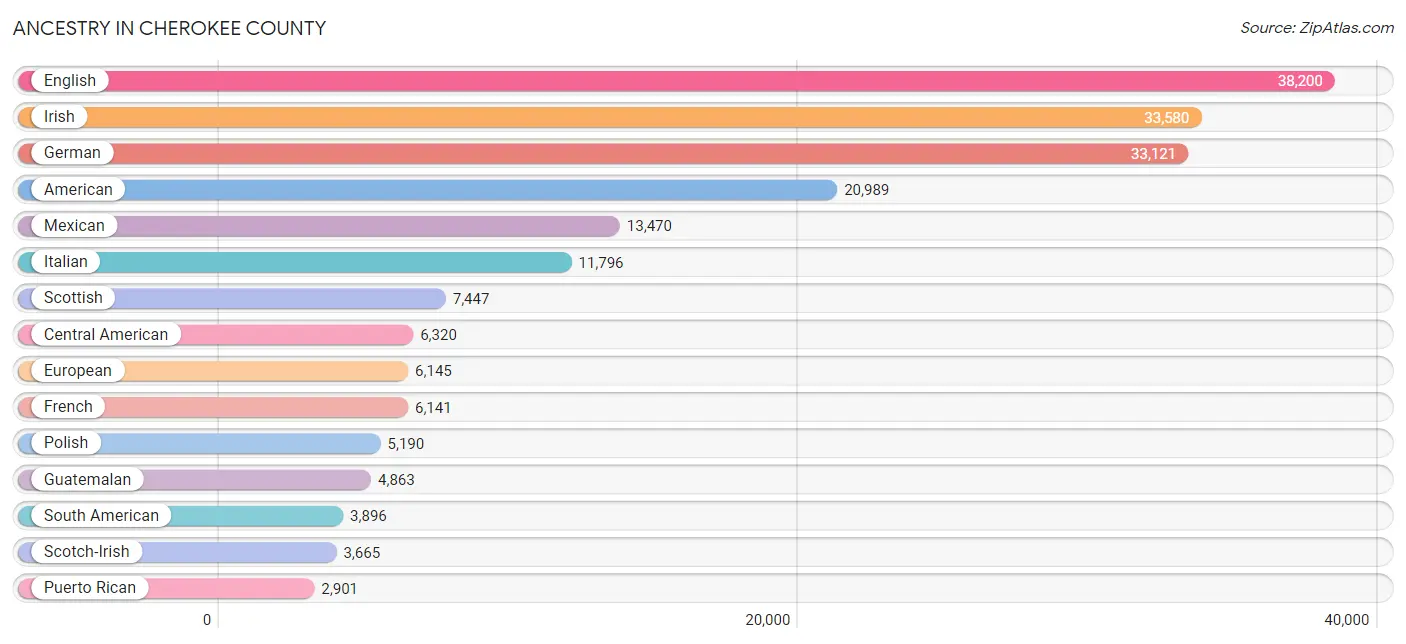
Ancestry in Cherokee County
The most populous ancestries reported in Cherokee County are English (38,200 | 14.2%), Irish (33,580 | 12.5%), German (33,121 | 12.3%), American (20,989 | 7.8%), and Mexican (13,470 | 5.0%), together accounting for 51.9% of all Cherokee County residents.
| Ancestry | # Population | % Population |
| African | 563 | 0.2% |
| Aleut | 2 | 0.0% |
| Alsatian | 13 | 0.0% |
| American | 20,989 | 7.8% |
| Arab | 936 | 0.4% |
| Argentinean | 91 | 0.0% |
| Armenian | 104 | 0.0% |
| Australian | 453 | 0.2% |
| Austrian | 389 | 0.1% |
| Bahamian | 219 | 0.1% |
| Basque | 9 | 0.0% |
| Belgian | 124 | 0.1% |
| Belizean | 194 | 0.1% |
| Bhutanese | 891 | 0.3% |
| Blackfeet | 191 | 0.1% |
| Brazilian | 1,030 | 0.4% |
| British | 2,601 | 1.0% |
| Burmese | 793 | 0.3% |
| Cajun | 80 | 0.0% |
| Canadian | 621 | 0.2% |
| Cape Verdean | 79 | 0.0% |
| Central American | 6,320 | 2.4% |
| Central American Indian | 1,568 | 0.6% |
| Cherokee | 1,198 | 0.4% |
| Cheyenne | 29 | 0.0% |
| Chilean | 204 | 0.1% |
| Chippewa | 6 | 0.0% |
| Choctaw | 25 | 0.0% |
| Colombian | 1,720 | 0.6% |
| Comanche | 21 | 0.0% |
| Costa Rican | 334 | 0.1% |
| Creek | 42 | 0.0% |
| Croatian | 186 | 0.1% |
| Cuban | 1,140 | 0.4% |
| Cypriot | 20 | 0.0% |
| Czech | 537 | 0.2% |
| Czechoslovakian | 122 | 0.1% |
| Danish | 639 | 0.2% |
| Dominican | 363 | 0.1% |
| Dutch | 2,189 | 0.8% |
| Eastern European | 640 | 0.2% |
| Ecuadorian | 367 | 0.1% |
| Egyptian | 91 | 0.0% |
| English | 38,200 | 14.2% |
| Estonian | 37 | 0.0% |
| Ethiopian | 385 | 0.1% |
| European | 6,145 | 2.3% |
| Filipino | 96 | 0.0% |
| Finnish | 201 | 0.1% |
| French | 6,141 | 2.3% |
| French Canadian | 1,211 | 0.4% |
| German | 33,121 | 12.3% |
| Ghanaian | 63 | 0.0% |
| Greek | 1,170 | 0.4% |
| Guamanian / Chamorro | 81 | 0.0% |
| Guatemalan | 4,863 | 1.8% |
| Guyanese | 153 | 0.1% |
| Haitian | 652 | 0.2% |
| Honduran | 396 | 0.2% |
| Houma | 1 | 0.0% |
| Hungarian | 790 | 0.3% |
| Indian (Asian) | 928 | 0.4% |
| Indonesian | 50 | 0.0% |
| Iranian | 297 | 0.1% |
| Irish | 33,580 | 12.5% |
| Iroquois | 4 | 0.0% |
| Israeli | 9 | 0.0% |
| Italian | 11,796 | 4.4% |
| Jamaican | 556 | 0.2% |
| Japanese | 261 | 0.1% |
| Jordanian | 18 | 0.0% |
| Kenyan | 186 | 0.1% |
| Korean | 1,532 | 0.6% |
| Laotian | 80 | 0.0% |
| Latvian | 38 | 0.0% |
| Lebanese | 500 | 0.2% |
| Lithuanian | 258 | 0.1% |
| Lumbee | 8 | 0.0% |
| Macedonian | 17 | 0.0% |
| Malaysian | 12 | 0.0% |
| Mexican | 13,470 | 5.0% |
| Mexican American Indian | 129 | 0.1% |
| Moroccan | 62 | 0.0% |
| Native Hawaiian | 689 | 0.3% |
| Navajo | 63 | 0.0% |
| New Zealander | 50 | 0.0% |
| Nicaraguan | 10 | 0.0% |
| Nigerian | 305 | 0.1% |
| Northern European | 319 | 0.1% |
| Norwegian | 1,852 | 0.7% |
| Pakistani | 80 | 0.0% |
| Palestinian | 146 | 0.1% |
| Panamanian | 119 | 0.0% |
| Paraguayan | 15 | 0.0% |
| Peruvian | 283 | 0.1% |
| Polish | 5,190 | 1.9% |
| Portuguese | 929 | 0.4% |
| Puerto Rican | 2,901 | 1.1% |
| Romanian | 307 | 0.1% |
| Russian | 1,194 | 0.4% |
| Salvadoran | 589 | 0.2% |
| Samoan | 33 | 0.0% |
| Scandinavian | 761 | 0.3% |
| Scotch-Irish | 3,665 | 1.4% |
| Scottish | 7,447 | 2.8% |
| Seminole | 23 | 0.0% |
| Serbian | 121 | 0.1% |
| Sioux | 39 | 0.0% |
| Slavic | 8 | 0.0% |
| Slovak | 746 | 0.3% |
| Slovene | 61 | 0.0% |
| South African | 272 | 0.1% |
| South American | 3,896 | 1.5% |
| South American Indian | 48 | 0.0% |
| Spaniard | 343 | 0.1% |
| Spanish | 805 | 0.3% |
| Sri Lankan | 406 | 0.2% |
| Subsaharan African | 2,619 | 1.0% |
| Swedish | 1,946 | 0.7% |
| Swiss | 729 | 0.3% |
| Syrian | 42 | 0.0% |
| Thai | 2,684 | 1.0% |
| Trinidadian and Tobagonian | 297 | 0.1% |
| Turkish | 66 | 0.0% |
| Ugandan | 2 | 0.0% |
| Ukrainian | 780 | 0.3% |
| Uruguayan | 170 | 0.1% |
| Venezuelan | 1,046 | 0.4% |
| Vietnamese | 56 | 0.0% |
| Welsh | 2,135 | 0.8% |
| West Indian | 121 | 0.1% |
| Yugoslavian | 410 | 0.2% | View All 132 Rows |
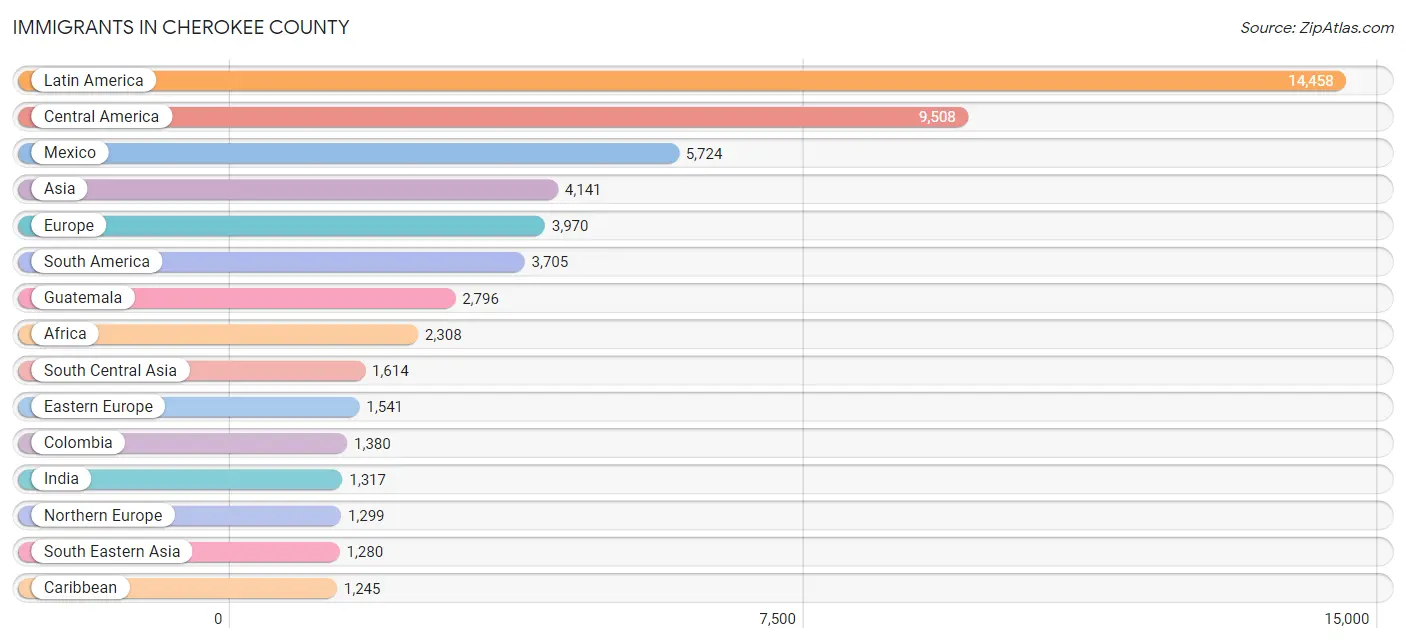
Immigrants in Cherokee County
The most numerous immigrant groups reported in Cherokee County came from Latin America (14,458 | 5.4%), Central America (9,508 | 3.5%), Mexico (5,724 | 2.1%), Asia (4,141 | 1.5%), and Europe (3,970 | 1.5%), together accounting for 14.1% of all Cherokee County residents.
| Immigration Origin | # Population | % Population |
| Africa | 2,308 | 0.9% |
| Argentina | 34 | 0.0% |
| Asia | 4,141 | 1.5% |
| Australia | 409 | 0.2% |
| Austria | 72 | 0.0% |
| Bahamas | 118 | 0.0% |
| Bangladesh | 61 | 0.0% |
| Belarus | 116 | 0.0% |
| Belize | 94 | 0.0% |
| Bosnia and Herzegovina | 325 | 0.1% |
| Brazil | 1,004 | 0.4% |
| Cambodia | 121 | 0.1% |
| Canada | 883 | 0.3% |
| Caribbean | 1,245 | 0.5% |
| Central America | 9,508 | 3.5% |
| China | 460 | 0.2% |
| Colombia | 1,380 | 0.5% |
| Costa Rica | 104 | 0.0% |
| Cuba | 299 | 0.1% |
| Czechoslovakia | 70 | 0.0% |
| Denmark | 11 | 0.0% |
| Dominican Republic | 254 | 0.1% |
| Eastern Africa | 1,079 | 0.4% |
| Eastern Asia | 1,041 | 0.4% |
| Eastern Europe | 1,541 | 0.6% |
| Ecuador | 128 | 0.1% |
| Egypt | 43 | 0.0% |
| El Salvador | 446 | 0.2% |
| England | 755 | 0.3% |
| Ethiopia | 349 | 0.1% |
| Europe | 3,970 | 1.5% |
| France | 88 | 0.0% |
| Germany | 506 | 0.2% |
| Greece | 164 | 0.1% |
| Guatemala | 2,796 | 1.0% |
| Guyana | 23 | 0.0% |
| Haiti | 236 | 0.1% |
| Honduras | 255 | 0.1% |
| Hong Kong | 29 | 0.0% |
| Hungary | 38 | 0.0% |
| India | 1,317 | 0.5% |
| Indonesia | 80 | 0.0% |
| Iran | 113 | 0.0% |
| Ireland | 38 | 0.0% |
| Israel | 40 | 0.0% |
| Italy | 45 | 0.0% |
| Jamaica | 162 | 0.1% |
| Japan | 217 | 0.1% |
| Jordan | 22 | 0.0% |
| Kenya | 630 | 0.2% |
| Korea | 364 | 0.1% |
| Kuwait | 6 | 0.0% |
| Latin America | 14,458 | 5.4% |
| Latvia | 11 | 0.0% |
| Lebanon | 54 | 0.0% |
| Liberia | 12 | 0.0% |
| Malaysia | 5 | 0.0% |
| Mexico | 5,724 | 2.1% |
| Middle Africa | 61 | 0.0% |
| Moldova | 41 | 0.0% |
| Morocco | 11 | 0.0% |
| Netherlands | 202 | 0.1% |
| Nicaragua | 11 | 0.0% |
| Nigeria | 248 | 0.1% |
| Northern Africa | 109 | 0.0% |
| Northern Europe | 1,299 | 0.5% |
| Norway | 58 | 0.0% |
| Oceania | 419 | 0.2% |
| Pakistan | 123 | 0.1% |
| Panama | 78 | 0.0% |
| Peru | 242 | 0.1% |
| Philippines | 540 | 0.2% |
| Poland | 96 | 0.0% |
| Portugal | 20 | 0.0% |
| Romania | 105 | 0.0% |
| Russia | 163 | 0.1% |
| Scotland | 9 | 0.0% |
| Serbia | 38 | 0.0% |
| South Africa | 415 | 0.2% |
| South America | 3,705 | 1.4% |
| South Central Asia | 1,614 | 0.6% |
| South Eastern Asia | 1,280 | 0.5% |
| Southern Europe | 262 | 0.1% |
| Spain | 33 | 0.0% |
| Sweden | 25 | 0.0% |
| Taiwan | 111 | 0.0% |
| Thailand | 202 | 0.1% |
| Trinidad and Tobago | 176 | 0.1% |
| Turkey | 27 | 0.0% |
| Uganda | 34 | 0.0% |
| Ukraine | 538 | 0.2% |
| Uruguay | 116 | 0.0% |
| Venezuela | 763 | 0.3% |
| Vietnam | 249 | 0.1% |
| Western Africa | 354 | 0.1% |
| Western Asia | 169 | 0.1% |
| Western Europe | 868 | 0.3% |
| Zaire | 33 | 0.0% | View All 98 Rows |
Sex and Age in Cherokee County
Sex and Age in Cherokee County
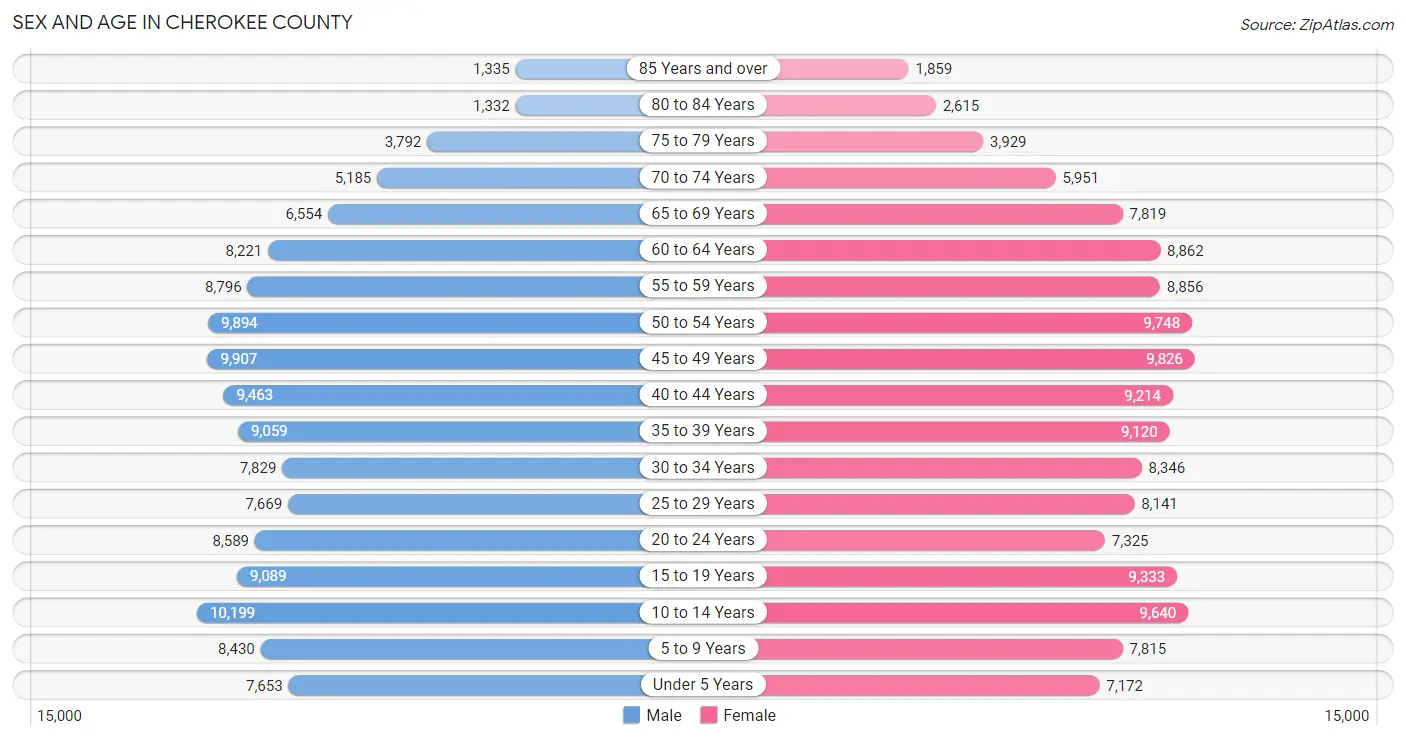
The most populous age groups in Cherokee County are 10 to 14 Years (10,199 | 7.7%) for men and 45 to 49 Years (9,826 | 7.2%) for women.
| Age Bracket | Male | Female |
| Under 5 Years | 7,653 (5.8%) | 7,172 (5.3%) |
| 5 to 9 Years | 8,430 (6.3%) | 7,815 (5.8%) |
| 10 to 14 Years | 10,199 (7.7%) | 9,640 (7.1%) |
| 15 to 19 Years | 9,089 (6.8%) | 9,333 (6.9%) |
| 20 to 24 Years | 8,589 (6.5%) | 7,325 (5.4%) |
| 25 to 29 Years | 7,669 (5.8%) | 8,141 (6.0%) |
| 30 to 34 Years | 7,829 (5.9%) | 8,346 (6.2%) |
| 35 to 39 Years | 9,059 (6.8%) | 9,120 (6.7%) |
| 40 to 44 Years | 9,463 (7.1%) | 9,214 (6.8%) |
| 45 to 49 Years | 9,907 (7.4%) | 9,826 (7.2%) |
| 50 to 54 Years | 9,894 (7.4%) | 9,748 (7.2%) |
| 55 to 59 Years | 8,796 (6.6%) | 8,856 (6.5%) |
| 60 to 64 Years | 8,221 (6.2%) | 8,862 (6.5%) |
| 65 to 69 Years | 6,554 (4.9%) | 7,819 (5.8%) |
| 70 to 74 Years | 5,185 (3.9%) | 5,951 (4.4%) |
| 75 to 79 Years | 3,792 (2.9%) | 3,929 (2.9%) |
| 80 to 84 Years | 1,332 (1.0%) | 2,615 (1.9%) |
| 85 Years and over | 1,335 (1.0%) | 1,859 (1.4%) |
| Total | 132,996 (100.0%) | 135,571 (100.0%) |
Families and Households in Cherokee County
Median Family Size in Cherokee County
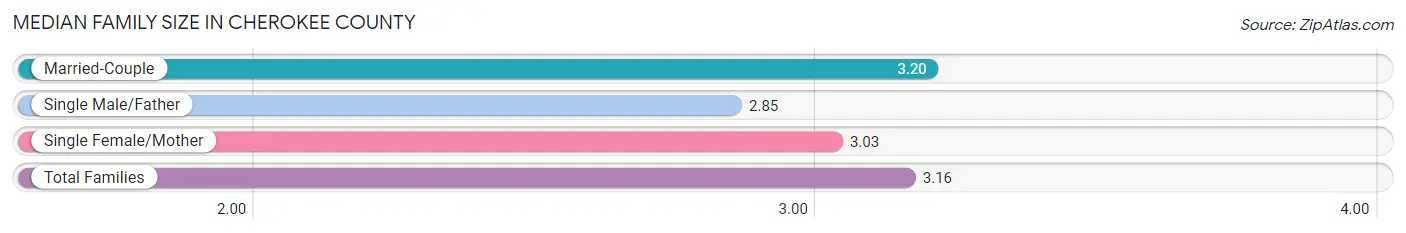
The median family size in Cherokee County is 3.16 persons per family, with married-couple families (59,853 | 81.7%) accounting for the largest median family size of 3.2 persons per family. On the other hand, single male/father families (3,725 | 5.1%) represent the smallest median family size with 2.85 persons per family.
| Family Type | # Families | Family Size |
| Married-Couple | 59,853 (81.7%) | 3.20 |
| Single Male/Father | 3,725 (5.1%) | 2.85 |
| Single Female/Mother | 9,683 (13.2%) | 3.03 |
| Total Families | 73,261 (100.0%) | 3.16 |
Median Household Size in Cherokee County
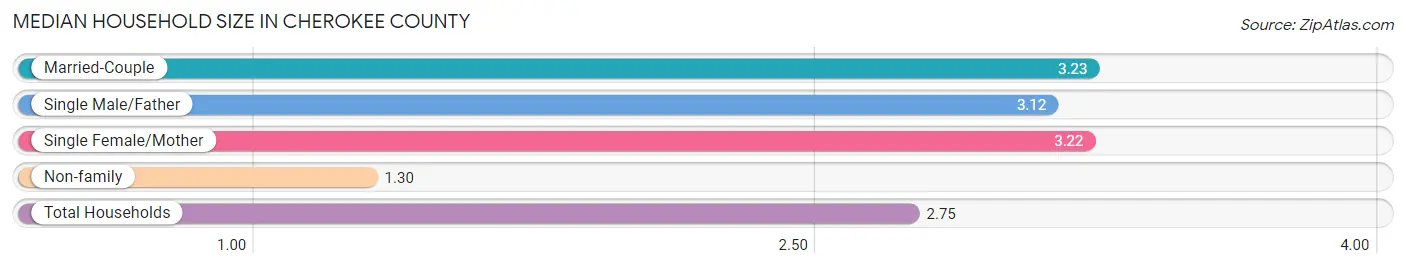
The median household size in Cherokee County is 2.75 persons per household, with married-couple households (59,853 | 61.7%) accounting for the largest median household size of 3.23 persons per household. non-family households (23,762 | 24.5%) represent the smallest median household size with 1.30 persons per household.
| Household Type | # Households | Household Size |
| Married-Couple | 59,853 (61.7%) | 3.23 |
| Single Male/Father | 3,725 (3.8%) | 3.12 |
| Single Female/Mother | 9,683 (10.0%) | 3.22 |
| Non-family | 23,762 (24.5%) | 1.30 |
| Total Households | 97,023 (100.0%) | 2.75 |
Household Size by Marriage Status in Cherokee County
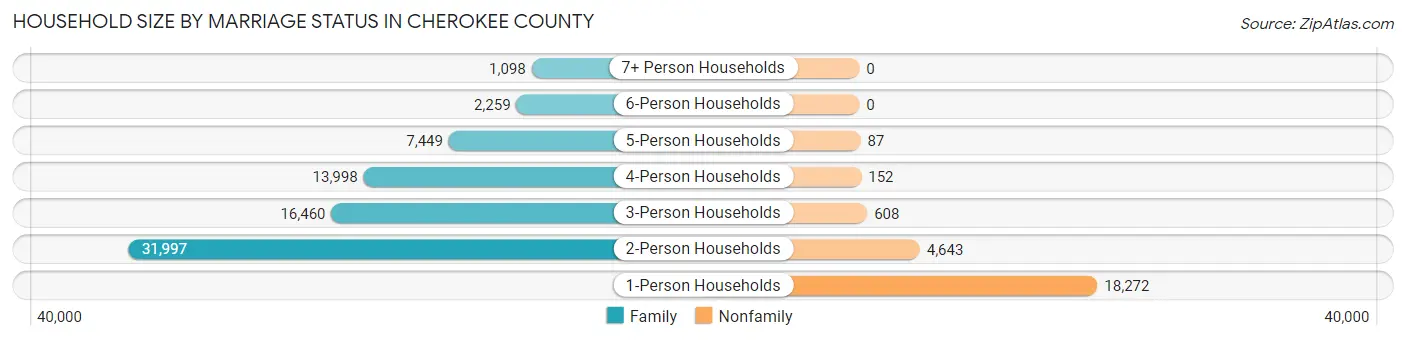
Out of a total of 97,023 households in Cherokee County, 73,261 (75.5%) are family households, while 23,762 (24.5%) are nonfamily households. The most numerous type of family households are 2-person households, comprising 31,997, and the most common type of nonfamily households are 1-person households, comprising 18,272.
| Household Size | Family Households | Nonfamily Households |
| 1-Person Households | - | 18,272 (18.8%) |
| 2-Person Households | 31,997 (33.0%) | 4,643 (4.8%) |
| 3-Person Households | 16,460 (17.0%) | 608 (0.6%) |
| 4-Person Households | 13,998 (14.4%) | 152 (0.2%) |
| 5-Person Households | 7,449 (7.7%) | 87 (0.1%) |
| 6-Person Households | 2,259 (2.3%) | 0 (0.0%) |
| 7+ Person Households | 1,098 (1.1%) | 0 (0.0%) |
| Total | 73,261 (75.5%) | 23,762 (24.5%) |
Female Fertility in Cherokee County
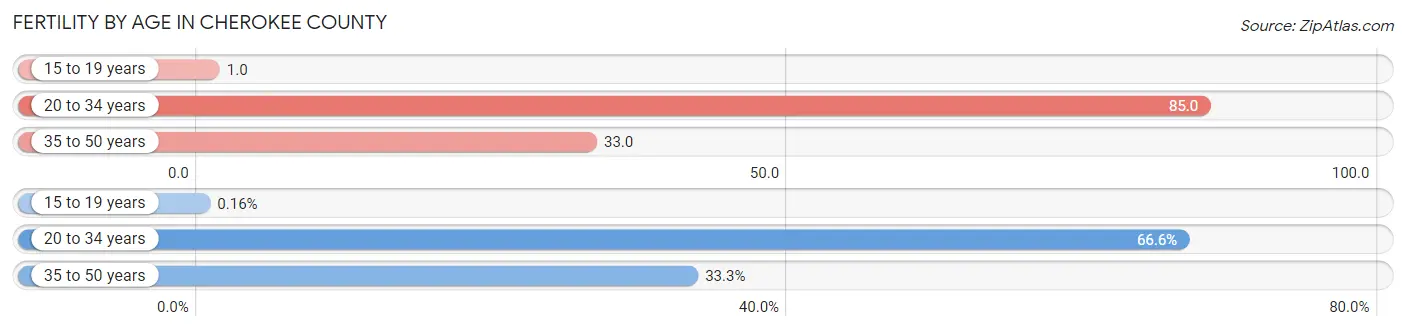
Fertility by Age in Cherokee County
Average fertility rate in Cherokee County is 48.0 births per 1,000 women. Women in the age bracket of 20 to 34 years have the highest fertility rate with 85.0 births per 1,000 women. Women in the age bracket of 20 to 34 years acount for 66.6% of all women with births.
| Age Bracket | Women with Births | Births / 1,000 Women |
| 15 to 19 years | 5 (0.2%) | 1.0 |
| 20 to 34 years | 2,027 (66.6%) | 85.0 |
| 35 to 50 years | 1,013 (33.3%) | 33.0 |
| Total | 3,045 (100.0%) | 48.0 |
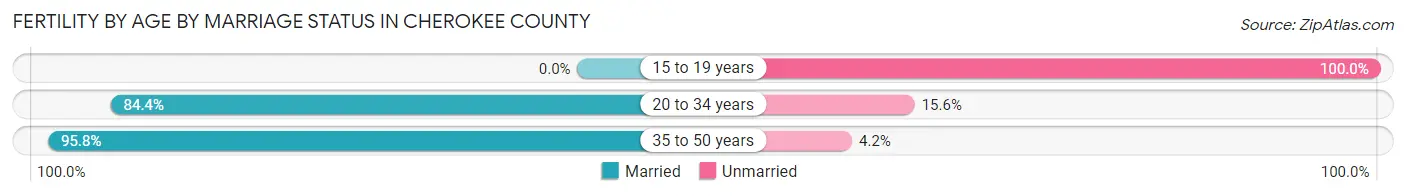
Fertility by Age by Marriage Status in Cherokee County
88.0% of women with births (3,045) in Cherokee County are married. The highest percentage of unmarried women with births falls into 15 to 19 years age bracket with 100.0% of them unmarried at the time of birth, while the lowest percentage of unmarried women with births belong to 35 to 50 years age bracket with 4.2% of them unmarried.
| Age Bracket | Married | Unmarried |
| 15 to 19 years | 0 (0.0%) | 5 (100.0%) |
| 20 to 34 years | 1,711 (84.4%) | 316 (15.6%) |
| 35 to 50 years | 970 (95.8%) | 43 (4.2%) |
| Total | 2,680 (88.0%) | 365 (12.0%) |
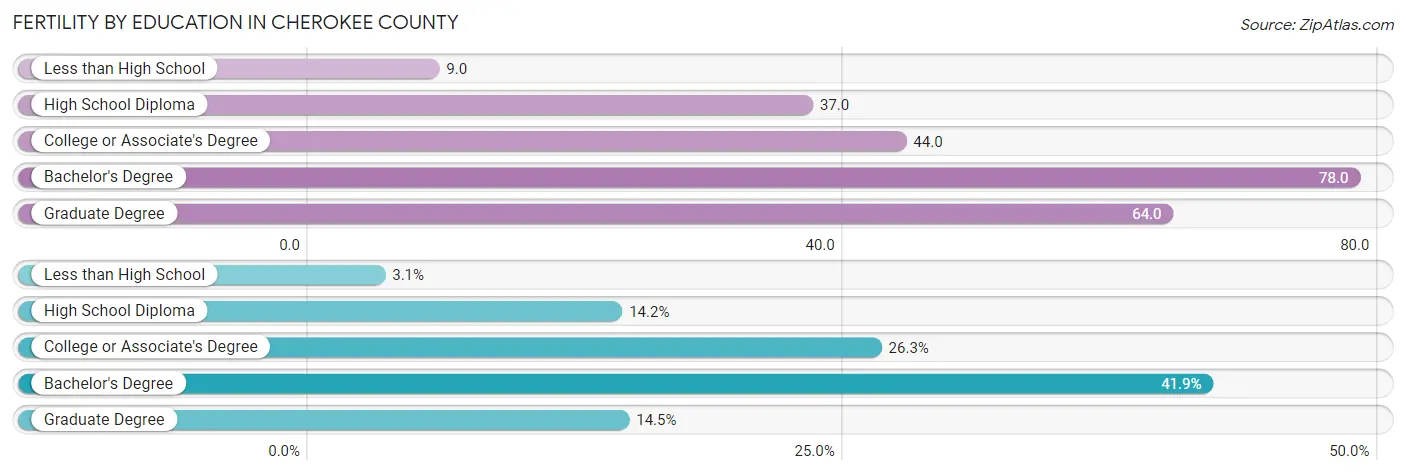
Fertility by Education in Cherokee County
Average fertility rate in Cherokee County is 48.0 births per 1,000 women. Women with the education attainment of bachelor's degree have the highest fertility rate of 78.0 births per 1,000 women, while women with the education attainment of less than high school have the lowest fertility at 9.0 births per 1,000 women. Women with the education attainment of bachelor's degree represent 41.9% of all women with births.
| Educational Attainment | Women with Births | Births / 1,000 Women |
| Less than High School | 94 (3.1%) | 9.0 |
| High School Diploma | 432 (14.2%) | 37.0 |
| College or Associate's Degree | 802 (26.3%) | 44.0 |
| Bachelor's Degree | 1,275 (41.9%) | 78.0 |
| Graduate Degree | 442 (14.5%) | 64.0 |
| Total | 3,045 (100.0%) | 48.0 |
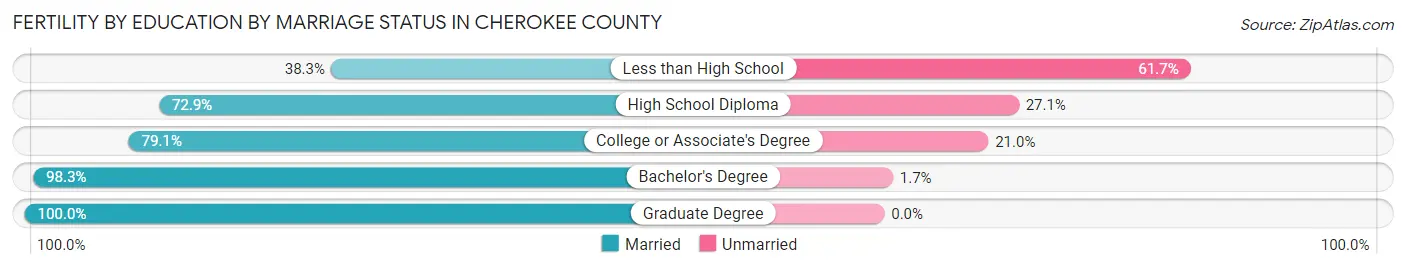
Fertility by Education by Marriage Status in Cherokee County
12.0% of women with births in Cherokee County are unmarried. Women with the educational attainment of graduate degree are most likely to be married with 100.0% of them married at childbirth, while women with the educational attainment of less than high school are least likely to be married with 61.7% of them unmarried at childbirth.
| Educational Attainment | Married | Unmarried |
| Less than High School | 36 (38.3%) | 58 (61.7%) |
| High School Diploma | 315 (72.9%) | 117 (27.1%) |
| College or Associate's Degree | 634 (79.0%) | 168 (20.9%) |
| Bachelor's Degree | 1,253 (98.3%) | 22 (1.7%) |
| Graduate Degree | 442 (100.0%) | 0 (0.0%) |
| Total | 2,680 (88.0%) | 365 (12.0%) |
Income in Cherokee County
Income Overview in Cherokee County
Per Capita Income in Cherokee County is $45,334, while median incomes of families and households are $113,750 and $100,824 respectively.
| Characteristic | Number | Measure |
| Per Capita Income | 268,567 | $45,334 |
| Median Family Income | 73,261 | $113,750 |
| Mean Family Income | 73,261 | $136,027 |
| Median Household Income | 97,023 | $100,824 |
| Mean Household Income | 97,023 | $121,950 |
| Income Deficit | 73,261 | $11,128 |
| Wage / Income Gap (%) | 268,567 | 32.92% |
| Wage / Income Gap ($) | 268,567 | 67.08¢ per $1 |
| Gini / Inequality Index | 268,567 | 0.41 |
Earnings by Sex in Cherokee County
Average Earnings in Cherokee County are $48,465, $58,201 for men and $39,043 for women, a difference of 32.9%.
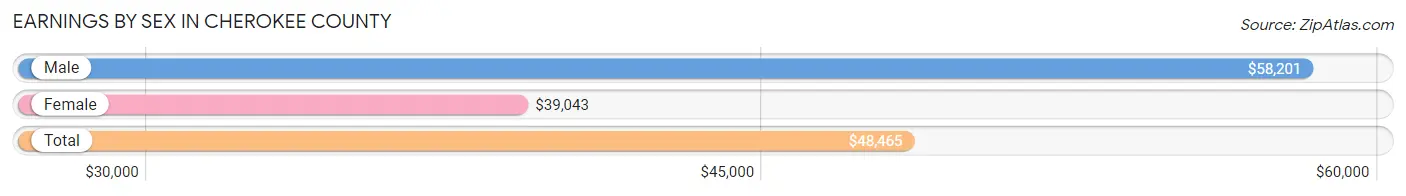
| Sex | Number | Average Earnings |
| Male | 81,936 (54.0%) | $58,201 |
| Female | 69,766 (46.0%) | $39,043 |
| Total | 151,702 (100.0%) | $48,465 |
Earnings by Sex by Income Bracket in Cherokee County
The most common earnings brackets in Cherokee County are $100,000+ for men (22,170 | 27.1%) and $100,000+ for women (7,791 | 11.2%).
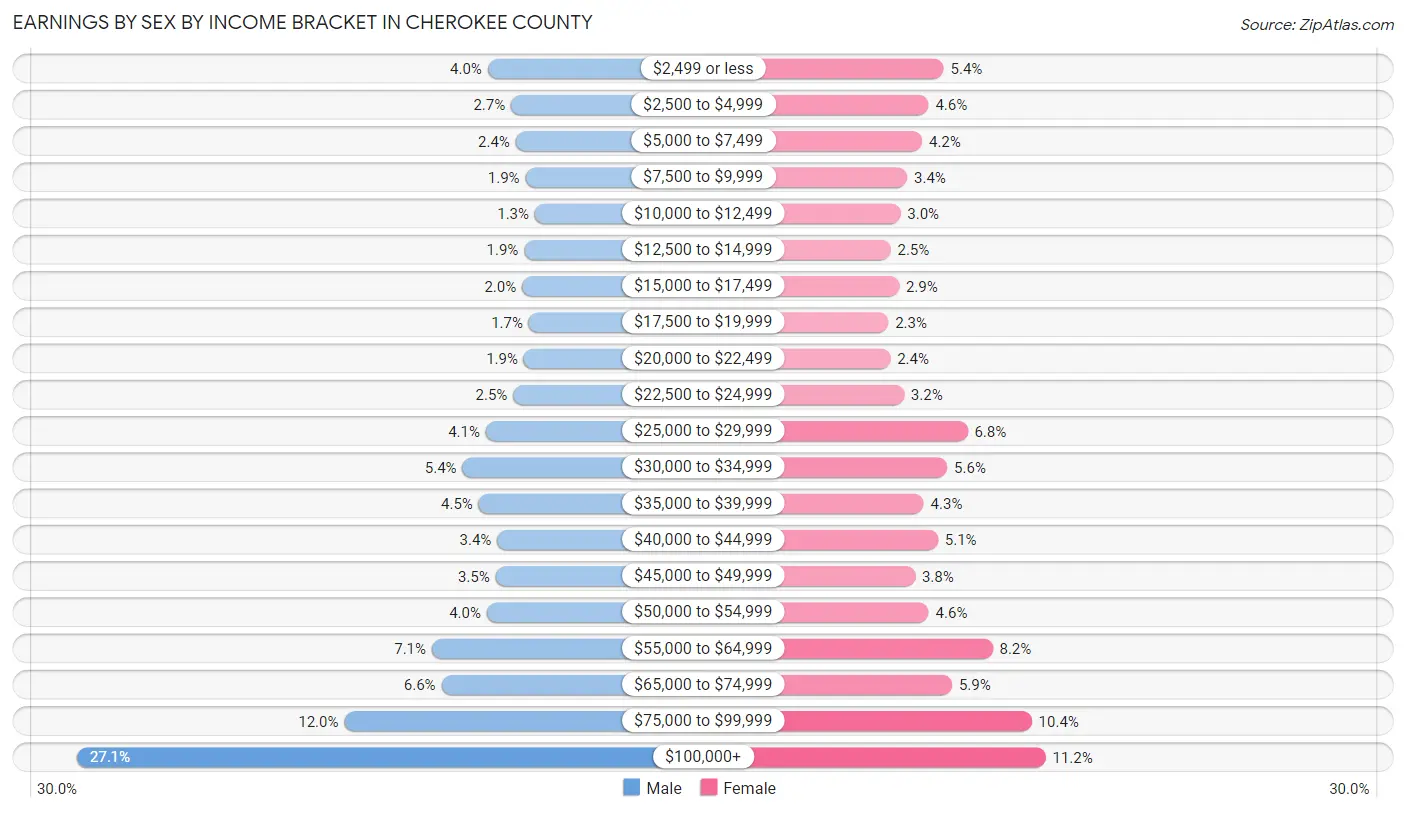
| Income | Male | Female |
| $2,499 or less | 3,256 (4.0%) | 3,798 (5.4%) |
| $2,500 to $4,999 | 2,177 (2.7%) | 3,205 (4.6%) |
| $5,000 to $7,499 | 1,963 (2.4%) | 2,953 (4.2%) |
| $7,500 to $9,999 | 1,516 (1.8%) | 2,366 (3.4%) |
| $10,000 to $12,499 | 1,082 (1.3%) | 2,100 (3.0%) |
| $12,500 to $14,999 | 1,571 (1.9%) | 1,716 (2.5%) |
| $15,000 to $17,499 | 1,669 (2.0%) | 2,044 (2.9%) |
| $17,500 to $19,999 | 1,363 (1.7%) | 1,625 (2.3%) |
| $20,000 to $22,499 | 1,588 (1.9%) | 1,705 (2.4%) |
| $22,500 to $24,999 | 2,080 (2.5%) | 2,242 (3.2%) |
| $25,000 to $29,999 | 3,340 (4.1%) | 4,729 (6.8%) |
| $30,000 to $34,999 | 4,416 (5.4%) | 3,938 (5.6%) |
| $35,000 to $39,999 | 3,668 (4.5%) | 3,012 (4.3%) |
| $40,000 to $44,999 | 2,822 (3.4%) | 3,572 (5.1%) |
| $45,000 to $49,999 | 2,895 (3.5%) | 2,675 (3.8%) |
| $50,000 to $54,999 | 3,294 (4.0%) | 3,211 (4.6%) |
| $55,000 to $64,999 | 5,827 (7.1%) | 5,712 (8.2%) |
| $65,000 to $74,999 | 5,380 (6.6%) | 4,126 (5.9%) |
| $75,000 to $99,999 | 9,859 (12.0%) | 7,246 (10.4%) |
| $100,000+ | 22,170 (27.1%) | 7,791 (11.2%) |
| Total | 81,936 (100.0%) | 69,766 (100.0%) |
Earnings by Sex by Educational Attainment in Cherokee County
Average earnings in Cherokee County are $67,961 for men and $45,536 for women, a difference of 33.0%. Men with an educational attainment of graduate degree enjoy the highest average annual earnings of $112,624, while those with less than high school education earn the least with $34,822. Women with an educational attainment of graduate degree earn the most with the average annual earnings of $72,223, while those with less than high school education have the smallest earnings of $25,684.
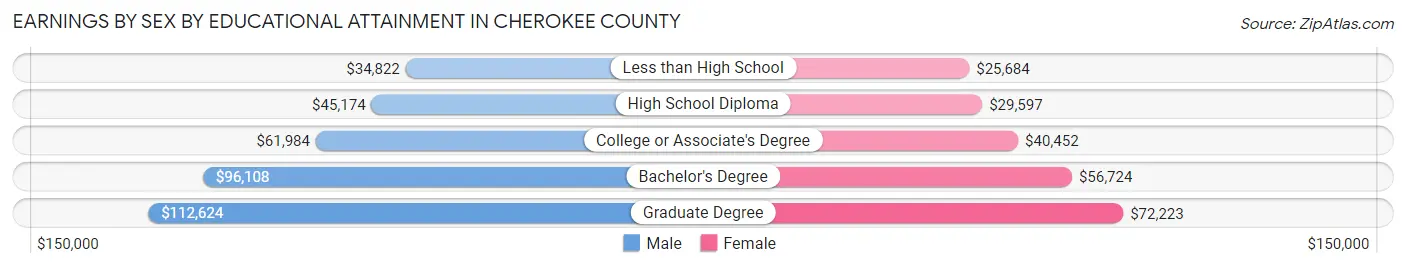
| Educational Attainment | Male Income | Female Income |
| Less than High School | $34,822 | $25,684 |
| High School Diploma | $45,174 | $29,597 |
| College or Associate's Degree | $61,984 | $40,452 |
| Bachelor's Degree | $96,108 | $56,724 |
| Graduate Degree | $112,624 | $72,223 |
| Total | $67,961 | $45,536 |
Family Income in Cherokee County
Family Income Brackets in Cherokee County
According to the Cherokee County family income data, there are 17,290 families falling into the $100,000 to $149,999 income range, which is the most common income bracket and makes up 23.6% of all families. Conversely, the $10,000 to $14,999 income bracket is the least frequent group with only 806 families (1.1%) belonging to this category.
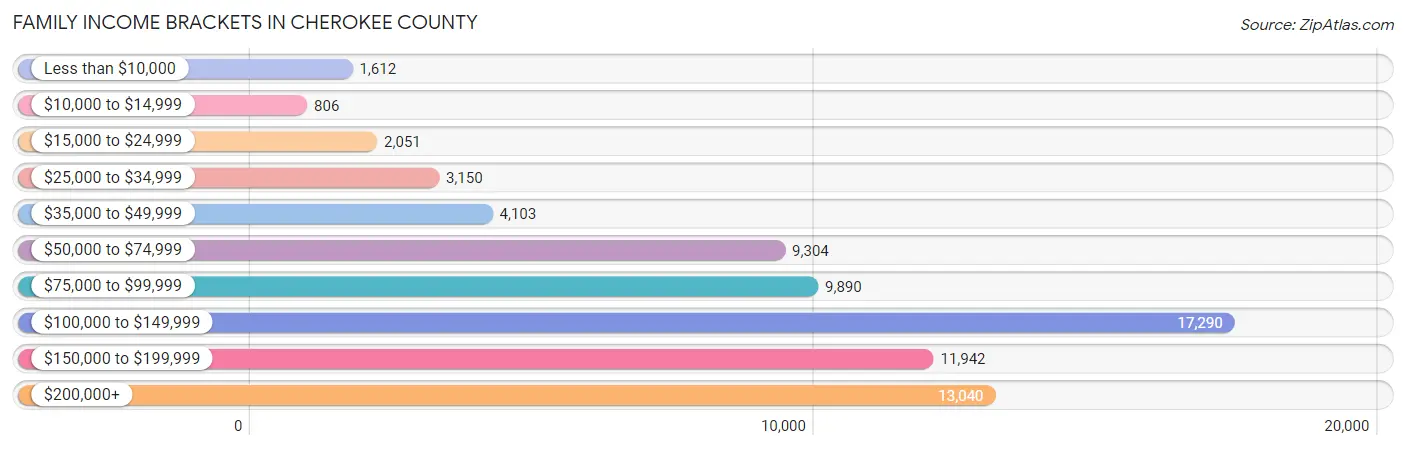
| Income Bracket | # Families | % Families |
| Less than $10,000 | 1,612 | 2.2% |
| $10,000 to $14,999 | 806 | 1.1% |
| $15,000 to $24,999 | 2,051 | 2.8% |
| $25,000 to $34,999 | 3,150 | 4.3% |
| $35,000 to $49,999 | 4,103 | 5.6% |
| $50,000 to $74,999 | 9,304 | 12.7% |
| $75,000 to $99,999 | 9,890 | 13.5% |
| $100,000 to $149,999 | 17,290 | 23.6% |
| $150,000 to $199,999 | 11,942 | 16.3% |
| $200,000+ | 13,040 | 17.8% |
Family Income by Famaliy Size in Cherokee County
4-person families (13,852 | 18.9%) account for the highest median family income in Cherokee County with $139,643 per family, while 2-person families (33,642 | 45.9%) have the highest median income of $49,102 per family member.
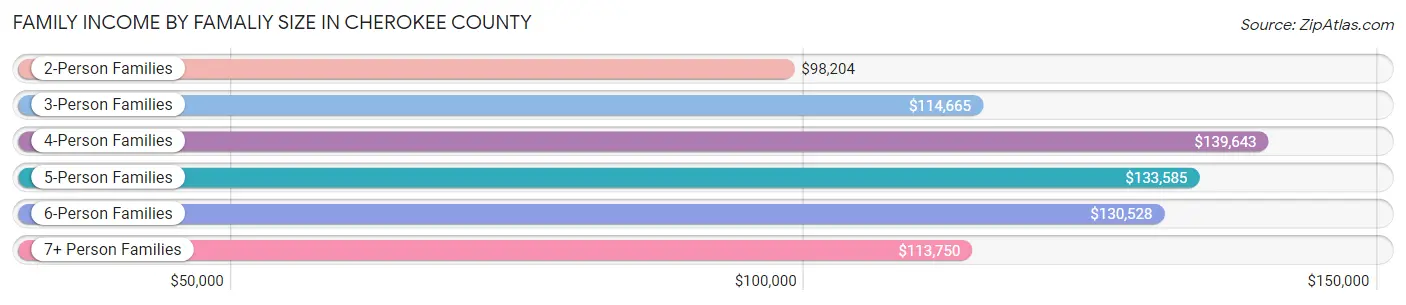
| Income Bracket | # Families | Median Income |
| 2-Person Families | 33,642 (45.9%) | $98,204 |
| 3-Person Families | 15,730 (21.5%) | $114,665 |
| 4-Person Families | 13,852 (18.9%) | $139,643 |
| 5-Person Families | 6,827 (9.3%) | $133,585 |
| 6-Person Families | 2,246 (3.1%) | $130,528 |
| 7+ Person Families | 964 (1.3%) | $113,750 |
| Total | 73,261 (100.0%) | $113,750 |
Family Income by Number of Earners in Cherokee County
The median family income in Cherokee County is $113,750, with families comprising 3+ earners (9,423) having the highest median family income of $164,002, while families with no earners (8,949) have the lowest median family income of $56,475, accounting for 12.9% and 12.2% of families, respectively.
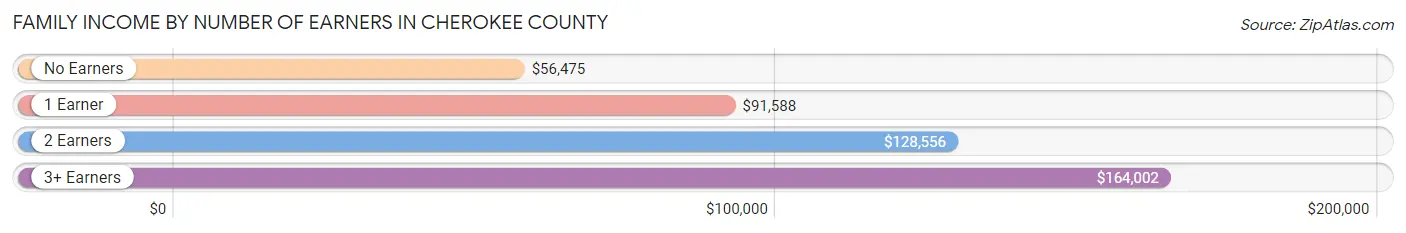
| Number of Earners | # Families | Median Income |
| No Earners | 8,949 (12.2%) | $56,475 |
| 1 Earner | 20,458 (27.9%) | $91,588 |
| 2 Earners | 34,431 (47.0%) | $128,556 |
| 3+ Earners | 9,423 (12.9%) | $164,002 |
| Total | 73,261 (100.0%) | $113,750 |
Household Income in Cherokee County
Household Income Brackets in Cherokee County
With 21,345 households falling in the category, the $100,000 to $149,999 income range is the most frequent in Cherokee County, accounting for 22.0% of all households. In contrast, only 1,843 households (1.9%) fall into the $10,000 to $14,999 income bracket, making it the least populous group.
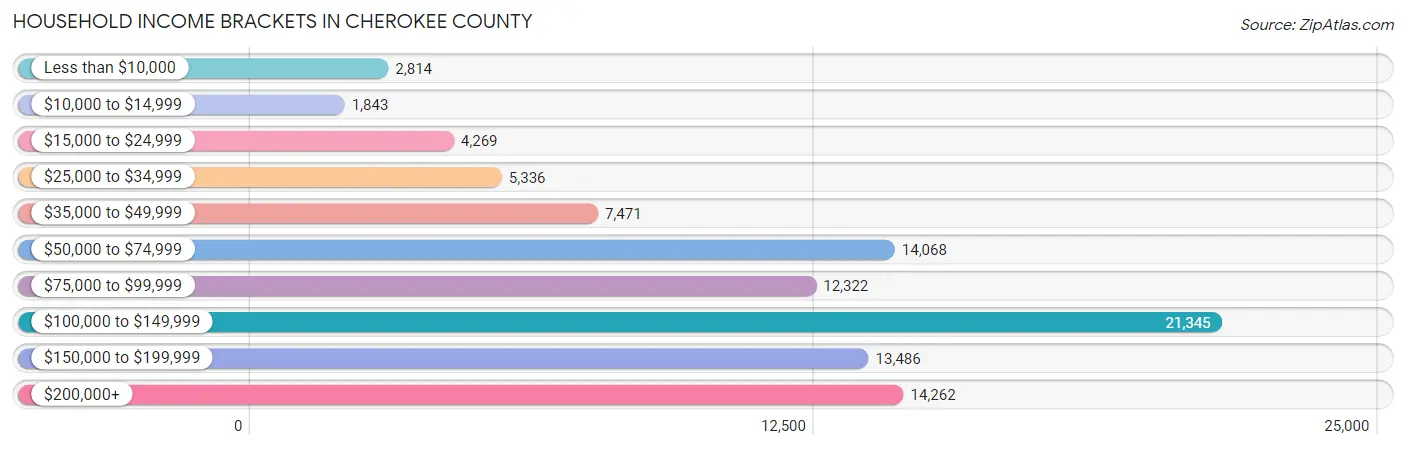
| Income Bracket | # Households | % Households |
| Less than $10,000 | 2,814 | 2.9% |
| $10,000 to $14,999 | 1,843 | 1.9% |
| $15,000 to $24,999 | 4,269 | 4.4% |
| $25,000 to $34,999 | 5,336 | 5.5% |
| $35,000 to $49,999 | 7,471 | 7.7% |
| $50,000 to $74,999 | 14,068 | 14.5% |
| $75,000 to $99,999 | 12,322 | 12.7% |
| $100,000 to $149,999 | 21,345 | 22.0% |
| $150,000 to $199,999 | 13,486 | 13.9% |
| $200,000+ | 14,262 | 14.7% |
Household Income by Householder Age in Cherokee County
The median household income in Cherokee County is $100,824, with the highest median household income of $124,139 found in the 45 to 64 years age bracket for the primary householder. A total of 40,026 households (41.2%) fall into this category. Meanwhile, the 15 to 24 years age bracket for the primary householder has the lowest median household income of $64,132, with 1,874 households (1.9%) in this group.
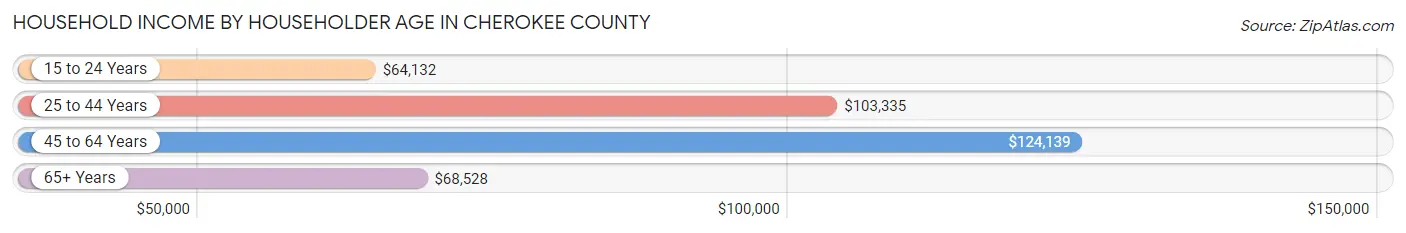
| Income Bracket | # Households | Median Income |
| 15 to 24 Years | 1,874 (1.9%) | $64,132 |
| 25 to 44 Years | 31,598 (32.6%) | $103,335 |
| 45 to 64 Years | 40,026 (41.2%) | $124,139 |
| 65+ Years | 23,525 (24.2%) | $68,528 |
| Total | 97,023 (100.0%) | $100,824 |
Poverty in Cherokee County
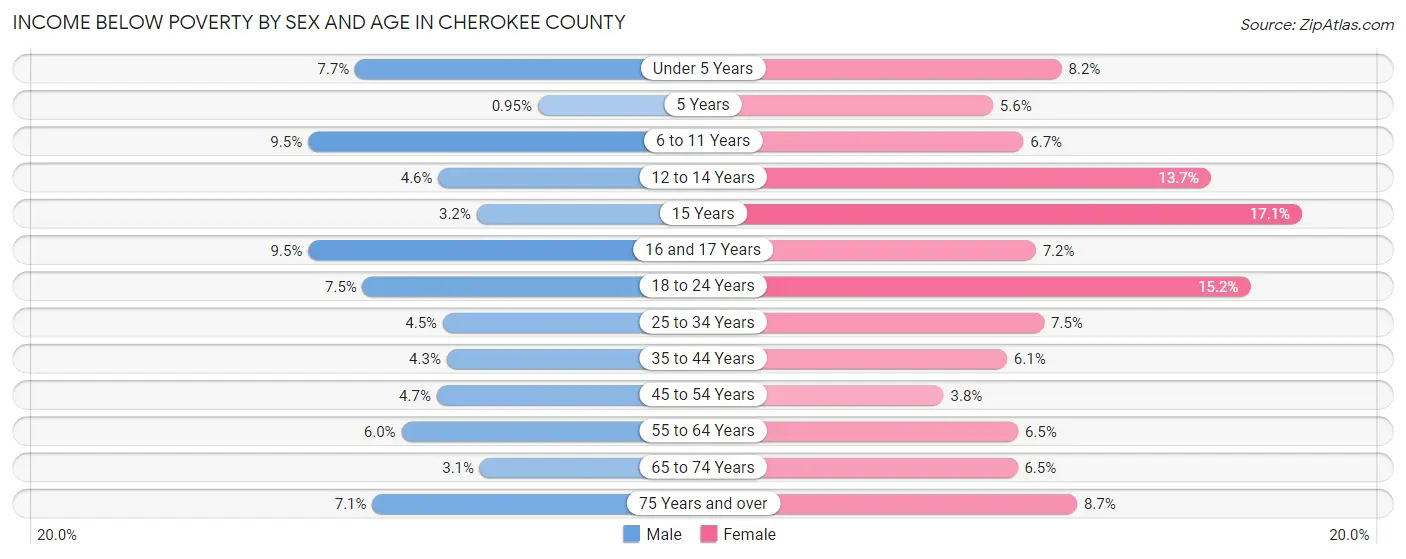
Income Below Poverty by Sex and Age in Cherokee County
With 5.7% poverty level for males and 7.6% for females among the residents of Cherokee County, 6 to 11 year old males and 15 year old females are the most vulnerable to poverty, with 1,061 males (9.5%) and 430 females (17.1%) in their respective age groups living below the poverty level.
| Age Bracket | Male | Female |
| Under 5 Years | 591 (7.7%) | 579 (8.2%) |
| 5 Years | 15 (0.9%) | 84 (5.6%) |
| 6 to 11 Years | 1,061 (9.5%) | 670 (6.7%) |
| 12 to 14 Years | 261 (4.6%) | 781 (13.7%) |
| 15 Years | 70 (3.2%) | 430 (17.1%) |
| 16 and 17 Years | 363 (9.5%) | 258 (7.2%) |
| 18 to 24 Years | 849 (7.4%) | 1,543 (15.2%) |
| 25 to 34 Years | 686 (4.5%) | 1,235 (7.5%) |
| 35 to 44 Years | 799 (4.3%) | 1,121 (6.1%) |
| 45 to 54 Years | 927 (4.7%) | 739 (3.8%) |
| 55 to 64 Years | 1,020 (6.0%) | 1,156 (6.5%) |
| 65 to 74 Years | 363 (3.1%) | 896 (6.5%) |
| 75 Years and over | 450 (7.1%) | 715 (8.7%) |
| Total | 7,455 (5.7%) | 10,207 (7.6%) |
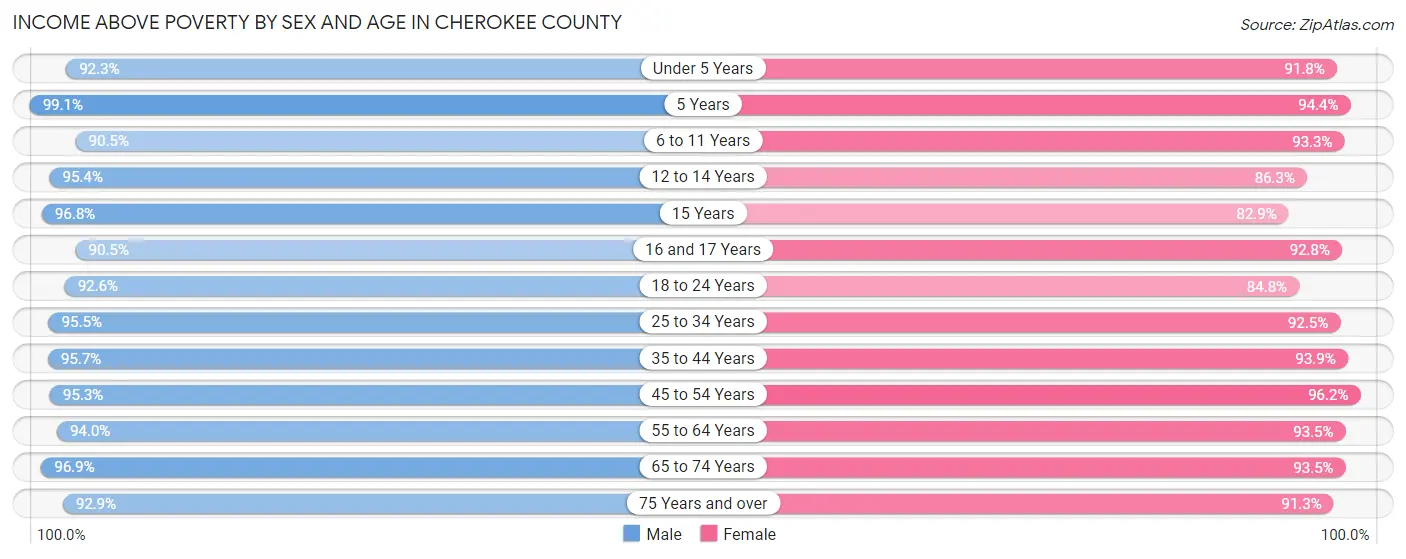
Income Above Poverty by Sex and Age in Cherokee County
According to the poverty statistics in Cherokee County, males aged 5 years and females aged 45 to 54 years are the age groups that are most secure financially, with 99.1% of males and 96.2% of females in these age groups living above the poverty line.
| Age Bracket | Male | Female |
| Under 5 Years | 7,052 (92.3%) | 6,520 (91.8%) |
| 5 Years | 1,564 (99.1%) | 1,413 (94.4%) |
| 6 to 11 Years | 10,131 (90.5%) | 9,276 (93.3%) |
| 12 to 14 Years | 5,361 (95.4%) | 4,923 (86.3%) |
| 15 Years | 2,104 (96.8%) | 2,088 (82.9%) |
| 16 and 17 Years | 3,471 (90.5%) | 3,323 (92.8%) |
| 18 to 24 Years | 10,544 (92.5%) | 8,637 (84.8%) |
| 25 to 34 Years | 14,644 (95.5%) | 15,219 (92.5%) |
| 35 to 44 Years | 17,656 (95.7%) | 17,178 (93.9%) |
| 45 to 54 Years | 18,779 (95.3%) | 18,790 (96.2%) |
| 55 to 64 Years | 15,944 (94.0%) | 16,509 (93.5%) |
| 65 to 74 Years | 11,344 (96.9%) | 12,840 (93.5%) |
| 75 Years and over | 5,893 (92.9%) | 7,479 (91.3%) |
| Total | 124,487 (94.4%) | 124,195 (92.4%) |
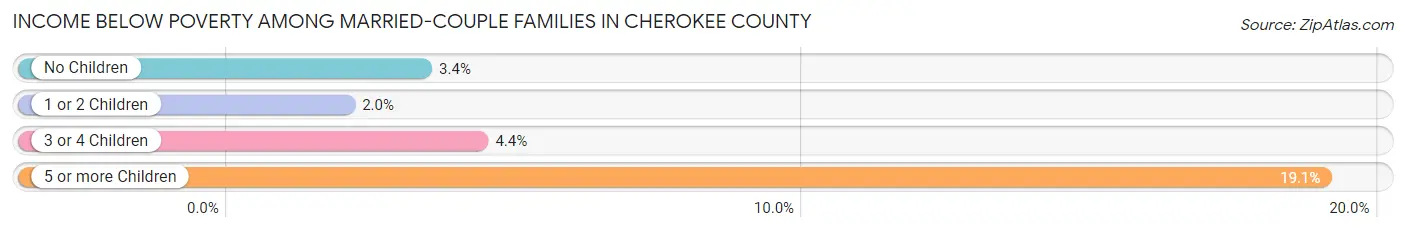
Income Below Poverty Among Married-Couple Families in Cherokee County
The poverty statistics for married-couple families in Cherokee County show that 3.1% or 1,842 of the total 59,853 families live below the poverty line. Families with 5 or more children have the highest poverty rate of 19.1%, comprising of 64 families. On the other hand, families with 1 or 2 children have the lowest poverty rate of 2.0%, which includes 432 families.
| Children | Above Poverty | Below Poverty |
| No Children | 32,146 (96.6%) | 1,124 (3.4%) |
| 1 or 2 Children | 20,721 (98.0%) | 432 (2.0%) |
| 3 or 4 Children | 4,872 (95.6%) | 222 (4.4%) |
| 5 or more Children | 272 (80.9%) | 64 (19.1%) |
| Total | 58,011 (96.9%) | 1,842 (3.1%) |
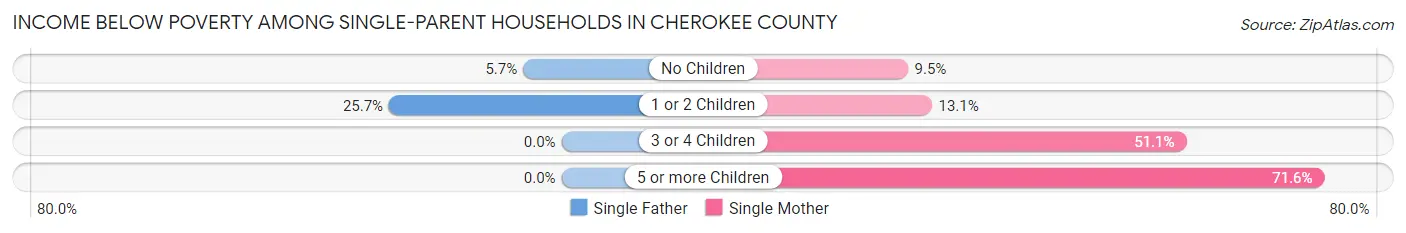
Income Below Poverty Among Single-Parent Households in Cherokee County
According to the poverty data in Cherokee County, 15.9% or 591 single-father households and 14.9% or 1,444 single-mother households are living below the poverty line. Among single-father households, those with 1 or 2 children have the highest poverty rate, with 504 households (25.7%) experiencing poverty. Likewise, among single-mother households, those with 5 or more children have the highest poverty rate, with 53 households (71.6%) falling below the poverty line.
| Children | Single Father | Single Mother |
| No Children | 87 (5.7%) | 362 (9.5%) |
| 1 or 2 Children | 504 (25.7%) | 667 (13.1%) |
| 3 or 4 Children | 0 (0.0%) | 362 (51.1%) |
| 5 or more Children | 0 (0.0%) | 53 (71.6%) |
| Total | 591 (15.9%) | 1,444 (14.9%) |
Income Below Poverty Among Married-Couple vs Single-Parent Households in Cherokee County
The poverty data for Cherokee County shows that 1,842 of the married-couple family households (3.1%) and 2,035 of the single-parent households (15.2%) are living below the poverty level. Within the married-couple family households, those with 5 or more children have the highest poverty rate, with 64 households (19.1%) falling below the poverty line. Among the single-parent households, those with 5 or more children have the highest poverty rate, with 53 household (71.6%) living below poverty.
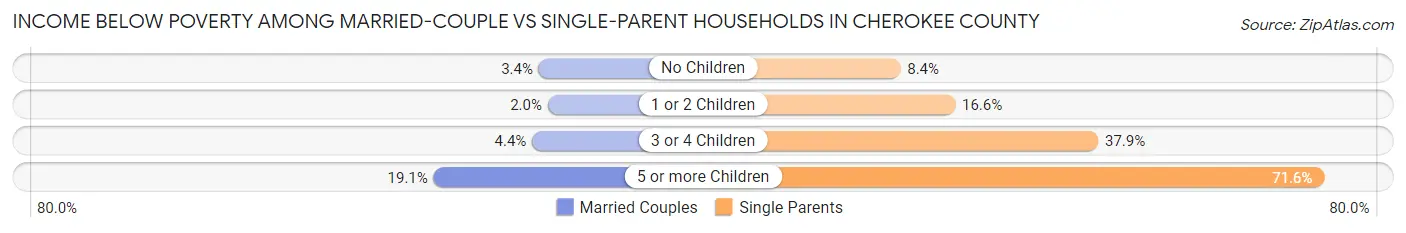
| Children | Married-Couple Families | Single-Parent Households |
| No Children | 1,124 (3.4%) | 449 (8.4%) |
| 1 or 2 Children | 432 (2.0%) | 1,171 (16.6%) |
| 3 or 4 Children | 222 (4.4%) | 362 (37.9%) |
| 5 or more Children | 64 (19.1%) | 53 (71.6%) |
| Total | 1,842 (3.1%) | 2,035 (15.2%) |
Employment Characteristics in Cherokee County
Employment by Class of Employer in Cherokee County
Among the 139,111 employed individuals in Cherokee County, private company employees (99,514 | 71.5%), local government employees (11,002 | 7.9%), and self-employed (not incorporated) (8,720 | 6.3%) make up the most common classes of employment.
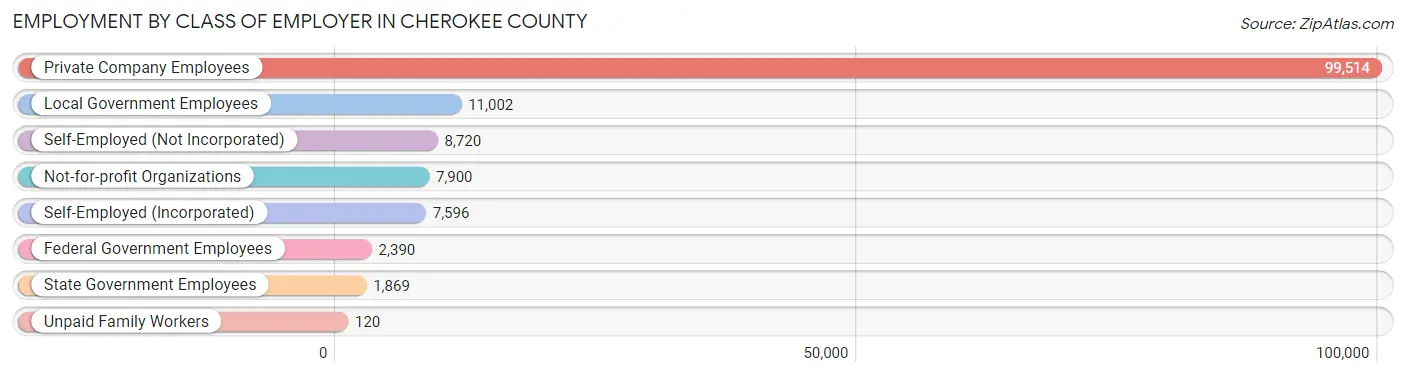
| Employer Class | # Employees | % Employees |
| Private Company Employees | 99,514 | 71.5% |
| Self-Employed (Incorporated) | 7,596 | 5.5% |
| Self-Employed (Not Incorporated) | 8,720 | 6.3% |
| Not-for-profit Organizations | 7,900 | 5.7% |
| Local Government Employees | 11,002 | 7.9% |
| State Government Employees | 1,869 | 1.3% |
| Federal Government Employees | 2,390 | 1.7% |
| Unpaid Family Workers | 120 | 0.1% |
| Total | 139,111 | 100.0% |
Employment Status by Age in Cherokee County
According to the labor force statistics for Cherokee County, out of the total population over 16 years of age (212,952), 68.9% or 146,724 individuals are in the labor force, with 3.7% or 5,429 of them unemployed. The age group with the highest labor force participation rate is 25 to 29 years, with 88.5% or 13,992 individuals in the labor force. Within the labor force, the 16 to 19 years age range has the highest percentage of unemployed individuals, with 12.6% or 817 of them being unemployed.
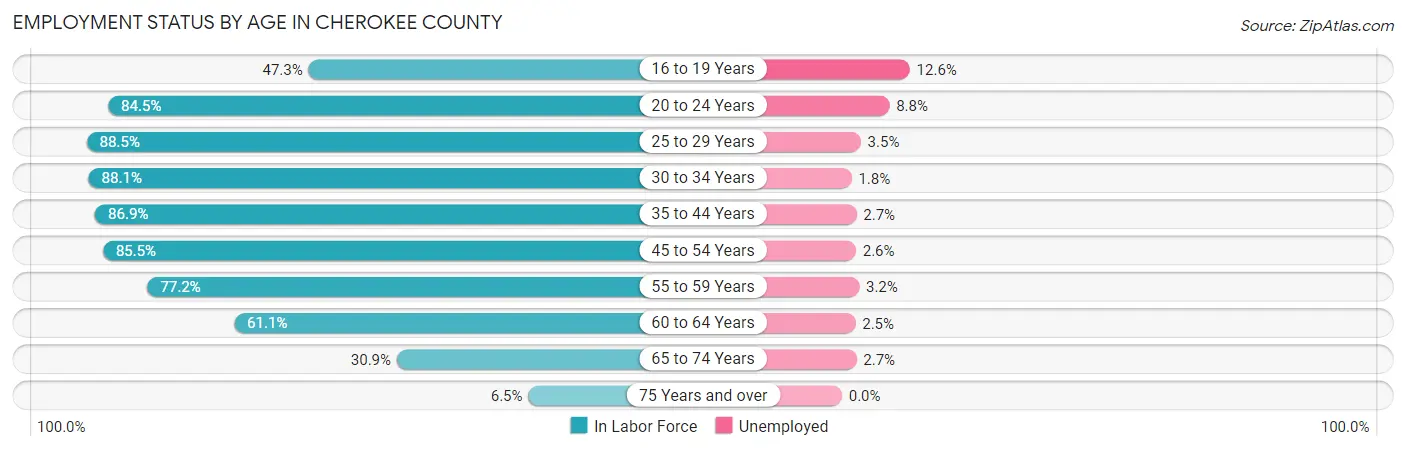
| Age Bracket | In Labor Force | Unemployed |
| 16 to 19 Years | 6,488 (47.3%) | 817 (12.6%) |
| 20 to 24 Years | 13,447 (84.5%) | 1,183 (8.8%) |
| 25 to 29 Years | 13,992 (88.5%) | 490 (3.5%) |
| 30 to 34 Years | 14,250 (88.1%) | 256 (1.8%) |
| 35 to 44 Years | 32,028 (86.9%) | 865 (2.7%) |
| 45 to 54 Years | 33,666 (85.5%) | 875 (2.6%) |
| 55 to 59 Years | 13,627 (77.2%) | 436 (3.2%) |
| 60 to 64 Years | 10,438 (61.1%) | 261 (2.5%) |
| 65 to 74 Years | 7,882 (30.9%) | 213 (2.7%) |
| 75 Years and over | 966 (6.5%) | 0 (0.0%) |
| Total | 146,724 (68.9%) | 5,429 (3.7%) |
Employment Status by Educational Attainment in Cherokee County
According to labor force statistics for Cherokee County, 82.5% of individuals (117,935) out of the total population between 25 and 64 years of age (142,951) are in the labor force, with 2.7% or 3,184 of them being unemployed. The group with the highest labor force participation rate are those with the educational attainment of bachelor's degree or higher, with 87.3% or 51,279 individuals in the labor force. Within the labor force, individuals with less than high school education have the highest percentage of unemployment, with 8.8% or 650 of them being unemployed.
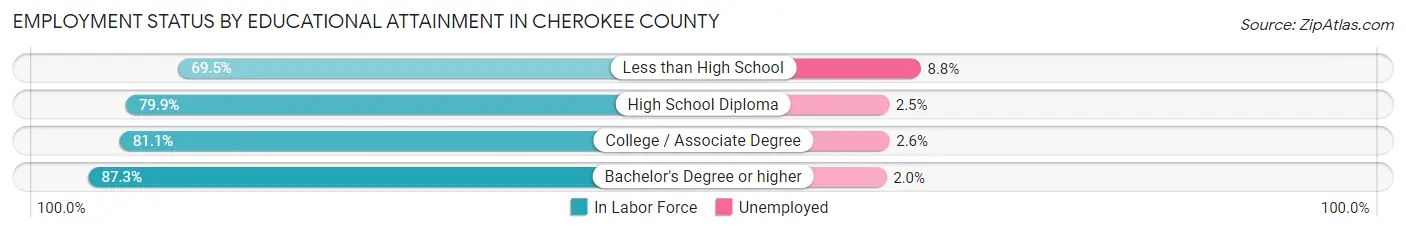
| Educational Attainment | In Labor Force | Unemployed |
| Less than High School | 7,383 (69.5%) | 935 (8.8%) |
| High School Diploma | 23,671 (79.9%) | 741 (2.5%) |
| College / Associate Degree | 35,654 (81.1%) | 1,143 (2.6%) |
| Bachelor's Degree or higher | 51,279 (87.3%) | 1,175 (2.0%) |
| Total | 117,935 (82.5%) | 3,860 (2.7%) |
Employment Occupations by Sex in Cherokee County
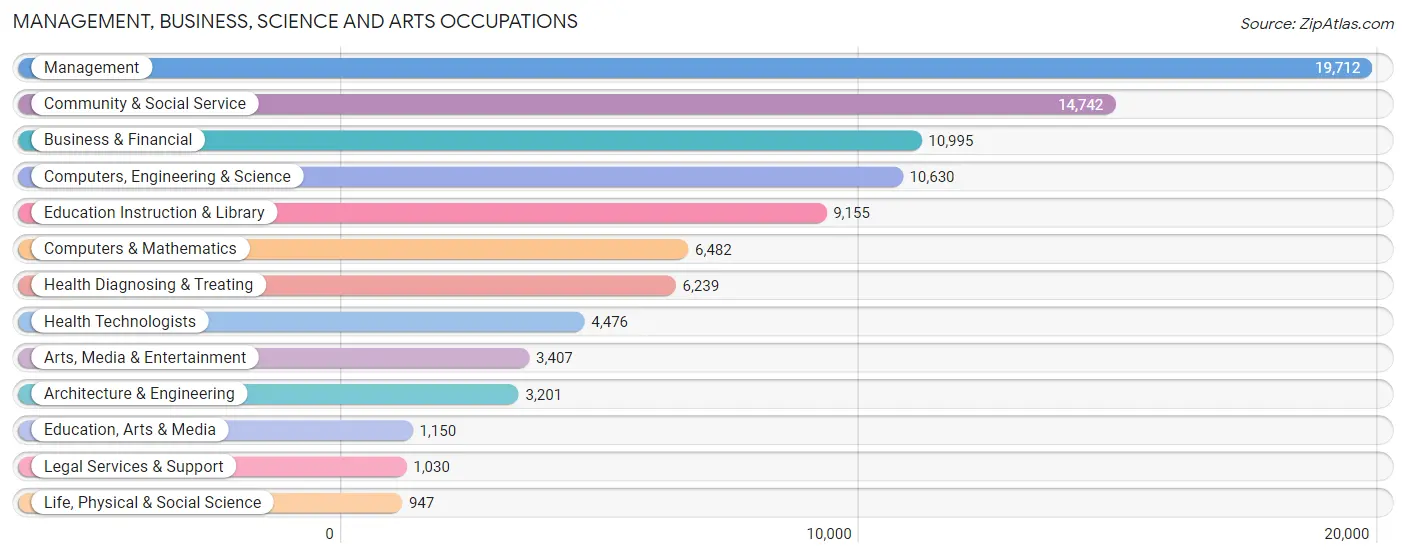
Management, Business, Science and Arts Occupations
The most common Management, Business, Science and Arts occupations in Cherokee County are Management (19,712 | 14.0%), Community & Social Service (14,742 | 10.4%), Business & Financial (10,995 | 7.8%), Computers, Engineering & Science (10,630 | 7.5%), and Education Instruction & Library (9,155 | 6.5%).
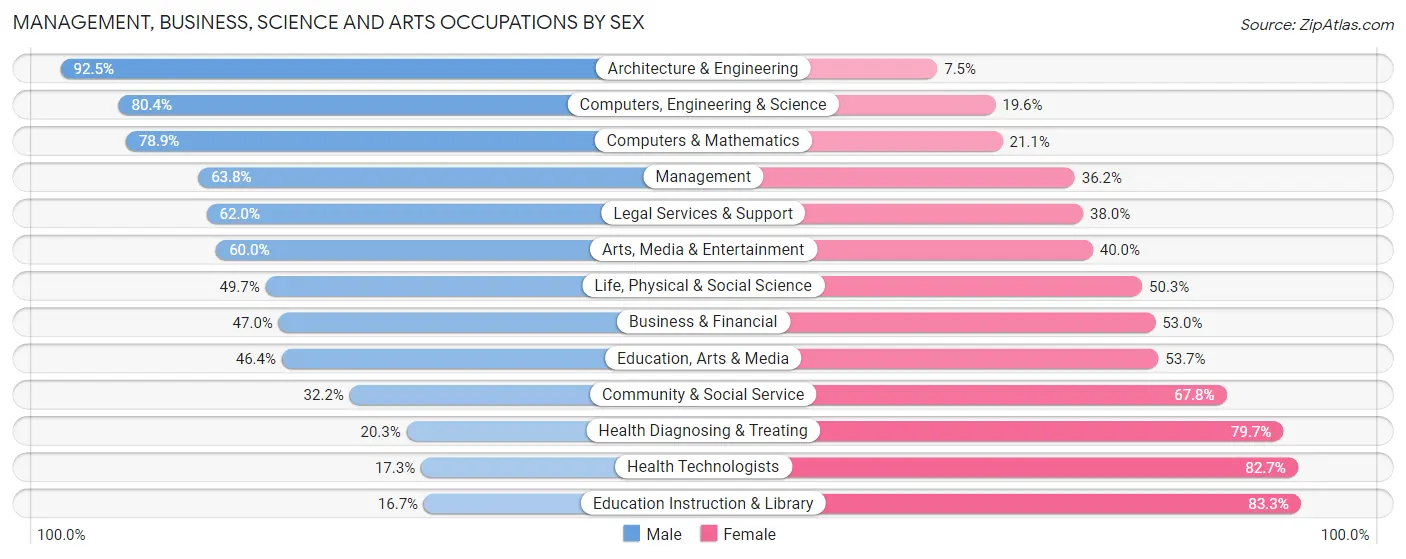
Management, Business, Science and Arts Occupations by Sex
Within the Management, Business, Science and Arts occupations in Cherokee County, the most male-oriented occupations are Architecture & Engineering (92.5%), Computers, Engineering & Science (80.4%), and Computers & Mathematics (78.9%), while the most female-oriented occupations are Education Instruction & Library (83.3%), Health Technologists (82.7%), and Health Diagnosing & Treating (79.7%).
| Occupation | Male | Female |
| Management | 12,572 (63.8%) | 7,140 (36.2%) |
| Business & Financial | 5,168 (47.0%) | 5,827 (53.0%) |
| Computers, Engineering & Science | 8,543 (80.4%) | 2,087 (19.6%) |
| Computers & Mathematics | 5,112 (78.9%) | 1,370 (21.1%) |
| Architecture & Engineering | 2,960 (92.5%) | 241 (7.5%) |
| Life, Physical & Social Science | 471 (49.7%) | 476 (50.3%) |
| Community & Social Service | 4,746 (32.2%) | 9,996 (67.8%) |
| Education, Arts & Media | 533 (46.4%) | 617 (53.6%) |
| Legal Services & Support | 639 (62.0%) | 391 (38.0%) |
| Education Instruction & Library | 1,529 (16.7%) | 7,626 (83.3%) |
| Arts, Media & Entertainment | 2,045 (60.0%) | 1,362 (40.0%) |
| Health Diagnosing & Treating | 1,268 (20.3%) | 4,971 (79.7%) |
| Health Technologists | 775 (17.3%) | 3,701 (82.7%) |
| Total (Category) | 32,297 (51.8%) | 30,021 (48.2%) |
| Total (Overall) | 76,346 (54.1%) | 64,845 (45.9%) |
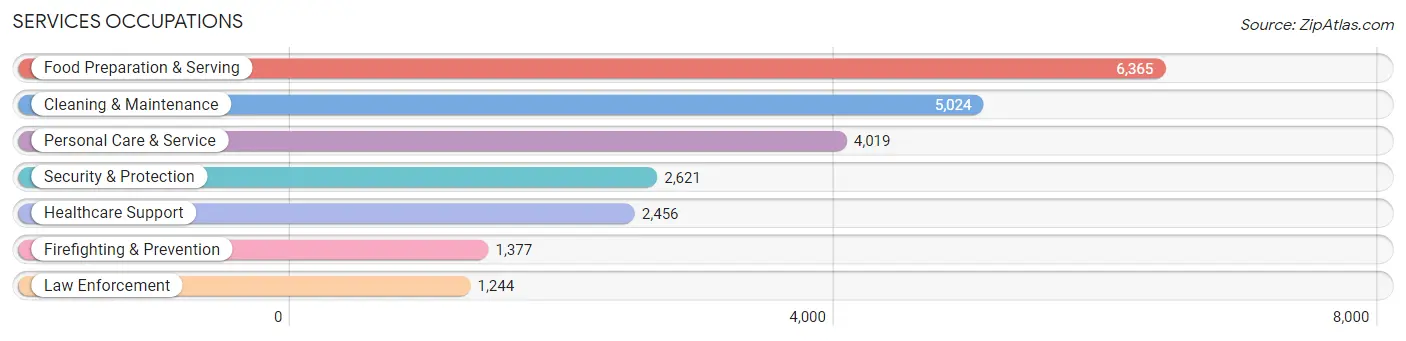
Services Occupations
The most common Services occupations in Cherokee County are Food Preparation & Serving (6,365 | 4.5%), Cleaning & Maintenance (5,024 | 3.6%), Personal Care & Service (4,019 | 2.9%), Security & Protection (2,621 | 1.9%), and Healthcare Support (2,456 | 1.7%).
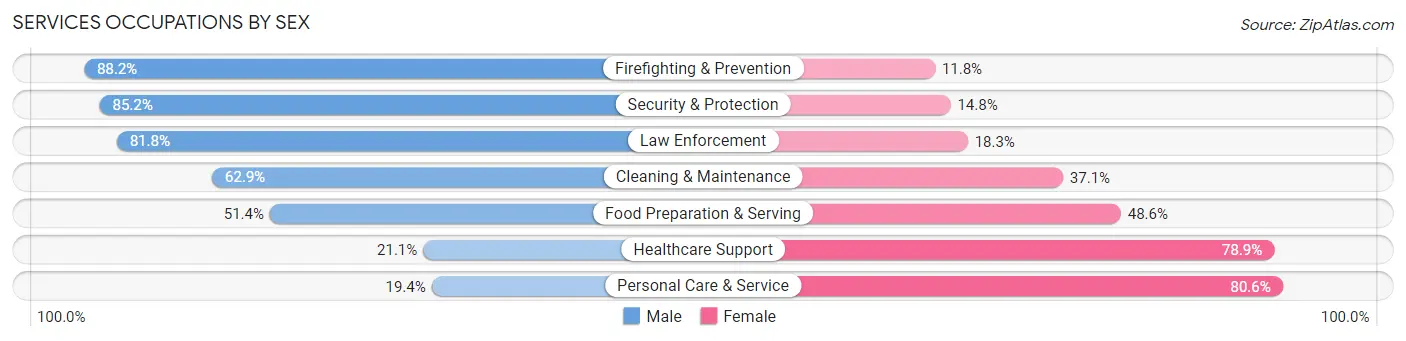
Services Occupations by Sex
Within the Services occupations in Cherokee County, the most male-oriented occupations are Firefighting & Prevention (88.2%), Security & Protection (85.2%), and Law Enforcement (81.8%), while the most female-oriented occupations are Personal Care & Service (80.6%), Healthcare Support (78.9%), and Food Preparation & Serving (48.6%).
| Occupation | Male | Female |
| Healthcare Support | 518 (21.1%) | 1,938 (78.9%) |
| Security & Protection | 2,232 (85.2%) | 389 (14.8%) |
| Firefighting & Prevention | 1,215 (88.2%) | 162 (11.8%) |
| Law Enforcement | 1,017 (81.8%) | 227 (18.2%) |
| Food Preparation & Serving | 3,274 (51.4%) | 3,091 (48.6%) |
| Cleaning & Maintenance | 3,160 (62.9%) | 1,864 (37.1%) |
| Personal Care & Service | 780 (19.4%) | 3,239 (80.6%) |
| Total (Category) | 9,964 (48.6%) | 10,521 (51.4%) |
| Total (Overall) | 76,346 (54.1%) | 64,845 (45.9%) |
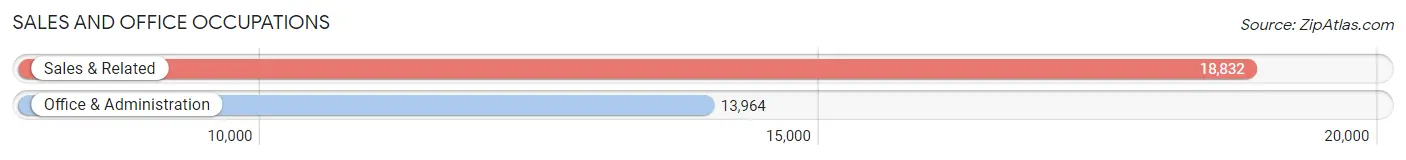
Sales and Office Occupations
The most common Sales and Office occupations in Cherokee County are Sales & Related (18,832 | 13.3%), and Office & Administration (13,964 | 9.9%).
Sales and Office Occupations by Sex
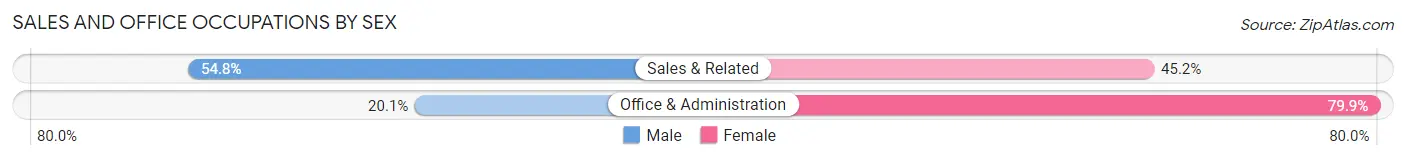
| Occupation | Male | Female |
| Sales & Related | 10,327 (54.8%) | 8,505 (45.2%) |
| Office & Administration | 2,803 (20.1%) | 11,161 (79.9%) |
| Total (Category) | 13,130 (40.0%) | 19,666 (60.0%) |
| Total (Overall) | 76,346 (54.1%) | 64,845 (45.9%) |
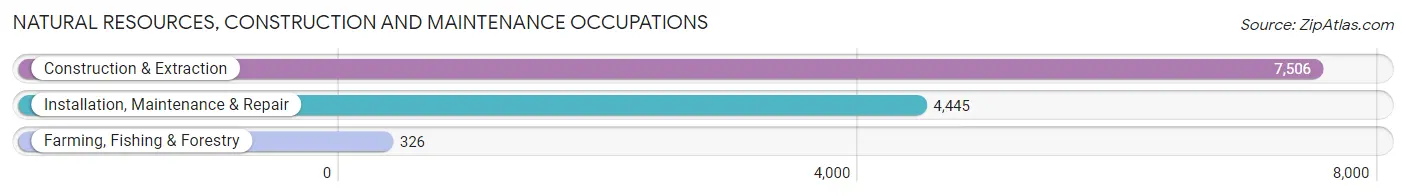
Natural Resources, Construction and Maintenance Occupations
The most common Natural Resources, Construction and Maintenance occupations in Cherokee County are Construction & Extraction (7,506 | 5.3%), Installation, Maintenance & Repair (4,445 | 3.2%), and Farming, Fishing & Forestry (326 | 0.2%).
Natural Resources, Construction and Maintenance Occupations by Sex
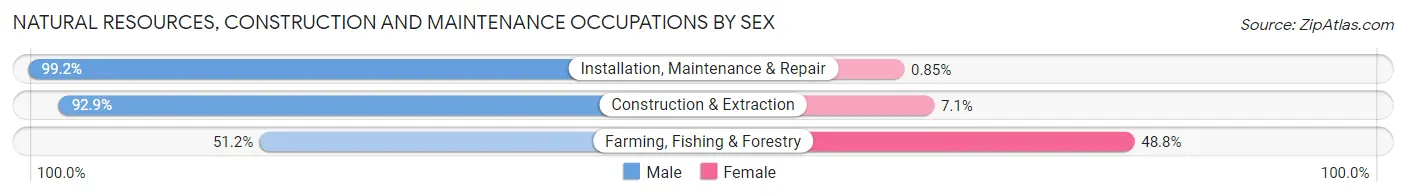
| Occupation | Male | Female |
| Farming, Fishing & Forestry | 167 (51.2%) | 159 (48.8%) |
| Construction & Extraction | 6,972 (92.9%) | 534 (7.1%) |
| Installation, Maintenance & Repair | 4,407 (99.2%) | 38 (0.9%) |
| Total (Category) | 11,546 (94.1%) | 731 (5.9%) |
| Total (Overall) | 76,346 (54.1%) | 64,845 (45.9%) |
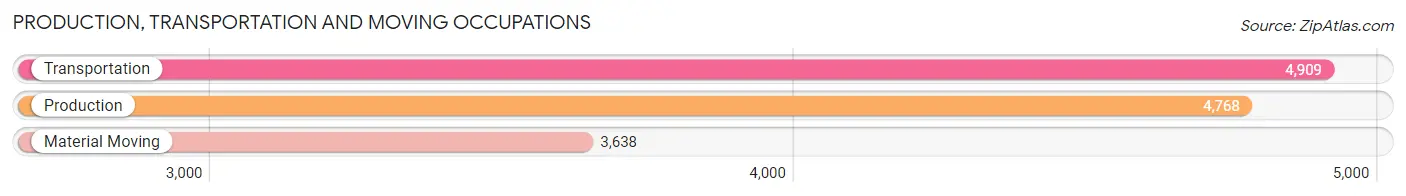
Production, Transportation and Moving Occupations
The most common Production, Transportation and Moving occupations in Cherokee County are Transportation (4,909 | 3.5%), Production (4,768 | 3.4%), and Material Moving (3,638 | 2.6%).
Production, Transportation and Moving Occupations by Sex
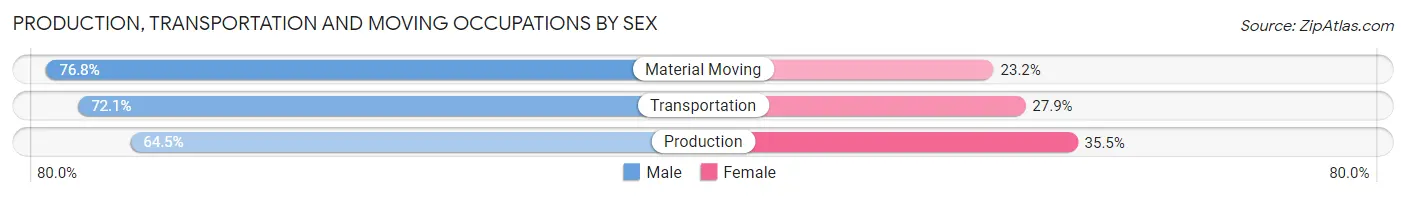
| Occupation | Male | Female |
| Production | 3,074 (64.5%) | 1,694 (35.5%) |
| Transportation | 3,541 (72.1%) | 1,368 (27.9%) |
| Material Moving | 2,794 (76.8%) | 844 (23.2%) |
| Total (Category) | 9,409 (70.7%) | 3,906 (29.3%) |
| Total (Overall) | 76,346 (54.1%) | 64,845 (45.9%) |
Employment Industries by Sex in Cherokee County
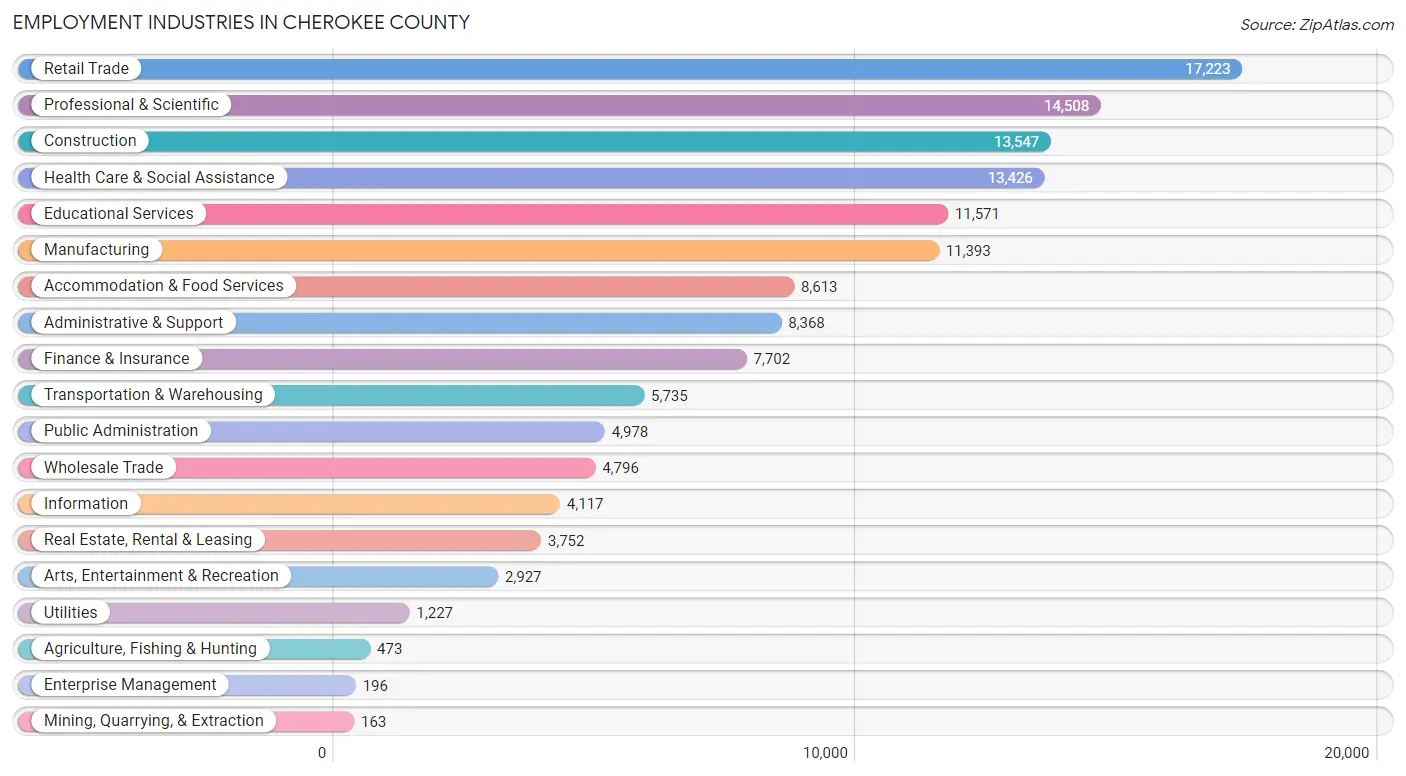
Employment Industries in Cherokee County
The major employment industries in Cherokee County include Retail Trade (17,223 | 12.2%), Professional & Scientific (14,508 | 10.3%), Construction (13,547 | 9.6%), Health Care & Social Assistance (13,426 | 9.5%), and Educational Services (11,571 | 8.2%).
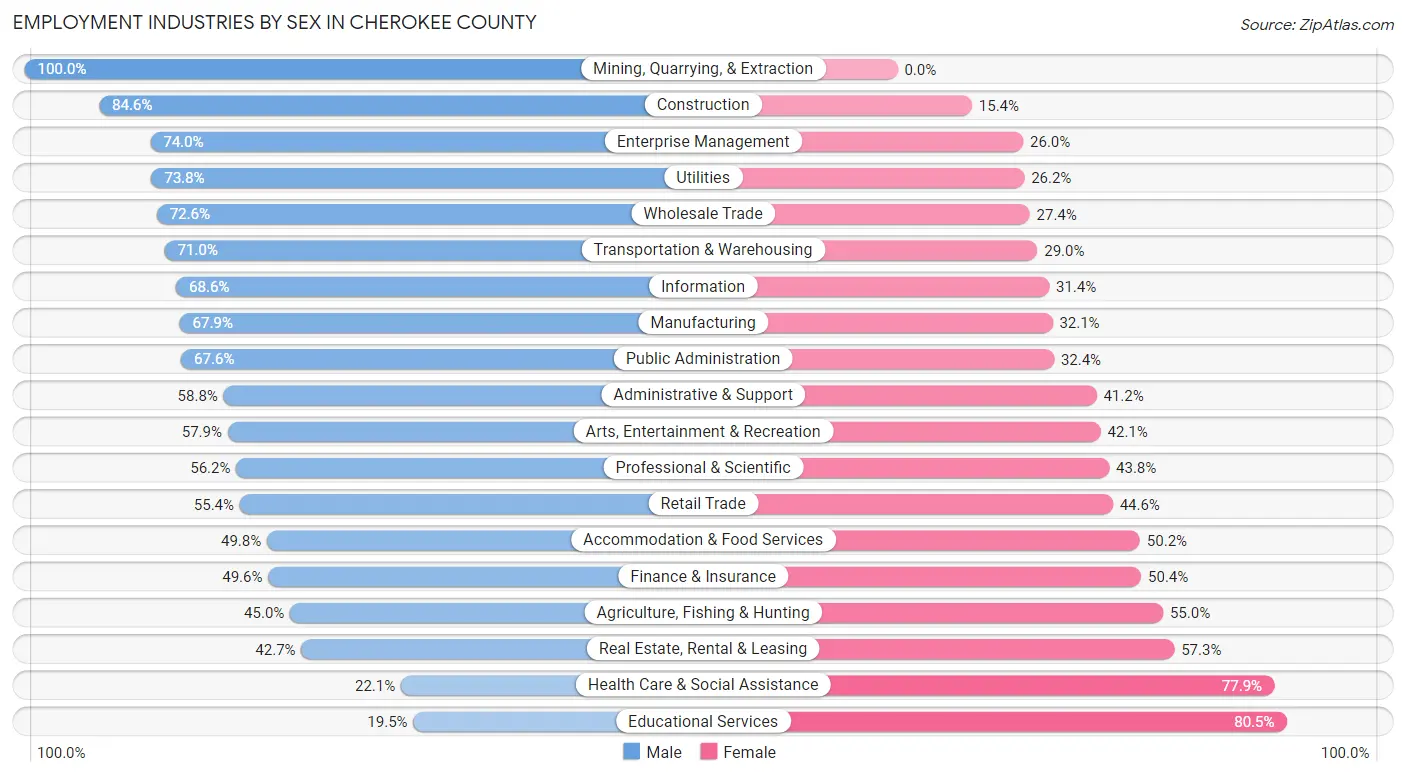
Employment Industries by Sex in Cherokee County
The Cherokee County industries that see more men than women are Mining, Quarrying, & Extraction (100.0%), Construction (84.6%), and Enterprise Management (74.0%), whereas the industries that tend to have a higher number of women are Educational Services (80.5%), Health Care & Social Assistance (77.9%), and Real Estate, Rental & Leasing (57.3%).
| Industry | Male | Female |
| Agriculture, Fishing & Hunting | 213 (45.0%) | 260 (55.0%) |
| Mining, Quarrying, & Extraction | 163 (100.0%) | 0 (0.0%) |
| Construction | 11,459 (84.6%) | 2,088 (15.4%) |
| Manufacturing | 7,737 (67.9%) | 3,656 (32.1%) |
| Wholesale Trade | 3,484 (72.6%) | 1,312 (27.4%) |
| Retail Trade | 9,548 (55.4%) | 7,675 (44.6%) |
| Transportation & Warehousing | 4,074 (71.0%) | 1,661 (29.0%) |
| Utilities | 905 (73.8%) | 322 (26.2%) |
| Information | 2,825 (68.6%) | 1,292 (31.4%) |
| Finance & Insurance | 3,817 (49.6%) | 3,885 (50.4%) |
| Real Estate, Rental & Leasing | 1,602 (42.7%) | 2,150 (57.3%) |
| Professional & Scientific | 8,150 (56.2%) | 6,358 (43.8%) |
| Enterprise Management | 145 (74.0%) | 51 (26.0%) |
| Administrative & Support | 4,920 (58.8%) | 3,448 (41.2%) |
| Educational Services | 2,259 (19.5%) | 9,312 (80.5%) |
| Health Care & Social Assistance | 2,965 (22.1%) | 10,461 (77.9%) |
| Arts, Entertainment & Recreation | 1,696 (57.9%) | 1,231 (42.1%) |
| Accommodation & Food Services | 4,290 (49.8%) | 4,323 (50.2%) |
| Public Administration | 3,365 (67.6%) | 1,613 (32.4%) |
| Total | 76,346 (54.1%) | 64,845 (45.9%) |
Education in Cherokee County
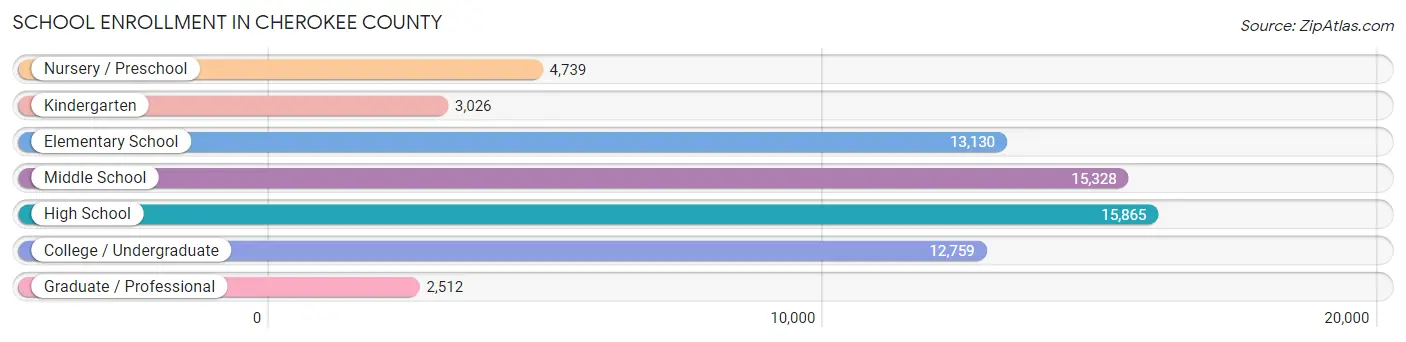
School Enrollment in Cherokee County
The most common levels of schooling among the 67,359 students in Cherokee County are high school (15,865 | 23.5%), middle school (15,328 | 22.8%), and elementary school (13,130 | 19.5%).
| School Level | # Students | % Students |
| Nursery / Preschool | 4,739 | 7.0% |
| Kindergarten | 3,026 | 4.5% |
| Elementary School | 13,130 | 19.5% |
| Middle School | 15,328 | 22.8% |
| High School | 15,865 | 23.5% |
| College / Undergraduate | 12,759 | 18.9% |
| Graduate / Professional | 2,512 | 3.7% |
| Total | 67,359 | 100.0% |
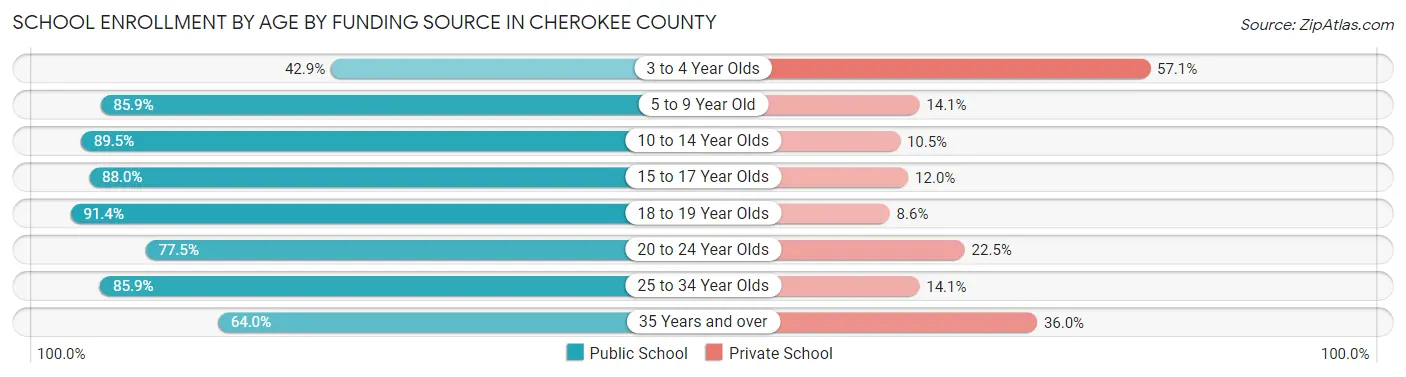
School Enrollment by Age by Funding Source in Cherokee County
Out of a total of 67,359 students who are enrolled in schools in Cherokee County, 11,114 (16.5%) attend a private institution, while the remaining 56,245 (83.5%) are enrolled in public schools. The age group of 3 to 4 year olds has the highest likelihood of being enrolled in private schools, with 1,909 (57.1% in the age bracket) enrolled. Conversely, the age group of 18 to 19 year olds has the lowest likelihood of being enrolled in a private school, with 3,917 (91.4% in the age bracket) attending a public institution.
| Age Bracket | Public School | Private School |
| 3 to 4 Year Olds | 1,436 (42.9%) | 1,909 (57.1%) |
| 5 to 9 Year Old | 13,121 (85.9%) | 2,154 (14.1%) |
| 10 to 14 Year Olds | 17,340 (89.5%) | 2,031 (10.5%) |
| 15 to 17 Year Olds | 10,472 (88.0%) | 1,429 (12.0%) |
| 18 to 19 Year Olds | 3,917 (91.4%) | 367 (8.6%) |
| 20 to 24 Year Olds | 4,897 (77.5%) | 1,425 (22.5%) |
| 25 to 34 Year Olds | 2,654 (85.9%) | 435 (14.1%) |
| 35 Years and over | 2,414 (64.0%) | 1,358 (36.0%) |
| Total | 56,245 (83.5%) | 11,114 (16.5%) |
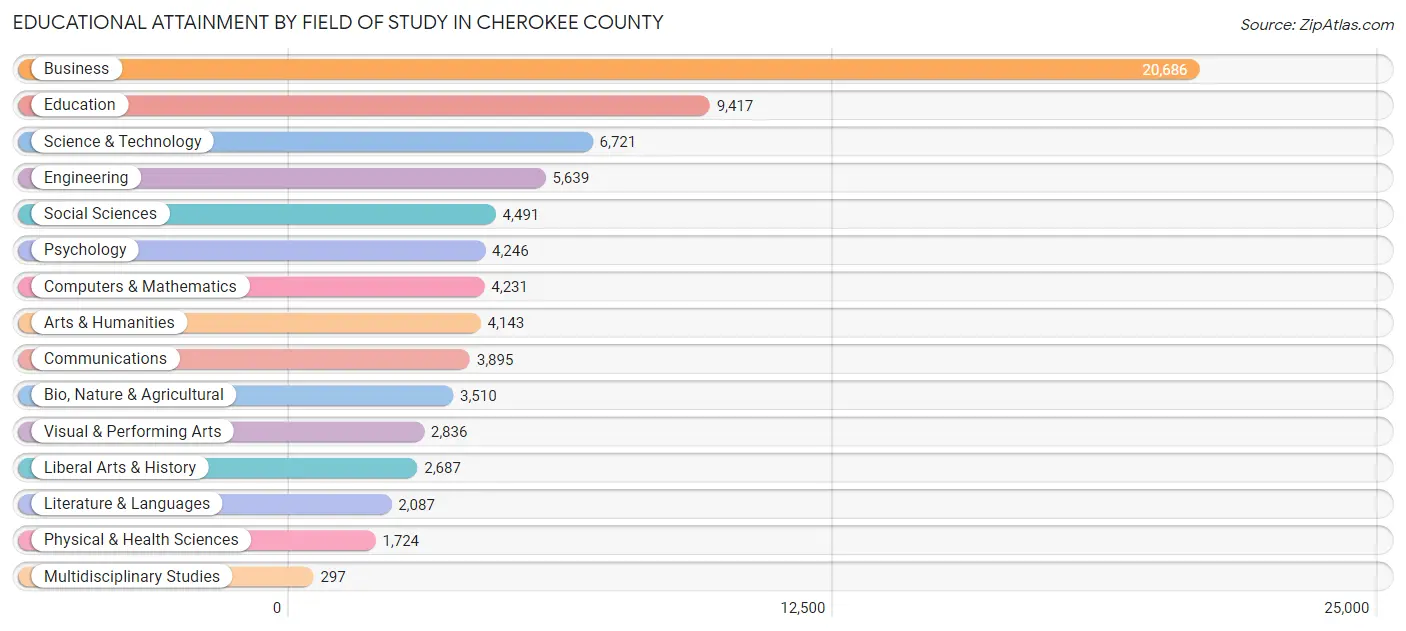
Educational Attainment by Field of Study in Cherokee County
Business (20,686 | 27.0%), education (9,417 | 12.3%), science & technology (6,721 | 8.8%), engineering (5,639 | 7.4%), and social sciences (4,491 | 5.9%) are the most common fields of study among 76,610 individuals in Cherokee County who have obtained a bachelor's degree or higher.
| Field of Study | # Graduates | % Graduates |
| Computers & Mathematics | 4,231 | 5.5% |
| Bio, Nature & Agricultural | 3,510 | 4.6% |
| Physical & Health Sciences | 1,724 | 2.2% |
| Psychology | 4,246 | 5.5% |
| Social Sciences | 4,491 | 5.9% |
| Engineering | 5,639 | 7.4% |
| Multidisciplinary Studies | 297 | 0.4% |
| Science & Technology | 6,721 | 8.8% |
| Business | 20,686 | 27.0% |
| Education | 9,417 | 12.3% |
| Literature & Languages | 2,087 | 2.7% |
| Liberal Arts & History | 2,687 | 3.5% |
| Visual & Performing Arts | 2,836 | 3.7% |
| Communications | 3,895 | 5.1% |
| Arts & Humanities | 4,143 | 5.4% |
| Total | 76,610 | 100.0% |
Transportation & Commute in Cherokee County
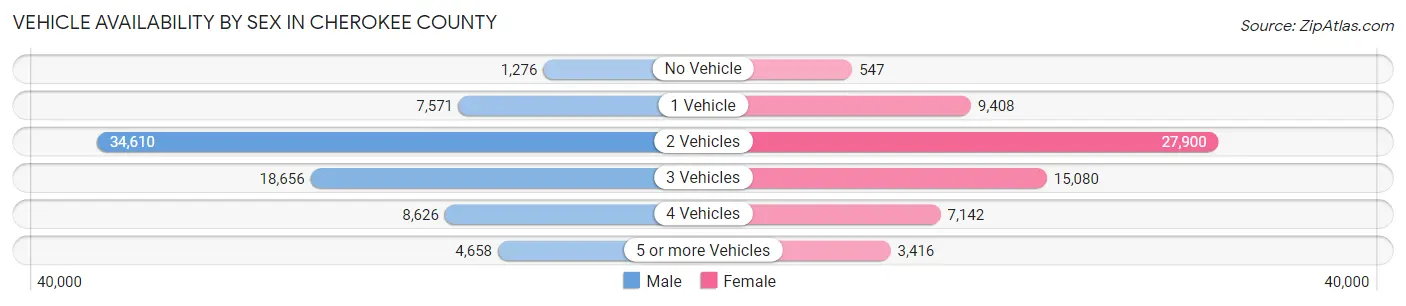
Vehicle Availability by Sex in Cherokee County
The most prevalent vehicle ownership categories in Cherokee County are males with 2 vehicles (34,610, accounting for 45.9%) and females with 2 vehicles (27,900, making up 54.5%).
| Vehicles Available | Male | Female |
| No Vehicle | 1,276 (1.7%) | 547 (0.9%) |
| 1 Vehicle | 7,571 (10.0%) | 9,408 (14.8%) |
| 2 Vehicles | 34,610 (45.9%) | 27,900 (43.9%) |
| 3 Vehicles | 18,656 (24.7%) | 15,080 (23.7%) |
| 4 Vehicles | 8,626 (11.4%) | 7,142 (11.3%) |
| 5 or more Vehicles | 4,658 (6.2%) | 3,416 (5.4%) |
| Total | 75,397 (100.0%) | 63,493 (100.0%) |
Commute Time in Cherokee County
The most frequently occuring commute durations in Cherokee County are 30 to 34 minutes (17,937 commuters, 15.8%), 45 to 59 minutes (15,365 commuters, 13.5%), and 15 to 19 minutes (14,436 commuters, 12.7%).
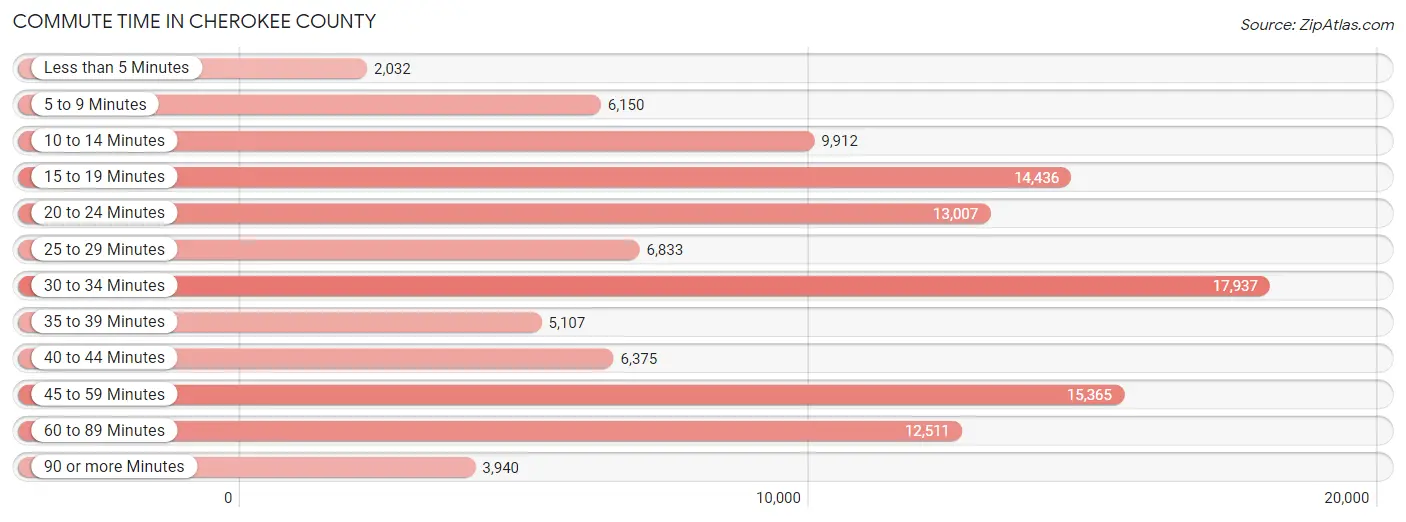
| Commute Time | # Commuters | % Commuters |
| Less than 5 Minutes | 2,032 | 1.8% |
| 5 to 9 Minutes | 6,150 | 5.4% |
| 10 to 14 Minutes | 9,912 | 8.7% |
| 15 to 19 Minutes | 14,436 | 12.7% |
| 20 to 24 Minutes | 13,007 | 11.5% |
| 25 to 29 Minutes | 6,833 | 6.0% |
| 30 to 34 Minutes | 17,937 | 15.8% |
| 35 to 39 Minutes | 5,107 | 4.5% |
| 40 to 44 Minutes | 6,375 | 5.6% |
| 45 to 59 Minutes | 15,365 | 13.5% |
| 60 to 89 Minutes | 12,511 | 11.0% |
| 90 or more Minutes | 3,940 | 3.5% |
Commute Time by Sex in Cherokee County
The most common commute times in Cherokee County are 45 to 59 minutes (10,098 commuters, 16.2%) for males and 30 to 34 minutes (8,722 commuters, 17.0%) for females.
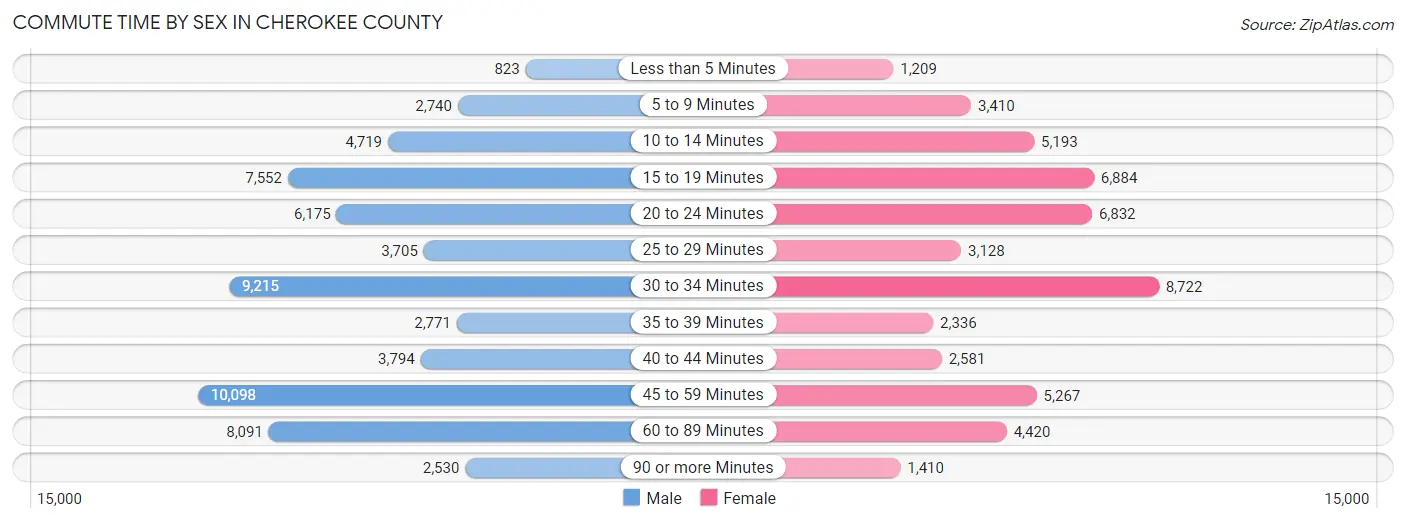
| Commute Time | Male | Female |
| Less than 5 Minutes | 823 (1.3%) | 1,209 (2.4%) |
| 5 to 9 Minutes | 2,740 (4.4%) | 3,410 (6.6%) |
| 10 to 14 Minutes | 4,719 (7.6%) | 5,193 (10.1%) |
| 15 to 19 Minutes | 7,552 (12.1%) | 6,884 (13.4%) |
| 20 to 24 Minutes | 6,175 (9.9%) | 6,832 (13.3%) |
| 25 to 29 Minutes | 3,705 (6.0%) | 3,128 (6.1%) |
| 30 to 34 Minutes | 9,215 (14.8%) | 8,722 (17.0%) |
| 35 to 39 Minutes | 2,771 (4.4%) | 2,336 (4.5%) |
| 40 to 44 Minutes | 3,794 (6.1%) | 2,581 (5.0%) |
| 45 to 59 Minutes | 10,098 (16.2%) | 5,267 (10.2%) |
| 60 to 89 Minutes | 8,091 (13.0%) | 4,420 (8.6%) |
| 90 or more Minutes | 2,530 (4.1%) | 1,410 (2.7%) |
Time of Departure to Work by Sex in Cherokee County
The most frequent times of departure to work in Cherokee County are 7:00 AM to 7:29 AM (10,668, 17.2%) for males and 7:00 AM to 7:29 AM (8,209, 16.0%) for females.
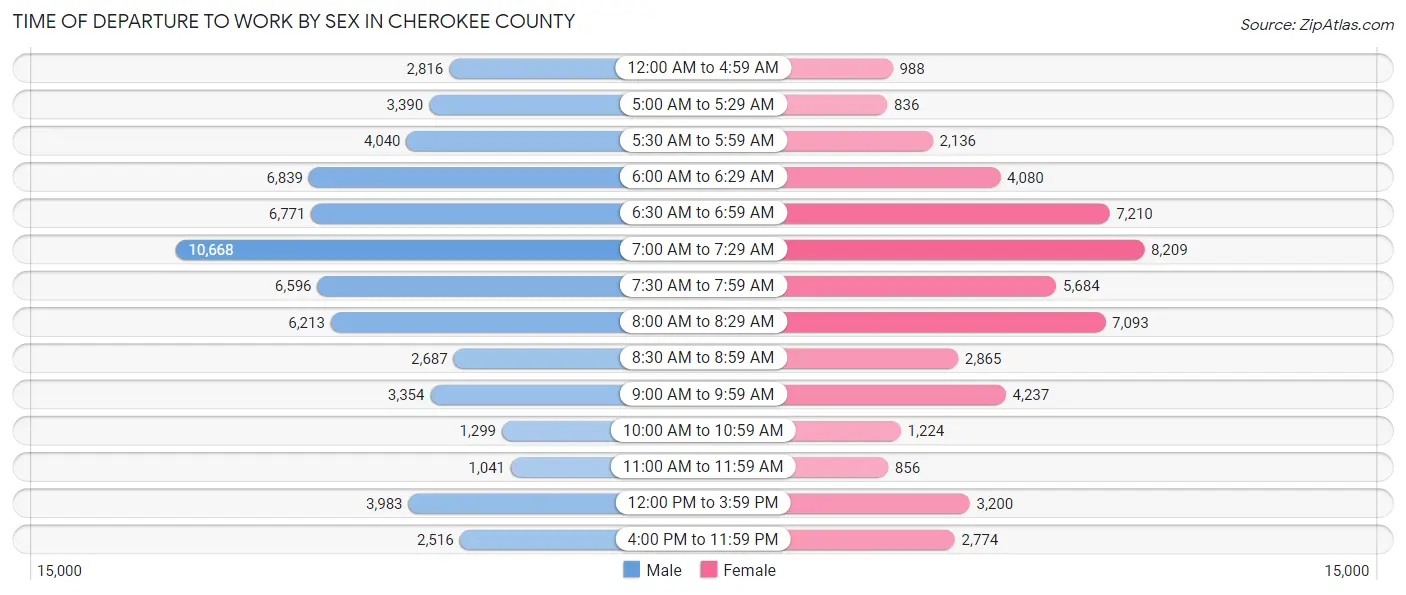
| Time of Departure | Male | Female |
| 12:00 AM to 4:59 AM | 2,816 (4.5%) | 988 (1.9%) |
| 5:00 AM to 5:29 AM | 3,390 (5.4%) | 836 (1.6%) |
| 5:30 AM to 5:59 AM | 4,040 (6.5%) | 2,136 (4.2%) |
| 6:00 AM to 6:29 AM | 6,839 (11.0%) | 4,080 (7.9%) |
| 6:30 AM to 6:59 AM | 6,771 (10.9%) | 7,210 (14.0%) |
| 7:00 AM to 7:29 AM | 10,668 (17.2%) | 8,209 (16.0%) |
| 7:30 AM to 7:59 AM | 6,596 (10.6%) | 5,684 (11.1%) |
| 8:00 AM to 8:29 AM | 6,213 (10.0%) | 7,093 (13.8%) |
| 8:30 AM to 8:59 AM | 2,687 (4.3%) | 2,865 (5.6%) |
| 9:00 AM to 9:59 AM | 3,354 (5.4%) | 4,237 (8.2%) |
| 10:00 AM to 10:59 AM | 1,299 (2.1%) | 1,224 (2.4%) |
| 11:00 AM to 11:59 AM | 1,041 (1.7%) | 856 (1.7%) |
| 12:00 PM to 3:59 PM | 3,983 (6.4%) | 3,200 (6.2%) |
| 4:00 PM to 11:59 PM | 2,516 (4.0%) | 2,774 (5.4%) |
| Total | 62,213 (100.0%) | 51,392 (100.0%) |
Housing Occupancy in Cherokee County
Occupancy by Ownership in Cherokee County
Of the total 97,023 dwellings in Cherokee County, owner-occupied units account for 75,148 (77.4%), while renter-occupied units make up 21,875 (22.6%).
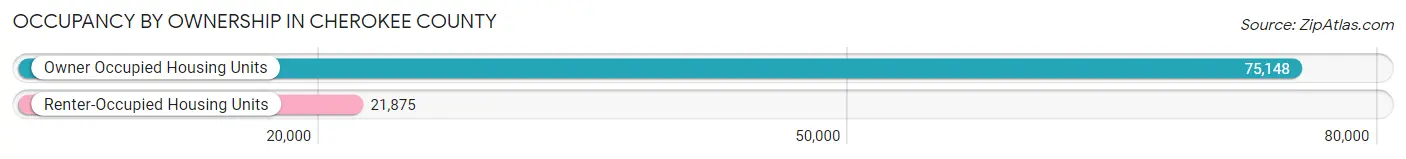
| Occupancy | # Housing Units | % Housing Units |
| Owner Occupied Housing Units | 75,148 | 77.4% |
| Renter-Occupied Housing Units | 21,875 | 22.6% |
| Total Occupied Housing Units | 97,023 | 100.0% |
Occupancy by Household Size in Cherokee County
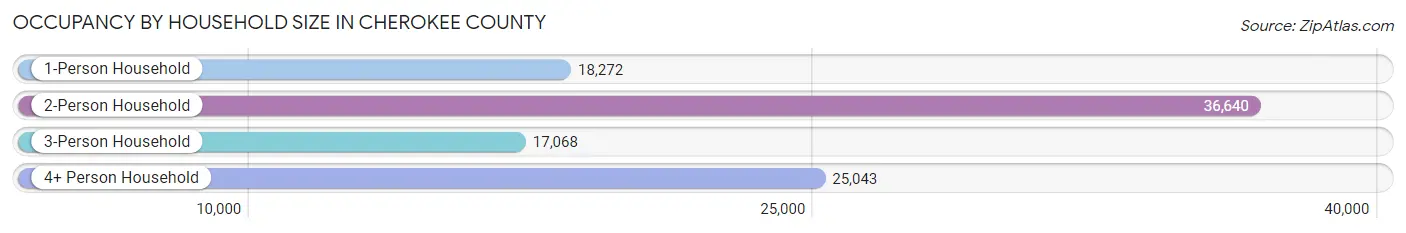
| Household Size | # Housing Units | % Housing Units |
| 1-Person Household | 18,272 | 18.8% |
| 2-Person Household | 36,640 | 37.8% |
| 3-Person Household | 17,068 | 17.6% |
| 4+ Person Household | 25,043 | 25.8% |
| Total Housing Units | 97,023 | 100.0% |
Occupancy by Ownership by Household Size in Cherokee County
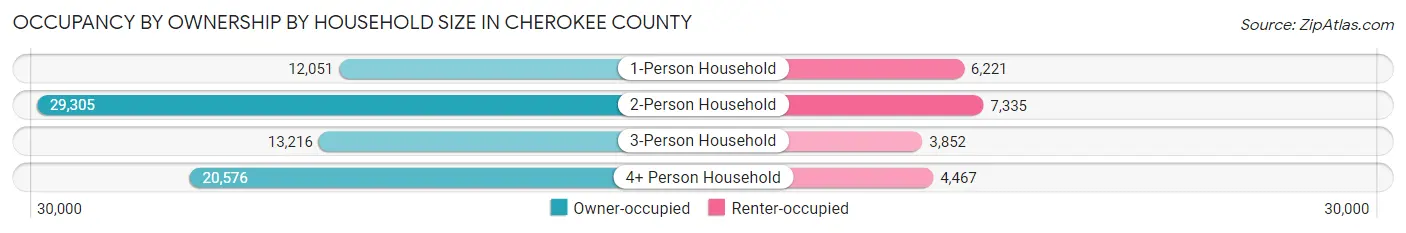
| Household Size | Owner-occupied | Renter-occupied |
| 1-Person Household | 12,051 (65.9%) | 6,221 (34.1%) |
| 2-Person Household | 29,305 (80.0%) | 7,335 (20.0%) |
| 3-Person Household | 13,216 (77.4%) | 3,852 (22.6%) |
| 4+ Person Household | 20,576 (82.2%) | 4,467 (17.8%) |
| Total Housing Units | 75,148 (77.4%) | 21,875 (22.6%) |
Occupancy by Educational Attainment in Cherokee County
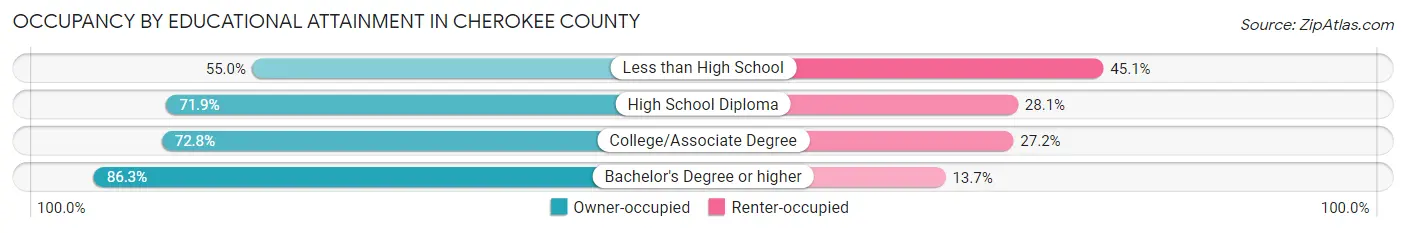
| Household Size | Owner-occupied | Renter-occupied |
| Less than High School | 3,189 (54.9%) | 2,614 (45.1%) |
| High School Diploma | 13,365 (71.9%) | 5,224 (28.1%) |
| College/Associate Degree | 21,935 (72.8%) | 8,200 (27.2%) |
| Bachelor's Degree or higher | 36,659 (86.3%) | 5,837 (13.7%) |
Occupancy by Age of Householder in Cherokee County
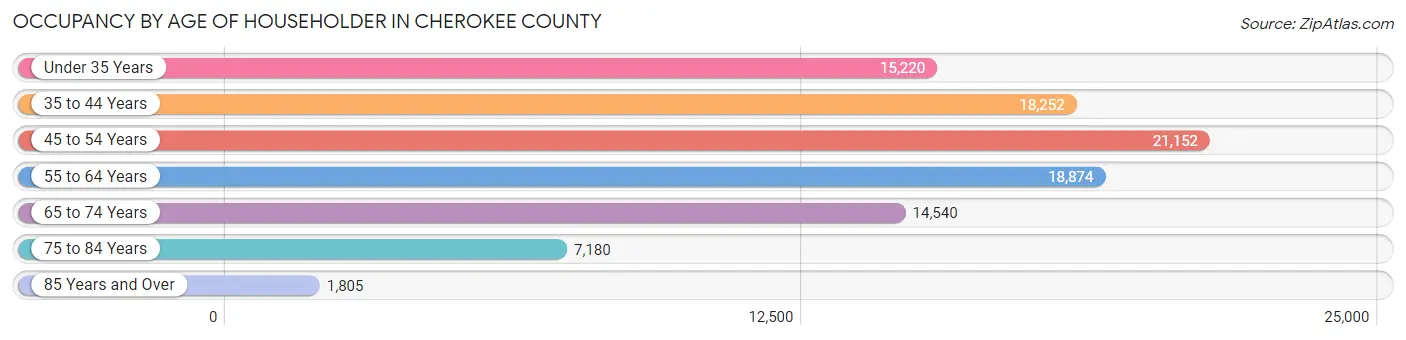
| Age Bracket | # Households | % Households |
| Under 35 Years | 15,220 | 15.7% |
| 35 to 44 Years | 18,252 | 18.8% |
| 45 to 54 Years | 21,152 | 21.8% |
| 55 to 64 Years | 18,874 | 19.5% |
| 65 to 74 Years | 14,540 | 15.0% |
| 75 to 84 Years | 7,180 | 7.4% |
| 85 Years and Over | 1,805 | 1.9% |
| Total | 97,023 | 100.0% |
Housing Finances in Cherokee County
Median Income by Occupancy in Cherokee County
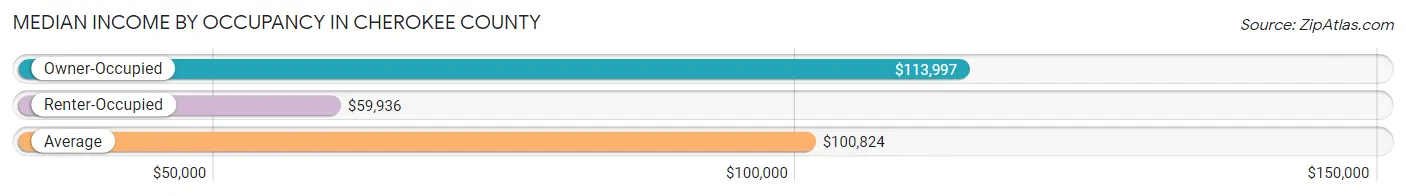
| Occupancy Type | # Households | Median Income |
| Owner-Occupied | 75,148 (77.4%) | $113,997 |
| Renter-Occupied | 21,875 (22.6%) | $59,936 |
| Average | 97,023 (100.0%) | $100,824 |
Occupancy by Householder Income Bracket in Cherokee County
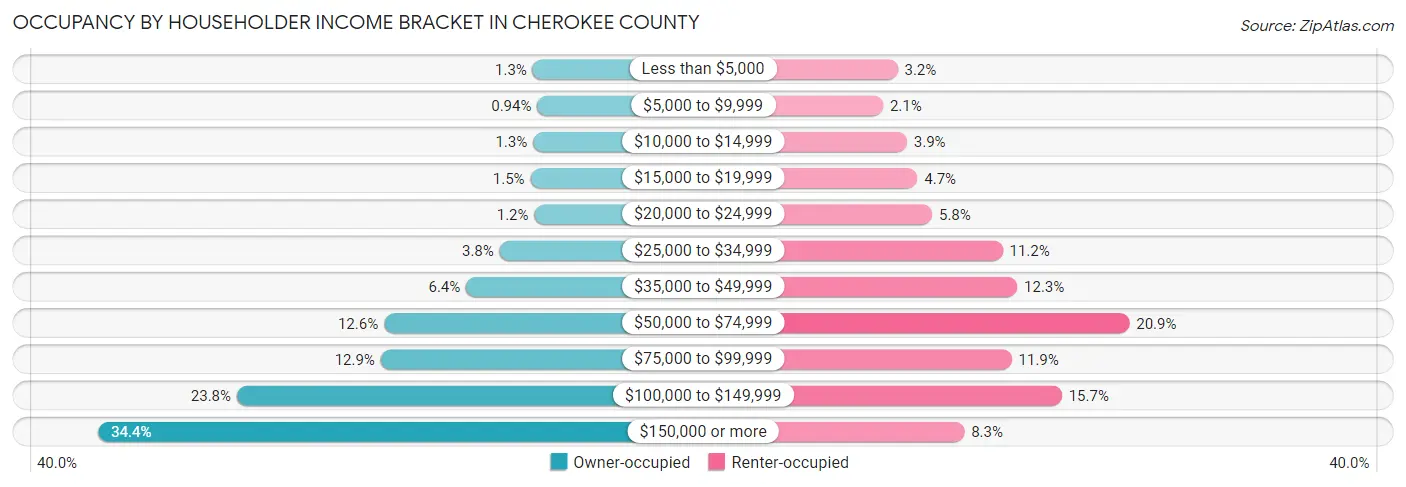
| Income Bracket | Owner-occupied | Renter-occupied |
| Less than $5,000 | 970 (1.3%) | 700 (3.2%) |
| $5,000 to $9,999 | 703 (0.9%) | 458 (2.1%) |
| $10,000 to $14,999 | 950 (1.3%) | 856 (3.9%) |
| $15,000 to $19,999 | 1,096 (1.5%) | 1,030 (4.7%) |
| $20,000 to $24,999 | 872 (1.2%) | 1,275 (5.8%) |
| $25,000 to $34,999 | 2,862 (3.8%) | 2,450 (11.2%) |
| $35,000 to $49,999 | 4,782 (6.4%) | 2,692 (12.3%) |
| $50,000 to $74,999 | 9,485 (12.6%) | 4,564 (20.9%) |
| $75,000 to $99,999 | 9,675 (12.9%) | 2,602 (11.9%) |
| $100,000 to $149,999 | 17,905 (23.8%) | 3,436 (15.7%) |
| $150,000 or more | 25,848 (34.4%) | 1,812 (8.3%) |
| Total | 75,148 (100.0%) | 21,875 (100.0%) |
Monthly Housing Cost Tiers in Cherokee County
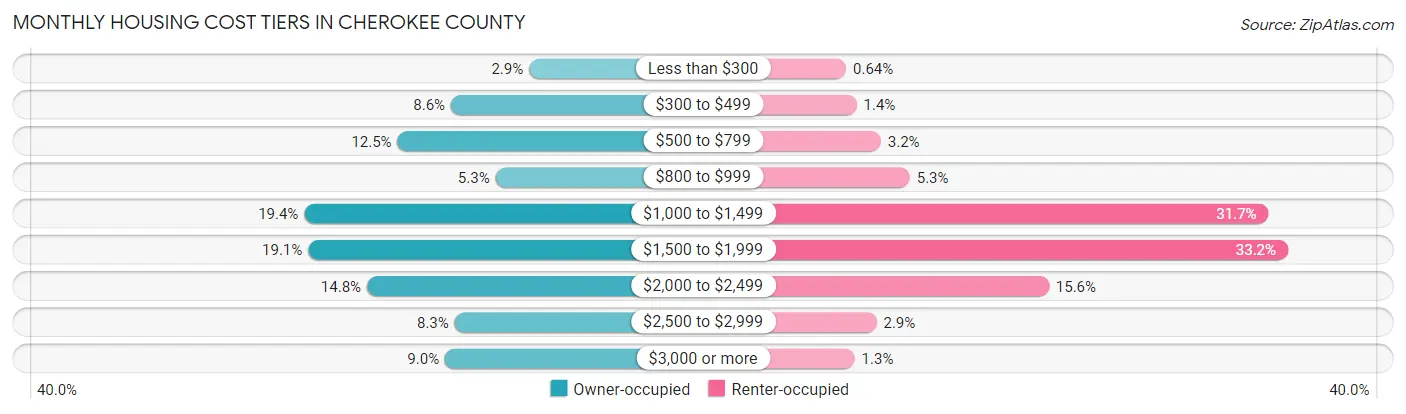
| Monthly Cost | Owner-occupied | Renter-occupied |
| Less than $300 | 2,142 (2.9%) | 141 (0.6%) |
| $300 to $499 | 6,462 (8.6%) | 308 (1.4%) |
| $500 to $799 | 9,426 (12.5%) | 701 (3.2%) |
| $800 to $999 | 3,996 (5.3%) | 1,167 (5.3%) |
| $1,000 to $1,499 | 14,583 (19.4%) | 6,944 (31.7%) |
| $1,500 to $1,999 | 14,372 (19.1%) | 7,257 (33.2%) |
| $2,000 to $2,499 | 11,117 (14.8%) | 3,405 (15.6%) |
| $2,500 to $2,999 | 6,260 (8.3%) | 629 (2.9%) |
| $3,000 or more | 6,790 (9.0%) | 278 (1.3%) |
| Total | 75,148 (100.0%) | 21,875 (100.0%) |
Physical Housing Characteristics in Cherokee County
Housing Structures in Cherokee County
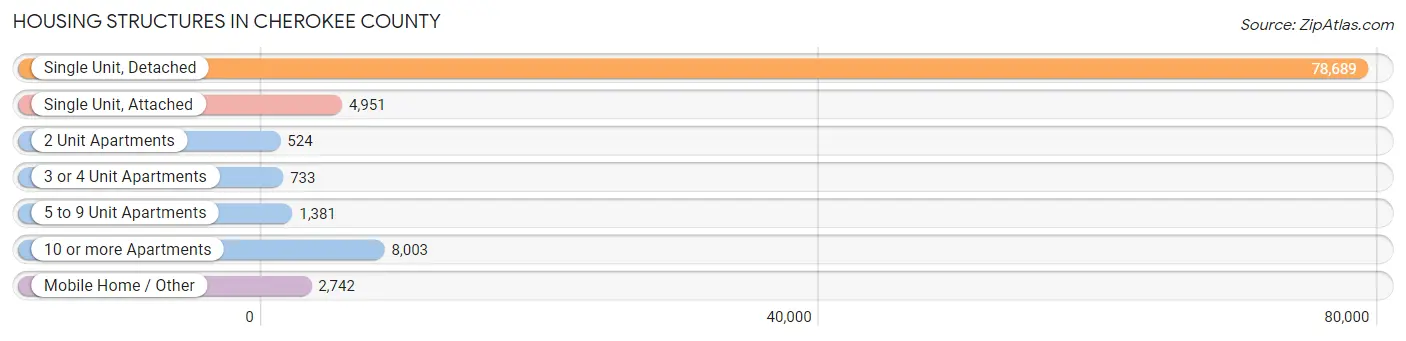
| Structure Type | # Housing Units | % Housing Units |
| Single Unit, Detached | 78,689 | 81.1% |
| Single Unit, Attached | 4,951 | 5.1% |
| 2 Unit Apartments | 524 | 0.5% |
| 3 or 4 Unit Apartments | 733 | 0.8% |
| 5 to 9 Unit Apartments | 1,381 | 1.4% |
| 10 or more Apartments | 8,003 | 8.3% |
| Mobile Home / Other | 2,742 | 2.8% |
| Total | 97,023 | 100.0% |
Housing Structures by Occupancy in Cherokee County
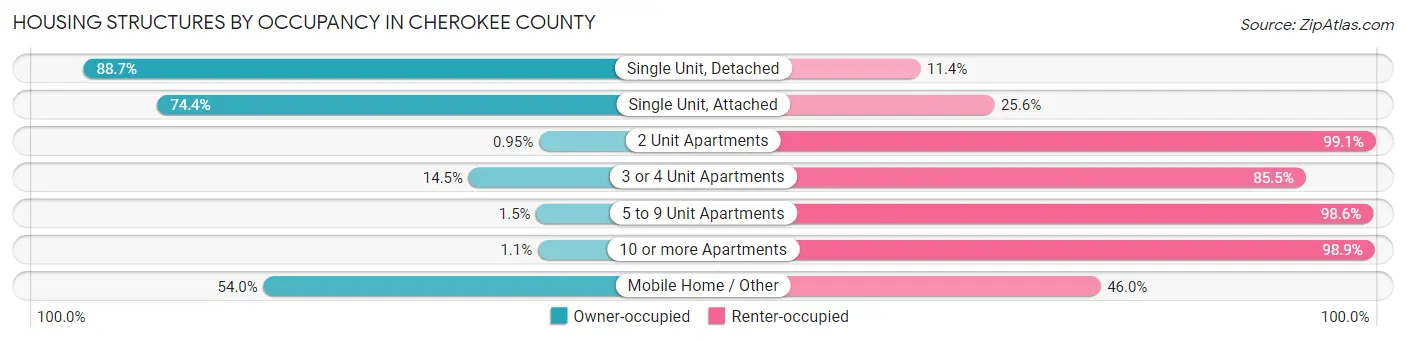
| Structure Type | Owner-occupied | Renter-occupied |
| Single Unit, Detached | 69,761 (88.6%) | 8,928 (11.4%) |
| Single Unit, Attached | 3,685 (74.4%) | 1,266 (25.6%) |
| 2 Unit Apartments | 5 (0.9%) | 519 (99.1%) |
| 3 or 4 Unit Apartments | 106 (14.5%) | 627 (85.5%) |
| 5 to 9 Unit Apartments | 20 (1.5%) | 1,361 (98.6%) |
| 10 or more Apartments | 91 (1.1%) | 7,912 (98.9%) |
| Mobile Home / Other | 1,480 (54.0%) | 1,262 (46.0%) |
| Total | 75,148 (77.4%) | 21,875 (22.6%) |
Housing Structures by Number of Rooms in Cherokee County
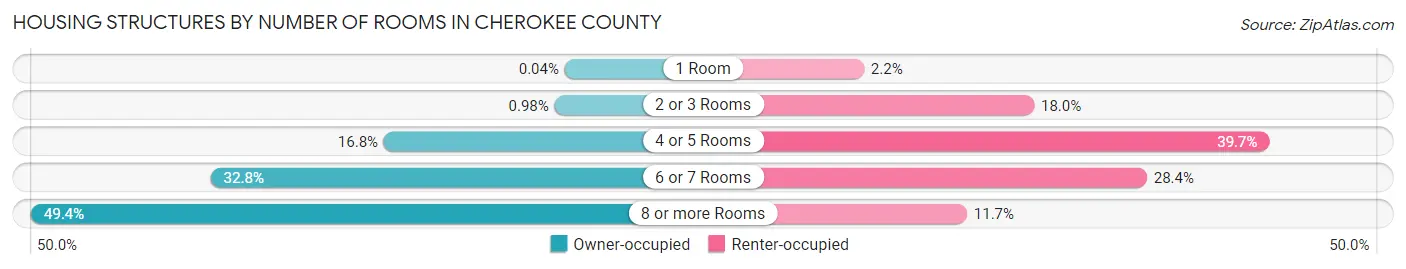
| Number of Rooms | Owner-occupied | Renter-occupied |
| 1 Room | 30 (0.0%) | 485 (2.2%) |
| 2 or 3 Rooms | 740 (1.0%) | 3,927 (17.9%) |
| 4 or 5 Rooms | 12,602 (16.8%) | 8,686 (39.7%) |
| 6 or 7 Rooms | 24,640 (32.8%) | 6,208 (28.4%) |
| 8 or more Rooms | 37,136 (49.4%) | 2,569 (11.7%) |
| Total | 75,148 (100.0%) | 21,875 (100.0%) |
Housing Structure by Heating Type in Cherokee County
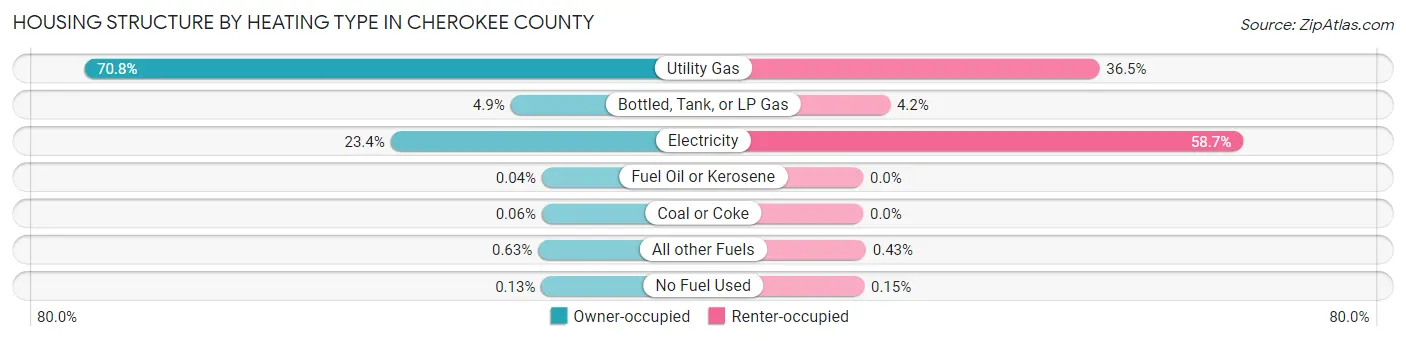
| Heating Type | Owner-occupied | Renter-occupied |
| Utility Gas | 53,216 (70.8%) | 7,991 (36.5%) |
| Bottled, Tank, or LP Gas | 3,676 (4.9%) | 910 (4.2%) |
| Electricity | 17,607 (23.4%) | 12,847 (58.7%) |
| Fuel Oil or Kerosene | 27 (0.0%) | 0 (0.0%) |
| Coal or Coke | 47 (0.1%) | 0 (0.0%) |
| All other Fuels | 476 (0.6%) | 94 (0.4%) |
| No Fuel Used | 99 (0.1%) | 33 (0.2%) |
| Total | 75,148 (100.0%) | 21,875 (100.0%) |
Household Vehicle Usage in Cherokee County
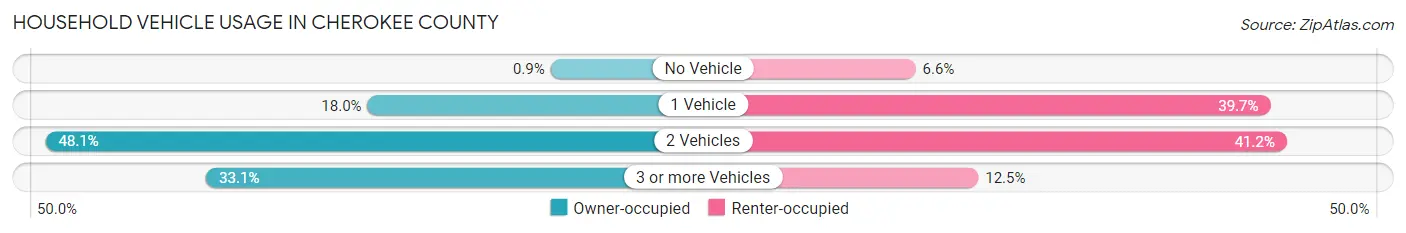
| Vehicles per Household | Owner-occupied | Renter-occupied |
| No Vehicle | 679 (0.9%) | 1,443 (6.6%) |
| 1 Vehicle | 13,528 (18.0%) | 8,687 (39.7%) |
| 2 Vehicles | 36,108 (48.0%) | 9,022 (41.2%) |
| 3 or more Vehicles | 24,833 (33.1%) | 2,723 (12.4%) |
| Total | 75,148 (100.0%) | 21,875 (100.0%) |
Real Estate & Mortgages in Cherokee County
Real Estate and Mortgage Overview in Cherokee County
| Characteristic | Without Mortgage | With Mortgage |
| Housing Units | 20,071 | 55,077 |
| Median Property Value | $340,700 | $363,900 |
| Median Household Income | $85,892 | $21,293 |
| Monthly Housing Costs | $544 | $6,757 |
| Real Estate Taxes | $1,653 | $1,061 |
Property Value by Mortgage Status in Cherokee County
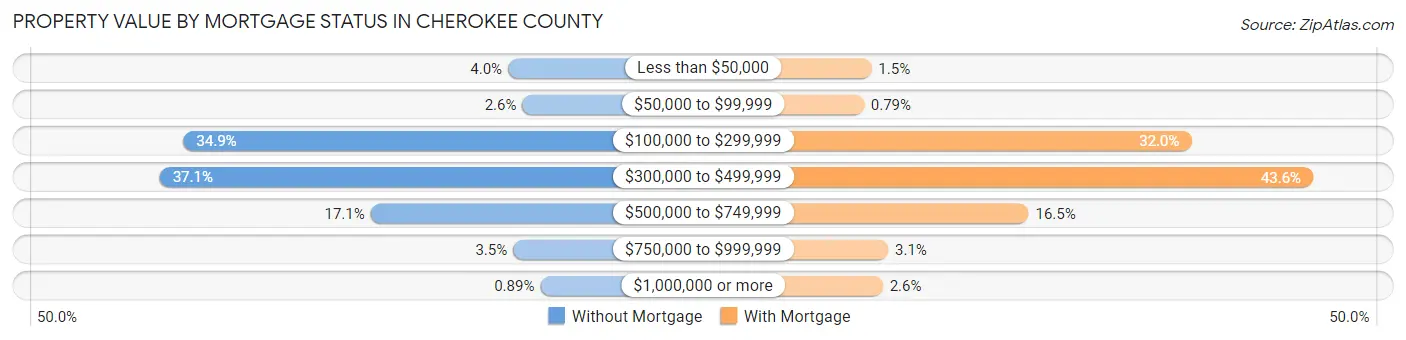
| Property Value | Without Mortgage | With Mortgage |
| Less than $50,000 | 797 (4.0%) | 833 (1.5%) |
| $50,000 to $99,999 | 521 (2.6%) | 437 (0.8%) |
| $100,000 to $299,999 | 6,999 (34.9%) | 17,607 (32.0%) |
| $300,000 to $499,999 | 7,453 (37.1%) | 23,990 (43.6%) |
| $500,000 to $749,999 | 3,423 (17.1%) | 9,075 (16.5%) |
| $750,000 to $999,999 | 699 (3.5%) | 1,710 (3.1%) |
| $1,000,000 or more | 179 (0.9%) | 1,425 (2.6%) |
| Total | 20,071 (100.0%) | 55,077 (100.0%) |
Household Income by Mortgage Status in Cherokee County
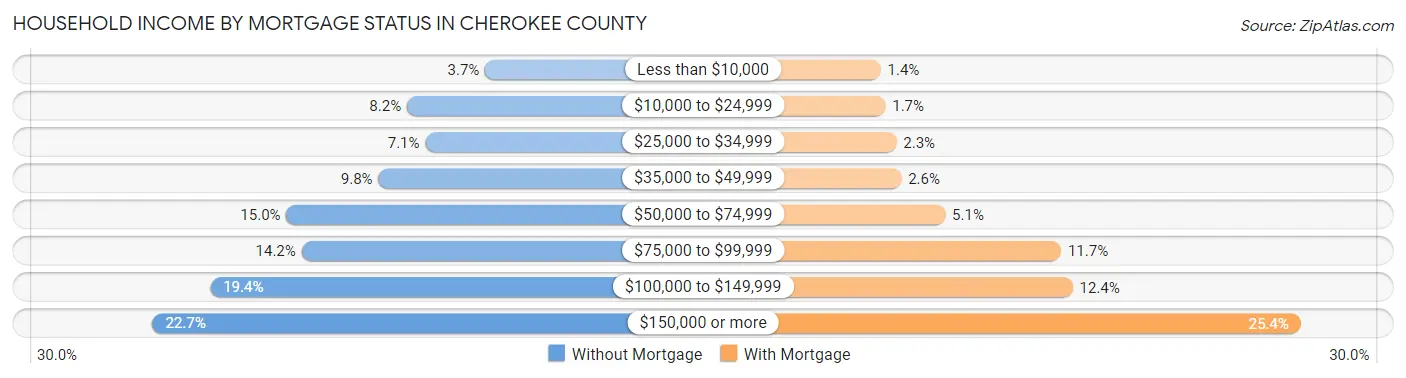
| Household Income | Without Mortgage | With Mortgage |
| Less than $10,000 | 739 (3.7%) | 789 (1.4%) |
| $10,000 to $24,999 | 1,636 (8.2%) | 934 (1.7%) |
| $25,000 to $34,999 | 1,425 (7.1%) | 1,282 (2.3%) |
| $35,000 to $49,999 | 1,962 (9.8%) | 1,437 (2.6%) |
| $50,000 to $74,999 | 3,018 (15.0%) | 2,820 (5.1%) |
| $75,000 to $99,999 | 2,845 (14.2%) | 6,467 (11.7%) |
| $100,000 to $149,999 | 3,891 (19.4%) | 6,830 (12.4%) |
| $150,000 or more | 4,555 (22.7%) | 14,014 (25.4%) |
| Total | 20,071 (100.0%) | 55,077 (100.0%) |
Property Value to Household Income Ratio in Cherokee County
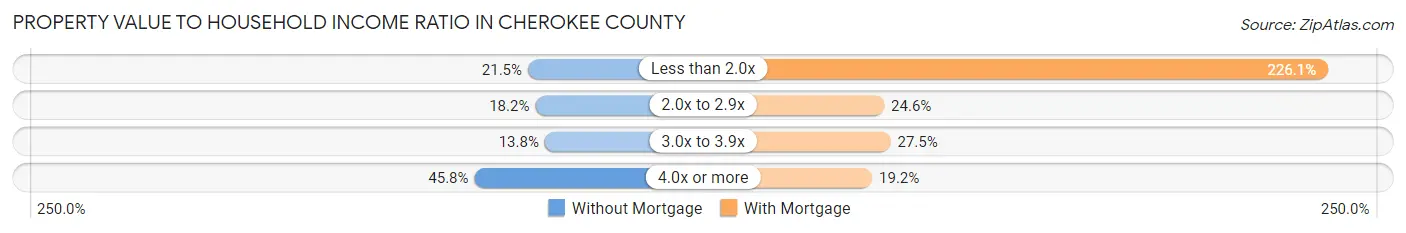
| Value-to-Income Ratio | Without Mortgage | With Mortgage |
| Less than 2.0x | 4,318 (21.5%) | 124,545 (226.1%) |
| 2.0x to 2.9x | 3,644 (18.2%) | 13,560 (24.6%) |
| 3.0x to 3.9x | 2,777 (13.8%) | 15,152 (27.5%) |
| 4.0x or more | 9,190 (45.8%) | 10,553 (19.2%) |
| Total | 20,071 (100.0%) | 55,077 (100.0%) |
Real Estate Taxes by Mortgage Status in Cherokee County
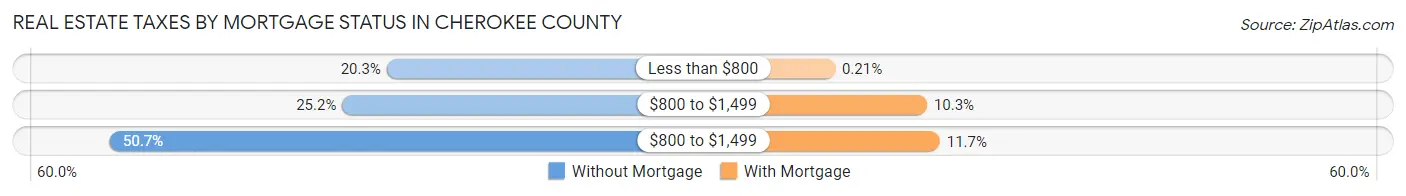
| Property Taxes | Without Mortgage | With Mortgage |
| Less than $800 | 4,078 (20.3%) | 118 (0.2%) |
| $800 to $1,499 | 5,056 (25.2%) | 5,666 (10.3%) |
| $800 to $1,499 | 10,165 (50.6%) | 6,442 (11.7%) |
| Total | 20,071 (100.0%) | 55,077 (100.0%) |
Health & Disability in Cherokee County
Health Insurance Coverage by Age in Cherokee County
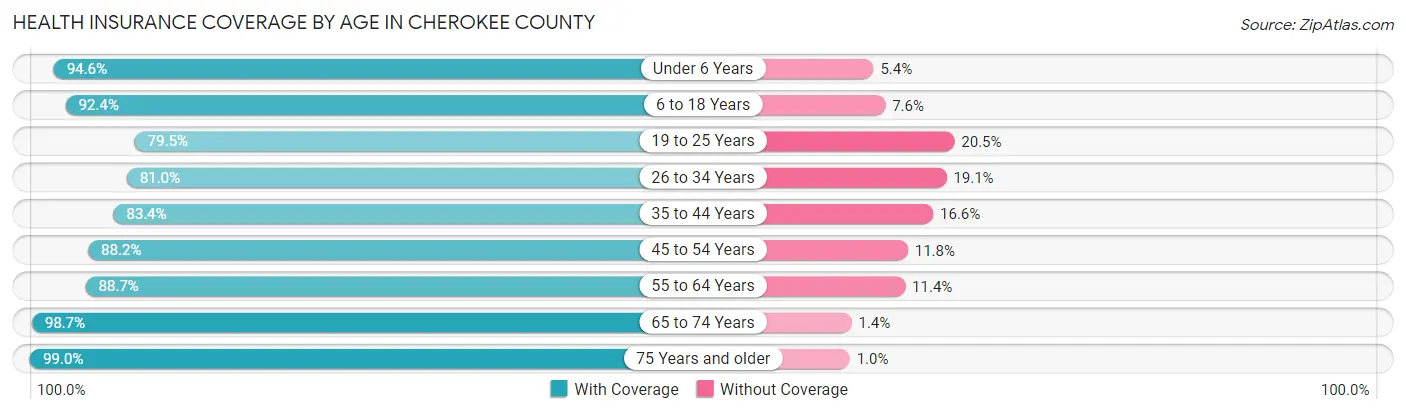
| Age Bracket | With Coverage | Without Coverage |
| Under 6 Years | 16,941 (94.6%) | 975 (5.4%) |
| 6 to 18 Years | 44,870 (92.4%) | 3,709 (7.6%) |
| 19 to 25 Years | 17,790 (79.5%) | 4,596 (20.5%) |
| 26 to 34 Years | 22,565 (80.9%) | 5,310 (19.1%) |
| 35 to 44 Years | 30,593 (83.4%) | 6,073 (16.6%) |
| 45 to 54 Years | 34,570 (88.2%) | 4,645 (11.8%) |
| 55 to 64 Years | 30,697 (88.6%) | 3,932 (11.4%) |
| 65 to 74 Years | 25,100 (98.7%) | 343 (1.3%) |
| 75 Years and older | 14,390 (99.0%) | 147 (1.0%) |
| Total | 237,516 (88.9%) | 29,730 (11.1%) |
Health Insurance Coverage by Citizenship Status in Cherokee County
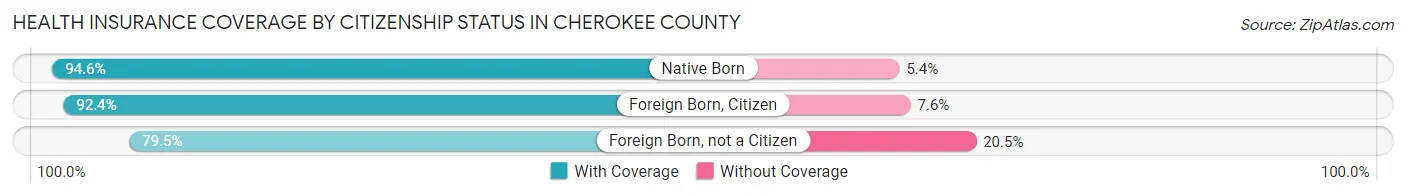
| Citizenship Status | With Coverage | Without Coverage |
| Native Born | 16,941 (94.6%) | 975 (5.4%) |
| Foreign Born, Citizen | 44,870 (92.4%) | 3,709 (7.6%) |
| Foreign Born, not a Citizen | 17,790 (79.5%) | 4,596 (20.5%) |
Health Insurance Coverage by Household Income in Cherokee County
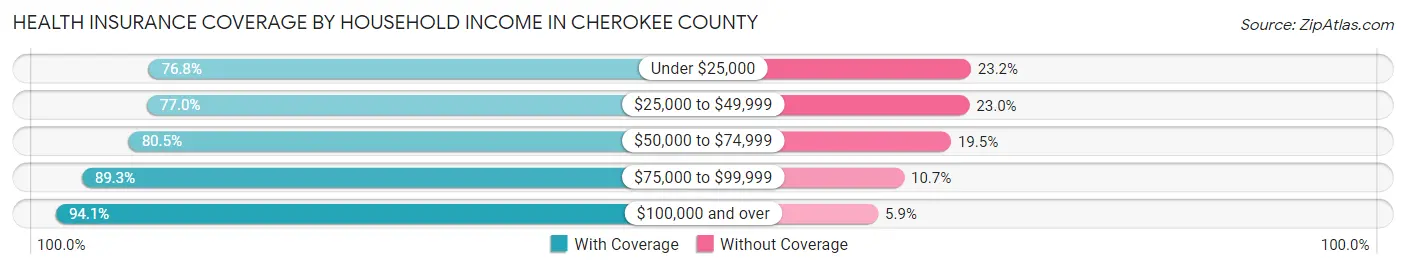
| Household Income | With Coverage | Without Coverage |
| Under $25,000 | 13,410 (76.8%) | 4,059 (23.2%) |
| $25,000 to $49,999 | 21,043 (77.0%) | 6,275 (23.0%) |
| $50,000 to $74,999 | 27,627 (80.5%) | 6,699 (19.5%) |
| $75,000 to $99,999 | 30,124 (89.3%) | 3,617 (10.7%) |
| $100,000 and over | 144,698 (94.1%) | 9,036 (5.9%) |
Public vs Private Health Insurance Coverage by Age in Cherokee County
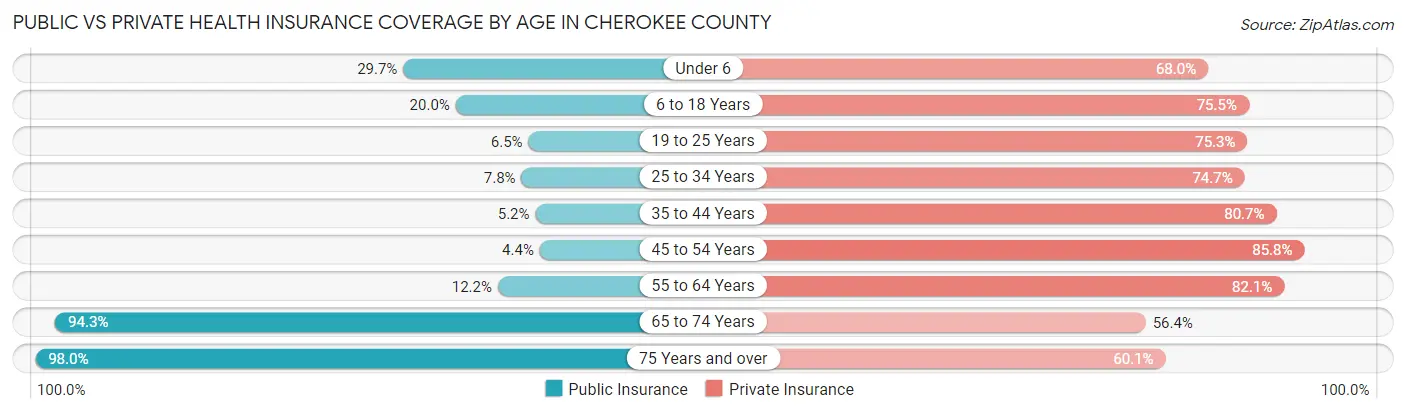
| Age Bracket | Public Insurance | Private Insurance |
| Under 6 | 5,326 (29.7%) | 12,176 (68.0%) |
| 6 to 18 Years | 9,713 (20.0%) | 36,690 (75.5%) |
| 19 to 25 Years | 1,451 (6.5%) | 16,850 (75.3%) |
| 25 to 34 Years | 2,168 (7.8%) | 20,835 (74.7%) |
| 35 to 44 Years | 1,902 (5.2%) | 29,571 (80.6%) |
| 45 to 54 Years | 1,716 (4.4%) | 33,661 (85.8%) |
| 55 to 64 Years | 4,215 (12.2%) | 28,431 (82.1%) |
| 65 to 74 Years | 23,997 (94.3%) | 14,352 (56.4%) |
| 75 Years and over | 14,249 (98.0%) | 8,732 (60.1%) |
| Total | 64,737 (24.2%) | 201,298 (75.3%) |
Disability Status by Sex by Age in Cherokee County
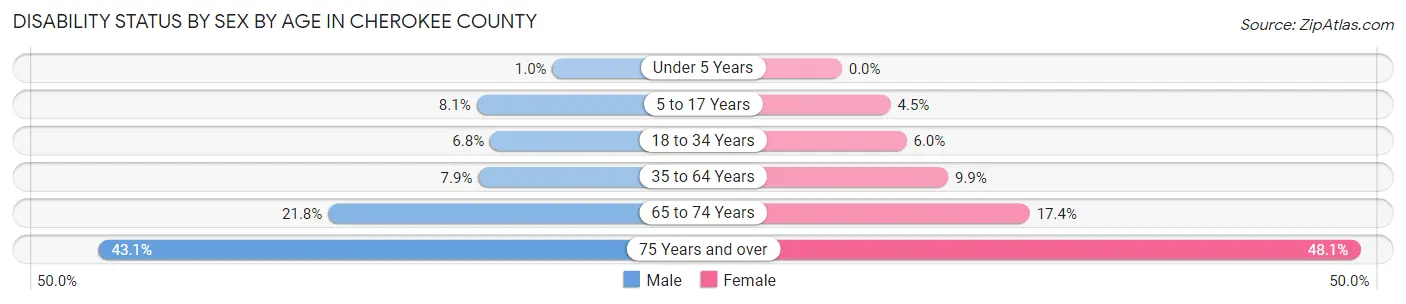
| Age Bracket | Male | Female |
| Under 5 Years | 77 (1.0%) | 0 (0.0%) |
| 5 to 17 Years | 1,984 (8.1%) | 1,068 (4.5%) |
| 18 to 34 Years | 1,826 (6.8%) | 1,618 (6.0%) |
| 35 to 64 Years | 4,349 (7.9%) | 5,468 (9.9%) |
| 65 to 74 Years | 2,556 (21.8%) | 2,396 (17.4%) |
| 75 Years and over | 2,736 (43.1%) | 3,941 (48.1%) |
Disability Class by Sex by Age in Cherokee County
Disability Class: Hearing Difficulty
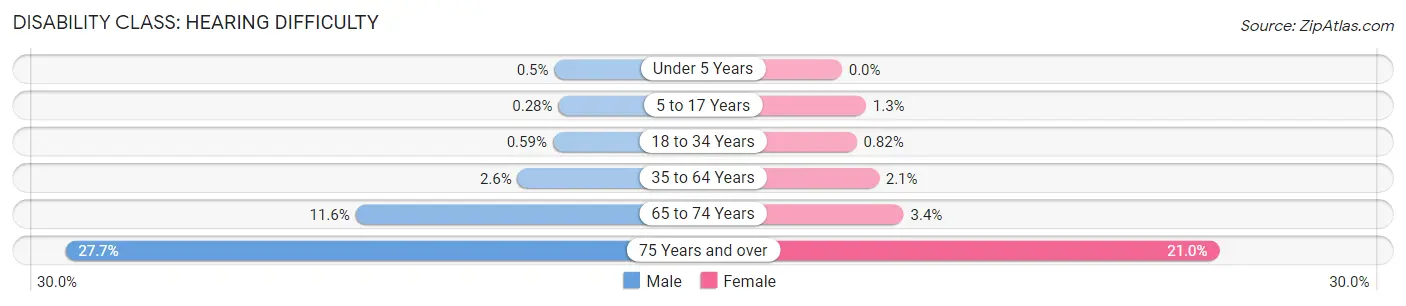
| Age Bracket | Male | Female |
| Under 5 Years | 38 (0.5%) | 0 (0.0%) |
| 5 to 17 Years | 69 (0.3%) | 315 (1.3%) |
| 18 to 34 Years | 159 (0.6%) | 220 (0.8%) |
| 35 to 64 Years | 1,402 (2.5%) | 1,142 (2.1%) |
| 65 to 74 Years | 1,354 (11.6%) | 473 (3.4%) |
| 75 Years and over | 1,759 (27.7%) | 1,722 (21.0%) |
Disability Class: Vision Difficulty
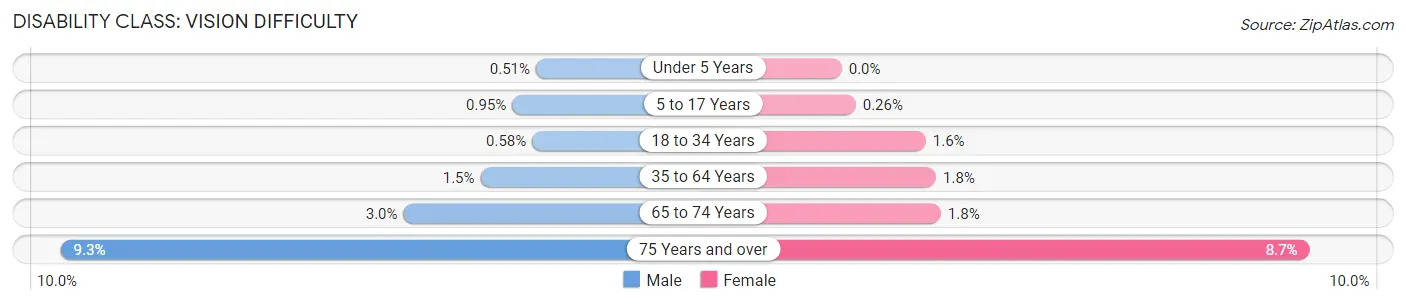
| Age Bracket | Male | Female |
| Under 5 Years | 39 (0.5%) | 0 (0.0%) |
| 5 to 17 Years | 235 (0.9%) | 61 (0.3%) |
| 18 to 34 Years | 155 (0.6%) | 420 (1.6%) |
| 35 to 64 Years | 850 (1.5%) | 970 (1.8%) |
| 65 to 74 Years | 348 (3.0%) | 253 (1.8%) |
| 75 Years and over | 592 (9.3%) | 711 (8.7%) |
Disability Class: Cognitive Difficulty
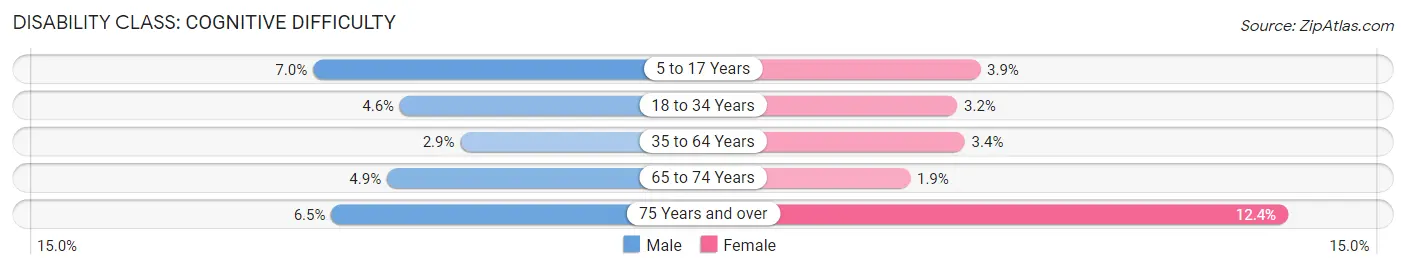
| Age Bracket | Male | Female |
| 5 to 17 Years | 1,717 (7.0%) | 906 (3.8%) |
| 18 to 34 Years | 1,220 (4.5%) | 864 (3.2%) |
| 35 to 64 Years | 1,580 (2.9%) | 1,896 (3.4%) |
| 65 to 74 Years | 575 (4.9%) | 261 (1.9%) |
| 75 Years and over | 410 (6.5%) | 1,018 (12.4%) |
Disability Class: Ambulatory Difficulty
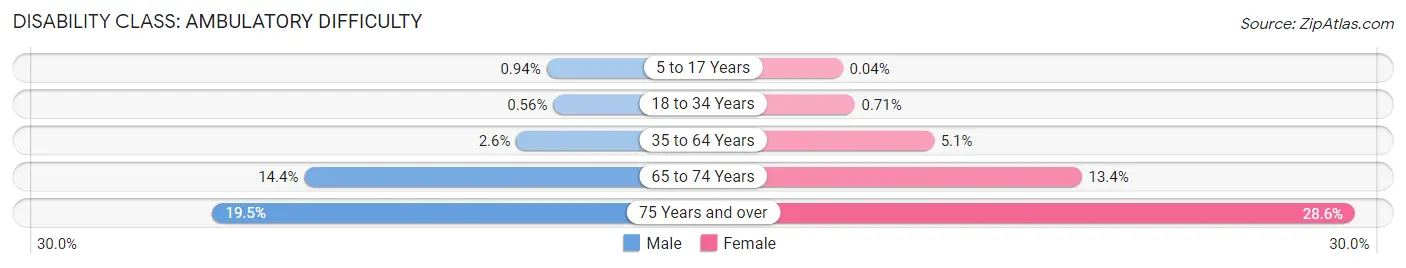
| Age Bracket | Male | Female |
| 5 to 17 Years | 232 (0.9%) | 10 (0.0%) |
| 18 to 34 Years | 150 (0.6%) | 191 (0.7%) |
| 35 to 64 Years | 1,443 (2.6%) | 2,837 (5.1%) |
| 65 to 74 Years | 1,689 (14.4%) | 1,834 (13.4%) |
| 75 Years and over | 1,239 (19.5%) | 2,341 (28.6%) |
Disability Class: Self-Care Difficulty
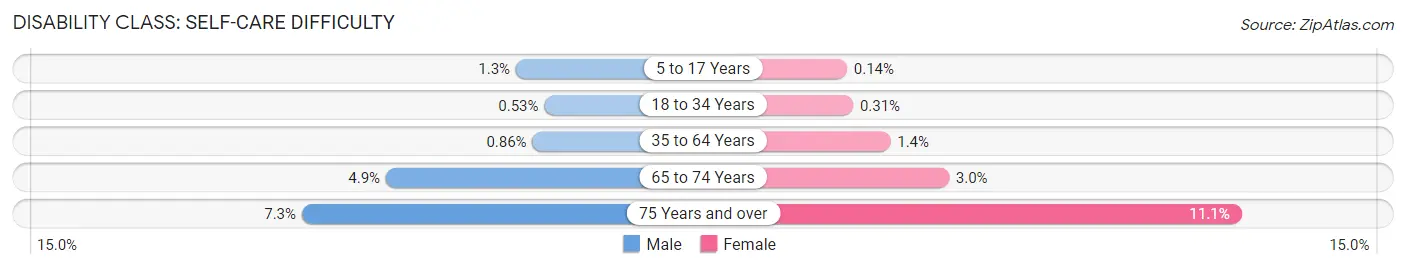
| Age Bracket | Male | Female |
| 5 to 17 Years | 324 (1.3%) | 34 (0.1%) |
| 18 to 34 Years | 141 (0.5%) | 84 (0.3%) |
| 35 to 64 Years | 471 (0.9%) | 749 (1.3%) |
| 65 to 74 Years | 578 (4.9%) | 409 (3.0%) |
| 75 Years and over | 462 (7.3%) | 912 (11.1%) |
Technology Access in Cherokee County
Computing Device Access in Cherokee County
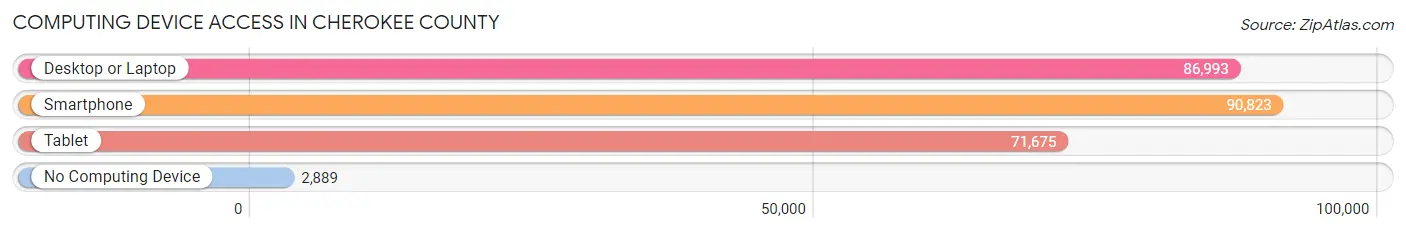
| Device Type | # Households | % Households |
| Desktop or Laptop | 86,993 | 89.7% |
| Smartphone | 90,823 | 93.6% |
| Tablet | 71,675 | 73.9% |
| No Computing Device | 2,889 | 3.0% |
| Total | 97,023 | 100.0% |
Internet Access in Cherokee County
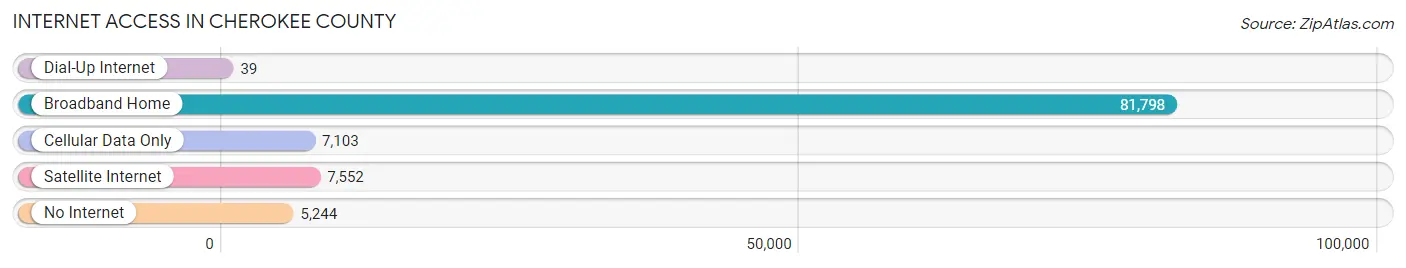
| Internet Type | # Households | % Households |
| Dial-Up Internet | 39 | 0.0% |
| Broadband Home | 81,798 | 84.3% |
| Cellular Data Only | 7,103 | 7.3% |
| Satellite Internet | 7,552 | 7.8% |
| No Internet | 5,244 | 5.4% |
| Total | 97,023 | 100.0% |
Cherokee County Summary
Cherokee County, Georgia is located in the north-central part of the state, approximately 40 miles north of Atlanta. It is bordered by Forsyth, Pickens, and Fulton counties to the north, Cobb and Bartow counties to the east, and Paulding and Douglas counties to the west. The county seat is Canton, and the largest city is Woodstock.
History
Cherokee County was created in 1831 from parts of the Cherokee, Cobb, and Forsyth counties. It was named after the Cherokee Indians who had inhabited the area for centuries prior to European settlement. The county was originally part of the Cherokee Nation, which was forcibly removed from the area in the 1830s as part of the Indian Removal Act.
The county was home to several prominent figures in the early days of the state, including Governor Joseph E. Brown and Senator Benjamin Harvey Hill. The county was also the site of the first gold rush in the United States, which began in 1829.
Geography
Cherokee County is located in the foothills of the Blue Ridge Mountains. The county is mostly mountainous, with elevations ranging from 800 to 1,800 feet above sea level. The county is drained by the Etowah and Oostanaula rivers, which flow into the Coosa River.
The county is home to several state parks, including Red Top Mountain State Park, Amicalola Falls State Park, and Vogel State Park. The county also contains portions of the Chattahoochee National Forest.
Economy
Cherokee County has a diverse economy, with a mix of manufacturing, retail, and service industries. The county is home to several large employers, including the Cherokee County School District, Northside Hospital, and WellStar Health System.
The county is also home to several major shopping centers, including Towne Lake Hills, Woodstock Square, and The Outlet Shoppes at Atlanta.
Demographics
As of the 2010 census, Cherokee County had a population of 214,346. The racial makeup of the county was 79.2% White, 11.3% African American, 0.5% Native American, 3.3% Asian, 0.1% Pacific Islander, and 4.6% from other races. Hispanic or Latino of any race were 8.7% of the population.
The median household income in the county was $63,902, and the median family income was $76,845. The per capita income was $30,945. About 8.3% of the population was below the poverty line.
Cherokee County is home to a large number of retirees, with nearly 20% of the population over the age of 65. The county is also home to a large number of young families, with nearly 30% of the population under the age of 18.
Common Questions
What is the Total Population of Cherokee County?
Total Population of Cherokee County is 268,567.
What is the Total Male Population of Cherokee County?
Total Male Population of Cherokee County is 132,996.
What is the Total Female Population of Cherokee County?
Total Female Population of Cherokee County is 135,571.
What is the Ratio of Males per 100 Females in Cherokee County?
There are 98.10 Males per 100 Females in Cherokee County.
What is the Ratio of Females per 100 Males in Cherokee County?
There are 101.94 Females per 100 Males in Cherokee County.
What is the Median Population Age in Cherokee County?
Median Population Age in Cherokee County is 39.7 Years.
What is the Average Family Size in Cherokee County
Average Family Size in Cherokee County is 3.2 People.
What is the Average Household Size in Cherokee County
Average Household Size in Cherokee County is 2.8 People.
What is Per Capita Income in Cherokee County?
Per Capita income in Cherokee County is $45,334.
What is the Median Family Income in Cherokee County?
Median Family Income in Cherokee County is $113,750.
What is the Median Household income in Cherokee County?
Median Household Income in Cherokee County is $100,824.
What is Income or Wage Gap in Cherokee County?
Income or Wage Gap in Cherokee County is 32.9%.
Women in Cherokee County earn 67.1 cents for every dollar earned by a man.
What is Family Income Deficit in Cherokee County?
Family Income Deficit in Cherokee County is $11,128.
Families that are below poverty line in Cherokee County earn $11,128 less on average than the poverty threshold level.
What is Inequality or Gini Index in Cherokee County?
Inequality or Gini Index in Cherokee County is 0.41.
How Large is the Labor Force in Cherokee County?
There are 146,724 People in the Labor Forcein in Cherokee County.
What is the Percentage of People in the Labor Force in Cherokee County?
68.9% of People are in the Labor Force in Cherokee County.
What is the Unemployment Rate in Cherokee County?
Unemployment Rate in Cherokee County is 3.7%.