Cities with the Highest Percentage of Immigrants from St. Vincent and the Grenadines in the United States
RELATED REPORTS & OPTIONS
St. Vincent and the Grenadines
United States
Compare Cities
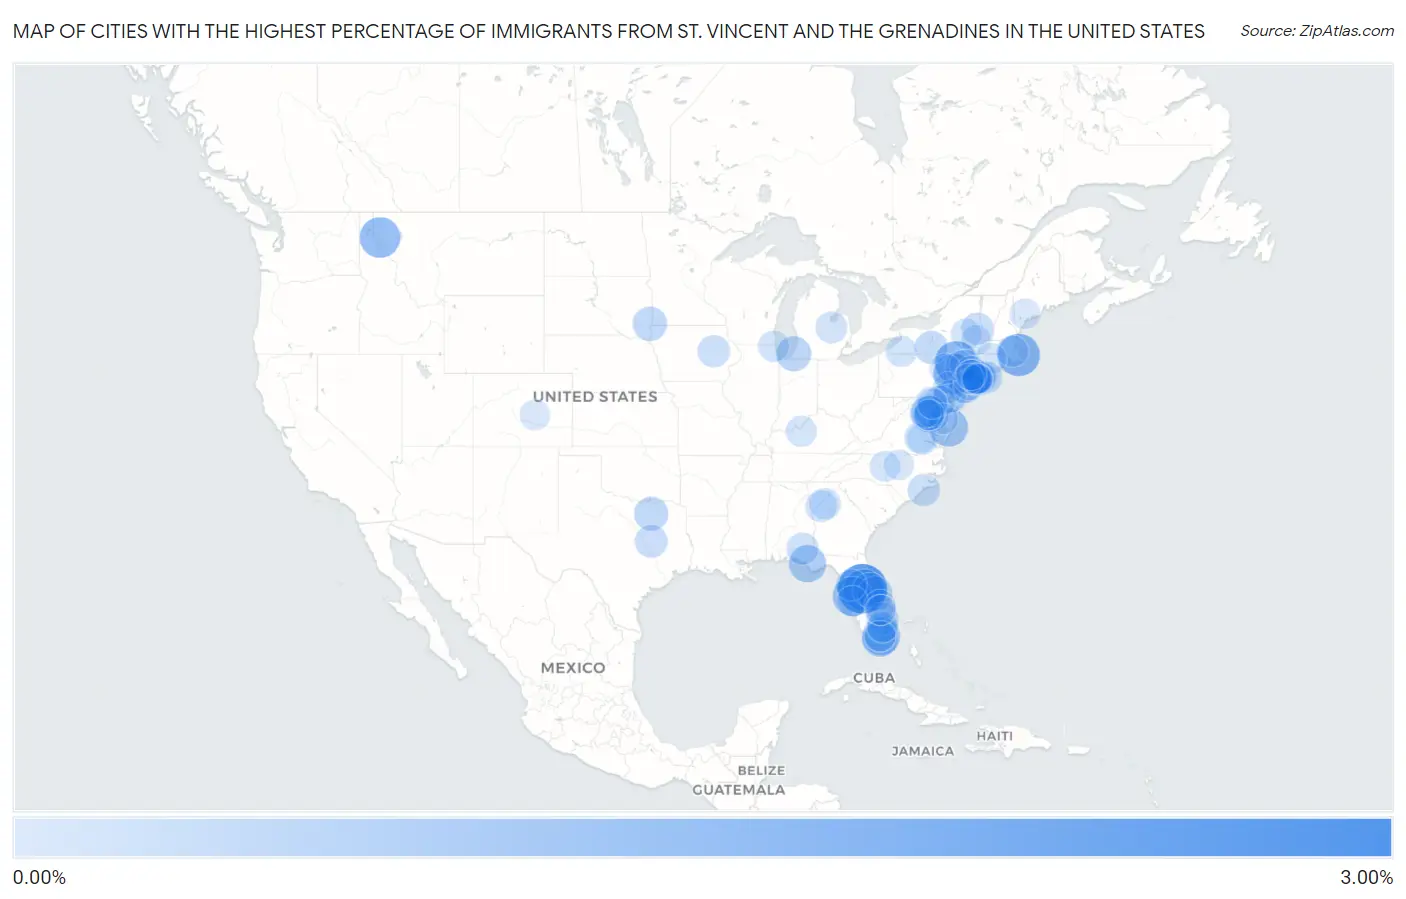
Map of Cities with the Highest Percentage of Immigrants from St. Vincent and the Grenadines in the United States
0.00%
3.00%
Cities with the Highest Percentage of Immigrants from St. Vincent and the Grenadines in the United States
| City | St. Vincent and the Grenadines | vs State | vs National | |
| 1. | East Petersburg Borough | 2.72% | 0.0053%(+2.72)#61 | 0.0067%(+2.72)#888 |
| 2. | Montverde | 2.47% | 0.012%(+2.46)#293 | 0.0067%(+2.46)#889 |
| 3. | Larksville Borough | 1.72% | 0.0053%(+1.72)#62 | 0.0067%(+1.72)#890 |
| 4. | Narrowsburg | 1.59% | 0.068%(+1.52)#215 | 0.0067%(+1.58)#1,442 |
| 5. | North Plymouth | 1.56% | 0.0051%(+1.56)#46 | 0.0067%(+1.56)#1,443 |
| 6. | Gotha | 1.46% | 0.012%(+1.45)#303 | 0.0067%(+1.46)#1,444 |
| 7. | Trout Creek | 1.34% | 0.00037%(+1.34)#2 | 0.0067%(+1.34)#1,662 |
| 8. | Arlington Heights | 1.33% | 0.0053%(+1.33)#63 | 0.0067%(+1.33)#1,663 |
| 9. | Pebble Creek | 1.20% | 0.012%(+1.19)#304 | 0.0067%(+1.20)#1,664 |
| 10. | Pocomoke City | 1.07% | 0.0086%(+1.06)#125 | 0.0067%(+1.06)#2,005 |
| 11. | Richmond Heights | 1.00% | 0.012%(+0.992)#305 | 0.0067%(+0.997)#2,006 |
| 12. | Andrews Afb | 0.97% | 0.0086%(+0.959)#126 | 0.0067%(+0.961)#2,007 |
| 13. | West Easton Borough | 0.96% | 0.0053%(+0.955)#102 | 0.0067%(+0.953)#2,008 |
| 14. | Callaway | 0.91% | 0.012%(+0.895)#335 | 0.0067%(+0.900)#2,009 |
| 15. | Naranja | 0.78% | 0.012%(+0.772)#336 | 0.0067%(+0.778)#2,010 |
| 16. | Stroudsburg Borough | 0.71% | 0.0053%(+0.707)#147 | 0.0067%(+0.706)#2,011 |
| 17. | Shoreham | 0.65% | 0.00058%(+0.651)#27 | 0.0067%(+0.645)#2,772 |
| 18. | Rockledge | 0.64% | 0.012%(+0.625)#521 | 0.0067%(+0.630)#2,773 |
| 19. | Bithlo | 0.61% | 0.012%(+0.595)#522 | 0.0067%(+0.600)#2,774 |
| 20. | Brandon | 0.56% | 0.0069%(+0.552)#5 | 0.0067%(+0.552)#3,040 |
| 21. | Clifton Heights Borough | 0.56% | 0.0053%(+0.551)#148 | 0.0067%(+0.549)#3,041 |
| 22. | Princeton | 0.53% | 0.0013%(+0.525)#15 | 0.0067%(+0.519)#3,042 |
| 23. | Montour Falls | 0.44% | 0.068%(+0.369)#358 | 0.0067%(+0.430)#3,043 |
| 24. | Yorketown | 0.42% | 0.013%(+0.404)#216 | 0.0067%(+0.410)#3,044 |
| 25. | South Floral Park | 0.41% | 0.068%(+0.347)#359 | 0.0067%(+0.408)#3,045 |
| 26. | Baywood | 0.39% | 0.068%(+0.321)#360 | 0.0067%(+0.383)#3,046 |
| 27. | Groesbeck | 0.36% | 0.0013%(+0.354)#182 | 0.0067%(+0.348)#3,806 |
| 28. | Newport | 0.35% | 0.010%(+0.339)#34 | 0.0067%(+0.343)#3,828 |
| 29. | Freehold Borough | 0.34% | 0.013%(+0.332)#217 | 0.0067%(+0.337)#3,829 |
| 30. | The Acreage | 0.33% | 0.012%(+0.322)#523 | 0.0067%(+0.327)#3,830 |
| 31. | Claymont | 0.33% | 0.010%(+0.323)#35 | 0.0067%(+0.327)#3,831 |
| 32. | Sneads Ferry | 0.33% | 0.0016%(+0.325)#132 | 0.0067%(+0.320)#3,934 |
| 33. | Garrison | 0.30% | 0.00003%(+0.305)#26 | 0.0067%(+0.298)#4,047 |
| 34. | Hudson Falls | 0.30% | 0.068%(+0.228)#490 | 0.0067%(+0.290)#4,096 |
| 35. | North Bellport | 0.28% | 0.068%(+0.217)#491 | 0.0067%(+0.278)#4,097 |
| 36. | Massapequa | 0.28% | 0.068%(+0.215)#492 | 0.0067%(+0.277)#4,098 |
| 37. | Geneva | 0.28% | 0.00024%(+0.283)#38 | 0.0067%(+0.277)#4,181 |
| 38. | Elmont | 0.28% | 0.068%(+0.209)#493 | 0.0067%(+0.271)#4,182 |
| 39. | Twin Rivers | 0.25% | 0.013%(+0.233)#218 | 0.0067%(+0.239)#4,183 |
| 40. | North Caldwell Borough | 0.24% | 0.013%(+0.229)#219 | 0.0067%(+0.235)#4,184 |
| 41. | Port Jervis | 0.24% | 0.068%(+0.172)#494 | 0.0067%(+0.234)#4,185 |
| 42. | Union City | 0.24% | 0.0072%(+0.231)#56 | 0.0067%(+0.232)#4,186 |
| 43. | Clinton | 0.23% | 0.0086%(+0.225)#127 | 0.0067%(+0.227)#4,187 |
| 44. | Ampere North | 0.23% | 0.013%(+0.220)#220 | 0.0067%(+0.226)#4,188 |
| 45. | Bridgeport | 0.23% | 0.00058%(+0.230)#68 | 0.0067%(+0.224)#4,507 |
| 46. | Randolph Town | 0.22% | 0.0051%(+0.217)#47 | 0.0067%(+0.215)#4,508 |
| 47. | Mount Vernon | 0.21% | 0.068%(+0.144)#495 | 0.0067%(+0.206)#4,509 |
| 48. | Pottsgrove | 0.21% | 0.0053%(+0.200)#301 | 0.0067%(+0.199)#4,510 |
| 49. | Lecanto | 0.20% | 0.012%(+0.190)#600 | 0.0067%(+0.195)#4,511 |
| 50. | Bon Air | 0.20% | 0.0044%(+0.196)#101 | 0.0067%(+0.194)#4,512 |
| 51. | Belvedere Park | 0.20% | 0.0072%(+0.192)#57 | 0.0067%(+0.193)#4,513 |
| 52. | Greenbelt | 0.20% | 0.0086%(+0.190)#128 | 0.0067%(+0.192)#4,514 |
| 53. | Coral Springs | 0.19% | 0.012%(+0.177)#601 | 0.0067%(+0.182)#4,515 |
| 54. | Beach Park | 0.19% | 0.00056%(+0.185)#82 | 0.0067%(+0.179)#4,516 |
| 55. | East Randolph | 0.18% | 0.068%(+0.113)#539 | 0.0067%(+0.175)#4,870 |
| 56. | Bellwood | 0.18% | 0.0044%(+0.176)#135 | 0.0067%(+0.173)#4,871 |
| 57. | Wyandanch | 0.17% | 0.068%(+0.101)#540 | 0.0067%(+0.162)#4,872 |
| 58. | Riverside | 0.17% | 0.0086%(+0.160)#129 | 0.0067%(+0.162)#4,873 |
| 59. | Owings Mills | 0.17% | 0.0086%(+0.160)#130 | 0.0067%(+0.162)#4,874 |
| 60. | Fort Knox | 0.16% | 0.00062%(+0.161)#17 | 0.0067%(+0.155)#4,875 |
| 61. | East Hartford | 0.16% | 0.0071%(+0.152)#12 | 0.0067%(+0.152)#4,876 |
| 62. | The Hammocks | 0.15% | 0.012%(+0.135)#602 | 0.0067%(+0.140)#4,877 |
| 63. | Caldwell Borough | 0.15% | 0.013%(+0.134)#221 | 0.0067%(+0.139)#4,878 |
| 64. | Gibsonton | 0.15% | 0.012%(+0.134)#603 | 0.0067%(+0.139)#4,879 |
| 65. | New York | 0.15% | 0.068%(+0.077)#541 | 0.0067%(+0.139)#4,880 |
| 66. | North Valley Stream | 0.14% | 0.068%(+0.074)#542 | 0.0067%(+0.135)#4,881 |
| 67. | Landover | 0.14% | 0.0086%(+0.131)#131 | 0.0067%(+0.132)#4,882 |
| 68. | Latham | 0.14% | 0.068%(+0.071)#543 | 0.0067%(+0.132)#4,883 |
| 69. | Merrick | 0.14% | 0.068%(+0.070)#544 | 0.0067%(+0.131)#4,884 |
| 70. | Cambridge | 0.14% | 0.0086%(+0.129)#132 | 0.0067%(+0.131)#4,885 |
| 71. | Country Walk | 0.13% | 0.012%(+0.122)#604 | 0.0067%(+0.127)#4,886 |
| 72. | Fort Washington | 0.13% | 0.0086%(+0.123)#133 | 0.0067%(+0.125)#4,887 |
| 73. | Vero Beach South | 0.13% | 0.012%(+0.118)#605 | 0.0067%(+0.123)#4,888 |
| 74. | Tamarac | 0.13% | 0.012%(+0.118)#606 | 0.0067%(+0.123)#4,889 |
| 75. | Dix Hills | 0.13% | 0.068%(+0.061)#545 | 0.0067%(+0.123)#4,890 |
| 76. | Oxon Hill | 0.13% | 0.0086%(+0.121)#134 | 0.0067%(+0.123)#4,891 |
| 77. | Middletown | 0.13% | 0.068%(+0.061)#546 | 0.0067%(+0.123)#4,892 |
| 78. | Spring Valley | 0.12% | 0.068%(+0.056)#547 | 0.0067%(+0.118)#4,893 |
| 79. | Oakton | 0.12% | 0.0044%(+0.116)#136 | 0.0067%(+0.114)#4,894 |
| 80. | Englewood | 0.12% | 0.013%(+0.108)#222 | 0.0067%(+0.114)#4,895 |
| 81. | Gloversville | 0.12% | 0.068%(+0.051)#548 | 0.0067%(+0.112)#4,896 |
| 82. | Thomasville | 0.12% | 0.0016%(+0.116)#164 | 0.0067%(+0.111)#4,897 |
| 83. | Fanwood Borough | 0.12% | 0.013%(+0.104)#223 | 0.0067%(+0.110)#4,898 |
| 84. | Strathmore | 0.12% | 0.013%(+0.103)#341 | 0.0067%(+0.109)#4,899 |
| 85. | Security Widefield | 0.10% | 0.0011%(+0.104)#20 | 0.0067%(+0.098)#4,900 |
| 86. | Wilkes Barre | 0.10% | 0.0053%(+0.097)#302 | 0.0067%(+0.095)#4,901 |
| 87. | Troy | 0.099% | 0.068%(+0.031)#549 | 0.0067%(+0.093)#4,902 |
| 88. | Daniels Farm | 0.099% | 0.0071%(+0.092)#96 | 0.0067%(+0.092)#5,150 |
| 89. | Roosevelt | 0.099% | 0.068%(+0.030)#550 | 0.0067%(+0.092)#5,151 |
| 90. | Port St Lucie | 0.098% | 0.012%(+0.086)#607 | 0.0067%(+0.091)#5,152 |
| 91. | River Park | 0.097% | 0.012%(+0.085)#608 | 0.0067%(+0.090)#5,153 |
| 92. | South Hempstead | 0.096% | 0.068%(+0.027)#551 | 0.0067%(+0.089)#5,154 |
| 93. | Carrboro | 0.094% | 0.0016%(+0.093)#165 | 0.0067%(+0.087)#5,155 |
| 94. | Cliffside Park Borough | 0.094% | 0.013%(+0.081)#342 | 0.0067%(+0.087)#5,156 |
| 95. | Uniondale | 0.093% | 0.068%(+0.025)#552 | 0.0067%(+0.087)#5,157 |
| 96. | Milford Mill | 0.092% | 0.0086%(+0.083)#135 | 0.0067%(+0.085)#5,158 |
| 97. | Auburn | 0.092% | 0.0018%(+0.090)#19 | 0.0067%(+0.085)#5,574 |
| 98. | North Merrick | 0.090% | 0.068%(+0.022)#553 | 0.0067%(+0.084)#5,575 |
| 99. | Harrison | 0.088% | 0.013%(+0.076)#343 | 0.0067%(+0.082)#5,576 |
| 100. | Hackensack | 0.085% | 0.013%(+0.073)#344 | 0.0067%(+0.079)#5,577 |
Common Questions
What are the Top 10 Cities with the Highest Percentage of Immigrants from St. Vincent and the Grenadines in the United States?
Top 10 Cities with the Highest Percentage of Immigrants from St. Vincent and the Grenadines in the United States are:
#1
2.47%
#2
1.59%
#3
1.56%
#4
1.46%
#5
1.34%
#6
1.33%
#7
1.20%
#8
1.07%
#9
1.00%
#10
0.97%
What city has the Highest Percentage of Immigrants from St. Vincent and the Grenadines in the United States?
Montverde has the Highest Percentage of Immigrants from St. Vincent and the Grenadines in the United States with 2.47%.
What is the Percentage of Immigrants from St. Vincent and the Grenadines in the United States?
Percentage of Immigrants from St. Vincent and the Grenadines in the United States is 0.0067%.