Cities with the Most Immigrants from South Central Asia in the United States
RELATED REPORTS & OPTIONS
South Central Asia
United States
Compare Cities
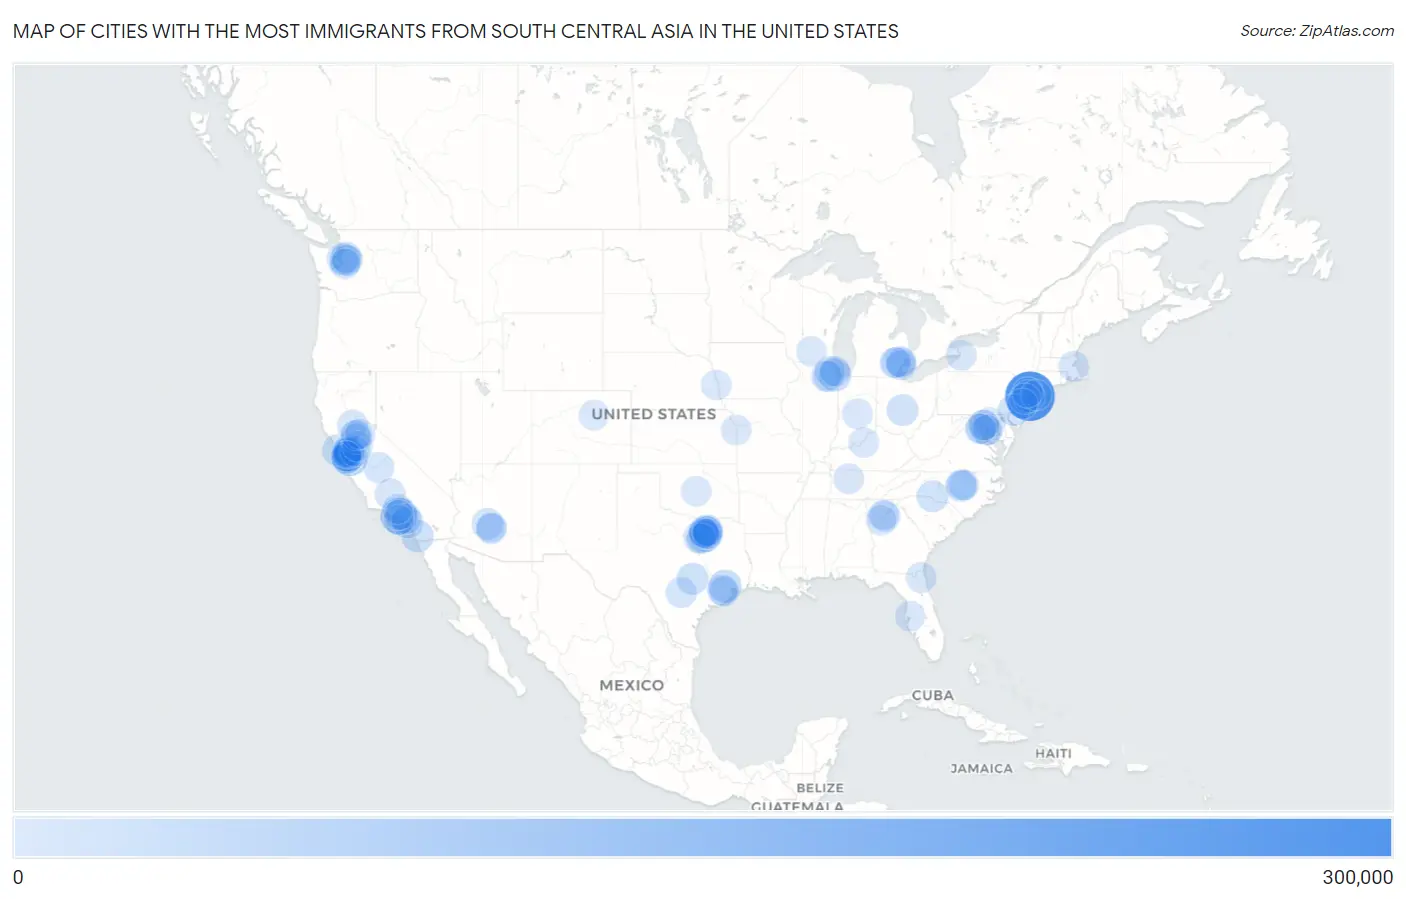
Map of Cities with the Most Immigrants from South Central Asia in the United States
0
300,000
Cities with the Most Immigrants from South Central Asia in the United States
| City | South Central Asia | vs State | vs National | |
| 1. | New York | 286,562 | 439,988(65.13%)#1 | 4,330,976(6.62%)#1 |
| 2. | Los Angeles | 92,840 | 909,406(10.21%)#1 | 4,330,976(2.14%)#2 |
| 3. | San Jose | 66,704 | 909,406(7.33%)#2 | 4,330,976(1.54%)#3 |
| 4. | Fremont | 51,640 | 909,406(5.68%)#3 | 4,330,976(1.19%)#4 |
| 5. | Houston | 43,407 | 467,125(9.29%)#1 | 4,330,976(1.00%)#5 |
| 6. | Chicago | 37,837 | 218,685(17.30%)#1 | 4,330,976(0.87%)#6 |
| 7. | Irving | 35,103 | 467,125(7.51%)#2 | 4,330,976(0.81%)#7 |
| 8. | Jersey City | 31,347 | 334,880(9.36%)#1 | 4,330,976(0.72%)#8 |
| 9. | San Diego | 30,792 | 909,406(3.39%)#4 | 4,330,976(0.71%)#9 |
| 10. | Plano | 29,515 | 467,125(6.32%)#3 | 4,330,976(0.68%)#10 |
| 11. | Glendale | 28,550 | 909,406(3.14%)#5 | 4,330,976(0.66%)#11 |
| 12. | Austin | 26,684 | 467,125(5.71%)#4 | 4,330,976(0.62%)#12 |
| 13. | Irvine | 25,243 | 909,406(2.78%)#6 | 4,330,976(0.58%)#13 |
| 14. | Frisco | 25,180 | 467,125(5.39%)#5 | 4,330,976(0.58%)#14 |
| 15. | Sunnyvale | 25,040 | 909,406(2.75%)#7 | 4,330,976(0.58%)#15 |
| 16. | Charlotte | 22,916 | 104,326(21.97%)#1 | 4,330,976(0.53%)#16 |
| 17. | Philadelphia | 22,762 | 149,233(15.25%)#1 | 4,330,976(0.53%)#17 |
| 18. | Columbus | 22,104 | 109,579(20.17%)#1 | 4,330,976(0.51%)#18 |
| 19. | Santa Clara | 19,755 | 909,406(2.17%)#8 | 4,330,976(0.46%)#19 |
| 20. | Seattle | 19,406 | 136,514(14.22%)#1 | 4,330,976(0.45%)#20 |
| 21. | Phoenix | 19,305 | 59,390(32.51%)#1 | 4,330,976(0.45%)#21 |
| 22. | San Francisco | 17,733 | 909,406(1.95%)#9 | 4,330,976(0.41%)#22 |
| 23. | Bellevue | 17,637 | 136,514(12.92%)#2 | 4,330,976(0.41%)#23 |
| 24. | Cary | 17,611 | 104,326(16.88%)#2 | 4,330,976(0.41%)#24 |
| 25. | San Antonio | 15,005 | 467,125(3.21%)#6 | 4,330,976(0.35%)#25 |
| 26. | San Ramon | 14,555 | 909,406(1.60%)#10 | 4,330,976(0.34%)#26 |
| 27. | Dallas | 14,494 | 467,125(3.10%)#7 | 4,330,976(0.33%)#27 |
| 28. | Milpitas | 14,037 | 909,406(1.54%)#11 | 4,330,976(0.32%)#28 |
| 29. | Fort Worth | 14,022 | 467,125(3.00%)#8 | 4,330,976(0.32%)#29 |
| 30. | Sacramento | 13,879 | 909,406(1.53%)#12 | 4,330,976(0.32%)#30 |
| 31. | Naperville | 13,844 | 218,685(6.33%)#2 | 4,330,976(0.32%)#31 |
| 32. | Dublin | 13,373 | 909,406(1.47%)#13 | 4,330,976(0.31%)#32 |
| 33. | Sugar Land | 13,348 | 467,125(2.86%)#9 | 4,330,976(0.31%)#33 |
| 34. | Redmond | 13,053 | 136,514(9.56%)#3 | 4,330,976(0.30%)#34 |
| 35. | Fresno | 12,791 | 909,406(1.41%)#14 | 4,330,976(0.30%)#35 |
| 36. | Cupertino | 12,728 | 909,406(1.40%)#15 | 4,330,976(0.29%)#36 |
| 37. | Pleasanton | 12,393 | 909,406(1.36%)#16 | 4,330,976(0.29%)#37 |
| 38. | Jacksonville | 10,119 | 144,811(6.99%)#1 | 4,330,976(0.23%)#38 |
| 39. | Troy | 10,051 | 117,592(8.55%)#1 | 4,330,976(0.23%)#39 |
| 40. | Mckinney | 9,920 | 467,125(2.12%)#10 | 4,330,976(0.23%)#40 |
| 41. | Chandler | 9,796 | 59,390(16.49%)#2 | 4,330,976(0.23%)#41 |
| 42. | Johns Creek | 9,553 | 141,735(6.74%)#1 | 4,330,976(0.22%)#42 |
| 43. | Boston | 9,273 | 115,610(8.02%)#1 | 4,330,976(0.21%)#43 |
| 44. | Schaumburg | 9,134 | 218,685(4.18%)#3 | 4,330,976(0.21%)#44 |
| 45. | Aurora | 9,001 | 218,685(4.12%)#4 | 4,330,976(0.21%)#45 |
| 46. | Buffalo | 8,659 | 439,988(1.97%)#2 | 4,330,976(0.20%)#46 |
| 47. | Union City | 8,538 | 909,406(0.94%)#17 | 4,330,976(0.20%)#47 |
| 48. | Bakersfield | 8,409 | 909,406(0.92%)#18 | 4,330,976(0.19%)#48 |
| 49. | Sammamish | 8,396 | 136,514(6.15%)#4 | 4,330,976(0.19%)#49 |
| 50. | Kent | 8,355 | 136,514(6.12%)#5 | 4,330,976(0.19%)#50 |
| 51. | Morrisville | 7,784 | 104,326(7.46%)#3 | 4,330,976(0.18%)#51 |
| 52. | Overland Park | 7,740 | 20,001(38.70%)#1 | 4,330,976(0.18%)#52 |
| 53. | Anaheim | 7,733 | 909,406(0.85%)#19 | 4,330,976(0.18%)#53 |
| 54. | Alpharetta | 7,729 | 141,735(5.45%)#2 | 4,330,976(0.18%)#54 |
| 55. | Nashville | 7,615 | 34,050(22.36%)#1 | 4,330,976(0.18%)#55 |
| 56. | Indianapolis | 7,513 | 41,403(18.15%)#1 | 4,330,976(0.17%)#56 |
| 57. | Yuba City | 7,231 | 909,406(0.80%)#20 | 4,330,976(0.17%)#57 |
| 58. | Elk Grove | 7,223 | 909,406(0.79%)#21 | 4,330,976(0.17%)#58 |
| 59. | Iselin | 7,178 | 334,880(2.14%)#2 | 4,330,976(0.17%)#59 |
| 60. | Hayward | 7,146 | 909,406(0.79%)#22 | 4,330,976(0.16%)#60 |
| 61. | Tracy | 7,142 | 909,406(0.79%)#23 | 4,330,976(0.16%)#61 |
| 62. | Farmington Hills | 6,989 | 117,592(5.94%)#2 | 4,330,976(0.16%)#62 |
| 63. | Raleigh | 6,962 | 104,326(6.67%)#4 | 4,330,976(0.16%)#63 |
| 64. | Hicksville | 6,904 | 439,988(1.57%)#3 | 4,330,976(0.16%)#64 |
| 65. | Stockton | 6,878 | 909,406(0.76%)#24 | 4,330,976(0.16%)#65 |
| 66. | Ellicott City | 6,829 | 118,051(5.78%)#1 | 4,330,976(0.16%)#66 |
| 67. | Arden Arcade | 6,806 | 909,406(0.75%)#25 | 4,330,976(0.16%)#67 |
| 68. | Atlanta | 6,601 | 141,735(4.66%)#3 | 4,330,976(0.15%)#68 |
| 69. | Tampa | 6,448 | 144,811(4.45%)#2 | 4,330,976(0.15%)#69 |
| 70. | Carrollton | 6,419 | 467,125(1.37%)#11 | 4,330,976(0.15%)#70 |
| 71. | Folsom | 6,391 | 909,406(0.70%)#26 | 4,330,976(0.15%)#71 |
| 72. | Germantown | 6,357 | 118,051(5.38%)#2 | 4,330,976(0.15%)#72 |
| 73. | Oklahoma City | 6,316 | 17,100(36.94%)#1 | 4,330,976(0.15%)#73 |
| 74. | Mountain View | 6,290 | 909,406(0.69%)#27 | 4,330,976(0.15%)#74 |
| 75. | Arlington | 6,184 | 183,927(3.36%)#1 | 4,330,976(0.14%)#75 |
| 76. | Louisville | 6,057 | 21,773(27.82%)#1 | 4,330,976(0.14%)#76 |
| 77. | Novi | 6,039 | 117,592(5.14%)#3 | 4,330,976(0.14%)#77 |
| 78. | Detroit | 5,841 | 117,592(4.97%)#4 | 4,330,976(0.13%)#78 |
| 79. | Coppell | 5,785 | 467,125(1.24%)#12 | 4,330,976(0.13%)#79 |
| 80. | Arlington | 5,776 | 467,125(1.24%)#13 | 4,330,976(0.13%)#80 |
| 81. | Omaha | 5,773 | 11,965(48.25%)#1 | 4,330,976(0.13%)#81 |
| 82. | Washington | 5,711 | 5,711(100.00%)#1 | 4,330,976(0.13%)#82 |
| 83. | Skokie | 5,693 | 218,685(2.60%)#5 | 4,330,976(0.13%)#83 |
| 84. | Parsippany | 5,661 | 334,880(1.69%)#3 | 4,330,976(0.13%)#84 |
| 85. | Tempe | 5,599 | 59,390(9.43%)#3 | 4,330,976(0.13%)#85 |
| 86. | Princeton Meadows | 5,589 | 334,880(1.67%)#4 | 4,330,976(0.13%)#86 |
| 87. | Warren | 5,581 | 117,592(4.75%)#5 | 4,330,976(0.13%)#87 |
| 88. | Brambleton | 5,484 | 183,927(2.98%)#2 | 4,330,976(0.13%)#88 |
| 89. | Torrance | 5,411 | 909,406(0.60%)#28 | 4,330,976(0.12%)#89 |
| 90. | Allen | 5,389 | 467,125(1.15%)#14 | 4,330,976(0.12%)#90 |
| 91. | Lewisville | 5,378 | 467,125(1.15%)#15 | 4,330,976(0.12%)#91 |
| 92. | Aurora | 5,348 | 38,562(13.87%)#1 | 4,330,976(0.12%)#92 |
| 93. | Missouri City | 5,322 | 467,125(1.14%)#16 | 4,330,976(0.12%)#93 |
| 94. | Madison | 5,265 | 30,911(17.03%)#1 | 4,330,976(0.12%)#94 |
| 95. | Mcnair | 5,243 | 183,927(2.85%)#3 | 4,330,976(0.12%)#95 |
| 96. | Santa Clarita | 5,231 | 909,406(0.58%)#29 | 4,330,976(0.12%)#96 |
| 97. | Beverly Hills | 5,204 | 909,406(0.57%)#30 | 4,330,976(0.12%)#97 |
| 98. | Richardson | 5,200 | 467,125(1.11%)#17 | 4,330,976(0.12%)#98 |
| 99. | Gaithersburg | 5,157 | 118,051(4.37%)#3 | 4,330,976(0.12%)#99 |
| 100. | Paterson | 5,089 | 334,880(1.52%)#5 | 4,330,976(0.12%)#100 |
Common Questions
What are the Top 10 Cities with the Most Immigrants from South Central Asia in the United States?
Top 10 Cities with the Most Immigrants from South Central Asia in the United States are:
What city has the Most Immigrants from South Central Asia in the United States?
New York has the Most Immigrants from South Central Asia in the United States with 286,562.
What is the Total Immigrants from South Central Asia in the United States?
Total Immigrants from South Central Asia in the United States is 4,330,976.