Floyd County, GA
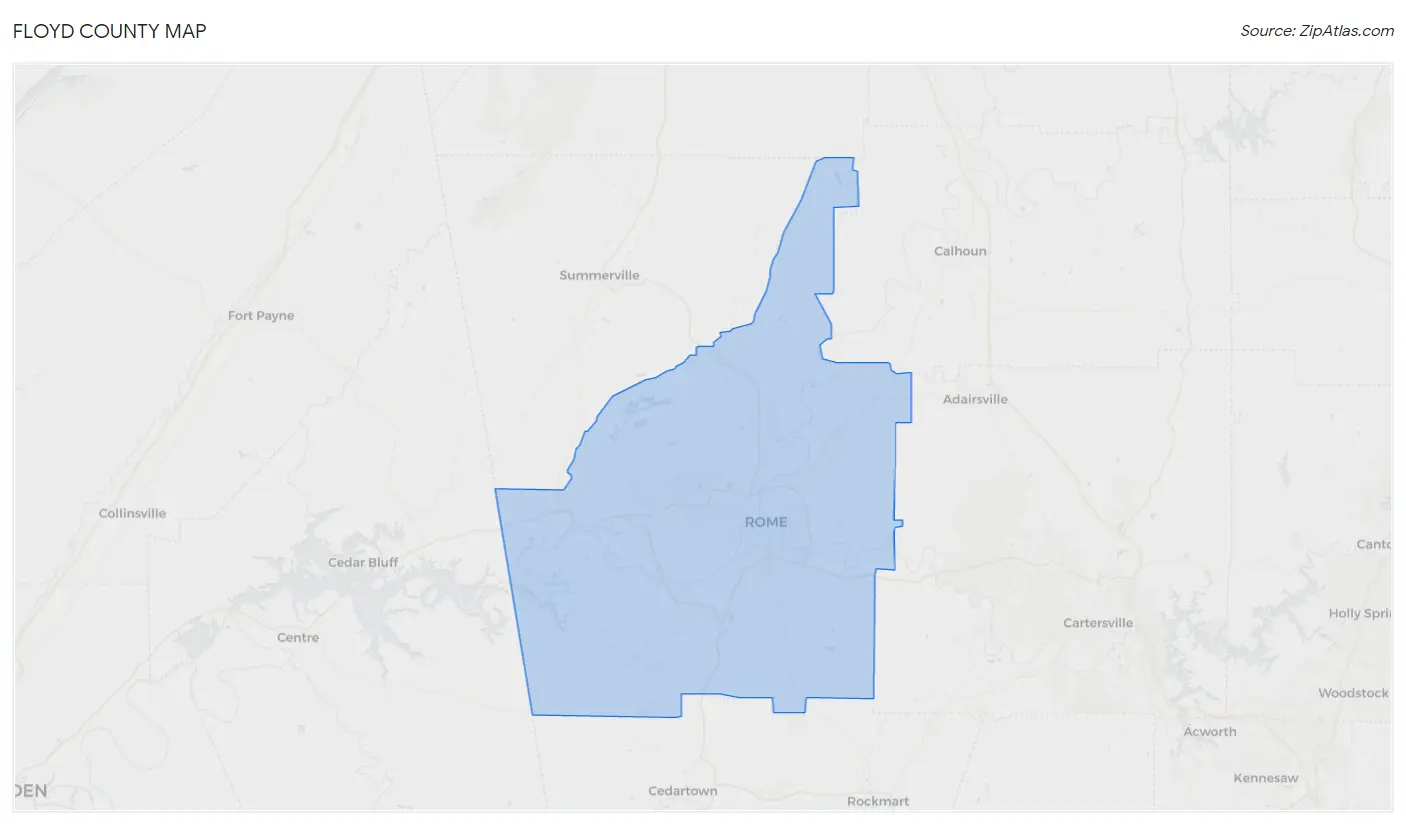
Floyd County Map
Floyd County Overview
98,541
TOTAL POPULATION
48,250
MALE POPULATION
50,291
FEMALE POPULATION
95.94
MALES / 100 FEMALES
104.23
FEMALES / 100 MALES
38.0
MEDIAN AGE
3.2
AVG FAMILY SIZE
2.6
AVG HOUSEHOLD SIZE
$30,523
PER CAPITA INCOME
$72,134
AVG FAMILY INCOME
$57,868
AVG HOUSEHOLD INCOME
30.7%
WAGE / INCOME GAP [ % ]
69.3¢/ $1
WAGE / INCOME GAP [ $ ]
$10,515
FAMILY INCOME DEFICIT
0.47
INEQUALITY / GINI INDEX
45,559
LABOR FORCE [ PEOPLE ]
57.8%
PERCENT IN LABOR FORCE
4.1%
UNEMPLOYMENT RATE
Floyd County Area Codes
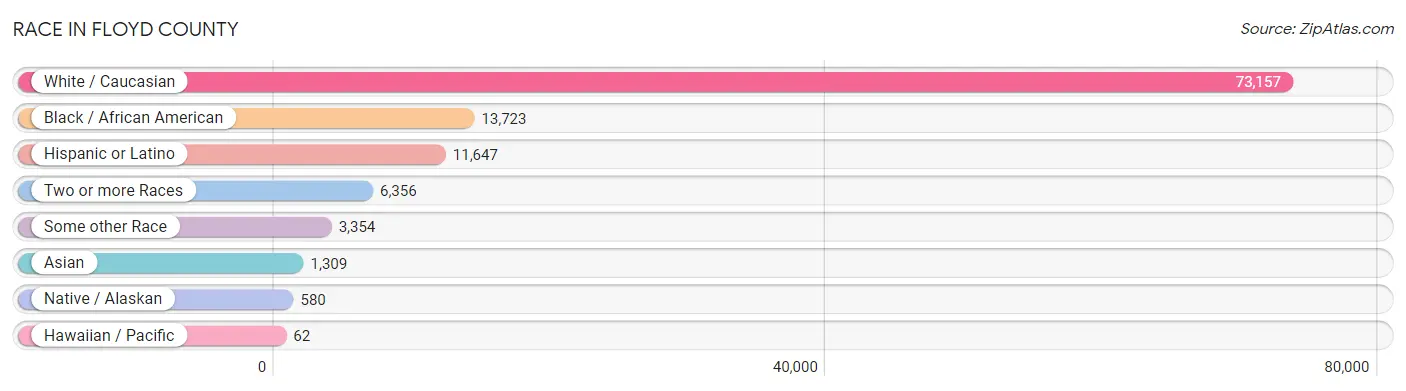
Race in Floyd County
The most populous races in Floyd County are White / Caucasian (73,157 | 74.2%), Black / African American (13,723 | 13.9%), and Hispanic or Latino (11,647 | 11.8%).
| Race | # Population | % Population |
| Asian | 1,309 | 1.3% |
| Black / African American | 13,723 | 13.9% |
| Hawaiian / Pacific | 62 | 0.1% |
| Hispanic or Latino | 11,647 | 11.8% |
| Native / Alaskan | 580 | 0.6% |
| White / Caucasian | 73,157 | 74.2% |
| Two or more Races | 6,356 | 6.5% |
| Some other Race | 3,354 | 3.4% |
| Total | 98,541 | 100.0% |
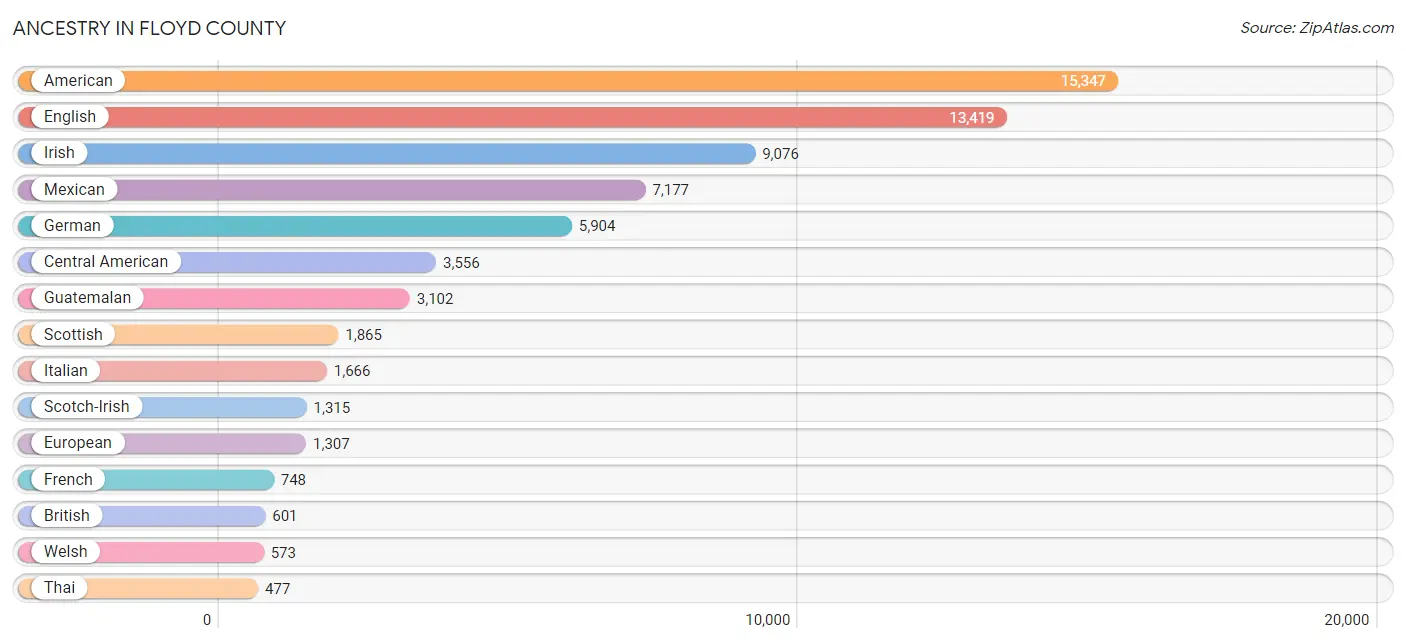
Ancestry in Floyd County
The most populous ancestries reported in Floyd County are American (15,347 | 15.6%), English (13,419 | 13.6%), Irish (9,076 | 9.2%), Mexican (7,177 | 7.3%), and German (5,904 | 6.0%), together accounting for 51.7% of all Floyd County residents.
| Ancestry | # Population | % Population |
| African | 165 | 0.2% |
| Alsatian | 1 | 0.0% |
| American | 15,347 | 15.6% |
| Apache | 2 | 0.0% |
| Arab | 166 | 0.2% |
| Argentinean | 12 | 0.0% |
| Australian | 9 | 0.0% |
| Austrian | 208 | 0.2% |
| Belgian | 46 | 0.1% |
| Bhutanese | 138 | 0.1% |
| Blackfeet | 87 | 0.1% |
| Brazilian | 9 | 0.0% |
| British | 601 | 0.6% |
| Bulgarian | 22 | 0.0% |
| Burmese | 190 | 0.2% |
| Canadian | 66 | 0.1% |
| Central American | 3,556 | 3.6% |
| Central American Indian | 309 | 0.3% |
| Cherokee | 402 | 0.4% |
| Cheyenne | 81 | 0.1% |
| Chinese | 11 | 0.0% |
| Choctaw | 12 | 0.0% |
| Colombian | 100 | 0.1% |
| Costa Rican | 9 | 0.0% |
| Creek | 21 | 0.0% |
| Croatian | 11 | 0.0% |
| Cuban | 70 | 0.1% |
| Czech | 41 | 0.0% |
| Czechoslovakian | 10 | 0.0% |
| Danish | 35 | 0.0% |
| Dominican | 14 | 0.0% |
| Dutch | 456 | 0.5% |
| Eastern European | 142 | 0.1% |
| Ecuadorian | 45 | 0.1% |
| English | 13,419 | 13.6% |
| European | 1,307 | 1.3% |
| Finnish | 4 | 0.0% |
| French | 748 | 0.8% |
| French Canadian | 184 | 0.2% |
| German | 5,904 | 6.0% |
| Ghanaian | 39 | 0.0% |
| Greek | 53 | 0.1% |
| Guamanian / Chamorro | 22 | 0.0% |
| Guatemalan | 3,102 | 3.2% |
| Haitian | 36 | 0.0% |
| Honduran | 121 | 0.1% |
| Hungarian | 69 | 0.1% |
| Indian (Asian) | 267 | 0.3% |
| Iranian | 18 | 0.0% |
| Irish | 9,076 | 9.2% |
| Iroquois | 40 | 0.0% |
| Israeli | 140 | 0.1% |
| Italian | 1,666 | 1.7% |
| Jamaican | 7 | 0.0% |
| Korean | 53 | 0.1% |
| Latvian | 15 | 0.0% |
| Lebanese | 50 | 0.1% |
| Lithuanian | 7 | 0.0% |
| Malaysian | 7 | 0.0% |
| Mexican | 7,177 | 7.3% |
| Mexican American Indian | 222 | 0.2% |
| Nicaraguan | 54 | 0.1% |
| Northern European | 69 | 0.1% |
| Norwegian | 290 | 0.3% |
| Pakistani | 26 | 0.0% |
| Palestinian | 116 | 0.1% |
| Panamanian | 20 | 0.0% |
| Polish | 363 | 0.4% |
| Portuguese | 47 | 0.1% |
| Pueblo | 3 | 0.0% |
| Puerto Rican | 363 | 0.4% |
| Romanian | 26 | 0.0% |
| Russian | 113 | 0.1% |
| Salvadoran | 250 | 0.3% |
| Samoan | 155 | 0.2% |
| Scandinavian | 102 | 0.1% |
| Scotch-Irish | 1,315 | 1.3% |
| Scottish | 1,865 | 1.9% |
| South African | 48 | 0.1% |
| South American | 181 | 0.2% |
| Spaniard | 39 | 0.0% |
| Spanish | 55 | 0.1% |
| Sri Lankan | 335 | 0.3% |
| Subsaharan African | 321 | 0.3% |
| Swedish | 372 | 0.4% |
| Swiss | 101 | 0.1% |
| Thai | 477 | 0.5% |
| Trinidadian and Tobagonian | 17 | 0.0% |
| Ukrainian | 27 | 0.0% |
| Venezuelan | 24 | 0.0% |
| Welsh | 573 | 0.6% |
| Yaqui | 12 | 0.0% |
| Zimbabwean | 31 | 0.0% | View All 93 Rows |
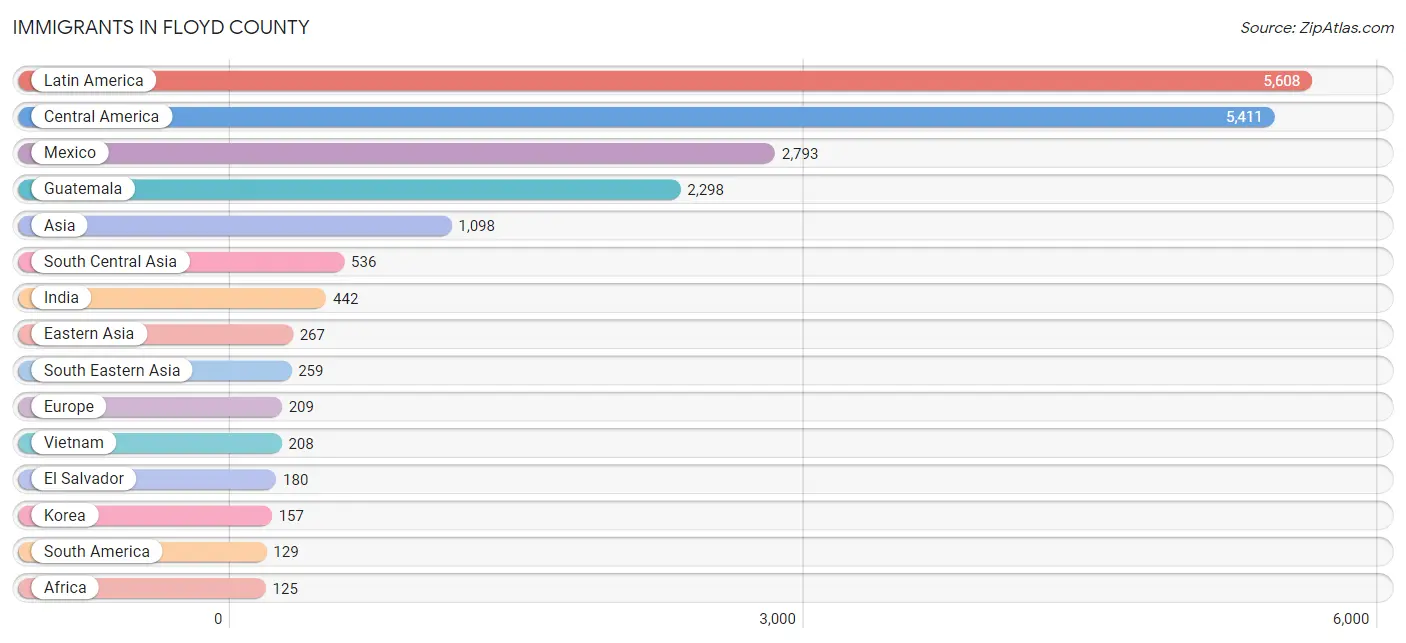
Immigrants in Floyd County
The most numerous immigrant groups reported in Floyd County came from Latin America (5,608 | 5.7%), Central America (5,411 | 5.5%), Mexico (2,793 | 2.8%), Guatemala (2,298 | 2.3%), and Asia (1,098 | 1.1%), together accounting for 17.4% of all Floyd County residents.
| Immigration Origin | # Population | % Population |
| Africa | 125 | 0.1% |
| Argentina | 12 | 0.0% |
| Asia | 1,098 | 1.1% |
| Australia | 9 | 0.0% |
| Brazil | 41 | 0.0% |
| Bulgaria | 7 | 0.0% |
| Canada | 66 | 0.1% |
| Caribbean | 68 | 0.1% |
| Central America | 5,411 | 5.5% |
| China | 110 | 0.1% |
| Colombia | 34 | 0.0% |
| Eastern Africa | 31 | 0.0% |
| Eastern Asia | 267 | 0.3% |
| Eastern Europe | 55 | 0.1% |
| Ecuador | 18 | 0.0% |
| El Salvador | 180 | 0.2% |
| England | 24 | 0.0% |
| Europe | 209 | 0.2% |
| France | 7 | 0.0% |
| Germany | 27 | 0.0% |
| Guatemala | 2,298 | 2.3% |
| Haiti | 36 | 0.0% |
| Honduras | 86 | 0.1% |
| Hong Kong | 25 | 0.0% |
| India | 442 | 0.4% |
| Ireland | 9 | 0.0% |
| Israel | 22 | 0.0% |
| Italy | 37 | 0.0% |
| Kenya | 6 | 0.0% |
| Korea | 157 | 0.2% |
| Latin America | 5,608 | 5.7% |
| Lebanon | 14 | 0.0% |
| Malaysia | 6 | 0.0% |
| Mexico | 2,793 | 2.8% |
| Middle Africa | 12 | 0.0% |
| Nicaragua | 54 | 0.1% |
| Northern Africa | 8 | 0.0% |
| Northern Europe | 63 | 0.1% |
| Oceania | 9 | 0.0% |
| Pakistan | 94 | 0.1% |
| Philippines | 39 | 0.0% |
| Poland | 13 | 0.0% |
| Romania | 5 | 0.0% |
| South Africa | 10 | 0.0% |
| South America | 129 | 0.1% |
| South Central Asia | 536 | 0.5% |
| South Eastern Asia | 259 | 0.3% |
| Southern Europe | 37 | 0.0% |
| Switzerland | 20 | 0.0% |
| Thailand | 6 | 0.0% |
| Trinidad and Tobago | 12 | 0.0% |
| Ukraine | 30 | 0.0% |
| Venezuela | 24 | 0.0% |
| Vietnam | 208 | 0.2% |
| Western Africa | 64 | 0.1% |
| Western Asia | 36 | 0.0% |
| Western Europe | 54 | 0.1% |
| Zimbabwe | 22 | 0.0% | View All 58 Rows |
Sex and Age in Floyd County
Sex and Age in Floyd County
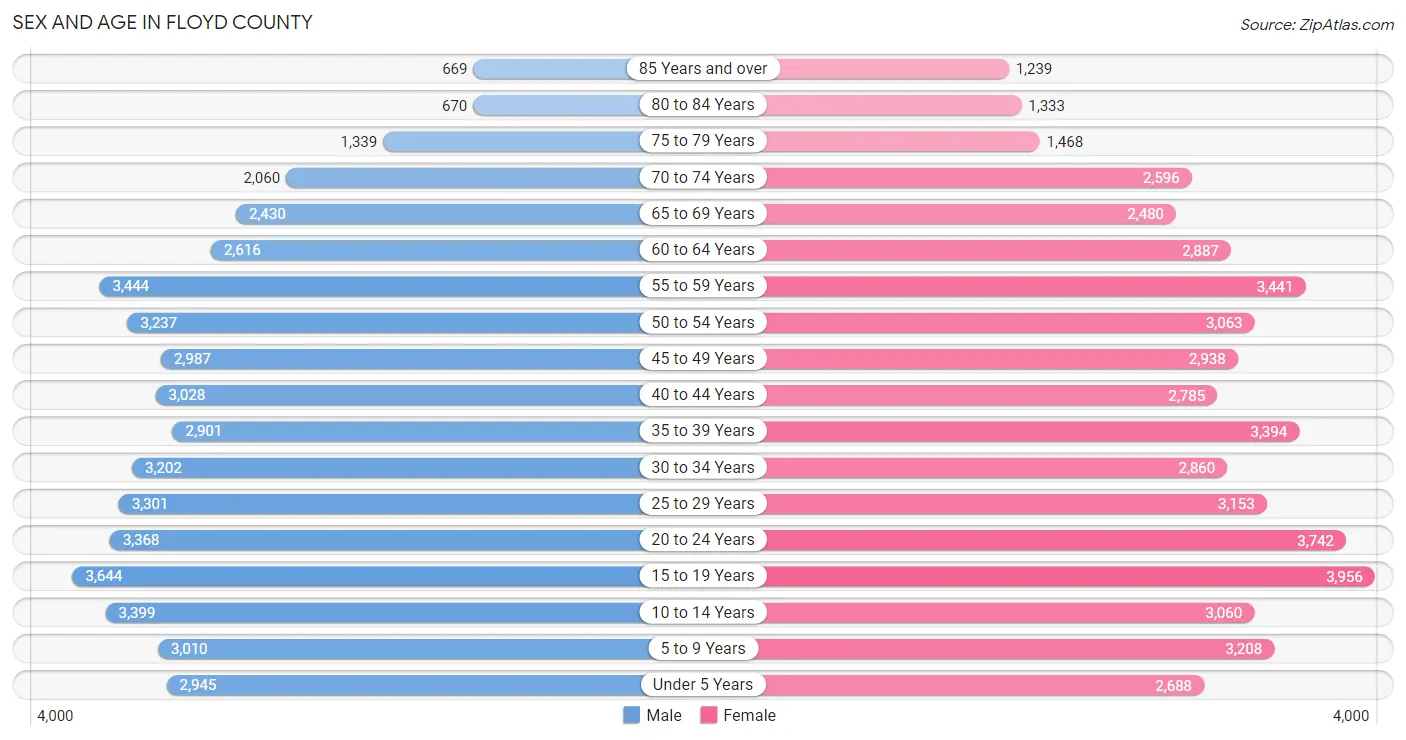
The most populous age groups in Floyd County are 15 to 19 Years (3,644 | 7.5%) for men and 15 to 19 Years (3,956 | 7.9%) for women.
| Age Bracket | Male | Female |
| Under 5 Years | 2,945 (6.1%) | 2,688 (5.3%) |
| 5 to 9 Years | 3,010 (6.2%) | 3,208 (6.4%) |
| 10 to 14 Years | 3,399 (7.0%) | 3,060 (6.1%) |
| 15 to 19 Years | 3,644 (7.5%) | 3,956 (7.9%) |
| 20 to 24 Years | 3,368 (7.0%) | 3,742 (7.4%) |
| 25 to 29 Years | 3,301 (6.8%) | 3,153 (6.3%) |
| 30 to 34 Years | 3,202 (6.6%) | 2,860 (5.7%) |
| 35 to 39 Years | 2,901 (6.0%) | 3,394 (6.8%) |
| 40 to 44 Years | 3,028 (6.3%) | 2,785 (5.5%) |
| 45 to 49 Years | 2,987 (6.2%) | 2,938 (5.8%) |
| 50 to 54 Years | 3,237 (6.7%) | 3,063 (6.1%) |
| 55 to 59 Years | 3,444 (7.1%) | 3,441 (6.8%) |
| 60 to 64 Years | 2,616 (5.4%) | 2,887 (5.7%) |
| 65 to 69 Years | 2,430 (5.0%) | 2,480 (4.9%) |
| 70 to 74 Years | 2,060 (4.3%) | 2,596 (5.2%) |
| 75 to 79 Years | 1,339 (2.8%) | 1,468 (2.9%) |
| 80 to 84 Years | 670 (1.4%) | 1,333 (2.6%) |
| 85 Years and over | 669 (1.4%) | 1,239 (2.5%) |
| Total | 48,250 (100.0%) | 50,291 (100.0%) |
Families and Households in Floyd County
Median Family Size in Floyd County
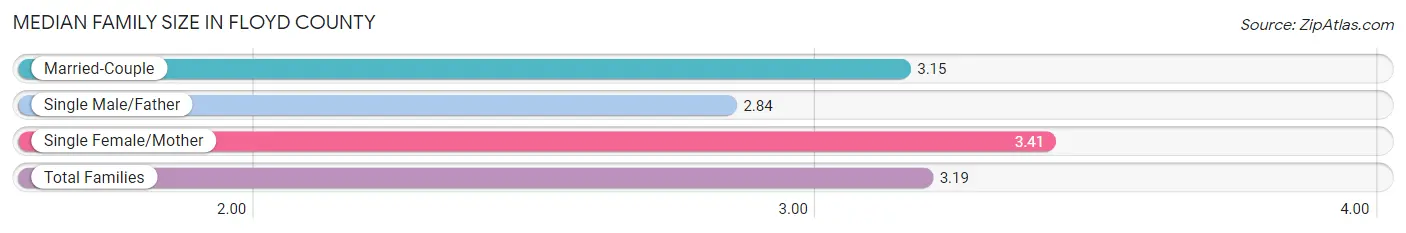
The median family size in Floyd County is 3.19 persons per family, with single female/mother families (5,704 | 23.2%) accounting for the largest median family size of 3.41 persons per family. On the other hand, single male/father families (1,782 | 7.2%) represent the smallest median family size with 2.84 persons per family.
| Family Type | # Families | Family Size |
| Married-Couple | 17,110 (69.6%) | 3.15 |
| Single Male/Father | 1,782 (7.2%) | 2.84 |
| Single Female/Mother | 5,704 (23.2%) | 3.41 |
| Total Families | 24,596 (100.0%) | 3.19 |
Median Household Size in Floyd County
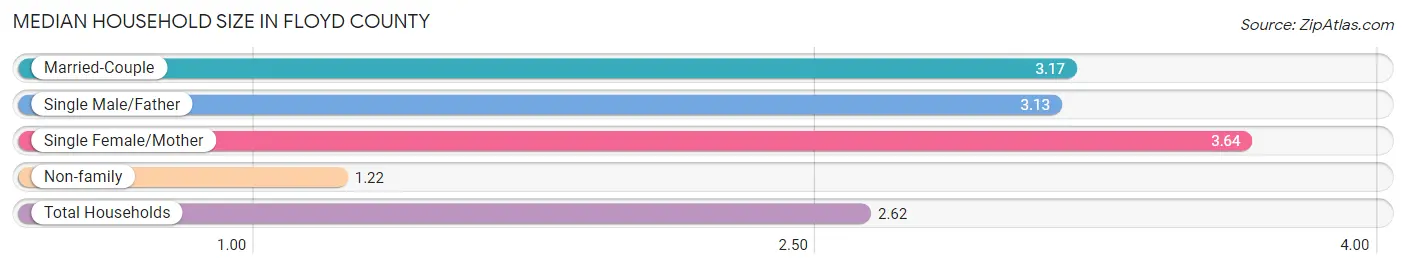
The median household size in Floyd County is 2.62 persons per household, with single female/mother households (5,704 | 15.9%) accounting for the largest median household size of 3.64 persons per household. non-family households (11,400 | 31.7%) represent the smallest median household size with 1.22 persons per household.
| Household Type | # Households | Household Size |
| Married-Couple | 17,110 (47.5%) | 3.17 |
| Single Male/Father | 1,782 (5.0%) | 3.13 |
| Single Female/Mother | 5,704 (15.9%) | 3.64 |
| Non-family | 11,400 (31.7%) | 1.22 |
| Total Households | 35,996 (100.0%) | 2.62 |
Household Size by Marriage Status in Floyd County
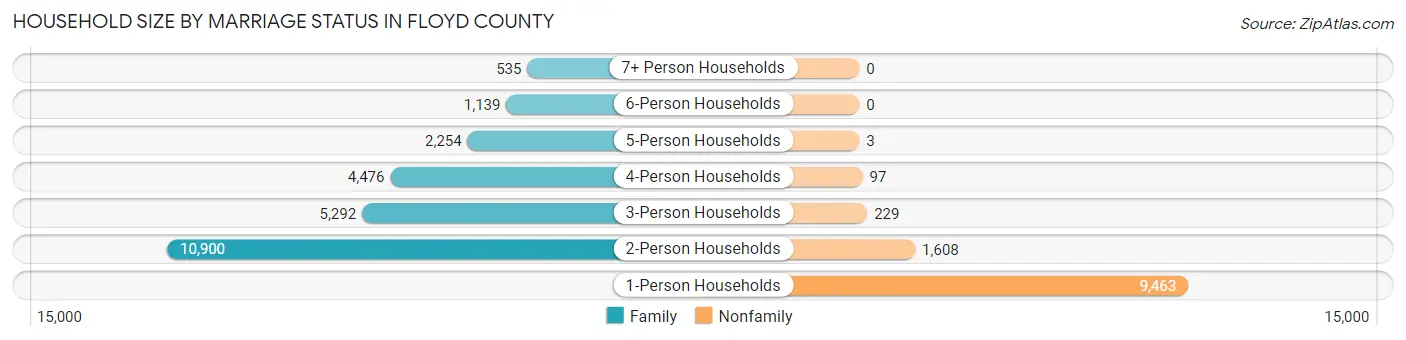
Out of a total of 35,996 households in Floyd County, 24,596 (68.3%) are family households, while 11,400 (31.7%) are nonfamily households. The most numerous type of family households are 2-person households, comprising 10,900, and the most common type of nonfamily households are 1-person households, comprising 9,463.
| Household Size | Family Households | Nonfamily Households |
| 1-Person Households | - | 9,463 (26.3%) |
| 2-Person Households | 10,900 (30.3%) | 1,608 (4.5%) |
| 3-Person Households | 5,292 (14.7%) | 229 (0.6%) |
| 4-Person Households | 4,476 (12.4%) | 97 (0.3%) |
| 5-Person Households | 2,254 (6.3%) | 3 (0.0%) |
| 6-Person Households | 1,139 (3.2%) | 0 (0.0%) |
| 7+ Person Households | 535 (1.5%) | 0 (0.0%) |
| Total | 24,596 (68.3%) | 11,400 (31.7%) |
Female Fertility in Floyd County
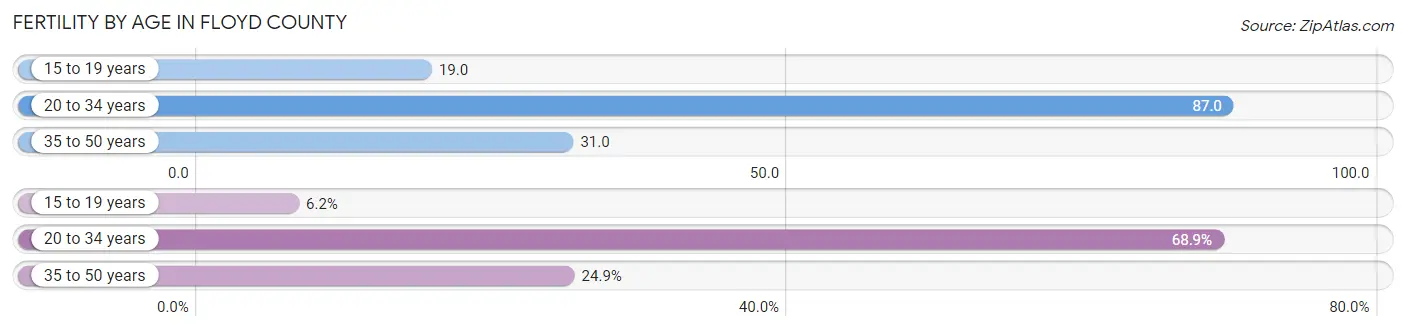
Fertility by Age in Floyd County
Average fertility rate in Floyd County is 52.0 births per 1,000 women. Women in the age bracket of 20 to 34 years have the highest fertility rate with 87.0 births per 1,000 women. Women in the age bracket of 20 to 34 years acount for 68.9% of all women with births.
| Age Bracket | Women with Births | Births / 1,000 Women |
| 15 to 19 years | 76 (6.2%) | 19.0 |
| 20 to 34 years | 848 (68.9%) | 87.0 |
| 35 to 50 years | 306 (24.9%) | 31.0 |
| Total | 1,230 (100.0%) | 52.0 |
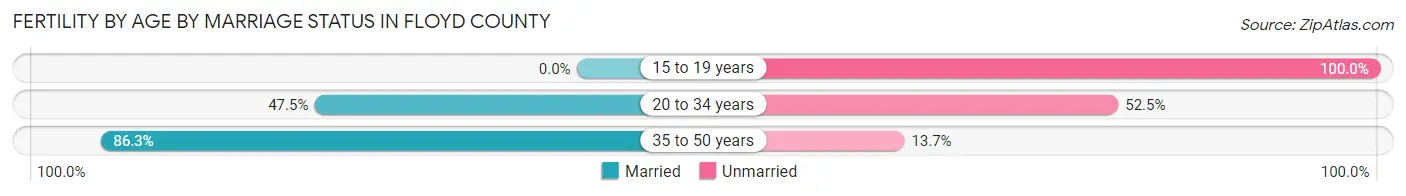
Fertility by Age by Marriage Status in Floyd County
54.2% of women with births (1,230) in Floyd County are married. The highest percentage of unmarried women with births falls into 15 to 19 years age bracket with 100.0% of them unmarried at the time of birth, while the lowest percentage of unmarried women with births belong to 35 to 50 years age bracket with 13.7% of them unmarried.
| Age Bracket | Married | Unmarried |
| 15 to 19 years | 0 (0.0%) | 76 (100.0%) |
| 20 to 34 years | 403 (47.5%) | 445 (52.5%) |
| 35 to 50 years | 264 (86.3%) | 42 (13.7%) |
| Total | 667 (54.2%) | 563 (45.8%) |
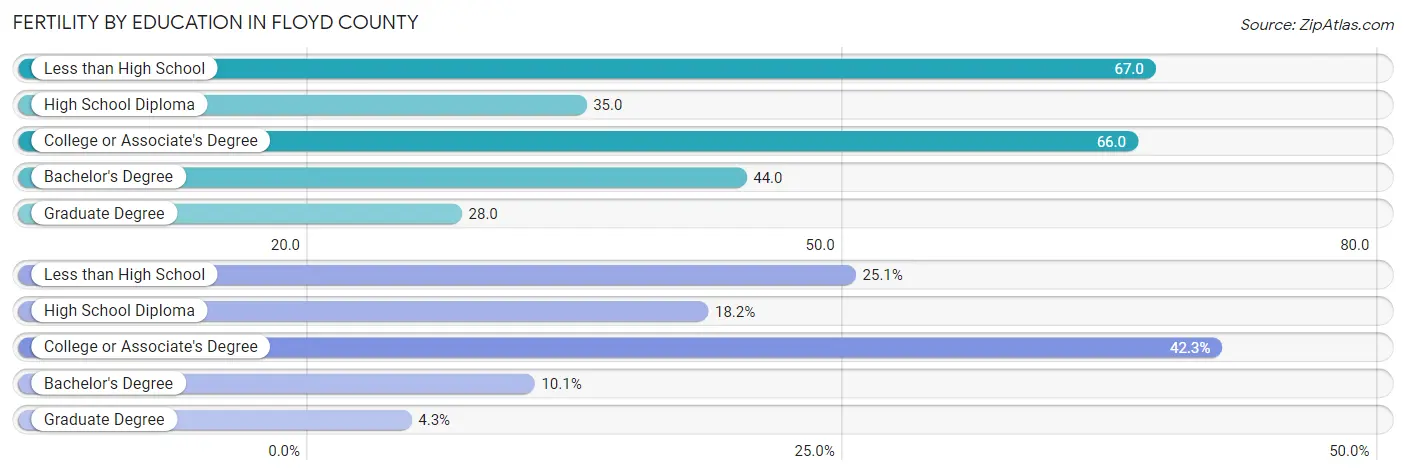
Fertility by Education in Floyd County
Average fertility rate in Floyd County is 52.0 births per 1,000 women. Women with the education attainment of less than high school have the highest fertility rate of 67.0 births per 1,000 women, while women with the education attainment of graduate degree have the lowest fertility at 28.0 births per 1,000 women. Women with the education attainment of college or associate's degree represent 42.3% of all women with births.
| Educational Attainment | Women with Births | Births / 1,000 Women |
| Less than High School | 309 (25.1%) | 67.0 |
| High School Diploma | 224 (18.2%) | 35.0 |
| College or Associate's Degree | 520 (42.3%) | 66.0 |
| Bachelor's Degree | 124 (10.1%) | 44.0 |
| Graduate Degree | 53 (4.3%) | 28.0 |
| Total | 1,230 (100.0%) | 52.0 |
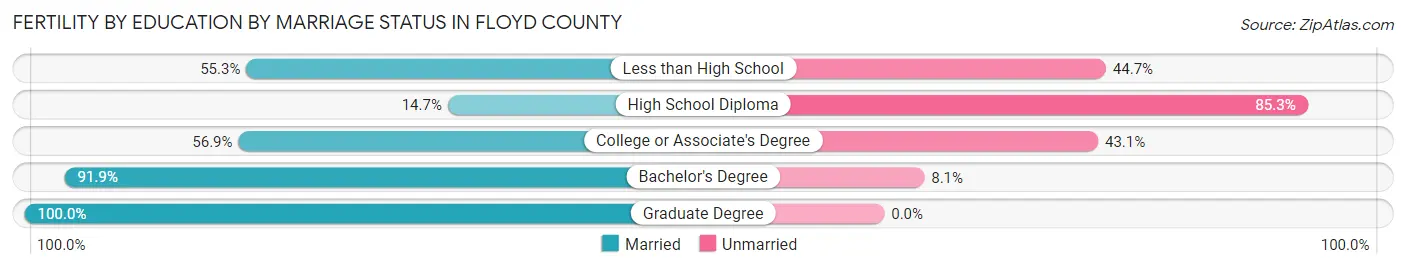
Fertility by Education by Marriage Status in Floyd County
45.8% of women with births in Floyd County are unmarried. Women with the educational attainment of graduate degree are most likely to be married with 100.0% of them married at childbirth, while women with the educational attainment of high school diploma are least likely to be married with 85.3% of them unmarried at childbirth.
| Educational Attainment | Married | Unmarried |
| Less than High School | 171 (55.3%) | 138 (44.7%) |
| High School Diploma | 33 (14.7%) | 191 (85.3%) |
| College or Associate's Degree | 296 (56.9%) | 224 (43.1%) |
| Bachelor's Degree | 114 (91.9%) | 10 (8.1%) |
| Graduate Degree | 53 (100.0%) | 0 (0.0%) |
| Total | 667 (54.2%) | 563 (45.8%) |
Income in Floyd County
Income Overview in Floyd County
Per Capita Income in Floyd County is $30,523, while median incomes of families and households are $72,134 and $57,868 respectively.
| Characteristic | Number | Measure |
| Per Capita Income | 98,541 | $30,523 |
| Median Family Income | 24,596 | $72,134 |
| Mean Family Income | 24,596 | $93,972 |
| Median Household Income | 35,996 | $57,868 |
| Mean Household Income | 35,996 | $80,139 |
| Income Deficit | 24,596 | $10,515 |
| Wage / Income Gap (%) | 98,541 | 30.74% |
| Wage / Income Gap ($) | 98,541 | 69.26¢ per $1 |
| Gini / Inequality Index | 98,541 | 0.47 |
Earnings by Sex in Floyd County
Average Earnings in Floyd County are $33,759, $39,958 for men and $27,673 for women, a difference of 30.7%.
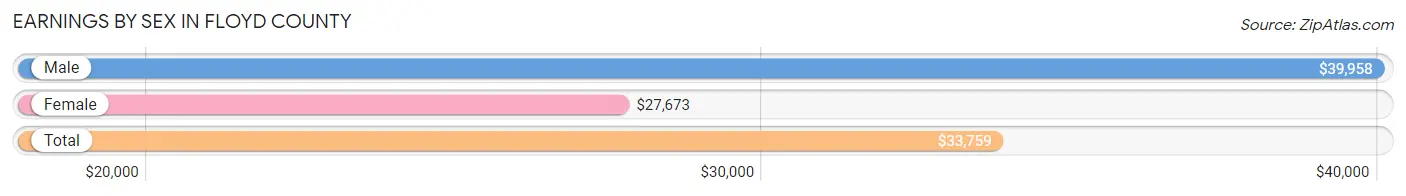
| Sex | Number | Average Earnings |
| Male | 25,483 (52.5%) | $39,958 |
| Female | 23,042 (47.5%) | $27,673 |
| Total | 48,525 (100.0%) | $33,759 |
Earnings by Sex by Income Bracket in Floyd County
The most common earnings brackets in Floyd County are $100,000+ for men (3,345 | 13.1%) and $2,499 or less for women (1,897 | 8.2%).
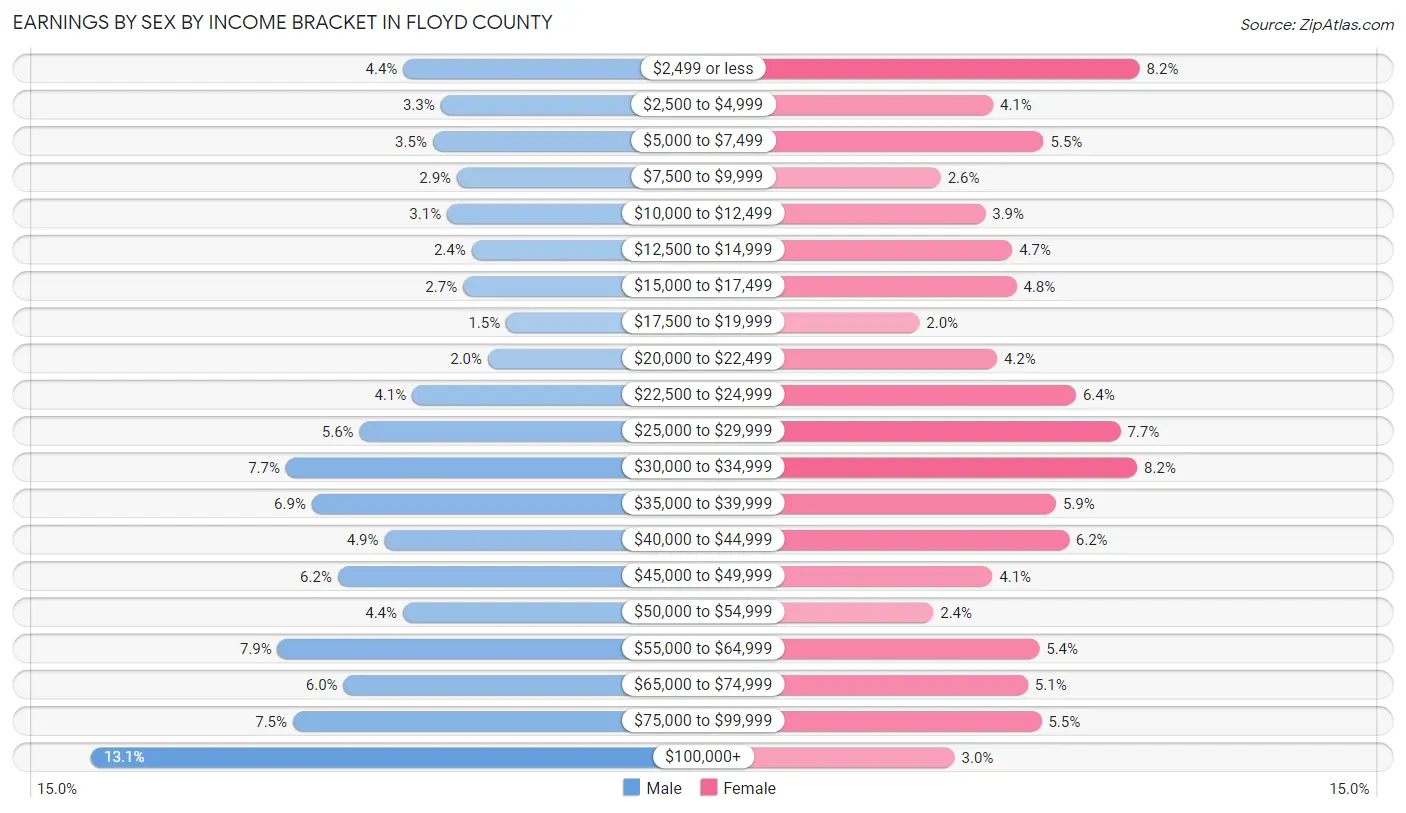
| Income | Male | Female |
| $2,499 or less | 1,111 (4.4%) | 1,897 (8.2%) |
| $2,500 to $4,999 | 843 (3.3%) | 946 (4.1%) |
| $5,000 to $7,499 | 900 (3.5%) | 1,274 (5.5%) |
| $7,500 to $9,999 | 726 (2.9%) | 609 (2.6%) |
| $10,000 to $12,499 | 797 (3.1%) | 897 (3.9%) |
| $12,500 to $14,999 | 622 (2.4%) | 1,071 (4.6%) |
| $15,000 to $17,499 | 683 (2.7%) | 1,098 (4.8%) |
| $17,500 to $19,999 | 374 (1.5%) | 470 (2.0%) |
| $20,000 to $22,499 | 505 (2.0%) | 973 (4.2%) |
| $22,500 to $24,999 | 1,047 (4.1%) | 1,484 (6.4%) |
| $25,000 to $29,999 | 1,425 (5.6%) | 1,772 (7.7%) |
| $30,000 to $34,999 | 1,952 (7.7%) | 1,881 (8.2%) |
| $35,000 to $39,999 | 1,767 (6.9%) | 1,354 (5.9%) |
| $40,000 to $44,999 | 1,245 (4.9%) | 1,437 (6.2%) |
| $45,000 to $49,999 | 1,579 (6.2%) | 942 (4.1%) |
| $50,000 to $54,999 | 1,113 (4.4%) | 559 (2.4%) |
| $55,000 to $64,999 | 2,010 (7.9%) | 1,246 (5.4%) |
| $65,000 to $74,999 | 1,539 (6.0%) | 1,172 (5.1%) |
| $75,000 to $99,999 | 1,900 (7.5%) | 1,261 (5.5%) |
| $100,000+ | 3,345 (13.1%) | 699 (3.0%) |
| Total | 25,483 (100.0%) | 23,042 (100.0%) |
Earnings by Sex by Educational Attainment in Floyd County
Average earnings in Floyd County are $45,949 for men and $32,667 for women, a difference of 28.9%. Men with an educational attainment of graduate degree enjoy the highest average annual earnings of $81,268, while those with less than high school education earn the least with $34,499. Women with an educational attainment of graduate degree earn the most with the average annual earnings of $64,012, while those with less than high school education have the smallest earnings of $21,580.
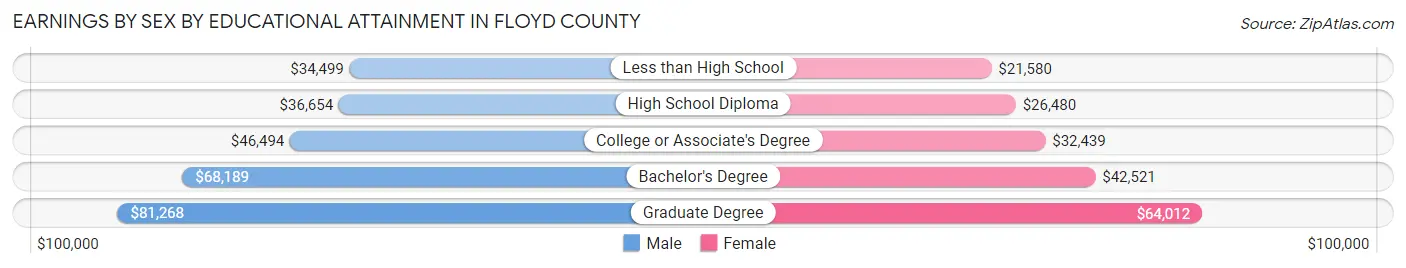
| Educational Attainment | Male Income | Female Income |
| Less than High School | $34,499 | $21,580 |
| High School Diploma | $36,654 | $26,480 |
| College or Associate's Degree | $46,494 | $32,439 |
| Bachelor's Degree | $68,189 | $42,521 |
| Graduate Degree | $81,268 | $64,012 |
| Total | $45,949 | $32,667 |
Family Income in Floyd County
Family Income Brackets in Floyd County
According to the Floyd County family income data, there are 4,649 families falling into the $100,000 to $149,999 income range, which is the most common income bracket and makes up 18.9% of all families. Conversely, the $10,000 to $14,999 income bracket is the least frequent group with only 566 families (2.3%) belonging to this category.
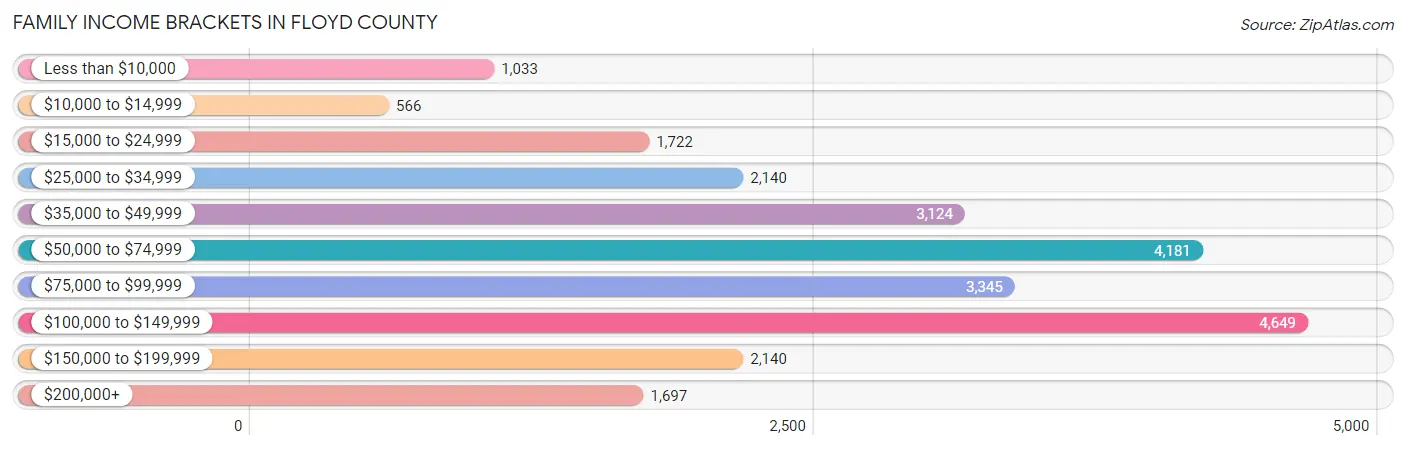
| Income Bracket | # Families | % Families |
| Less than $10,000 | 1,033 | 4.2% |
| $10,000 to $14,999 | 566 | 2.3% |
| $15,000 to $24,999 | 1,722 | 7.0% |
| $25,000 to $34,999 | 2,140 | 8.7% |
| $35,000 to $49,999 | 3,124 | 12.7% |
| $50,000 to $74,999 | 4,181 | 17.0% |
| $75,000 to $99,999 | 3,345 | 13.6% |
| $100,000 to $149,999 | 4,649 | 18.9% |
| $150,000 to $199,999 | 2,140 | 8.7% |
| $200,000+ | 1,697 | 6.9% |
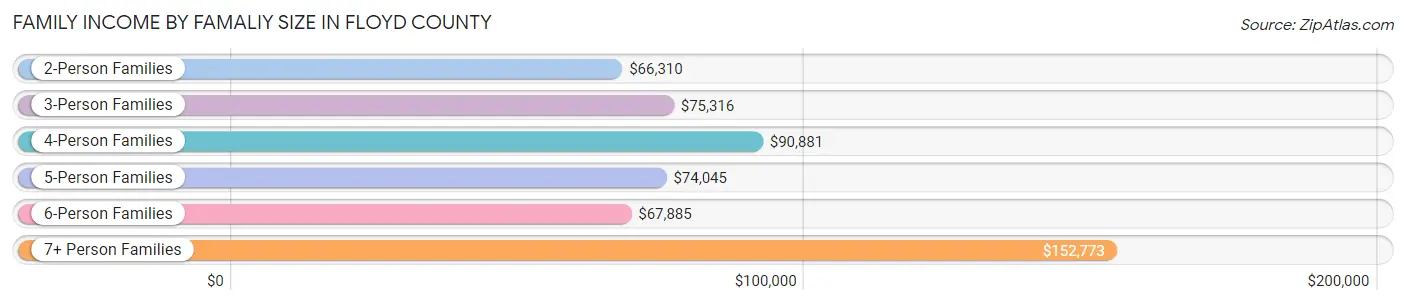
Family Income by Famaliy Size in Floyd County
7+ person families (367 | 1.5%) account for the highest median family income in Floyd County with $152,773 per family, while 2-person families (11,466 | 46.6%) have the highest median income of $33,155 per family member.
| Income Bracket | # Families | Median Income |
| 2-Person Families | 11,466 (46.6%) | $66,310 |
| 3-Person Families | 5,062 (20.6%) | $75,316 |
| 4-Person Families | 4,557 (18.5%) | $90,881 |
| 5-Person Families | 2,132 (8.7%) | $74,045 |
| 6-Person Families | 1,012 (4.1%) | $67,885 |
| 7+ Person Families | 367 (1.5%) | $152,773 |
| Total | 24,596 (100.0%) | $72,134 |
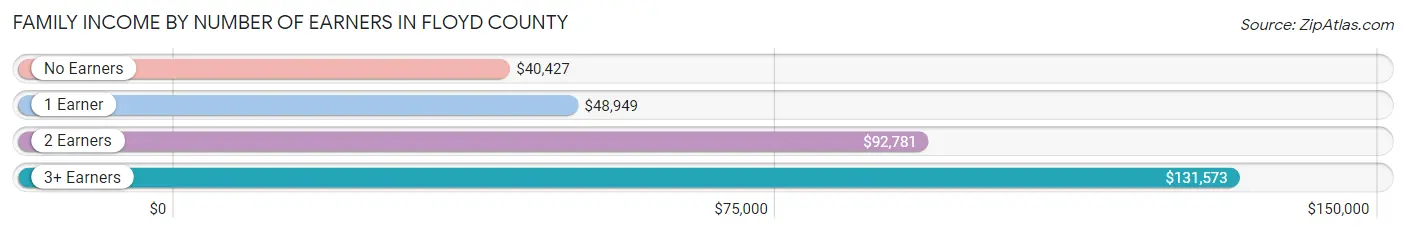
Family Income by Number of Earners in Floyd County
The median family income in Floyd County is $72,134, with families comprising 3+ earners (2,613) having the highest median family income of $131,573, while families with no earners (4,207) have the lowest median family income of $40,427, accounting for 10.6% and 17.1% of families, respectively.
| Number of Earners | # Families | Median Income |
| No Earners | 4,207 (17.1%) | $40,427 |
| 1 Earner | 8,284 (33.7%) | $48,949 |
| 2 Earners | 9,492 (38.6%) | $92,781 |
| 3+ Earners | 2,613 (10.6%) | $131,573 |
| Total | 24,596 (100.0%) | $72,134 |
Household Income in Floyd County
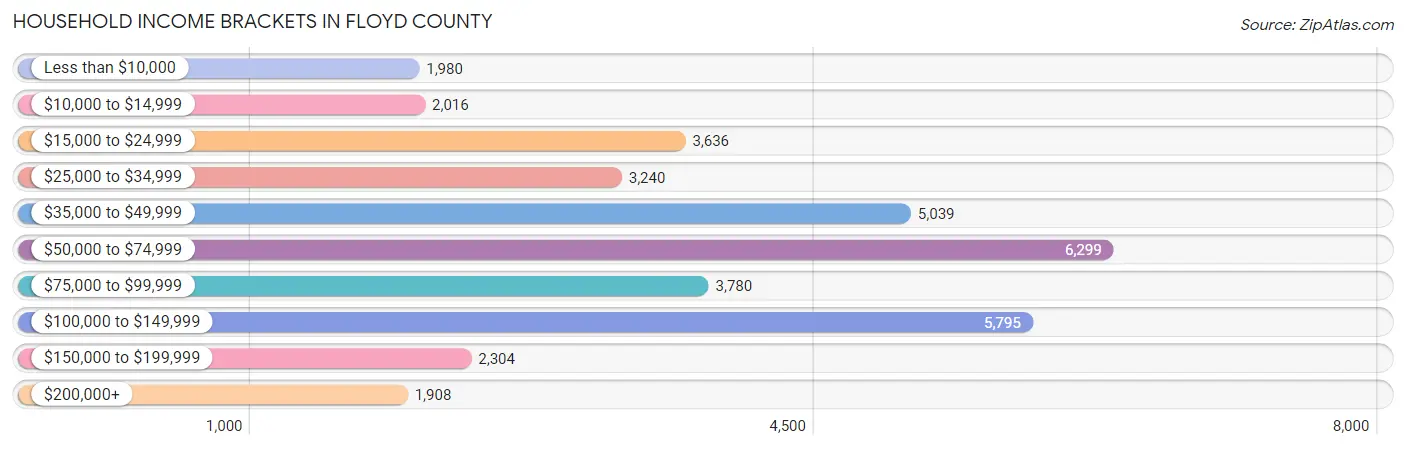
Household Income Brackets in Floyd County
With 6,299 households falling in the category, the $50,000 to $74,999 income range is the most frequent in Floyd County, accounting for 17.5% of all households. In contrast, only 1,908 households (5.3%) fall into the $200,000+ income bracket, making it the least populous group.
| Income Bracket | # Households | % Households |
| Less than $10,000 | 1,980 | 5.5% |
| $10,000 to $14,999 | 2,016 | 5.6% |
| $15,000 to $24,999 | 3,636 | 10.1% |
| $25,000 to $34,999 | 3,240 | 9.0% |
| $35,000 to $49,999 | 5,039 | 14.0% |
| $50,000 to $74,999 | 6,299 | 17.5% |
| $75,000 to $99,999 | 3,780 | 10.5% |
| $100,000 to $149,999 | 5,795 | 16.1% |
| $150,000 to $199,999 | 2,304 | 6.4% |
| $200,000+ | 1,908 | 5.3% |
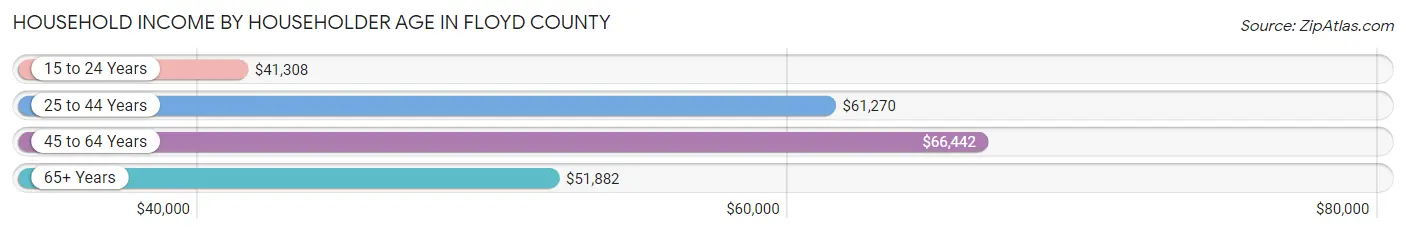
Household Income by Householder Age in Floyd County
The median household income in Floyd County is $57,868, with the highest median household income of $66,442 found in the 45 to 64 years age bracket for the primary householder. A total of 13,223 households (36.7%) fall into this category. Meanwhile, the 15 to 24 years age bracket for the primary householder has the lowest median household income of $41,308, with 1,728 households (4.8%) in this group.
| Income Bracket | # Households | Median Income |
| 15 to 24 Years | 1,728 (4.8%) | $41,308 |
| 25 to 44 Years | 10,952 (30.4%) | $61,270 |
| 45 to 64 Years | 13,223 (36.7%) | $66,442 |
| 65+ Years | 10,093 (28.0%) | $51,882 |
| Total | 35,996 (100.0%) | $57,868 |
Poverty in Floyd County
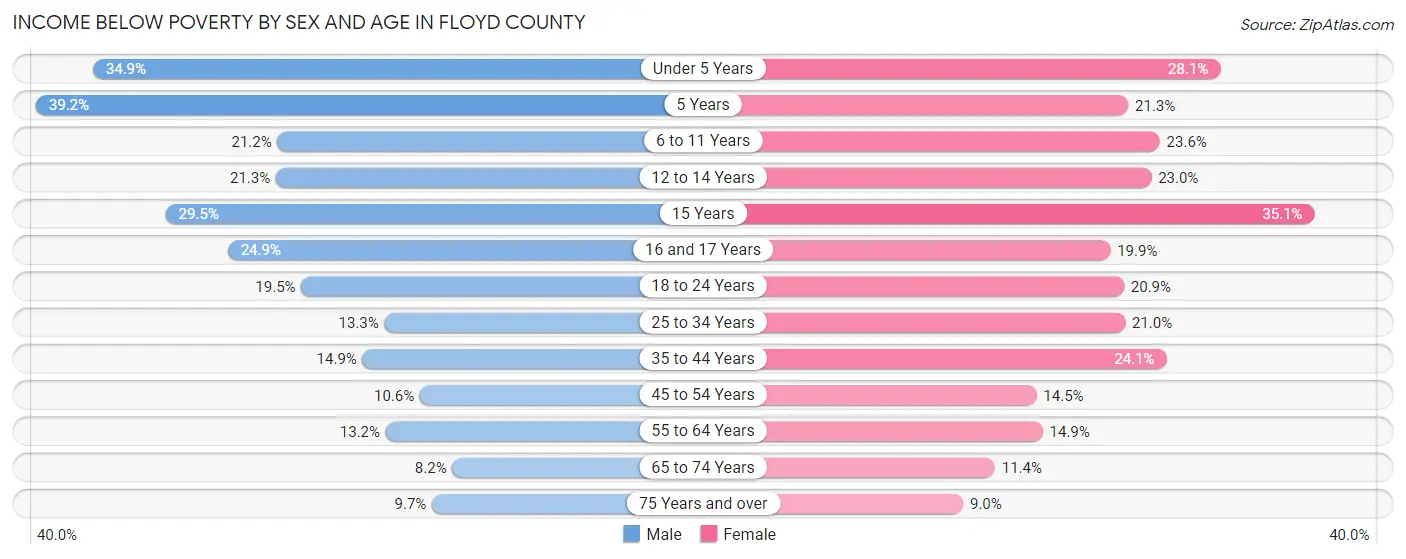
Income Below Poverty by Sex and Age in Floyd County
With 16.3% poverty level for males and 18.7% for females among the residents of Floyd County, 5 year old males and 15 year old females are the most vulnerable to poverty, with 251 males (39.2%) and 226 females (35.1%) in their respective age groups living below the poverty level.
| Age Bracket | Male | Female |
| Under 5 Years | 1,018 (34.9%) | 732 (28.1%) |
| 5 Years | 251 (39.2%) | 118 (21.3%) |
| 6 to 11 Years | 778 (21.2%) | 883 (23.6%) |
| 12 to 14 Years | 420 (21.3%) | 422 (23.0%) |
| 15 Years | 225 (29.5%) | 226 (35.1%) |
| 16 and 17 Years | 321 (24.9%) | 239 (19.9%) |
| 18 to 24 Years | 821 (19.5%) | 939 (20.9%) |
| 25 to 34 Years | 822 (13.3%) | 1,255 (21.0%) |
| 35 to 44 Years | 838 (14.9%) | 1,487 (24.1%) |
| 45 to 54 Years | 639 (10.6%) | 866 (14.4%) |
| 55 to 64 Years | 790 (13.2%) | 938 (14.9%) |
| 65 to 74 Years | 367 (8.2%) | 572 (11.4%) |
| 75 Years and over | 248 (9.7%) | 319 (9.0%) |
| Total | 7,538 (16.3%) | 8,996 (18.7%) |
Income Above Poverty by Sex and Age in Floyd County
According to the poverty statistics in Floyd County, males aged 65 to 74 years and females aged 75 years and over are the age groups that are most secure financially, with 91.8% of males and 91.0% of females in these age groups living above the poverty line.
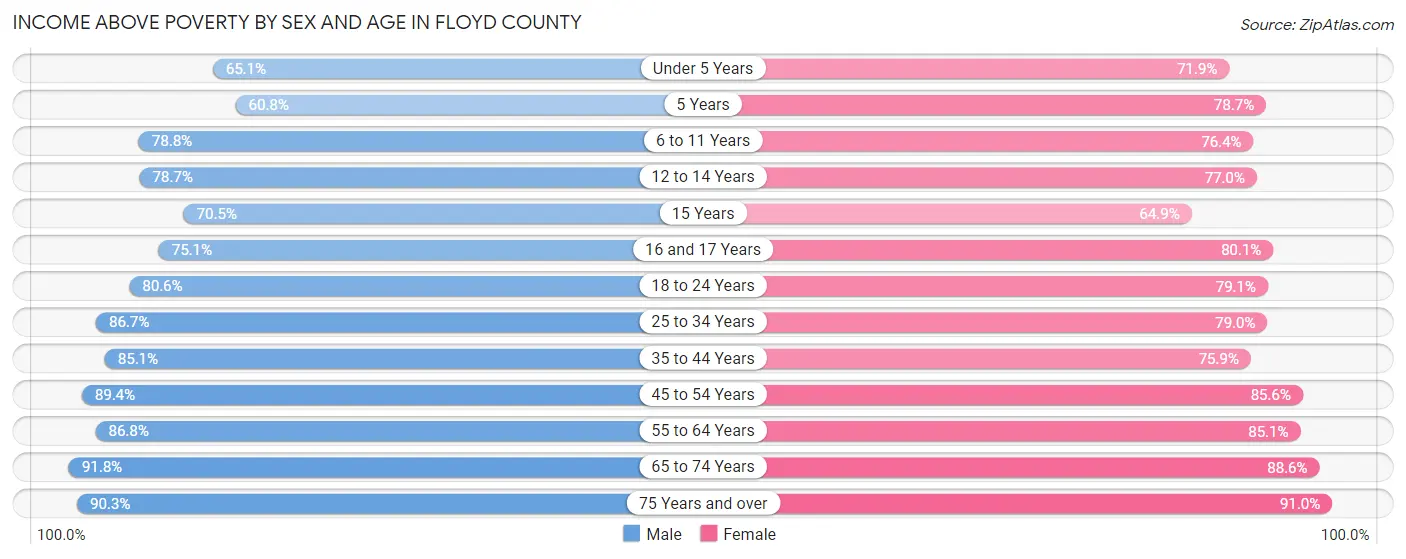
| Age Bracket | Male | Female |
| Under 5 Years | 1,896 (65.1%) | 1,874 (71.9%) |
| 5 Years | 390 (60.8%) | 437 (78.7%) |
| 6 to 11 Years | 2,889 (78.8%) | 2,858 (76.4%) |
| 12 to 14 Years | 1,549 (78.7%) | 1,415 (77.0%) |
| 15 Years | 537 (70.5%) | 418 (64.9%) |
| 16 and 17 Years | 967 (75.1%) | 960 (80.1%) |
| 18 to 24 Years | 3,400 (80.5%) | 3,546 (79.1%) |
| 25 to 34 Years | 5,371 (86.7%) | 4,712 (79.0%) |
| 35 to 44 Years | 4,785 (85.1%) | 4,683 (75.9%) |
| 45 to 54 Years | 5,364 (89.4%) | 5,126 (85.6%) |
| 55 to 64 Years | 5,202 (86.8%) | 5,352 (85.1%) |
| 65 to 74 Years | 4,092 (91.8%) | 4,465 (88.6%) |
| 75 Years and over | 2,298 (90.3%) | 3,227 (91.0%) |
| Total | 38,740 (83.7%) | 39,073 (81.3%) |
Income Below Poverty Among Married-Couple Families in Floyd County
The poverty statistics for married-couple families in Floyd County show that 5.6% or 950 of the total 17,110 families live below the poverty line. Families with 3 or 4 children have the highest poverty rate of 19.3%, comprising of 312 families. On the other hand, families with 5 or more children have the lowest poverty rate of 1.2%, which includes 2 families.
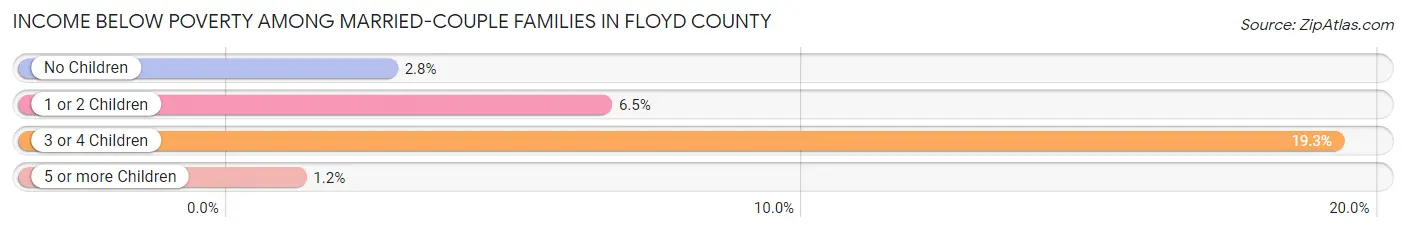
| Children | Above Poverty | Below Poverty |
| No Children | 9,417 (97.2%) | 269 (2.8%) |
| 1 or 2 Children | 5,268 (93.5%) | 367 (6.5%) |
| 3 or 4 Children | 1,309 (80.7%) | 312 (19.3%) |
| 5 or more Children | 166 (98.8%) | 2 (1.2%) |
| Total | 16,160 (94.5%) | 950 (5.6%) |
Income Below Poverty Among Single-Parent Households in Floyd County
According to the poverty data in Floyd County, 14.1% or 252 single-father households and 35.5% or 2,028 single-mother households are living below the poverty line. Among single-father households, those with 3 or 4 children have the highest poverty rate, with 16 households (55.2%) experiencing poverty. Likewise, among single-mother households, those with 5 or more children have the highest poverty rate, with 141 households (100.0%) falling below the poverty line.
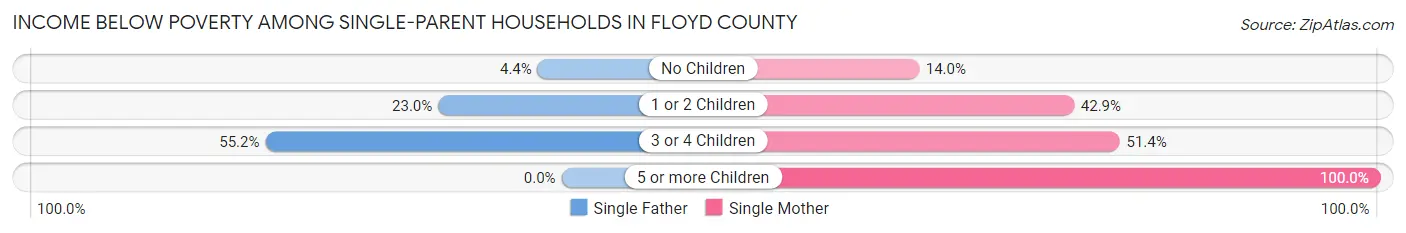
| Children | Single Father | Single Mother |
| No Children | 40 (4.4%) | 274 (14.0%) |
| 1 or 2 Children | 196 (23.0%) | 1,207 (42.9%) |
| 3 or 4 Children | 16 (55.2%) | 406 (51.4%) |
| 5 or more Children | 0 (0.0%) | 141 (100.0%) |
| Total | 252 (14.1%) | 2,028 (35.5%) |
Income Below Poverty Among Married-Couple vs Single-Parent Households in Floyd County
The poverty data for Floyd County shows that 950 of the married-couple family households (5.6%) and 2,280 of the single-parent households (30.5%) are living below the poverty level. Within the married-couple family households, those with 3 or 4 children have the highest poverty rate, with 312 households (19.3%) falling below the poverty line. Among the single-parent households, those with 5 or more children have the highest poverty rate, with 141 household (100.0%) living below poverty.
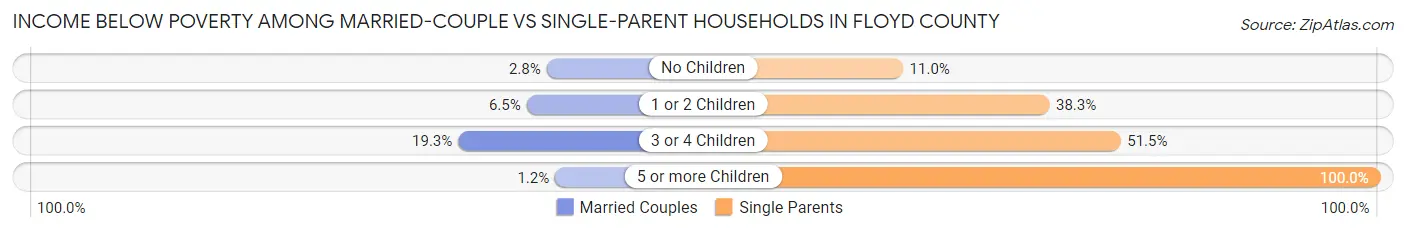
| Children | Married-Couple Families | Single-Parent Households |
| No Children | 269 (2.8%) | 314 (11.0%) |
| 1 or 2 Children | 367 (6.5%) | 1,403 (38.3%) |
| 3 or 4 Children | 312 (19.3%) | 422 (51.5%) |
| 5 or more Children | 2 (1.2%) | 141 (100.0%) |
| Total | 950 (5.6%) | 2,280 (30.5%) |
Employment Characteristics in Floyd County
Employment by Class of Employer in Floyd County
Among the 42,651 employed individuals in Floyd County, private company employees (30,144 | 70.7%), local government employees (3,124 | 7.3%), and not-for-profit organizations (3,075 | 7.2%) make up the most common classes of employment.
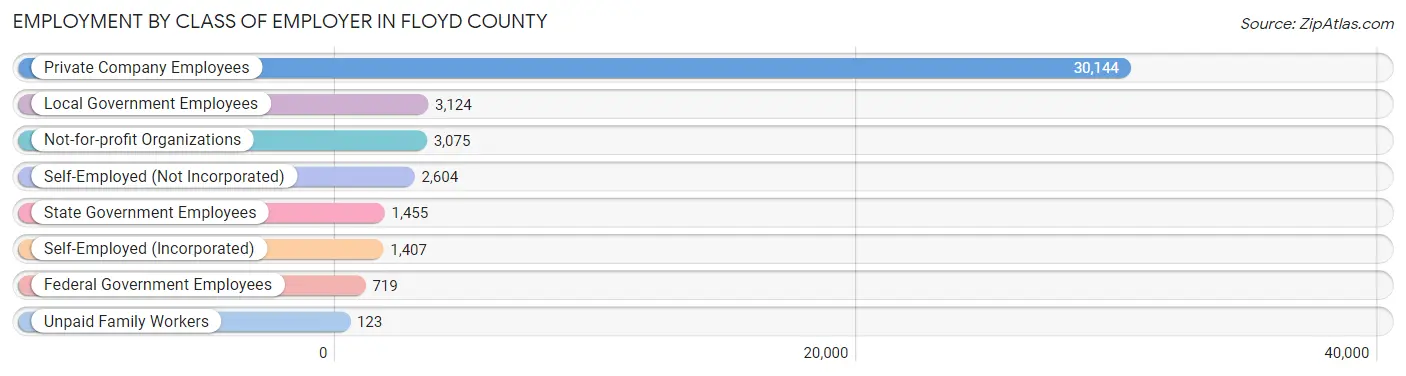
| Employer Class | # Employees | % Employees |
| Private Company Employees | 30,144 | 70.7% |
| Self-Employed (Incorporated) | 1,407 | 3.3% |
| Self-Employed (Not Incorporated) | 2,604 | 6.1% |
| Not-for-profit Organizations | 3,075 | 7.2% |
| Local Government Employees | 3,124 | 7.3% |
| State Government Employees | 1,455 | 3.4% |
| Federal Government Employees | 719 | 1.7% |
| Unpaid Family Workers | 123 | 0.3% |
| Total | 42,651 | 100.0% |
Employment Status by Age in Floyd County
According to the labor force statistics for Floyd County, out of the total population over 16 years of age (78,821), 57.8% or 45,559 individuals are in the labor force, with 4.1% or 1,868 of them unemployed. The age group with the highest labor force participation rate is 30 to 34 years, with 79.6% or 4,825 individuals in the labor force. Within the labor force, the 16 to 19 years age range has the highest percentage of unemployed individuals, with 15.1% or 386 of them being unemployed.
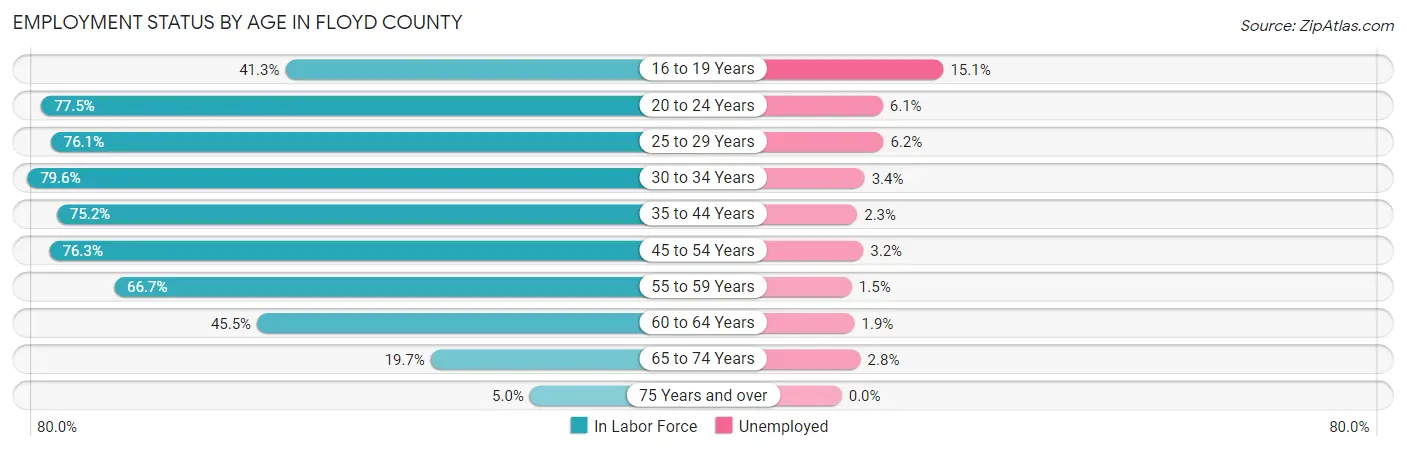
| Age Bracket | In Labor Force | Unemployed |
| 16 to 19 Years | 2,556 (41.3%) | 386 (15.1%) |
| 20 to 24 Years | 5,510 (77.5%) | 336 (6.1%) |
| 25 to 29 Years | 4,911 (76.1%) | 304 (6.2%) |
| 30 to 34 Years | 4,825 (79.6%) | 164 (3.4%) |
| 35 to 44 Years | 9,105 (75.2%) | 209 (2.3%) |
| 45 to 54 Years | 9,328 (76.3%) | 298 (3.2%) |
| 55 to 59 Years | 4,592 (66.7%) | 69 (1.5%) |
| 60 to 64 Years | 2,504 (45.5%) | 48 (1.9%) |
| 65 to 74 Years | 1,885 (19.7%) | 53 (2.8%) |
| 75 Years and over | 336 (5.0%) | 0 (0.0%) |
| Total | 45,559 (57.8%) | 1,868 (4.1%) |
Employment Status by Educational Attainment in Floyd County
According to labor force statistics for Floyd County, 71.6% of individuals (35,254) out of the total population between 25 and 64 years of age (49,237) are in the labor force, with 3.1% or 1,093 of them being unemployed. The group with the highest labor force participation rate are those with the educational attainment of bachelor's degree or higher, with 85.6% or 9,362 individuals in the labor force. Within the labor force, individuals with high school diploma education have the highest percentage of unemployment, with 4.6% or 488 of them being unemployed.
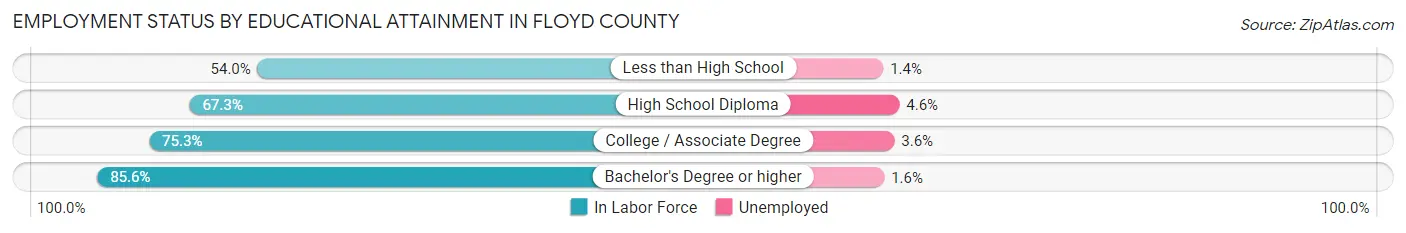
| Educational Attainment | In Labor Force | Unemployed |
| Less than High School | 4,252 (54.0%) | 110 (1.4%) |
| High School Diploma | 10,619 (67.3%) | 726 (4.6%) |
| College / Associate Degree | 11,028 (75.3%) | 527 (3.6%) |
| Bachelor's Degree or higher | 9,362 (85.6%) | 175 (1.6%) |
| Total | 35,254 (71.6%) | 1,526 (3.1%) |
Employment Occupations by Sex in Floyd County
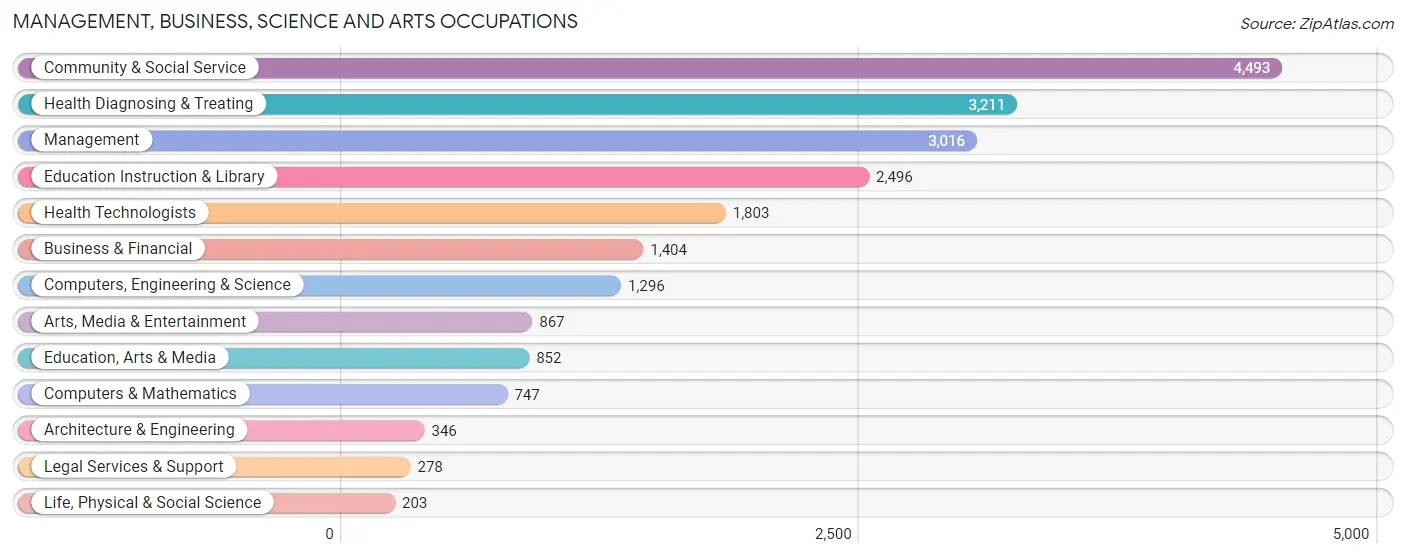
Management, Business, Science and Arts Occupations
The most common Management, Business, Science and Arts occupations in Floyd County are Community & Social Service (4,493 | 10.3%), Health Diagnosing & Treating (3,211 | 7.4%), Management (3,016 | 6.9%), Education Instruction & Library (2,496 | 5.7%), and Health Technologists (1,803 | 4.1%).
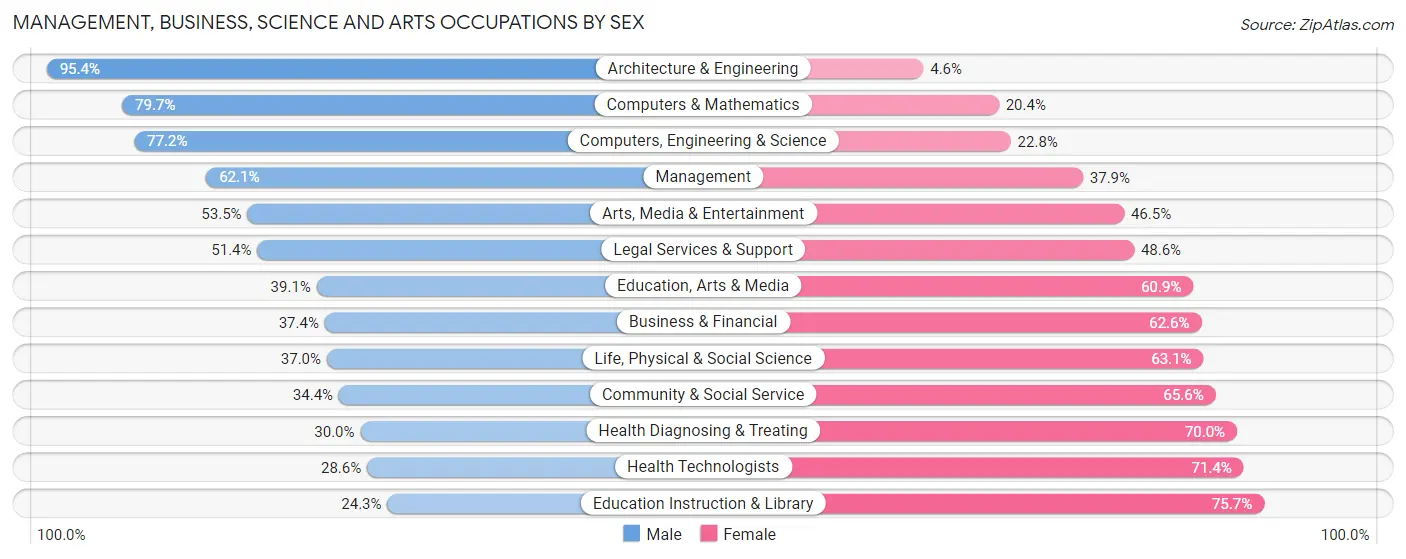
Management, Business, Science and Arts Occupations by Sex
Within the Management, Business, Science and Arts occupations in Floyd County, the most male-oriented occupations are Architecture & Engineering (95.4%), Computers & Mathematics (79.6%), and Computers, Engineering & Science (77.2%), while the most female-oriented occupations are Education Instruction & Library (75.7%), Health Technologists (71.4%), and Health Diagnosing & Treating (70.0%).
| Occupation | Male | Female |
| Management | 1,873 (62.1%) | 1,143 (37.9%) |
| Business & Financial | 525 (37.4%) | 879 (62.6%) |
| Computers, Engineering & Science | 1,000 (77.2%) | 296 (22.8%) |
| Computers & Mathematics | 595 (79.6%) | 152 (20.3%) |
| Architecture & Engineering | 330 (95.4%) | 16 (4.6%) |
| Life, Physical & Social Science | 75 (36.9%) | 128 (63.0%) |
| Community & Social Service | 1,547 (34.4%) | 2,946 (65.6%) |
| Education, Arts & Media | 333 (39.1%) | 519 (60.9%) |
| Legal Services & Support | 143 (51.4%) | 135 (48.6%) |
| Education Instruction & Library | 607 (24.3%) | 1,889 (75.7%) |
| Arts, Media & Entertainment | 464 (53.5%) | 403 (46.5%) |
| Health Diagnosing & Treating | 962 (30.0%) | 2,249 (70.0%) |
| Health Technologists | 515 (28.6%) | 1,288 (71.4%) |
| Total (Category) | 5,907 (44.0%) | 7,513 (56.0%) |
| Total (Overall) | 22,787 (52.2%) | 20,829 (47.8%) |
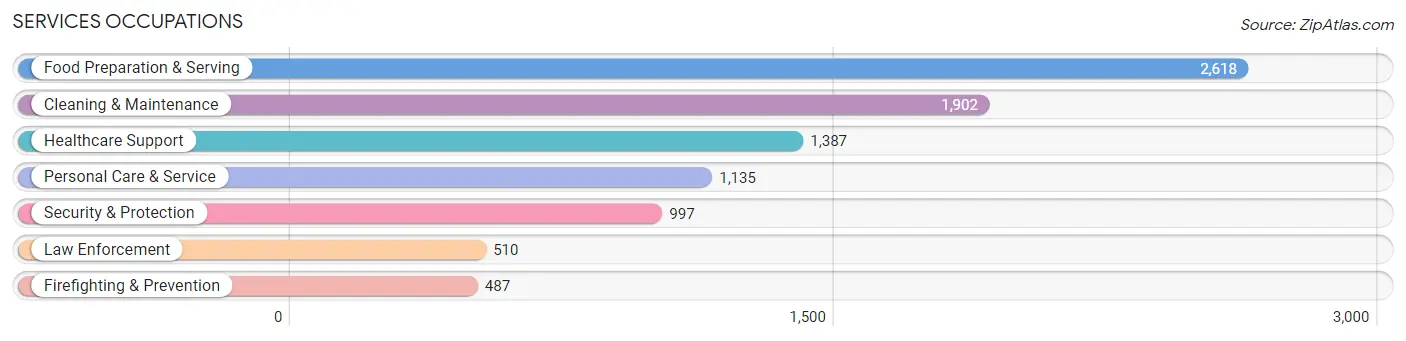
Services Occupations
The most common Services occupations in Floyd County are Food Preparation & Serving (2,618 | 6.0%), Cleaning & Maintenance (1,902 | 4.4%), Healthcare Support (1,387 | 3.2%), Personal Care & Service (1,135 | 2.6%), and Security & Protection (997 | 2.3%).
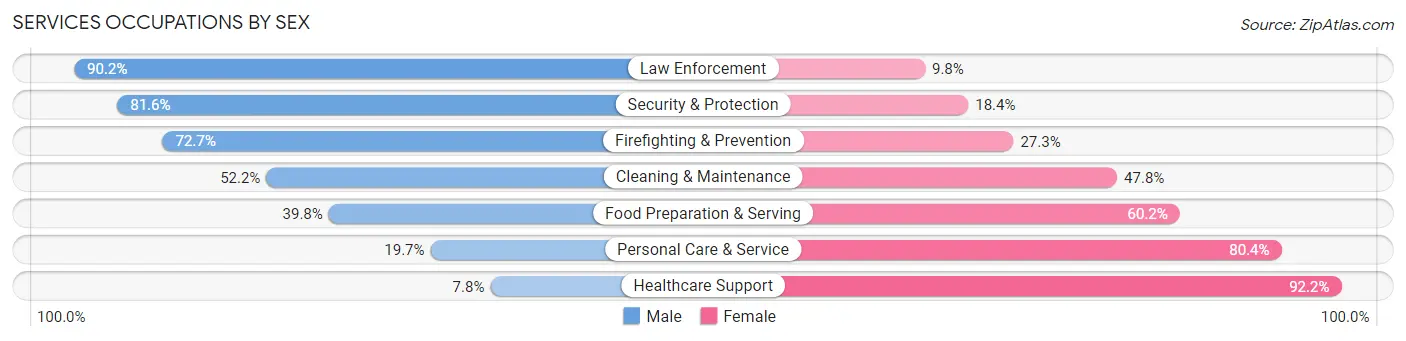
Services Occupations by Sex
Within the Services occupations in Floyd County, the most male-oriented occupations are Law Enforcement (90.2%), Security & Protection (81.6%), and Firefighting & Prevention (72.7%), while the most female-oriented occupations are Healthcare Support (92.2%), Personal Care & Service (80.3%), and Food Preparation & Serving (60.2%).
| Occupation | Male | Female |
| Healthcare Support | 108 (7.8%) | 1,279 (92.2%) |
| Security & Protection | 814 (81.6%) | 183 (18.4%) |
| Firefighting & Prevention | 354 (72.7%) | 133 (27.3%) |
| Law Enforcement | 460 (90.2%) | 50 (9.8%) |
| Food Preparation & Serving | 1,042 (39.8%) | 1,576 (60.2%) |
| Cleaning & Maintenance | 992 (52.2%) | 910 (47.8%) |
| Personal Care & Service | 223 (19.7%) | 912 (80.3%) |
| Total (Category) | 3,179 (39.5%) | 4,860 (60.5%) |
| Total (Overall) | 22,787 (52.2%) | 20,829 (47.8%) |
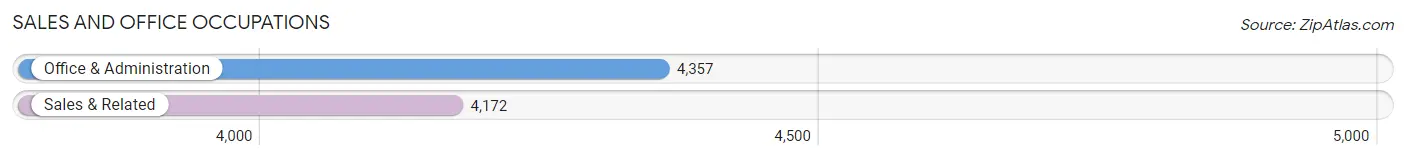
Sales and Office Occupations
The most common Sales and Office occupations in Floyd County are Office & Administration (4,357 | 10.0%), and Sales & Related (4,172 | 9.6%).
Sales and Office Occupations by Sex
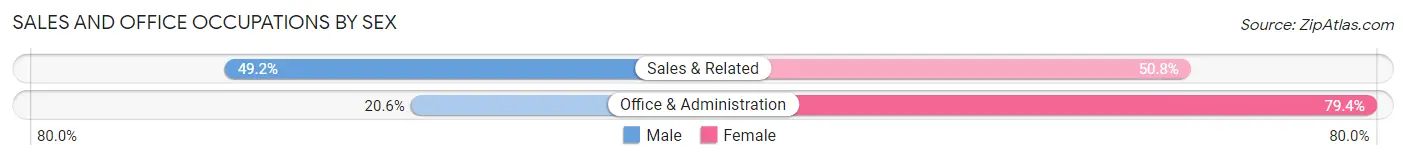
| Occupation | Male | Female |
| Sales & Related | 2,053 (49.2%) | 2,119 (50.8%) |
| Office & Administration | 898 (20.6%) | 3,459 (79.4%) |
| Total (Category) | 2,951 (34.6%) | 5,578 (65.4%) |
| Total (Overall) | 22,787 (52.2%) | 20,829 (47.8%) |
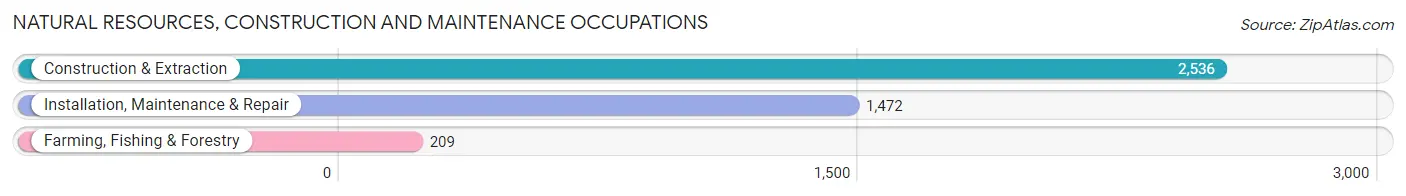
Natural Resources, Construction and Maintenance Occupations
The most common Natural Resources, Construction and Maintenance occupations in Floyd County are Construction & Extraction (2,536 | 5.8%), Installation, Maintenance & Repair (1,472 | 3.4%), and Farming, Fishing & Forestry (209 | 0.5%).
Natural Resources, Construction and Maintenance Occupations by Sex
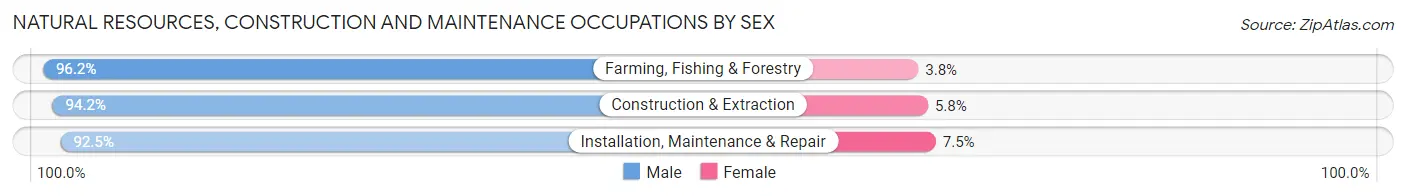
| Occupation | Male | Female |
| Farming, Fishing & Forestry | 201 (96.2%) | 8 (3.8%) |
| Construction & Extraction | 2,388 (94.2%) | 148 (5.8%) |
| Installation, Maintenance & Repair | 1,362 (92.5%) | 110 (7.5%) |
| Total (Category) | 3,951 (93.7%) | 266 (6.3%) |
| Total (Overall) | 22,787 (52.2%) | 20,829 (47.8%) |
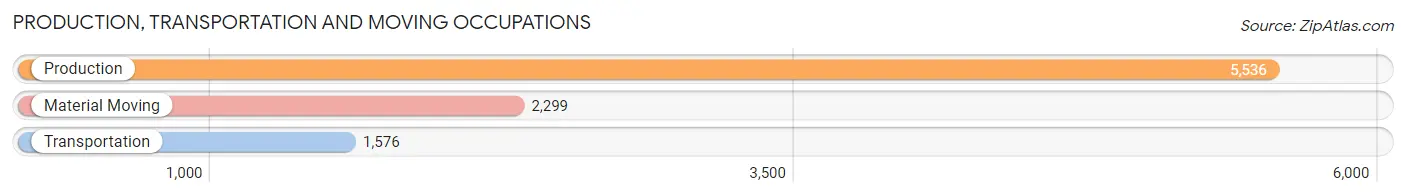
Production, Transportation and Moving Occupations
The most common Production, Transportation and Moving occupations in Floyd County are Production (5,536 | 12.7%), Material Moving (2,299 | 5.3%), and Transportation (1,576 | 3.6%).
Production, Transportation and Moving Occupations by Sex
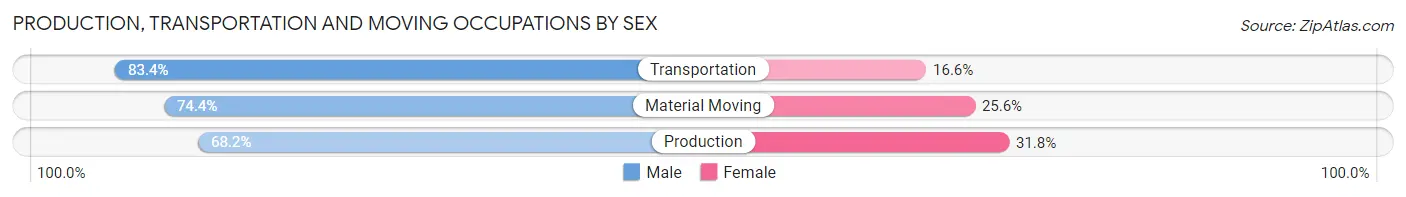
| Occupation | Male | Female |
| Production | 3,774 (68.2%) | 1,762 (31.8%) |
| Transportation | 1,314 (83.4%) | 262 (16.6%) |
| Material Moving | 1,711 (74.4%) | 588 (25.6%) |
| Total (Category) | 6,799 (72.3%) | 2,612 (27.8%) |
| Total (Overall) | 22,787 (52.2%) | 20,829 (47.8%) |
Employment Industries by Sex in Floyd County
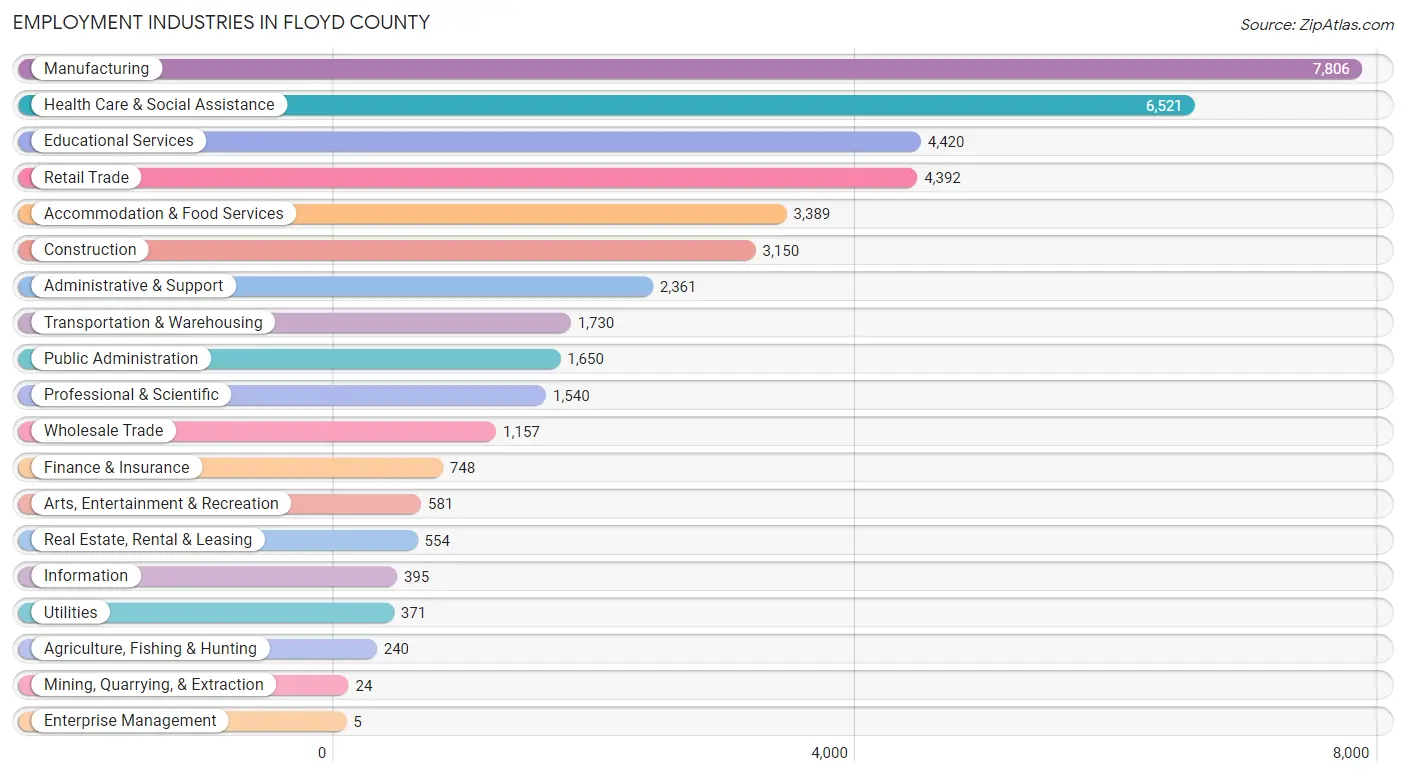
Employment Industries in Floyd County
The major employment industries in Floyd County include Manufacturing (7,806 | 17.9%), Health Care & Social Assistance (6,521 | 14.9%), Educational Services (4,420 | 10.1%), Retail Trade (4,392 | 10.1%), and Accommodation & Food Services (3,389 | 7.8%).
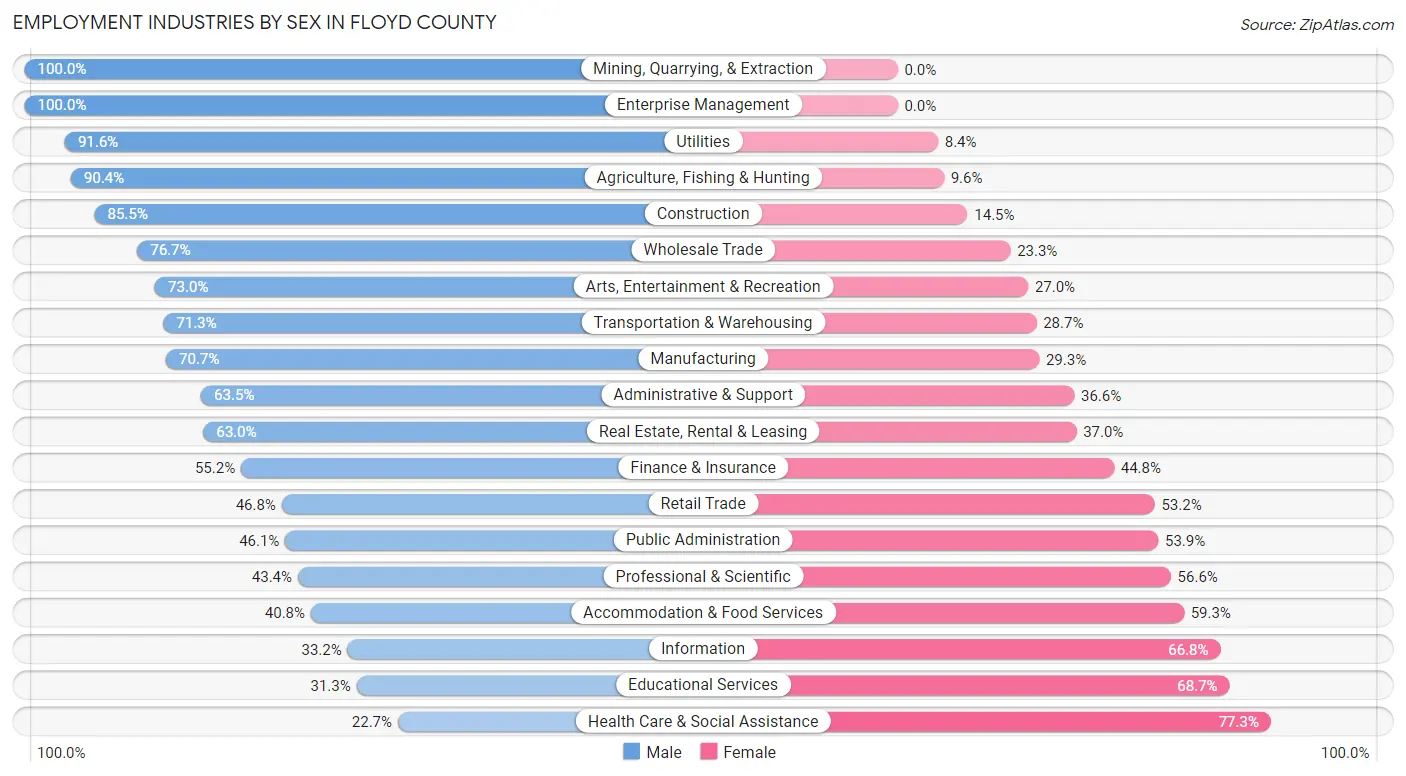
Employment Industries by Sex in Floyd County
The Floyd County industries that see more men than women are Mining, Quarrying, & Extraction (100.0%), Enterprise Management (100.0%), and Utilities (91.6%), whereas the industries that tend to have a higher number of women are Health Care & Social Assistance (77.3%), Educational Services (68.7%), and Information (66.8%).
| Industry | Male | Female |
| Agriculture, Fishing & Hunting | 217 (90.4%) | 23 (9.6%) |
| Mining, Quarrying, & Extraction | 24 (100.0%) | 0 (0.0%) |
| Construction | 2,694 (85.5%) | 456 (14.5%) |
| Manufacturing | 5,519 (70.7%) | 2,287 (29.3%) |
| Wholesale Trade | 887 (76.7%) | 270 (23.3%) |
| Retail Trade | 2,055 (46.8%) | 2,337 (53.2%) |
| Transportation & Warehousing | 1,233 (71.3%) | 497 (28.7%) |
| Utilities | 340 (91.6%) | 31 (8.4%) |
| Information | 131 (33.2%) | 264 (66.8%) |
| Finance & Insurance | 413 (55.2%) | 335 (44.8%) |
| Real Estate, Rental & Leasing | 349 (63.0%) | 205 (37.0%) |
| Professional & Scientific | 669 (43.4%) | 871 (56.6%) |
| Enterprise Management | 5 (100.0%) | 0 (0.0%) |
| Administrative & Support | 1,498 (63.4%) | 863 (36.5%) |
| Educational Services | 1,383 (31.3%) | 3,037 (68.7%) |
| Health Care & Social Assistance | 1,483 (22.7%) | 5,038 (77.3%) |
| Arts, Entertainment & Recreation | 424 (73.0%) | 157 (27.0%) |
| Accommodation & Food Services | 1,381 (40.7%) | 2,008 (59.3%) |
| Public Administration | 760 (46.1%) | 890 (53.9%) |
| Total | 22,787 (52.2%) | 20,829 (47.8%) |
Education in Floyd County
School Enrollment in Floyd County
The most common levels of schooling among the 24,198 students in Floyd County are college / undergraduate (6,012 | 24.8%), middle school (5,298 | 21.9%), and elementary school (4,749 | 19.6%).
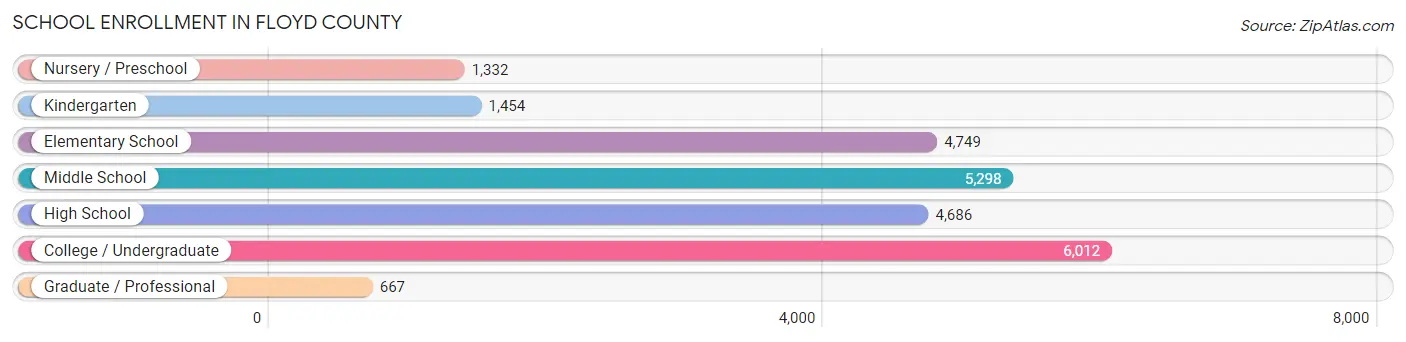
| School Level | # Students | % Students |
| Nursery / Preschool | 1,332 | 5.5% |
| Kindergarten | 1,454 | 6.0% |
| Elementary School | 4,749 | 19.6% |
| Middle School | 5,298 | 21.9% |
| High School | 4,686 | 19.4% |
| College / Undergraduate | 6,012 | 24.8% |
| Graduate / Professional | 667 | 2.8% |
| Total | 24,198 | 100.0% |
School Enrollment by Age by Funding Source in Floyd County
Out of a total of 24,198 students who are enrolled in schools in Floyd County, 5,057 (20.9%) attend a private institution, while the remaining 19,141 (79.1%) are enrolled in public schools. The age group of 18 to 19 year olds has the highest likelihood of being enrolled in private schools, with 954 (37.4% in the age bracket) enrolled. Conversely, the age group of 15 to 17 year olds has the lowest likelihood of being enrolled in a private school, with 3,243 (88.7% in the age bracket) attending a public institution.
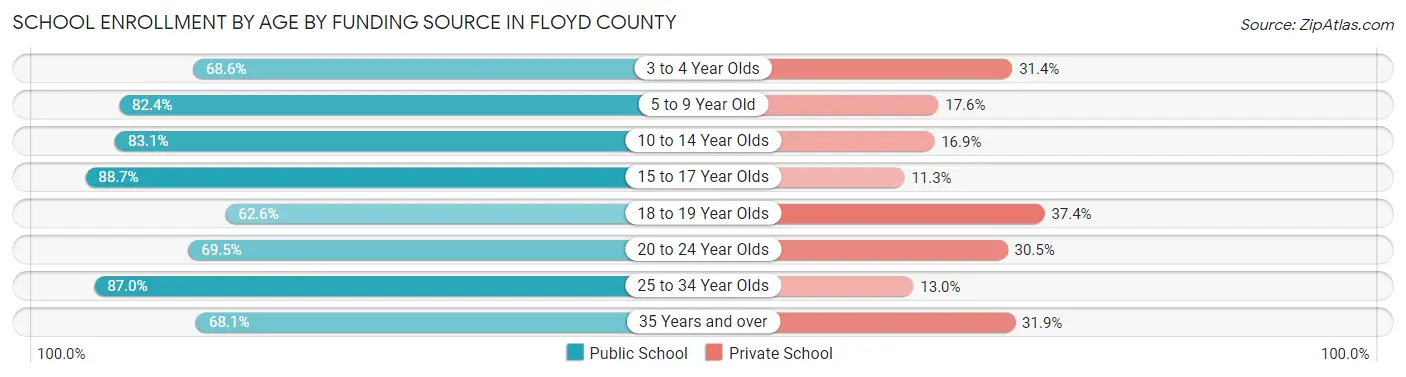
| Age Bracket | Public School | Private School |
| 3 to 4 Year Olds | 706 (68.6%) | 323 (31.4%) |
| 5 to 9 Year Old | 4,889 (82.4%) | 1,046 (17.6%) |
| 10 to 14 Year Olds | 5,121 (83.1%) | 1,039 (16.9%) |
| 15 to 17 Year Olds | 3,243 (88.7%) | 414 (11.3%) |
| 18 to 19 Year Olds | 1,597 (62.6%) | 954 (37.4%) |
| 20 to 24 Year Olds | 1,992 (69.5%) | 875 (30.5%) |
| 25 to 34 Year Olds | 1,012 (87.0%) | 151 (13.0%) |
| 35 Years and over | 569 (68.1%) | 267 (31.9%) |
| Total | 19,141 (79.1%) | 5,057 (20.9%) |
Educational Attainment by Field of Study in Floyd County
Business (3,027 | 19.6%), education (2,992 | 19.4%), science & technology (1,659 | 10.7%), bio, nature & agricultural (1,308 | 8.5%), and arts & humanities (904 | 5.9%) are the most common fields of study among 15,452 individuals in Floyd County who have obtained a bachelor's degree or higher.
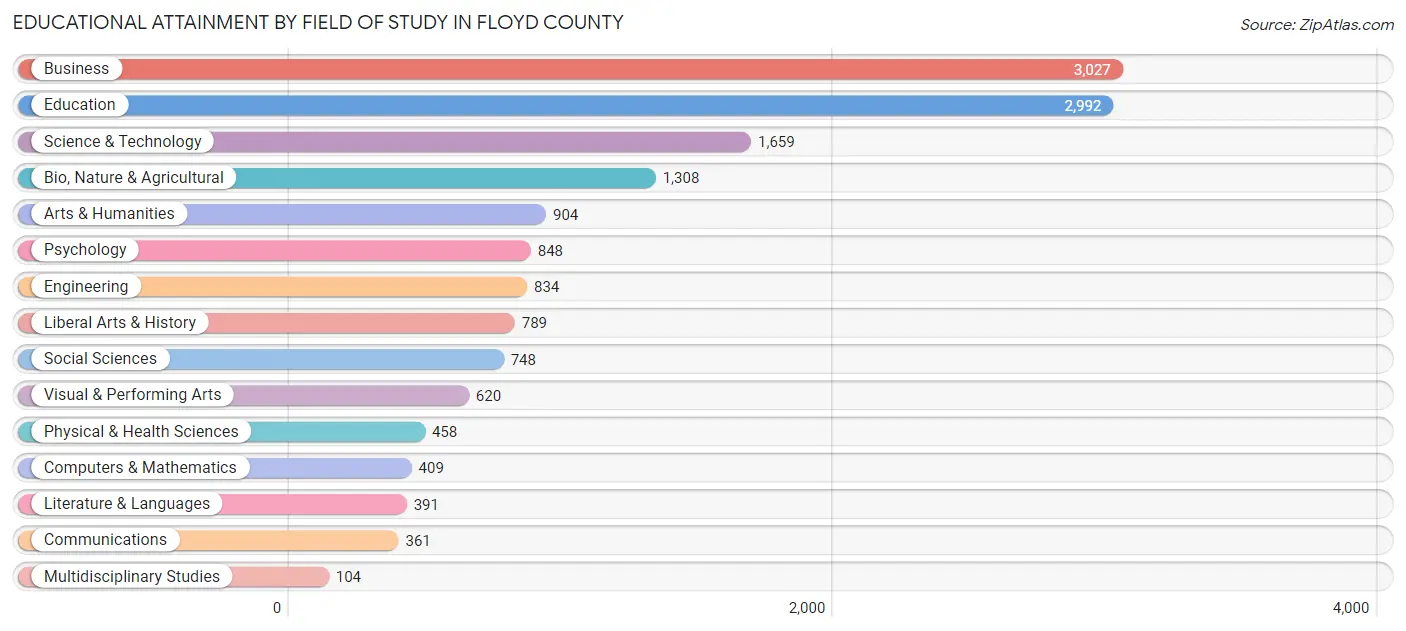
| Field of Study | # Graduates | % Graduates |
| Computers & Mathematics | 409 | 2.6% |
| Bio, Nature & Agricultural | 1,308 | 8.5% |
| Physical & Health Sciences | 458 | 3.0% |
| Psychology | 848 | 5.5% |
| Social Sciences | 748 | 4.8% |
| Engineering | 834 | 5.4% |
| Multidisciplinary Studies | 104 | 0.7% |
| Science & Technology | 1,659 | 10.7% |
| Business | 3,027 | 19.6% |
| Education | 2,992 | 19.4% |
| Literature & Languages | 391 | 2.5% |
| Liberal Arts & History | 789 | 5.1% |
| Visual & Performing Arts | 620 | 4.0% |
| Communications | 361 | 2.3% |
| Arts & Humanities | 904 | 5.9% |
| Total | 15,452 | 100.0% |
Transportation & Commute in Floyd County
Vehicle Availability by Sex in Floyd County
The most prevalent vehicle ownership categories in Floyd County are males with 2 vehicles (8,551, accounting for 38.5%) and females with 2 vehicles (6,680, making up 44.0%).
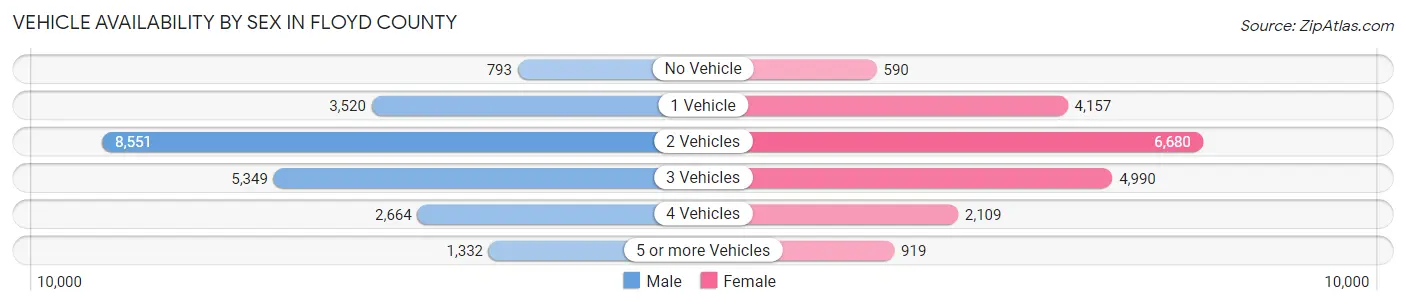
| Vehicles Available | Male | Female |
| No Vehicle | 793 (3.6%) | 590 (3.0%) |
| 1 Vehicle | 3,520 (15.9%) | 4,157 (21.4%) |
| 2 Vehicles | 8,551 (38.5%) | 6,680 (34.4%) |
| 3 Vehicles | 5,349 (24.1%) | 4,990 (25.7%) |
| 4 Vehicles | 2,664 (12.0%) | 2,109 (10.8%) |
| 5 or more Vehicles | 1,332 (6.0%) | 919 (4.7%) |
| Total | 22,209 (100.0%) | 19,445 (100.0%) |
Commute Time in Floyd County
The most frequently occuring commute durations in Floyd County are 15 to 19 minutes (7,957 commuters, 19.7%), 10 to 14 minutes (7,198 commuters, 17.8%), and 20 to 24 minutes (6,520 commuters, 16.1%).
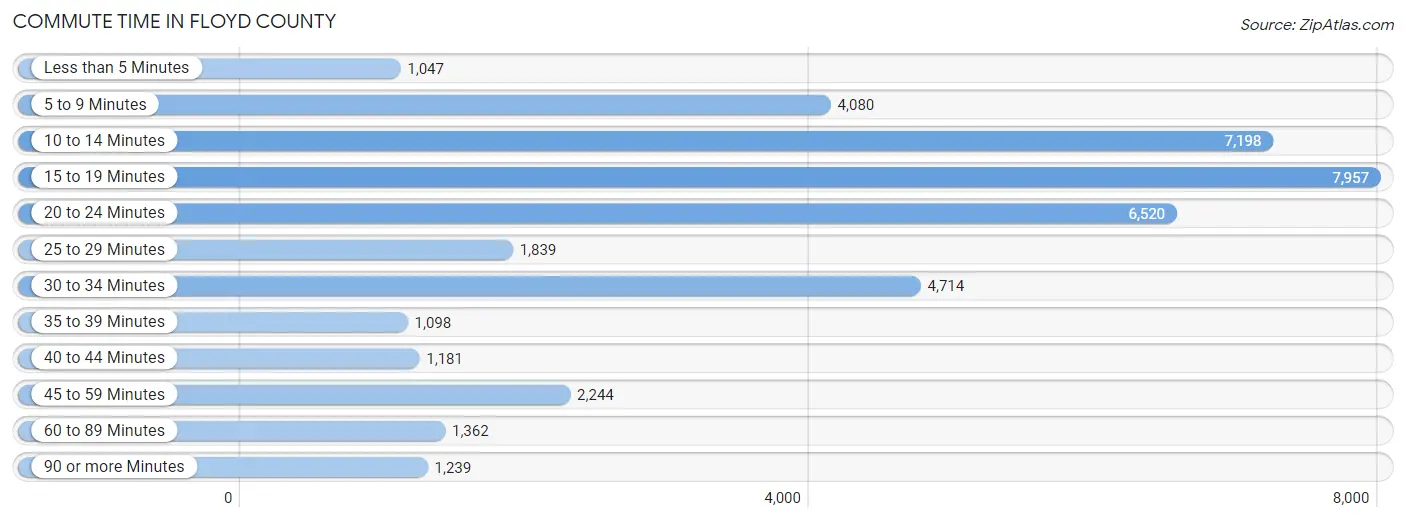
| Commute Time | # Commuters | % Commuters |
| Less than 5 Minutes | 1,047 | 2.6% |
| 5 to 9 Minutes | 4,080 | 10.1% |
| 10 to 14 Minutes | 7,198 | 17.8% |
| 15 to 19 Minutes | 7,957 | 19.7% |
| 20 to 24 Minutes | 6,520 | 16.1% |
| 25 to 29 Minutes | 1,839 | 4.5% |
| 30 to 34 Minutes | 4,714 | 11.7% |
| 35 to 39 Minutes | 1,098 | 2.7% |
| 40 to 44 Minutes | 1,181 | 2.9% |
| 45 to 59 Minutes | 2,244 | 5.5% |
| 60 to 89 Minutes | 1,362 | 3.4% |
| 90 or more Minutes | 1,239 | 3.1% |
Commute Time by Sex in Floyd County
The most common commute times in Floyd County are 15 to 19 minutes (3,788 commuters, 17.5%) for males and 15 to 19 minutes (4,169 commuters, 22.1%) for females.
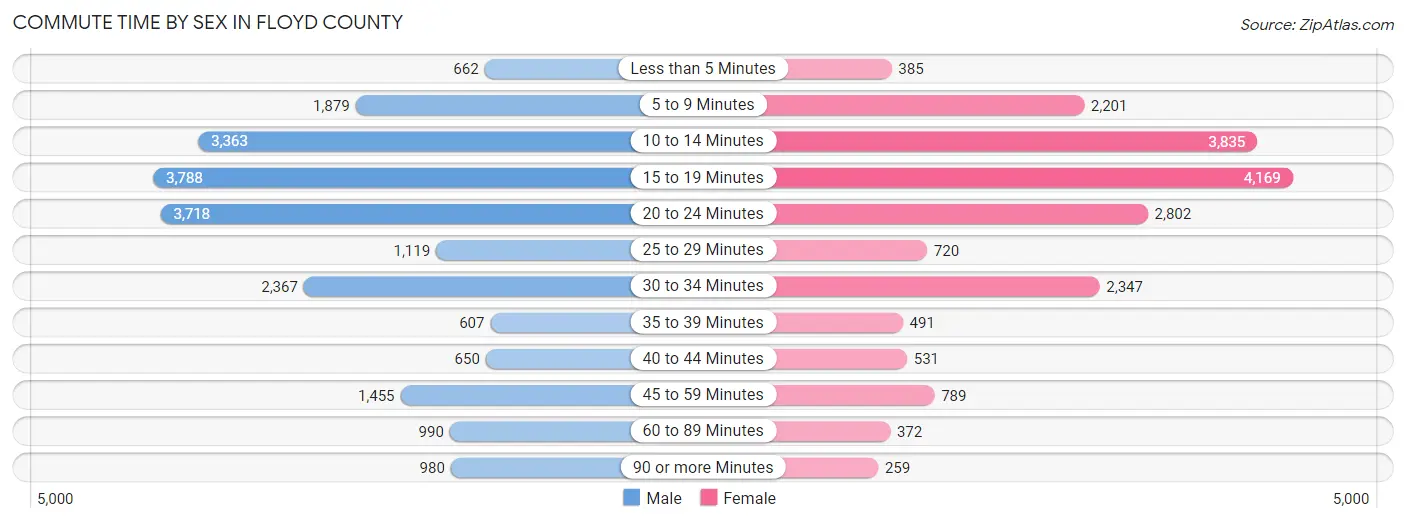
| Commute Time | Male | Female |
| Less than 5 Minutes | 662 (3.1%) | 385 (2.0%) |
| 5 to 9 Minutes | 1,879 (8.7%) | 2,201 (11.6%) |
| 10 to 14 Minutes | 3,363 (15.6%) | 3,835 (20.3%) |
| 15 to 19 Minutes | 3,788 (17.5%) | 4,169 (22.1%) |
| 20 to 24 Minutes | 3,718 (17.2%) | 2,802 (14.8%) |
| 25 to 29 Minutes | 1,119 (5.2%) | 720 (3.8%) |
| 30 to 34 Minutes | 2,367 (11.0%) | 2,347 (12.4%) |
| 35 to 39 Minutes | 607 (2.8%) | 491 (2.6%) |
| 40 to 44 Minutes | 650 (3.0%) | 531 (2.8%) |
| 45 to 59 Minutes | 1,455 (6.7%) | 789 (4.2%) |
| 60 to 89 Minutes | 990 (4.6%) | 372 (2.0%) |
| 90 or more Minutes | 980 (4.5%) | 259 (1.4%) |
Time of Departure to Work by Sex in Floyd County
The most frequent times of departure to work in Floyd County are 7:30 AM to 7:59 AM (2,417, 11.2%) for males and 7:30 AM to 7:59 AM (3,288, 17.4%) for females.
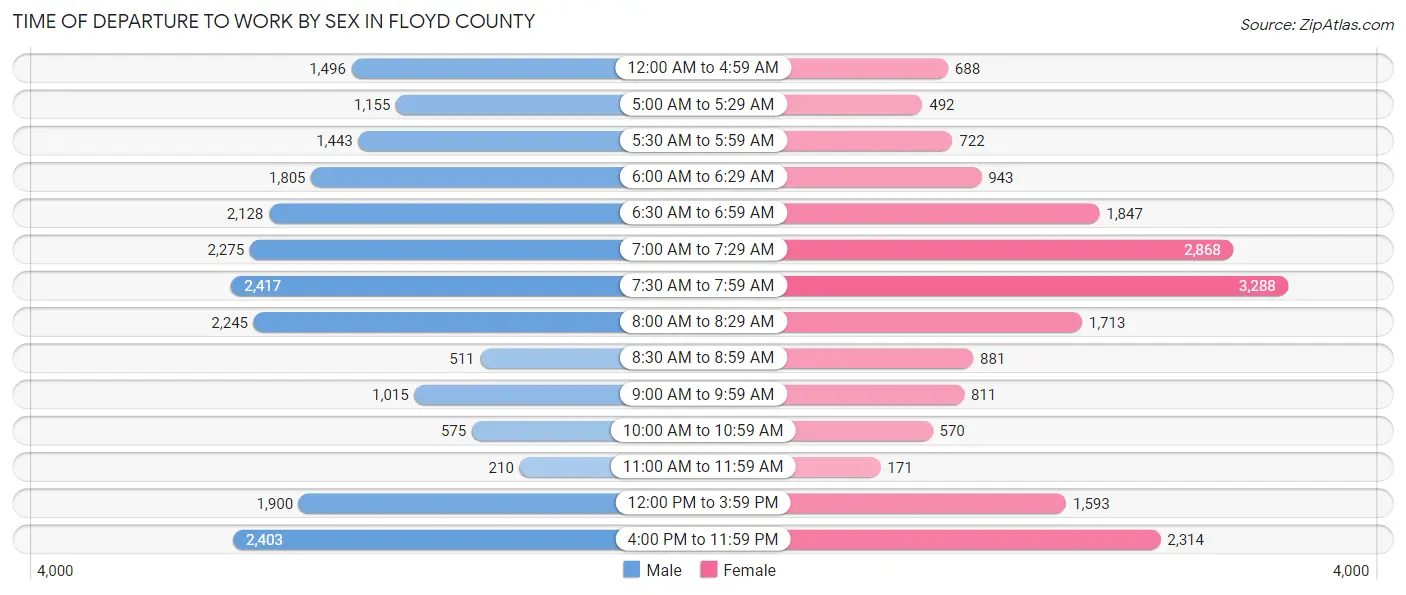
| Time of Departure | Male | Female |
| 12:00 AM to 4:59 AM | 1,496 (6.9%) | 688 (3.6%) |
| 5:00 AM to 5:29 AM | 1,155 (5.3%) | 492 (2.6%) |
| 5:30 AM to 5:59 AM | 1,443 (6.7%) | 722 (3.8%) |
| 6:00 AM to 6:29 AM | 1,805 (8.4%) | 943 (5.0%) |
| 6:30 AM to 6:59 AM | 2,128 (9.9%) | 1,847 (9.8%) |
| 7:00 AM to 7:29 AM | 2,275 (10.5%) | 2,868 (15.2%) |
| 7:30 AM to 7:59 AM | 2,417 (11.2%) | 3,288 (17.4%) |
| 8:00 AM to 8:29 AM | 2,245 (10.4%) | 1,713 (9.1%) |
| 8:30 AM to 8:59 AM | 511 (2.4%) | 881 (4.7%) |
| 9:00 AM to 9:59 AM | 1,015 (4.7%) | 811 (4.3%) |
| 10:00 AM to 10:59 AM | 575 (2.7%) | 570 (3.0%) |
| 11:00 AM to 11:59 AM | 210 (1.0%) | 171 (0.9%) |
| 12:00 PM to 3:59 PM | 1,900 (8.8%) | 1,593 (8.4%) |
| 4:00 PM to 11:59 PM | 2,403 (11.1%) | 2,314 (12.2%) |
| Total | 21,578 (100.0%) | 18,901 (100.0%) |
Housing Occupancy in Floyd County
Occupancy by Ownership in Floyd County
Of the total 35,996 dwellings in Floyd County, owner-occupied units account for 22,717 (63.1%), while renter-occupied units make up 13,279 (36.9%).
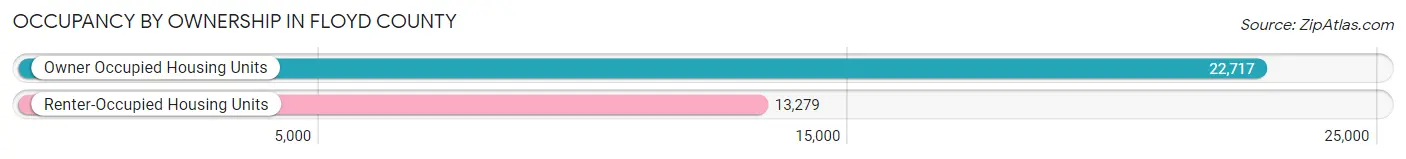
| Occupancy | # Housing Units | % Housing Units |
| Owner Occupied Housing Units | 22,717 | 63.1% |
| Renter-Occupied Housing Units | 13,279 | 36.9% |
| Total Occupied Housing Units | 35,996 | 100.0% |
Occupancy by Household Size in Floyd County
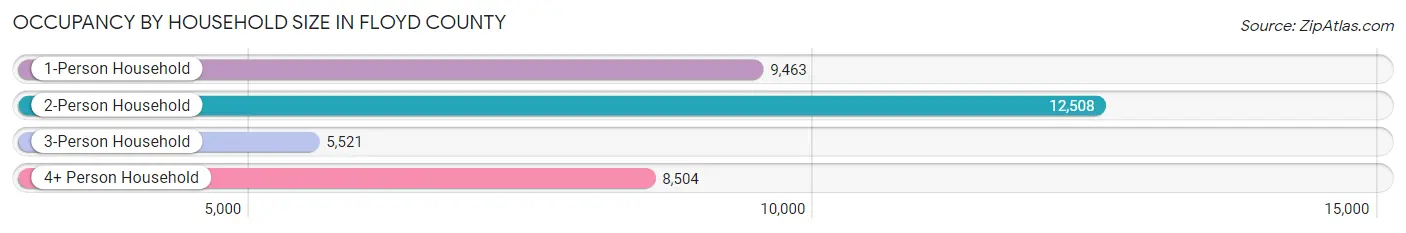
| Household Size | # Housing Units | % Housing Units |
| 1-Person Household | 9,463 | 26.3% |
| 2-Person Household | 12,508 | 34.7% |
| 3-Person Household | 5,521 | 15.3% |
| 4+ Person Household | 8,504 | 23.6% |
| Total Housing Units | 35,996 | 100.0% |
Occupancy by Ownership by Household Size in Floyd County
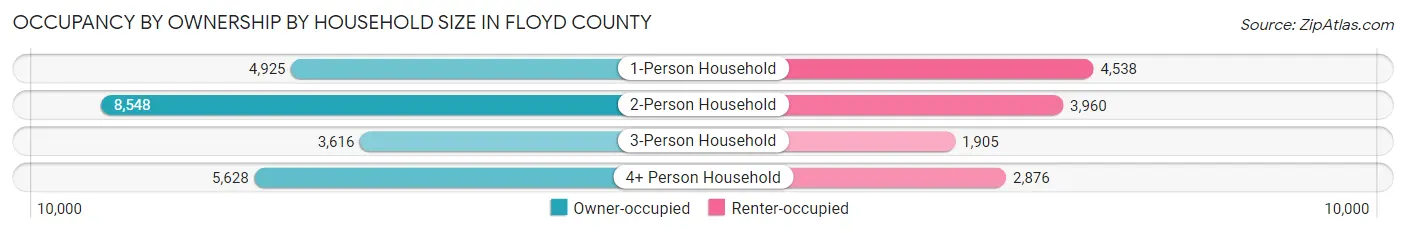
| Household Size | Owner-occupied | Renter-occupied |
| 1-Person Household | 4,925 (52.0%) | 4,538 (48.0%) |
| 2-Person Household | 8,548 (68.3%) | 3,960 (31.7%) |
| 3-Person Household | 3,616 (65.5%) | 1,905 (34.5%) |
| 4+ Person Household | 5,628 (66.2%) | 2,876 (33.8%) |
| Total Housing Units | 22,717 (63.1%) | 13,279 (36.9%) |
Occupancy by Educational Attainment in Floyd County
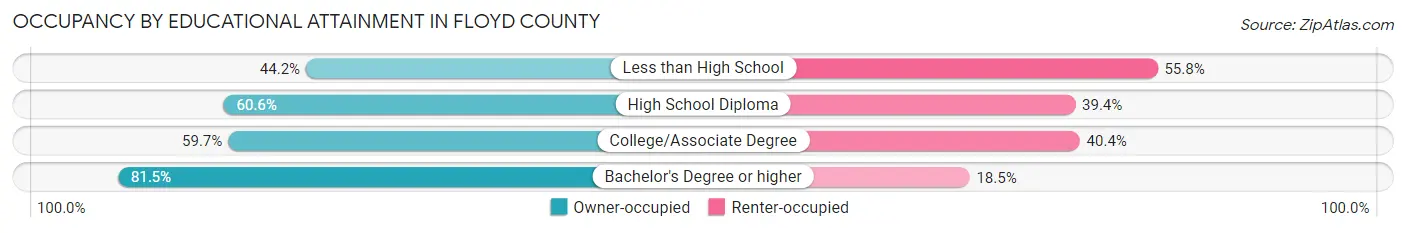
| Household Size | Owner-occupied | Renter-occupied |
| Less than High School | 2,223 (44.2%) | 2,803 (55.8%) |
| High School Diploma | 6,461 (60.6%) | 4,207 (39.4%) |
| College/Associate Degree | 6,861 (59.7%) | 4,641 (40.4%) |
| Bachelor's Degree or higher | 7,172 (81.5%) | 1,628 (18.5%) |
Occupancy by Age of Householder in Floyd County
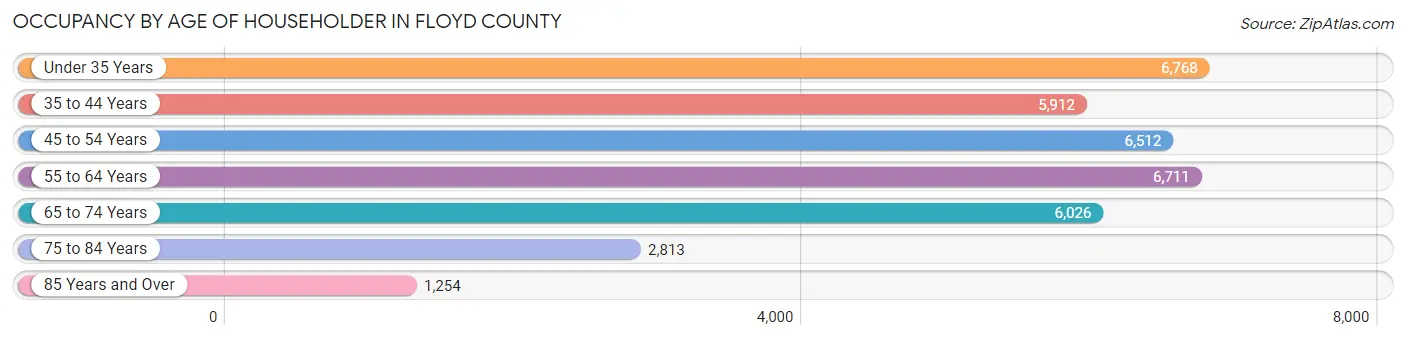
| Age Bracket | # Households | % Households |
| Under 35 Years | 6,768 | 18.8% |
| 35 to 44 Years | 5,912 | 16.4% |
| 45 to 54 Years | 6,512 | 18.1% |
| 55 to 64 Years | 6,711 | 18.6% |
| 65 to 74 Years | 6,026 | 16.7% |
| 75 to 84 Years | 2,813 | 7.8% |
| 85 Years and Over | 1,254 | 3.5% |
| Total | 35,996 | 100.0% |
Housing Finances in Floyd County
Median Income by Occupancy in Floyd County
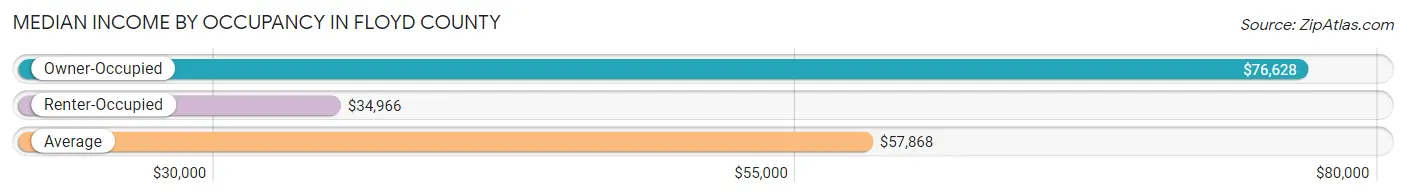
| Occupancy Type | # Households | Median Income |
| Owner-Occupied | 22,717 (63.1%) | $76,628 |
| Renter-Occupied | 13,279 (36.9%) | $34,966 |
| Average | 35,996 (100.0%) | $57,868 |
Occupancy by Householder Income Bracket in Floyd County
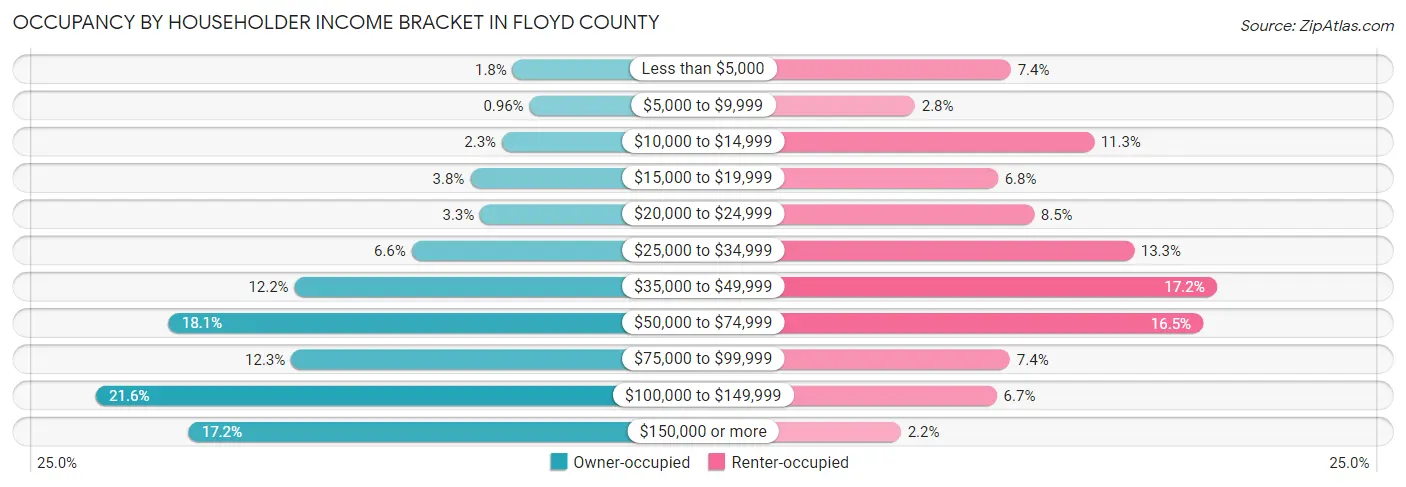
| Income Bracket | Owner-occupied | Renter-occupied |
| Less than $5,000 | 399 (1.8%) | 981 (7.4%) |
| $5,000 to $9,999 | 217 (1.0%) | 375 (2.8%) |
| $10,000 to $14,999 | 516 (2.3%) | 1,506 (11.3%) |
| $15,000 to $19,999 | 859 (3.8%) | 899 (6.8%) |
| $20,000 to $24,999 | 752 (3.3%) | 1,127 (8.5%) |
| $25,000 to $34,999 | 1,492 (6.6%) | 1,759 (13.3%) |
| $35,000 to $49,999 | 2,760 (12.1%) | 2,282 (17.2%) |
| $50,000 to $74,999 | 4,118 (18.1%) | 2,197 (16.5%) |
| $75,000 to $99,999 | 2,796 (12.3%) | 976 (7.3%) |
| $100,000 to $149,999 | 4,905 (21.6%) | 892 (6.7%) |
| $150,000 or more | 3,903 (17.2%) | 285 (2.1%) |
| Total | 22,717 (100.0%) | 13,279 (100.0%) |
Monthly Housing Cost Tiers in Floyd County
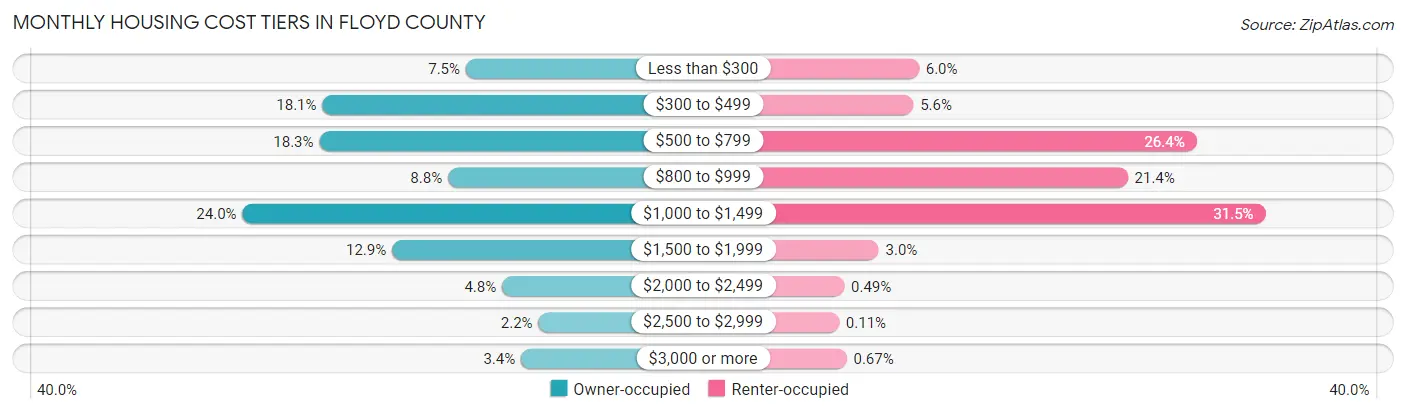
| Monthly Cost | Owner-occupied | Renter-occupied |
| Less than $300 | 1,703 (7.5%) | 795 (6.0%) |
| $300 to $499 | 4,104 (18.1%) | 741 (5.6%) |
| $500 to $799 | 4,154 (18.3%) | 3,511 (26.4%) |
| $800 to $999 | 2,004 (8.8%) | 2,838 (21.4%) |
| $1,000 to $1,499 | 5,442 (24.0%) | 4,186 (31.5%) |
| $1,500 to $1,999 | 2,939 (12.9%) | 402 (3.0%) |
| $2,000 to $2,499 | 1,099 (4.8%) | 65 (0.5%) |
| $2,500 to $2,999 | 491 (2.2%) | 15 (0.1%) |
| $3,000 or more | 781 (3.4%) | 89 (0.7%) |
| Total | 22,717 (100.0%) | 13,279 (100.0%) |
Physical Housing Characteristics in Floyd County
Housing Structures in Floyd County
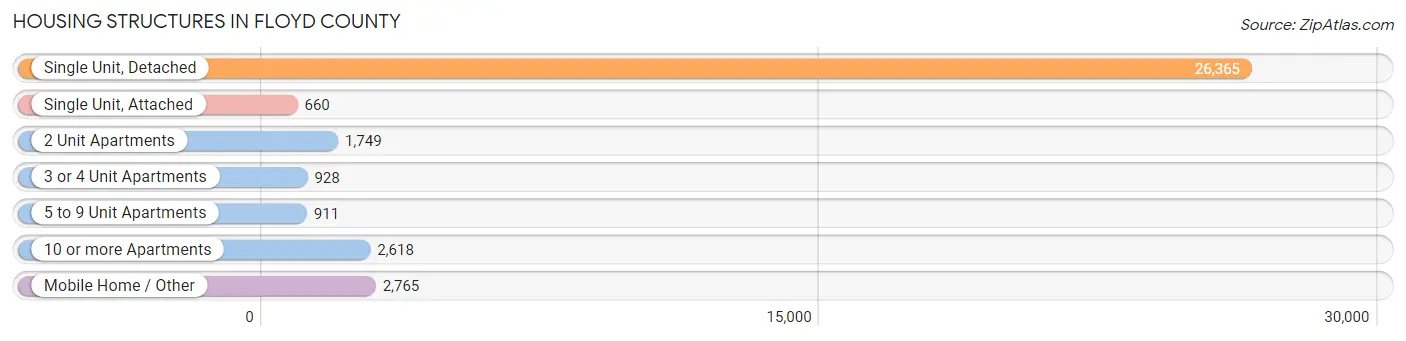
| Structure Type | # Housing Units | % Housing Units |
| Single Unit, Detached | 26,365 | 73.2% |
| Single Unit, Attached | 660 | 1.8% |
| 2 Unit Apartments | 1,749 | 4.9% |
| 3 or 4 Unit Apartments | 928 | 2.6% |
| 5 to 9 Unit Apartments | 911 | 2.5% |
| 10 or more Apartments | 2,618 | 7.3% |
| Mobile Home / Other | 2,765 | 7.7% |
| Total | 35,996 | 100.0% |
Housing Structures by Occupancy in Floyd County
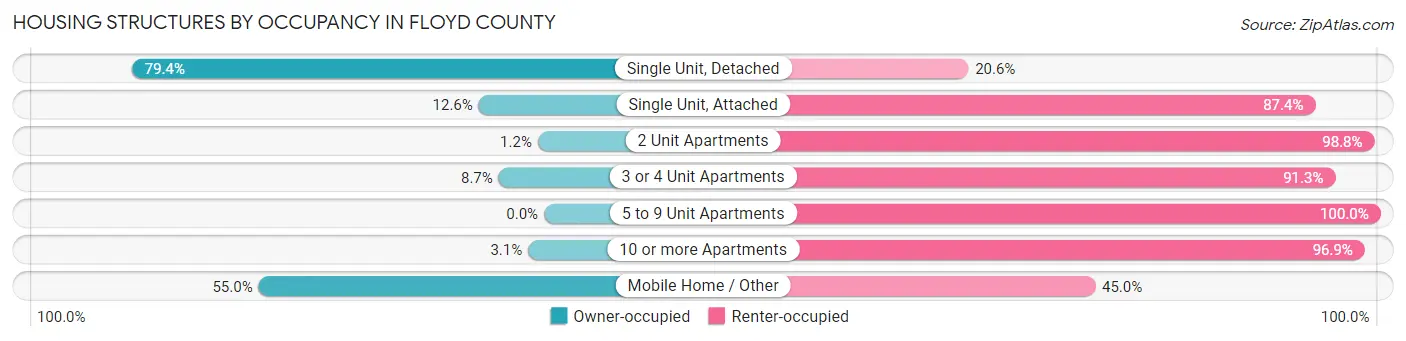
| Structure Type | Owner-occupied | Renter-occupied |
| Single Unit, Detached | 20,932 (79.4%) | 5,433 (20.6%) |
| Single Unit, Attached | 83 (12.6%) | 577 (87.4%) |
| 2 Unit Apartments | 21 (1.2%) | 1,728 (98.8%) |
| 3 or 4 Unit Apartments | 81 (8.7%) | 847 (91.3%) |
| 5 to 9 Unit Apartments | 0 (0.0%) | 911 (100.0%) |
| 10 or more Apartments | 80 (3.1%) | 2,538 (96.9%) |
| Mobile Home / Other | 1,520 (55.0%) | 1,245 (45.0%) |
| Total | 22,717 (63.1%) | 13,279 (36.9%) |
Housing Structures by Number of Rooms in Floyd County
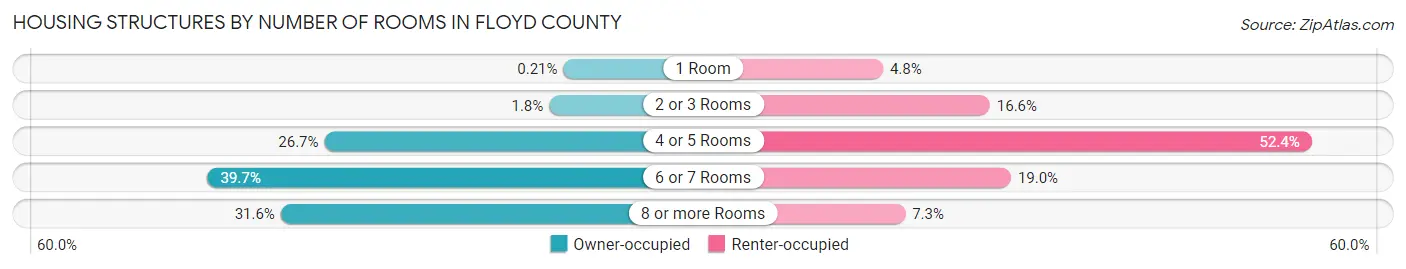
| Number of Rooms | Owner-occupied | Renter-occupied |
| 1 Room | 47 (0.2%) | 635 (4.8%) |
| 2 or 3 Rooms | 406 (1.8%) | 2,209 (16.6%) |
| 4 or 5 Rooms | 6,073 (26.7%) | 6,952 (52.3%) |
| 6 or 7 Rooms | 9,018 (39.7%) | 2,520 (19.0%) |
| 8 or more Rooms | 7,173 (31.6%) | 963 (7.2%) |
| Total | 22,717 (100.0%) | 13,279 (100.0%) |
Housing Structure by Heating Type in Floyd County
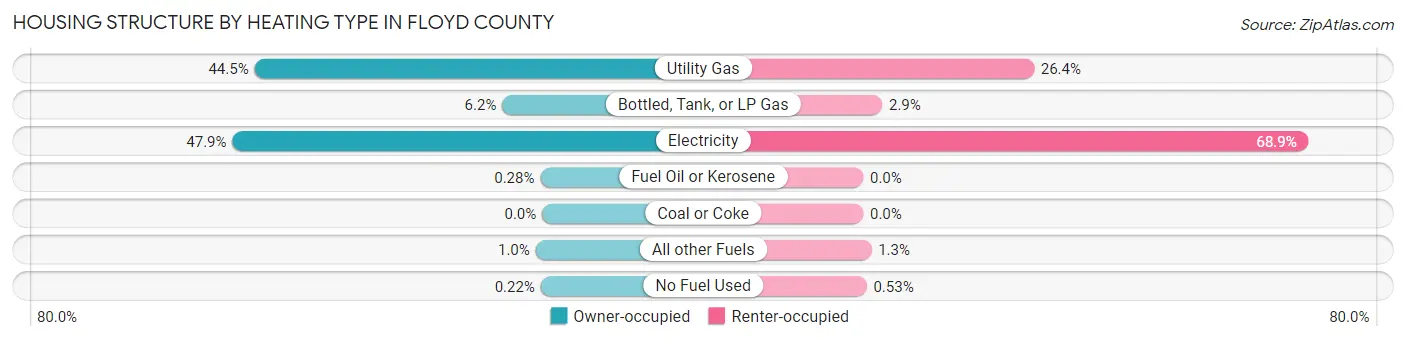
| Heating Type | Owner-occupied | Renter-occupied |
| Utility Gas | 10,100 (44.5%) | 3,506 (26.4%) |
| Bottled, Tank, or LP Gas | 1,399 (6.2%) | 390 (2.9%) |
| Electricity | 10,878 (47.9%) | 9,145 (68.9%) |
| Fuel Oil or Kerosene | 63 (0.3%) | 0 (0.0%) |
| Coal or Coke | 0 (0.0%) | 0 (0.0%) |
| All other Fuels | 228 (1.0%) | 167 (1.3%) |
| No Fuel Used | 49 (0.2%) | 71 (0.5%) |
| Total | 22,717 (100.0%) | 13,279 (100.0%) |
Household Vehicle Usage in Floyd County
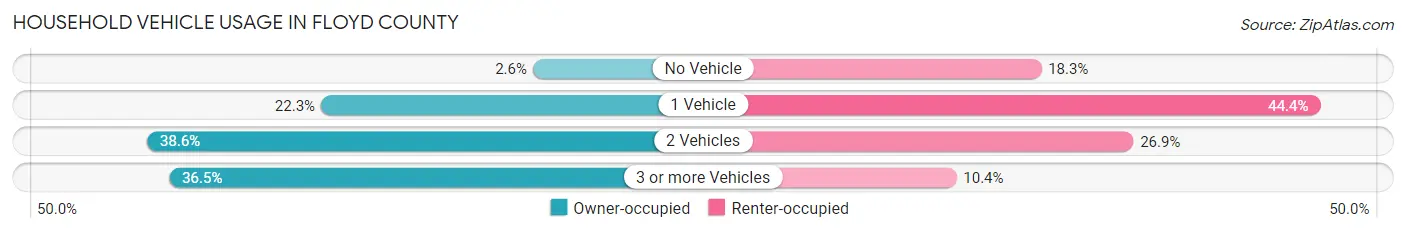
| Vehicles per Household | Owner-occupied | Renter-occupied |
| No Vehicle | 582 (2.6%) | 2,433 (18.3%) |
| 1 Vehicle | 5,075 (22.3%) | 5,892 (44.4%) |
| 2 Vehicles | 8,764 (38.6%) | 3,573 (26.9%) |
| 3 or more Vehicles | 8,296 (36.5%) | 1,381 (10.4%) |
| Total | 22,717 (100.0%) | 13,279 (100.0%) |
Real Estate & Mortgages in Floyd County
Real Estate and Mortgage Overview in Floyd County
| Characteristic | Without Mortgage | With Mortgage |
| Housing Units | 9,956 | 12,761 |
| Median Property Value | $146,300 | $195,700 |
| Median Household Income | $59,064 | $2,785 |
| Monthly Housing Costs | $468 | $781 |
| Real Estate Taxes | $997 | $87 |
Property Value by Mortgage Status in Floyd County
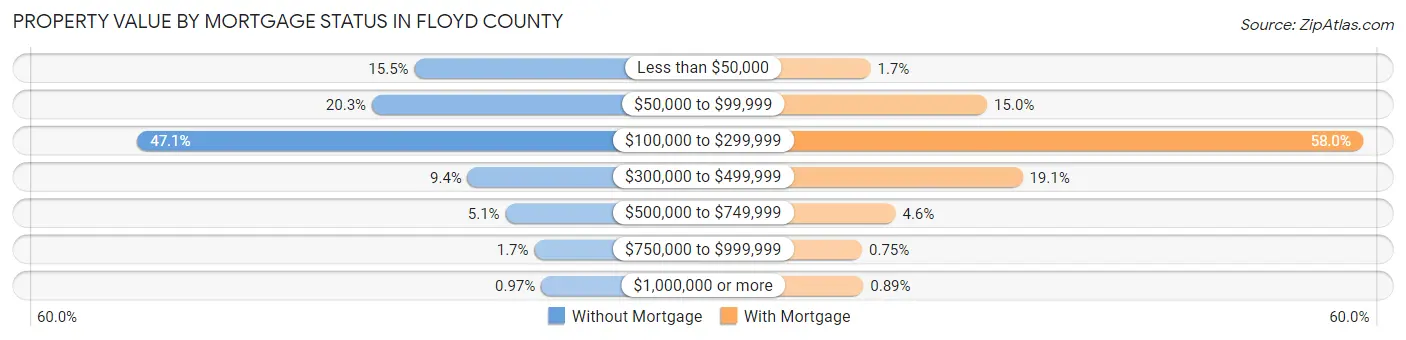
| Property Value | Without Mortgage | With Mortgage |
| Less than $50,000 | 1,538 (15.4%) | 218 (1.7%) |
| $50,000 to $99,999 | 2,022 (20.3%) | 1,919 (15.0%) |
| $100,000 to $299,999 | 4,691 (47.1%) | 7,397 (58.0%) |
| $300,000 to $499,999 | 932 (9.4%) | 2,435 (19.1%) |
| $500,000 to $749,999 | 503 (5.1%) | 583 (4.6%) |
| $750,000 to $999,999 | 173 (1.7%) | 96 (0.7%) |
| $1,000,000 or more | 97 (1.0%) | 113 (0.9%) |
| Total | 9,956 (100.0%) | 12,761 (100.0%) |
Household Income by Mortgage Status in Floyd County
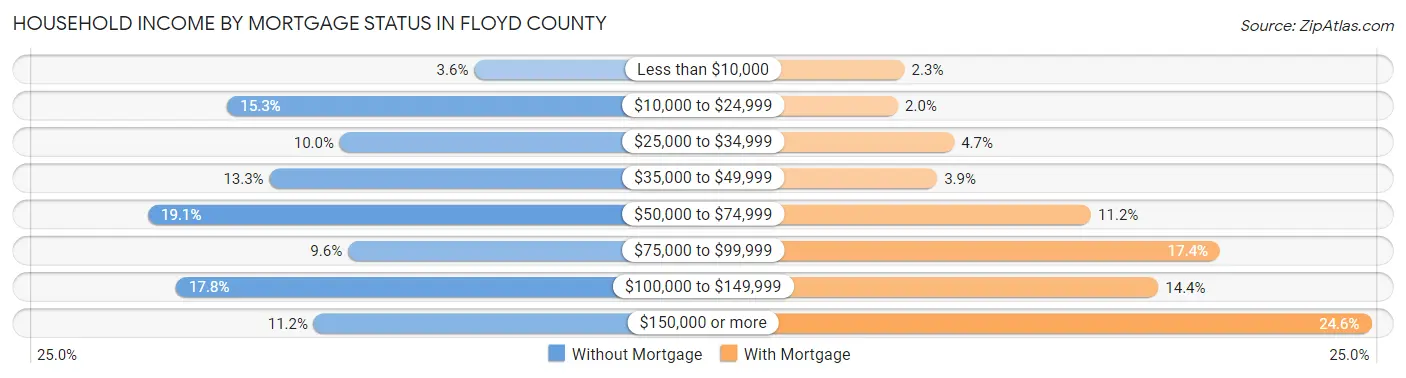
| Household Income | Without Mortgage | With Mortgage |
| Less than $10,000 | 357 (3.6%) | 299 (2.3%) |
| $10,000 to $24,999 | 1,527 (15.3%) | 259 (2.0%) |
| $25,000 to $34,999 | 995 (10.0%) | 600 (4.7%) |
| $35,000 to $49,999 | 1,328 (13.3%) | 497 (3.9%) |
| $50,000 to $74,999 | 1,904 (19.1%) | 1,432 (11.2%) |
| $75,000 to $99,999 | 956 (9.6%) | 2,214 (17.3%) |
| $100,000 to $149,999 | 1,771 (17.8%) | 1,840 (14.4%) |
| $150,000 or more | 1,118 (11.2%) | 3,134 (24.6%) |
| Total | 9,956 (100.0%) | 12,761 (100.0%) |
Property Value to Household Income Ratio in Floyd County
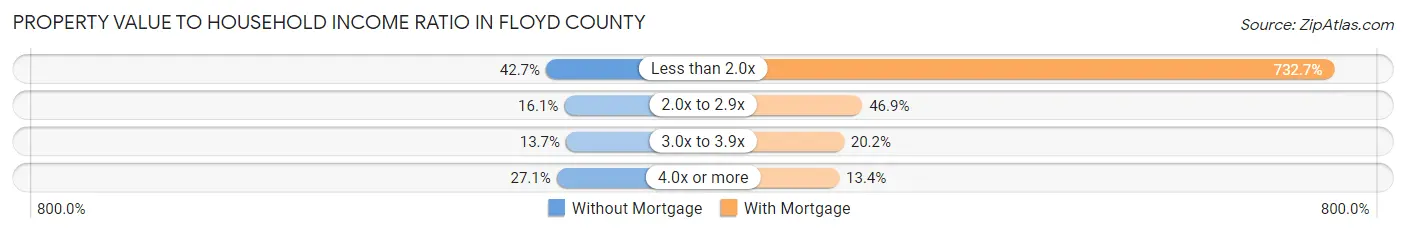
| Value-to-Income Ratio | Without Mortgage | With Mortgage |
| Less than 2.0x | 4,251 (42.7%) | 93,498 (732.7%) |
| 2.0x to 2.9x | 1,601 (16.1%) | 5,988 (46.9%) |
| 3.0x to 3.9x | 1,364 (13.7%) | 2,571 (20.2%) |
| 4.0x or more | 2,696 (27.1%) | 1,706 (13.4%) |
| Total | 9,956 (100.0%) | 12,761 (100.0%) |
Real Estate Taxes by Mortgage Status in Floyd County
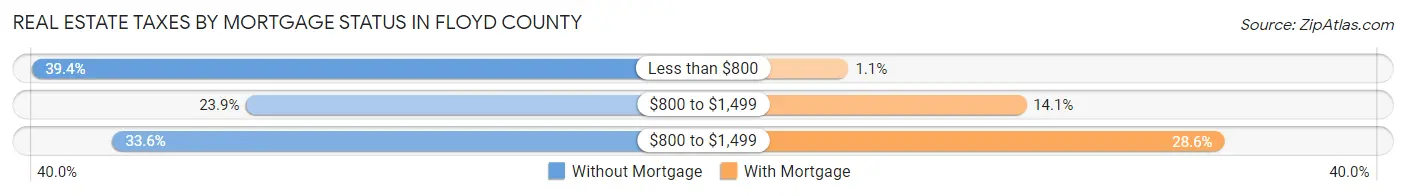
| Property Taxes | Without Mortgage | With Mortgage |
| Less than $800 | 3,927 (39.4%) | 144 (1.1%) |
| $800 to $1,499 | 2,377 (23.9%) | 1,800 (14.1%) |
| $800 to $1,499 | 3,343 (33.6%) | 3,648 (28.6%) |
| Total | 9,956 (100.0%) | 12,761 (100.0%) |
Health & Disability in Floyd County
Health Insurance Coverage by Age in Floyd County
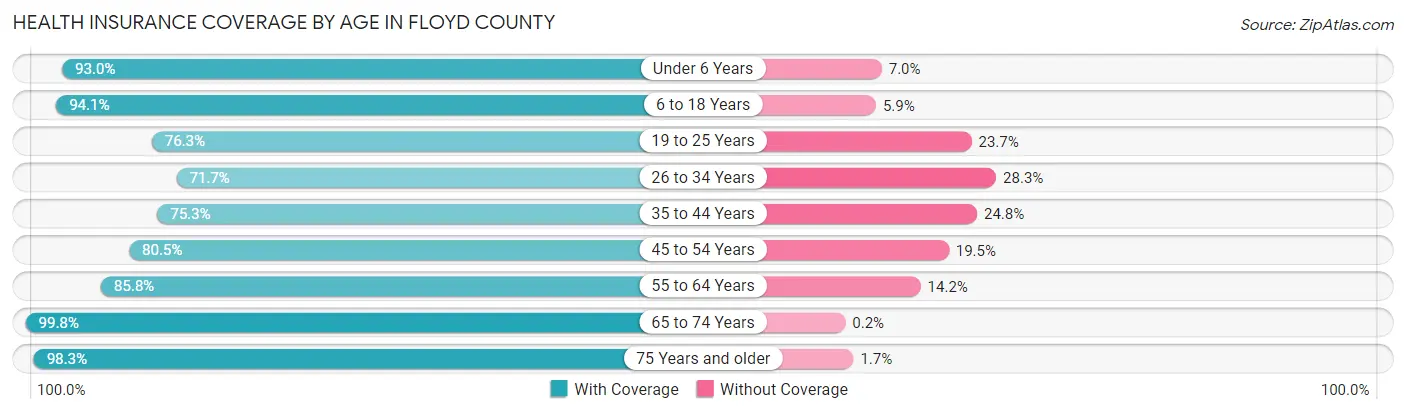
| Age Bracket | With Coverage | Without Coverage |
| Under 6 Years | 6,389 (93.0%) | 480 (7.0%) |
| 6 to 18 Years | 16,469 (94.1%) | 1,034 (5.9%) |
| 19 to 25 Years | 7,645 (76.3%) | 2,379 (23.7%) |
| 26 to 34 Years | 7,536 (71.7%) | 2,977 (28.3%) |
| 35 to 44 Years | 8,831 (75.2%) | 2,905 (24.7%) |
| 45 to 54 Years | 9,660 (80.5%) | 2,339 (19.5%) |
| 55 to 64 Years | 10,533 (85.8%) | 1,749 (14.2%) |
| 65 to 74 Years | 9,477 (99.8%) | 19 (0.2%) |
| 75 Years and older | 5,988 (98.3%) | 104 (1.7%) |
| Total | 82,528 (85.5%) | 13,986 (14.5%) |
Health Insurance Coverage by Citizenship Status in Floyd County
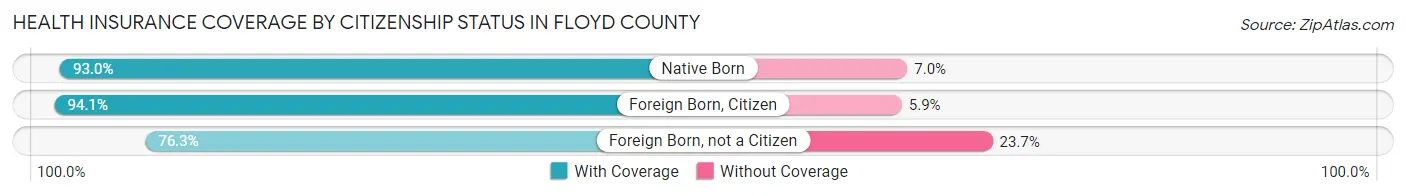
| Citizenship Status | With Coverage | Without Coverage |
| Native Born | 6,389 (93.0%) | 480 (7.0%) |
| Foreign Born, Citizen | 16,469 (94.1%) | 1,034 (5.9%) |
| Foreign Born, not a Citizen | 7,645 (76.3%) | 2,379 (23.7%) |
Health Insurance Coverage by Household Income in Floyd County
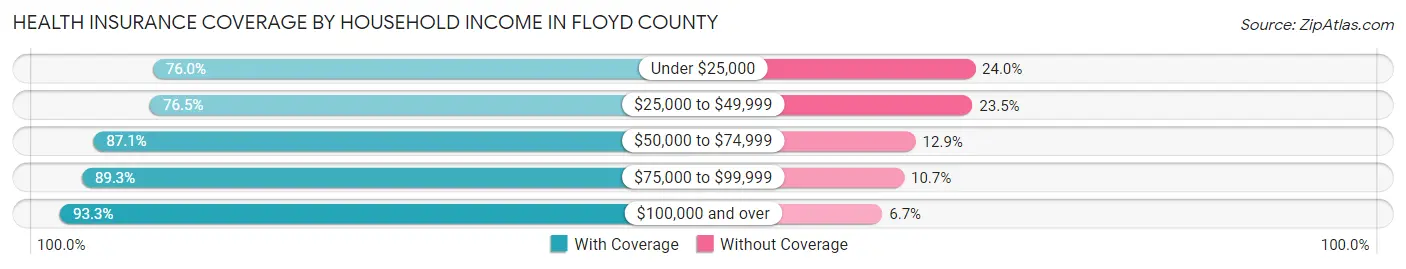
| Household Income | With Coverage | Without Coverage |
| Under $25,000 | 10,930 (76.0%) | 3,460 (24.0%) |
| $25,000 to $49,999 | 15,851 (76.5%) | 4,878 (23.5%) |
| $50,000 to $74,999 | 14,449 (87.1%) | 2,140 (12.9%) |
| $75,000 to $99,999 | 9,769 (89.3%) | 1,174 (10.7%) |
| $100,000 and over | 29,594 (93.3%) | 2,110 (6.7%) |
Public vs Private Health Insurance Coverage by Age in Floyd County
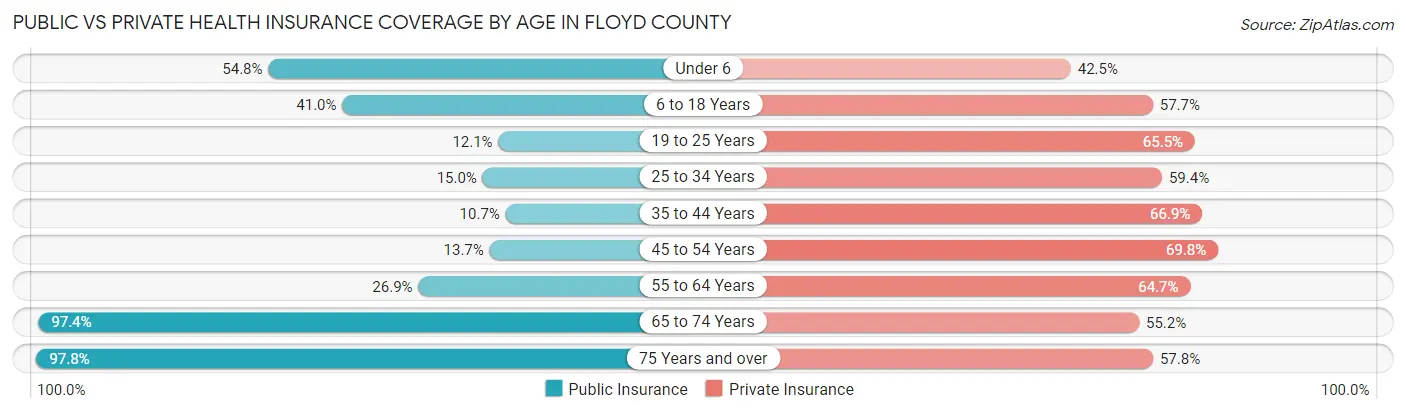
| Age Bracket | Public Insurance | Private Insurance |
| Under 6 | 3,761 (54.7%) | 2,919 (42.5%) |
| 6 to 18 Years | 7,179 (41.0%) | 10,105 (57.7%) |
| 19 to 25 Years | 1,208 (12.0%) | 6,570 (65.5%) |
| 25 to 34 Years | 1,574 (15.0%) | 6,248 (59.4%) |
| 35 to 44 Years | 1,257 (10.7%) | 7,849 (66.9%) |
| 45 to 54 Years | 1,643 (13.7%) | 8,380 (69.8%) |
| 55 to 64 Years | 3,304 (26.9%) | 7,945 (64.7%) |
| 65 to 74 Years | 9,253 (97.4%) | 5,240 (55.2%) |
| 75 Years and over | 5,958 (97.8%) | 3,519 (57.8%) |
| Total | 35,137 (36.4%) | 58,775 (60.9%) |
Disability Status by Sex by Age in Floyd County
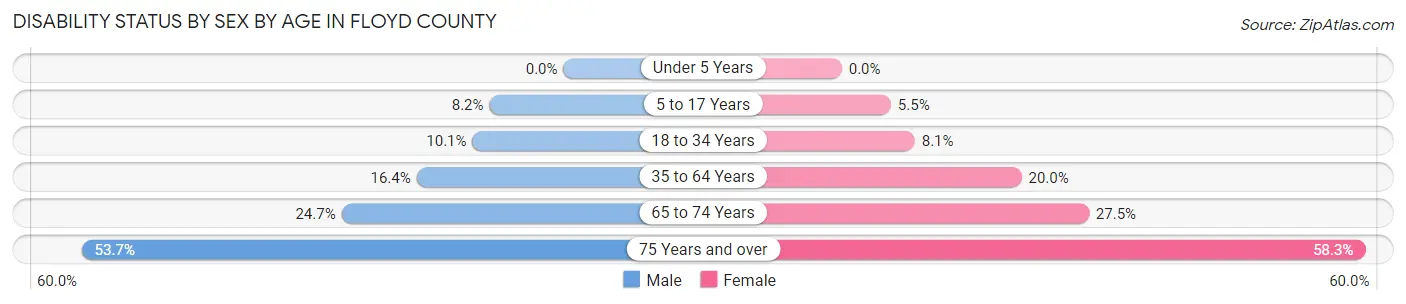
| Age Bracket | Male | Female |
| Under 5 Years | 0 (0.0%) | 0 (0.0%) |
| 5 to 17 Years | 696 (8.2%) | 446 (5.5%) |
| 18 to 34 Years | 1,108 (10.1%) | 954 (8.1%) |
| 35 to 64 Years | 2,872 (16.4%) | 3,694 (20.0%) |
| 65 to 74 Years | 1,102 (24.7%) | 1,386 (27.5%) |
| 75 Years and over | 1,366 (53.6%) | 2,067 (58.3%) |
Disability Class by Sex by Age in Floyd County
Disability Class: Hearing Difficulty
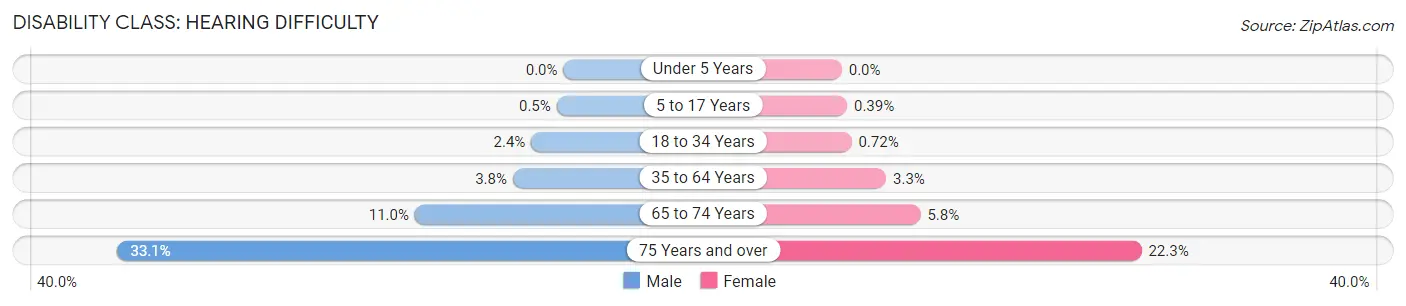
| Age Bracket | Male | Female |
| Under 5 Years | 0 (0.0%) | 0 (0.0%) |
| 5 to 17 Years | 42 (0.5%) | 32 (0.4%) |
| 18 to 34 Years | 261 (2.4%) | 85 (0.7%) |
| 35 to 64 Years | 659 (3.7%) | 607 (3.3%) |
| 65 to 74 Years | 492 (11.0%) | 294 (5.8%) |
| 75 Years and over | 843 (33.1%) | 789 (22.3%) |
Disability Class: Vision Difficulty
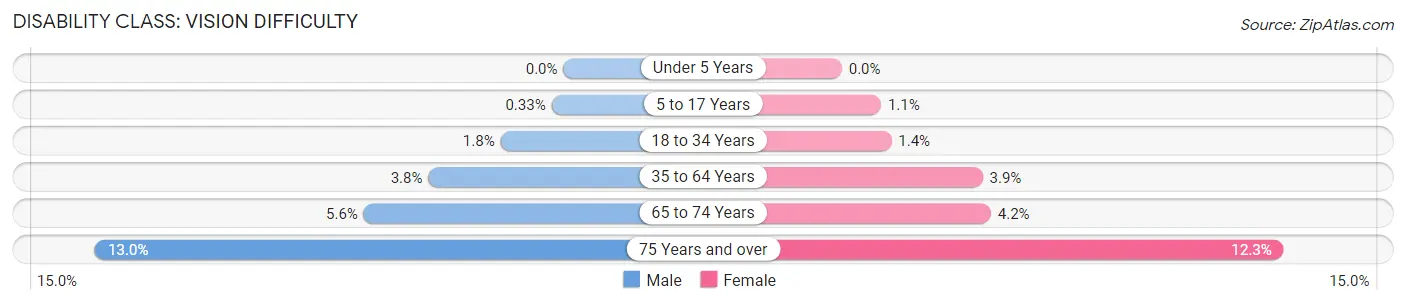
| Age Bracket | Male | Female |
| Under 5 Years | 0 (0.0%) | 0 (0.0%) |
| 5 to 17 Years | 28 (0.3%) | 89 (1.1%) |
| 18 to 34 Years | 191 (1.8%) | 162 (1.4%) |
| 35 to 64 Years | 660 (3.8%) | 723 (3.9%) |
| 65 to 74 Years | 248 (5.6%) | 209 (4.2%) |
| 75 Years and over | 332 (13.0%) | 436 (12.3%) |
Disability Class: Cognitive Difficulty
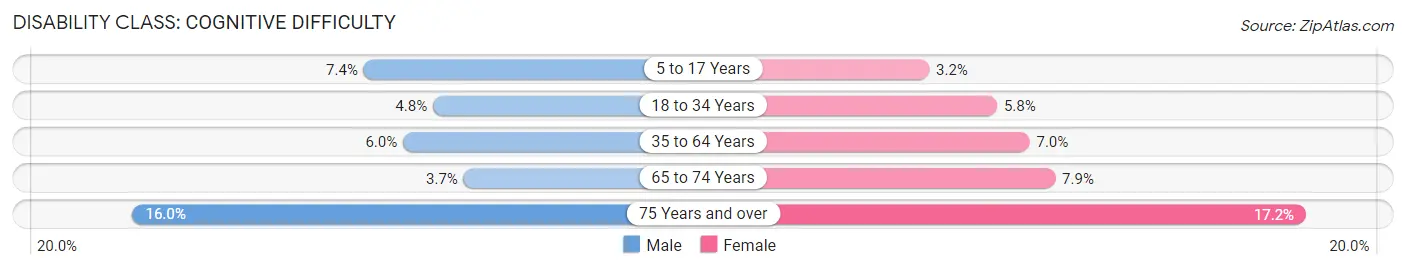
| Age Bracket | Male | Female |
| 5 to 17 Years | 626 (7.4%) | 264 (3.2%) |
| 18 to 34 Years | 529 (4.8%) | 676 (5.8%) |
| 35 to 64 Years | 1,045 (5.9%) | 1,286 (7.0%) |
| 65 to 74 Years | 165 (3.7%) | 399 (7.9%) |
| 75 Years and over | 407 (16.0%) | 611 (17.2%) |
Disability Class: Ambulatory Difficulty
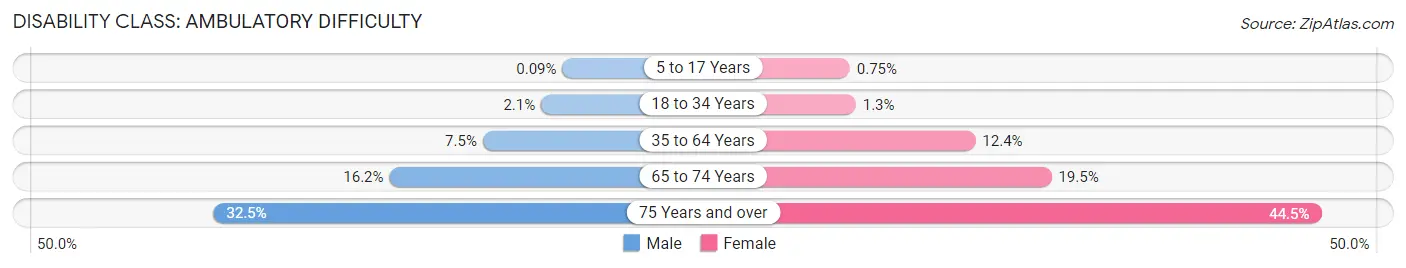
| Age Bracket | Male | Female |
| 5 to 17 Years | 8 (0.1%) | 61 (0.7%) |
| 18 to 34 Years | 226 (2.1%) | 153 (1.3%) |
| 35 to 64 Years | 1,314 (7.5%) | 2,288 (12.4%) |
| 65 to 74 Years | 720 (16.2%) | 980 (19.5%) |
| 75 Years and over | 827 (32.5%) | 1,578 (44.5%) |
Disability Class: Self-Care Difficulty
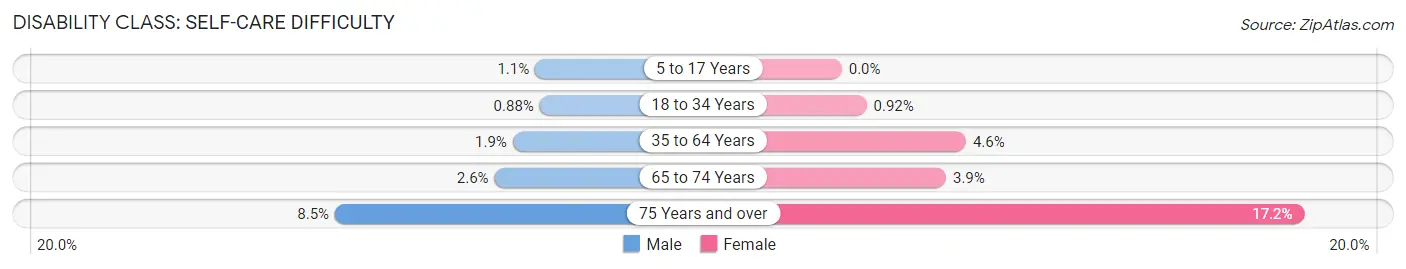
| Age Bracket | Male | Female |
| 5 to 17 Years | 89 (1.1%) | 0 (0.0%) |
| 18 to 34 Years | 96 (0.9%) | 108 (0.9%) |
| 35 to 64 Years | 330 (1.9%) | 850 (4.6%) |
| 65 to 74 Years | 114 (2.6%) | 195 (3.9%) |
| 75 Years and over | 216 (8.5%) | 609 (17.2%) |
Technology Access in Floyd County
Computing Device Access in Floyd County
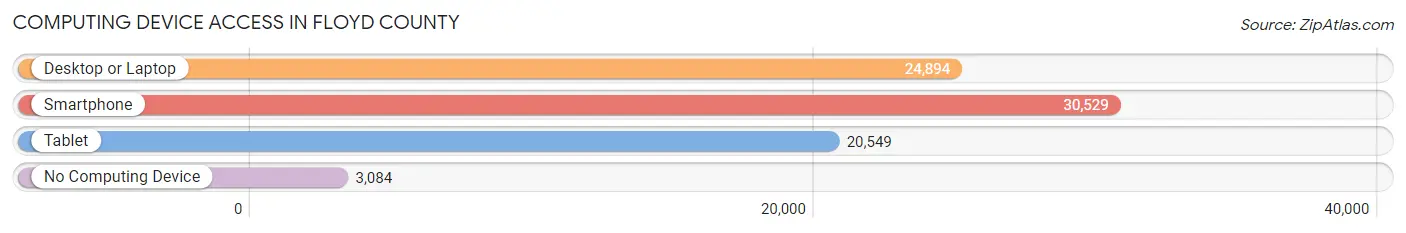
| Device Type | # Households | % Households |
| Desktop or Laptop | 24,894 | 69.2% |
| Smartphone | 30,529 | 84.8% |
| Tablet | 20,549 | 57.1% |
| No Computing Device | 3,084 | 8.6% |
| Total | 35,996 | 100.0% |
Internet Access in Floyd County
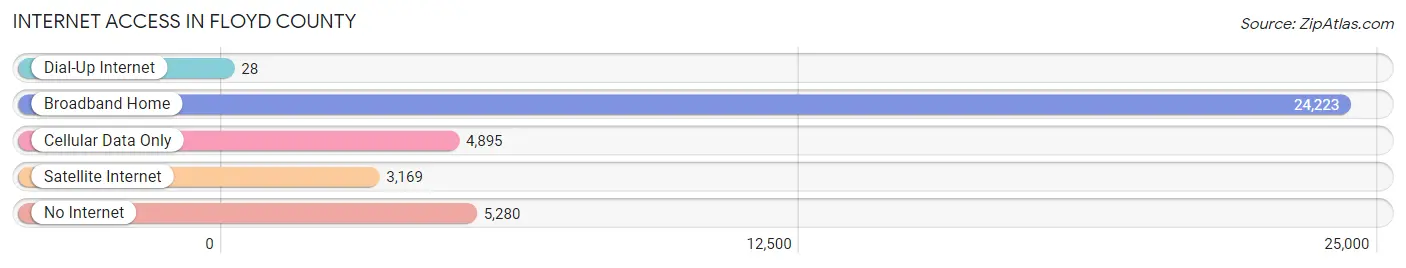
| Internet Type | # Households | % Households |
| Dial-Up Internet | 28 | 0.1% |
| Broadband Home | 24,223 | 67.3% |
| Cellular Data Only | 4,895 | 13.6% |
| Satellite Internet | 3,169 | 8.8% |
| No Internet | 5,280 | 14.7% |
| Total | 35,996 | 100.0% |
Floyd County Summary
Floyd County is located in the northwestern part of the state of Georgia, in the foothills of the Appalachian Mountains. It is bordered by Chattooga County to the north, Polk County to the east, Bartow County to the south, and Gordon County to the west. The county seat is Rome, which is also the largest city in the county.
History
Floyd County was created in 1832 from Cherokee and Creek Indian lands. It was named for General John Floyd, a Revolutionary War hero and Georgia politician. The county was originally part of the Cherokee Nation, and the area was home to several Cherokee settlements. In 1838, the Cherokee were forcibly removed from the area during the Trail of Tears.
The county was largely rural until the late 19th century, when the railroad was built through the area. This brought new industry and economic growth to the county, and the city of Rome was established in 1834. The city quickly became the county seat and the center of commerce in the area.
Geography
Floyd County covers an area of 441 square miles, making it the 33rd largest county in Georgia. The terrain is mostly hilly, with the Appalachian Mountains to the north and the Etowah River running through the county. The highest point in the county is Mount Alto, which has an elevation of 1,890 feet.
The county is home to several state parks, including Red Top Mountain State Park, Chattahoochee Bend State Park, and the Etowah Indian Mounds State Historic Site.
Economy
The economy of Floyd County is largely based on manufacturing and agriculture. The county is home to several large manufacturing companies, including Mohawk Industries, Shaw Industries, and Georgia-Pacific. Agriculture is also an important part of the economy, with the county producing corn, soybeans, cotton, and other crops.
The county also has a growing tourism industry, with several attractions, including the Etowah Indian Mounds State Historic Site, the Rome-Floyd Planetarium, and the Chieftains Museum.
Demographics
As of the 2010 census, Floyd County had a population of 96,317. The racial makeup of the county was 75.3% White, 17.2% African American, 0.5% Native American, 1.7% Asian, 0.1% Pacific Islander, and 4.2% from other races. Hispanic or Latino of any race were 8.2% of the population.
The median household income in the county was $41,945, and the median family income was $50,945. The per capita income was $21,845. About 14.2% of the population was below the poverty line.
Common Questions
What is the Total Population of Floyd County?
Total Population of Floyd County is 98,541.
What is the Total Male Population of Floyd County?
Total Male Population of Floyd County is 48,250.
What is the Total Female Population of Floyd County?
Total Female Population of Floyd County is 50,291.
What is the Ratio of Males per 100 Females in Floyd County?
There are 95.94 Males per 100 Females in Floyd County.
What is the Ratio of Females per 100 Males in Floyd County?
There are 104.23 Females per 100 Males in Floyd County.
What is the Median Population Age in Floyd County?
Median Population Age in Floyd County is 38.0 Years.
What is the Average Family Size in Floyd County
Average Family Size in Floyd County is 3.2 People.
What is the Average Household Size in Floyd County
Average Household Size in Floyd County is 2.6 People.
What is Per Capita Income in Floyd County?
Per Capita income in Floyd County is $30,523.
What is the Median Family Income in Floyd County?
Median Family Income in Floyd County is $72,134.
What is the Median Household income in Floyd County?
Median Household Income in Floyd County is $57,868.
What is Income or Wage Gap in Floyd County?
Income or Wage Gap in Floyd County is 30.7%.
Women in Floyd County earn 69.3 cents for every dollar earned by a man.
What is Family Income Deficit in Floyd County?
Family Income Deficit in Floyd County is $10,515.
Families that are below poverty line in Floyd County earn $10,515 less on average than the poverty threshold level.
What is Inequality or Gini Index in Floyd County?
Inequality or Gini Index in Floyd County is 0.47.
How Large is the Labor Force in Floyd County?
There are 45,559 People in the Labor Forcein in Floyd County.
What is the Percentage of People in the Labor Force in Floyd County?
57.8% of People are in the Labor Force in Floyd County.
What is the Unemployment Rate in Floyd County?
Unemployment Rate in Floyd County is 4.1%.