Cities with the Most Immigrants from Uganda in the United States
RELATED REPORTS & OPTIONS
Uganda
United States
Compare Cities
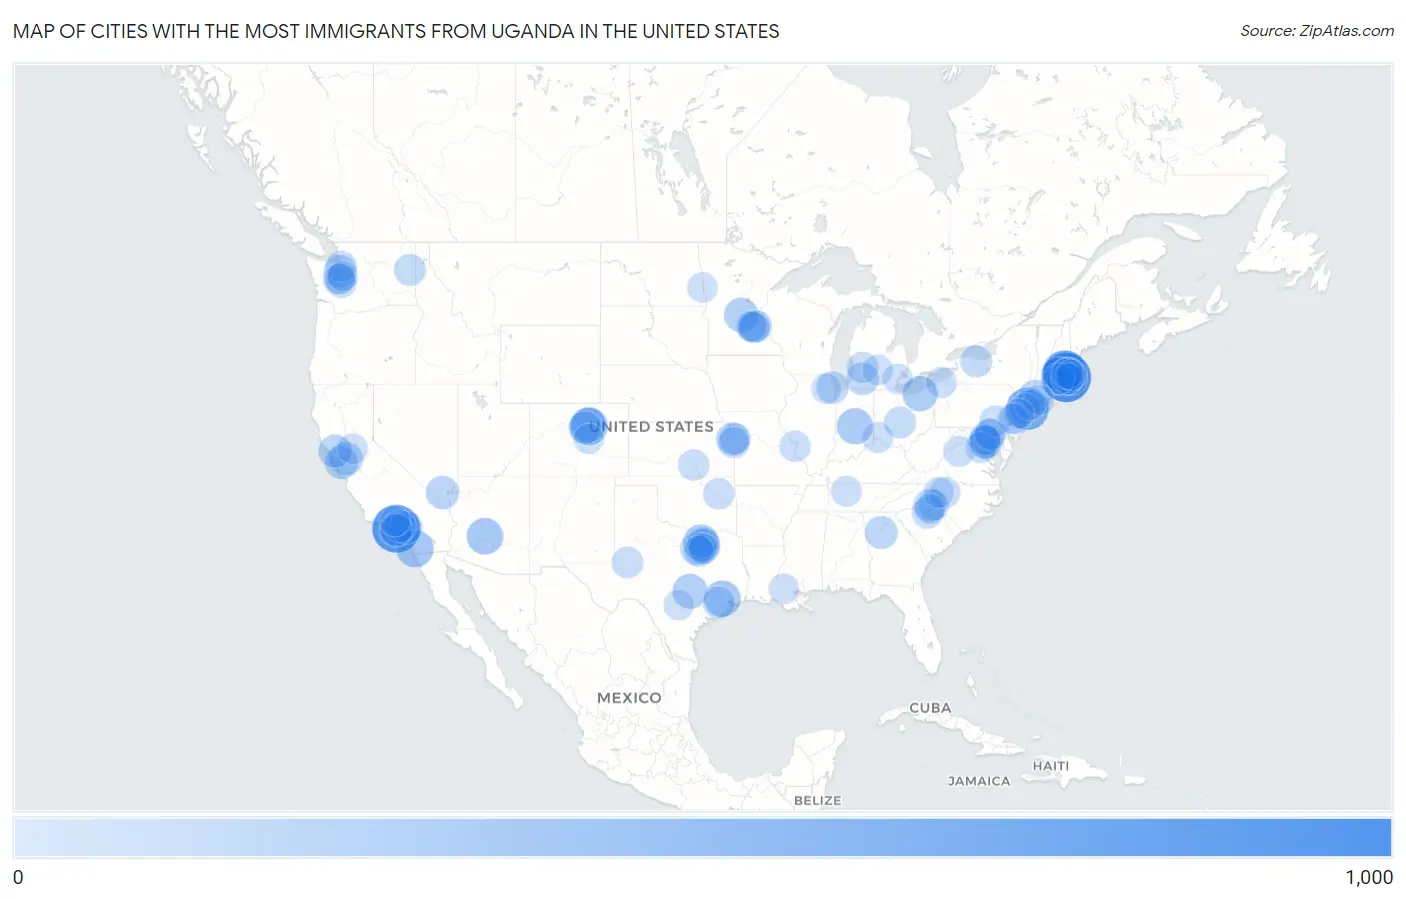
Map of Cities with the Most Immigrants from Uganda in the United States
0
1,000
Cities with the Most Immigrants from Uganda in the United States
| City | Uganda | vs State | vs National | |
| 1. | Waltham | 871 | 5,099(17.08%)#1 | 36,662(2.38%)#1 |
| 2. | Los Angeles | 800 | 4,329(18.48%)#1 | 36,662(2.18%)#2 |
| 3. | Lowell | 646 | 5,099(12.67%)#2 | 36,662(1.76%)#3 |
| 4. | New York | 574 | 1,200(47.83%)#1 | 36,662(1.57%)#4 |
| 5. | Denver | 380 | 1,172(32.42%)#1 | 36,662(1.04%)#5 |
| 6. | San Diego | 355 | 4,329(8.20%)#2 | 36,662(0.97%)#6 |
| 7. | Phoenix | 330 | 449(73.50%)#1 | 36,662(0.90%)#7 |
| 8. | Houston | 325 | 3,573(9.10%)#1 | 36,662(0.89%)#8 |
| 9. | Little Elm | 312 | 3,573(8.73%)#2 | 36,662(0.85%)#9 |
| 10. | Indianapolis | 304 | 366(83.06%)#1 | 36,662(0.83%)#10 |
| 11. | Cleveland Heights | 278 | 875(31.77%)#1 | 36,662(0.76%)#11 |
| 12. | Woburn | 278 | 5,099(5.45%)#3 | 36,662(0.76%)#12 |
| 13. | Austin | 265 | 3,573(7.42%)#3 | 36,662(0.72%)#13 |
| 14. | Commerce City | 257 | 1,172(21.93%)#2 | 36,662(0.70%)#14 |
| 15. | St Cloud | 246 | 1,547(15.90%)#1 | 36,662(0.67%)#15 |
| 16. | Framingham | 236 | 5,099(4.63%)#4 | 36,662(0.64%)#16 |
| 17. | Hawthorne | 221 | 4,329(5.11%)#3 | 36,662(0.60%)#17 |
| 18. | Burlington | 212 | 5,099(4.16%)#5 | 36,662(0.58%)#18 |
| 19. | Pittsburg | 207 | 4,329(4.78%)#4 | 36,662(0.56%)#19 |
| 20. | Oakland | 198 | 4,329(4.57%)#5 | 36,662(0.54%)#20 |
| 21. | Leominster | 198 | 5,099(3.88%)#6 | 36,662(0.54%)#21 |
| 22. | Santa Rosa | 197 | 4,329(4.55%)#6 | 36,662(0.54%)#22 |
| 23. | Paradise | 196 | 351(55.84%)#1 | 36,662(0.53%)#23 |
| 24. | Clarkston | 185 | 2,337(7.92%)#1 | 36,662(0.50%)#24 |
| 25. | Kansas City | 183 | 419(43.68%)#1 | 36,662(0.50%)#25 |
| 26. | Plano | 181 | 3,573(5.07%)#4 | 36,662(0.49%)#26 |
| 27. | Kalamazoo | 175 | 835(20.96%)#1 | 36,662(0.48%)#27 |
| 28. | Silver Spring | 173 | 1,672(10.35%)#1 | 36,662(0.47%)#28 |
| 29. | Danbury | 172 | 585(29.40%)#1 | 36,662(0.47%)#29 |
| 30. | Upland | 172 | 4,329(3.97%)#7 | 36,662(0.47%)#30 |
| 31. | Huntersville | 172 | 1,162(14.80%)#1 | 36,662(0.47%)#31 |
| 32. | Seattle | 170 | 1,754(9.69%)#1 | 36,662(0.46%)#32 |
| 33. | Lakewood | 167 | 1,172(14.25%)#3 | 36,662(0.46%)#33 |
| 34. | Chicago | 166 | 1,043(15.92%)#1 | 36,662(0.45%)#34 |
| 35. | Coral Hills | 163 | 1,672(9.75%)#2 | 36,662(0.44%)#35 |
| 36. | Minneapolis | 160 | 1,547(10.34%)#2 | 36,662(0.44%)#36 |
| 37. | Boston | 156 | 5,099(3.06%)#7 | 36,662(0.43%)#37 |
| 38. | Washington | 155 | 155(100.00%)#1 | 36,662(0.42%)#38 |
| 39. | Edgewater Borough | 155 | 1,291(12.01%)#1 | 36,662(0.42%)#39 |
| 40. | Pasadena | 152 | 4,329(3.51%)#8 | 36,662(0.41%)#40 |
| 41. | Haltom City | 150 | 3,573(4.20%)#5 | 36,662(0.41%)#41 |
| 42. | Rochester | 144 | 1,200(12.00%)#2 | 36,662(0.39%)#42 |
| 43. | Columbus | 141 | 875(16.11%)#2 | 36,662(0.38%)#43 |
| 44. | St Paul | 141 | 1,547(9.11%)#3 | 36,662(0.38%)#44 |
| 45. | Richmond | 141 | 3,573(3.95%)#6 | 36,662(0.38%)#45 |
| 46. | Spokane | 140 | 1,754(7.98%)#2 | 36,662(0.38%)#46 |
| 47. | Baltimore | 137 | 1,672(8.19%)#3 | 36,662(0.37%)#47 |
| 48. | Rock Hill | 137 | 312(43.91%)#1 | 36,662(0.37%)#48 |
| 49. | Tacoma | 130 | 1,754(7.41%)#3 | 36,662(0.35%)#49 |
| 50. | Midland | 129 | 3,573(3.61%)#7 | 36,662(0.35%)#50 |
| 51. | Inglewood | 127 | 4,329(2.93%)#9 | 36,662(0.35%)#51 |
| 52. | Newton | 123 | 5,099(2.41%)#8 | 36,662(0.34%)#52 |
| 53. | Kentwood | 122 | 835(14.61%)#2 | 36,662(0.33%)#53 |
| 54. | Wichita | 120 | 419(28.64%)#2 | 36,662(0.33%)#54 |
| 55. | Newark | 118 | 1,291(9.14%)#2 | 36,662(0.32%)#55 |
| 56. | Lancaster | 117 | 1,139(10.27%)#1 | 36,662(0.32%)#56 |
| 57. | Kansas City | 116 | 390(29.74%)#1 | 36,662(0.32%)#57 |
| 58. | Overland Park | 116 | 419(27.68%)#3 | 36,662(0.32%)#58 |
| 59. | Woodbourne | 116 | 1,139(10.18%)#2 | 36,662(0.32%)#59 |
| 60. | Broken Arrow | 115 | 429(26.81%)#1 | 36,662(0.31%)#60 |
| 61. | Woodbridge | 114 | 1,127(10.12%)#1 | 36,662(0.31%)#61 |
| 62. | University City | 114 | 390(29.23%)#2 | 36,662(0.31%)#62 |
| 63. | Worcester | 112 | 5,099(2.20%)#9 | 36,662(0.31%)#63 |
| 64. | Greensboro | 109 | 1,162(9.38%)#2 | 36,662(0.30%)#64 |
| 65. | Richfield | 109 | 1,547(7.05%)#4 | 36,662(0.30%)#65 |
| 66. | Harrisonburg | 108 | 1,127(9.58%)#2 | 36,662(0.29%)#66 |
| 67. | South Hill | 106 | 1,754(6.04%)#4 | 36,662(0.29%)#67 |
| 68. | Towson | 106 | 1,672(6.34%)#4 | 36,662(0.29%)#68 |
| 69. | Irving | 105 | 3,573(2.94%)#8 | 36,662(0.29%)#69 |
| 70. | Prosper | 105 | 3,573(2.94%)#9 | 36,662(0.29%)#70 |
| 71. | Martha Lake | 105 | 1,754(5.99%)#5 | 36,662(0.29%)#71 |
| 72. | Arlington | 104 | 3,573(2.91%)#10 | 36,662(0.28%)#72 |
| 73. | Cincinnati | 103 | 875(11.77%)#3 | 36,662(0.28%)#73 |
| 74. | Minnetonka | 103 | 1,547(6.66%)#5 | 36,662(0.28%)#74 |
| 75. | Pinehurst | 103 | 5,099(2.02%)#10 | 36,662(0.28%)#75 |
| 76. | Erie | 102 | 1,139(8.96%)#3 | 36,662(0.28%)#76 |
| 77. | Concord | 100 | 1,162(8.61%)#3 | 36,662(0.27%)#77 |
| 78. | Nashville | 96 | 251(38.25%)#1 | 36,662(0.26%)#78 |
| 79. | Calverton | 96 | 1,672(5.74%)#5 | 36,662(0.26%)#79 |
| 80. | Winston Salem | 95 | 1,162(8.18%)#4 | 36,662(0.26%)#80 |
| 81. | Warminster Heights | 95 | 1,139(8.34%)#4 | 36,662(0.26%)#81 |
| 82. | Lansing | 94 | 835(11.26%)#3 | 36,662(0.26%)#82 |
| 83. | Federal Way | 94 | 1,754(5.36%)#6 | 36,662(0.26%)#83 |
| 84. | Dallas | 92 | 3,573(2.57%)#11 | 36,662(0.25%)#84 |
| 85. | Bridgeport | 92 | 585(15.73%)#2 | 36,662(0.25%)#85 |
| 86. | Pelham Manor | 91 | 1,200(7.58%)#3 | 36,662(0.25%)#86 |
| 87. | Sacramento | 90 | 4,329(2.08%)#10 | 36,662(0.25%)#87 |
| 88. | Lynn | 90 | 5,099(1.77%)#11 | 36,662(0.25%)#88 |
| 89. | Charlotte | 89 | 1,162(7.66%)#5 | 36,662(0.24%)#89 |
| 90. | San Antonio | 87 | 3,573(2.43%)#12 | 36,662(0.24%)#90 |
| 91. | Baton Rouge | 86 | 244(35.25%)#1 | 36,662(0.23%)#91 |
| 92. | Ten Mile Run | 86 | 1,291(6.66%)#3 | 36,662(0.23%)#92 |
| 93. | Santa Clarita | 85 | 4,329(1.96%)#11 | 36,662(0.23%)#93 |
| 94. | Folcroft Borough | 85 | 1,139(7.46%)#5 | 36,662(0.23%)#94 |
| 95. | Naperville | 84 | 1,043(8.05%)#2 | 36,662(0.23%)#95 |
| 96. | Fargo | 84 | 85(98.82%)#1 | 36,662(0.23%)#96 |
| 97. | Kent | 83 | 1,754(4.73%)#7 | 36,662(0.23%)#97 |
| 98. | Melvindale | 83 | 835(9.94%)#4 | 36,662(0.23%)#98 |
| 99. | Roessleville | 83 | 1,200(6.92%)#4 | 36,662(0.23%)#99 |
| 100. | Woodmoor | 83 | 1,172(7.08%)#4 | 36,662(0.23%)#100 |
Common Questions
What are the Top 10 Cities with the Most Immigrants from Uganda in the United States?
Top 10 Cities with the Most Immigrants from Uganda in the United States are:
What city has the Most Immigrants from Uganda in the United States?
Waltham has the Most Immigrants from Uganda in the United States with 871.
What is the Total Immigrants from Uganda in the United States?
Total Immigrants from Uganda in the United States is 36,662.