Glynn County, GA
Glynn County Overview
84,566
TOTAL POPULATION
39,461
MALE POPULATION
45,105
FEMALE POPULATION
87.49
MALES / 100 FEMALES
114.30
FEMALES / 100 MALES
43.3
MEDIAN AGE
3.0
AVG FAMILY SIZE
2.4
AVG HOUSEHOLD SIZE
$39,221
PER CAPITA INCOME
$81,669
AVG FAMILY INCOME
$65,970
AVG HOUSEHOLD INCOME
30.6%
WAGE / INCOME GAP [ % ]
69.4¢/ $1
WAGE / INCOME GAP [ $ ]
$11,475
FAMILY INCOME DEFICIT
0.50
INEQUALITY / GINI INDEX
39,602
LABOR FORCE [ PEOPLE ]
57.7%
PERCENT IN LABOR FORCE
4.3%
UNEMPLOYMENT RATE
Glynn County Area Codes
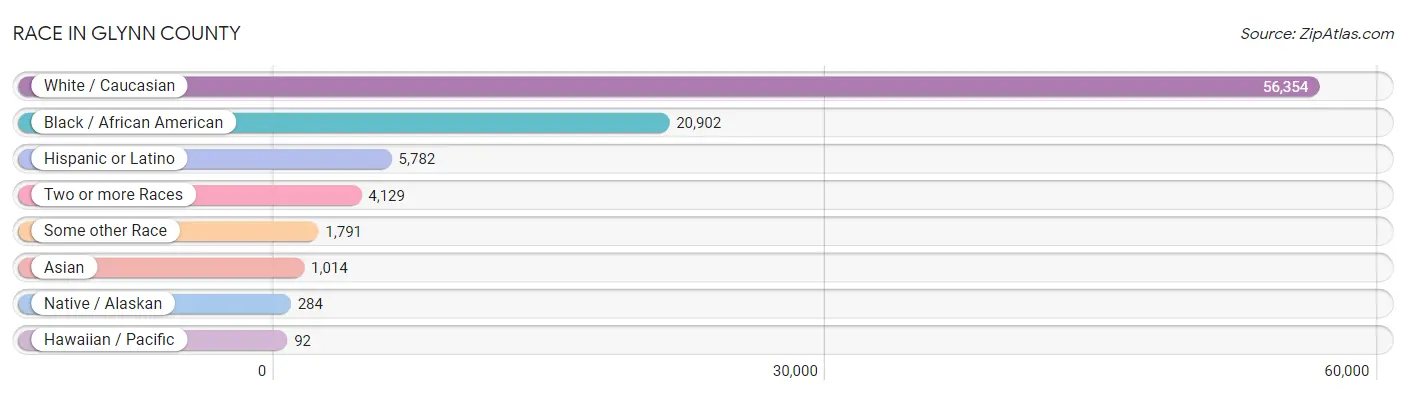
Race in Glynn County
The most populous races in Glynn County are White / Caucasian (56,354 | 66.6%), Black / African American (20,902 | 24.7%), and Hispanic or Latino (5,782 | 6.8%).
| Race | # Population | % Population |
| Asian | 1,014 | 1.2% |
| Black / African American | 20,902 | 24.7% |
| Hawaiian / Pacific | 92 | 0.1% |
| Hispanic or Latino | 5,782 | 6.8% |
| Native / Alaskan | 284 | 0.3% |
| White / Caucasian | 56,354 | 66.6% |
| Two or more Races | 4,129 | 4.9% |
| Some other Race | 1,791 | 2.1% |
| Total | 84,566 | 100.0% |
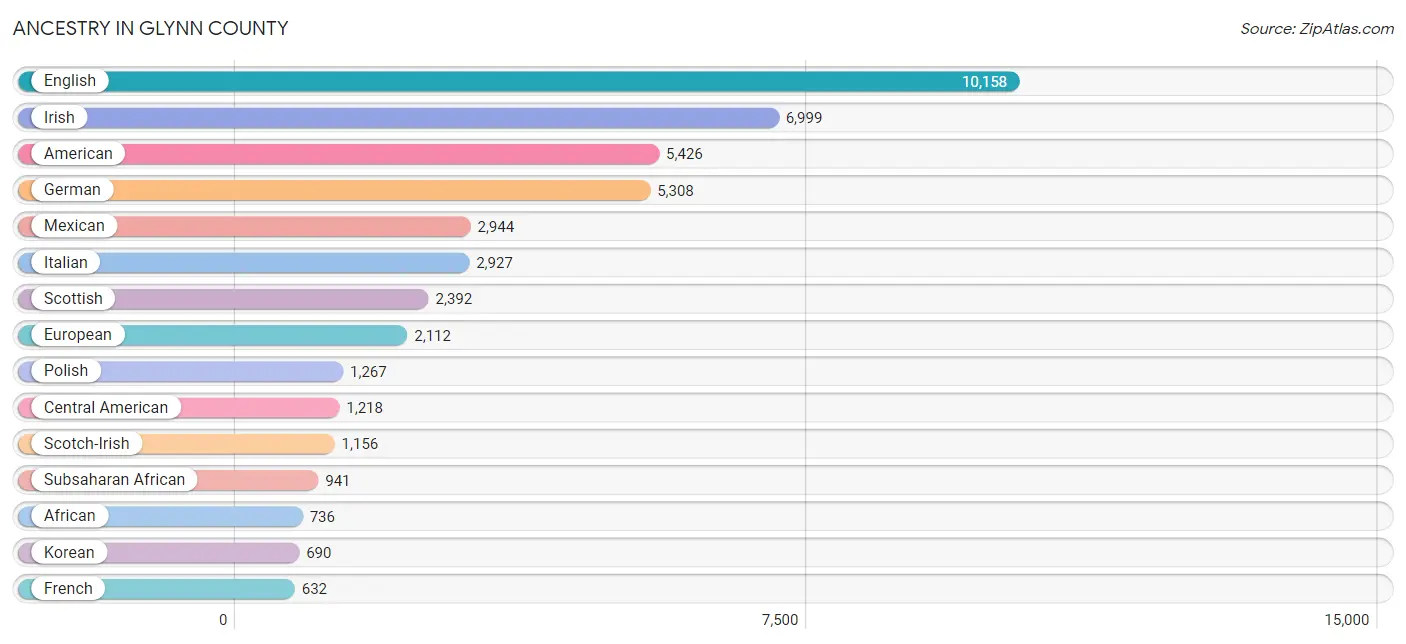
Ancestry in Glynn County
The most populous ancestries reported in Glynn County are English (10,158 | 12.0%), Irish (6,999 | 8.3%), American (5,426 | 6.4%), German (5,308 | 6.3%), and Mexican (2,944 | 3.5%), together accounting for 36.5% of all Glynn County residents.
| Ancestry | # Population | % Population |
| African | 736 | 0.9% |
| Albanian | 9 | 0.0% |
| American | 5,426 | 6.4% |
| Arab | 198 | 0.2% |
| Austrian | 123 | 0.2% |
| Bahamian | 26 | 0.0% |
| Barbadian | 95 | 0.1% |
| Belgian | 47 | 0.1% |
| Bhutanese | 93 | 0.1% |
| Blackfeet | 16 | 0.0% |
| Brazilian | 4 | 0.0% |
| British | 457 | 0.5% |
| Bulgarian | 6 | 0.0% |
| Burmese | 330 | 0.4% |
| Cambodian | 61 | 0.1% |
| Canadian | 94 | 0.1% |
| Central American | 1,218 | 1.4% |
| Central American Indian | 6 | 0.0% |
| Cherokee | 154 | 0.2% |
| Chilean | 81 | 0.1% |
| Chippewa | 5 | 0.0% |
| Choctaw | 87 | 0.1% |
| Colombian | 144 | 0.2% |
| Costa Rican | 16 | 0.0% |
| Croatian | 40 | 0.1% |
| Cuban | 103 | 0.1% |
| Czech | 66 | 0.1% |
| Czechoslovakian | 116 | 0.1% |
| Danish | 104 | 0.1% |
| Dominican | 108 | 0.1% |
| Dutch | 496 | 0.6% |
| Eastern European | 263 | 0.3% |
| Ecuadorian | 30 | 0.0% |
| English | 10,158 | 12.0% |
| European | 2,112 | 2.5% |
| Finnish | 95 | 0.1% |
| French | 632 | 0.7% |
| French Canadian | 195 | 0.2% |
| German | 5,308 | 6.3% |
| Greek | 336 | 0.4% |
| Guamanian / Chamorro | 50 | 0.1% |
| Guatemalan | 380 | 0.4% |
| Guyanese | 82 | 0.1% |
| Haitian | 103 | 0.1% |
| Honduran | 499 | 0.6% |
| Hungarian | 233 | 0.3% |
| Indian (Asian) | 77 | 0.1% |
| Irish | 6,999 | 8.3% |
| Italian | 2,927 | 3.5% |
| Jamaican | 97 | 0.1% |
| Japanese | 41 | 0.1% |
| Korean | 690 | 0.8% |
| Lebanese | 69 | 0.1% |
| Lithuanian | 78 | 0.1% |
| Luxembourger | 5 | 0.0% |
| Malaysian | 139 | 0.2% |
| Mexican | 2,944 | 3.5% |
| Mexican American Indian | 27 | 0.0% |
| Mongolian | 16 | 0.0% |
| Native Hawaiian | 173 | 0.2% |
| Navajo | 17 | 0.0% |
| Nigerian | 182 | 0.2% |
| Northern European | 126 | 0.2% |
| Norwegian | 473 | 0.6% |
| Pakistani | 61 | 0.1% |
| Panamanian | 67 | 0.1% |
| Pennsylvania German | 19 | 0.0% |
| Peruvian | 48 | 0.1% |
| Polish | 1,267 | 1.5% |
| Portuguese | 231 | 0.3% |
| Puerto Rican | 626 | 0.7% |
| Romanian | 81 | 0.1% |
| Russian | 502 | 0.6% |
| Salvadoran | 256 | 0.3% |
| Samoan | 6 | 0.0% |
| Scandinavian | 271 | 0.3% |
| Scotch-Irish | 1,156 | 1.4% |
| Scottish | 2,392 | 2.8% |
| Serbian | 15 | 0.0% |
| Sioux | 4 | 0.0% |
| Slavic | 20 | 0.0% |
| Slovak | 47 | 0.1% |
| Slovene | 15 | 0.0% |
| South African | 23 | 0.0% |
| South American | 422 | 0.5% |
| Spaniard | 8 | 0.0% |
| Spanish | 31 | 0.0% |
| Sri Lankan | 309 | 0.4% |
| Subsaharan African | 941 | 1.1% |
| Swedish | 437 | 0.5% |
| Swiss | 50 | 0.1% |
| Syrian | 4 | 0.0% |
| Thai | 65 | 0.1% |
| U.S. Virgin Islander | 24 | 0.0% |
| Ukrainian | 78 | 0.1% |
| Uruguayan | 55 | 0.1% |
| Venezuelan | 64 | 0.1% |
| Welsh | 359 | 0.4% |
| West Indian | 71 | 0.1% |
| Yugoslavian | 82 | 0.1% | View All 100 Rows |
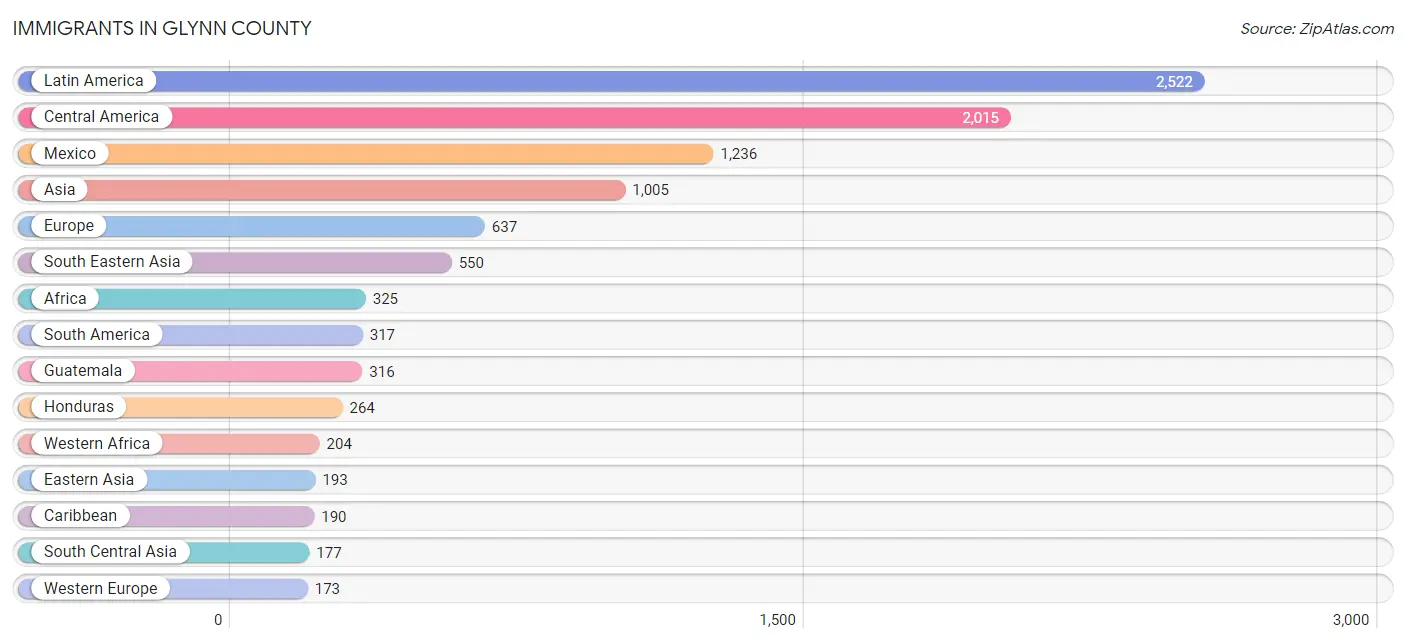
Immigrants in Glynn County
The most numerous immigrant groups reported in Glynn County came from Latin America (2,522 | 3.0%), Central America (2,015 | 2.4%), Mexico (1,236 | 1.5%), Asia (1,005 | 1.2%), and Europe (637 | 0.7%), together accounting for 8.8% of all Glynn County residents.
| Immigration Origin | # Population | % Population |
| Africa | 325 | 0.4% |
| Asia | 1,005 | 1.2% |
| Australia | 32 | 0.0% |
| Bahamas | 41 | 0.1% |
| Bangladesh | 16 | 0.0% |
| Belgium | 14 | 0.0% |
| Brazil | 4 | 0.0% |
| Cambodia | 116 | 0.1% |
| Canada | 153 | 0.2% |
| Caribbean | 190 | 0.2% |
| Central America | 2,015 | 2.4% |
| Chile | 81 | 0.1% |
| China | 53 | 0.1% |
| Colombia | 20 | 0.0% |
| Costa Rica | 16 | 0.0% |
| Cuba | 20 | 0.0% |
| Eastern Africa | 14 | 0.0% |
| Eastern Asia | 193 | 0.2% |
| Eastern Europe | 169 | 0.2% |
| El Salvador | 161 | 0.2% |
| England | 70 | 0.1% |
| Europe | 637 | 0.7% |
| France | 13 | 0.0% |
| Germany | 51 | 0.1% |
| Ghana | 50 | 0.1% |
| Guatemala | 316 | 0.4% |
| Guyana | 110 | 0.1% |
| Haiti | 16 | 0.0% |
| Honduras | 264 | 0.3% |
| Hungary | 30 | 0.0% |
| India | 129 | 0.2% |
| Iraq | 32 | 0.0% |
| Israel | 18 | 0.0% |
| Jamaica | 73 | 0.1% |
| Korea | 140 | 0.2% |
| Laos | 23 | 0.0% |
| Latin America | 2,522 | 3.0% |
| Lebanon | 35 | 0.0% |
| Malaysia | 16 | 0.0% |
| Mexico | 1,236 | 1.5% |
| Morocco | 84 | 0.1% |
| Netherlands | 95 | 0.1% |
| Nigeria | 154 | 0.2% |
| Northern Africa | 84 | 0.1% |
| Northern Europe | 165 | 0.2% |
| Oceania | 139 | 0.2% |
| Pakistan | 32 | 0.0% |
| Panama | 22 | 0.0% |
| Peru | 9 | 0.0% |
| Philippines | 152 | 0.2% |
| Poland | 26 | 0.0% |
| Portugal | 113 | 0.1% |
| Russia | 100 | 0.1% |
| Scotland | 19 | 0.0% |
| South Africa | 23 | 0.0% |
| South America | 317 | 0.4% |
| South Central Asia | 177 | 0.2% |
| South Eastern Asia | 550 | 0.6% |
| Southern Europe | 130 | 0.2% |
| Spain | 17 | 0.0% |
| Sweden | 34 | 0.0% |
| Thailand | 141 | 0.2% |
| Trinidad and Tobago | 40 | 0.1% |
| Uruguay | 48 | 0.1% |
| Venezuela | 45 | 0.1% |
| Vietnam | 102 | 0.1% |
| Western Africa | 204 | 0.2% |
| Western Asia | 85 | 0.1% |
| Western Europe | 173 | 0.2% | View All 69 Rows |
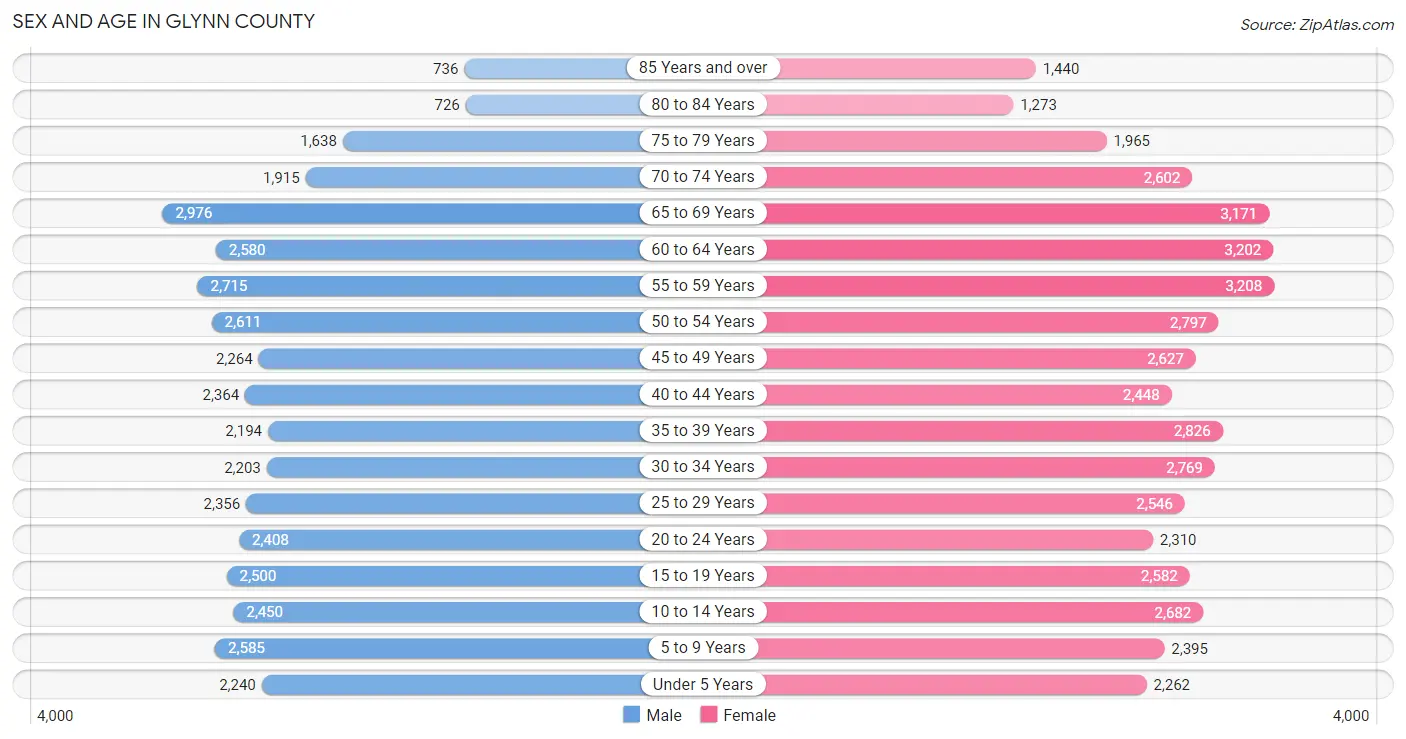
Sex and Age in Glynn County
Sex and Age in Glynn County
The most populous age groups in Glynn County are 65 to 69 Years (2,976 | 7.5%) for men and 55 to 59 Years (3,208 | 7.1%) for women.
| Age Bracket | Male | Female |
| Under 5 Years | 2,240 (5.7%) | 2,262 (5.0%) |
| 5 to 9 Years | 2,585 (6.6%) | 2,395 (5.3%) |
| 10 to 14 Years | 2,450 (6.2%) | 2,682 (5.9%) |
| 15 to 19 Years | 2,500 (6.3%) | 2,582 (5.7%) |
| 20 to 24 Years | 2,408 (6.1%) | 2,310 (5.1%) |
| 25 to 29 Years | 2,356 (6.0%) | 2,546 (5.6%) |
| 30 to 34 Years | 2,203 (5.6%) | 2,769 (6.1%) |
| 35 to 39 Years | 2,194 (5.6%) | 2,826 (6.3%) |
| 40 to 44 Years | 2,364 (6.0%) | 2,448 (5.4%) |
| 45 to 49 Years | 2,264 (5.7%) | 2,627 (5.8%) |
| 50 to 54 Years | 2,611 (6.6%) | 2,797 (6.2%) |
| 55 to 59 Years | 2,715 (6.9%) | 3,208 (7.1%) |
| 60 to 64 Years | 2,580 (6.5%) | 3,202 (7.1%) |
| 65 to 69 Years | 2,976 (7.5%) | 3,171 (7.0%) |
| 70 to 74 Years | 1,915 (4.9%) | 2,602 (5.8%) |
| 75 to 79 Years | 1,638 (4.2%) | 1,965 (4.4%) |
| 80 to 84 Years | 726 (1.8%) | 1,273 (2.8%) |
| 85 Years and over | 736 (1.9%) | 1,440 (3.2%) |
| Total | 39,461 (100.0%) | 45,105 (100.0%) |
Families and Households in Glynn County
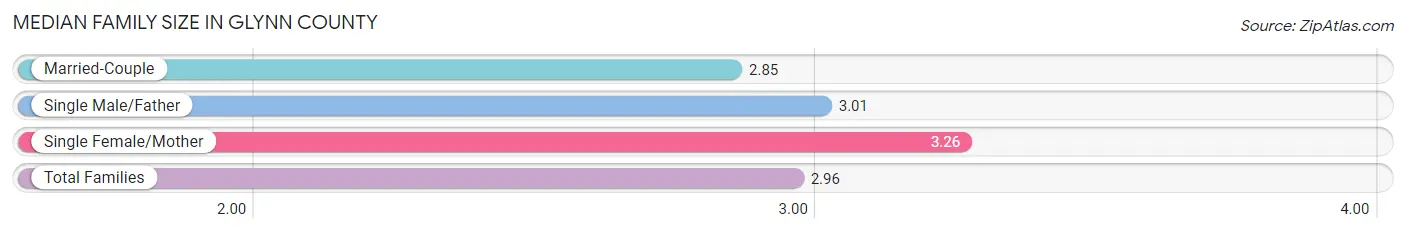
Median Family Size in Glynn County
The median family size in Glynn County is 2.96 persons per family, with single female/mother families (5,418 | 23.9%) accounting for the largest median family size of 3.26 persons per family. On the other hand, married-couple families (15,720 | 69.4%) represent the smallest median family size with 2.85 persons per family.
| Family Type | # Families | Family Size |
| Married-Couple | 15,720 (69.4%) | 2.85 |
| Single Male/Father | 1,524 (6.7%) | 3.01 |
| Single Female/Mother | 5,418 (23.9%) | 3.26 |
| Total Families | 22,662 (100.0%) | 2.96 |
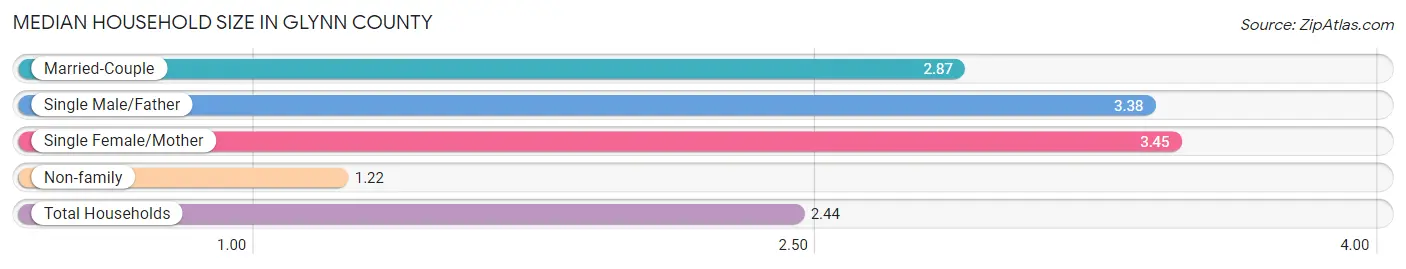
Median Household Size in Glynn County
The median household size in Glynn County is 2.44 persons per household, with single female/mother households (5,418 | 15.9%) accounting for the largest median household size of 3.45 persons per household. non-family households (11,329 | 33.3%) represent the smallest median household size with 1.22 persons per household.
| Household Type | # Households | Household Size |
| Married-Couple | 15,720 (46.3%) | 2.87 |
| Single Male/Father | 1,524 (4.5%) | 3.38 |
| Single Female/Mother | 5,418 (15.9%) | 3.45 |
| Non-family | 11,329 (33.3%) | 1.22 |
| Total Households | 33,991 (100.0%) | 2.44 |
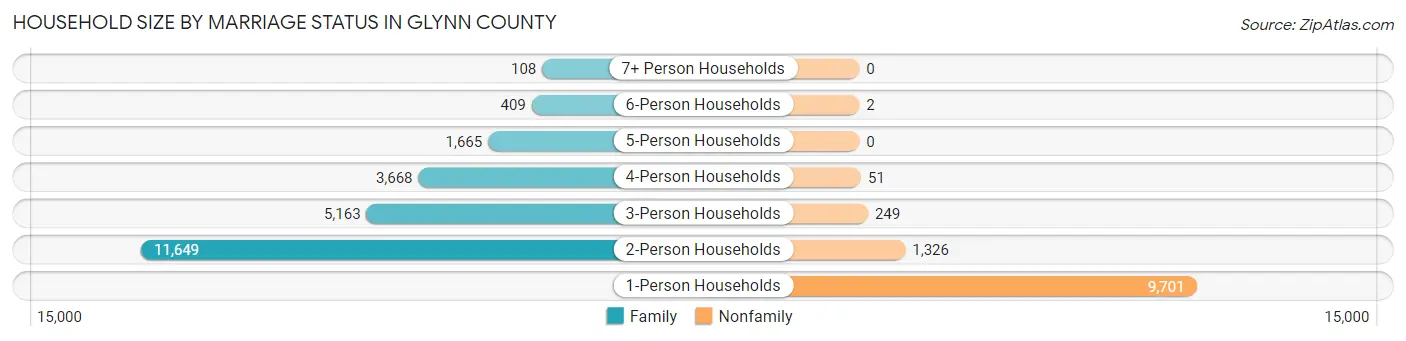
Household Size by Marriage Status in Glynn County
Out of a total of 33,991 households in Glynn County, 22,662 (66.7%) are family households, while 11,329 (33.3%) are nonfamily households. The most numerous type of family households are 2-person households, comprising 11,649, and the most common type of nonfamily households are 1-person households, comprising 9,701.
| Household Size | Family Households | Nonfamily Households |
| 1-Person Households | - | 9,701 (28.5%) |
| 2-Person Households | 11,649 (34.3%) | 1,326 (3.9%) |
| 3-Person Households | 5,163 (15.2%) | 249 (0.7%) |
| 4-Person Households | 3,668 (10.8%) | 51 (0.2%) |
| 5-Person Households | 1,665 (4.9%) | 0 (0.0%) |
| 6-Person Households | 409 (1.2%) | 2 (0.0%) |
| 7+ Person Households | 108 (0.3%) | 0 (0.0%) |
| Total | 22,662 (66.7%) | 11,329 (33.3%) |
Female Fertility in Glynn County
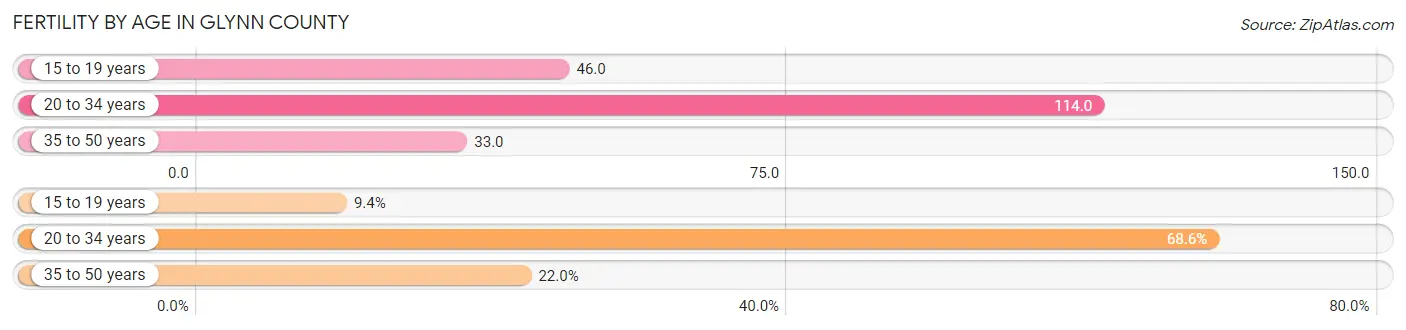
Fertility by Age in Glynn County
Average fertility rate in Glynn County is 68.0 births per 1,000 women. Women in the age bracket of 20 to 34 years have the highest fertility rate with 114.0 births per 1,000 women. Women in the age bracket of 20 to 34 years acount for 68.6% of all women with births.
| Age Bracket | Women with Births | Births / 1,000 Women |
| 15 to 19 years | 119 (9.4%) | 46.0 |
| 20 to 34 years | 866 (68.6%) | 114.0 |
| 35 to 50 years | 277 (22.0%) | 33.0 |
| Total | 1,262 (100.0%) | 68.0 |
Fertility by Age by Marriage Status in Glynn County
30.8% of women with births (1,262) in Glynn County are married. The highest percentage of unmarried women with births falls into 15 to 19 years age bracket with 100.0% of them unmarried at the time of birth, while the lowest percentage of unmarried women with births belong to 35 to 50 years age bracket with 35.4% of them unmarried.
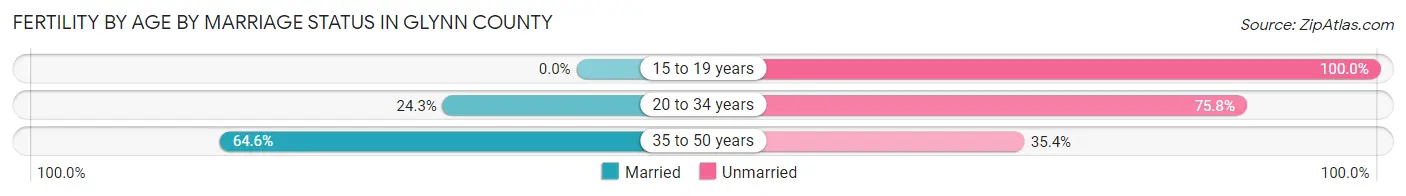
| Age Bracket | Married | Unmarried |
| 15 to 19 years | 0 (0.0%) | 119 (100.0%) |
| 20 to 34 years | 210 (24.2%) | 656 (75.7%) |
| 35 to 50 years | 179 (64.6%) | 98 (35.4%) |
| Total | 389 (30.8%) | 873 (69.2%) |
Fertility by Education in Glynn County
Average fertility rate in Glynn County is 68.0 births per 1,000 women. Women with the education attainment of high school diploma have the highest fertility rate of 114.0 births per 1,000 women, while women with the education attainment of college or associate's degree have the lowest fertility at 35.0 births per 1,000 women. Women with the education attainment of high school diploma represent 38.8% of all women with births.
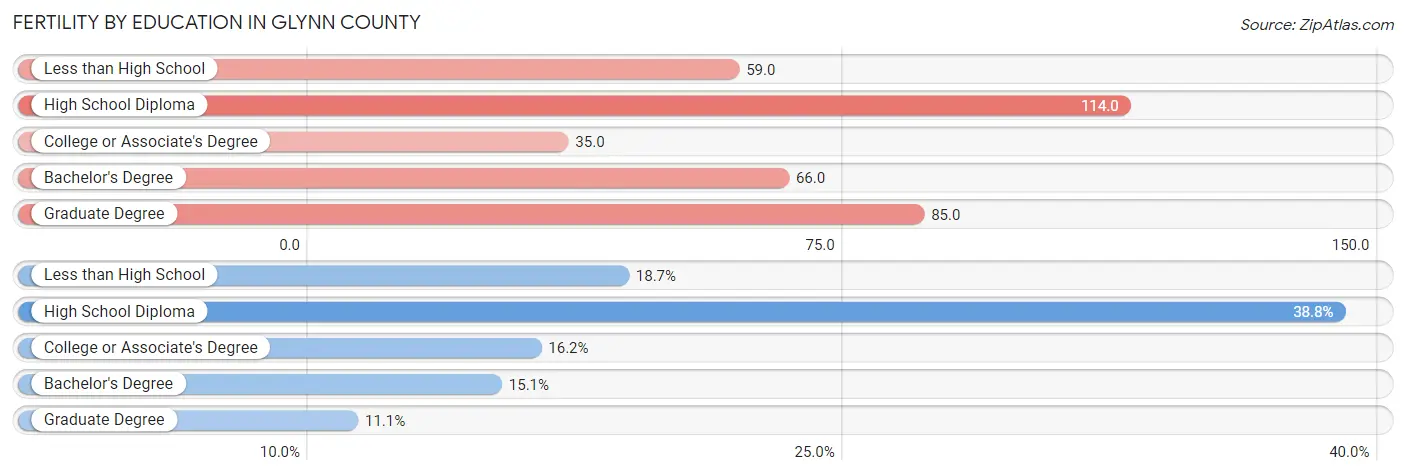
| Educational Attainment | Women with Births | Births / 1,000 Women |
| Less than High School | 236 (18.7%) | 59.0 |
| High School Diploma | 490 (38.8%) | 114.0 |
| College or Associate's Degree | 205 (16.2%) | 35.0 |
| Bachelor's Degree | 191 (15.1%) | 66.0 |
| Graduate Degree | 140 (11.1%) | 85.0 |
| Total | 1,262 (100.0%) | 68.0 |
Fertility by Education by Marriage Status in Glynn County
69.2% of women with births in Glynn County are unmarried. Women with the educational attainment of bachelor's degree are most likely to be married with 53.4% of them married at childbirth, while women with the educational attainment of high school diploma are least likely to be married with 79.2% of them unmarried at childbirth.
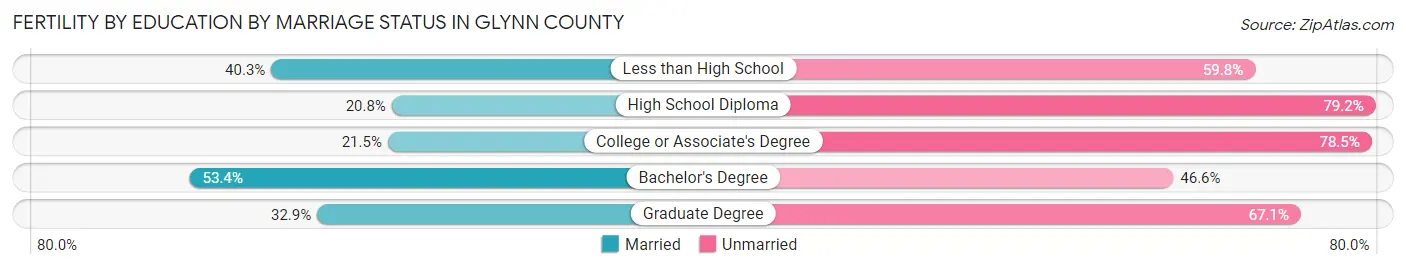
| Educational Attainment | Married | Unmarried |
| Less than High School | 95 (40.3%) | 141 (59.8%) |
| High School Diploma | 102 (20.8%) | 388 (79.2%) |
| College or Associate's Degree | 44 (21.5%) | 161 (78.5%) |
| Bachelor's Degree | 102 (53.4%) | 89 (46.6%) |
| Graduate Degree | 46 (32.9%) | 94 (67.1%) |
| Total | 389 (30.8%) | 873 (69.2%) |
Income in Glynn County
Income Overview in Glynn County
Per Capita Income in Glynn County is $39,221, while median incomes of families and households are $81,669 and $65,970 respectively.
| Characteristic | Number | Measure |
| Per Capita Income | 84,566 | $39,221 |
| Median Family Income | 22,662 | $81,669 |
| Mean Family Income | 22,662 | $111,383 |
| Median Household Income | 33,991 | $65,970 |
| Mean Household Income | 33,991 | $95,279 |
| Income Deficit | 22,662 | $11,475 |
| Wage / Income Gap (%) | 84,566 | 30.60% |
| Wage / Income Gap ($) | 84,566 | 69.40¢ per $1 |
| Gini / Inequality Index | 84,566 | 0.50 |
Earnings by Sex in Glynn County
Average Earnings in Glynn County are $37,139, $45,040 for men and $31,257 for women, a difference of 30.6%.
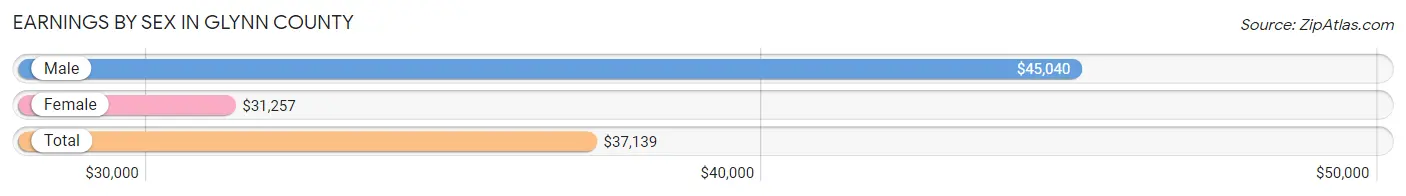
| Sex | Number | Average Earnings |
| Male | 20,593 (49.8%) | $45,040 |
| Female | 20,772 (50.2%) | $31,257 |
| Total | 41,365 (100.0%) | $37,139 |
Earnings by Sex by Income Bracket in Glynn County
The most common earnings brackets in Glynn County are $100,000+ for men (3,213 | 15.6%) and $30,000 to $34,999 for women (1,469 | 7.1%).
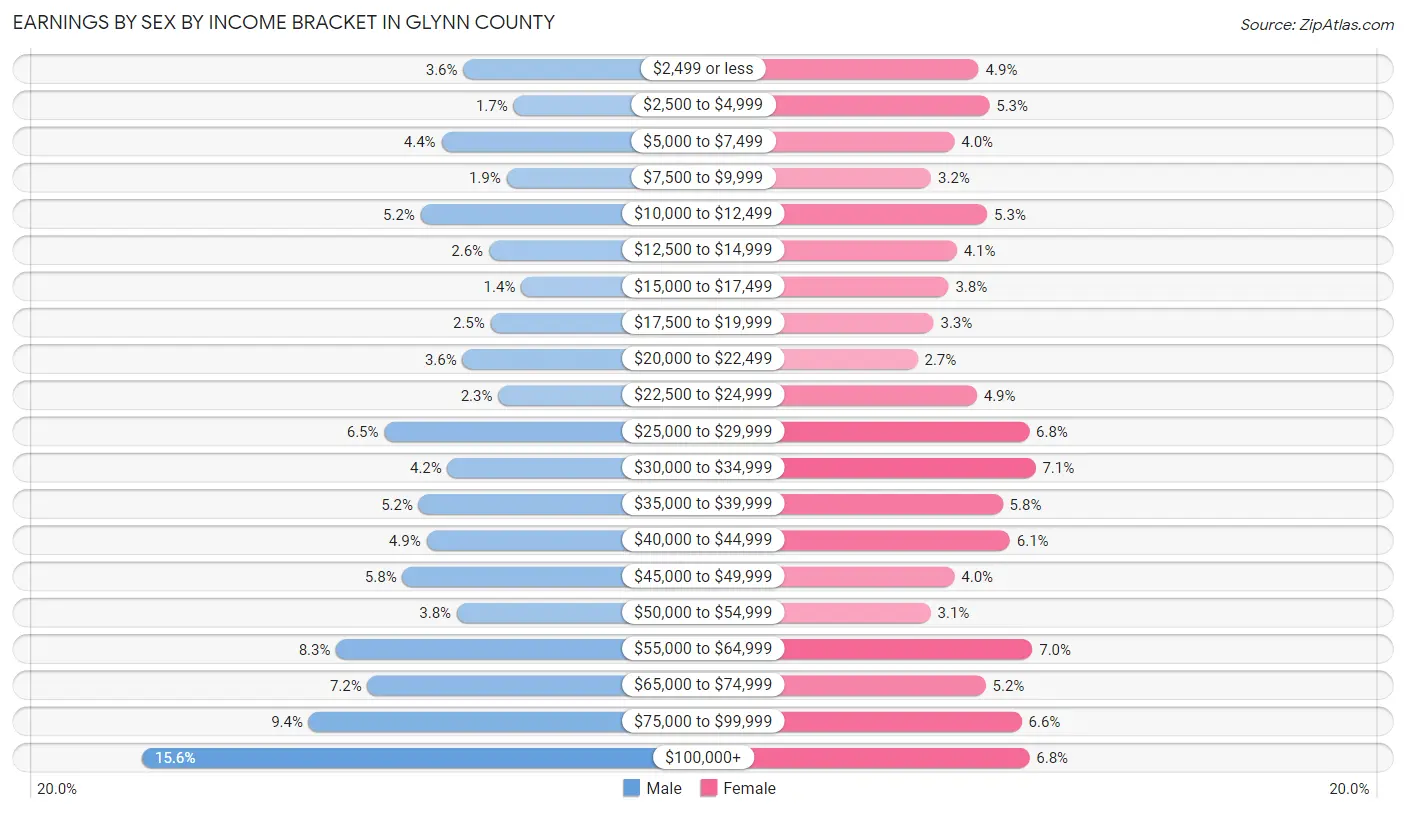
| Income | Male | Female |
| $2,499 or less | 734 (3.6%) | 1,027 (4.9%) |
| $2,500 to $4,999 | 346 (1.7%) | 1,110 (5.3%) |
| $5,000 to $7,499 | 902 (4.4%) | 837 (4.0%) |
| $7,500 to $9,999 | 400 (1.9%) | 656 (3.2%) |
| $10,000 to $12,499 | 1,063 (5.2%) | 1,093 (5.3%) |
| $12,500 to $14,999 | 536 (2.6%) | 855 (4.1%) |
| $15,000 to $17,499 | 286 (1.4%) | 791 (3.8%) |
| $17,500 to $19,999 | 524 (2.5%) | 676 (3.3%) |
| $20,000 to $22,499 | 740 (3.6%) | 550 (2.6%) |
| $22,500 to $24,999 | 463 (2.2%) | 1,012 (4.9%) |
| $25,000 to $29,999 | 1,342 (6.5%) | 1,418 (6.8%) |
| $30,000 to $34,999 | 855 (4.2%) | 1,469 (7.1%) |
| $35,000 to $39,999 | 1,076 (5.2%) | 1,214 (5.8%) |
| $40,000 to $44,999 | 1,017 (4.9%) | 1,270 (6.1%) |
| $45,000 to $49,999 | 1,203 (5.8%) | 838 (4.0%) |
| $50,000 to $54,999 | 782 (3.8%) | 653 (3.1%) |
| $55,000 to $64,999 | 1,713 (8.3%) | 1,443 (7.0%) |
| $65,000 to $74,999 | 1,472 (7.1%) | 1,080 (5.2%) |
| $75,000 to $99,999 | 1,926 (9.3%) | 1,360 (6.6%) |
| $100,000+ | 3,213 (15.6%) | 1,420 (6.8%) |
| Total | 20,593 (100.0%) | 20,772 (100.0%) |
Earnings by Sex by Educational Attainment in Glynn County
Average earnings in Glynn County are $51,231 for men and $36,144 for women, a difference of 29.4%. Men with an educational attainment of graduate degree enjoy the highest average annual earnings of $69,566, while those with less than high school education earn the least with $25,432. Women with an educational attainment of graduate degree earn the most with the average annual earnings of $64,810, while those with less than high school education have the smallest earnings of $23,300.
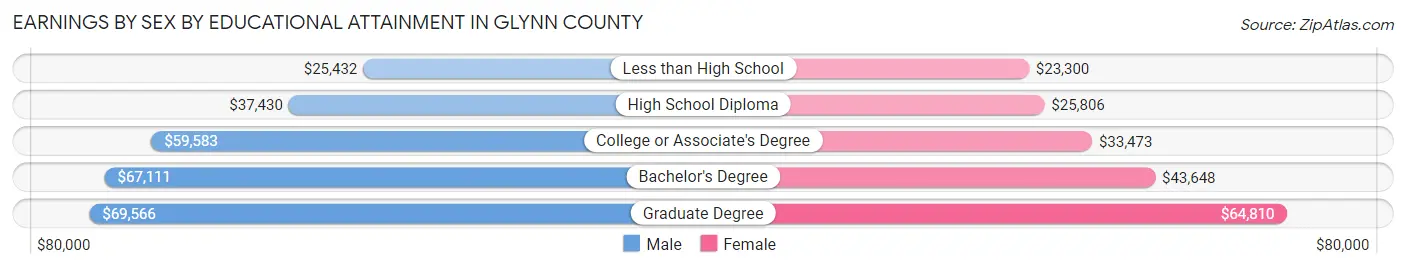
| Educational Attainment | Male Income | Female Income |
| Less than High School | $25,432 | $23,300 |
| High School Diploma | $37,430 | $25,806 |
| College or Associate's Degree | $59,583 | $33,473 |
| Bachelor's Degree | $67,111 | $43,648 |
| Graduate Degree | $69,566 | $64,810 |
| Total | $51,231 | $36,144 |
Family Income in Glynn County
Family Income Brackets in Glynn County
According to the Glynn County family income data, there are 4,192 families falling into the $100,000 to $149,999 income range, which is the most common income bracket and makes up 18.5% of all families. Conversely, the less than $10,000 income bracket is the least frequent group with only 816 families (3.6%) belonging to this category.
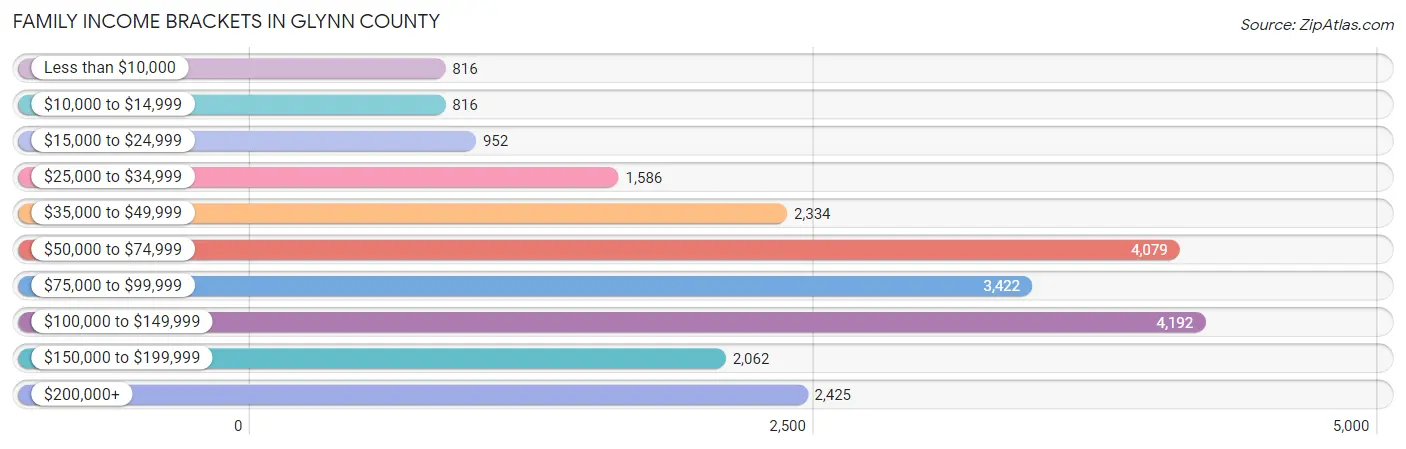
| Income Bracket | # Families | % Families |
| Less than $10,000 | 816 | 3.6% |
| $10,000 to $14,999 | 816 | 3.6% |
| $15,000 to $24,999 | 952 | 4.2% |
| $25,000 to $34,999 | 1,586 | 7.0% |
| $35,000 to $49,999 | 2,334 | 10.3% |
| $50,000 to $74,999 | 4,079 | 18.0% |
| $75,000 to $99,999 | 3,422 | 15.1% |
| $100,000 to $149,999 | 4,192 | 18.5% |
| $150,000 to $199,999 | 2,062 | 9.1% |
| $200,000+ | 2,425 | 10.7% |
Family Income by Famaliy Size in Glynn County
5-person families (1,284 | 5.7%) account for the highest median family income in Glynn County with $112,105 per family, while 2-person families (12,237 | 54.0%) have the highest median income of $39,907 per family member.
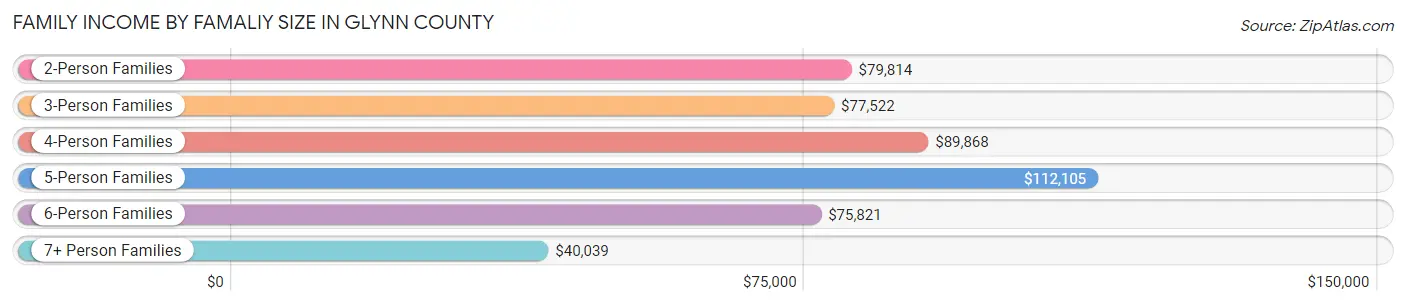
| Income Bracket | # Families | Median Income |
| 2-Person Families | 12,237 (54.0%) | $79,814 |
| 3-Person Families | 5,501 (24.3%) | $77,522 |
| 4-Person Families | 3,142 (13.9%) | $89,868 |
| 5-Person Families | 1,284 (5.7%) | $112,105 |
| 6-Person Families | 401 (1.8%) | $75,821 |
| 7+ Person Families | 97 (0.4%) | $40,039 |
| Total | 22,662 (100.0%) | $81,669 |
Family Income by Number of Earners in Glynn County
The median family income in Glynn County is $81,669, with families comprising 3+ earners (1,895) having the highest median family income of $134,533, while families with 1 earner (7,631) have the lowest median family income of $53,870, accounting for 8.4% and 33.7% of families, respectively.
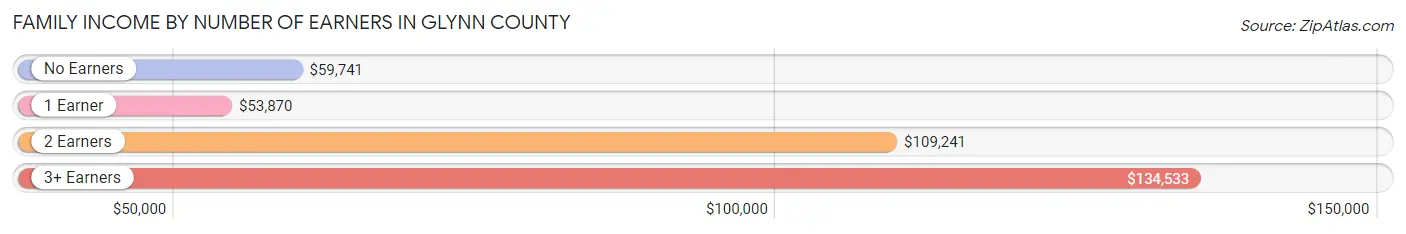
| Number of Earners | # Families | Median Income |
| No Earners | 4,887 (21.6%) | $59,741 |
| 1 Earner | 7,631 (33.7%) | $53,870 |
| 2 Earners | 8,249 (36.4%) | $109,241 |
| 3+ Earners | 1,895 (8.4%) | $134,533 |
| Total | 22,662 (100.0%) | $81,669 |
Household Income in Glynn County
Household Income Brackets in Glynn County
With 6,118 households falling in the category, the $50,000 to $74,999 income range is the most frequent in Glynn County, accounting for 18.0% of all households. In contrast, only 1,224 households (3.6%) fall into the $10,000 to $14,999 income bracket, making it the least populous group.
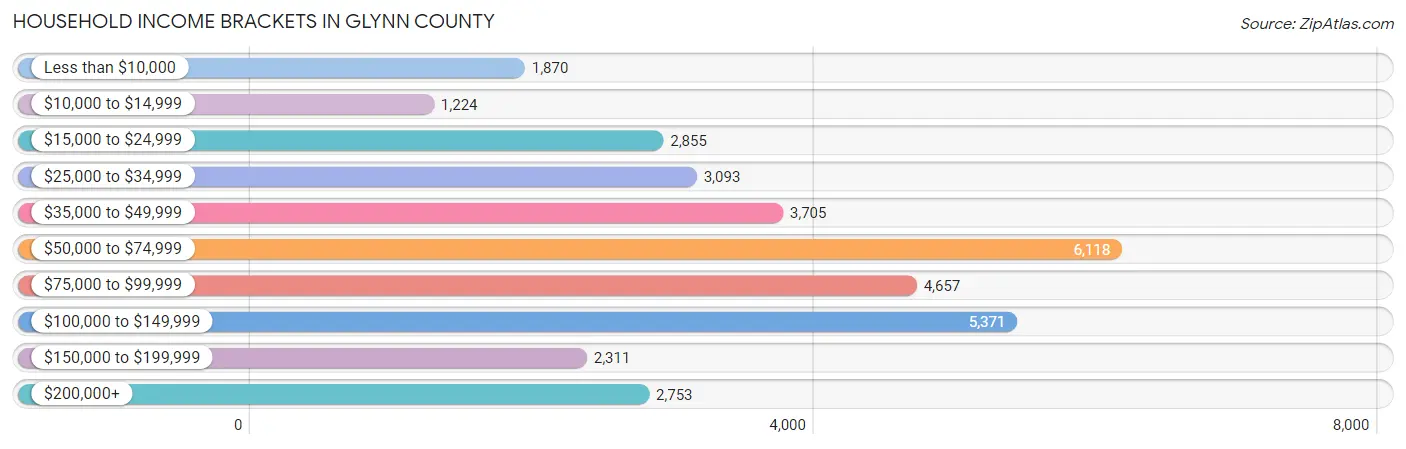
| Income Bracket | # Households | % Households |
| Less than $10,000 | 1,870 | 5.5% |
| $10,000 to $14,999 | 1,224 | 3.6% |
| $15,000 to $24,999 | 2,855 | 8.4% |
| $25,000 to $34,999 | 3,093 | 9.1% |
| $35,000 to $49,999 | 3,705 | 10.9% |
| $50,000 to $74,999 | 6,118 | 18.0% |
| $75,000 to $99,999 | 4,657 | 13.7% |
| $100,000 to $149,999 | 5,371 | 15.8% |
| $150,000 to $199,999 | 2,311 | 6.8% |
| $200,000+ | 2,753 | 8.1% |
Household Income by Householder Age in Glynn County
The median household income in Glynn County is $65,970, with the highest median household income of $74,000 found in the 45 to 64 years age bracket for the primary householder. A total of 12,530 households (36.9%) fall into this category. Meanwhile, the 15 to 24 years age bracket for the primary householder has the lowest median household income of $46,956, with 797 households (2.3%) in this group.
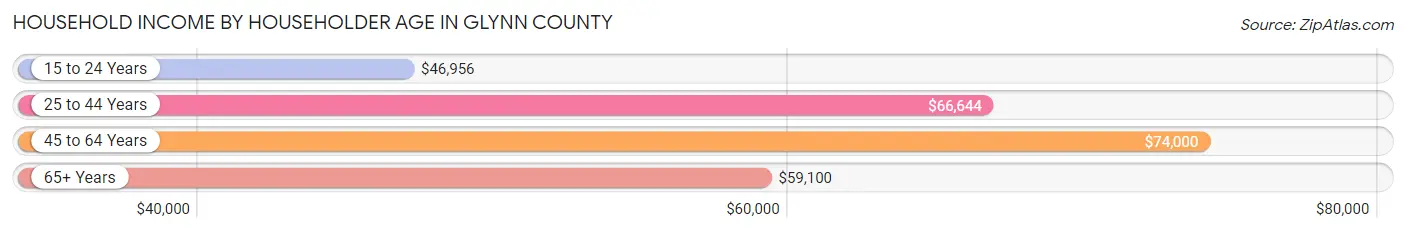
| Income Bracket | # Households | Median Income |
| 15 to 24 Years | 797 (2.3%) | $46,956 |
| 25 to 44 Years | 8,990 (26.5%) | $66,644 |
| 45 to 64 Years | 12,530 (36.9%) | $74,000 |
| 65+ Years | 11,674 (34.3%) | $59,100 |
| Total | 33,991 (100.0%) | $65,970 |
Poverty in Glynn County
Income Below Poverty by Sex and Age in Glynn County
With 15.3% poverty level for males and 17.4% for females among the residents of Glynn County, 16 and 17 year old males and 5 year old females are the most vulnerable to poverty, with 261 males (34.3%) and 343 females (76.9%) in their respective age groups living below the poverty level.
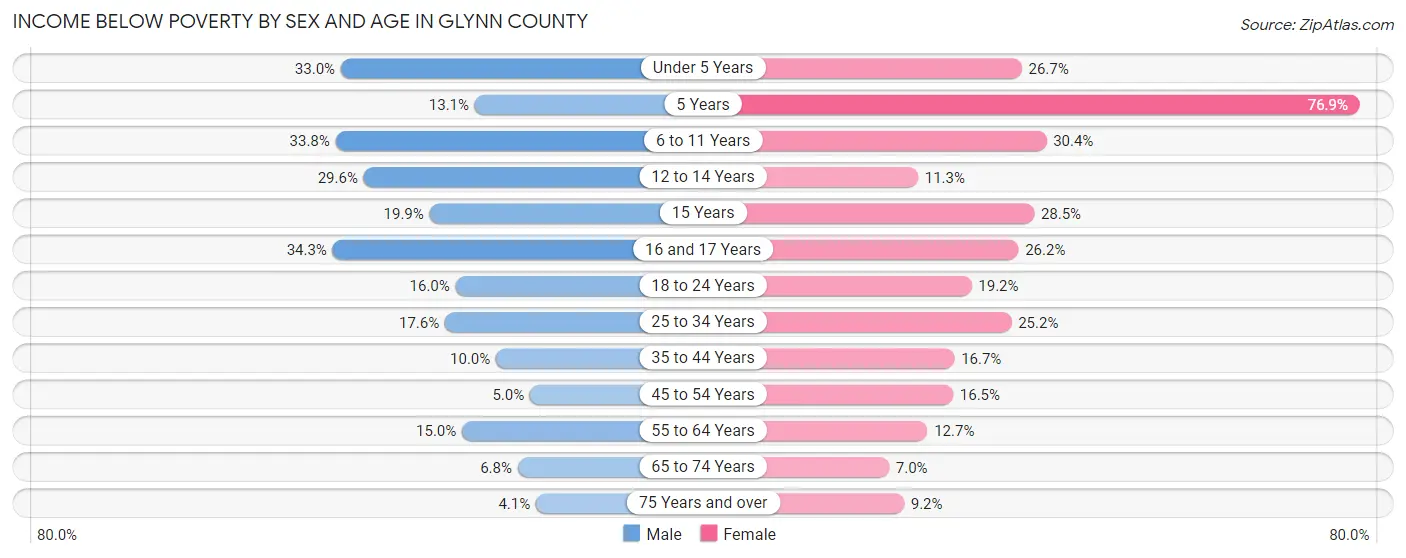
| Age Bracket | Male | Female |
| Under 5 Years | 729 (33.0%) | 599 (26.7%) |
| 5 Years | 36 (13.1%) | 343 (76.9%) |
| 6 to 11 Years | 1,002 (33.8%) | 828 (30.3%) |
| 12 to 14 Years | 533 (29.6%) | 198 (11.3%) |
| 15 Years | 137 (19.9%) | 178 (28.5%) |
| 16 and 17 Years | 261 (34.3%) | 279 (26.2%) |
| 18 to 24 Years | 520 (16.0%) | 579 (19.2%) |
| 25 to 34 Years | 780 (17.6%) | 1,327 (25.2%) |
| 35 to 44 Years | 448 (10.0%) | 876 (16.7%) |
| 45 to 54 Years | 239 (5.0%) | 893 (16.5%) |
| 55 to 64 Years | 788 (15.0%) | 811 (12.7%) |
| 65 to 74 Years | 328 (6.8%) | 399 (7.0%) |
| 75 Years and over | 121 (4.1%) | 406 (9.2%) |
| Total | 5,922 (15.3%) | 7,716 (17.4%) |
Income Above Poverty by Sex and Age in Glynn County
According to the poverty statistics in Glynn County, males aged 75 years and over and females aged 65 to 74 years are the age groups that are most secure financially, with 96.0% of males and 93.0% of females in these age groups living above the poverty line.
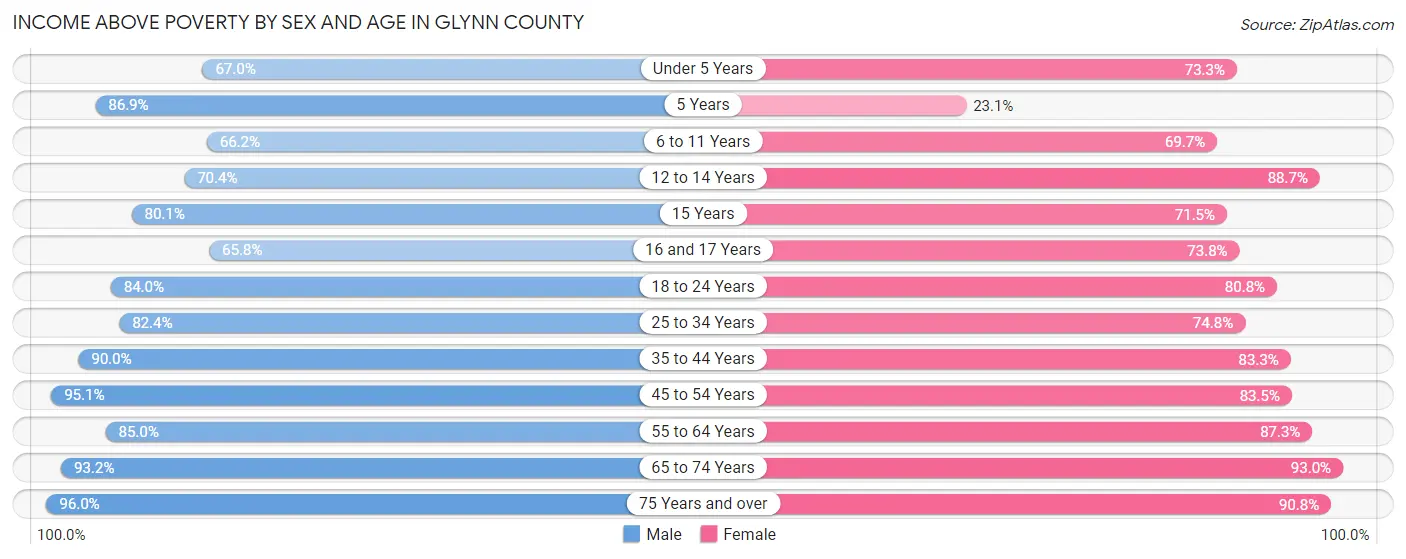
| Age Bracket | Male | Female |
| Under 5 Years | 1,478 (67.0%) | 1,645 (73.3%) |
| 5 Years | 238 (86.9%) | 103 (23.1%) |
| 6 to 11 Years | 1,961 (66.2%) | 1,900 (69.7%) |
| 12 to 14 Years | 1,265 (70.4%) | 1,555 (88.7%) |
| 15 Years | 553 (80.1%) | 446 (71.5%) |
| 16 and 17 Years | 501 (65.7%) | 786 (73.8%) |
| 18 to 24 Years | 2,729 (84.0%) | 2,431 (80.8%) |
| 25 to 34 Years | 3,659 (82.4%) | 3,947 (74.8%) |
| 35 to 44 Years | 4,039 (90.0%) | 4,374 (83.3%) |
| 45 to 54 Years | 4,594 (95.1%) | 4,522 (83.5%) |
| 55 to 64 Years | 4,456 (85.0%) | 5,579 (87.3%) |
| 65 to 74 Years | 4,522 (93.2%) | 5,312 (93.0%) |
| 75 Years and over | 2,863 (96.0%) | 4,009 (90.8%) |
| Total | 32,858 (84.7%) | 36,609 (82.6%) |
Income Below Poverty Among Married-Couple Families in Glynn County
The poverty statistics for married-couple families in Glynn County show that 5.2% or 818 of the total 15,720 families live below the poverty line. Families with 5 or more children have the highest poverty rate of 86.4%, comprising of 38 families. On the other hand, families with no children have the lowest poverty rate of 3.5%, which includes 383 families.
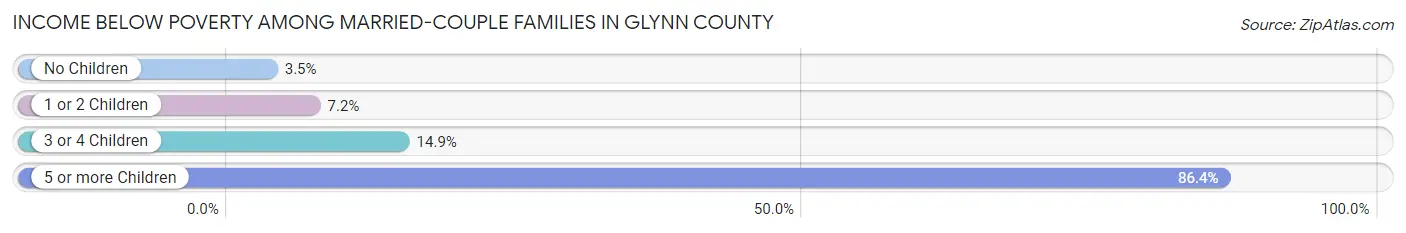
| Children | Above Poverty | Below Poverty |
| No Children | 10,689 (96.5%) | 383 (3.5%) |
| 1 or 2 Children | 3,484 (92.8%) | 270 (7.2%) |
| 3 or 4 Children | 723 (85.1%) | 127 (14.9%) |
| 5 or more Children | 6 (13.6%) | 38 (86.4%) |
| Total | 14,902 (94.8%) | 818 (5.2%) |
Income Below Poverty Among Single-Parent Households in Glynn County
According to the poverty data in Glynn County, 18.6% or 283 single-father households and 27.6% or 1,495 single-mother households are living below the poverty line. Among single-father households, those with 5 or more children have the highest poverty rate, with 32 households (74.4%) experiencing poverty. Likewise, among single-mother households, those with 5 or more children have the highest poverty rate, with 83 households (90.2%) falling below the poverty line.
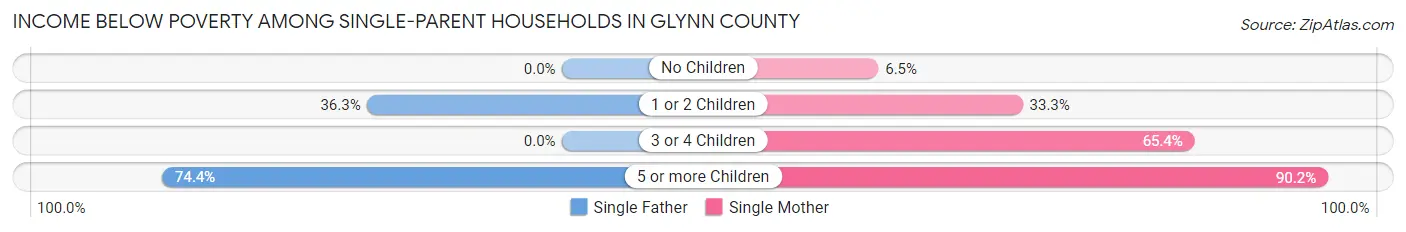
| Children | Single Father | Single Mother |
| No Children | 0 (0.0%) | 133 (6.5%) |
| 1 or 2 Children | 251 (36.3%) | 890 (33.3%) |
| 3 or 4 Children | 0 (0.0%) | 389 (65.4%) |
| 5 or more Children | 32 (74.4%) | 83 (90.2%) |
| Total | 283 (18.6%) | 1,495 (27.6%) |
Income Below Poverty Among Married-Couple vs Single-Parent Households in Glynn County
The poverty data for Glynn County shows that 818 of the married-couple family households (5.2%) and 1,778 of the single-parent households (25.6%) are living below the poverty level. Within the married-couple family households, those with 5 or more children have the highest poverty rate, with 38 households (86.4%) falling below the poverty line. Among the single-parent households, those with 5 or more children have the highest poverty rate, with 115 household (85.2%) living below poverty.
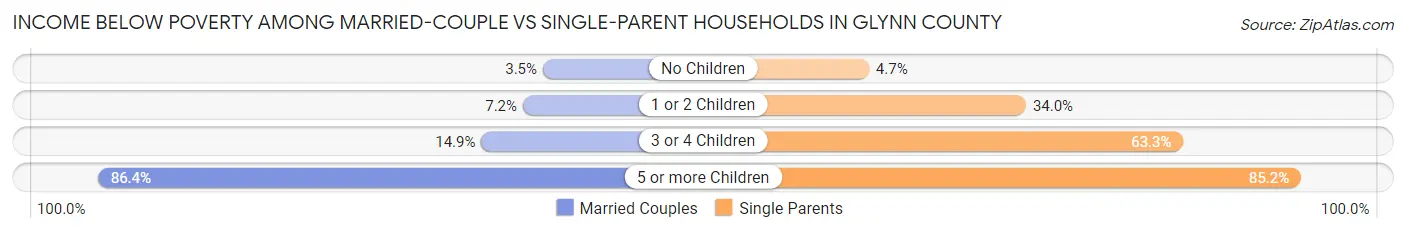
| Children | Married-Couple Families | Single-Parent Households |
| No Children | 383 (3.5%) | 133 (4.7%) |
| 1 or 2 Children | 270 (7.2%) | 1,141 (34.0%) |
| 3 or 4 Children | 127 (14.9%) | 389 (63.2%) |
| 5 or more Children | 38 (86.4%) | 115 (85.2%) |
| Total | 818 (5.2%) | 1,778 (25.6%) |
Employment Characteristics in Glynn County
Employment by Class of Employer in Glynn County
Among the 36,929 employed individuals in Glynn County, private company employees (23,925 | 64.8%), self-employed (not incorporated) (2,775 | 7.5%), and not-for-profit organizations (2,445 | 6.6%) make up the most common classes of employment.
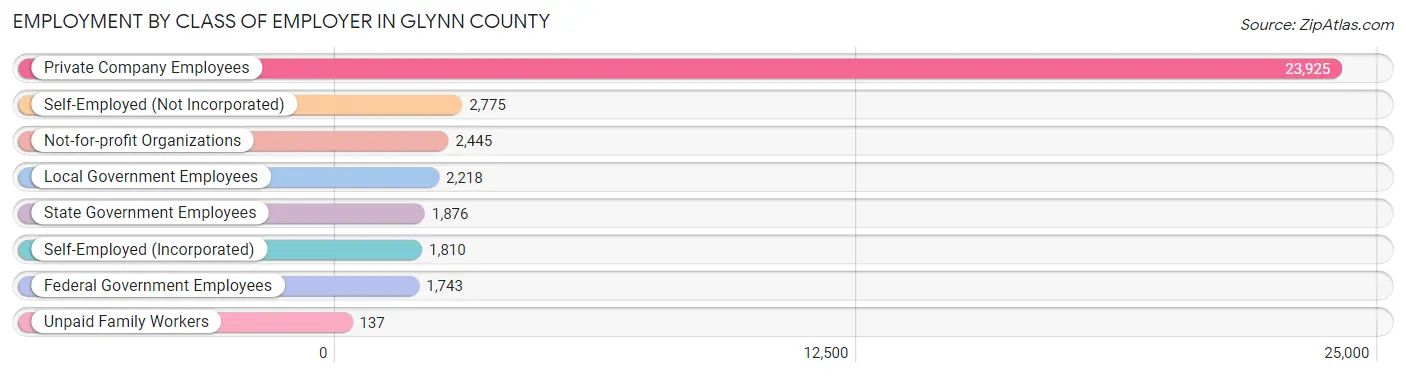
| Employer Class | # Employees | % Employees |
| Private Company Employees | 23,925 | 64.8% |
| Self-Employed (Incorporated) | 1,810 | 4.9% |
| Self-Employed (Not Incorporated) | 2,775 | 7.5% |
| Not-for-profit Organizations | 2,445 | 6.6% |
| Local Government Employees | 2,218 | 6.0% |
| State Government Employees | 1,876 | 5.1% |
| Federal Government Employees | 1,743 | 4.7% |
| Unpaid Family Workers | 137 | 0.4% |
| Total | 36,929 | 100.0% |
Employment Status by Age in Glynn County
According to the labor force statistics for Glynn County, out of the total population over 16 years of age (68,635), 57.7% or 39,602 individuals are in the labor force, with 4.3% or 1,703 of them unemployed. The age group with the highest labor force participation rate is 45 to 54 years, with 82.7% or 8,517 individuals in the labor force. Within the labor force, the 16 to 19 years age range has the highest percentage of unemployed individuals, with 9.7% or 157 of them being unemployed.
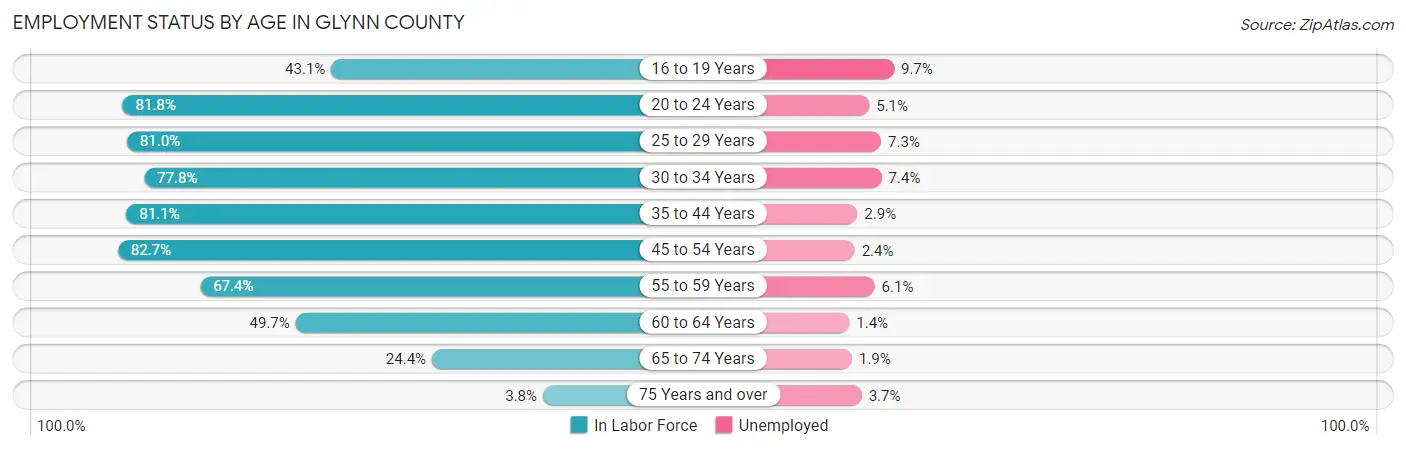
| Age Bracket | In Labor Force | Unemployed |
| 16 to 19 Years | 1,623 (43.1%) | 157 (9.7%) |
| 20 to 24 Years | 3,859 (81.8%) | 197 (5.1%) |
| 25 to 29 Years | 3,971 (81.0%) | 290 (7.3%) |
| 30 to 34 Years | 3,868 (77.8%) | 286 (7.4%) |
| 35 to 44 Years | 7,974 (81.1%) | 231 (2.9%) |
| 45 to 54 Years | 8,517 (82.7%) | 204 (2.4%) |
| 55 to 59 Years | 3,992 (67.4%) | 244 (6.1%) |
| 60 to 64 Years | 2,874 (49.7%) | 40 (1.4%) |
| 65 to 74 Years | 2,602 (24.4%) | 49 (1.9%) |
| 75 Years and over | 296 (3.8%) | 11 (3.7%) |
| Total | 39,602 (57.7%) | 1,703 (4.3%) |
Employment Status by Educational Attainment in Glynn County
According to labor force statistics for Glynn County, 74.8% of individuals (31,199) out of the total population between 25 and 64 years of age (41,710) are in the labor force, with 4.2% or 1,310 of them being unemployed. The group with the highest labor force participation rate are those with the educational attainment of bachelor's degree or higher, with 84.6% or 10,186 individuals in the labor force. Within the labor force, individuals with less than high school education have the highest percentage of unemployment, with 5.8% or 192 of them being unemployed.
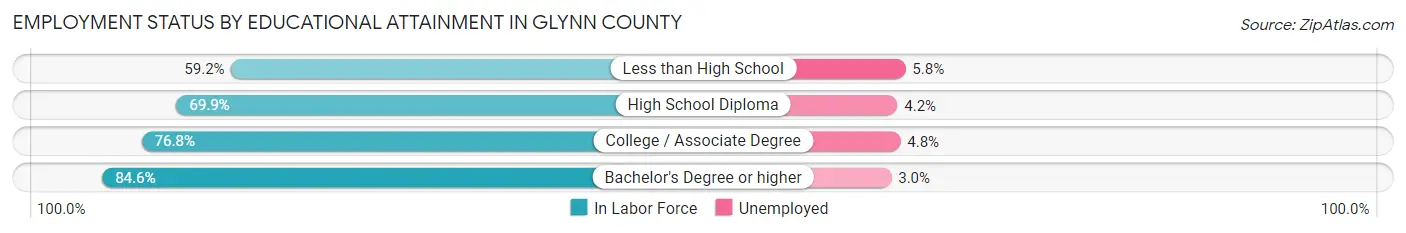
| Educational Attainment | In Labor Force | Unemployed |
| Less than High School | 3,303 (59.2%) | 324 (5.8%) |
| High School Diploma | 7,938 (69.9%) | 477 (4.2%) |
| College / Associate Degree | 9,780 (76.8%) | 611 (4.8%) |
| Bachelor's Degree or higher | 10,186 (84.6%) | 361 (3.0%) |
| Total | 31,199 (74.8%) | 1,752 (4.2%) |
Employment Occupations by Sex in Glynn County
Management, Business, Science and Arts Occupations
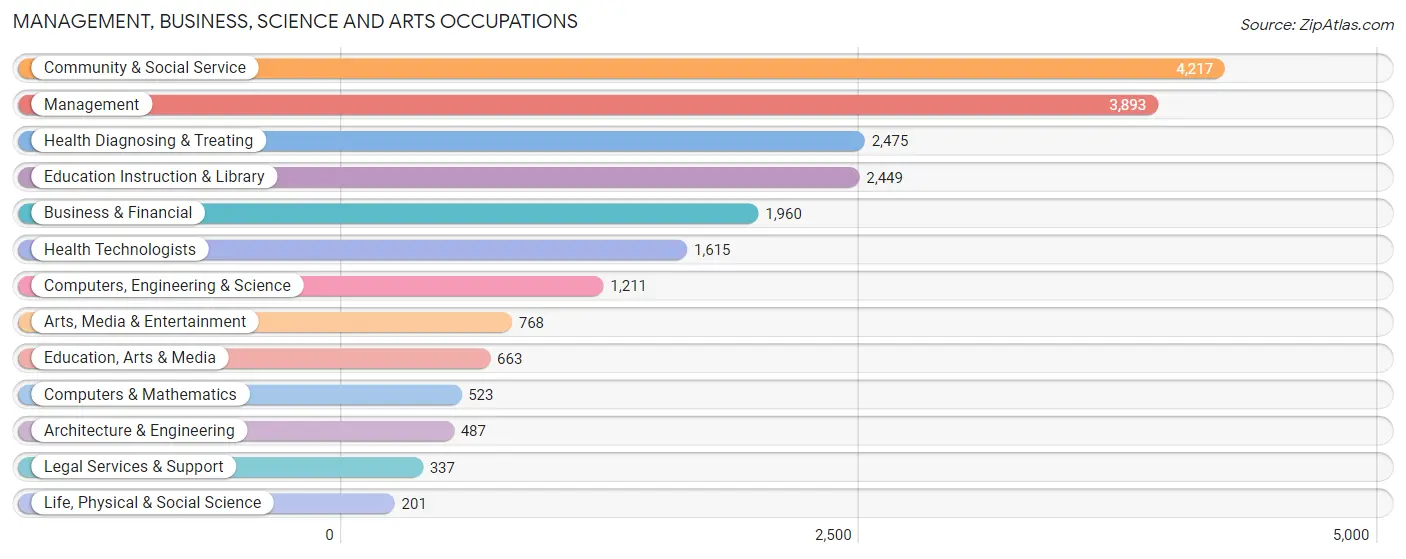
The most common Management, Business, Science and Arts occupations in Glynn County are Community & Social Service (4,217 | 11.2%), Management (3,893 | 10.3%), Health Diagnosing & Treating (2,475 | 6.6%), Education Instruction & Library (2,449 | 6.5%), and Business & Financial (1,960 | 5.2%).
Management, Business, Science and Arts Occupations by Sex
Within the Management, Business, Science and Arts occupations in Glynn County, the most male-oriented occupations are Architecture & Engineering (98.0%), Computers, Engineering & Science (79.6%), and Computers & Mathematics (67.3%), while the most female-oriented occupations are Health Diagnosing & Treating (83.8%), Health Technologists (79.3%), and Education Instruction & Library (61.8%).
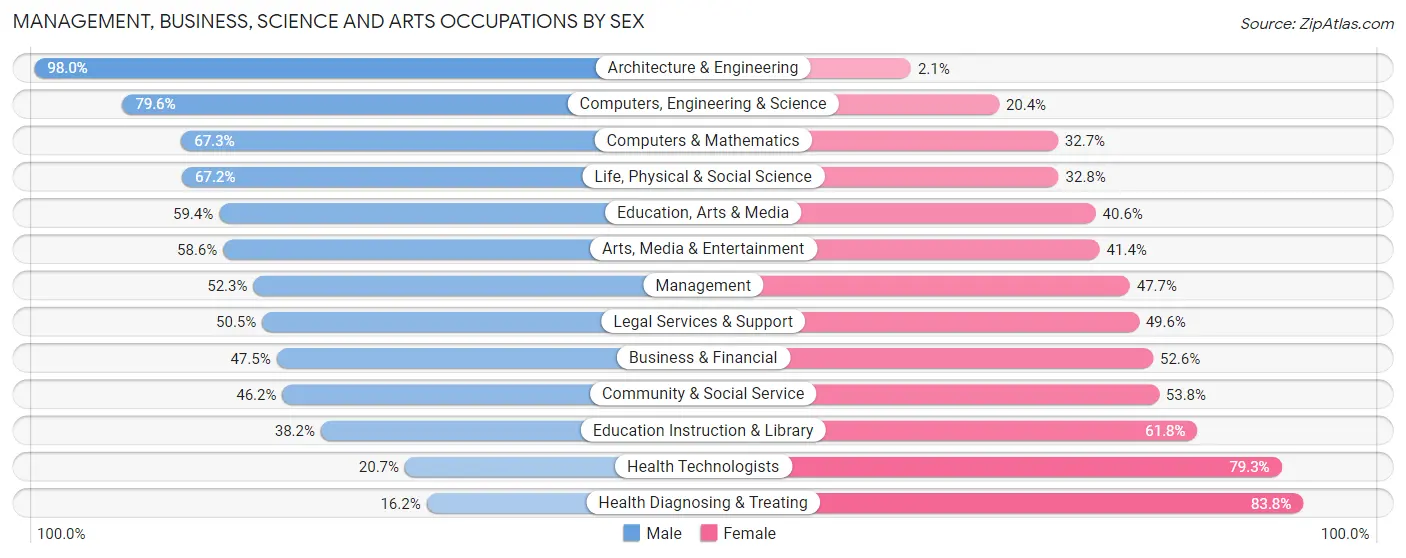
| Occupation | Male | Female |
| Management | 2,036 (52.3%) | 1,857 (47.7%) |
| Business & Financial | 930 (47.4%) | 1,030 (52.5%) |
| Computers, Engineering & Science | 964 (79.6%) | 247 (20.4%) |
| Computers & Mathematics | 352 (67.3%) | 171 (32.7%) |
| Architecture & Engineering | 477 (98.0%) | 10 (2.1%) |
| Life, Physical & Social Science | 135 (67.2%) | 66 (32.8%) |
| Community & Social Service | 1,950 (46.2%) | 2,267 (53.8%) |
| Education, Arts & Media | 394 (59.4%) | 269 (40.6%) |
| Legal Services & Support | 170 (50.4%) | 167 (49.5%) |
| Education Instruction & Library | 936 (38.2%) | 1,513 (61.8%) |
| Arts, Media & Entertainment | 450 (58.6%) | 318 (41.4%) |
| Health Diagnosing & Treating | 400 (16.2%) | 2,075 (83.8%) |
| Health Technologists | 334 (20.7%) | 1,281 (79.3%) |
| Total (Category) | 6,280 (45.7%) | 7,476 (54.3%) |
| Total (Overall) | 19,358 (51.2%) | 18,441 (48.8%) |
Services Occupations
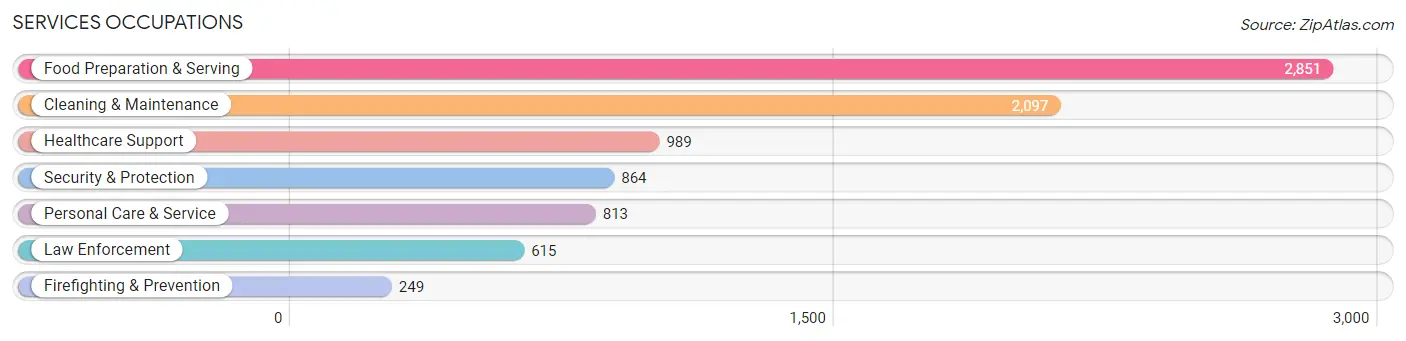
The most common Services occupations in Glynn County are Food Preparation & Serving (2,851 | 7.5%), Cleaning & Maintenance (2,097 | 5.6%), Healthcare Support (989 | 2.6%), Security & Protection (864 | 2.3%), and Personal Care & Service (813 | 2.1%).
Services Occupations by Sex
Within the Services occupations in Glynn County, the most male-oriented occupations are Firefighting & Prevention (63.4%), Security & Protection (60.5%), and Law Enforcement (59.4%), while the most female-oriented occupations are Healthcare Support (87.2%), Personal Care & Service (79.5%), and Food Preparation & Serving (60.6%).
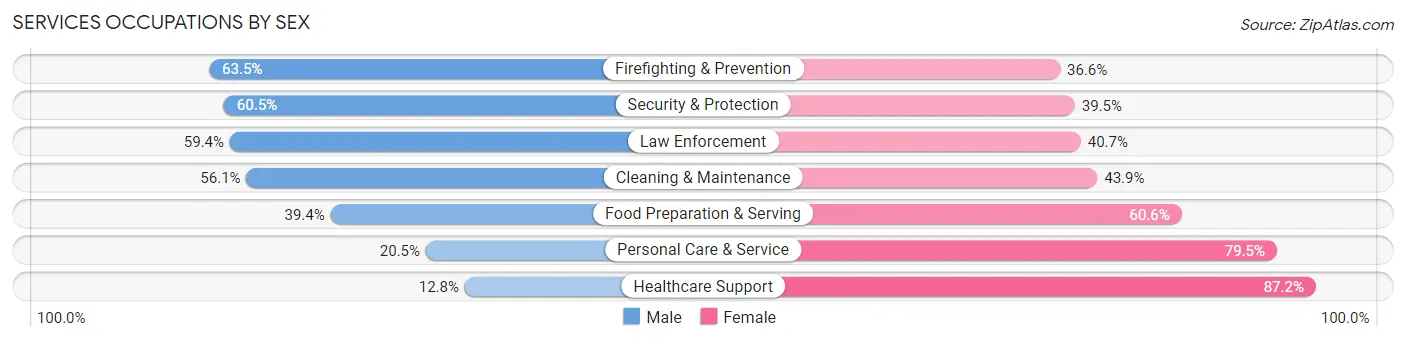
| Occupation | Male | Female |
| Healthcare Support | 127 (12.8%) | 862 (87.2%) |
| Security & Protection | 523 (60.5%) | 341 (39.5%) |
| Firefighting & Prevention | 158 (63.4%) | 91 (36.5%) |
| Law Enforcement | 365 (59.4%) | 250 (40.6%) |
| Food Preparation & Serving | 1,124 (39.4%) | 1,727 (60.6%) |
| Cleaning & Maintenance | 1,176 (56.1%) | 921 (43.9%) |
| Personal Care & Service | 167 (20.5%) | 646 (79.5%) |
| Total (Category) | 3,117 (40.9%) | 4,497 (59.1%) |
| Total (Overall) | 19,358 (51.2%) | 18,441 (48.8%) |
Sales and Office Occupations
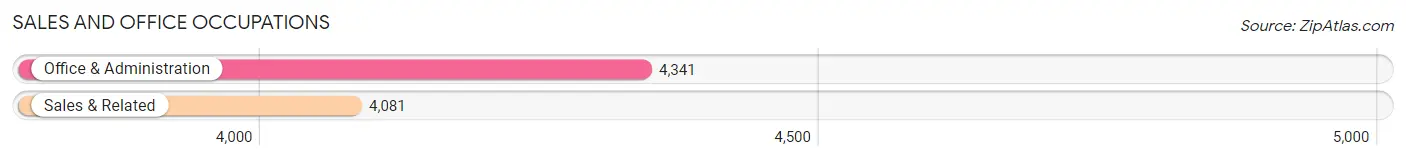
The most common Sales and Office occupations in Glynn County are Office & Administration (4,341 | 11.5%), and Sales & Related (4,081 | 10.8%).
Sales and Office Occupations by Sex
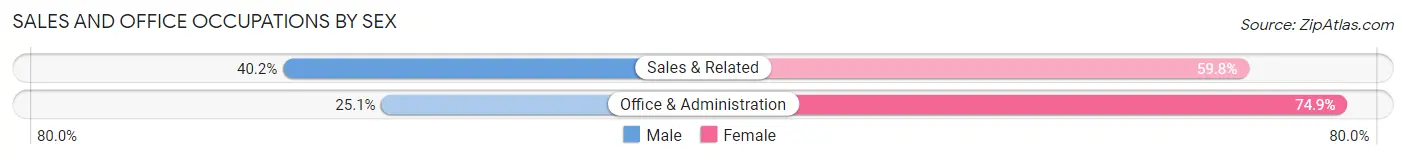
| Occupation | Male | Female |
| Sales & Related | 1,642 (40.2%) | 2,439 (59.8%) |
| Office & Administration | 1,090 (25.1%) | 3,251 (74.9%) |
| Total (Category) | 2,732 (32.4%) | 5,690 (67.6%) |
| Total (Overall) | 19,358 (51.2%) | 18,441 (48.8%) |
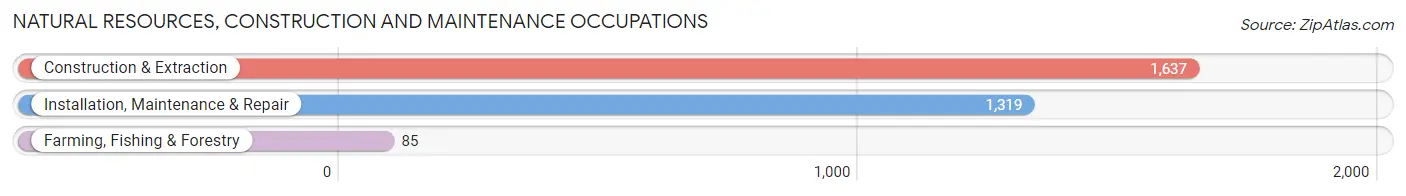
Natural Resources, Construction and Maintenance Occupations
The most common Natural Resources, Construction and Maintenance occupations in Glynn County are Construction & Extraction (1,637 | 4.3%), Installation, Maintenance & Repair (1,319 | 3.5%), and Farming, Fishing & Forestry (85 | 0.2%).
Natural Resources, Construction and Maintenance Occupations by Sex
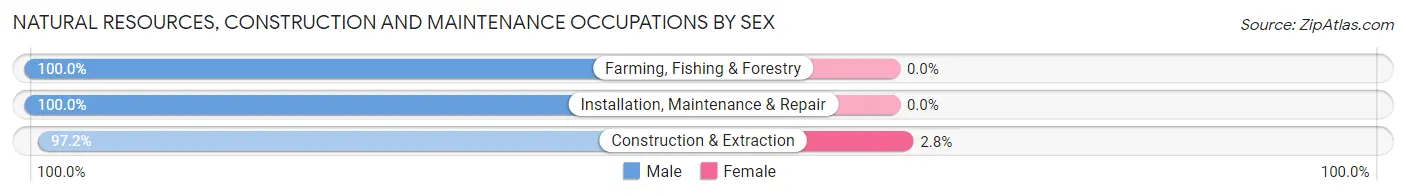
| Occupation | Male | Female |
| Farming, Fishing & Forestry | 85 (100.0%) | 0 (0.0%) |
| Construction & Extraction | 1,591 (97.2%) | 46 (2.8%) |
| Installation, Maintenance & Repair | 1,319 (100.0%) | 0 (0.0%) |
| Total (Category) | 2,995 (98.5%) | 46 (1.5%) |
| Total (Overall) | 19,358 (51.2%) | 18,441 (48.8%) |
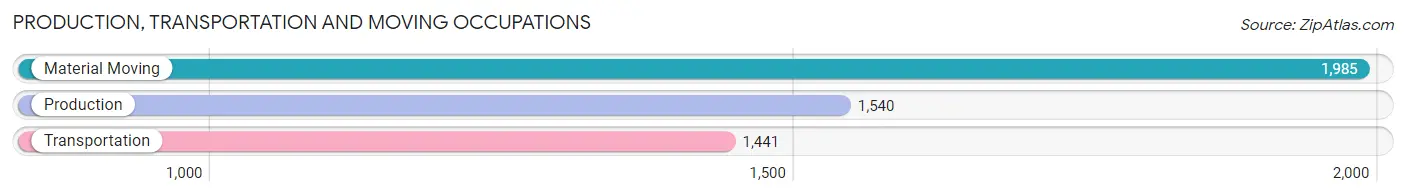
Production, Transportation and Moving Occupations
The most common Production, Transportation and Moving occupations in Glynn County are Material Moving (1,985 | 5.2%), Production (1,540 | 4.1%), and Transportation (1,441 | 3.8%).
Production, Transportation and Moving Occupations by Sex
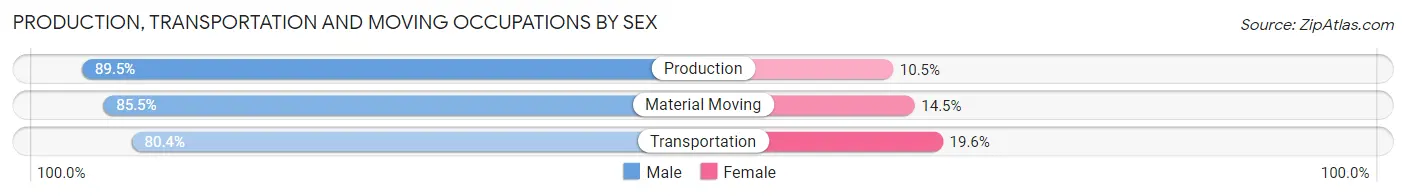
| Occupation | Male | Female |
| Production | 1,378 (89.5%) | 162 (10.5%) |
| Transportation | 1,158 (80.4%) | 283 (19.6%) |
| Material Moving | 1,698 (85.5%) | 287 (14.5%) |
| Total (Category) | 4,234 (85.3%) | 732 (14.7%) |
| Total (Overall) | 19,358 (51.2%) | 18,441 (48.8%) |
Employment Industries by Sex in Glynn County
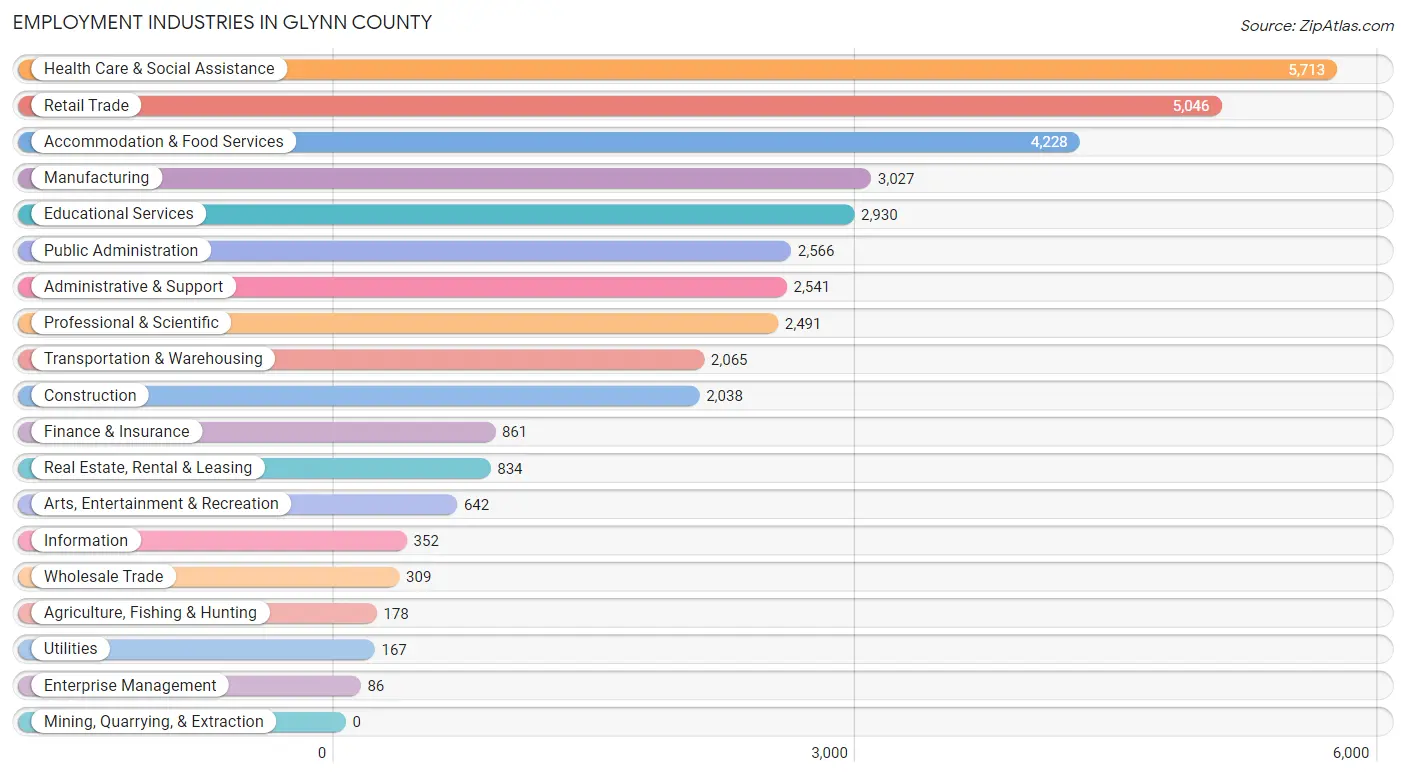
Employment Industries in Glynn County
The major employment industries in Glynn County include Health Care & Social Assistance (5,713 | 15.1%), Retail Trade (5,046 | 13.4%), Accommodation & Food Services (4,228 | 11.2%), Manufacturing (3,027 | 8.0%), and Educational Services (2,930 | 7.7%).
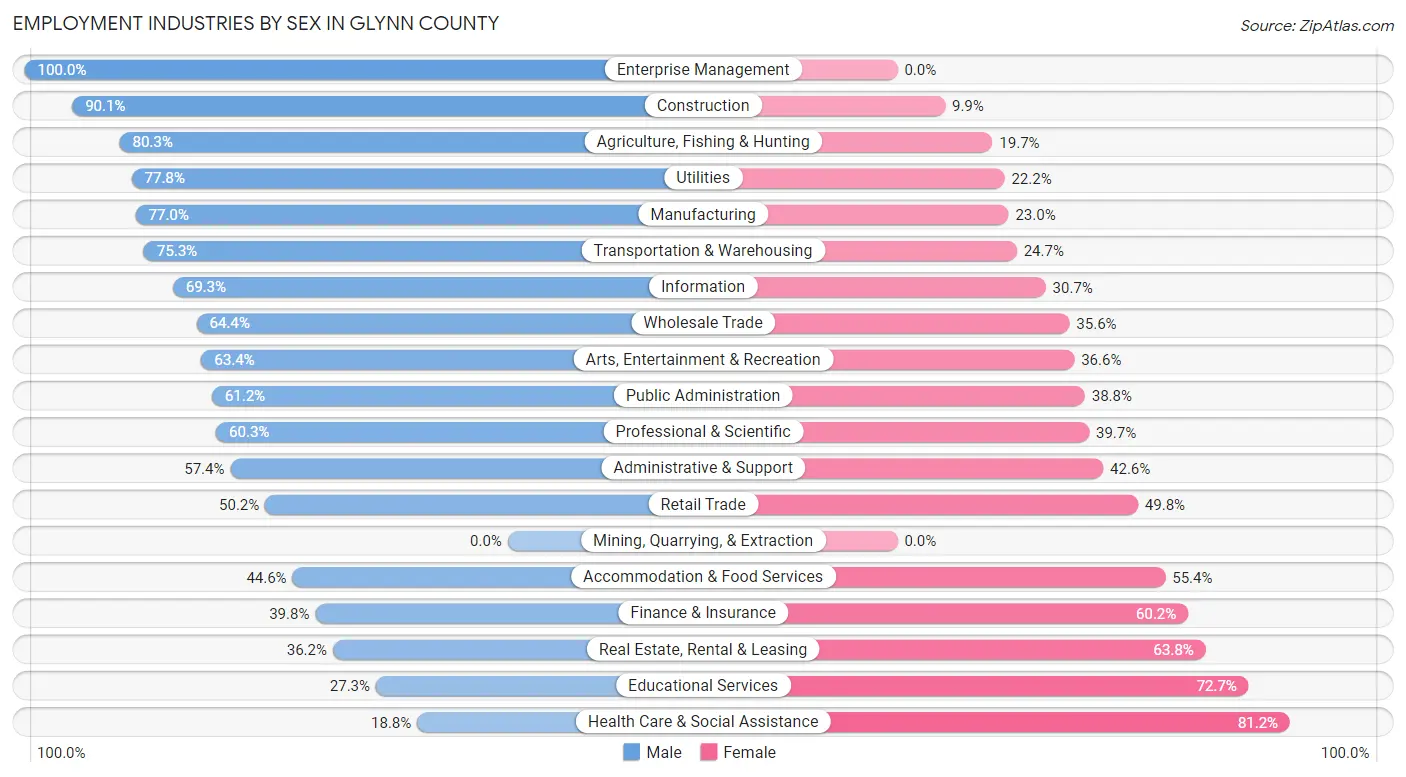
Employment Industries by Sex in Glynn County
The Glynn County industries that see more men than women are Enterprise Management (100.0%), Construction (90.1%), and Agriculture, Fishing & Hunting (80.3%), whereas the industries that tend to have a higher number of women are Health Care & Social Assistance (81.2%), Educational Services (72.7%), and Real Estate, Rental & Leasing (63.8%).
| Industry | Male | Female |
| Agriculture, Fishing & Hunting | 143 (80.3%) | 35 (19.7%) |
| Mining, Quarrying, & Extraction | 0 (0.0%) | 0 (0.0%) |
| Construction | 1,837 (90.1%) | 201 (9.9%) |
| Manufacturing | 2,331 (77.0%) | 696 (23.0%) |
| Wholesale Trade | 199 (64.4%) | 110 (35.6%) |
| Retail Trade | 2,534 (50.2%) | 2,512 (49.8%) |
| Transportation & Warehousing | 1,555 (75.3%) | 510 (24.7%) |
| Utilities | 130 (77.8%) | 37 (22.2%) |
| Information | 244 (69.3%) | 108 (30.7%) |
| Finance & Insurance | 343 (39.8%) | 518 (60.2%) |
| Real Estate, Rental & Leasing | 302 (36.2%) | 532 (63.8%) |
| Professional & Scientific | 1,503 (60.3%) | 988 (39.7%) |
| Enterprise Management | 86 (100.0%) | 0 (0.0%) |
| Administrative & Support | 1,459 (57.4%) | 1,082 (42.6%) |
| Educational Services | 800 (27.3%) | 2,130 (72.7%) |
| Health Care & Social Assistance | 1,072 (18.8%) | 4,641 (81.2%) |
| Arts, Entertainment & Recreation | 407 (63.4%) | 235 (36.6%) |
| Accommodation & Food Services | 1,884 (44.6%) | 2,344 (55.4%) |
| Public Administration | 1,571 (61.2%) | 995 (38.8%) |
| Total | 19,358 (51.2%) | 18,441 (48.8%) |
Education in Glynn County
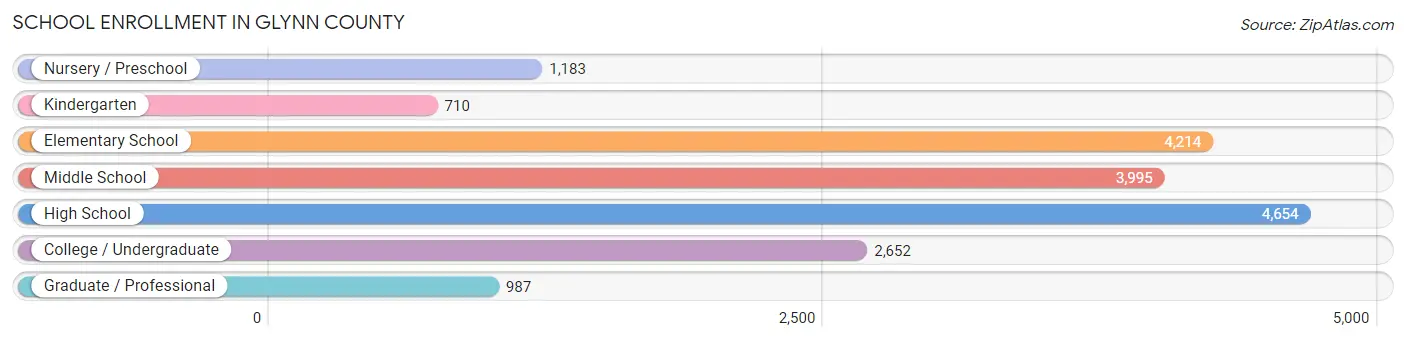
School Enrollment in Glynn County
The most common levels of schooling among the 18,395 students in Glynn County are high school (4,654 | 25.3%), elementary school (4,214 | 22.9%), and middle school (3,995 | 21.7%).
| School Level | # Students | % Students |
| Nursery / Preschool | 1,183 | 6.4% |
| Kindergarten | 710 | 3.9% |
| Elementary School | 4,214 | 22.9% |
| Middle School | 3,995 | 21.7% |
| High School | 4,654 | 25.3% |
| College / Undergraduate | 2,652 | 14.4% |
| Graduate / Professional | 987 | 5.4% |
| Total | 18,395 | 100.0% |
School Enrollment by Age by Funding Source in Glynn County
Out of a total of 18,395 students who are enrolled in schools in Glynn County, 2,649 (14.4%) attend a private institution, while the remaining 15,746 (85.6%) are enrolled in public schools. The age group of 3 to 4 year olds has the highest likelihood of being enrolled in private schools, with 405 (41.1% in the age bracket) enrolled. Conversely, the age group of 15 to 17 year olds has the lowest likelihood of being enrolled in a private school, with 2,949 (97.7% in the age bracket) attending a public institution.
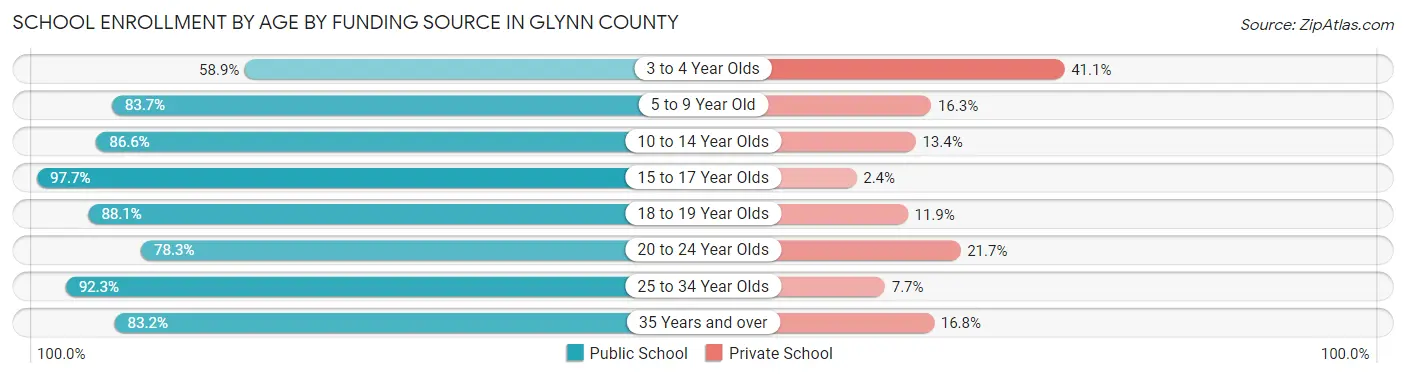
| Age Bracket | Public School | Private School |
| 3 to 4 Year Olds | 581 (58.9%) | 405 (41.1%) |
| 5 to 9 Year Old | 4,062 (83.7%) | 789 (16.3%) |
| 10 to 14 Year Olds | 4,343 (86.6%) | 671 (13.4%) |
| 15 to 17 Year Olds | 2,949 (97.7%) | 71 (2.4%) |
| 18 to 19 Year Olds | 940 (88.1%) | 127 (11.9%) |
| 20 to 24 Year Olds | 1,262 (78.3%) | 350 (21.7%) |
| 25 to 34 Year Olds | 735 (92.3%) | 61 (7.7%) |
| 35 Years and over | 873 (83.2%) | 176 (16.8%) |
| Total | 15,746 (85.6%) | 2,649 (14.4%) |
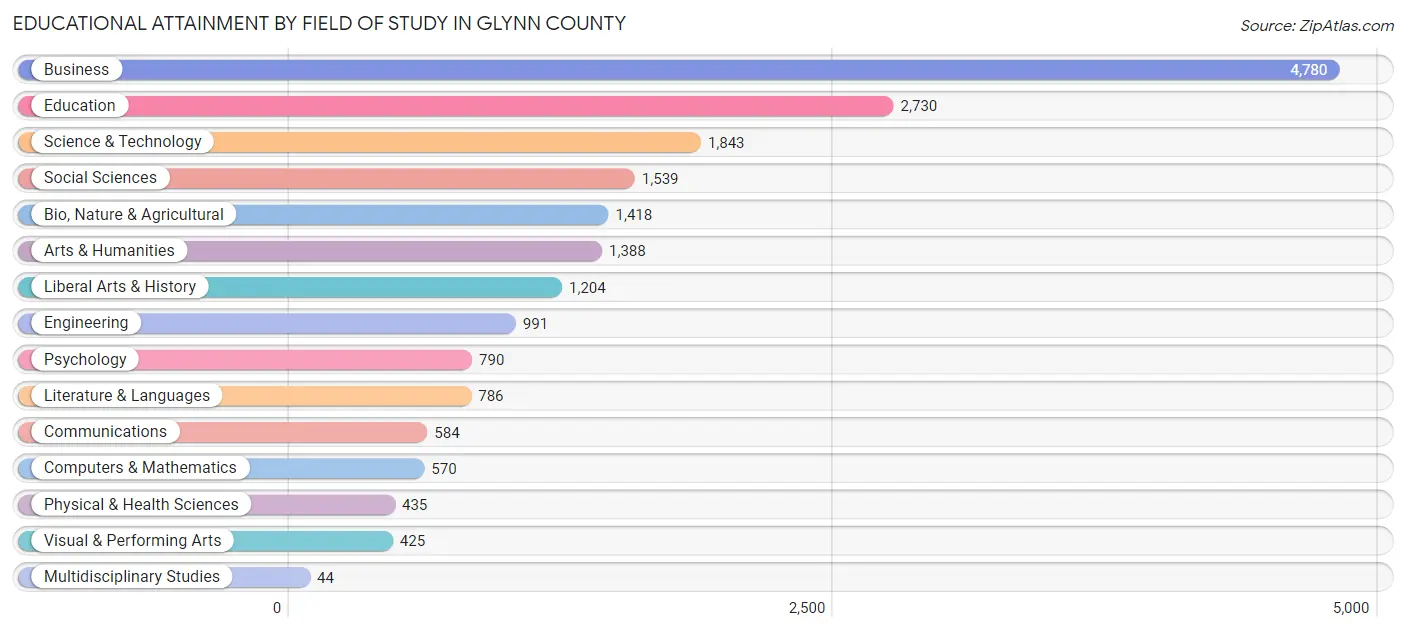
Educational Attainment by Field of Study in Glynn County
Business (4,780 | 24.5%), education (2,730 | 14.0%), science & technology (1,843 | 9.4%), social sciences (1,539 | 7.9%), and bio, nature & agricultural (1,418 | 7.3%) are the most common fields of study among 19,527 individuals in Glynn County who have obtained a bachelor's degree or higher.
| Field of Study | # Graduates | % Graduates |
| Computers & Mathematics | 570 | 2.9% |
| Bio, Nature & Agricultural | 1,418 | 7.3% |
| Physical & Health Sciences | 435 | 2.2% |
| Psychology | 790 | 4.1% |
| Social Sciences | 1,539 | 7.9% |
| Engineering | 991 | 5.1% |
| Multidisciplinary Studies | 44 | 0.2% |
| Science & Technology | 1,843 | 9.4% |
| Business | 4,780 | 24.5% |
| Education | 2,730 | 14.0% |
| Literature & Languages | 786 | 4.0% |
| Liberal Arts & History | 1,204 | 6.2% |
| Visual & Performing Arts | 425 | 2.2% |
| Communications | 584 | 3.0% |
| Arts & Humanities | 1,388 | 7.1% |
| Total | 19,527 | 100.0% |
Transportation & Commute in Glynn County
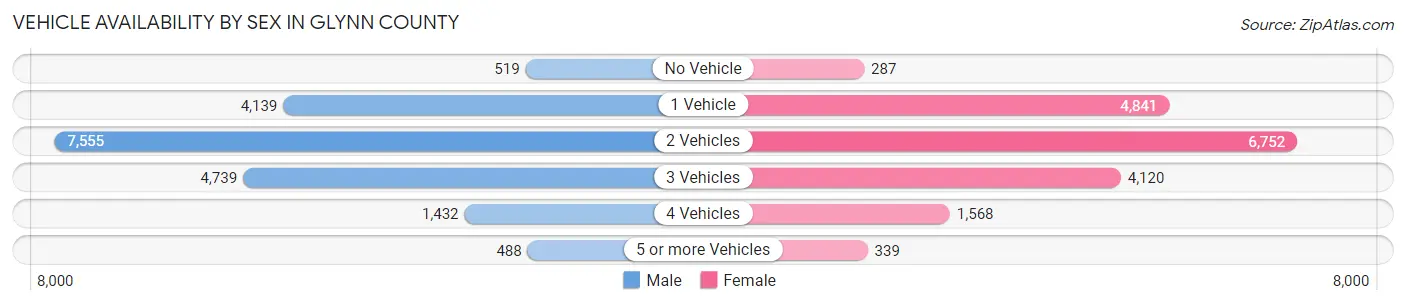
Vehicle Availability by Sex in Glynn County
The most prevalent vehicle ownership categories in Glynn County are males with 2 vehicles (7,555, accounting for 40.0%) and females with 2 vehicles (6,752, making up 42.2%).
| Vehicles Available | Male | Female |
| No Vehicle | 519 (2.8%) | 287 (1.6%) |
| 1 Vehicle | 4,139 (21.9%) | 4,841 (27.0%) |
| 2 Vehicles | 7,555 (40.0%) | 6,752 (37.7%) |
| 3 Vehicles | 4,739 (25.1%) | 4,120 (23.0%) |
| 4 Vehicles | 1,432 (7.6%) | 1,568 (8.8%) |
| 5 or more Vehicles | 488 (2.6%) | 339 (1.9%) |
| Total | 18,872 (100.0%) | 17,907 (100.0%) |
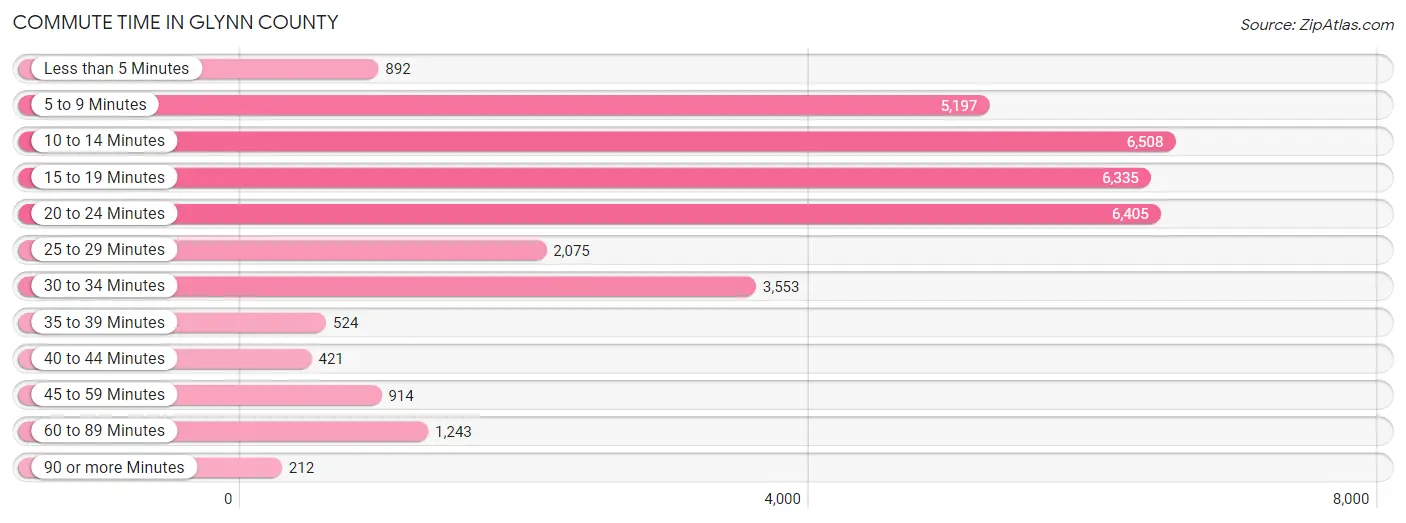
Commute Time in Glynn County
The most frequently occuring commute durations in Glynn County are 10 to 14 minutes (6,508 commuters, 19.0%), 20 to 24 minutes (6,405 commuters, 18.7%), and 15 to 19 minutes (6,335 commuters, 18.5%).
| Commute Time | # Commuters | % Commuters |
| Less than 5 Minutes | 892 | 2.6% |
| 5 to 9 Minutes | 5,197 | 15.2% |
| 10 to 14 Minutes | 6,508 | 19.0% |
| 15 to 19 Minutes | 6,335 | 18.5% |
| 20 to 24 Minutes | 6,405 | 18.7% |
| 25 to 29 Minutes | 2,075 | 6.0% |
| 30 to 34 Minutes | 3,553 | 10.4% |
| 35 to 39 Minutes | 524 | 1.5% |
| 40 to 44 Minutes | 421 | 1.2% |
| 45 to 59 Minutes | 914 | 2.7% |
| 60 to 89 Minutes | 1,243 | 3.6% |
| 90 or more Minutes | 212 | 0.6% |
Commute Time by Sex in Glynn County
The most common commute times in Glynn County are 15 to 19 minutes (3,720 commuters, 20.6%) for males and 10 to 14 minutes (3,354 commuters, 20.6%) for females.
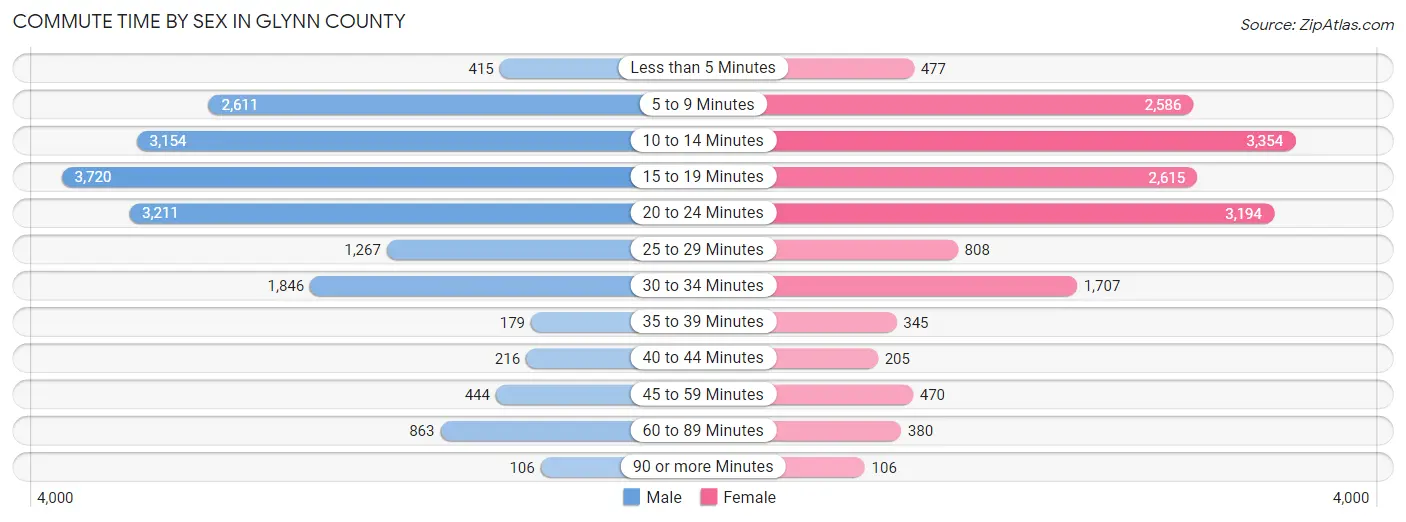
| Commute Time | Male | Female |
| Less than 5 Minutes | 415 (2.3%) | 477 (2.9%) |
| 5 to 9 Minutes | 2,611 (14.5%) | 2,586 (15.9%) |
| 10 to 14 Minutes | 3,154 (17.5%) | 3,354 (20.6%) |
| 15 to 19 Minutes | 3,720 (20.6%) | 2,615 (16.1%) |
| 20 to 24 Minutes | 3,211 (17.8%) | 3,194 (19.7%) |
| 25 to 29 Minutes | 1,267 (7.0%) | 808 (5.0%) |
| 30 to 34 Minutes | 1,846 (10.2%) | 1,707 (10.5%) |
| 35 to 39 Minutes | 179 (1.0%) | 345 (2.1%) |
| 40 to 44 Minutes | 216 (1.2%) | 205 (1.3%) |
| 45 to 59 Minutes | 444 (2.5%) | 470 (2.9%) |
| 60 to 89 Minutes | 863 (4.8%) | 380 (2.3%) |
| 90 or more Minutes | 106 (0.6%) | 106 (0.6%) |
Time of Departure to Work by Sex in Glynn County
The most frequent times of departure to work in Glynn County are 7:00 AM to 7:29 AM (2,840, 15.8%) for males and 7:30 AM to 7:59 AM (3,076, 18.9%) for females.
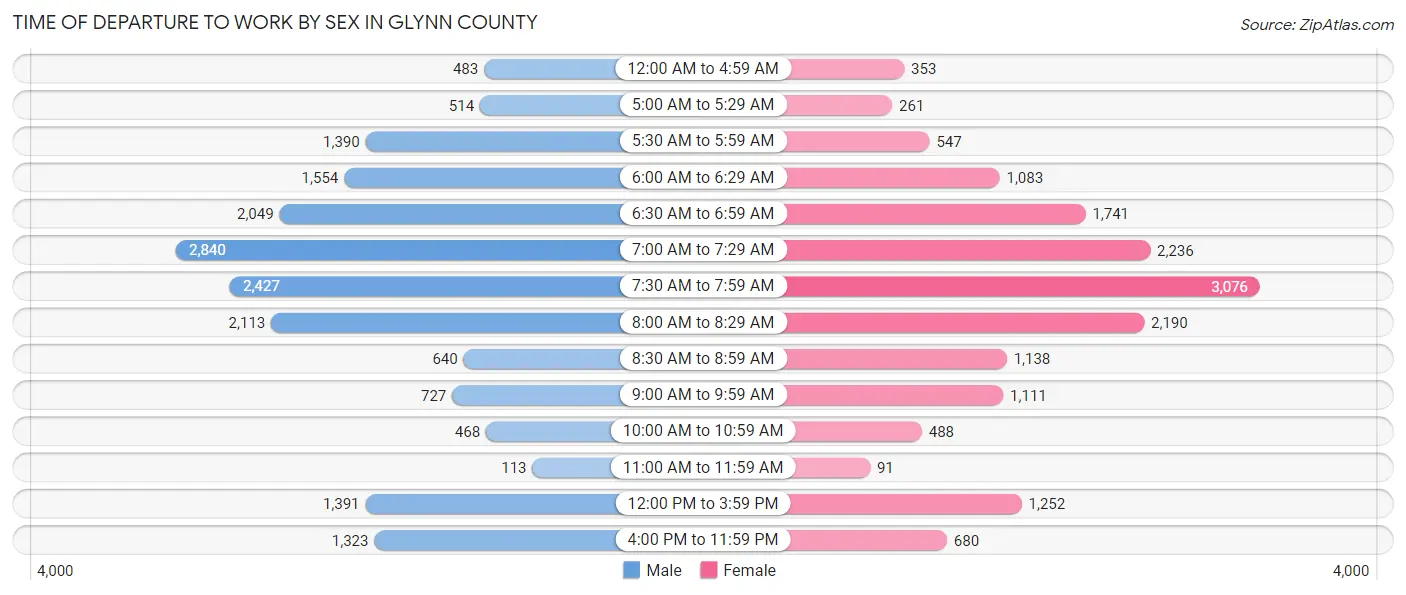
| Time of Departure | Male | Female |
| 12:00 AM to 4:59 AM | 483 (2.7%) | 353 (2.2%) |
| 5:00 AM to 5:29 AM | 514 (2.9%) | 261 (1.6%) |
| 5:30 AM to 5:59 AM | 1,390 (7.7%) | 547 (3.4%) |
| 6:00 AM to 6:29 AM | 1,554 (8.6%) | 1,083 (6.7%) |
| 6:30 AM to 6:59 AM | 2,049 (11.4%) | 1,741 (10.7%) |
| 7:00 AM to 7:29 AM | 2,840 (15.8%) | 2,236 (13.8%) |
| 7:30 AM to 7:59 AM | 2,427 (13.5%) | 3,076 (18.9%) |
| 8:00 AM to 8:29 AM | 2,113 (11.7%) | 2,190 (13.5%) |
| 8:30 AM to 8:59 AM | 640 (3.5%) | 1,138 (7.0%) |
| 9:00 AM to 9:59 AM | 727 (4.0%) | 1,111 (6.8%) |
| 10:00 AM to 10:59 AM | 468 (2.6%) | 488 (3.0%) |
| 11:00 AM to 11:59 AM | 113 (0.6%) | 91 (0.6%) |
| 12:00 PM to 3:59 PM | 1,391 (7.7%) | 1,252 (7.7%) |
| 4:00 PM to 11:59 PM | 1,323 (7.3%) | 680 (4.2%) |
| Total | 18,032 (100.0%) | 16,247 (100.0%) |
Housing Occupancy in Glynn County
Occupancy by Ownership in Glynn County
Of the total 33,991 dwellings in Glynn County, owner-occupied units account for 22,725 (66.9%), while renter-occupied units make up 11,266 (33.1%).
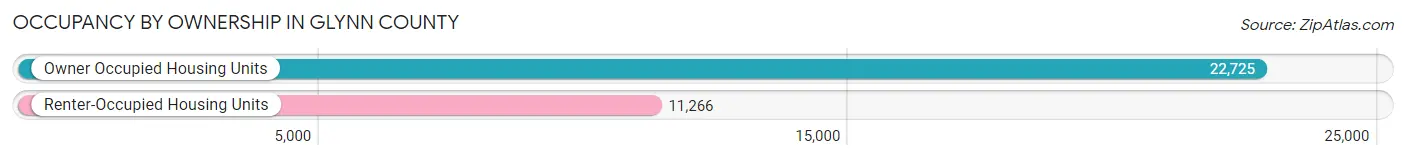
| Occupancy | # Housing Units | % Housing Units |
| Owner Occupied Housing Units | 22,725 | 66.9% |
| Renter-Occupied Housing Units | 11,266 | 33.1% |
| Total Occupied Housing Units | 33,991 | 100.0% |
Occupancy by Household Size in Glynn County
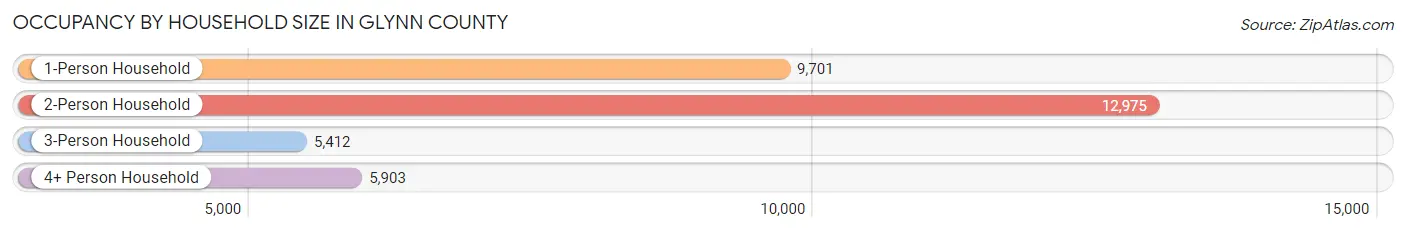
| Household Size | # Housing Units | % Housing Units |
| 1-Person Household | 9,701 | 28.5% |
| 2-Person Household | 12,975 | 38.2% |
| 3-Person Household | 5,412 | 15.9% |
| 4+ Person Household | 5,903 | 17.4% |
| Total Housing Units | 33,991 | 100.0% |
Occupancy by Ownership by Household Size in Glynn County
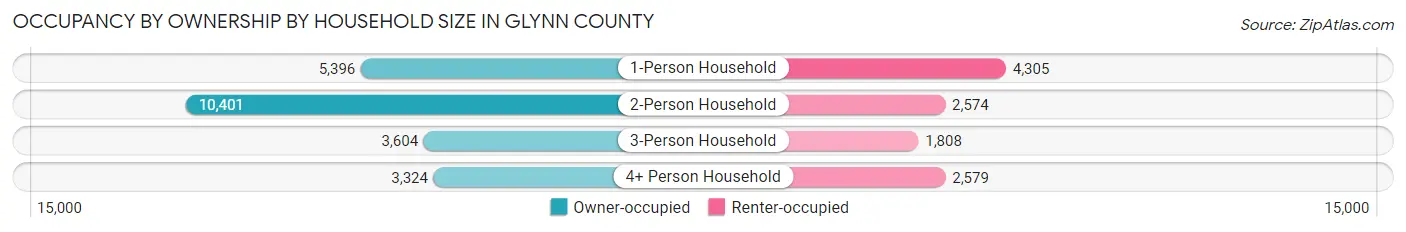
| Household Size | Owner-occupied | Renter-occupied |
| 1-Person Household | 5,396 (55.6%) | 4,305 (44.4%) |
| 2-Person Household | 10,401 (80.2%) | 2,574 (19.8%) |
| 3-Person Household | 3,604 (66.6%) | 1,808 (33.4%) |
| 4+ Person Household | 3,324 (56.3%) | 2,579 (43.7%) |
| Total Housing Units | 22,725 (66.9%) | 11,266 (33.1%) |
Occupancy by Educational Attainment in Glynn County
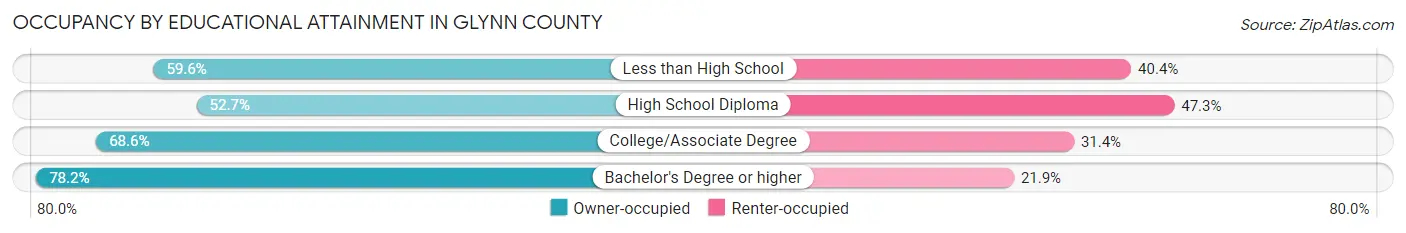
| Household Size | Owner-occupied | Renter-occupied |
| Less than High School | 2,224 (59.6%) | 1,510 (40.4%) |
| High School Diploma | 4,369 (52.7%) | 3,919 (47.3%) |
| College/Associate Degree | 7,475 (68.6%) | 3,417 (31.4%) |
| Bachelor's Degree or higher | 8,657 (78.1%) | 2,420 (21.8%) |
Occupancy by Age of Householder in Glynn County
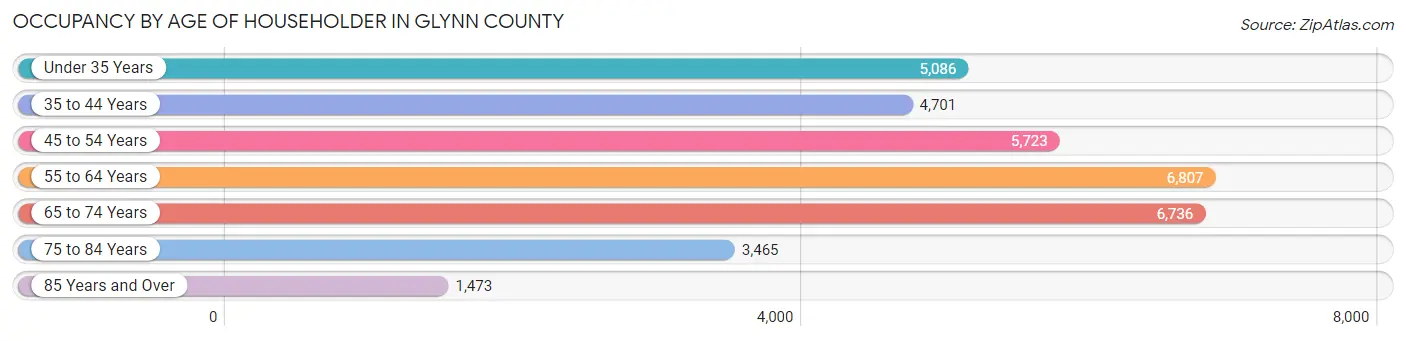
| Age Bracket | # Households | % Households |
| Under 35 Years | 5,086 | 15.0% |
| 35 to 44 Years | 4,701 | 13.8% |
| 45 to 54 Years | 5,723 | 16.8% |
| 55 to 64 Years | 6,807 | 20.0% |
| 65 to 74 Years | 6,736 | 19.8% |
| 75 to 84 Years | 3,465 | 10.2% |
| 85 Years and Over | 1,473 | 4.3% |
| Total | 33,991 | 100.0% |
Housing Finances in Glynn County
Median Income by Occupancy in Glynn County
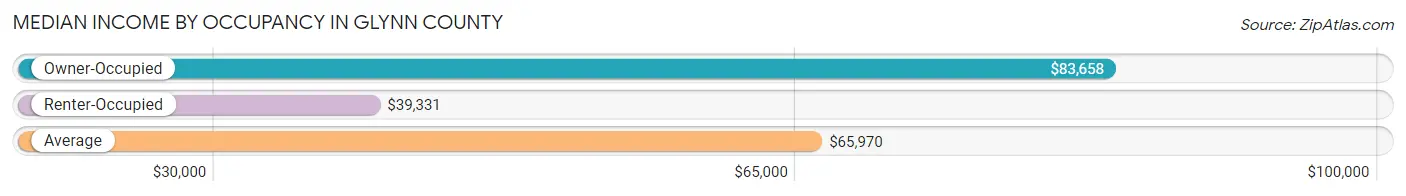
| Occupancy Type | # Households | Median Income |
| Owner-Occupied | 22,725 (66.9%) | $83,658 |
| Renter-Occupied | 11,266 (33.1%) | $39,331 |
| Average | 33,991 (100.0%) | $65,970 |
Occupancy by Householder Income Bracket in Glynn County
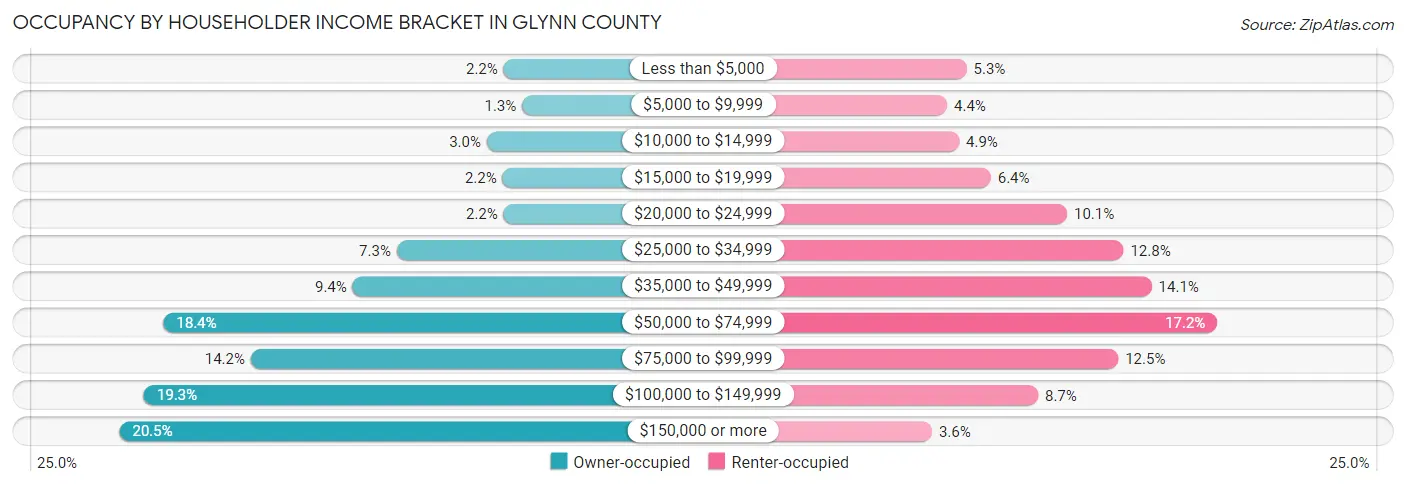
| Income Bracket | Owner-occupied | Renter-occupied |
| Less than $5,000 | 498 (2.2%) | 596 (5.3%) |
| $5,000 to $9,999 | 297 (1.3%) | 491 (4.4%) |
| $10,000 to $14,999 | 680 (3.0%) | 555 (4.9%) |
| $15,000 to $19,999 | 509 (2.2%) | 725 (6.4%) |
| $20,000 to $24,999 | 497 (2.2%) | 1,134 (10.1%) |
| $25,000 to $34,999 | 1,655 (7.3%) | 1,438 (12.8%) |
| $35,000 to $49,999 | 2,131 (9.4%) | 1,589 (14.1%) |
| $50,000 to $74,999 | 4,178 (18.4%) | 1,940 (17.2%) |
| $75,000 to $99,999 | 3,233 (14.2%) | 1,409 (12.5%) |
| $100,000 to $149,999 | 4,390 (19.3%) | 979 (8.7%) |
| $150,000 or more | 4,657 (20.5%) | 410 (3.6%) |
| Total | 22,725 (100.0%) | 11,266 (100.0%) |
Monthly Housing Cost Tiers in Glynn County
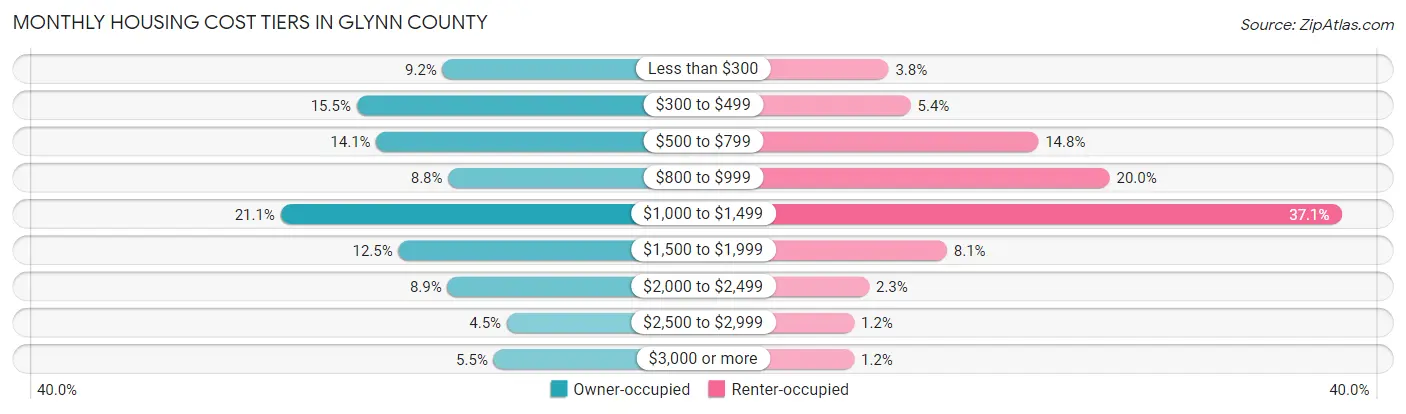
| Monthly Cost | Owner-occupied | Renter-occupied |
| Less than $300 | 2,093 (9.2%) | 424 (3.8%) |
| $300 to $499 | 3,532 (15.5%) | 607 (5.4%) |
| $500 to $799 | 3,201 (14.1%) | 1,666 (14.8%) |
| $800 to $999 | 1,997 (8.8%) | 2,258 (20.0%) |
| $1,000 to $1,499 | 4,803 (21.1%) | 4,181 (37.1%) |
| $1,500 to $1,999 | 2,831 (12.5%) | 908 (8.1%) |
| $2,000 to $2,499 | 2,011 (8.8%) | 263 (2.3%) |
| $2,500 to $2,999 | 1,018 (4.5%) | 139 (1.2%) |
| $3,000 or more | 1,239 (5.4%) | 139 (1.2%) |
| Total | 22,725 (100.0%) | 11,266 (100.0%) |
Physical Housing Characteristics in Glynn County
Housing Structures in Glynn County
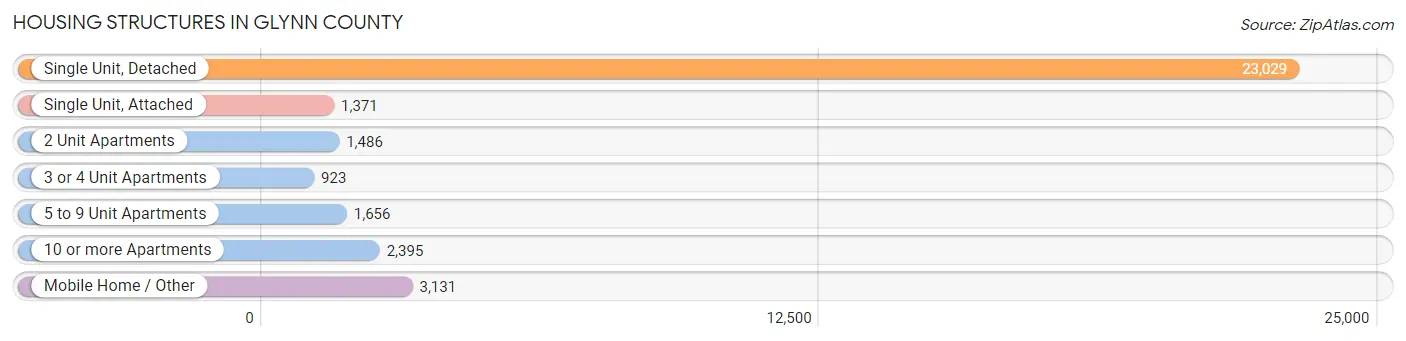
| Structure Type | # Housing Units | % Housing Units |
| Single Unit, Detached | 23,029 | 67.7% |
| Single Unit, Attached | 1,371 | 4.0% |
| 2 Unit Apartments | 1,486 | 4.4% |
| 3 or 4 Unit Apartments | 923 | 2.7% |
| 5 to 9 Unit Apartments | 1,656 | 4.9% |
| 10 or more Apartments | 2,395 | 7.0% |
| Mobile Home / Other | 3,131 | 9.2% |
| Total | 33,991 | 100.0% |
Housing Structures by Occupancy in Glynn County
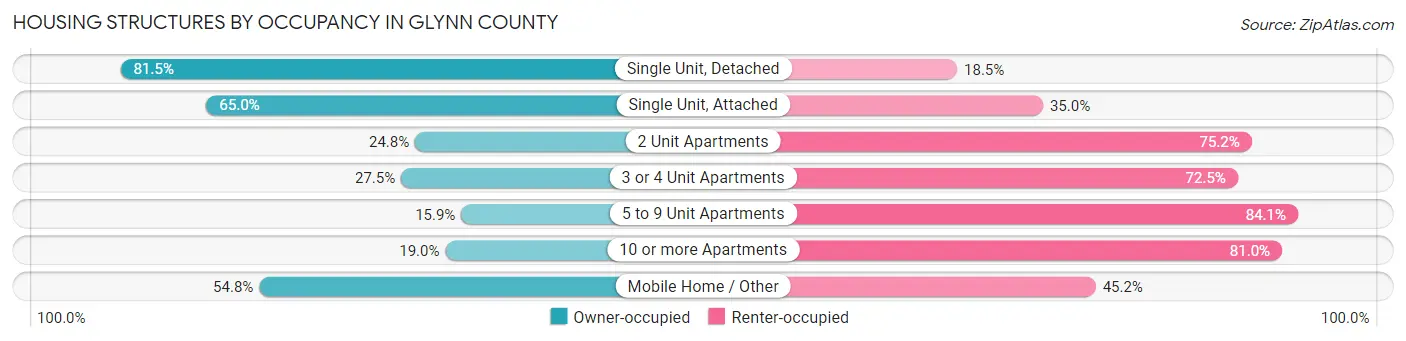
| Structure Type | Owner-occupied | Renter-occupied |
| Single Unit, Detached | 18,775 (81.5%) | 4,254 (18.5%) |
| Single Unit, Attached | 891 (65.0%) | 480 (35.0%) |
| 2 Unit Apartments | 369 (24.8%) | 1,117 (75.2%) |
| 3 or 4 Unit Apartments | 254 (27.5%) | 669 (72.5%) |
| 5 to 9 Unit Apartments | 264 (15.9%) | 1,392 (84.1%) |
| 10 or more Apartments | 455 (19.0%) | 1,940 (81.0%) |
| Mobile Home / Other | 1,717 (54.8%) | 1,414 (45.2%) |
| Total | 22,725 (66.9%) | 11,266 (33.1%) |
Housing Structures by Number of Rooms in Glynn County
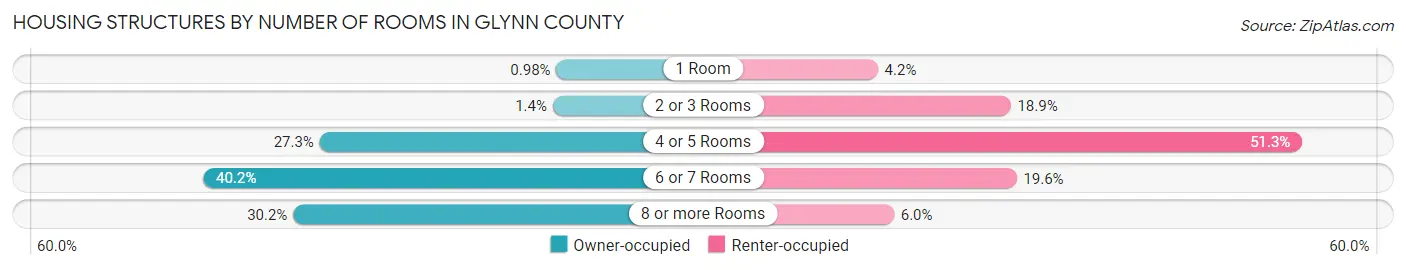
| Number of Rooms | Owner-occupied | Renter-occupied |
| 1 Room | 223 (1.0%) | 472 (4.2%) |
| 2 or 3 Rooms | 314 (1.4%) | 2,133 (18.9%) |
| 4 or 5 Rooms | 6,193 (27.3%) | 5,780 (51.3%) |
| 6 or 7 Rooms | 9,134 (40.2%) | 2,207 (19.6%) |
| 8 or more Rooms | 6,861 (30.2%) | 674 (6.0%) |
| Total | 22,725 (100.0%) | 11,266 (100.0%) |
Housing Structure by Heating Type in Glynn County
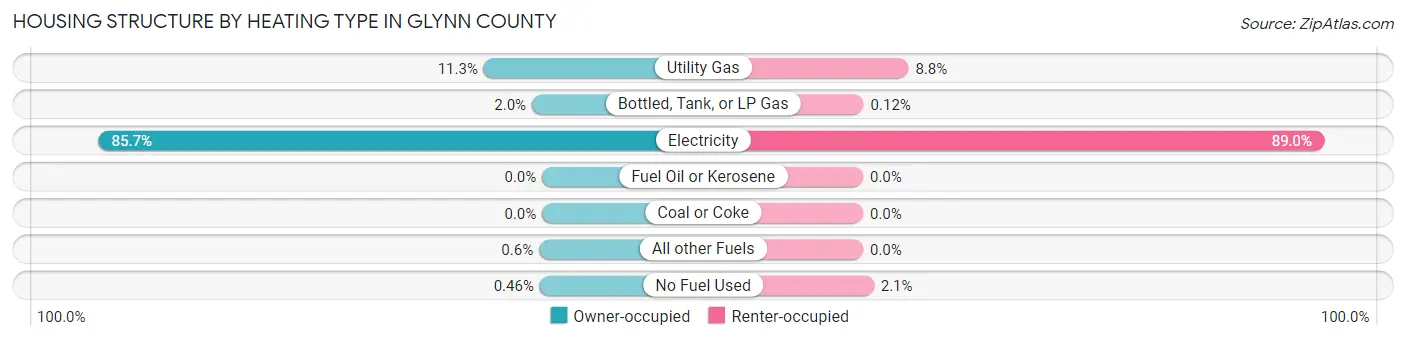
| Heating Type | Owner-occupied | Renter-occupied |
| Utility Gas | 2,564 (11.3%) | 989 (8.8%) |
| Bottled, Tank, or LP Gas | 448 (2.0%) | 14 (0.1%) |
| Electricity | 19,471 (85.7%) | 10,030 (89.0%) |
| Fuel Oil or Kerosene | 0 (0.0%) | 0 (0.0%) |
| Coal or Coke | 0 (0.0%) | 0 (0.0%) |
| All other Fuels | 137 (0.6%) | 0 (0.0%) |
| No Fuel Used | 105 (0.5%) | 233 (2.1%) |
| Total | 22,725 (100.0%) | 11,266 (100.0%) |
Household Vehicle Usage in Glynn County
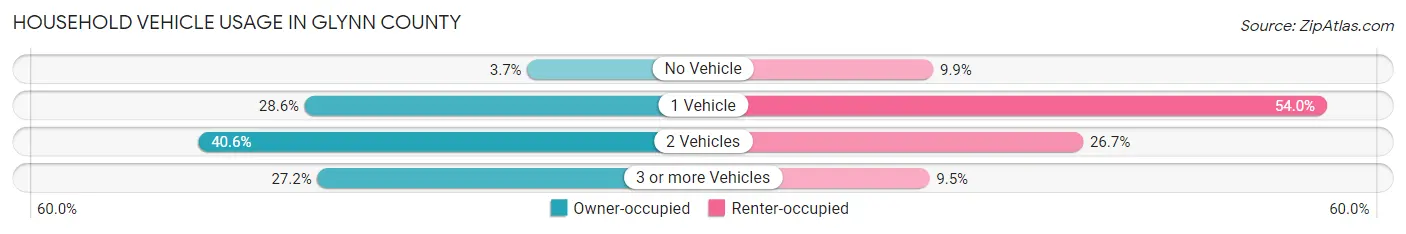
| Vehicles per Household | Owner-occupied | Renter-occupied |
| No Vehicle | 833 (3.7%) | 1,112 (9.9%) |
| 1 Vehicle | 6,499 (28.6%) | 6,083 (54.0%) |
| 2 Vehicles | 9,214 (40.6%) | 3,005 (26.7%) |
| 3 or more Vehicles | 6,179 (27.2%) | 1,066 (9.5%) |
| Total | 22,725 (100.0%) | 11,266 (100.0%) |
Real Estate & Mortgages in Glynn County
Real Estate and Mortgage Overview in Glynn County
| Characteristic | Without Mortgage | With Mortgage |
| Housing Units | 9,697 | 13,028 |
| Median Property Value | $205,200 | $258,100 |
| Median Household Income | $62,798 | $3,241 |
| Monthly Housing Costs | $458 | $1,196 |
| Real Estate Taxes | $1,098 | $634 |
Property Value by Mortgage Status in Glynn County
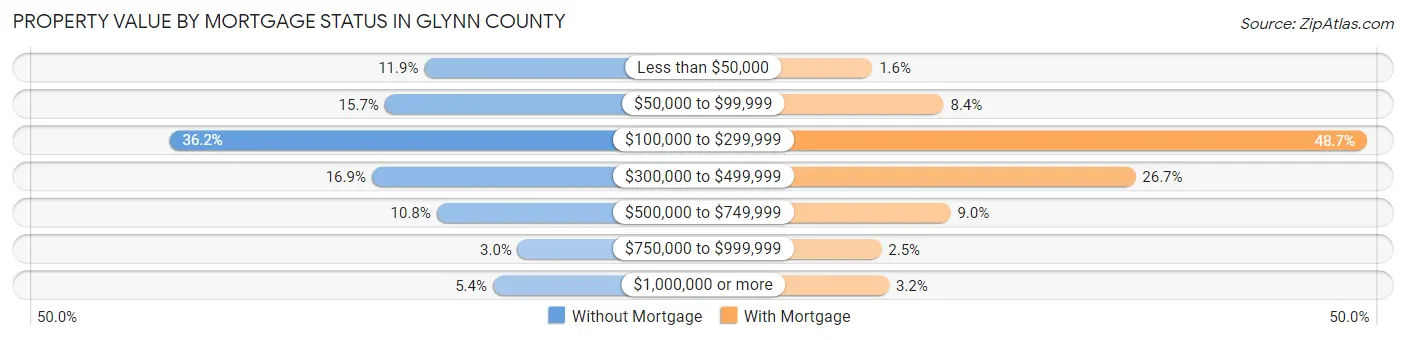
| Property Value | Without Mortgage | With Mortgage |
| Less than $50,000 | 1,158 (11.9%) | 207 (1.6%) |
| $50,000 to $99,999 | 1,523 (15.7%) | 1,092 (8.4%) |
| $100,000 to $299,999 | 3,510 (36.2%) | 6,343 (48.7%) |
| $300,000 to $499,999 | 1,643 (16.9%) | 3,472 (26.7%) |
| $500,000 to $749,999 | 1,043 (10.8%) | 1,178 (9.0%) |
| $750,000 to $999,999 | 295 (3.0%) | 320 (2.5%) |
| $1,000,000 or more | 525 (5.4%) | 416 (3.2%) |
| Total | 9,697 (100.0%) | 13,028 (100.0%) |
Household Income by Mortgage Status in Glynn County
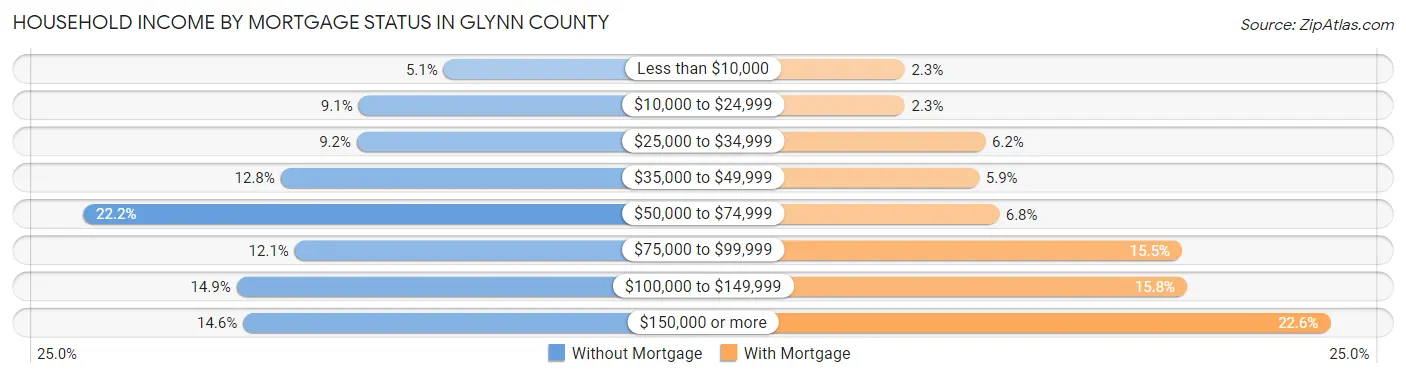
| Household Income | Without Mortgage | With Mortgage |
| Less than $10,000 | 490 (5.1%) | 303 (2.3%) |
| $10,000 to $24,999 | 882 (9.1%) | 305 (2.3%) |
| $25,000 to $34,999 | 890 (9.2%) | 804 (6.2%) |
| $35,000 to $49,999 | 1,242 (12.8%) | 765 (5.9%) |
| $50,000 to $74,999 | 2,154 (22.2%) | 889 (6.8%) |
| $75,000 to $99,999 | 1,177 (12.1%) | 2,024 (15.5%) |
| $100,000 to $149,999 | 1,446 (14.9%) | 2,056 (15.8%) |
| $150,000 or more | 1,416 (14.6%) | 2,944 (22.6%) |
| Total | 9,697 (100.0%) | 13,028 (100.0%) |
Property Value to Household Income Ratio in Glynn County
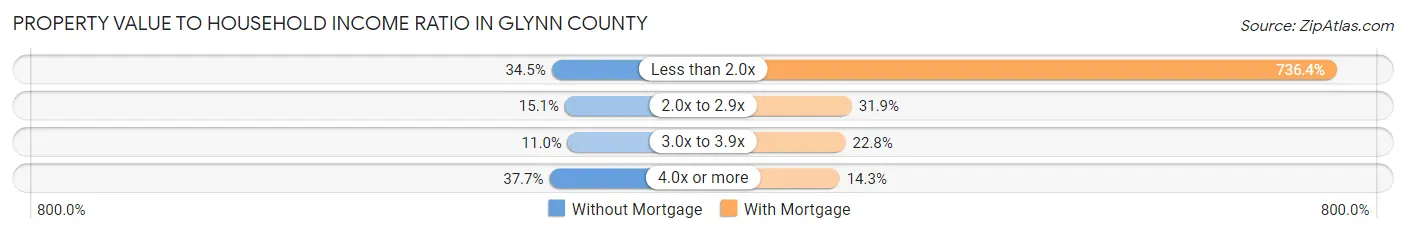
| Value-to-Income Ratio | Without Mortgage | With Mortgage |
| Less than 2.0x | 3,347 (34.5%) | 95,940 (736.4%) |
| 2.0x to 2.9x | 1,461 (15.1%) | 4,150 (31.9%) |
| 3.0x to 3.9x | 1,064 (11.0%) | 2,968 (22.8%) |
| 4.0x or more | 3,659 (37.7%) | 1,863 (14.3%) |
| Total | 9,697 (100.0%) | 13,028 (100.0%) |
Real Estate Taxes by Mortgage Status in Glynn County
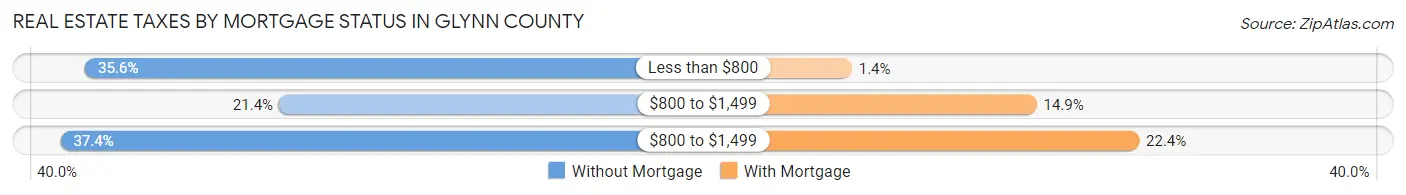
| Property Taxes | Without Mortgage | With Mortgage |
| Less than $800 | 3,450 (35.6%) | 178 (1.4%) |
| $800 to $1,499 | 2,077 (21.4%) | 1,937 (14.9%) |
| $800 to $1,499 | 3,625 (37.4%) | 2,913 (22.4%) |
| Total | 9,697 (100.0%) | 13,028 (100.0%) |
Health & Disability in Glynn County
Health Insurance Coverage by Age in Glynn County
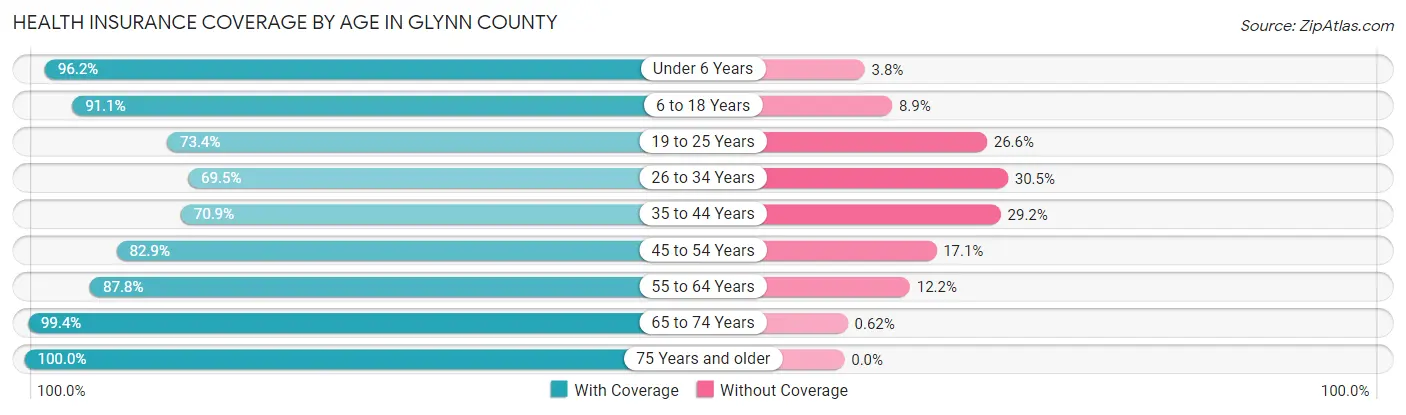
| Age Bracket | With Coverage | Without Coverage |
| Under 6 Years | 5,024 (96.2%) | 198 (3.8%) |
| 6 to 18 Years | 12,348 (91.1%) | 1,205 (8.9%) |
| 19 to 25 Years | 5,022 (73.4%) | 1,817 (26.6%) |
| 26 to 34 Years | 5,807 (69.5%) | 2,547 (30.5%) |
| 35 to 44 Years | 6,877 (70.9%) | 2,829 (29.1%) |
| 45 to 54 Years | 8,492 (82.9%) | 1,756 (17.1%) |
| 55 to 64 Years | 10,212 (87.8%) | 1,422 (12.2%) |
| 65 to 74 Years | 10,496 (99.4%) | 65 (0.6%) |
| 75 Years and older | 7,399 (100.0%) | 0 (0.0%) |
| Total | 71,677 (85.8%) | 11,839 (14.2%) |
Health Insurance Coverage by Citizenship Status in Glynn County
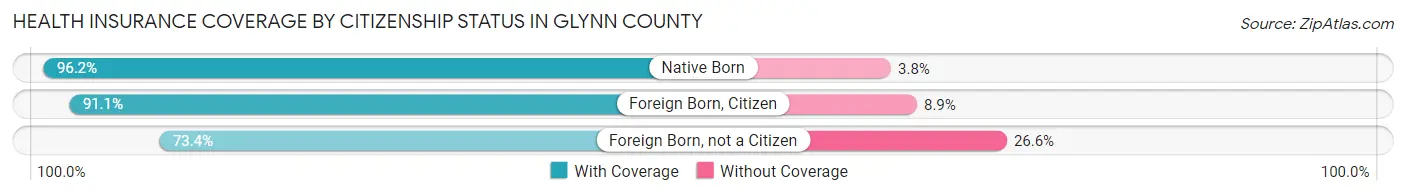
| Citizenship Status | With Coverage | Without Coverage |
| Native Born | 5,024 (96.2%) | 198 (3.8%) |
| Foreign Born, Citizen | 12,348 (91.1%) | 1,205 (8.9%) |
| Foreign Born, not a Citizen | 5,022 (73.4%) | 1,817 (26.6%) |
Health Insurance Coverage by Household Income in Glynn County
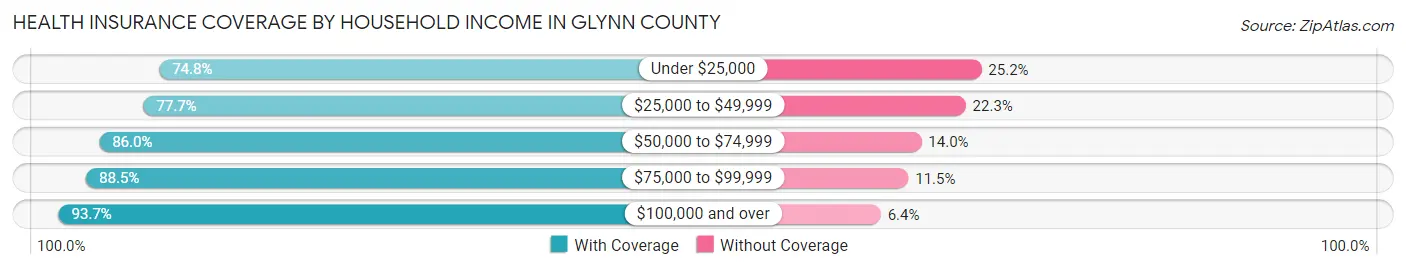
| Household Income | With Coverage | Without Coverage |
| Under $25,000 | 8,703 (74.8%) | 2,935 (25.2%) |
| $25,000 to $49,999 | 11,583 (77.7%) | 3,319 (22.3%) |
| $50,000 to $74,999 | 12,272 (86.0%) | 1,994 (14.0%) |
| $75,000 to $99,999 | 10,992 (88.5%) | 1,432 (11.5%) |
| $100,000 and over | 27,666 (93.6%) | 1,876 (6.4%) |
Public vs Private Health Insurance Coverage by Age in Glynn County
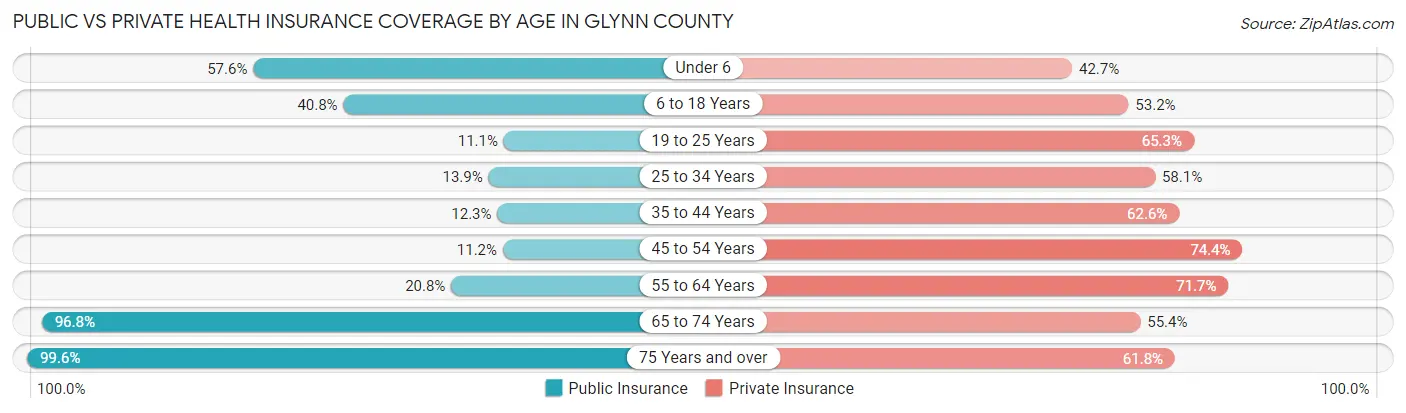
| Age Bracket | Public Insurance | Private Insurance |
| Under 6 | 3,006 (57.6%) | 2,232 (42.7%) |
| 6 to 18 Years | 5,532 (40.8%) | 7,210 (53.2%) |
| 19 to 25 Years | 756 (11.1%) | 4,468 (65.3%) |
| 25 to 34 Years | 1,160 (13.9%) | 4,856 (58.1%) |
| 35 to 44 Years | 1,189 (12.2%) | 6,077 (62.6%) |
| 45 to 54 Years | 1,151 (11.2%) | 7,620 (74.4%) |
| 55 to 64 Years | 2,422 (20.8%) | 8,346 (71.7%) |
| 65 to 74 Years | 10,224 (96.8%) | 5,851 (55.4%) |
| 75 Years and over | 7,366 (99.6%) | 4,574 (61.8%) |
| Total | 32,806 (39.3%) | 51,234 (61.4%) |
Disability Status by Sex by Age in Glynn County
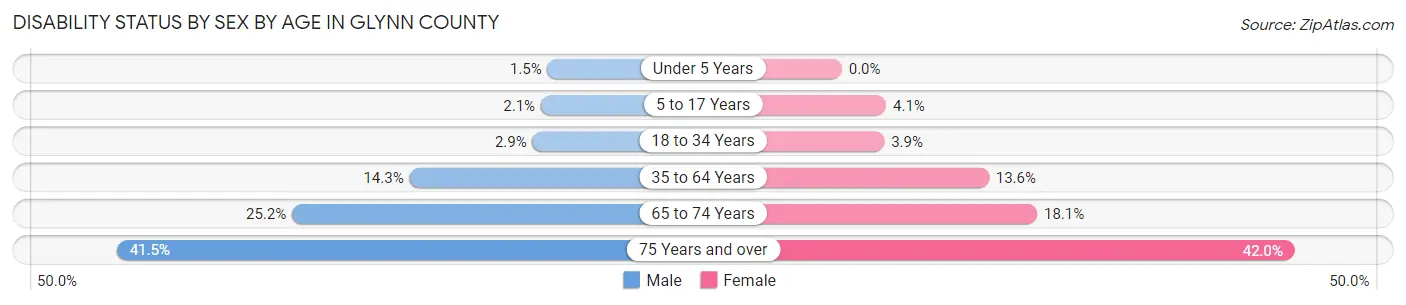
| Age Bracket | Male | Female |
| Under 5 Years | 33 (1.5%) | 0 (0.0%) |
| 5 to 17 Years | 135 (2.1%) | 278 (4.1%) |
| 18 to 34 Years | 222 (2.9%) | 333 (3.9%) |
| 35 to 64 Years | 2,075 (14.3%) | 2,327 (13.6%) |
| 65 to 74 Years | 1,221 (25.2%) | 1,035 (18.1%) |
| 75 Years and over | 1,237 (41.4%) | 1,856 (42.0%) |
Disability Class by Sex by Age in Glynn County
Disability Class: Hearing Difficulty
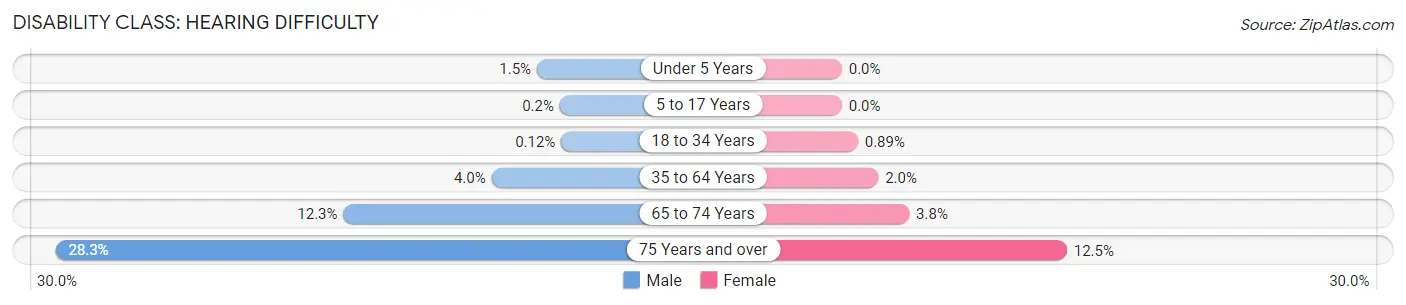
| Age Bracket | Male | Female |
| Under 5 Years | 33 (1.5%) | 0 (0.0%) |
| 5 to 17 Years | 13 (0.2%) | 0 (0.0%) |
| 18 to 34 Years | 9 (0.1%) | 75 (0.9%) |
| 35 to 64 Years | 581 (4.0%) | 347 (2.0%) |
| 65 to 74 Years | 594 (12.2%) | 214 (3.7%) |
| 75 Years and over | 844 (28.3%) | 553 (12.5%) |
Disability Class: Vision Difficulty
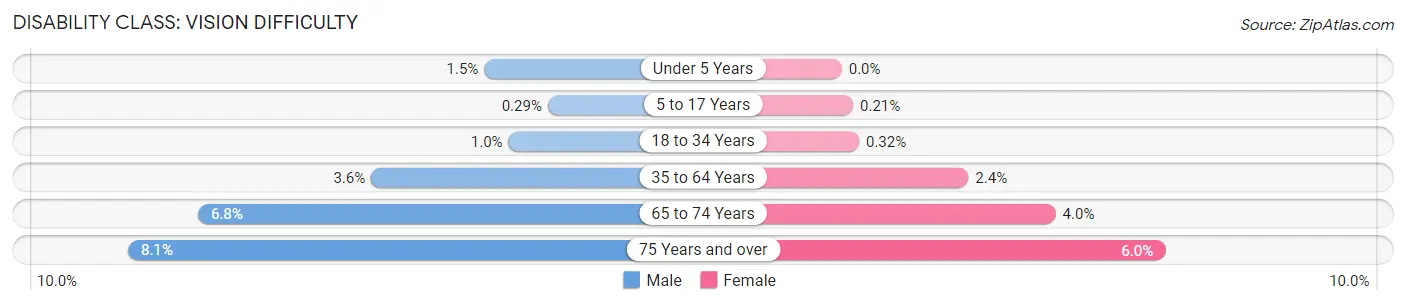
| Age Bracket | Male | Female |
| Under 5 Years | 33 (1.5%) | 0 (0.0%) |
| 5 to 17 Years | 19 (0.3%) | 14 (0.2%) |
| 18 to 34 Years | 79 (1.0%) | 27 (0.3%) |
| 35 to 64 Years | 519 (3.6%) | 400 (2.4%) |
| 65 to 74 Years | 329 (6.8%) | 227 (4.0%) |
| 75 Years and over | 241 (8.1%) | 265 (6.0%) |
Disability Class: Cognitive Difficulty
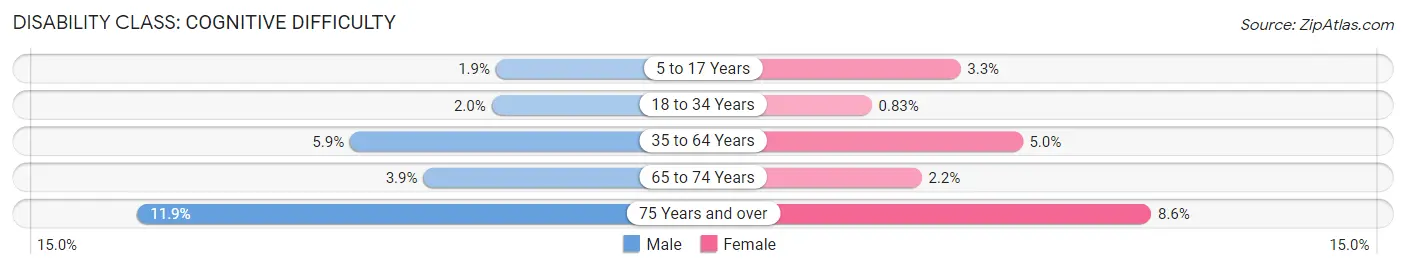
| Age Bracket | Male | Female |
| 5 to 17 Years | 122 (1.9%) | 223 (3.3%) |
| 18 to 34 Years | 155 (2.0%) | 70 (0.8%) |
| 35 to 64 Years | 863 (5.9%) | 858 (5.0%) |
| 65 to 74 Years | 189 (3.9%) | 127 (2.2%) |
| 75 Years and over | 354 (11.9%) | 380 (8.6%) |
Disability Class: Ambulatory Difficulty
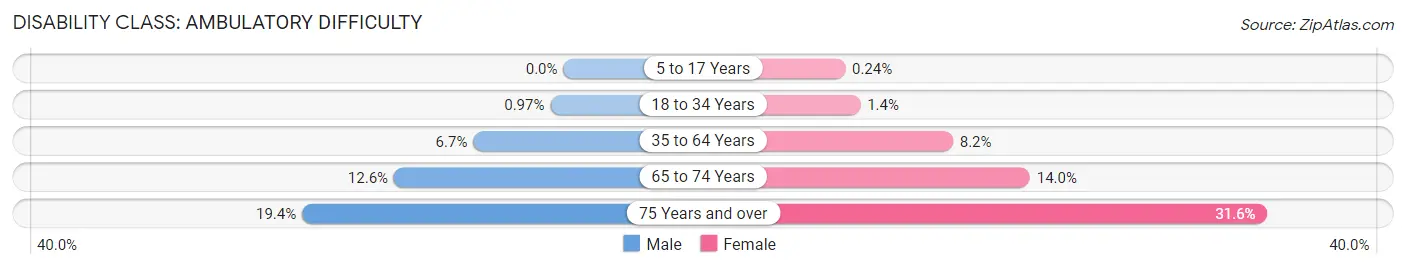
| Age Bracket | Male | Female |
| 5 to 17 Years | 0 (0.0%) | 16 (0.2%) |
| 18 to 34 Years | 75 (1.0%) | 116 (1.4%) |
| 35 to 64 Years | 972 (6.7%) | 1,406 (8.2%) |
| 65 to 74 Years | 610 (12.6%) | 797 (14.0%) |
| 75 Years and over | 579 (19.4%) | 1,395 (31.6%) |
Disability Class: Self-Care Difficulty
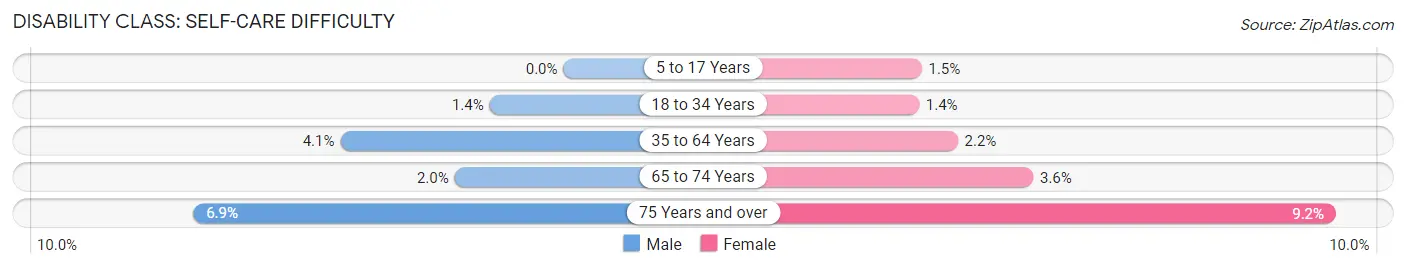
| Age Bracket | Male | Female |
| 5 to 17 Years | 0 (0.0%) | 100 (1.5%) |
| 18 to 34 Years | 106 (1.4%) | 121 (1.4%) |
| 35 to 64 Years | 602 (4.1%) | 367 (2.1%) |
| 65 to 74 Years | 98 (2.0%) | 203 (3.5%) |
| 75 Years and over | 205 (6.9%) | 405 (9.2%) |
Technology Access in Glynn County
Computing Device Access in Glynn County
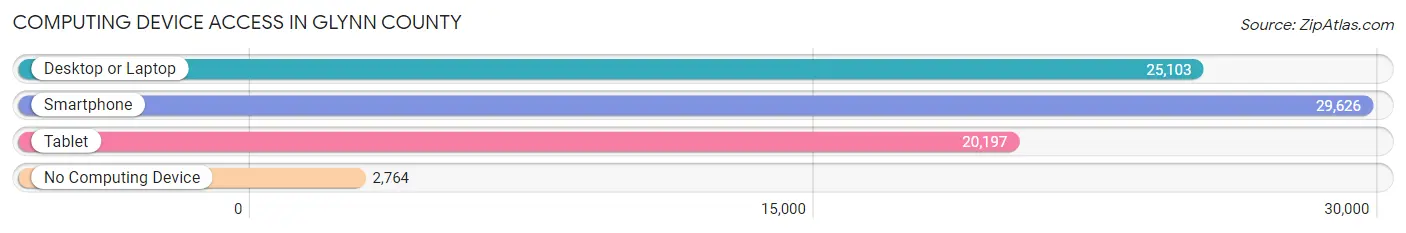
| Device Type | # Households | % Households |
| Desktop or Laptop | 25,103 | 73.9% |
| Smartphone | 29,626 | 87.2% |
| Tablet | 20,197 | 59.4% |
| No Computing Device | 2,764 | 8.1% |
| Total | 33,991 | 100.0% |
Internet Access in Glynn County
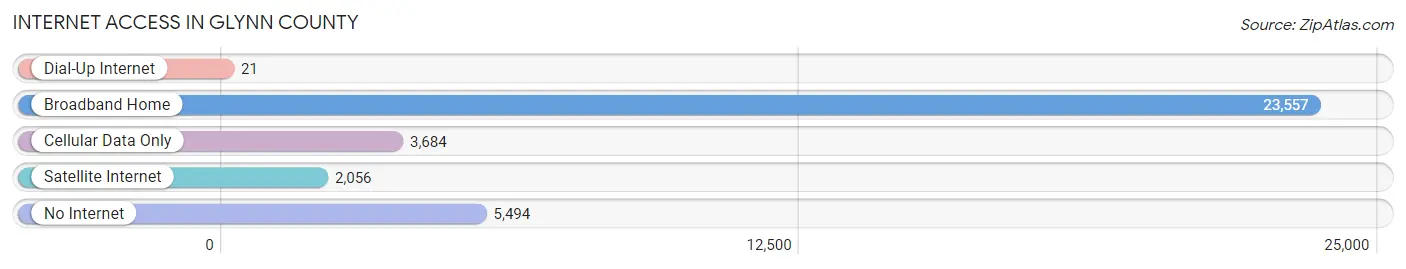
| Internet Type | # Households | % Households |
| Dial-Up Internet | 21 | 0.1% |
| Broadband Home | 23,557 | 69.3% |
| Cellular Data Only | 3,684 | 10.8% |
| Satellite Internet | 2,056 | 6.0% |
| No Internet | 5,494 | 16.2% |
| Total | 33,991 | 100.0% |
Glynn County Summary
Glynn County is a county located in the U.S. state of Georgia. As of the 2010 census, the population was 79,626. The county seat is Brunswick. Glynn County is part of the Brunswick, GA Metropolitan Statistical Area.
History
Glynn County was created in 1777 from part of Camden County. It was named for John Glynn, a member of the British Parliament who had opposed the Stamp Act of 1765. The county was part of the original land grant to General James Oglethorpe, founder of the Georgia colony.
Glynn County was the site of the Battle of Bloody Marsh, a Revolutionary War battle fought in 1742. The battle was a victory for the British, who were attempting to take control of the island of St. Simons.
Geography
Glynn County is located in southeastern Georgia, along the Atlantic Ocean. It is bordered to the north by Camden County, to the east by McIntosh County, to the south by Brantley County, and to the west by Charlton County.
The county has a total area of 576 square miles, of which 545 square miles is land and 31 square miles (5.4%) is water. The county is located on the mainland, with the Atlantic Ocean to the east and the Altamaha River to the west.
Economy
Glynn County is home to a variety of industries, including tourism, manufacturing, and agriculture. The county is home to several large employers, including the Brunswick Pulp and Paper Company, the Georgia-Pacific Corporation, and the Jekyll Island Club.
Tourism is a major industry in Glynn County. The county is home to several popular tourist attractions, including the Jekyll Island Club, the Georgia Sea Turtle Center, and the St. Simons Lighthouse.
Demographics
As of the 2010 census, there were 79,626 people, 30,845 households, and 20,945 families residing in the county. The population density was 146 people per square mile. There were 35,945 housing units at an average density of 66 per square mile. The racial makeup of the county was 68.2% White, 28.2% Black or African American, 0.3% Native American, 0.8% Asian, 0.1% Pacific Islander, 1.2% from other races, and 1.2% from two or more races. 2.7% of the population were Hispanic or Latino of any race.
The median income for a household in the county was $41,945, and the median income for a family was $50,945. The per capita income for the county was $22,945. About 11.2% of families and 14.2% of the population were below the poverty line, including 19.2% of those under age 18 and 10.2% of those age 65 or over.
Common Questions
What is the Total Population of Glynn County?
Total Population of Glynn County is 84,566.
What is the Total Male Population of Glynn County?
Total Male Population of Glynn County is 39,461.
What is the Total Female Population of Glynn County?
Total Female Population of Glynn County is 45,105.
What is the Ratio of Males per 100 Females in Glynn County?
There are 87.49 Males per 100 Females in Glynn County.
What is the Ratio of Females per 100 Males in Glynn County?
There are 114.30 Females per 100 Males in Glynn County.
What is the Median Population Age in Glynn County?
Median Population Age in Glynn County is 43.3 Years.
What is the Average Family Size in Glynn County
Average Family Size in Glynn County is 3.0 People.
What is the Average Household Size in Glynn County
Average Household Size in Glynn County is 2.4 People.
What is Per Capita Income in Glynn County?
Per Capita income in Glynn County is $39,221.
What is the Median Family Income in Glynn County?
Median Family Income in Glynn County is $81,669.
What is the Median Household income in Glynn County?
Median Household Income in Glynn County is $65,970.
What is Income or Wage Gap in Glynn County?
Income or Wage Gap in Glynn County is 30.6%.
Women in Glynn County earn 69.4 cents for every dollar earned by a man.
What is Family Income Deficit in Glynn County?
Family Income Deficit in Glynn County is $11,475.
Families that are below poverty line in Glynn County earn $11,475 less on average than the poverty threshold level.
What is Inequality or Gini Index in Glynn County?
Inequality or Gini Index in Glynn County is 0.50.
How Large is the Labor Force in Glynn County?
There are 39,602 People in the Labor Forcein in Glynn County.
What is the Percentage of People in the Labor Force in Glynn County?
57.7% of People are in the Labor Force in Glynn County.
What is the Unemployment Rate in Glynn County?
Unemployment Rate in Glynn County is 4.3%.