Pembroke, GA
Pembroke Map
Pembroke Overview
2,542
TOTAL POPULATION
1,156
MALE POPULATION
1,386
FEMALE POPULATION
83.41
MALES / 100 FEMALES
119.90
FEMALES / 100 MALES
26.9
MEDIAN AGE
3.2
AVG FAMILY SIZE
2.9
AVG HOUSEHOLD SIZE
$25,702
PER CAPITA INCOME
$67,031
AVG FAMILY INCOME
$66,488
AVG HOUSEHOLD INCOME
20.0%
WAGE / INCOME GAP [ % ]
80.0¢/ $1
WAGE / INCOME GAP [ $ ]
$3,707
FAMILY INCOME DEFICIT
0.39
INEQUALITY / GINI INDEX
1,434
LABOR FORCE [ PEOPLE ]
72.2%
PERCENT IN LABOR FORCE
7.7%
UNEMPLOYMENT RATE
Pembroke Zip Codes
Pembroke Area Codes
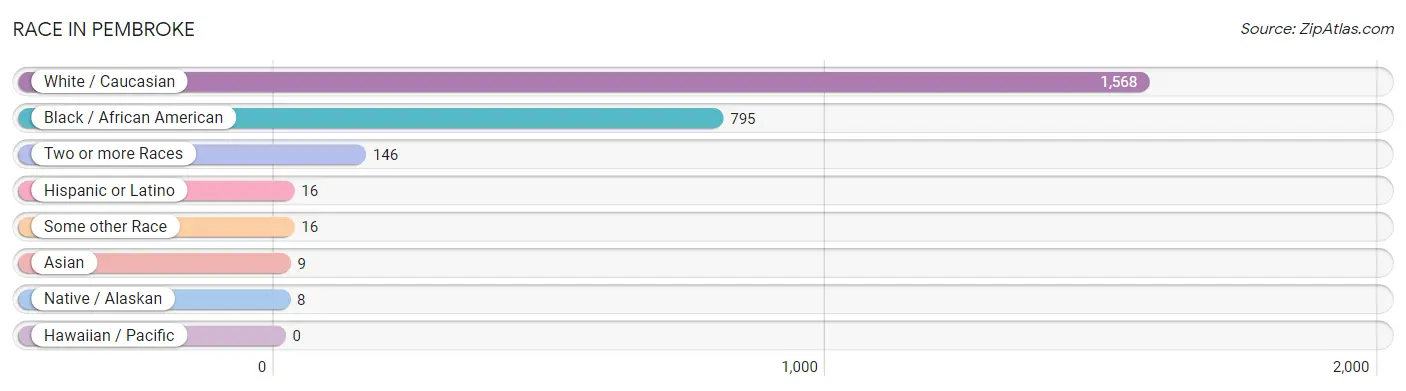
Race in Pembroke
The most populous races in Pembroke are White / Caucasian (1,568 | 61.7%), Black / African American (795 | 31.3%), and Two or more Races (146 | 5.7%).
| Race | # Population | % Population |
| Asian | 9 | 0.4% |
| Black / African American | 795 | 31.3% |
| Hawaiian / Pacific | 0 | 0.0% |
| Hispanic or Latino | 16 | 0.6% |
| Native / Alaskan | 8 | 0.3% |
| White / Caucasian | 1,568 | 61.7% |
| Two or more Races | 146 | 5.7% |
| Some other Race | 16 | 0.6% |
| Total | 2,542 | 100.0% |
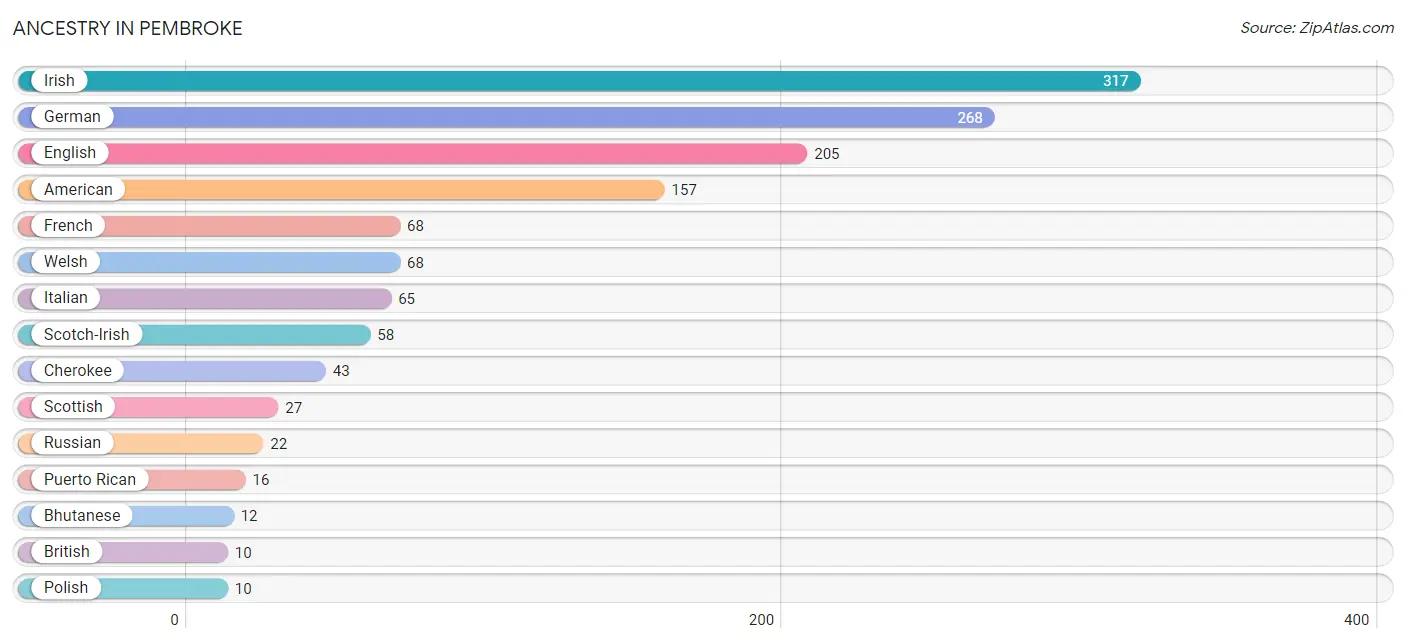
Ancestry in Pembroke
The most populous ancestries reported in Pembroke are Irish (317 | 12.5%), German (268 | 10.5%), English (205 | 8.1%), American (157 | 6.2%), and French (68 | 2.7%), together accounting for 39.9% of all Pembroke residents.
| Ancestry | # Population | % Population |
| American | 157 | 6.2% |
| Bhutanese | 12 | 0.5% |
| British | 10 | 0.4% |
| Burmese | 1 | 0.0% |
| Cherokee | 43 | 1.7% |
| Choctaw | 4 | 0.2% |
| English | 205 | 8.1% |
| European | 8 | 0.3% |
| French | 68 | 2.7% |
| French Canadian | 4 | 0.2% |
| German | 268 | 10.5% |
| Iranian | 3 | 0.1% |
| Irish | 317 | 12.5% |
| Italian | 65 | 2.6% |
| Korean | 9 | 0.4% |
| Polish | 10 | 0.4% |
| Puerto Rican | 16 | 0.6% |
| Russian | 22 | 0.9% |
| Scotch-Irish | 58 | 2.3% |
| Scottish | 27 | 1.1% |
| Welsh | 68 | 2.7% | View All 21 Rows |
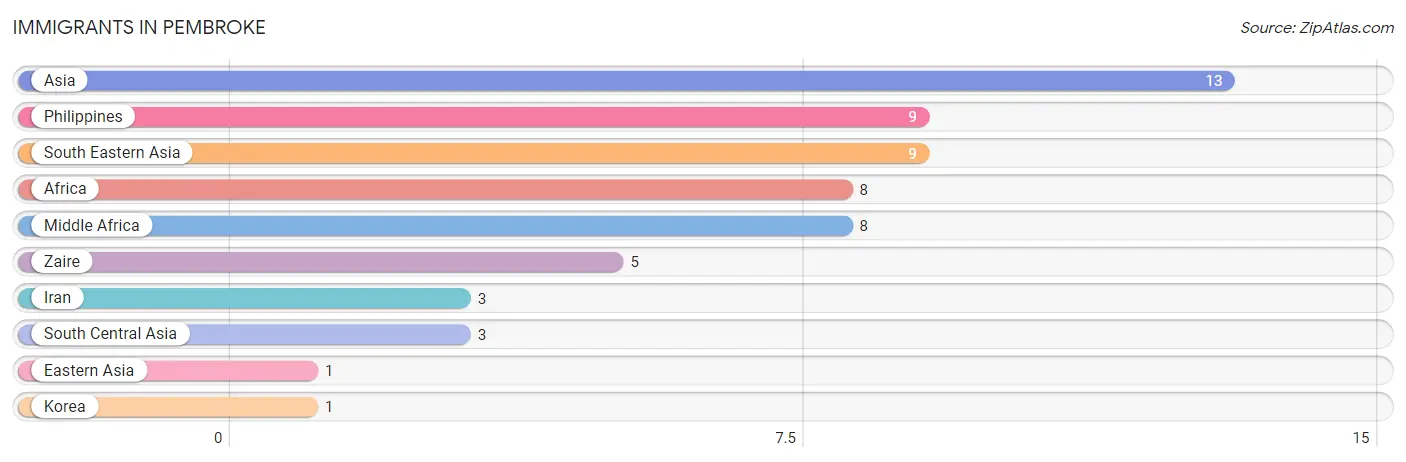
Immigrants in Pembroke
The most numerous immigrant groups reported in Pembroke came from Asia (13 | 0.5%), Philippines (9 | 0.4%), South Eastern Asia (9 | 0.4%), Africa (8 | 0.3%), and Middle Africa (8 | 0.3%), together accounting for 1.8% of all Pembroke residents.
| Immigration Origin | # Population | % Population |
| Africa | 8 | 0.3% |
| Asia | 13 | 0.5% |
| Eastern Asia | 1 | 0.0% |
| Iran | 3 | 0.1% |
| Korea | 1 | 0.0% |
| Middle Africa | 8 | 0.3% |
| Philippines | 9 | 0.4% |
| South Central Asia | 3 | 0.1% |
| South Eastern Asia | 9 | 0.4% |
| Zaire | 5 | 0.2% | View All 10 Rows |
Sex and Age in Pembroke
Sex and Age in Pembroke
The most populous age groups in Pembroke are 20 to 24 Years (284 | 24.6%) for men and 15 to 19 Years (201 | 14.5%) for women.
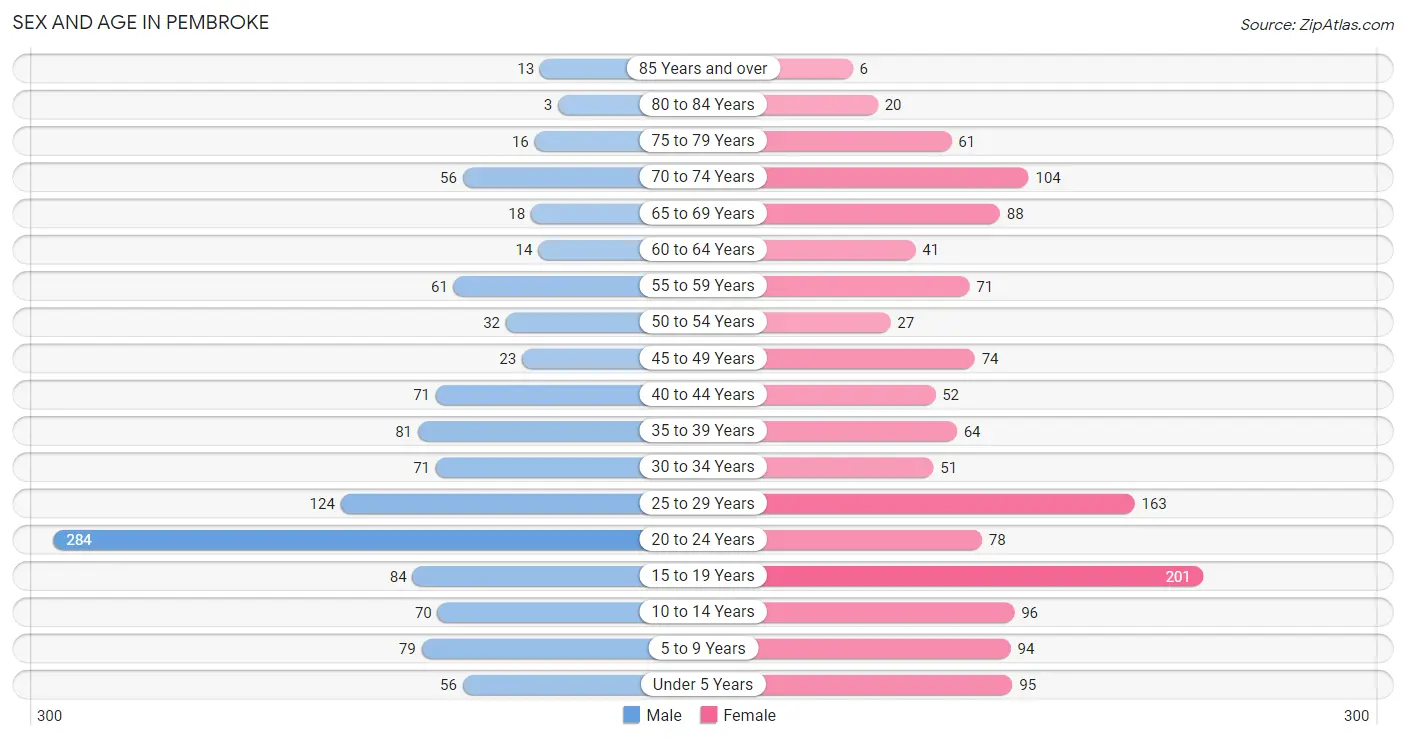
| Age Bracket | Male | Female |
| Under 5 Years | 56 (4.8%) | 95 (6.9%) |
| 5 to 9 Years | 79 (6.8%) | 94 (6.8%) |
| 10 to 14 Years | 70 (6.1%) | 96 (6.9%) |
| 15 to 19 Years | 84 (7.3%) | 201 (14.5%) |
| 20 to 24 Years | 284 (24.6%) | 78 (5.6%) |
| 25 to 29 Years | 124 (10.7%) | 163 (11.8%) |
| 30 to 34 Years | 71 (6.1%) | 51 (3.7%) |
| 35 to 39 Years | 81 (7.0%) | 64 (4.6%) |
| 40 to 44 Years | 71 (6.1%) | 52 (3.7%) |
| 45 to 49 Years | 23 (2.0%) | 74 (5.3%) |
| 50 to 54 Years | 32 (2.8%) | 27 (1.9%) |
| 55 to 59 Years | 61 (5.3%) | 71 (5.1%) |
| 60 to 64 Years | 14 (1.2%) | 41 (3.0%) |
| 65 to 69 Years | 18 (1.6%) | 88 (6.4%) |
| 70 to 74 Years | 56 (4.8%) | 104 (7.5%) |
| 75 to 79 Years | 16 (1.4%) | 61 (4.4%) |
| 80 to 84 Years | 3 (0.3%) | 20 (1.4%) |
| 85 Years and over | 13 (1.1%) | 6 (0.4%) |
| Total | 1,156 (100.0%) | 1,386 (100.0%) |
Families and Households in Pembroke
Median Family Size in Pembroke
The median family size in Pembroke is 3.23 persons per family, with single male/father families (45 | 7.5%) accounting for the largest median family size of 4.38 persons per family. On the other hand, single female/mother families (250 | 41.7%) represent the smallest median family size with 3.11 persons per family.
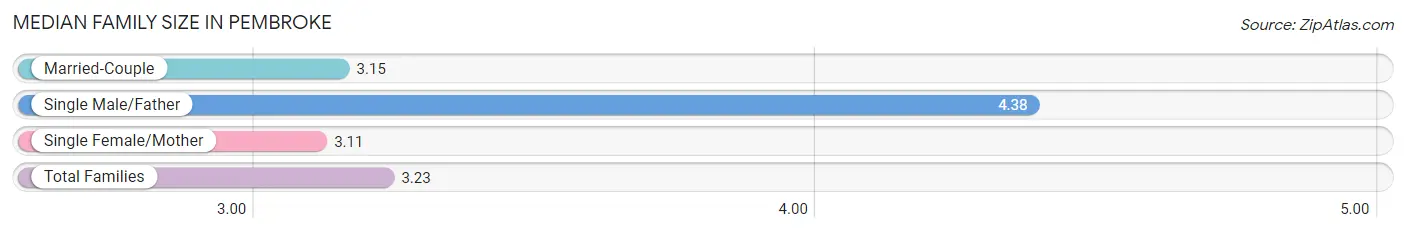
| Family Type | # Families | Family Size |
| Married-Couple | 305 (50.8%) | 3.15 |
| Single Male/Father | 45 (7.5%) | 4.38 |
| Single Female/Mother | 250 (41.7%) | 3.11 |
| Total Families | 600 (100.0%) | 3.23 |
Median Household Size in Pembroke
The median household size in Pembroke is 2.87 persons per household, with single male/father households (45 | 5.1%) accounting for the largest median household size of 4.76 persons per household. non-family households (281 | 31.9%) represent the smallest median household size with 1.91 persons per household.
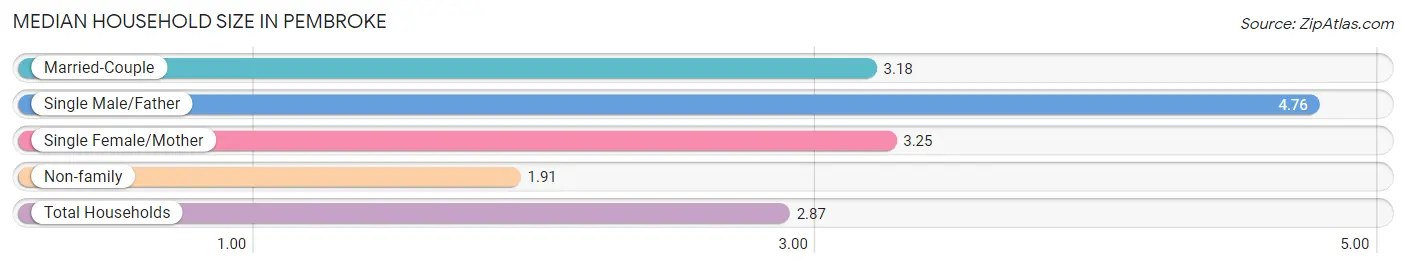
| Household Type | # Households | Household Size |
| Married-Couple | 305 (34.6%) | 3.18 |
| Single Male/Father | 45 (5.1%) | 4.76 |
| Single Female/Mother | 250 (28.4%) | 3.25 |
| Non-family | 281 (31.9%) | 1.91 |
| Total Households | 881 (100.0%) | 2.87 |
Household Size by Marriage Status in Pembroke
Out of a total of 881 households in Pembroke, 600 (68.1%) are family households, while 281 (31.9%) are nonfamily households. The most numerous type of family households are 2-person households, comprising 238, and the most common type of nonfamily households are 1-person households, comprising 132.
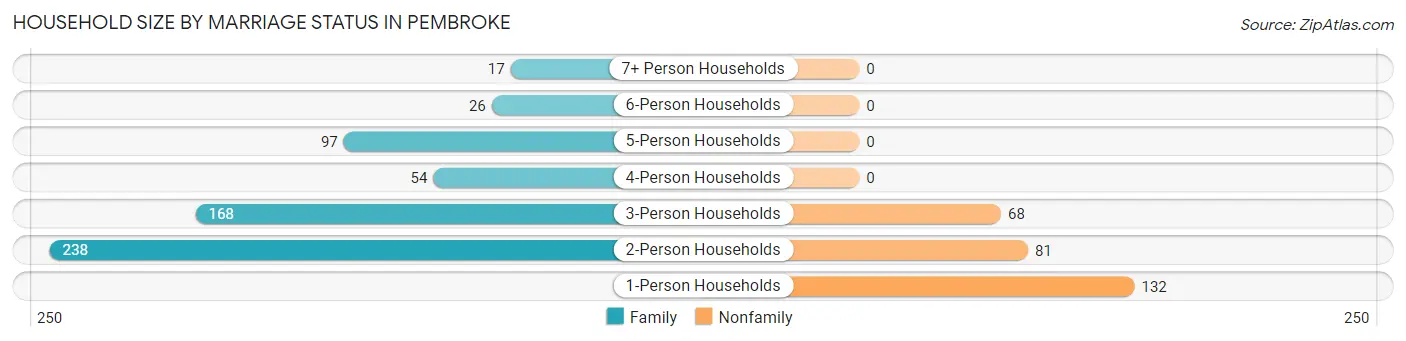
| Household Size | Family Households | Nonfamily Households |
| 1-Person Households | - | 132 (15.0%) |
| 2-Person Households | 238 (27.0%) | 81 (9.2%) |
| 3-Person Households | 168 (19.1%) | 68 (7.7%) |
| 4-Person Households | 54 (6.1%) | 0 (0.0%) |
| 5-Person Households | 97 (11.0%) | 0 (0.0%) |
| 6-Person Households | 26 (2.9%) | 0 (0.0%) |
| 7+ Person Households | 17 (1.9%) | 0 (0.0%) |
| Total | 600 (68.1%) | 281 (31.9%) |
Female Fertility in Pembroke
Fertility by Age in Pembroke
Average fertility rate in Pembroke is 116.0 births per 1,000 women. Women in the age bracket of 20 to 34 years have the highest fertility rate with 175.0 births per 1,000 women. Women in the age bracket of 20 to 34 years acount for 64.6% of all women with births.
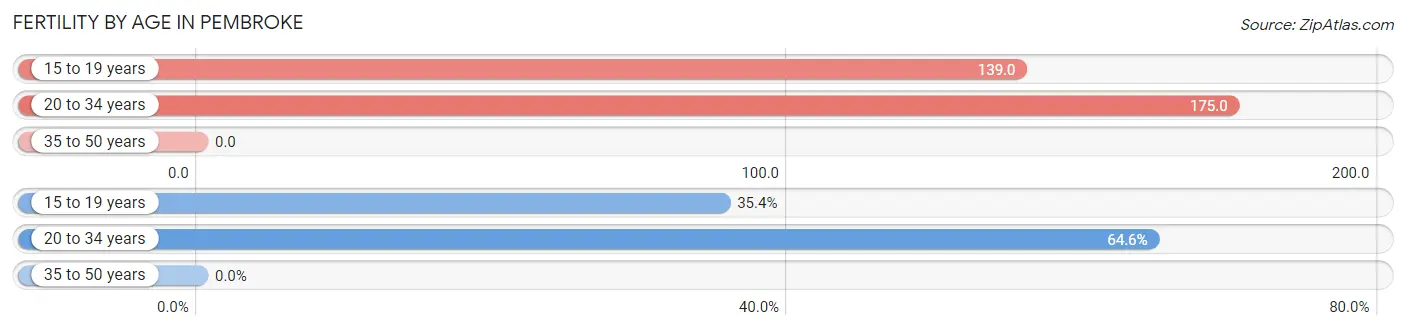
| Age Bracket | Women with Births | Births / 1,000 Women |
| 15 to 19 years | 28 (35.4%) | 139.0 |
| 20 to 34 years | 51 (64.6%) | 175.0 |
| 35 to 50 years | 0 (0.0%) | 0.0 |
| Total | 79 (100.0%) | 116.0 |
Fertility by Age by Marriage Status in Pembroke
35.4% of women with births (79) in Pembroke are married. The highest percentage of unmarried women with births falls into 20 to 34 years age bracket with 100.0% of them unmarried at the time of birth, while the lowest percentage of unmarried women with births belong to 15 to 19 years age bracket with 0.0% of them unmarried.
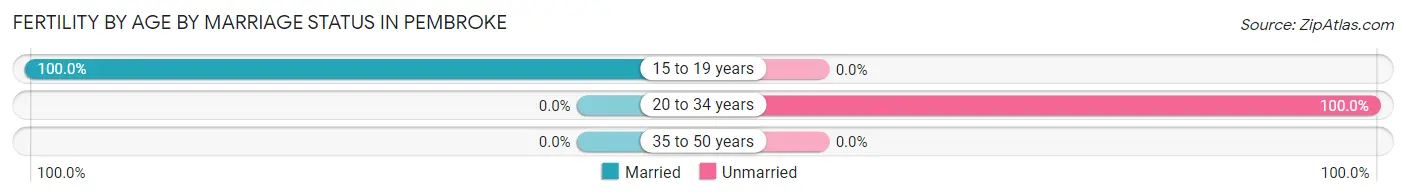
| Age Bracket | Married | Unmarried |
| 15 to 19 years | 28 (100.0%) | 0 (0.0%) |
| 20 to 34 years | 0 (0.0%) | 51 (100.0%) |
| 35 to 50 years | 0 (0.0%) | 0 (0.0%) |
| Total | 28 (35.4%) | 51 (64.6%) |
Fertility by Education in Pembroke
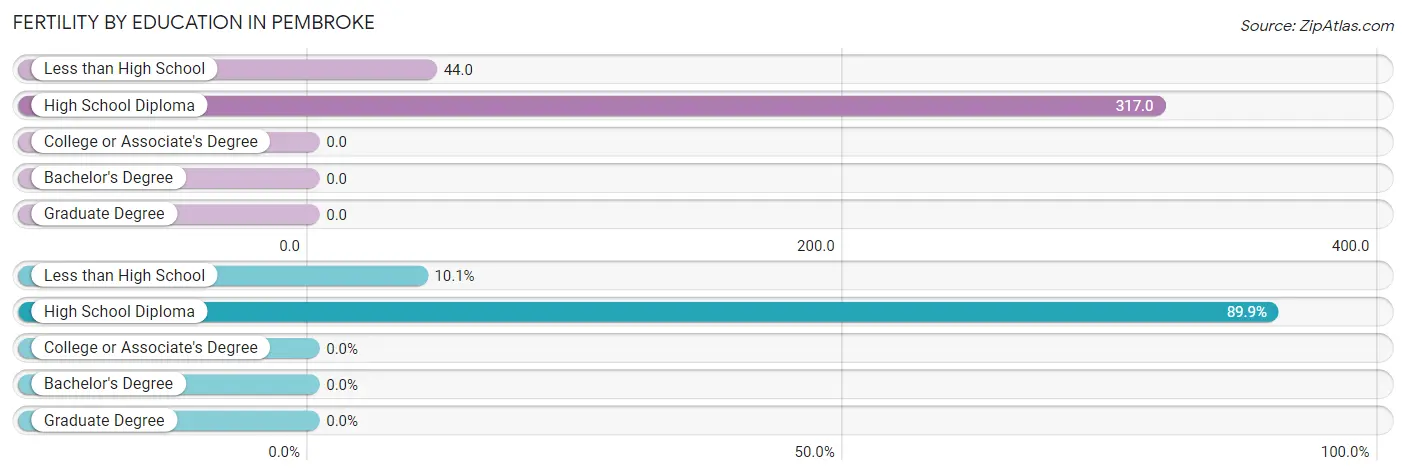
| Educational Attainment | Women with Births | Births / 1,000 Women |
| Less than High School | 8 (10.1%) | 44.0 |
| High School Diploma | 71 (89.9%) | 317.0 |
| College or Associate's Degree | 0 (0.0%) | 0.0 |
| Bachelor's Degree | 0 (0.0%) | 0.0 |
| Graduate Degree | 0 (0.0%) | 0.0 |
| Total | 79 (100.0%) | 116.0 |
Fertility by Education by Marriage Status in Pembroke
64.6% of women with births in Pembroke are unmarried. Women with the educational attainment of high school diploma are most likely to be married with 39.4% of them married at childbirth, while women with the educational attainment of less than high school are least likely to be married with 100.0% of them unmarried at childbirth.
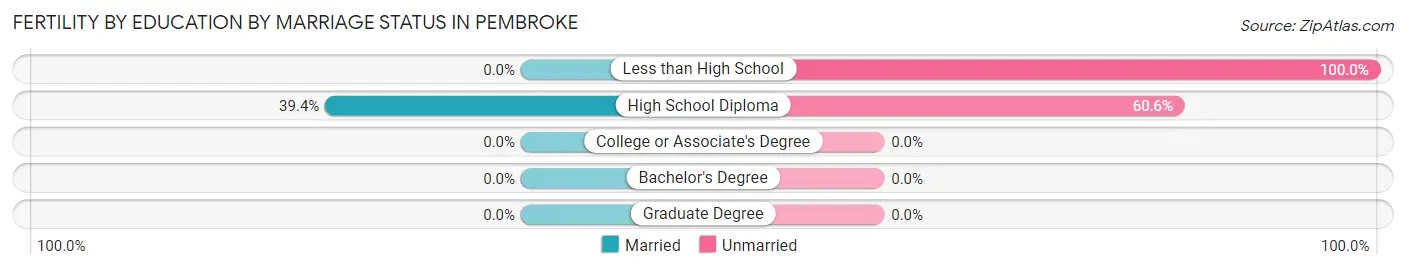
| Educational Attainment | Married | Unmarried |
| Less than High School | 0 (0.0%) | 8 (100.0%) |
| High School Diploma | 28 (39.4%) | 43 (60.6%) |
| College or Associate's Degree | 0 (0.0%) | 0 (0.0%) |
| Bachelor's Degree | 0 (0.0%) | 0 (0.0%) |
| Graduate Degree | 0 (0.0%) | 0 (0.0%) |
| Total | 28 (35.4%) | 51 (64.6%) |
Income in Pembroke
Income Overview in Pembroke
Per Capita Income in Pembroke is $25,702, while median incomes of families and households are $67,031 and $66,488 respectively.
| Characteristic | Number | Measure |
| Per Capita Income | 2,542 | $25,702 |
| Median Family Income | 600 | $67,031 |
| Mean Family Income | 600 | $76,536 |
| Median Household Income | 881 | $66,488 |
| Mean Household Income | 881 | $73,040 |
| Income Deficit | 600 | $3,707 |
| Wage / Income Gap (%) | 2,542 | 20.02% |
| Wage / Income Gap ($) | 2,542 | 79.98¢ per $1 |
| Gini / Inequality Index | 2,542 | 0.39 |
Earnings by Sex in Pembroke
Average Earnings in Pembroke are $29,938, $34,831 for men and $27,858 for women, a difference of 20.0%.
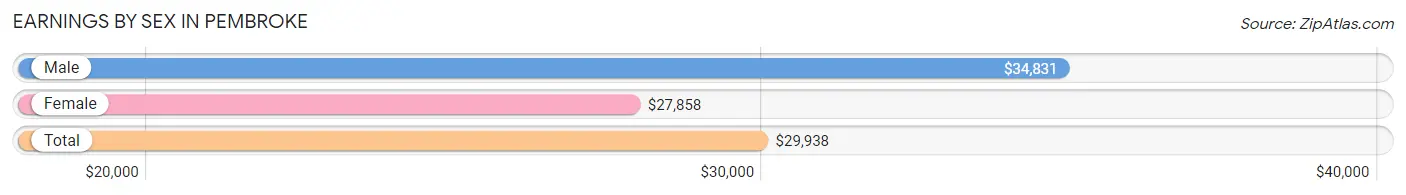
| Sex | Number | Average Earnings |
| Male | 772 (50.6%) | $34,831 |
| Female | 753 (49.4%) | $27,858 |
| Total | 1,525 (100.0%) | $29,938 |
Earnings by Sex by Income Bracket in Pembroke
The most common earnings brackets in Pembroke are $30,000 to $34,999 for men (134 | 17.4%) and $25,000 to $29,999 for women (163 | 21.6%).
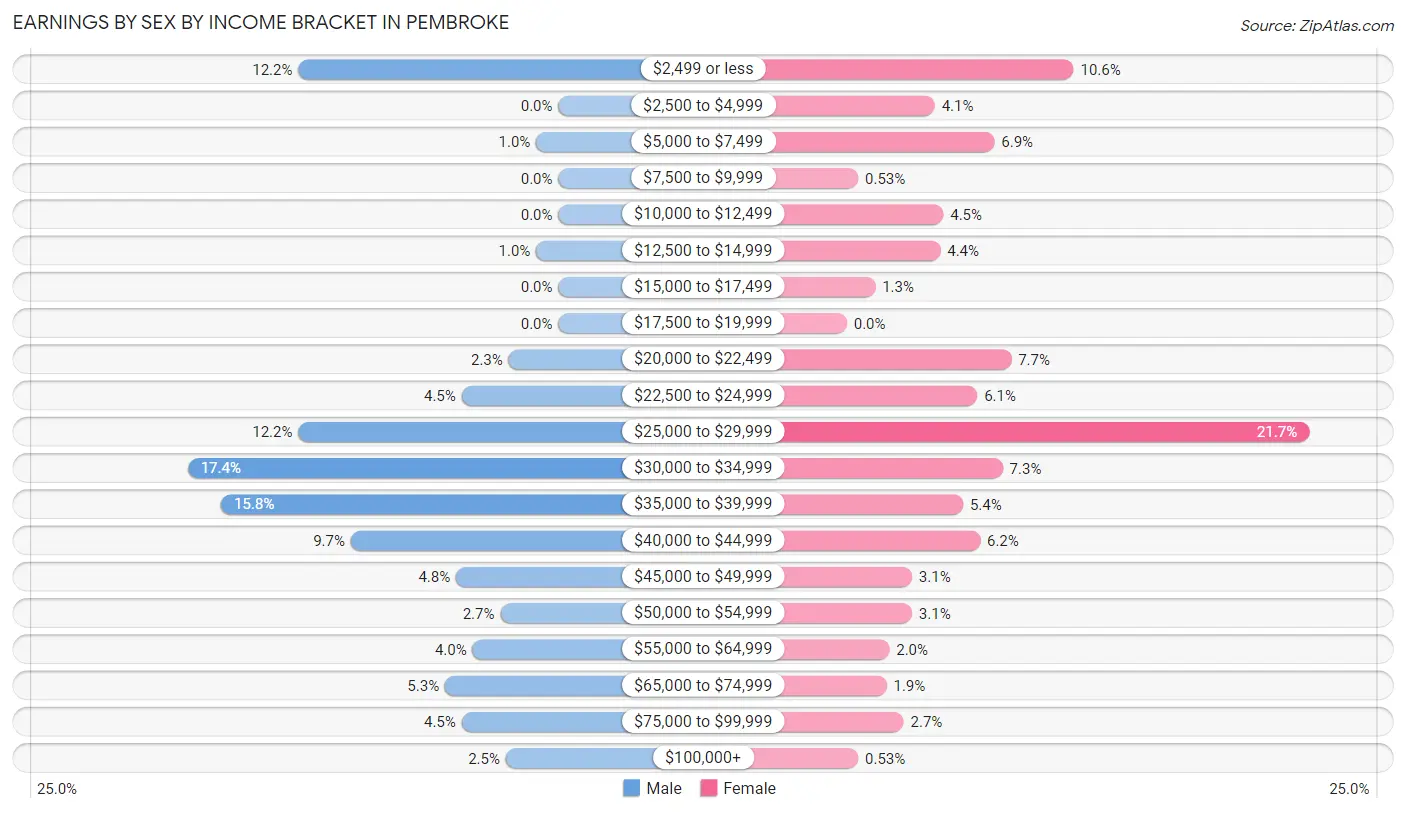
| Income | Male | Female |
| $2,499 or less | 94 (12.2%) | 80 (10.6%) |
| $2,500 to $4,999 | 0 (0.0%) | 31 (4.1%) |
| $5,000 to $7,499 | 8 (1.0%) | 52 (6.9%) |
| $7,500 to $9,999 | 0 (0.0%) | 4 (0.5%) |
| $10,000 to $12,499 | 0 (0.0%) | 34 (4.5%) |
| $12,500 to $14,999 | 8 (1.0%) | 33 (4.4%) |
| $15,000 to $17,499 | 0 (0.0%) | 10 (1.3%) |
| $17,500 to $19,999 | 0 (0.0%) | 0 (0.0%) |
| $20,000 to $22,499 | 18 (2.3%) | 58 (7.7%) |
| $22,500 to $24,999 | 35 (4.5%) | 46 (6.1%) |
| $25,000 to $29,999 | 94 (12.2%) | 163 (21.6%) |
| $30,000 to $34,999 | 134 (17.4%) | 55 (7.3%) |
| $35,000 to $39,999 | 122 (15.8%) | 41 (5.4%) |
| $40,000 to $44,999 | 75 (9.7%) | 47 (6.2%) |
| $45,000 to $49,999 | 37 (4.8%) | 23 (3.0%) |
| $50,000 to $54,999 | 21 (2.7%) | 23 (3.0%) |
| $55,000 to $64,999 | 31 (4.0%) | 15 (2.0%) |
| $65,000 to $74,999 | 41 (5.3%) | 14 (1.9%) |
| $75,000 to $99,999 | 35 (4.5%) | 20 (2.7%) |
| $100,000+ | 19 (2.5%) | 4 (0.5%) |
| Total | 772 (100.0%) | 753 (100.0%) |
Earnings by Sex by Educational Attainment in Pembroke
Average earnings in Pembroke are $36,094 for men and $28,067 for women, a difference of 22.2%. Men with an educational attainment of less than high school enjoy the highest average annual earnings of $40,469, while those with bachelor's degree education earn the least with $2,499. Women with an educational attainment of bachelor's degree earn the most with the average annual earnings of $44,013, while those with graduate degree education have the smallest earnings of $2,499.
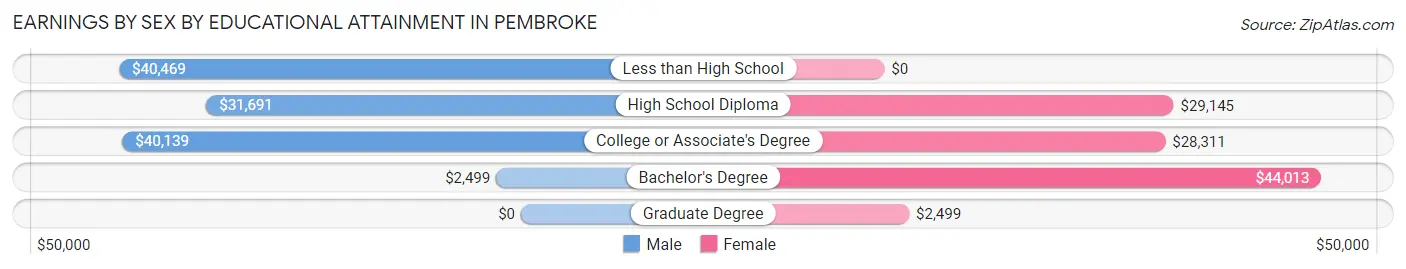
| Educational Attainment | Male Income | Female Income |
| Less than High School | $40,469 | $0 |
| High School Diploma | $31,691 | $29,145 |
| College or Associate's Degree | $40,139 | $28,311 |
| Bachelor's Degree | $2,499 | $44,013 |
| Graduate Degree | - | - |
| Total | $36,094 | $28,067 |
Family Income in Pembroke
Family Income Brackets in Pembroke
According to the Pembroke family income data, there are 130 families falling into the $25,000 to $34,999 income range, which is the most common income bracket and makes up 21.7% of all families.
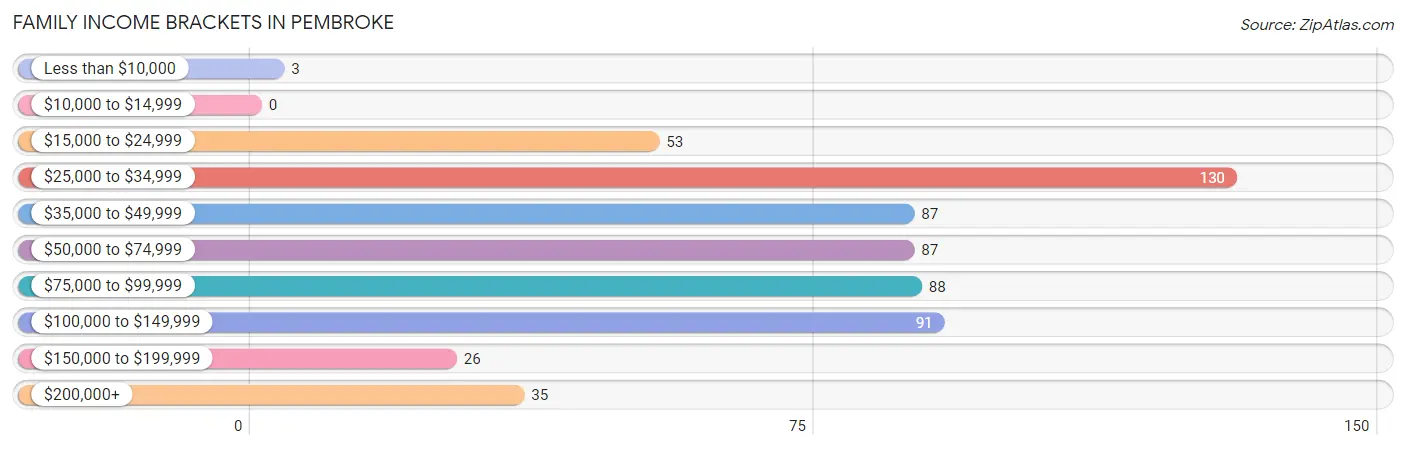
| Income Bracket | # Families | % Families |
| Less than $10,000 | 3 | 0.5% |
| $10,000 to $14,999 | 0 | 0.0% |
| $15,000 to $24,999 | 53 | 8.8% |
| $25,000 to $34,999 | 130 | 21.7% |
| $35,000 to $49,999 | 87 | 14.5% |
| $50,000 to $74,999 | 87 | 14.5% |
| $75,000 to $99,999 | 88 | 14.7% |
| $100,000 to $149,999 | 91 | 15.2% |
| $150,000 to $199,999 | 26 | 4.3% |
| $200,000+ | 35 | 5.8% |
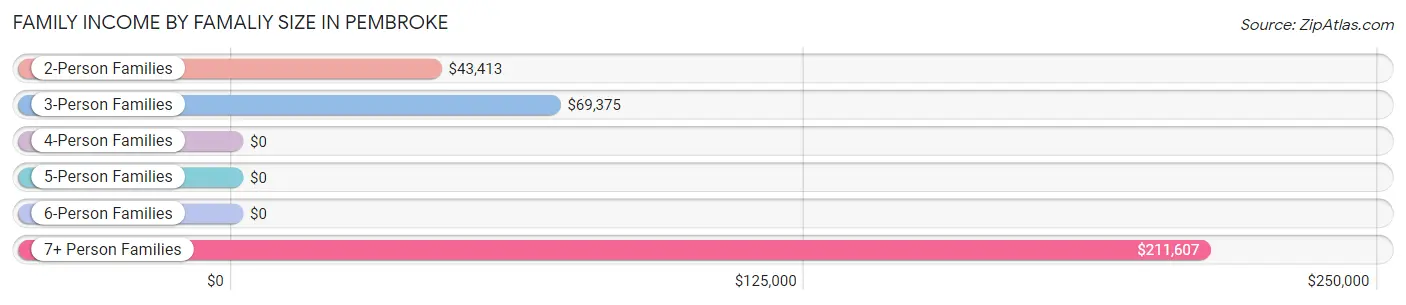
Family Income by Famaliy Size in Pembroke
7+ person families (17 | 2.8%) account for the highest median family income in Pembroke with $211,607 per family, while 7+ person families (17 | 2.8%) have the highest median income of $30,230 per family member.
| Income Bracket | # Families | Median Income |
| 2-Person Families | 247 (41.2%) | $43,413 |
| 3-Person Families | 159 (26.5%) | $69,375 |
| 4-Person Families | 106 (17.7%) | $0 |
| 5-Person Families | 52 (8.7%) | $0 |
| 6-Person Families | 19 (3.2%) | $0 |
| 7+ Person Families | 17 (2.8%) | $211,607 |
| Total | 600 (100.0%) | $67,031 |
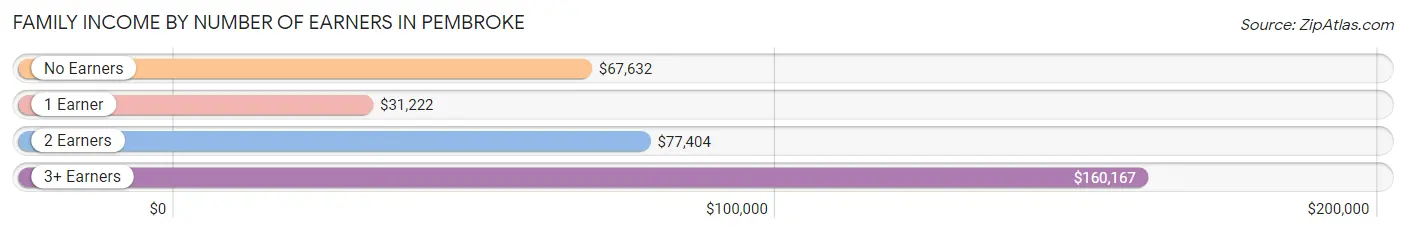
Family Income by Number of Earners in Pembroke
The median family income in Pembroke is $67,031, with families comprising 3+ earners (92) having the highest median family income of $160,167, while families with 1 earner (284) have the lowest median family income of $31,222, accounting for 15.3% and 47.3% of families, respectively.
| Number of Earners | # Families | Median Income |
| No Earners | 82 (13.7%) | $67,632 |
| 1 Earner | 284 (47.3%) | $31,222 |
| 2 Earners | 142 (23.7%) | $77,404 |
| 3+ Earners | 92 (15.3%) | $160,167 |
| Total | 600 (100.0%) | $67,031 |
Household Income in Pembroke
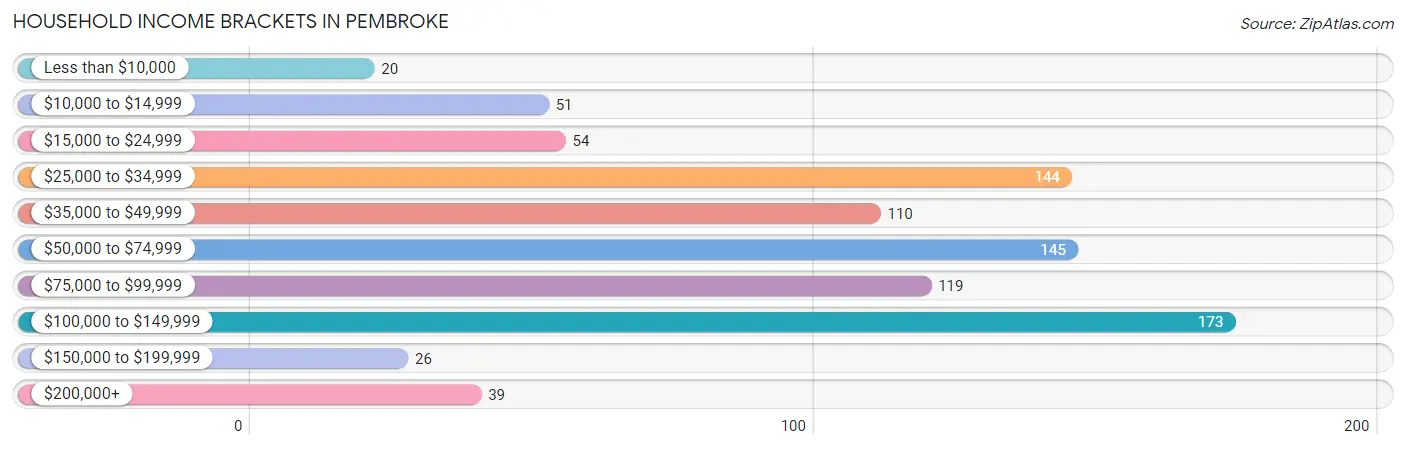
Household Income Brackets in Pembroke
With 173 households falling in the category, the $100,000 to $149,999 income range is the most frequent in Pembroke, accounting for 19.6% of all households. In contrast, only 20 households (2.3%) fall into the less than $10,000 income bracket, making it the least populous group.
| Income Bracket | # Households | % Households |
| Less than $10,000 | 20 | 2.3% |
| $10,000 to $14,999 | 51 | 5.8% |
| $15,000 to $24,999 | 54 | 6.1% |
| $25,000 to $34,999 | 144 | 16.3% |
| $35,000 to $49,999 | 110 | 12.5% |
| $50,000 to $74,999 | 145 | 16.5% |
| $75,000 to $99,999 | 119 | 13.5% |
| $100,000 to $149,999 | 173 | 19.6% |
| $150,000 to $199,999 | 26 | 3.0% |
| $200,000+ | 39 | 4.4% |
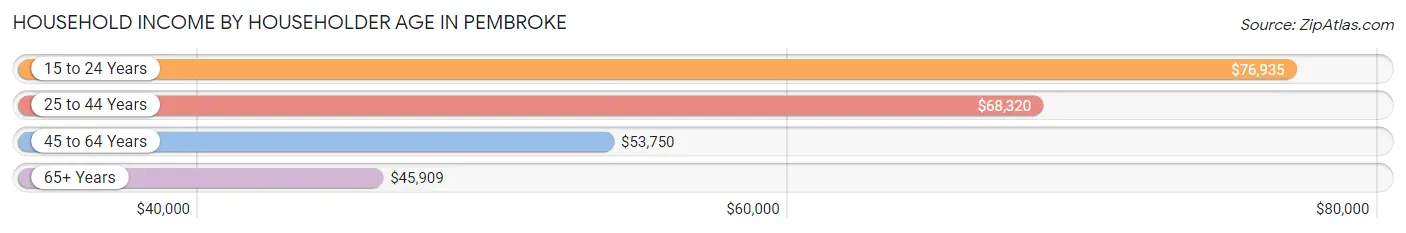
Household Income by Householder Age in Pembroke
The median household income in Pembroke is $66,488, with the highest median household income of $76,935 found in the 15 to 24 years age bracket for the primary householder. A total of 114 households (12.9%) fall into this category. Meanwhile, the 65+ years age bracket for the primary householder has the lowest median household income of $45,909, with 266 households (30.2%) in this group.
| Income Bracket | # Households | Median Income |
| 15 to 24 Years | 114 (12.9%) | $76,935 |
| 25 to 44 Years | 275 (31.2%) | $68,320 |
| 45 to 64 Years | 226 (25.7%) | $53,750 |
| 65+ Years | 266 (30.2%) | $45,909 |
| Total | 881 (100.0%) | $66,488 |
Poverty in Pembroke
Income Below Poverty by Sex and Age in Pembroke
With 12.2% poverty level for males and 18.9% for females among the residents of Pembroke, 12 to 14 year old males and 16 and 17 year old females are the most vulnerable to poverty, with 25 males (55.6%) and 29 females (78.4%) in their respective age groups living below the poverty level.
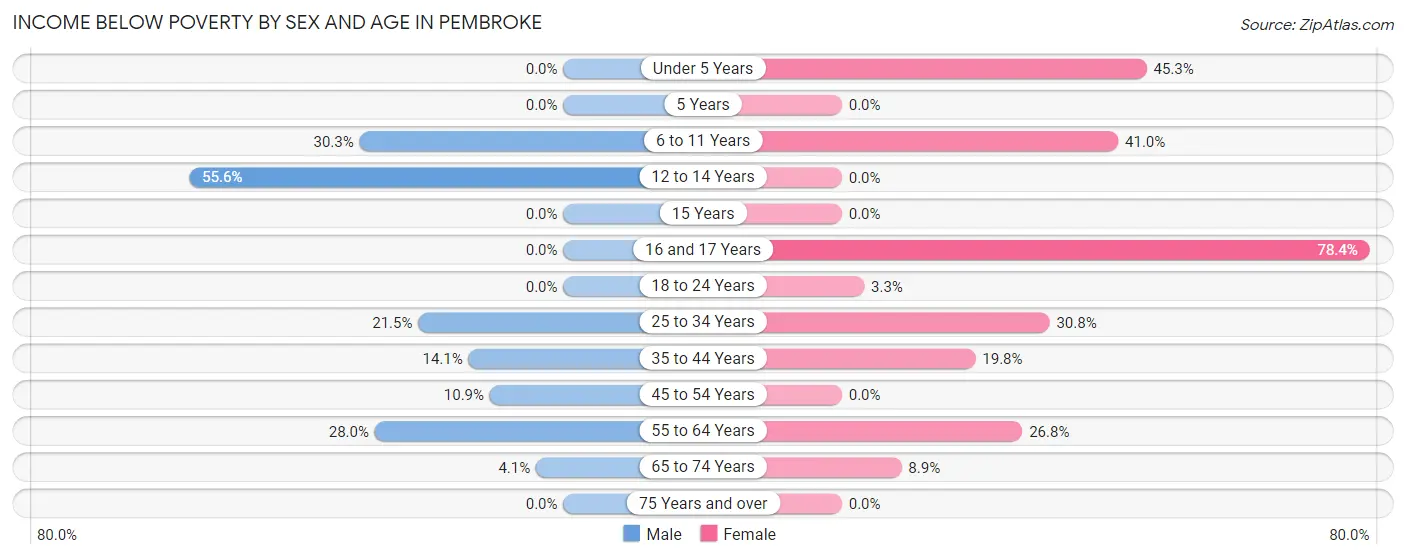
| Age Bracket | Male | Female |
| Under 5 Years | 0 (0.0%) | 43 (45.3%) |
| 5 Years | 0 (0.0%) | 0 (0.0%) |
| 6 to 11 Years | 23 (30.3%) | 48 (41.0%) |
| 12 to 14 Years | 25 (55.6%) | 0 (0.0%) |
| 15 Years | 0 (0.0%) | 0 (0.0%) |
| 16 and 17 Years | 0 (0.0%) | 29 (78.4%) |
| 18 to 24 Years | 0 (0.0%) | 6 (3.3%) |
| 25 to 34 Years | 42 (21.5%) | 66 (30.8%) |
| 35 to 44 Years | 20 (14.1%) | 23 (19.8%) |
| 45 to 54 Years | 6 (10.9%) | 0 (0.0%) |
| 55 to 64 Years | 21 (28.0%) | 30 (26.8%) |
| 65 to 74 Years | 3 (4.1%) | 17 (8.8%) |
| 75 Years and over | 0 (0.0%) | 0 (0.0%) |
| Total | 140 (12.2%) | 262 (18.9%) |
Income Above Poverty by Sex and Age in Pembroke
According to the poverty statistics in Pembroke, males aged under 5 years and females aged 12 to 14 years are the age groups that are most secure financially, with 100.0% of males and 100.0% of females in these age groups living above the poverty line.
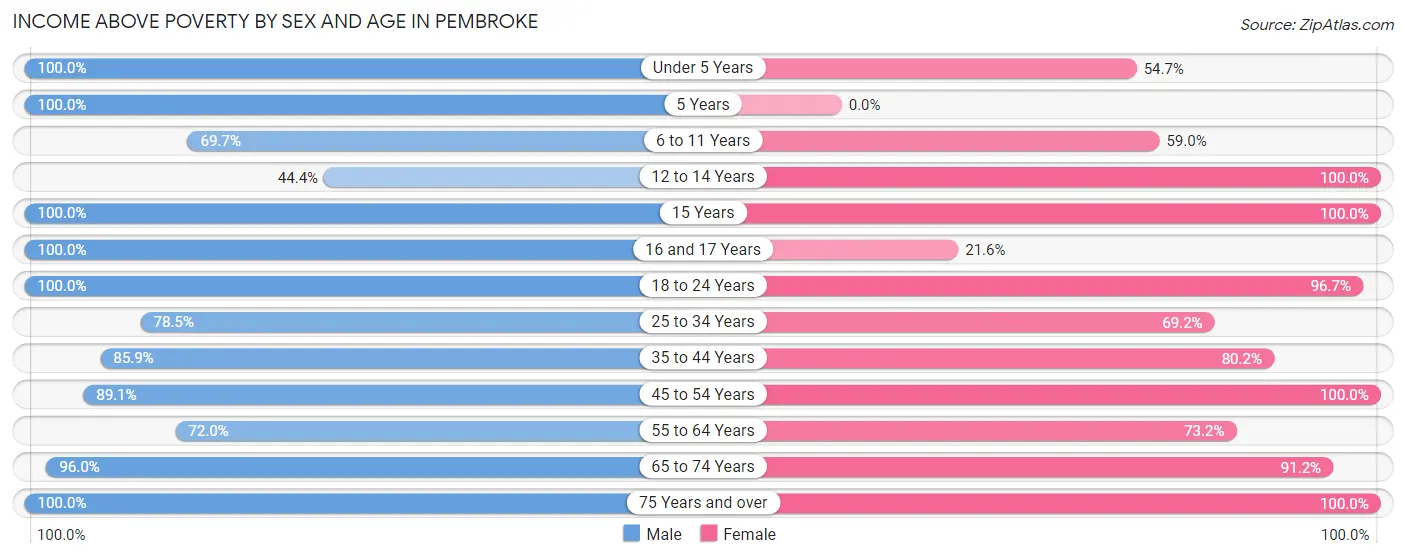
| Age Bracket | Male | Female |
| Under 5 Years | 56 (100.0%) | 52 (54.7%) |
| 5 Years | 28 (100.0%) | 0 (0.0%) |
| 6 to 11 Years | 53 (69.7%) | 69 (59.0%) |
| 12 to 14 Years | 20 (44.4%) | 73 (100.0%) |
| 15 Years | 5 (100.0%) | 61 (100.0%) |
| 16 and 17 Years | 29 (100.0%) | 8 (21.6%) |
| 18 to 24 Years | 334 (100.0%) | 175 (96.7%) |
| 25 to 34 Years | 153 (78.5%) | 148 (69.2%) |
| 35 to 44 Years | 122 (85.9%) | 93 (80.2%) |
| 45 to 54 Years | 49 (89.1%) | 101 (100.0%) |
| 55 to 64 Years | 54 (72.0%) | 82 (73.2%) |
| 65 to 74 Years | 71 (96.0%) | 175 (91.1%) |
| 75 Years and over | 32 (100.0%) | 87 (100.0%) |
| Total | 1,006 (87.8%) | 1,124 (81.1%) |
Income Below Poverty Among Married-Couple Families in Pembroke
The poverty statistics for married-couple families in Pembroke show that 5.6% or 17 of the total 305 families live below the poverty line. Families with 1 or 2 children have the highest poverty rate of 10.8%, comprising of 9 families. On the other hand, families with 3 or 4 children have the lowest poverty rate of 0.0%, which includes 0 families.
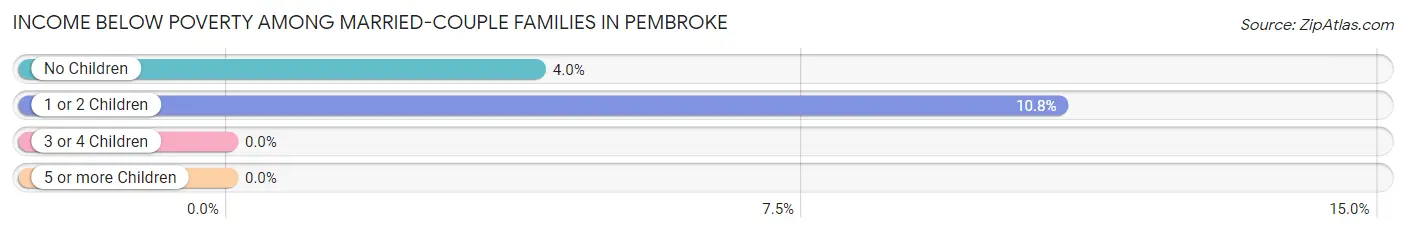
| Children | Above Poverty | Below Poverty |
| No Children | 191 (96.0%) | 8 (4.0%) |
| 1 or 2 Children | 74 (89.2%) | 9 (10.8%) |
| 3 or 4 Children | 23 (100.0%) | 0 (0.0%) |
| 5 or more Children | 0 (0.0%) | 0 (0.0%) |
| Total | 288 (94.4%) | 17 (5.6%) |
Income Below Poverty Among Single-Parent Households in Pembroke
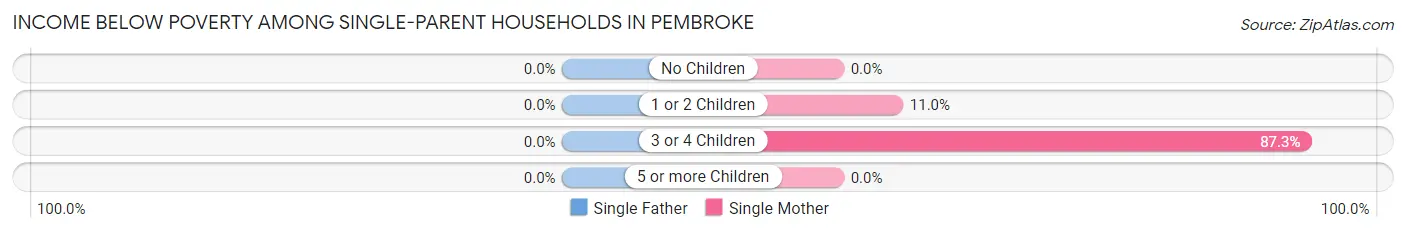
| Children | Single Father | Single Mother |
| No Children | 0 (0.0%) | 0 (0.0%) |
| 1 or 2 Children | 0 (0.0%) | 16 (11.0%) |
| 3 or 4 Children | 0 (0.0%) | 48 (87.3%) |
| 5 or more Children | 0 (0.0%) | 0 (0.0%) |
| Total | 0 (0.0%) | 64 (25.6%) |
Income Below Poverty Among Married-Couple vs Single-Parent Households in Pembroke
The poverty data for Pembroke shows that 17 of the married-couple family households (5.6%) and 64 of the single-parent households (21.7%) are living below the poverty level. Within the married-couple family households, those with 1 or 2 children have the highest poverty rate, with 9 households (10.8%) falling below the poverty line. Among the single-parent households, those with 3 or 4 children have the highest poverty rate, with 48 household (64.0%) living below poverty.
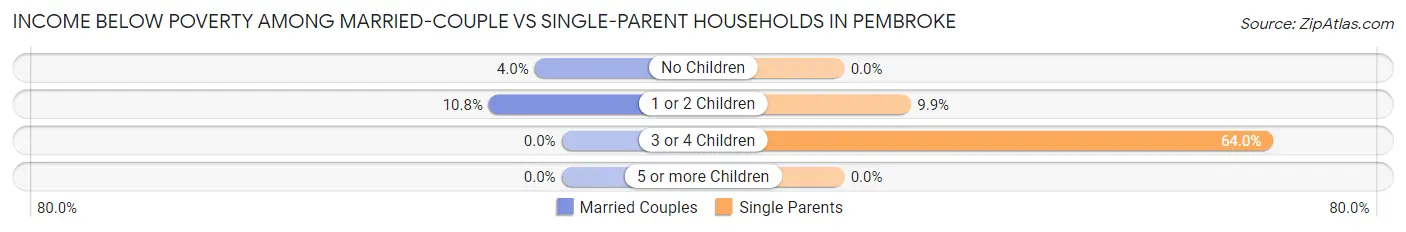
| Children | Married-Couple Families | Single-Parent Households |
| No Children | 8 (4.0%) | 0 (0.0%) |
| 1 or 2 Children | 9 (10.8%) | 16 (9.9%) |
| 3 or 4 Children | 0 (0.0%) | 48 (64.0%) |
| 5 or more Children | 0 (0.0%) | 0 (0.0%) |
| Total | 17 (5.6%) | 64 (21.7%) |
Employment Characteristics in Pembroke
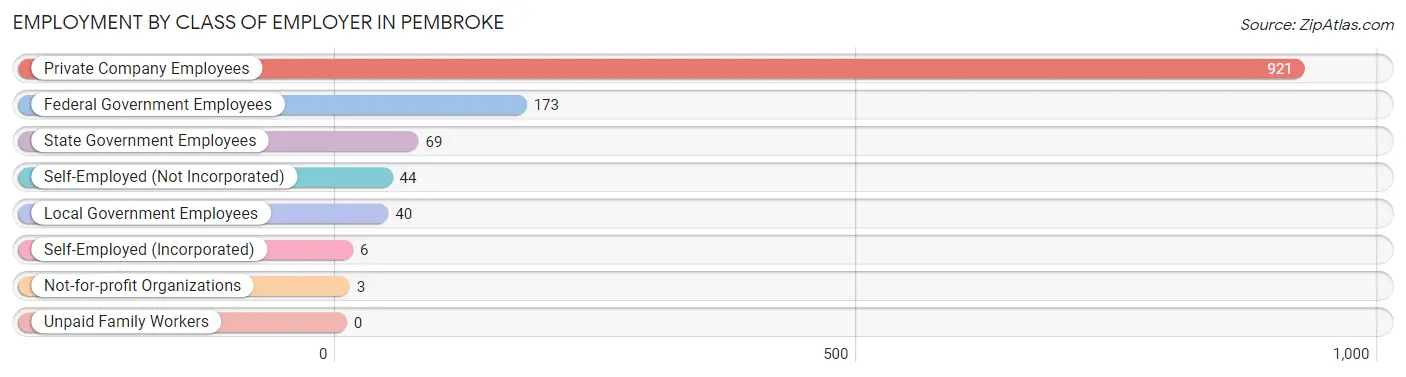
Employment by Class of Employer in Pembroke
Among the 1,256 employed individuals in Pembroke, private company employees (921 | 73.3%), federal government employees (173 | 13.8%), and state government employees (69 | 5.5%) make up the most common classes of employment.
| Employer Class | # Employees | % Employees |
| Private Company Employees | 921 | 73.3% |
| Self-Employed (Incorporated) | 6 | 0.5% |
| Self-Employed (Not Incorporated) | 44 | 3.5% |
| Not-for-profit Organizations | 3 | 0.2% |
| Local Government Employees | 40 | 3.2% |
| State Government Employees | 69 | 5.5% |
| Federal Government Employees | 173 | 13.8% |
| Unpaid Family Workers | 0 | 0.0% |
| Total | 1,256 | 100.0% |
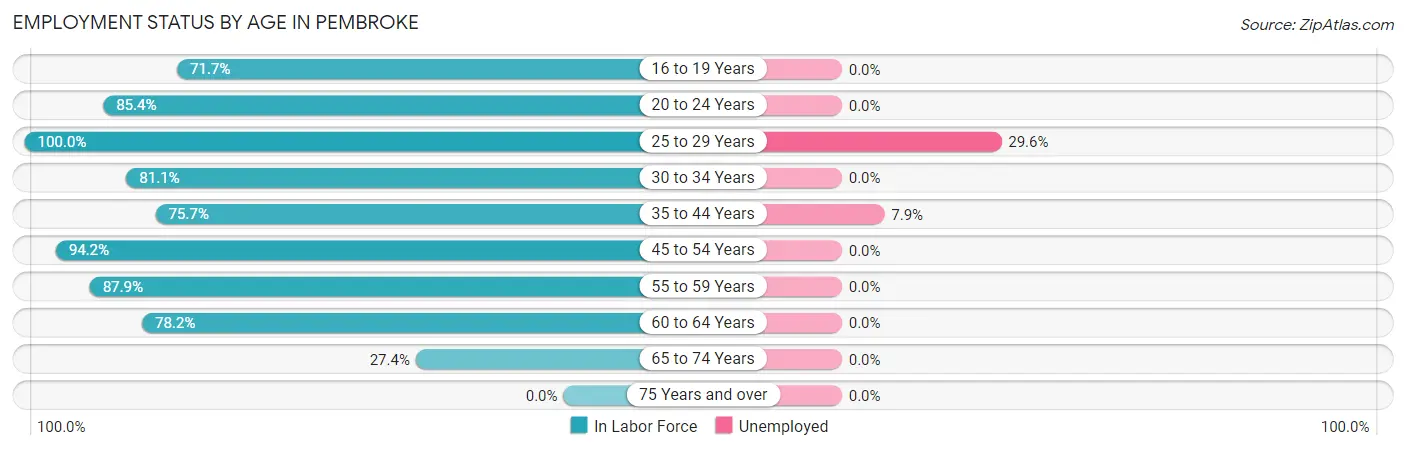
Employment Status by Age in Pembroke
According to the labor force statistics for Pembroke, out of the total population over 16 years of age (1,986), 72.2% or 1,434 individuals are in the labor force, with 7.7% or 110 of them unemployed. The age group with the highest labor force participation rate is 25 to 29 years, with 100.0% or 287 individuals in the labor force. Within the labor force, the 25 to 29 years age range has the highest percentage of unemployed individuals, with 29.6% or 85 of them being unemployed.
| Age Bracket | In Labor Force | Unemployed |
| 16 to 19 Years | 157 (71.7%) | 0 (0.0%) |
| 20 to 24 Years | 309 (85.4%) | 0 (0.0%) |
| 25 to 29 Years | 287 (100.0%) | 85 (29.6%) |
| 30 to 34 Years | 99 (81.1%) | 0 (0.0%) |
| 35 to 44 Years | 203 (75.7%) | 16 (7.9%) |
| 45 to 54 Years | 147 (94.2%) | 0 (0.0%) |
| 55 to 59 Years | 116 (87.9%) | 0 (0.0%) |
| 60 to 64 Years | 43 (78.2%) | 0 (0.0%) |
| 65 to 74 Years | 73 (27.4%) | 0 (0.0%) |
| 75 Years and over | 0 (0.0%) | 0 (0.0%) |
| Total | 1,434 (72.2%) | 110 (7.7%) |
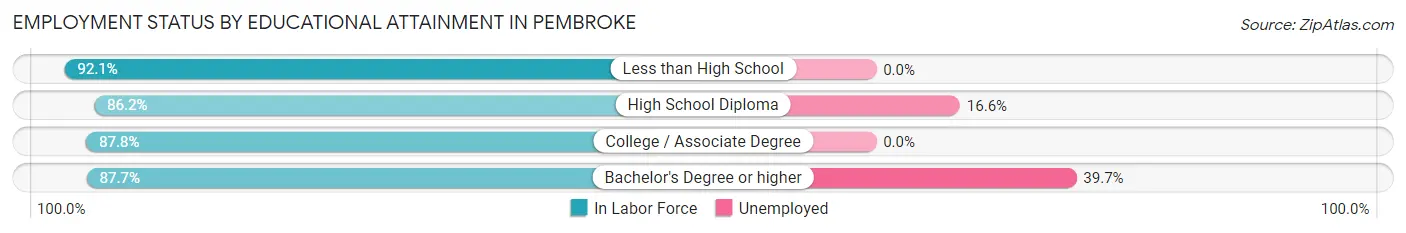
Employment Status by Educational Attainment in Pembroke
According to labor force statistics for Pembroke, 87.7% of individuals (895) out of the total population between 25 and 64 years of age (1,020) are in the labor force, with 11.5% or 103 of them being unemployed. The group with the highest labor force participation rate are those with the educational attainment of less than high school, with 92.1% or 105 individuals in the labor force. Within the labor force, individuals with bachelor's degree or higher education have the highest percentage of unemployment, with 39.7% or 54 of them being unemployed.
| Educational Attainment | In Labor Force | Unemployed |
| Less than High School | 105 (92.1%) | 0 (0.0%) |
| High School Diploma | 300 (86.2%) | 58 (16.6%) |
| College / Associate Degree | 354 (87.8%) | 0 (0.0%) |
| Bachelor's Degree or higher | 136 (87.7%) | 62 (39.7%) |
| Total | 895 (87.7%) | 117 (11.5%) |
Employment Occupations by Sex in Pembroke
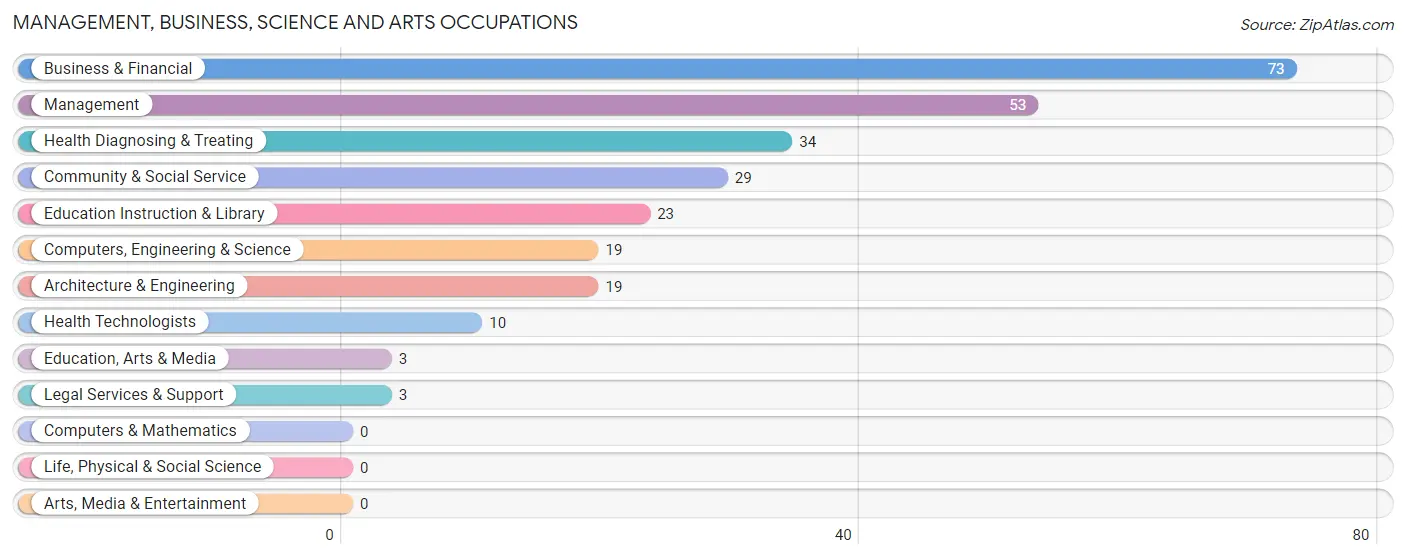
Management, Business, Science and Arts Occupations
The most common Management, Business, Science and Arts occupations in Pembroke are Business & Financial (73 | 6.1%), Management (53 | 4.4%), Health Diagnosing & Treating (34 | 2.8%), Community & Social Service (29 | 2.4%), and Education Instruction & Library (23 | 1.9%).
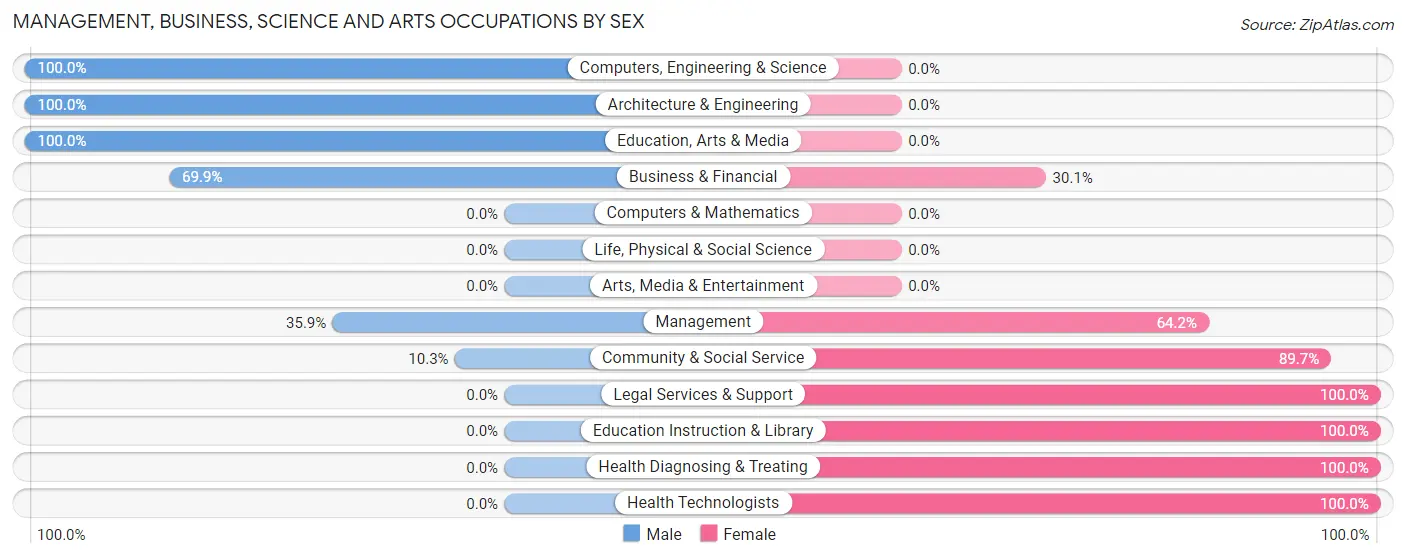
Management, Business, Science and Arts Occupations by Sex
Within the Management, Business, Science and Arts occupations in Pembroke, the most male-oriented occupations are Computers, Engineering & Science (100.0%), Architecture & Engineering (100.0%), and Education, Arts & Media (100.0%), while the most female-oriented occupations are Legal Services & Support (100.0%), Education Instruction & Library (100.0%), and Health Diagnosing & Treating (100.0%).
| Occupation | Male | Female |
| Management | 19 (35.8%) | 34 (64.1%) |
| Business & Financial | 51 (69.9%) | 22 (30.1%) |
| Computers, Engineering & Science | 19 (100.0%) | 0 (0.0%) |
| Computers & Mathematics | 0 (0.0%) | 0 (0.0%) |
| Architecture & Engineering | 19 (100.0%) | 0 (0.0%) |
| Life, Physical & Social Science | 0 (0.0%) | 0 (0.0%) |
| Community & Social Service | 3 (10.3%) | 26 (89.7%) |
| Education, Arts & Media | 3 (100.0%) | 0 (0.0%) |
| Legal Services & Support | 0 (0.0%) | 3 (100.0%) |
| Education Instruction & Library | 0 (0.0%) | 23 (100.0%) |
| Arts, Media & Entertainment | 0 (0.0%) | 0 (0.0%) |
| Health Diagnosing & Treating | 0 (0.0%) | 34 (100.0%) |
| Health Technologists | 0 (0.0%) | 10 (100.0%) |
| Total (Category) | 92 (44.2%) | 116 (55.8%) |
| Total (Overall) | 558 (46.3%) | 647 (53.7%) |
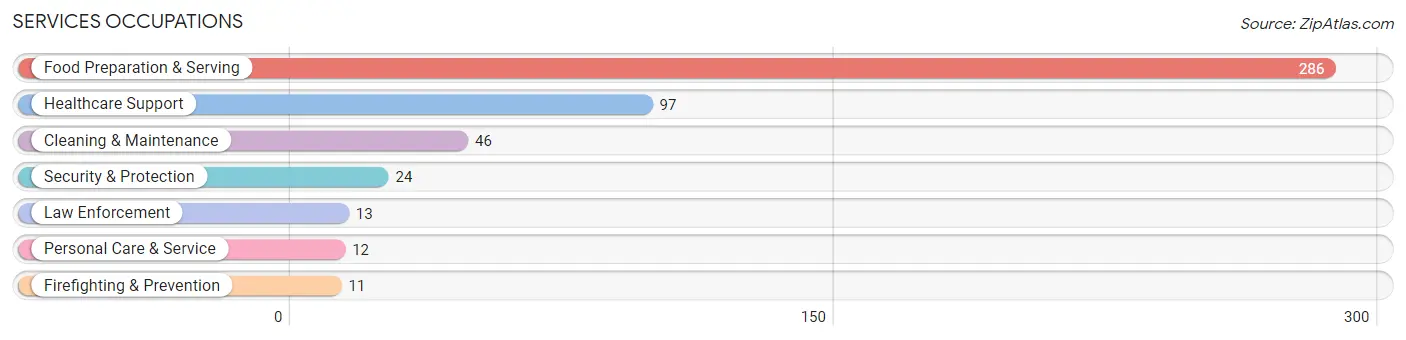
Services Occupations
The most common Services occupations in Pembroke are Food Preparation & Serving (286 | 23.7%), Healthcare Support (97 | 8.1%), Cleaning & Maintenance (46 | 3.8%), Security & Protection (24 | 2.0%), and Law Enforcement (13 | 1.1%).
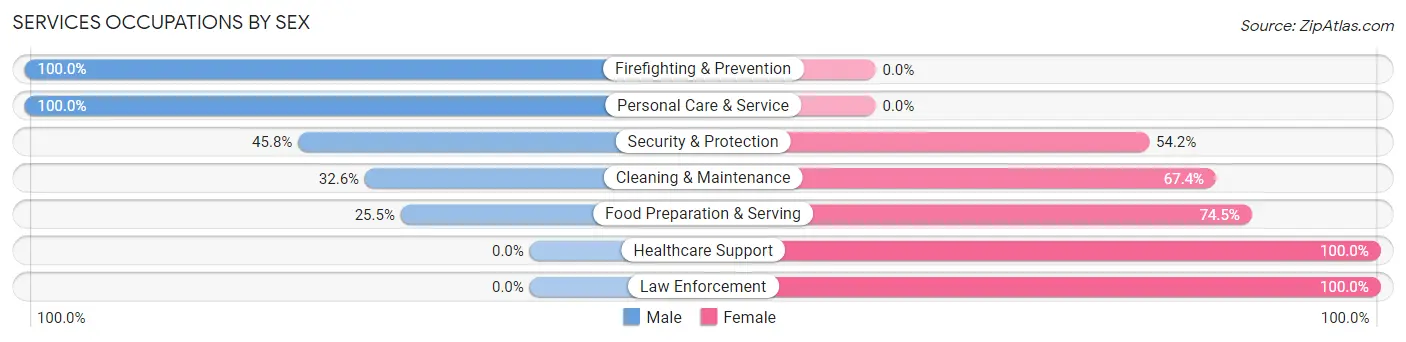
Services Occupations by Sex
Within the Services occupations in Pembroke, the most male-oriented occupations are Firefighting & Prevention (100.0%), Personal Care & Service (100.0%), and Security & Protection (45.8%), while the most female-oriented occupations are Healthcare Support (100.0%), Law Enforcement (100.0%), and Food Preparation & Serving (74.5%).
| Occupation | Male | Female |
| Healthcare Support | 0 (0.0%) | 97 (100.0%) |
| Security & Protection | 11 (45.8%) | 13 (54.2%) |
| Firefighting & Prevention | 11 (100.0%) | 0 (0.0%) |
| Law Enforcement | 0 (0.0%) | 13 (100.0%) |
| Food Preparation & Serving | 73 (25.5%) | 213 (74.5%) |
| Cleaning & Maintenance | 15 (32.6%) | 31 (67.4%) |
| Personal Care & Service | 12 (100.0%) | 0 (0.0%) |
| Total (Category) | 111 (23.9%) | 354 (76.1%) |
| Total (Overall) | 558 (46.3%) | 647 (53.7%) |
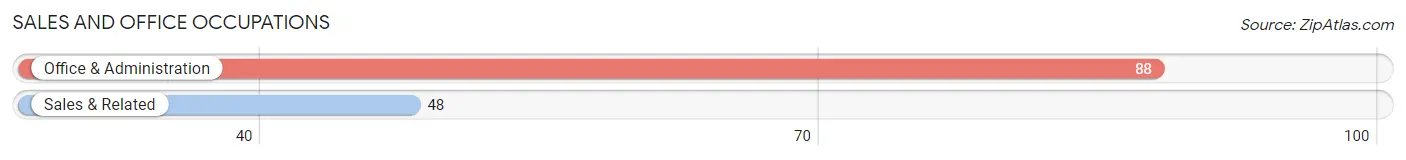
Sales and Office Occupations
The most common Sales and Office occupations in Pembroke are Office & Administration (88 | 7.3%), and Sales & Related (48 | 4.0%).
Sales and Office Occupations by Sex
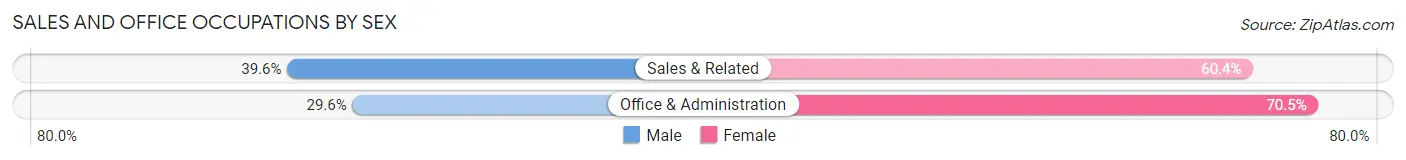
| Occupation | Male | Female |
| Sales & Related | 19 (39.6%) | 29 (60.4%) |
| Office & Administration | 26 (29.5%) | 62 (70.5%) |
| Total (Category) | 45 (33.1%) | 91 (66.9%) |
| Total (Overall) | 558 (46.3%) | 647 (53.7%) |
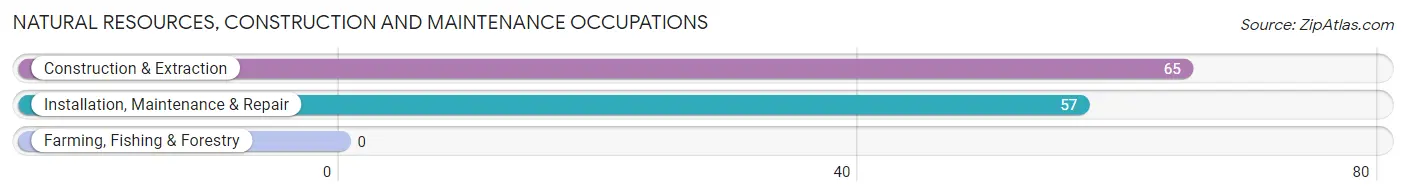
Natural Resources, Construction and Maintenance Occupations
The most common Natural Resources, Construction and Maintenance occupations in Pembroke are Construction & Extraction (65 | 5.4%), and Installation, Maintenance & Repair (57 | 4.7%).
Natural Resources, Construction and Maintenance Occupations by Sex
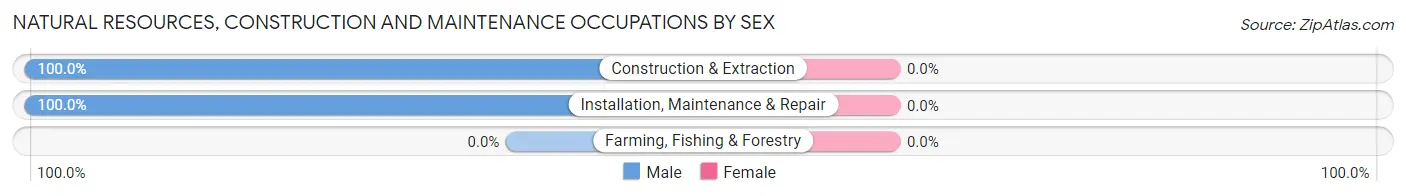
| Occupation | Male | Female |
| Farming, Fishing & Forestry | 0 (0.0%) | 0 (0.0%) |
| Construction & Extraction | 65 (100.0%) | 0 (0.0%) |
| Installation, Maintenance & Repair | 57 (100.0%) | 0 (0.0%) |
| Total (Category) | 122 (100.0%) | 0 (0.0%) |
| Total (Overall) | 558 (46.3%) | 647 (53.7%) |
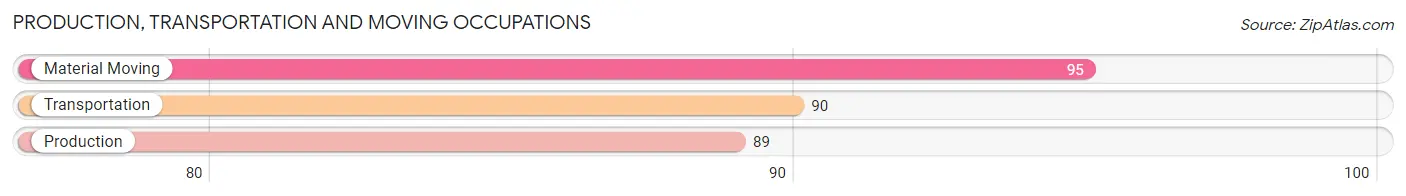
Production, Transportation and Moving Occupations
The most common Production, Transportation and Moving occupations in Pembroke are Material Moving (95 | 7.9%), Transportation (90 | 7.5%), and Production (89 | 7.4%).
Production, Transportation and Moving Occupations by Sex
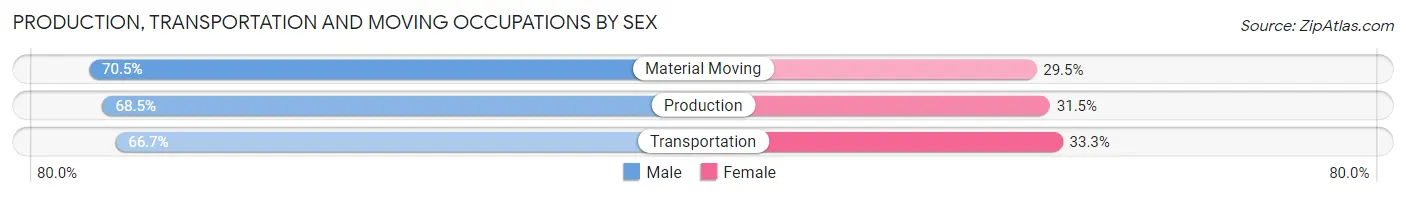
| Occupation | Male | Female |
| Production | 61 (68.5%) | 28 (31.5%) |
| Transportation | 60 (66.7%) | 30 (33.3%) |
| Material Moving | 67 (70.5%) | 28 (29.5%) |
| Total (Category) | 188 (68.6%) | 86 (31.4%) |
| Total (Overall) | 558 (46.3%) | 647 (53.7%) |
Employment Industries by Sex in Pembroke
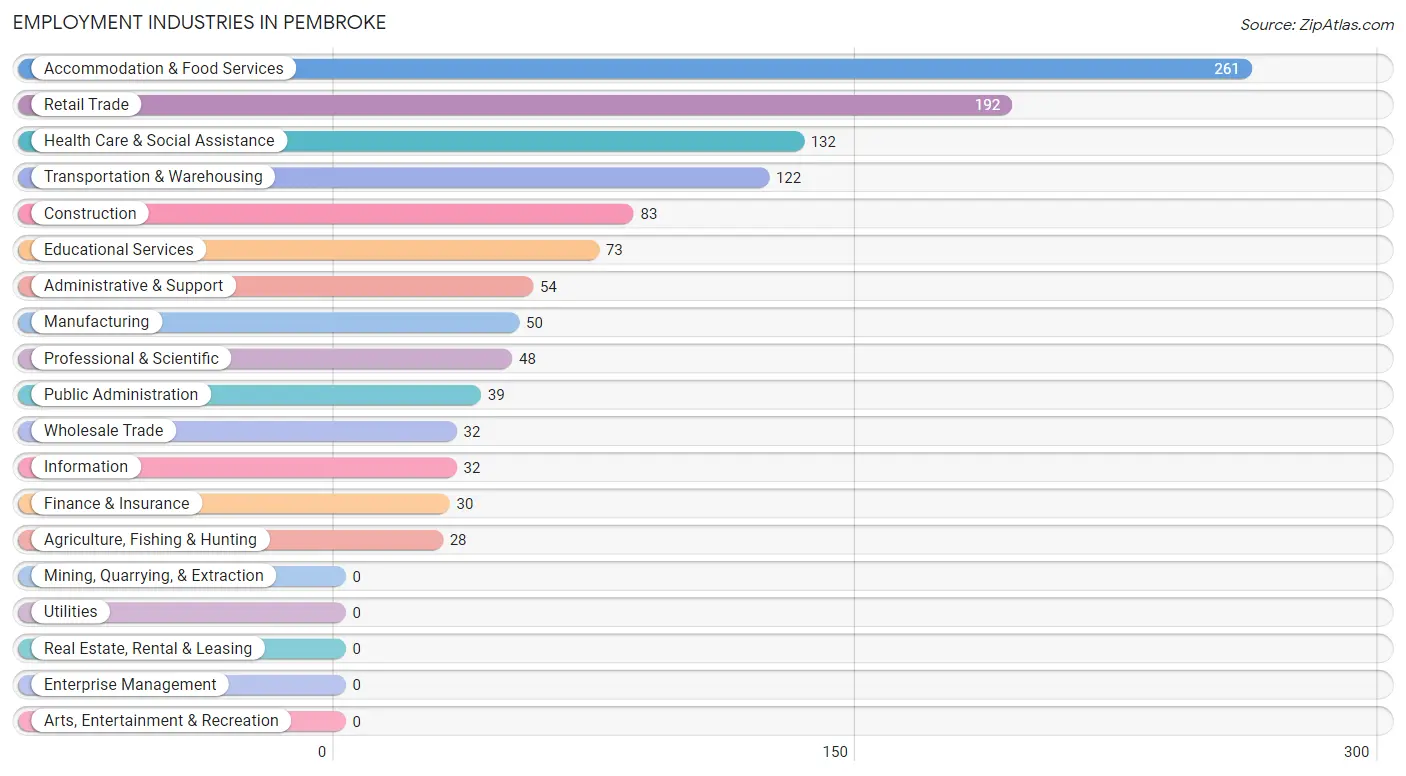
Employment Industries in Pembroke
The major employment industries in Pembroke include Accommodation & Food Services (261 | 21.7%), Retail Trade (192 | 15.9%), Health Care & Social Assistance (132 | 11.0%), Transportation & Warehousing (122 | 10.1%), and Construction (83 | 6.9%).
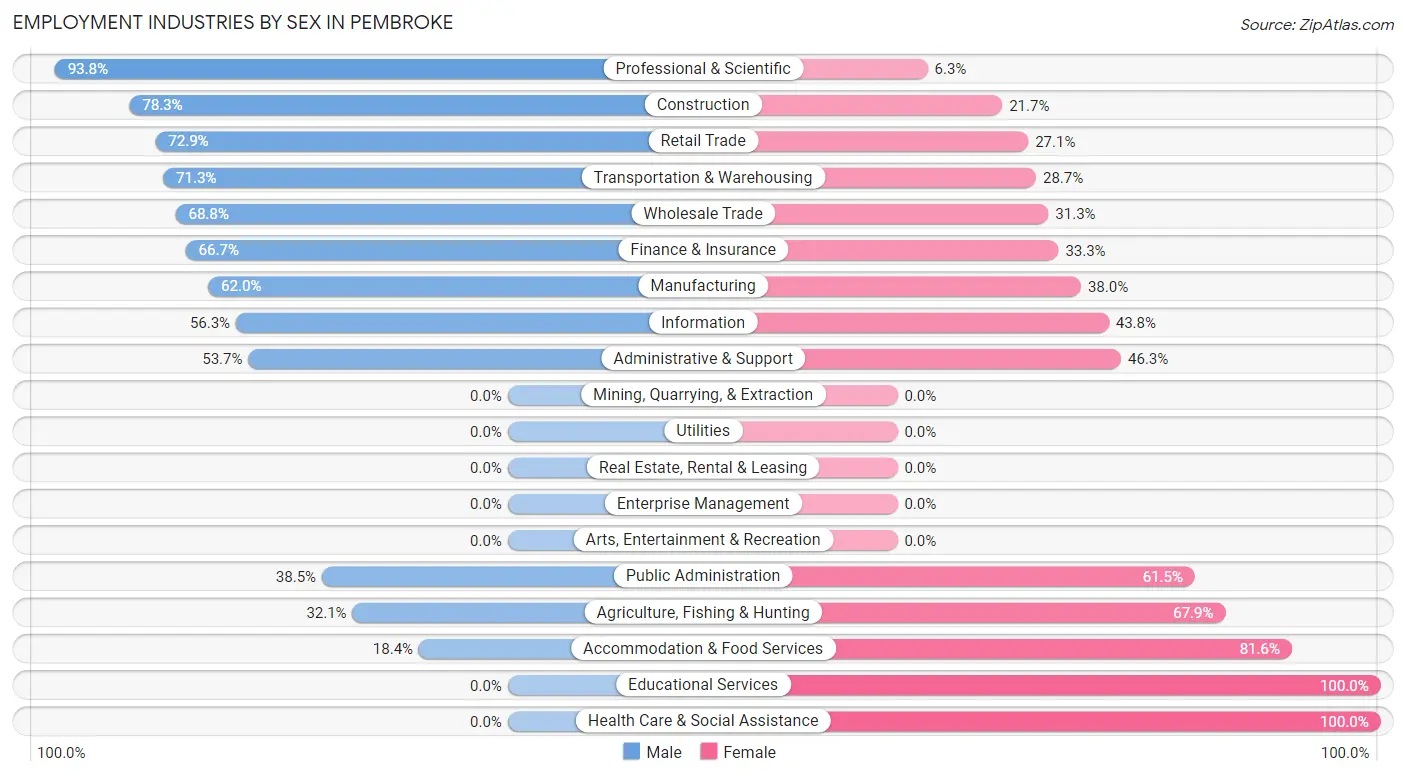
Employment Industries by Sex in Pembroke
The Pembroke industries that see more men than women are Professional & Scientific (93.8%), Construction (78.3%), and Retail Trade (72.9%), whereas the industries that tend to have a higher number of women are Educational Services (100.0%), Health Care & Social Assistance (100.0%), and Accommodation & Food Services (81.6%).
| Industry | Male | Female |
| Agriculture, Fishing & Hunting | 9 (32.1%) | 19 (67.9%) |
| Mining, Quarrying, & Extraction | 0 (0.0%) | 0 (0.0%) |
| Construction | 65 (78.3%) | 18 (21.7%) |
| Manufacturing | 31 (62.0%) | 19 (38.0%) |
| Wholesale Trade | 22 (68.8%) | 10 (31.2%) |
| Retail Trade | 140 (72.9%) | 52 (27.1%) |
| Transportation & Warehousing | 87 (71.3%) | 35 (28.7%) |
| Utilities | 0 (0.0%) | 0 (0.0%) |
| Information | 18 (56.2%) | 14 (43.8%) |
| Finance & Insurance | 20 (66.7%) | 10 (33.3%) |
| Real Estate, Rental & Leasing | 0 (0.0%) | 0 (0.0%) |
| Professional & Scientific | 45 (93.8%) | 3 (6.2%) |
| Enterprise Management | 0 (0.0%) | 0 (0.0%) |
| Administrative & Support | 29 (53.7%) | 25 (46.3%) |
| Educational Services | 0 (0.0%) | 73 (100.0%) |
| Health Care & Social Assistance | 0 (0.0%) | 132 (100.0%) |
| Arts, Entertainment & Recreation | 0 (0.0%) | 0 (0.0%) |
| Accommodation & Food Services | 48 (18.4%) | 213 (81.6%) |
| Public Administration | 15 (38.5%) | 24 (61.5%) |
| Total | 558 (46.3%) | 647 (53.7%) |
Education in Pembroke
School Enrollment in Pembroke
The most common levels of schooling among the 675 students in Pembroke are middle school (200 | 29.6%), high school (160 | 23.7%), and elementary school (139 | 20.6%).
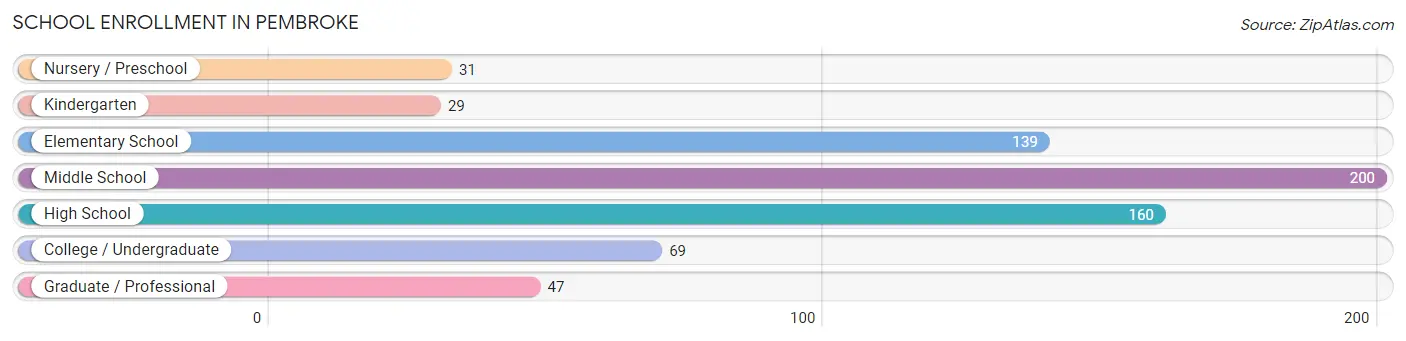
| School Level | # Students | % Students |
| Nursery / Preschool | 31 | 4.6% |
| Kindergarten | 29 | 4.3% |
| Elementary School | 139 | 20.6% |
| Middle School | 200 | 29.6% |
| High School | 160 | 23.7% |
| College / Undergraduate | 69 | 10.2% |
| Graduate / Professional | 47 | 7.0% |
| Total | 675 | 100.0% |
School Enrollment by Age by Funding Source in Pembroke
Out of a total of 675 students who are enrolled in schools in Pembroke, 98 (14.5%) attend a private institution, while the remaining 577 (85.5%) are enrolled in public schools. The age group of 20 to 24 year olds has the highest likelihood of being enrolled in private schools, with 23 (100.0% in the age bracket) enrolled. Conversely, the age group of 18 to 19 year olds has the lowest likelihood of being enrolled in a private school, with 58 (100.0% in the age bracket) attending a public institution.
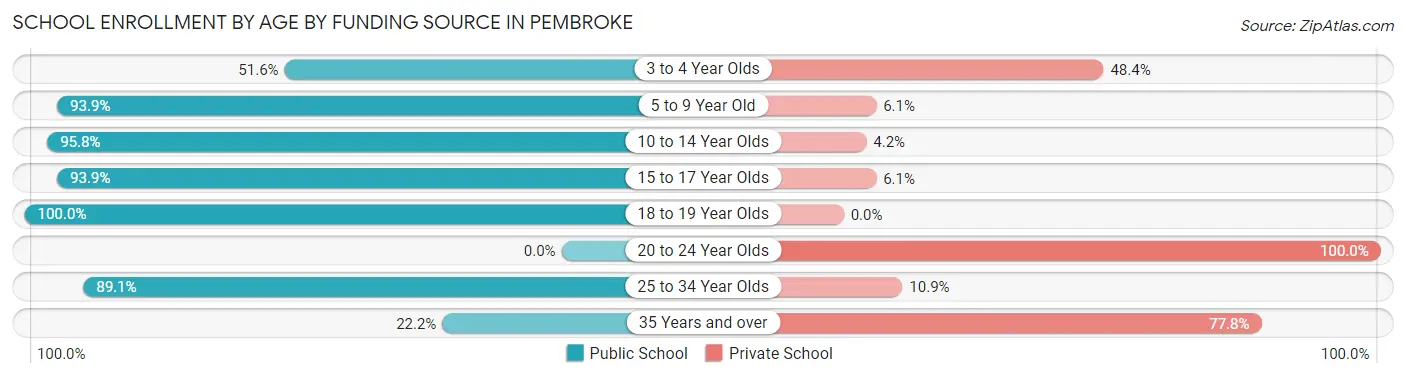
| Age Bracket | Public School | Private School |
| 3 to 4 Year Olds | 16 (51.6%) | 15 (48.4%) |
| 5 to 9 Year Old | 155 (93.9%) | 10 (6.1%) |
| 10 to 14 Year Olds | 159 (95.8%) | 7 (4.2%) |
| 15 to 17 Year Olds | 124 (93.9%) | 8 (6.1%) |
| 18 to 19 Year Olds | 58 (100.0%) | 0 (0.0%) |
| 20 to 24 Year Olds | 0 (0.0%) | 23 (100.0%) |
| 25 to 34 Year Olds | 57 (89.1%) | 7 (10.9%) |
| 35 Years and over | 8 (22.2%) | 28 (77.8%) |
| Total | 577 (85.5%) | 98 (14.5%) |
Educational Attainment by Field of Study in Pembroke
Education (59 | 22.3%), visual & performing arts (45 | 17.0%), arts & humanities (38 | 14.3%), business (36 | 13.6%), and science & technology (30 | 11.3%) are the most common fields of study among 265 individuals in Pembroke who have obtained a bachelor's degree or higher.
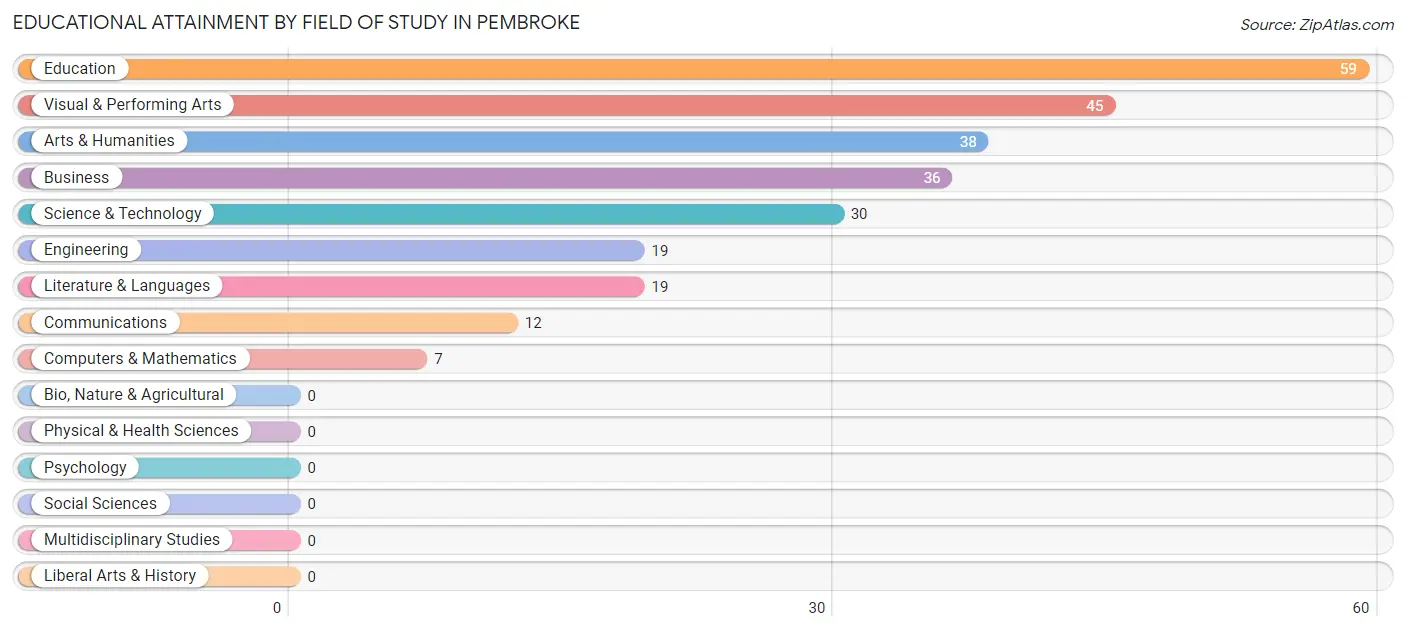
| Field of Study | # Graduates | % Graduates |
| Computers & Mathematics | 7 | 2.6% |
| Bio, Nature & Agricultural | 0 | 0.0% |
| Physical & Health Sciences | 0 | 0.0% |
| Psychology | 0 | 0.0% |
| Social Sciences | 0 | 0.0% |
| Engineering | 19 | 7.2% |
| Multidisciplinary Studies | 0 | 0.0% |
| Science & Technology | 30 | 11.3% |
| Business | 36 | 13.6% |
| Education | 59 | 22.3% |
| Literature & Languages | 19 | 7.2% |
| Liberal Arts & History | 0 | 0.0% |
| Visual & Performing Arts | 45 | 17.0% |
| Communications | 12 | 4.5% |
| Arts & Humanities | 38 | 14.3% |
| Total | 265 | 100.0% |
Transportation & Commute in Pembroke
Vehicle Availability by Sex in Pembroke
The most prevalent vehicle ownership categories in Pembroke are males with 4 vehicles (174, accounting for 25.4%) and females with 4 vehicles (77, making up 30.5%).
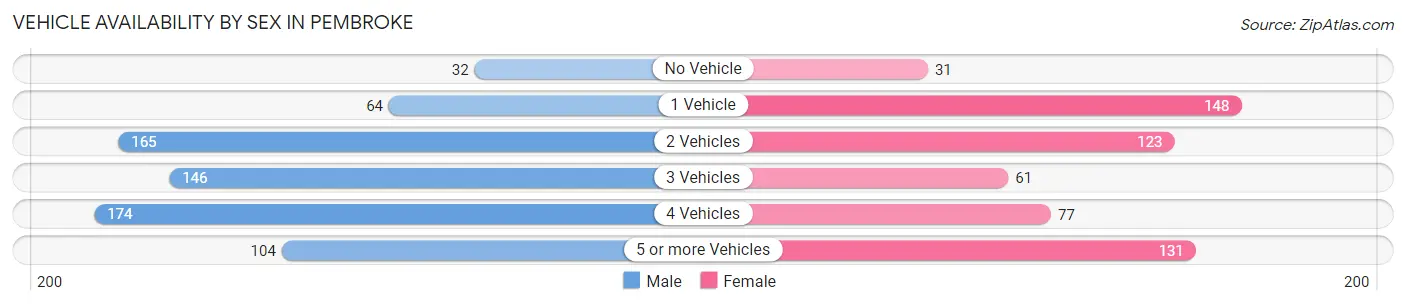
| Vehicles Available | Male | Female |
| No Vehicle | 32 (4.7%) | 31 (5.4%) |
| 1 Vehicle | 64 (9.3%) | 148 (25.9%) |
| 2 Vehicles | 165 (24.1%) | 123 (21.5%) |
| 3 Vehicles | 146 (21.3%) | 61 (10.7%) |
| 4 Vehicles | 174 (25.4%) | 77 (13.5%) |
| 5 or more Vehicles | 104 (15.2%) | 131 (22.9%) |
| Total | 685 (100.0%) | 571 (100.0%) |
Commute Time in Pembroke
The most frequently occuring commute durations in Pembroke are 20 to 24 minutes (195 commuters, 15.5%), 45 to 59 minutes (180 commuters, 14.3%), and 60 to 89 minutes (168 commuters, 13.4%).
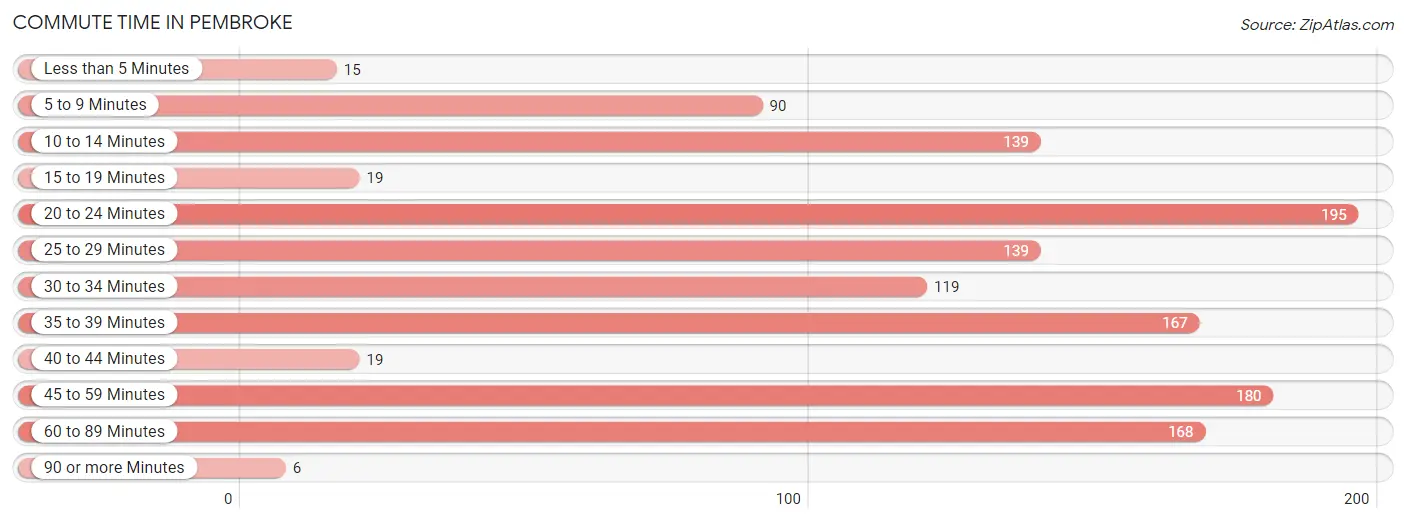
| Commute Time | # Commuters | % Commuters |
| Less than 5 Minutes | 15 | 1.2% |
| 5 to 9 Minutes | 90 | 7.2% |
| 10 to 14 Minutes | 139 | 11.1% |
| 15 to 19 Minutes | 19 | 1.5% |
| 20 to 24 Minutes | 195 | 15.5% |
| 25 to 29 Minutes | 139 | 11.1% |
| 30 to 34 Minutes | 119 | 9.5% |
| 35 to 39 Minutes | 167 | 13.3% |
| 40 to 44 Minutes | 19 | 1.5% |
| 45 to 59 Minutes | 180 | 14.3% |
| 60 to 89 Minutes | 168 | 13.4% |
| 90 or more Minutes | 6 | 0.5% |
Commute Time by Sex in Pembroke
The most common commute times in Pembroke are 20 to 24 minutes (140 commuters, 20.4%) for males and 35 to 39 minutes (146 commuters, 25.6%) for females.
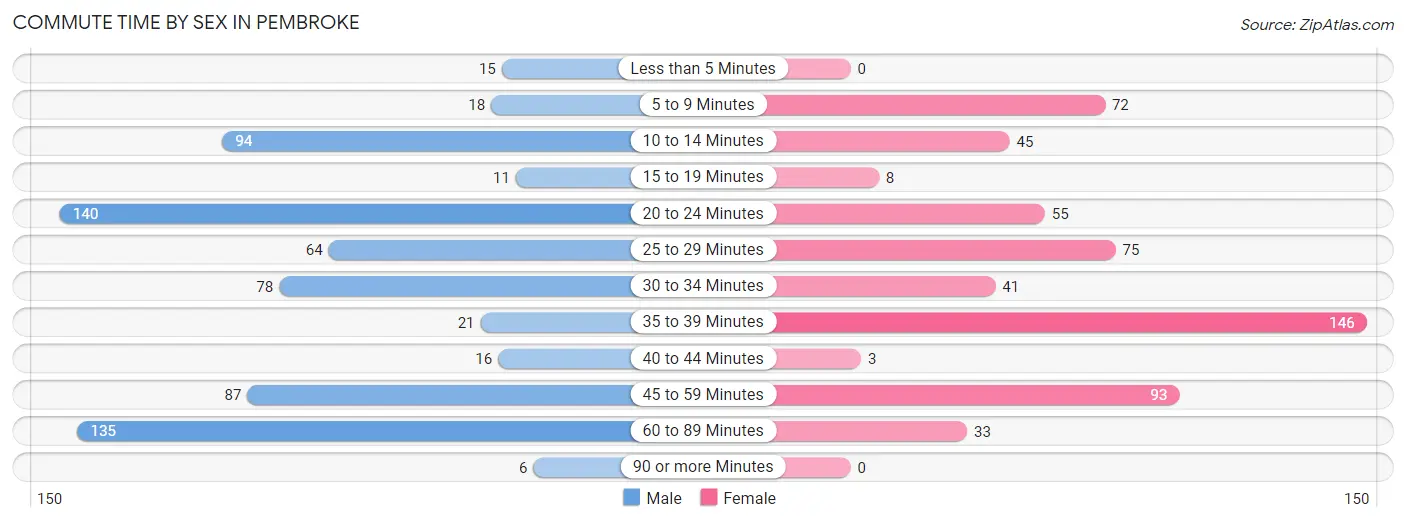
| Commute Time | Male | Female |
| Less than 5 Minutes | 15 (2.2%) | 0 (0.0%) |
| 5 to 9 Minutes | 18 (2.6%) | 72 (12.6%) |
| 10 to 14 Minutes | 94 (13.7%) | 45 (7.9%) |
| 15 to 19 Minutes | 11 (1.6%) | 8 (1.4%) |
| 20 to 24 Minutes | 140 (20.4%) | 55 (9.6%) |
| 25 to 29 Minutes | 64 (9.3%) | 75 (13.1%) |
| 30 to 34 Minutes | 78 (11.4%) | 41 (7.2%) |
| 35 to 39 Minutes | 21 (3.1%) | 146 (25.6%) |
| 40 to 44 Minutes | 16 (2.3%) | 3 (0.5%) |
| 45 to 59 Minutes | 87 (12.7%) | 93 (16.3%) |
| 60 to 89 Minutes | 135 (19.7%) | 33 (5.8%) |
| 90 or more Minutes | 6 (0.9%) | 0 (0.0%) |
Time of Departure to Work by Sex in Pembroke
The most frequent times of departure to work in Pembroke are 5:30 AM to 5:59 AM (116, 16.9%) for males and 12:00 AM to 4:59 AM (74, 13.0%) for females.
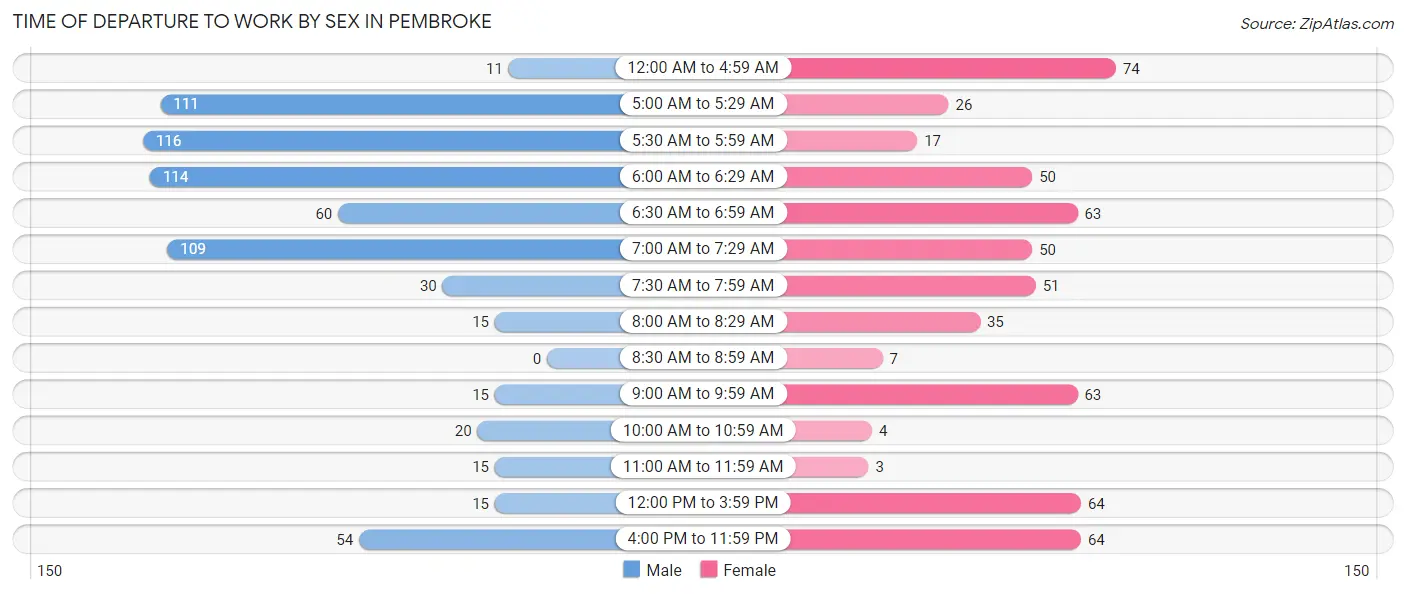
| Time of Departure | Male | Female |
| 12:00 AM to 4:59 AM | 11 (1.6%) | 74 (13.0%) |
| 5:00 AM to 5:29 AM | 111 (16.2%) | 26 (4.5%) |
| 5:30 AM to 5:59 AM | 116 (16.9%) | 17 (3.0%) |
| 6:00 AM to 6:29 AM | 114 (16.6%) | 50 (8.8%) |
| 6:30 AM to 6:59 AM | 60 (8.8%) | 63 (11.0%) |
| 7:00 AM to 7:29 AM | 109 (15.9%) | 50 (8.8%) |
| 7:30 AM to 7:59 AM | 30 (4.4%) | 51 (8.9%) |
| 8:00 AM to 8:29 AM | 15 (2.2%) | 35 (6.1%) |
| 8:30 AM to 8:59 AM | 0 (0.0%) | 7 (1.2%) |
| 9:00 AM to 9:59 AM | 15 (2.2%) | 63 (11.0%) |
| 10:00 AM to 10:59 AM | 20 (2.9%) | 4 (0.7%) |
| 11:00 AM to 11:59 AM | 15 (2.2%) | 3 (0.5%) |
| 12:00 PM to 3:59 PM | 15 (2.2%) | 64 (11.2%) |
| 4:00 PM to 11:59 PM | 54 (7.9%) | 64 (11.2%) |
| Total | 685 (100.0%) | 571 (100.0%) |
Housing Occupancy in Pembroke
Occupancy by Ownership in Pembroke
Of the total 881 dwellings in Pembroke, owner-occupied units account for 434 (49.3%), while renter-occupied units make up 447 (50.7%).
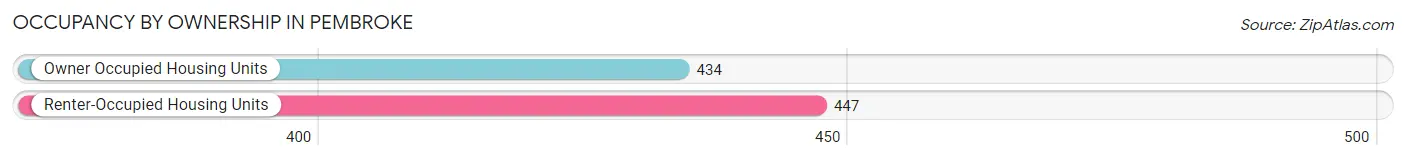
| Occupancy | # Housing Units | % Housing Units |
| Owner Occupied Housing Units | 434 | 49.3% |
| Renter-Occupied Housing Units | 447 | 50.7% |
| Total Occupied Housing Units | 881 | 100.0% |
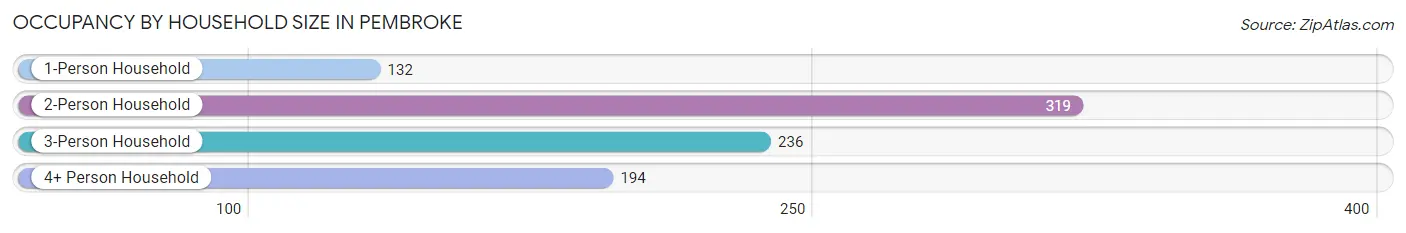
Occupancy by Household Size in Pembroke
| Household Size | # Housing Units | % Housing Units |
| 1-Person Household | 132 | 15.0% |
| 2-Person Household | 319 | 36.2% |
| 3-Person Household | 236 | 26.8% |
| 4+ Person Household | 194 | 22.0% |
| Total Housing Units | 881 | 100.0% |
Occupancy by Ownership by Household Size in Pembroke
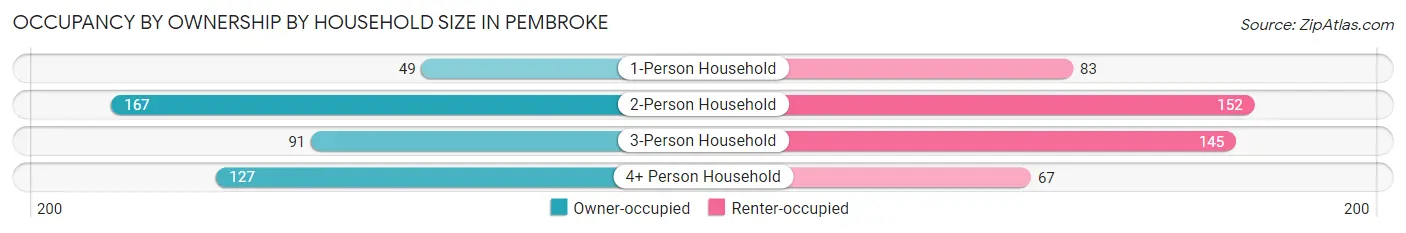
| Household Size | Owner-occupied | Renter-occupied |
| 1-Person Household | 49 (37.1%) | 83 (62.9%) |
| 2-Person Household | 167 (52.3%) | 152 (47.6%) |
| 3-Person Household | 91 (38.6%) | 145 (61.4%) |
| 4+ Person Household | 127 (65.5%) | 67 (34.5%) |
| Total Housing Units | 434 (49.3%) | 447 (50.7%) |
Occupancy by Educational Attainment in Pembroke
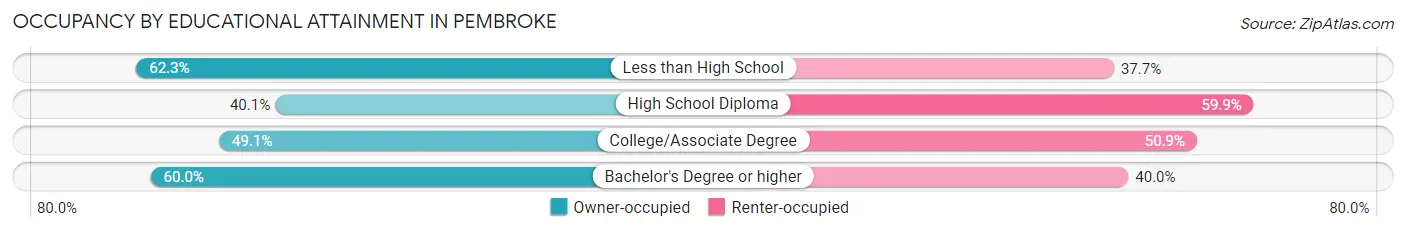
| Household Size | Owner-occupied | Renter-occupied |
| Less than High School | 71 (62.3%) | 43 (37.7%) |
| High School Diploma | 120 (40.1%) | 179 (59.9%) |
| College/Associate Degree | 171 (49.1%) | 177 (50.9%) |
| Bachelor's Degree or higher | 72 (60.0%) | 48 (40.0%) |
Occupancy by Age of Householder in Pembroke
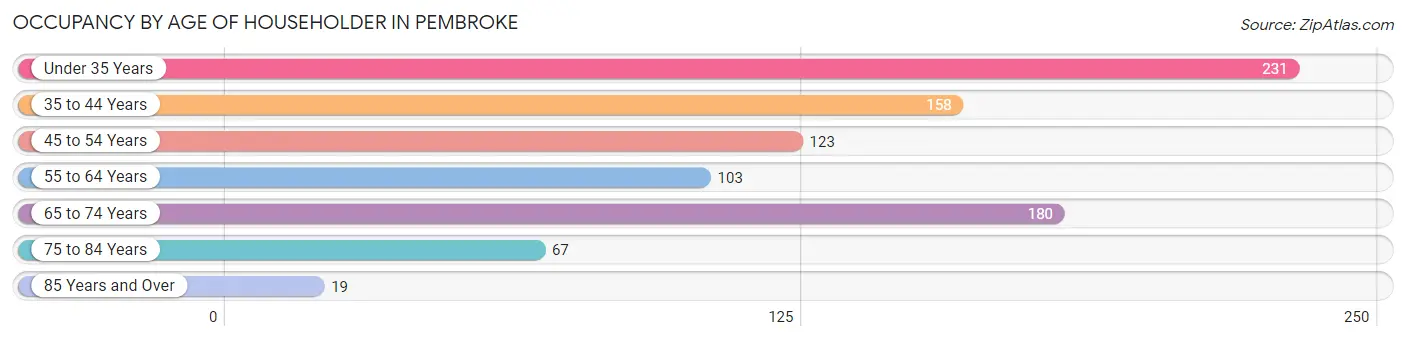
| Age Bracket | # Households | % Households |
| Under 35 Years | 231 | 26.2% |
| 35 to 44 Years | 158 | 17.9% |
| 45 to 54 Years | 123 | 14.0% |
| 55 to 64 Years | 103 | 11.7% |
| 65 to 74 Years | 180 | 20.4% |
| 75 to 84 Years | 67 | 7.6% |
| 85 Years and Over | 19 | 2.2% |
| Total | 881 | 100.0% |
Housing Finances in Pembroke
Median Income by Occupancy in Pembroke
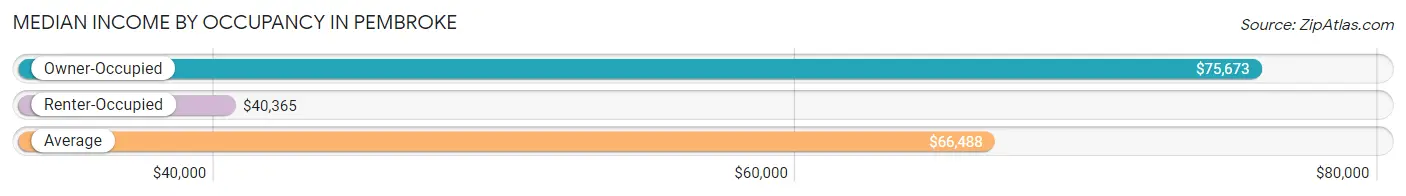
| Occupancy Type | # Households | Median Income |
| Owner-Occupied | 434 (49.3%) | $75,673 |
| Renter-Occupied | 447 (50.7%) | $40,365 |
| Average | 881 (100.0%) | $66,488 |
Occupancy by Householder Income Bracket in Pembroke
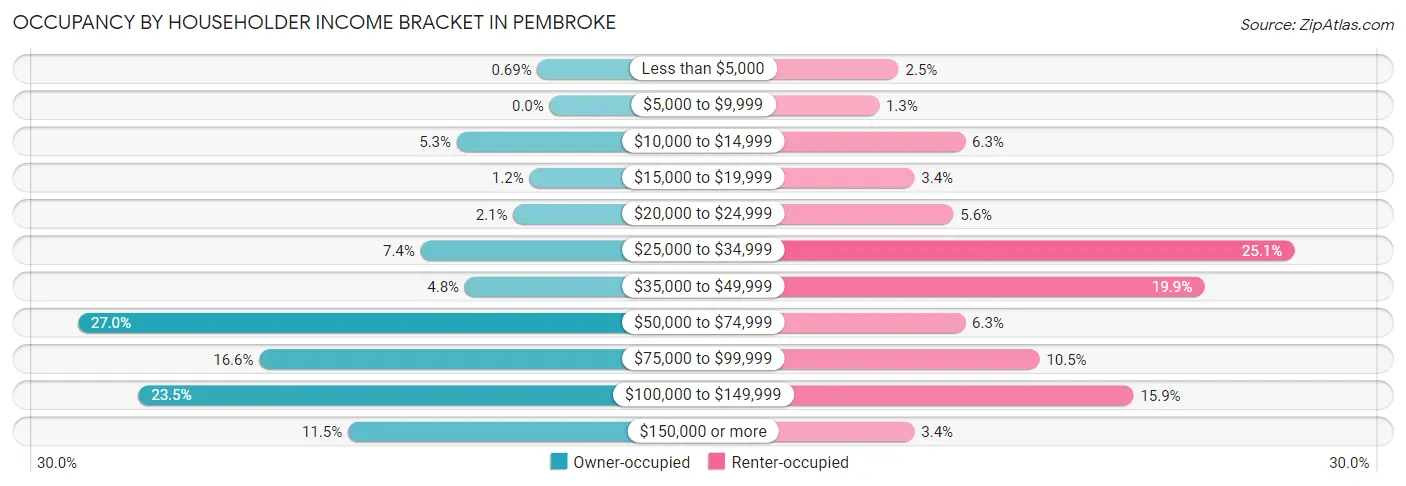
| Income Bracket | Owner-occupied | Renter-occupied |
| Less than $5,000 | 3 (0.7%) | 11 (2.5%) |
| $5,000 to $9,999 | 0 (0.0%) | 6 (1.3%) |
| $10,000 to $14,999 | 23 (5.3%) | 28 (6.3%) |
| $15,000 to $19,999 | 5 (1.1%) | 15 (3.4%) |
| $20,000 to $24,999 | 9 (2.1%) | 25 (5.6%) |
| $25,000 to $34,999 | 32 (7.4%) | 112 (25.1%) |
| $35,000 to $49,999 | 21 (4.8%) | 89 (19.9%) |
| $50,000 to $74,999 | 117 (27.0%) | 28 (6.3%) |
| $75,000 to $99,999 | 72 (16.6%) | 47 (10.5%) |
| $100,000 to $149,999 | 102 (23.5%) | 71 (15.9%) |
| $150,000 or more | 50 (11.5%) | 15 (3.4%) |
| Total | 434 (100.0%) | 447 (100.0%) |
Monthly Housing Cost Tiers in Pembroke
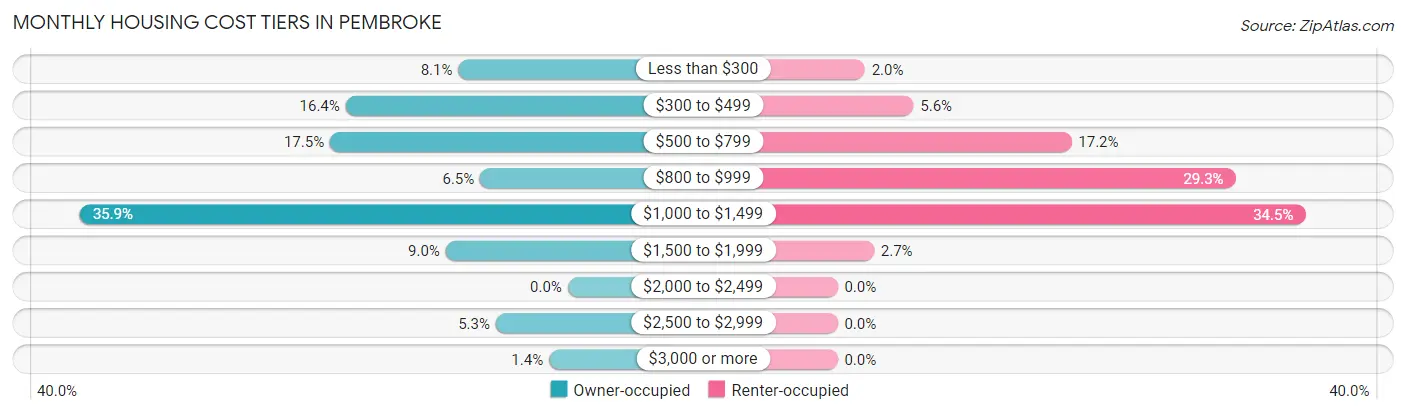
| Monthly Cost | Owner-occupied | Renter-occupied |
| Less than $300 | 35 (8.1%) | 9 (2.0%) |
| $300 to $499 | 71 (16.4%) | 25 (5.6%) |
| $500 to $799 | 76 (17.5%) | 77 (17.2%) |
| $800 to $999 | 28 (6.5%) | 131 (29.3%) |
| $1,000 to $1,499 | 156 (35.9%) | 154 (34.4%) |
| $1,500 to $1,999 | 39 (9.0%) | 12 (2.7%) |
| $2,000 to $2,499 | 0 (0.0%) | 0 (0.0%) |
| $2,500 to $2,999 | 23 (5.3%) | 0 (0.0%) |
| $3,000 or more | 6 (1.4%) | 0 (0.0%) |
| Total | 434 (100.0%) | 447 (100.0%) |
Physical Housing Characteristics in Pembroke
Housing Structures in Pembroke
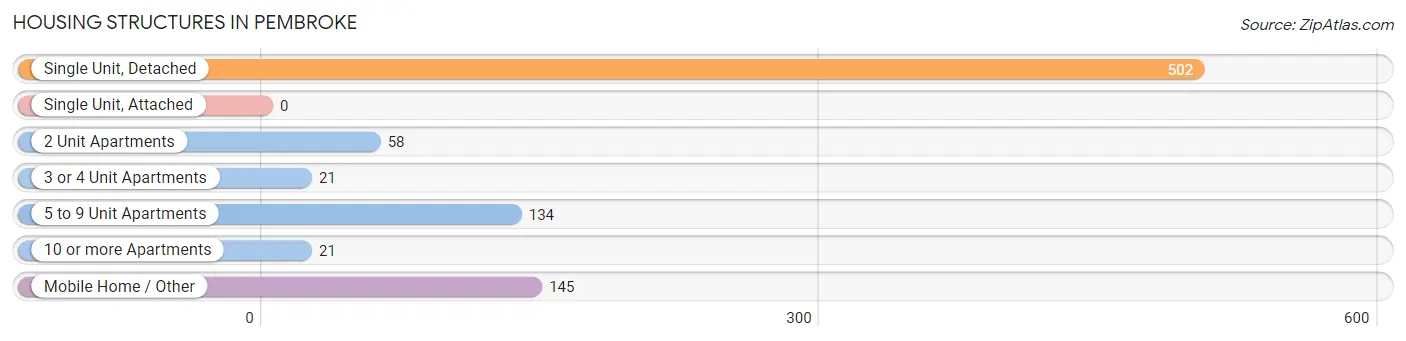
| Structure Type | # Housing Units | % Housing Units |
| Single Unit, Detached | 502 | 57.0% |
| Single Unit, Attached | 0 | 0.0% |
| 2 Unit Apartments | 58 | 6.6% |
| 3 or 4 Unit Apartments | 21 | 2.4% |
| 5 to 9 Unit Apartments | 134 | 15.2% |
| 10 or more Apartments | 21 | 2.4% |
| Mobile Home / Other | 145 | 16.5% |
| Total | 881 | 100.0% |
Housing Structures by Occupancy in Pembroke
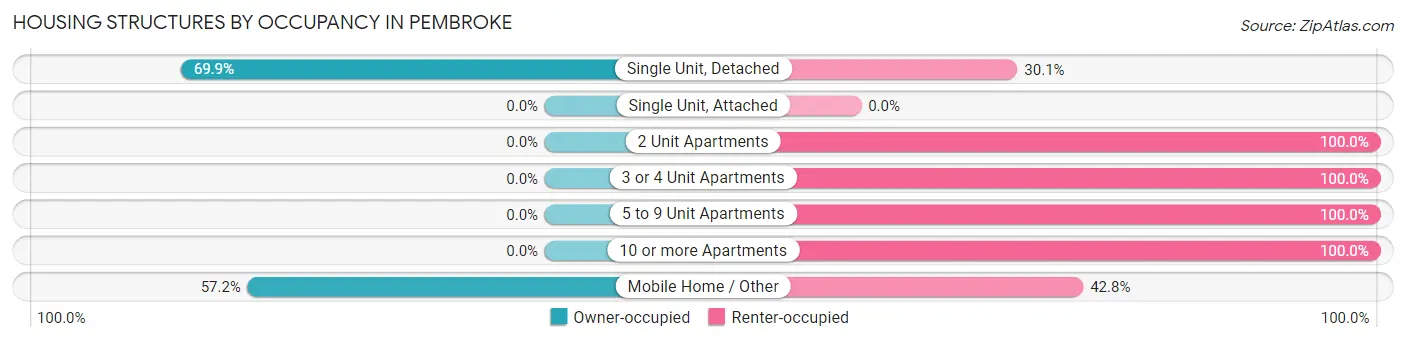
| Structure Type | Owner-occupied | Renter-occupied |
| Single Unit, Detached | 351 (69.9%) | 151 (30.1%) |
| Single Unit, Attached | 0 (0.0%) | 0 (0.0%) |
| 2 Unit Apartments | 0 (0.0%) | 58 (100.0%) |
| 3 or 4 Unit Apartments | 0 (0.0%) | 21 (100.0%) |
| 5 to 9 Unit Apartments | 0 (0.0%) | 134 (100.0%) |
| 10 or more Apartments | 0 (0.0%) | 21 (100.0%) |
| Mobile Home / Other | 83 (57.2%) | 62 (42.8%) |
| Total | 434 (49.3%) | 447 (50.7%) |
Housing Structures by Number of Rooms in Pembroke
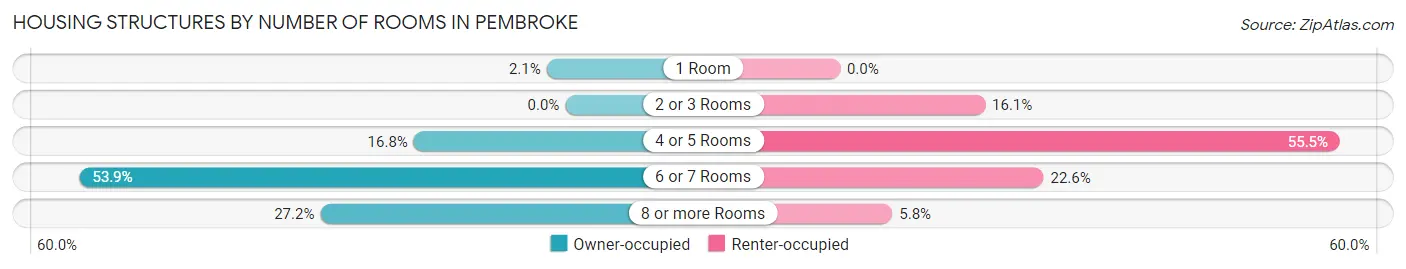
| Number of Rooms | Owner-occupied | Renter-occupied |
| 1 Room | 9 (2.1%) | 0 (0.0%) |
| 2 or 3 Rooms | 0 (0.0%) | 72 (16.1%) |
| 4 or 5 Rooms | 73 (16.8%) | 248 (55.5%) |
| 6 or 7 Rooms | 234 (53.9%) | 101 (22.6%) |
| 8 or more Rooms | 118 (27.2%) | 26 (5.8%) |
| Total | 434 (100.0%) | 447 (100.0%) |
Housing Structure by Heating Type in Pembroke
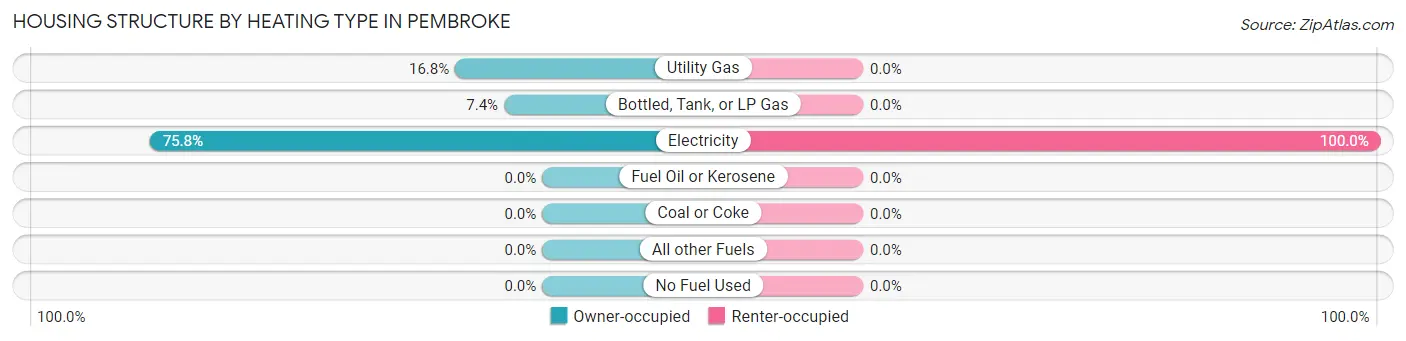
| Heating Type | Owner-occupied | Renter-occupied |
| Utility Gas | 73 (16.8%) | 0 (0.0%) |
| Bottled, Tank, or LP Gas | 32 (7.4%) | 0 (0.0%) |
| Electricity | 329 (75.8%) | 447 (100.0%) |
| Fuel Oil or Kerosene | 0 (0.0%) | 0 (0.0%) |
| Coal or Coke | 0 (0.0%) | 0 (0.0%) |
| All other Fuels | 0 (0.0%) | 0 (0.0%) |
| No Fuel Used | 0 (0.0%) | 0 (0.0%) |
| Total | 434 (100.0%) | 447 (100.0%) |
Household Vehicle Usage in Pembroke
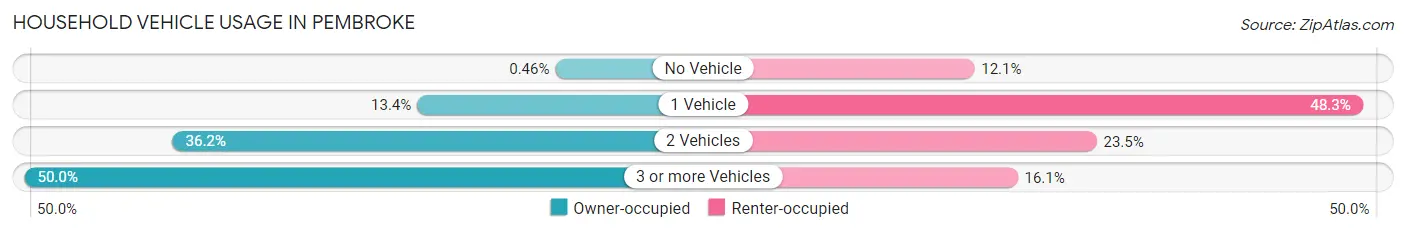
| Vehicles per Household | Owner-occupied | Renter-occupied |
| No Vehicle | 2 (0.5%) | 54 (12.1%) |
| 1 Vehicle | 58 (13.4%) | 216 (48.3%) |
| 2 Vehicles | 157 (36.2%) | 105 (23.5%) |
| 3 or more Vehicles | 217 (50.0%) | 72 (16.1%) |
| Total | 434 (100.0%) | 447 (100.0%) |
Real Estate & Mortgages in Pembroke
Real Estate and Mortgage Overview in Pembroke
| Characteristic | Without Mortgage | With Mortgage |
| Housing Units | 191 | 243 |
| Median Property Value | $158,400 | $172,900 |
| Median Household Income | $68,882 | $39 |
| Monthly Housing Costs | $476 | $6 |
| Real Estate Taxes | - | - |
Property Value by Mortgage Status in Pembroke
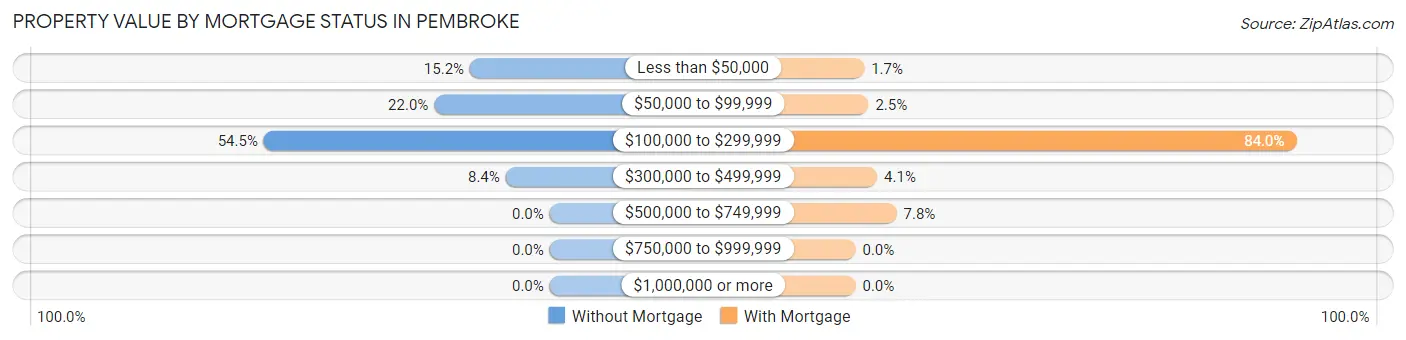
| Property Value | Without Mortgage | With Mortgage |
| Less than $50,000 | 29 (15.2%) | 4 (1.7%) |
| $50,000 to $99,999 | 42 (22.0%) | 6 (2.5%) |
| $100,000 to $299,999 | 104 (54.4%) | 204 (84.0%) |
| $300,000 to $499,999 | 16 (8.4%) | 10 (4.1%) |
| $500,000 to $749,999 | 0 (0.0%) | 19 (7.8%) |
| $750,000 to $999,999 | 0 (0.0%) | 0 (0.0%) |
| $1,000,000 or more | 0 (0.0%) | 0 (0.0%) |
| Total | 191 (100.0%) | 243 (100.0%) |
Household Income by Mortgage Status in Pembroke
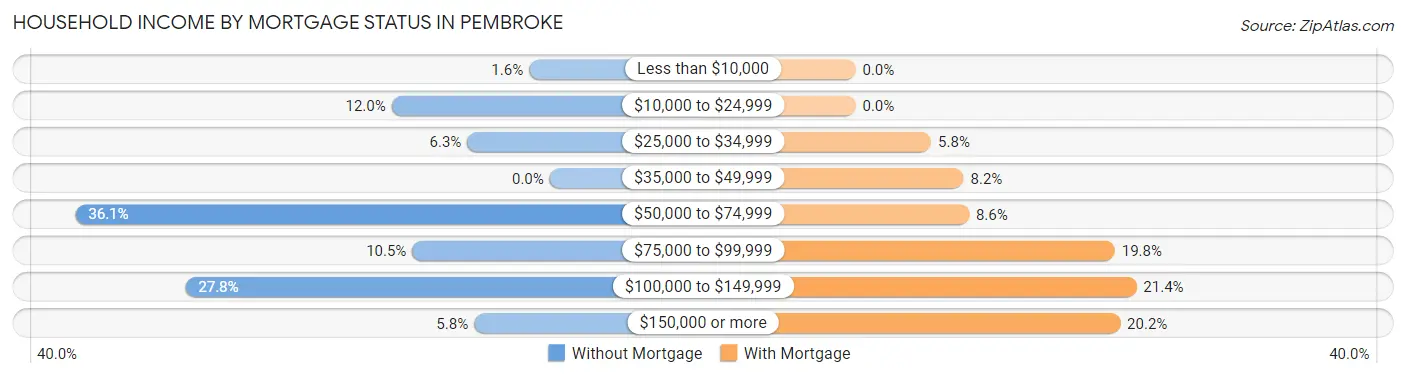
| Household Income | Without Mortgage | With Mortgage |
| Less than $10,000 | 3 (1.6%) | 0 (0.0%) |
| $10,000 to $24,999 | 23 (12.0%) | 0 (0.0%) |
| $25,000 to $34,999 | 12 (6.3%) | 14 (5.8%) |
| $35,000 to $49,999 | 0 (0.0%) | 20 (8.2%) |
| $50,000 to $74,999 | 69 (36.1%) | 21 (8.6%) |
| $75,000 to $99,999 | 20 (10.5%) | 48 (19.8%) |
| $100,000 to $149,999 | 53 (27.8%) | 52 (21.4%) |
| $150,000 or more | 11 (5.8%) | 49 (20.2%) |
| Total | 191 (100.0%) | 243 (100.0%) |
Property Value to Household Income Ratio in Pembroke
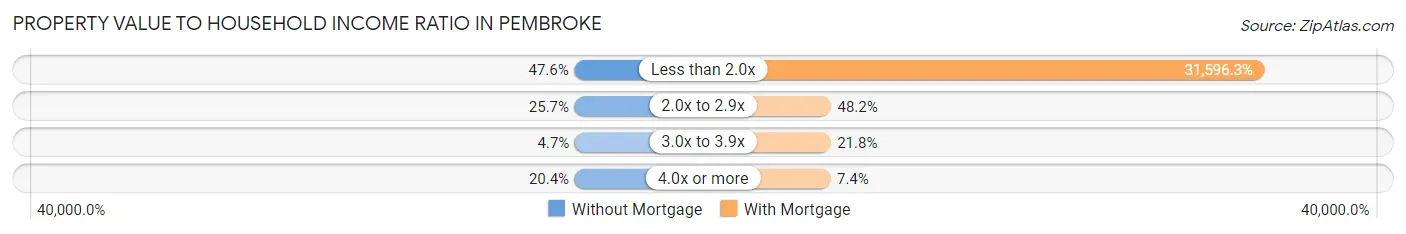
| Value-to-Income Ratio | Without Mortgage | With Mortgage |
| Less than 2.0x | 91 (47.6%) | 76,779 (31,596.3%) |
| 2.0x to 2.9x | 49 (25.7%) | 117 (48.1%) |
| 3.0x to 3.9x | 9 (4.7%) | 53 (21.8%) |
| 4.0x or more | 39 (20.4%) | 18 (7.4%) |
| Total | 191 (100.0%) | 243 (100.0%) |
Real Estate Taxes by Mortgage Status in Pembroke
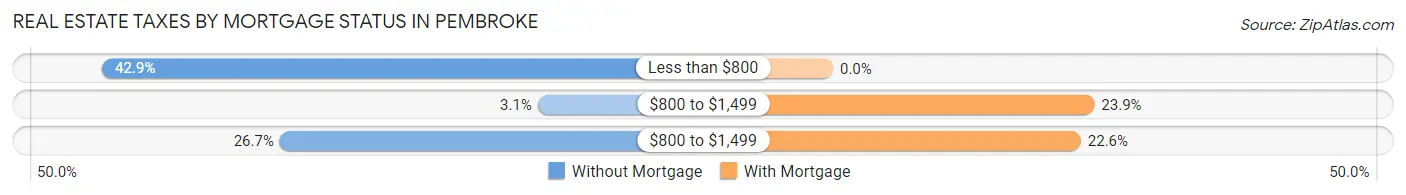
| Property Taxes | Without Mortgage | With Mortgage |
| Less than $800 | 82 (42.9%) | 0 (0.0%) |
| $800 to $1,499 | 6 (3.1%) | 58 (23.9%) |
| $800 to $1,499 | 51 (26.7%) | 55 (22.6%) |
| Total | 191 (100.0%) | 243 (100.0%) |
Health & Disability in Pembroke
Health Insurance Coverage by Age in Pembroke
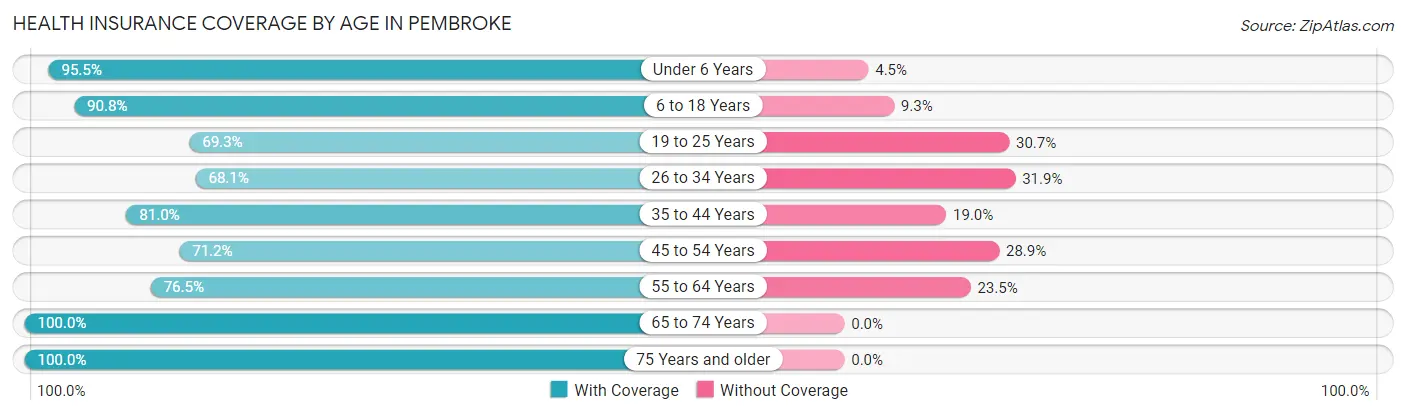
| Age Bracket | With Coverage | Without Coverage |
| Under 6 Years | 171 (95.5%) | 8 (4.5%) |
| 6 to 18 Years | 461 (90.7%) | 47 (9.2%) |
| 19 to 25 Years | 300 (69.3%) | 133 (30.7%) |
| 26 to 34 Years | 203 (68.1%) | 95 (31.9%) |
| 35 to 44 Years | 209 (81.0%) | 49 (19.0%) |
| 45 to 54 Years | 111 (71.2%) | 45 (28.8%) |
| 55 to 64 Years | 143 (76.5%) | 44 (23.5%) |
| 65 to 74 Years | 266 (100.0%) | 0 (0.0%) |
| 75 Years and older | 119 (100.0%) | 0 (0.0%) |
| Total | 1,983 (82.5%) | 421 (17.5%) |
Health Insurance Coverage by Citizenship Status in Pembroke
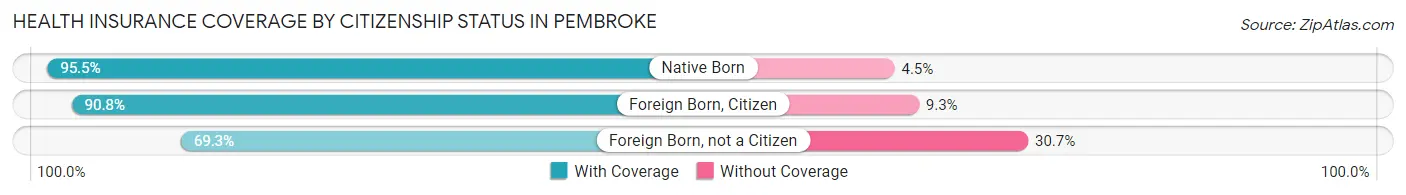
| Citizenship Status | With Coverage | Without Coverage |
| Native Born | 171 (95.5%) | 8 (4.5%) |
| Foreign Born, Citizen | 461 (90.7%) | 47 (9.2%) |
| Foreign Born, not a Citizen | 300 (69.3%) | 133 (30.7%) |
Health Insurance Coverage by Household Income in Pembroke
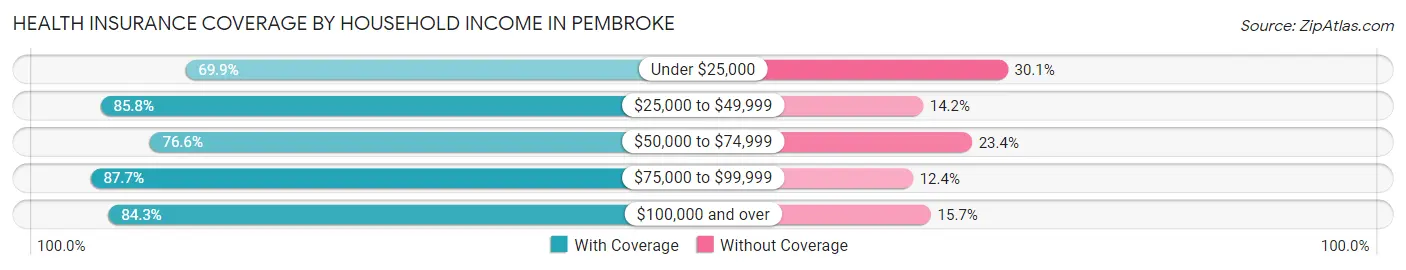
| Household Income | With Coverage | Without Coverage |
| Under $25,000 | 130 (69.9%) | 56 (30.1%) |
| $25,000 to $49,999 | 518 (85.8%) | 86 (14.2%) |
| $50,000 to $74,999 | 337 (76.6%) | 103 (23.4%) |
| $75,000 to $99,999 | 220 (87.6%) | 31 (12.3%) |
| $100,000 and over | 778 (84.3%) | 145 (15.7%) |
Public vs Private Health Insurance Coverage by Age in Pembroke
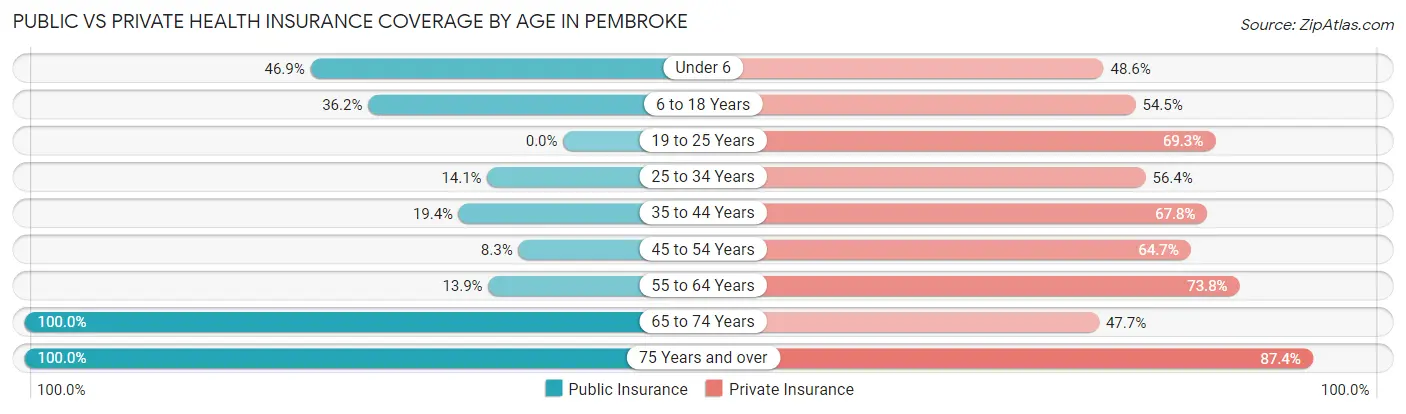
| Age Bracket | Public Insurance | Private Insurance |
| Under 6 | 84 (46.9%) | 87 (48.6%) |
| 6 to 18 Years | 184 (36.2%) | 277 (54.5%) |
| 19 to 25 Years | 0 (0.0%) | 300 (69.3%) |
| 25 to 34 Years | 42 (14.1%) | 168 (56.4%) |
| 35 to 44 Years | 50 (19.4%) | 175 (67.8%) |
| 45 to 54 Years | 13 (8.3%) | 101 (64.7%) |
| 55 to 64 Years | 26 (13.9%) | 138 (73.8%) |
| 65 to 74 Years | 266 (100.0%) | 127 (47.7%) |
| 75 Years and over | 119 (100.0%) | 104 (87.4%) |
| Total | 784 (32.6%) | 1,477 (61.4%) |
Disability Status by Sex by Age in Pembroke
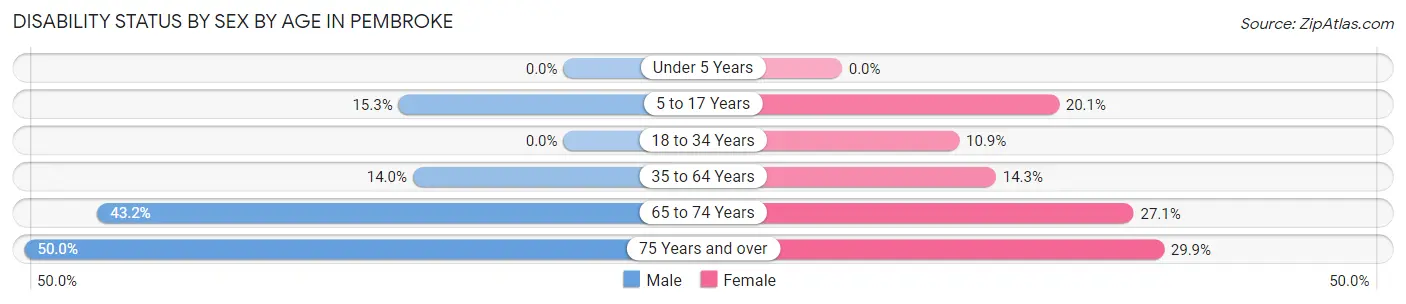
| Age Bracket | Male | Female |
| Under 5 Years | 0 (0.0%) | 0 (0.0%) |
| 5 to 17 Years | 28 (15.3%) | 58 (20.1%) |
| 18 to 34 Years | 0 (0.0%) | 43 (10.9%) |
| 35 to 64 Years | 38 (14.0%) | 47 (14.3%) |
| 65 to 74 Years | 32 (43.2%) | 52 (27.1%) |
| 75 Years and over | 16 (50.0%) | 26 (29.9%) |
Disability Class by Sex by Age in Pembroke
Disability Class: Hearing Difficulty
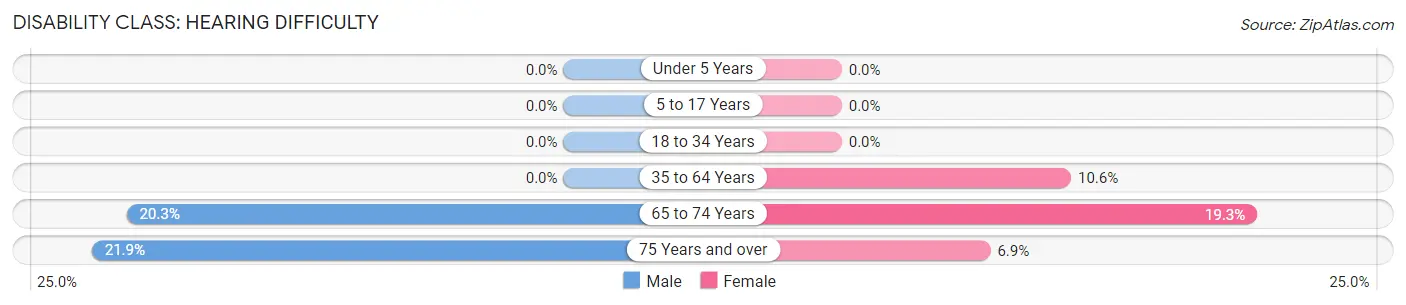
| Age Bracket | Male | Female |
| Under 5 Years | 0 (0.0%) | 0 (0.0%) |
| 5 to 17 Years | 0 (0.0%) | 0 (0.0%) |
| 18 to 34 Years | 0 (0.0%) | 0 (0.0%) |
| 35 to 64 Years | 0 (0.0%) | 35 (10.6%) |
| 65 to 74 Years | 15 (20.3%) | 37 (19.3%) |
| 75 Years and over | 7 (21.9%) | 6 (6.9%) |
Disability Class: Vision Difficulty
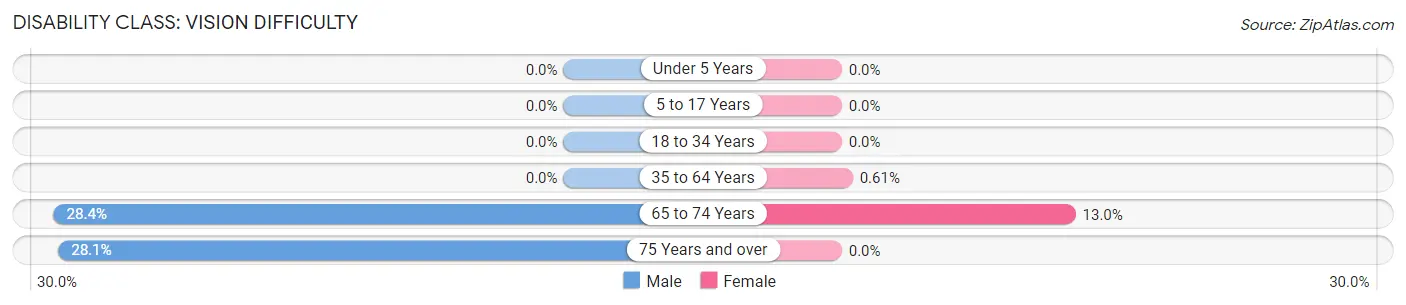
| Age Bracket | Male | Female |
| Under 5 Years | 0 (0.0%) | 0 (0.0%) |
| 5 to 17 Years | 0 (0.0%) | 0 (0.0%) |
| 18 to 34 Years | 0 (0.0%) | 0 (0.0%) |
| 35 to 64 Years | 0 (0.0%) | 2 (0.6%) |
| 65 to 74 Years | 21 (28.4%) | 25 (13.0%) |
| 75 Years and over | 9 (28.1%) | 0 (0.0%) |
Disability Class: Cognitive Difficulty
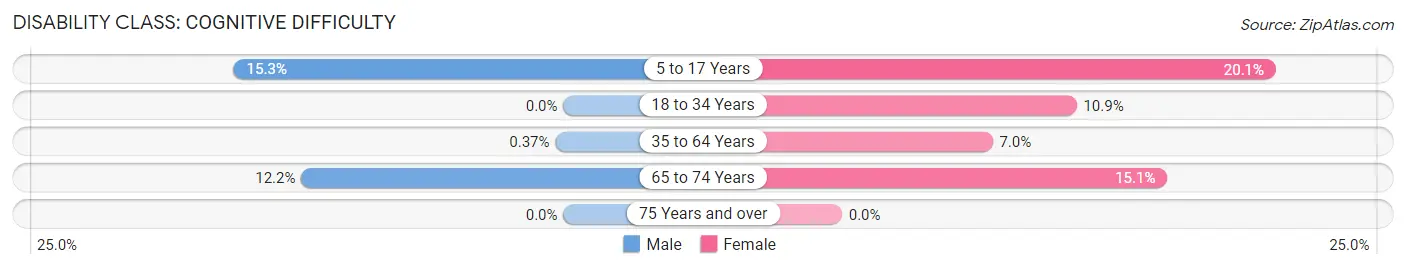
| Age Bracket | Male | Female |
| 5 to 17 Years | 28 (15.3%) | 58 (20.1%) |
| 18 to 34 Years | 0 (0.0%) | 43 (10.9%) |
| 35 to 64 Years | 1 (0.4%) | 23 (7.0%) |
| 65 to 74 Years | 9 (12.2%) | 29 (15.1%) |
| 75 Years and over | 0 (0.0%) | 0 (0.0%) |
Disability Class: Ambulatory Difficulty
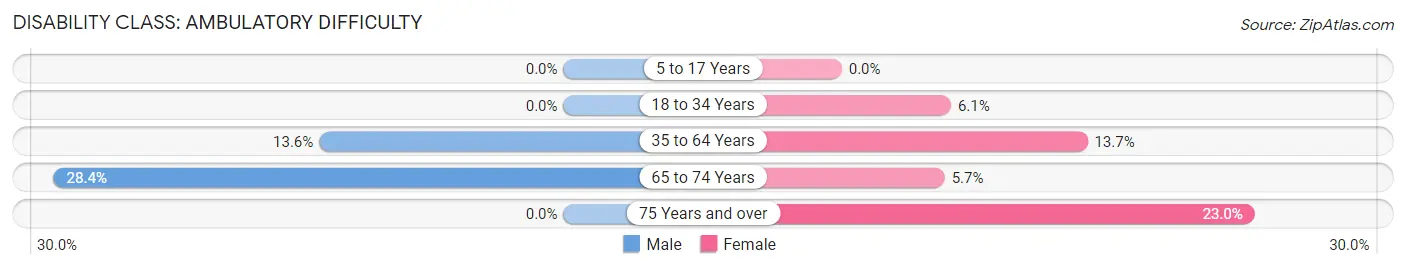
| Age Bracket | Male | Female |
| 5 to 17 Years | 0 (0.0%) | 0 (0.0%) |
| 18 to 34 Years | 0 (0.0%) | 24 (6.1%) |
| 35 to 64 Years | 37 (13.6%) | 45 (13.7%) |
| 65 to 74 Years | 21 (28.4%) | 11 (5.7%) |
| 75 Years and over | 0 (0.0%) | 20 (23.0%) |
Disability Class: Self-Care Difficulty
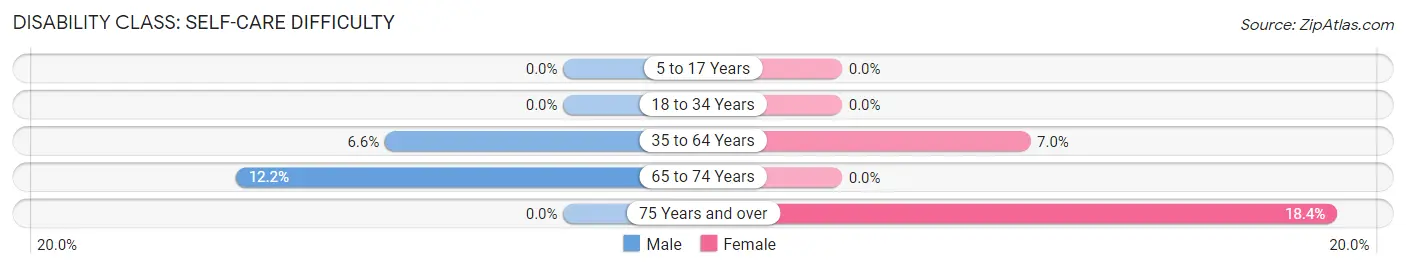
| Age Bracket | Male | Female |
| 5 to 17 Years | 0 (0.0%) | 0 (0.0%) |
| 18 to 34 Years | 0 (0.0%) | 0 (0.0%) |
| 35 to 64 Years | 18 (6.6%) | 23 (7.0%) |
| 65 to 74 Years | 9 (12.2%) | 0 (0.0%) |
| 75 Years and over | 0 (0.0%) | 16 (18.4%) |
Technology Access in Pembroke
Computing Device Access in Pembroke
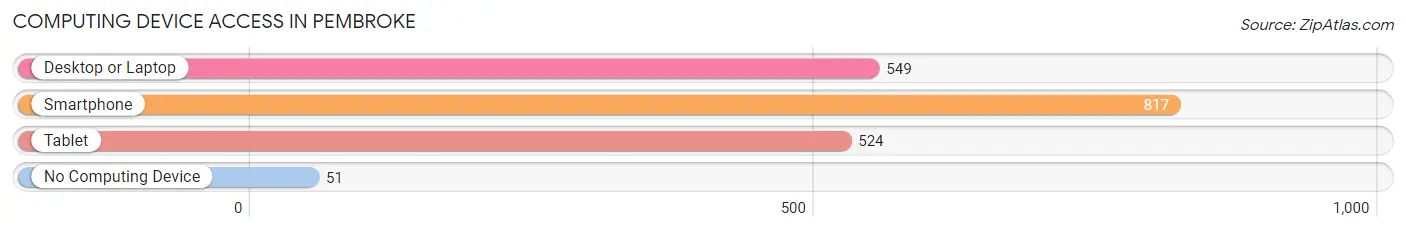
| Device Type | # Households | % Households |
| Desktop or Laptop | 549 | 62.3% |
| Smartphone | 817 | 92.7% |
| Tablet | 524 | 59.5% |
| No Computing Device | 51 | 5.8% |
| Total | 881 | 100.0% |
Internet Access in Pembroke
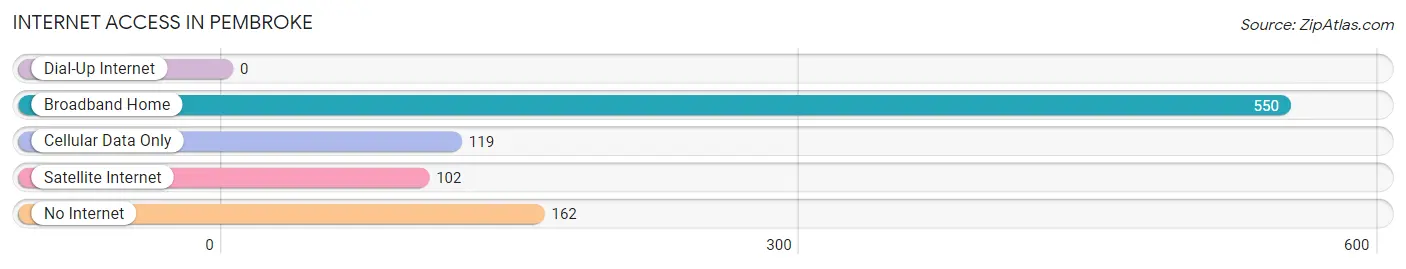
| Internet Type | # Households | % Households |
| Dial-Up Internet | 0 | 0.0% |
| Broadband Home | 550 | 62.4% |
| Cellular Data Only | 119 | 13.5% |
| Satellite Internet | 102 | 11.6% |
| No Internet | 162 | 18.4% |
| Total | 881 | 100.0% |
Pembroke Summary
Pembroke, Georgia is a small city located in Bryan County, Georgia, United States. It is situated on the Ogeechee River, approximately 30 miles west of Savannah. The city has a population of 2,945 as of the 2010 census, making it the smallest city in the county.
History
Pembroke was founded in 1872 by the Georgia General Assembly as a railroad town. The town was named after Pembroke, Wales, and was incorporated in 1874. The town was originally located on the Savannah and Albany Railroad, which was later acquired by the Central of Georgia Railway. The town was a major shipping point for cotton, timber, and naval stores.
In the late 19th century, Pembroke was a thriving community with a population of over 1,000. The town had several stores, a hotel, a bank, a post office, and a school. The town also had a cotton gin, a sawmill, and a grist mill.
In the early 20th century, the town began to decline as the railroad industry declined. The town's population decreased to just over 500 by the 1950s. In the late 20th century, the town began to experience a resurgence as the economy of the region improved.
Geography
Pembroke is located in southeastern Georgia at 31°55'N 81°30'W (31.914, -81.500). The city is situated on the Ogeechee River, approximately 30 miles west of Savannah. The city has a total area of 2.2 square miles, all of which is land.
The city is located in the Coastal Plain region of Georgia, which is characterized by flat terrain and sandy soils. The climate is humid subtropical, with hot, humid summers and mild winters.
Economy
The economy of Pembroke is largely based on agriculture and timber. The city is home to several farms, which produce a variety of crops, including cotton, corn, soybeans, and peanuts. The city is also home to several timber companies, which harvest timber from the surrounding forests.
The city is also home to several small businesses, including restaurants, retail stores, and service providers. The city is also home to a branch of the Bryan County Board of Education, which provides educational services to the city's residents.
Demographics
As of the 2010 census, Pembroke had a population of 2,945. The racial makeup of the city was 65.3% White, 28.2% African American, 0.3% Native American, 0.7% Asian, 0.1% Pacific Islander, 4.2% from other races, and 1.4% from two or more races. Hispanic or Latino of any race were 6.7% of the population.
The median income for a household in the city was $30,938, and the median income for a family was $37,813. The per capita income for the city was $15,945. About 17.2% of families and 20.3% of the population were below the poverty line, including 28.3% of those under age 18 and 15.2% of those age 65 or over.
Common Questions
What is the Total Population of Pembroke?
Total Population of Pembroke is 2,542.
What is the Total Male Population of Pembroke?
Total Male Population of Pembroke is 1,156.
What is the Total Female Population of Pembroke?
Total Female Population of Pembroke is 1,386.
What is the Ratio of Males per 100 Females in Pembroke?
There are 83.41 Males per 100 Females in Pembroke.
What is the Ratio of Females per 100 Males in Pembroke?
There are 119.90 Females per 100 Males in Pembroke.
What is the Median Population Age in Pembroke?
Median Population Age in Pembroke is 26.9 Years.
What is the Average Family Size in Pembroke
Average Family Size in Pembroke is 3.2 People.
What is the Average Household Size in Pembroke
Average Household Size in Pembroke is 2.9 People.
What is Per Capita Income in Pembroke?
Per Capita income in Pembroke is $25,702.
What is the Median Family Income in Pembroke?
Median Family Income in Pembroke is $67,031.
What is the Median Household income in Pembroke?
Median Household Income in Pembroke is $66,488.
What is Income or Wage Gap in Pembroke?
Income or Wage Gap in Pembroke is 20.0%.
Women in Pembroke earn 80.0 cents for every dollar earned by a man.
What is Family Income Deficit in Pembroke?
Family Income Deficit in Pembroke is $3,707.
Families that are below poverty line in Pembroke earn $3,707 less on average than the poverty threshold level.
What is Inequality or Gini Index in Pembroke?
Inequality or Gini Index in Pembroke is 0.39.
How Large is the Labor Force in Pembroke?
There are 1,434 People in the Labor Forcein in Pembroke.
What is the Percentage of People in the Labor Force in Pembroke?
72.2% of People are in the Labor Force in Pembroke.
What is the Unemployment Rate in Pembroke?
Unemployment Rate in Pembroke is 7.7%.