Tallulah Falls, GA
Tallulah Falls Map
Tallulah Falls Overview
236
TOTAL POPULATION
72
MALE POPULATION
164
FEMALE POPULATION
43.90
MALES / 100 FEMALES
227.78
FEMALES / 100 MALES
18.4
MEDIAN AGE
5.3
AVG FAMILY SIZE
3.5
AVG HOUSEHOLD SIZE
$20,730
PER CAPITA INCOME
$71,250
AVG FAMILY INCOME
$48,750
AVG HOUSEHOLD INCOME
0.38
INEQUALITY / GINI INDEX
63
LABOR FORCE [ PEOPLE ]
29.2%
PERCENT IN LABOR FORCE
Tallulah Falls Zip Codes
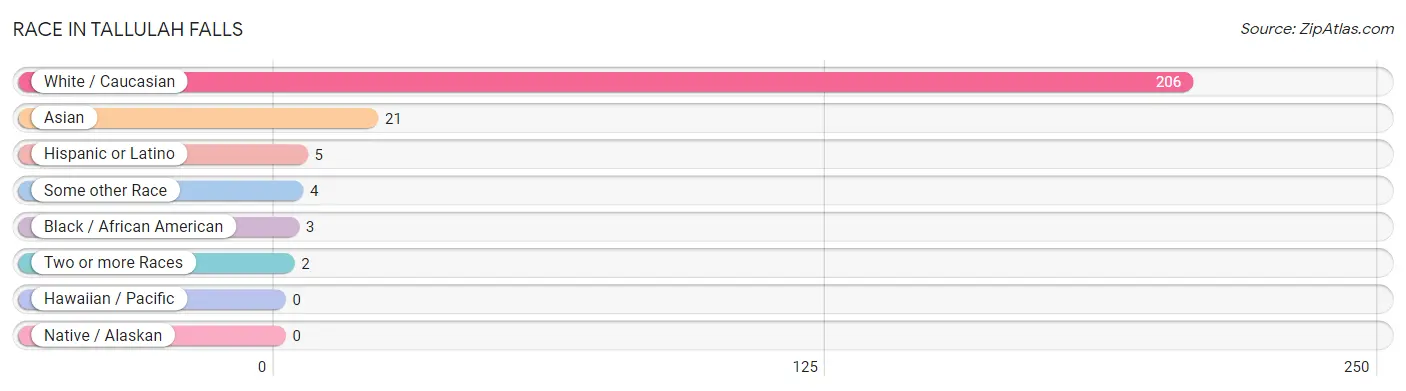
Race in Tallulah Falls
The most populous races in Tallulah Falls are White / Caucasian (206 | 87.3%), Asian (21 | 8.9%), and Hispanic or Latino (5 | 2.1%).
| Race | # Population | % Population |
| Asian | 21 | 8.9% |
| Black / African American | 3 | 1.3% |
| Hawaiian / Pacific | 0 | 0.0% |
| Hispanic or Latino | 5 | 2.1% |
| Native / Alaskan | 0 | 0.0% |
| White / Caucasian | 206 | 87.3% |
| Two or more Races | 2 | 0.9% |
| Some other Race | 4 | 1.7% |
| Total | 236 | 100.0% |
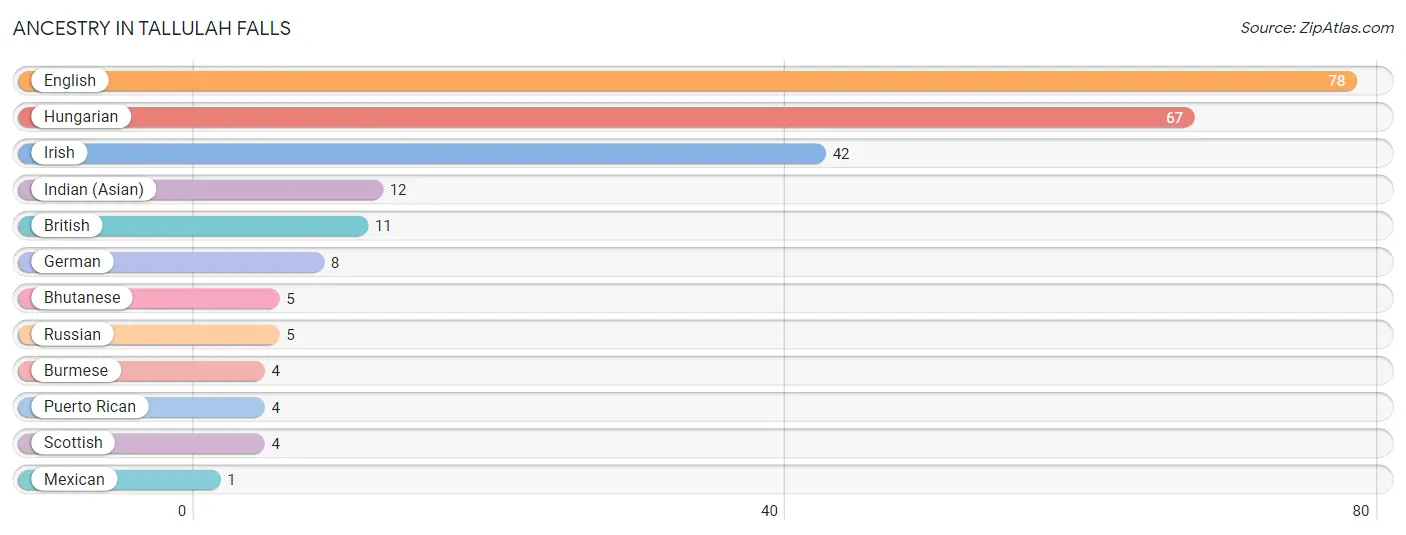
Ancestry in Tallulah Falls
The most populous ancestries reported in Tallulah Falls are English (78 | 33.1%), Hungarian (67 | 28.4%), Irish (42 | 17.8%), Indian (Asian) (12 | 5.1%), and British (11 | 4.7%), together accounting for 89.0% of all Tallulah Falls residents.
| Ancestry | # Population | % Population |
| Bhutanese | 5 | 2.1% |
| British | 11 | 4.7% |
| Burmese | 4 | 1.7% |
| English | 78 | 33.1% |
| German | 8 | 3.4% |
| Hungarian | 67 | 28.4% |
| Indian (Asian) | 12 | 5.1% |
| Irish | 42 | 17.8% |
| Mexican | 1 | 0.4% |
| Puerto Rican | 4 | 1.7% |
| Russian | 5 | 2.1% |
| Scottish | 4 | 1.7% | View All 12 Rows |
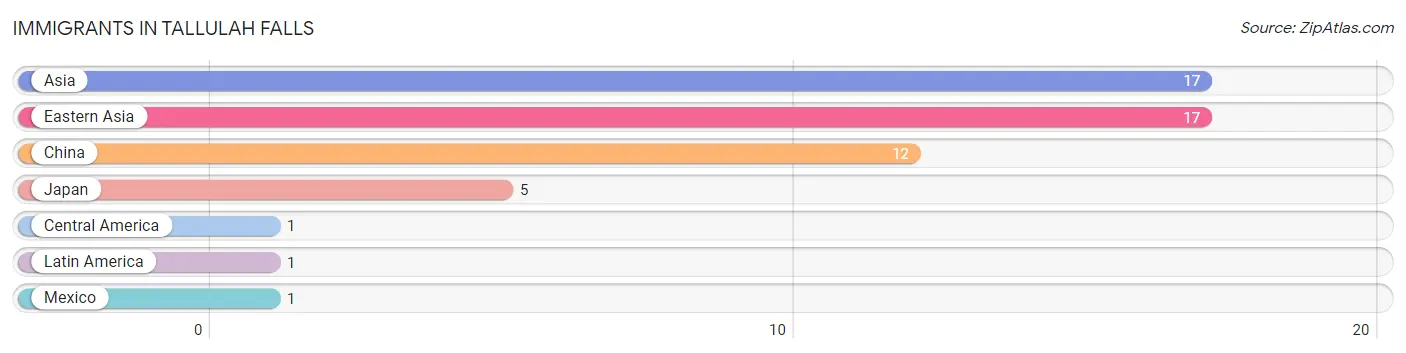
Immigrants in Tallulah Falls
The most numerous immigrant groups reported in Tallulah Falls came from Asia (17 | 7.2%), Eastern Asia (17 | 7.2%), China (12 | 5.1%), Japan (5 | 2.1%), and Central America (1 | 0.4%), together accounting for 22.0% of all Tallulah Falls residents.
| Immigration Origin | # Population | % Population |
| Asia | 17 | 7.2% |
| Central America | 1 | 0.4% |
| China | 12 | 5.1% |
| Eastern Asia | 17 | 7.2% |
| Japan | 5 | 2.1% |
| Latin America | 1 | 0.4% |
| Mexico | 1 | 0.4% | View All 7 Rows |
Sex and Age in Tallulah Falls
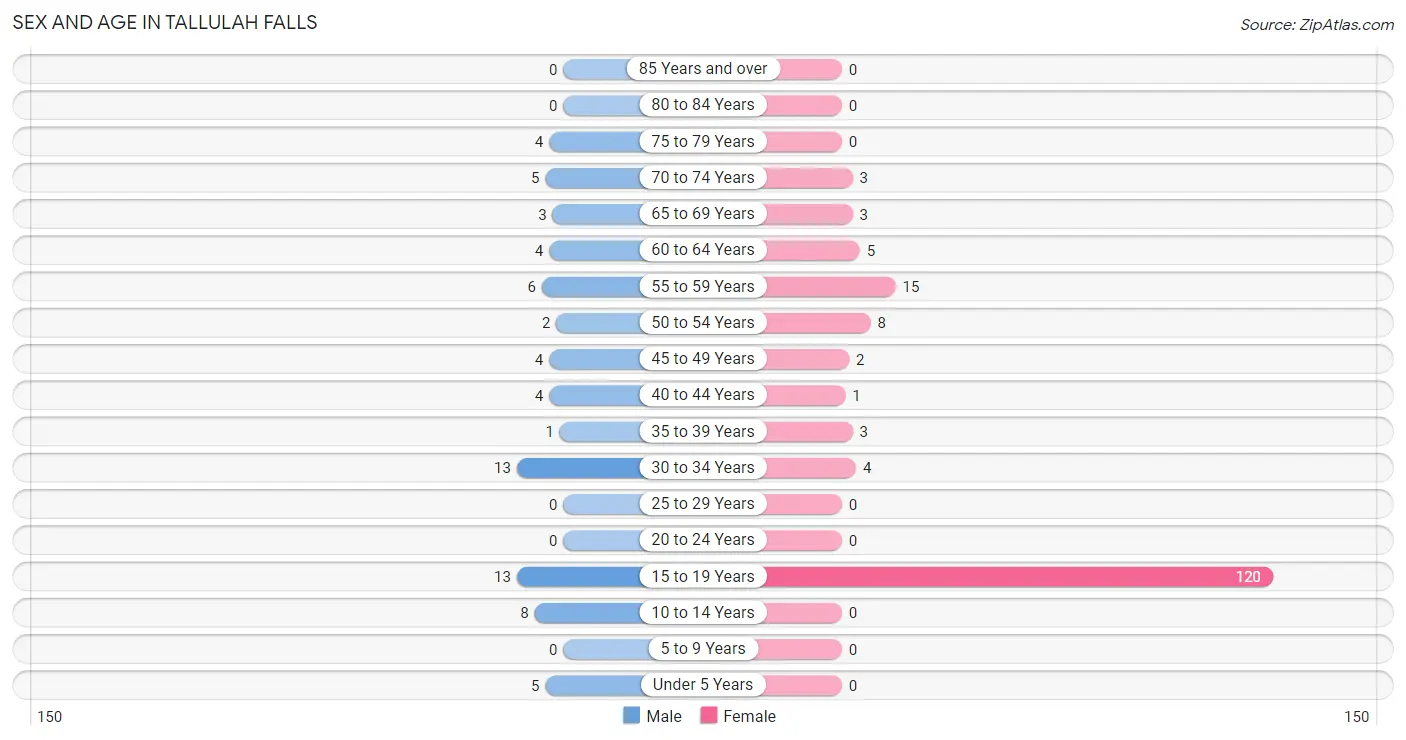
Sex and Age in Tallulah Falls
The most populous age groups in Tallulah Falls are 15 to 19 Years (13 | 18.1%) for men and 15 to 19 Years (120 | 73.2%) for women.
| Age Bracket | Male | Female |
| Under 5 Years | 5 (6.9%) | 0 (0.0%) |
| 5 to 9 Years | 0 (0.0%) | 0 (0.0%) |
| 10 to 14 Years | 8 (11.1%) | 0 (0.0%) |
| 15 to 19 Years | 13 (18.1%) | 120 (73.2%) |
| 20 to 24 Years | 0 (0.0%) | 0 (0.0%) |
| 25 to 29 Years | 0 (0.0%) | 0 (0.0%) |
| 30 to 34 Years | 13 (18.1%) | 4 (2.4%) |
| 35 to 39 Years | 1 (1.4%) | 3 (1.8%) |
| 40 to 44 Years | 4 (5.6%) | 1 (0.6%) |
| 45 to 49 Years | 4 (5.6%) | 2 (1.2%) |
| 50 to 54 Years | 2 (2.8%) | 8 (4.9%) |
| 55 to 59 Years | 6 (8.3%) | 15 (9.1%) |
| 60 to 64 Years | 4 (5.6%) | 5 (3.0%) |
| 65 to 69 Years | 3 (4.2%) | 3 (1.8%) |
| 70 to 74 Years | 5 (6.9%) | 3 (1.8%) |
| 75 to 79 Years | 4 (5.6%) | 0 (0.0%) |
| 80 to 84 Years | 0 (0.0%) | 0 (0.0%) |
| 85 Years and over | 0 (0.0%) | 0 (0.0%) |
| Total | 72 (100.0%) | 164 (100.0%) |
Families and Households in Tallulah Falls
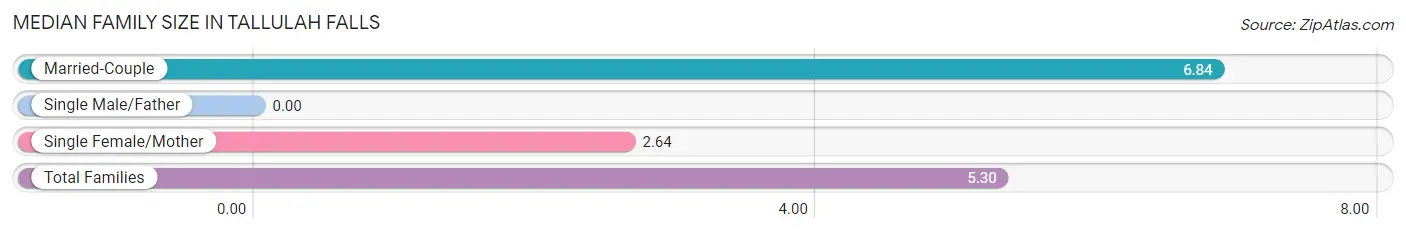
Median Family Size in Tallulah Falls
| Family Type | # Families | Family Size |
| Married-Couple | 19 (63.3%) | 6.84 |
| Single Male/Father | 0 (0.0%) | - |
| Single Female/Mother | 11 (36.7%) | 2.64 |
| Total Families | 30 (100.0%) | 5.30 |
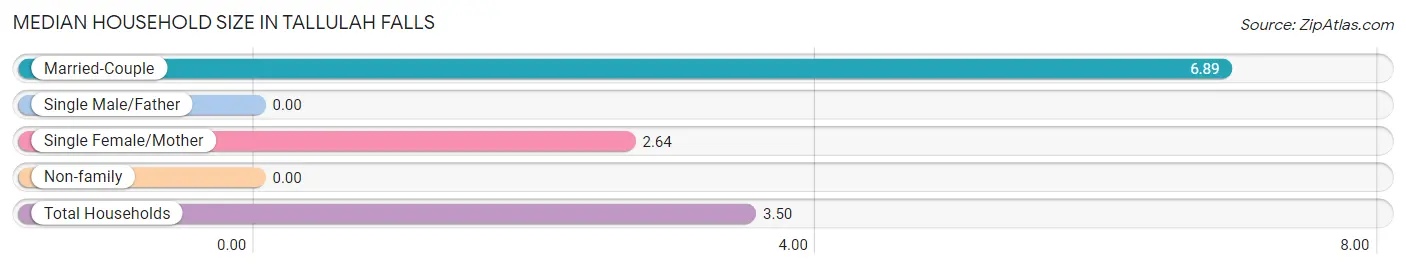
Median Household Size in Tallulah Falls
| Household Type | # Households | Household Size |
| Married-Couple | 19 (36.5%) | 6.89 |
| Single Male/Father | 0 (0.0%) | - |
| Single Female/Mother | 11 (21.1%) | 2.64 |
| Non-family | 22 (42.3%) | - |
| Total Households | 52 (100.0%) | 3.50 |
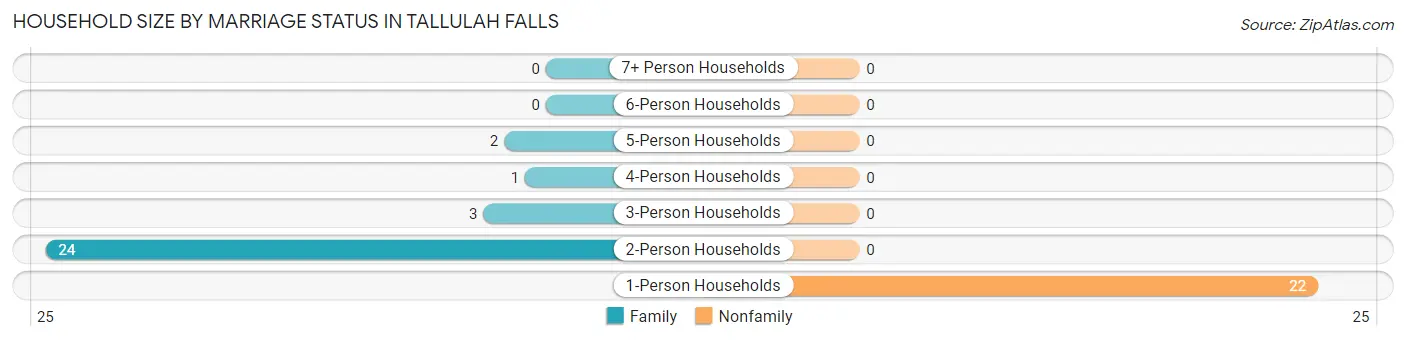
Household Size by Marriage Status in Tallulah Falls
Out of a total of 52 households in Tallulah Falls, 30 (57.7%) are family households, while 22 (42.3%) are nonfamily households. The most numerous type of family households are 2-person households, comprising 24, and the most common type of nonfamily households are 1-person households, comprising 22.
| Household Size | Family Households | Nonfamily Households |
| 1-Person Households | - | 22 (42.3%) |
| 2-Person Households | 24 (46.2%) | 0 (0.0%) |
| 3-Person Households | 3 (5.8%) | 0 (0.0%) |
| 4-Person Households | 1 (1.9%) | 0 (0.0%) |
| 5-Person Households | 2 (3.8%) | 0 (0.0%) |
| 6-Person Households | 0 (0.0%) | 0 (0.0%) |
| 7+ Person Households | 0 (0.0%) | 0 (0.0%) |
| Total | 30 (57.7%) | 22 (42.3%) |
Female Fertility in Tallulah Falls
Fertility by Age in Tallulah Falls
Average fertility rate in Tallulah Falls is 23.0 births per 1,000 women. Women in the age bracket of 35 to 50 years have the highest fertility rate with 500.0 births per 1,000 women. Women in the age bracket of 35 to 50 years acount for 100.0% of all women with births.
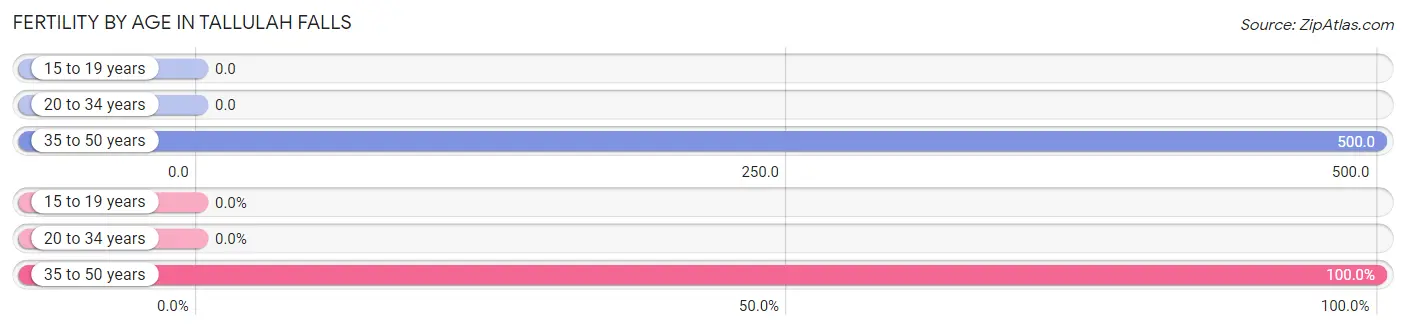
| Age Bracket | Women with Births | Births / 1,000 Women |
| 15 to 19 years | 0 (0.0%) | 0.0 |
| 20 to 34 years | 0 (0.0%) | 0.0 |
| 35 to 50 years | 3 (100.0%) | 500.0 |
| Total | 3 (100.0%) | 23.0 |
Fertility by Age by Marriage Status in Tallulah Falls
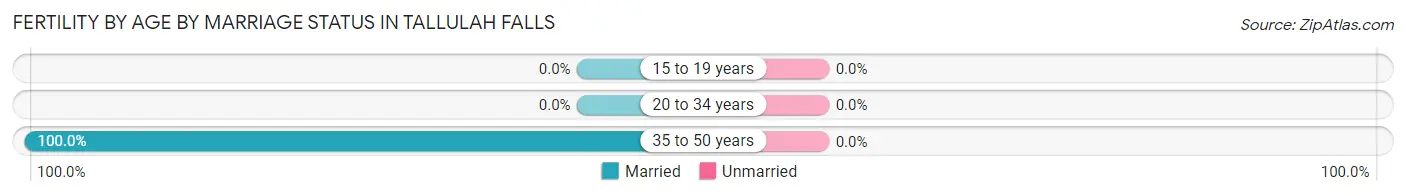
| Age Bracket | Married | Unmarried |
| 15 to 19 years | 0 (0.0%) | 0 (0.0%) |
| 20 to 34 years | 0 (0.0%) | 0 (0.0%) |
| 35 to 50 years | 3 (100.0%) | 0 (0.0%) |
| Total | 3 (100.0%) | 0 (0.0%) |
Fertility by Education in Tallulah Falls
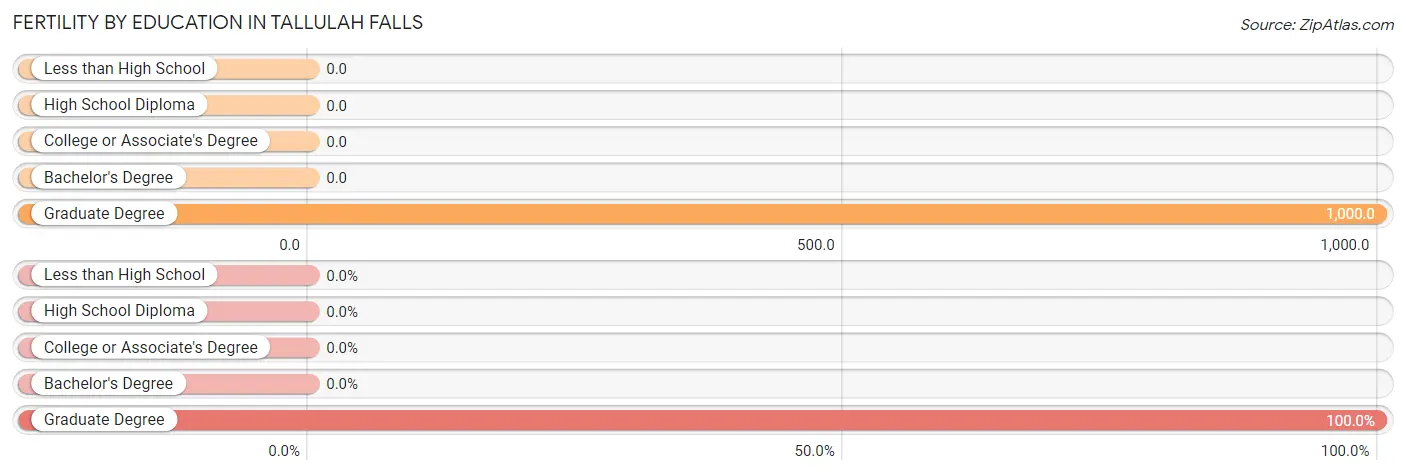
| Educational Attainment | Women with Births | Births / 1,000 Women |
| Less than High School | 0 (0.0%) | 0.0 |
| High School Diploma | 0 (0.0%) | 0.0 |
| College or Associate's Degree | 0 (0.0%) | 0.0 |
| Bachelor's Degree | 0 (0.0%) | 0.0 |
| Graduate Degree | 3 (100.0%) | 1,000.0 |
| Total | 3 (100.0%) | 23.0 |
Fertility by Education by Marriage Status in Tallulah Falls
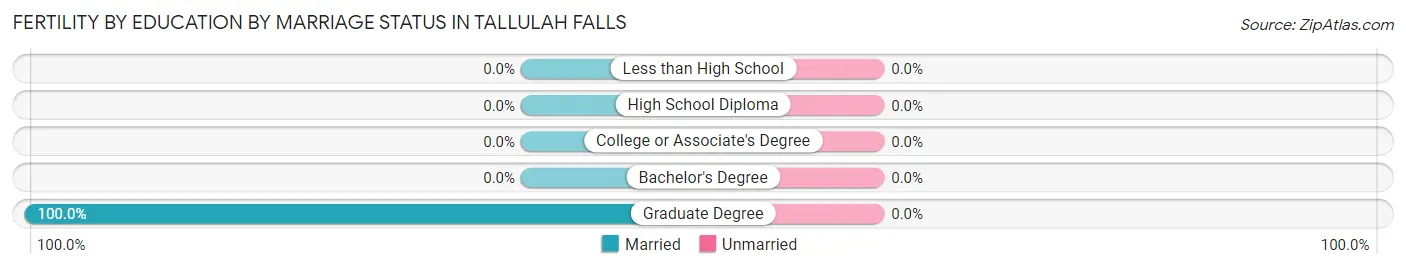
| Educational Attainment | Married | Unmarried |
| Less than High School | 0 (0.0%) | 0 (0.0%) |
| High School Diploma | 0 (0.0%) | 0 (0.0%) |
| College or Associate's Degree | 0 (0.0%) | 0 (0.0%) |
| Bachelor's Degree | 0 (0.0%) | 0 (0.0%) |
| Graduate Degree | 3 (100.0%) | 0 (0.0%) |
| Total | 3 (100.0%) | 0 (0.0%) |
Income in Tallulah Falls
Income Overview in Tallulah Falls
Per Capita Income in Tallulah Falls is $20,730, while median incomes of families and households are $71,250 and $48,750 respectively.
| Characteristic | Number | Measure |
| Per Capita Income | 236 | $20,730 |
| Median Family Income | 30 | $71,250 |
| Mean Family Income | 30 | $85,787 |
| Median Household Income | 52 | $48,750 |
| Mean Household Income | 52 | $73,119 |
| Income Deficit | 30 | $0 |
| Wage / Income Gap (%) | 236 | 0.00% |
| Wage / Income Gap ($) | 236 | 100.00¢ per $1 |
| Gini / Inequality Index | 236 | 0.38 |
Earnings by Sex in Tallulah Falls
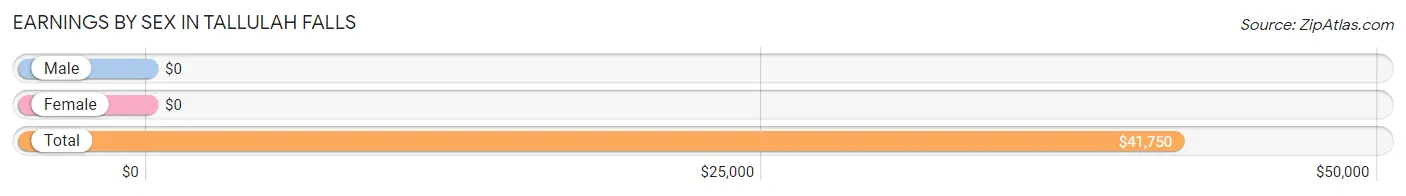
| Sex | Number | Average Earnings |
| Male | 25 (37.3%) | $0 |
| Female | 42 (62.7%) | $0 |
| Total | 67 (100.0%) | $41,750 |
Earnings by Sex by Income Bracket in Tallulah Falls
The most common earnings brackets in Tallulah Falls are $75,000 to $99,999 for men (7 | 28.0%) and $45,000 to $49,999 for women (12 | 28.6%).
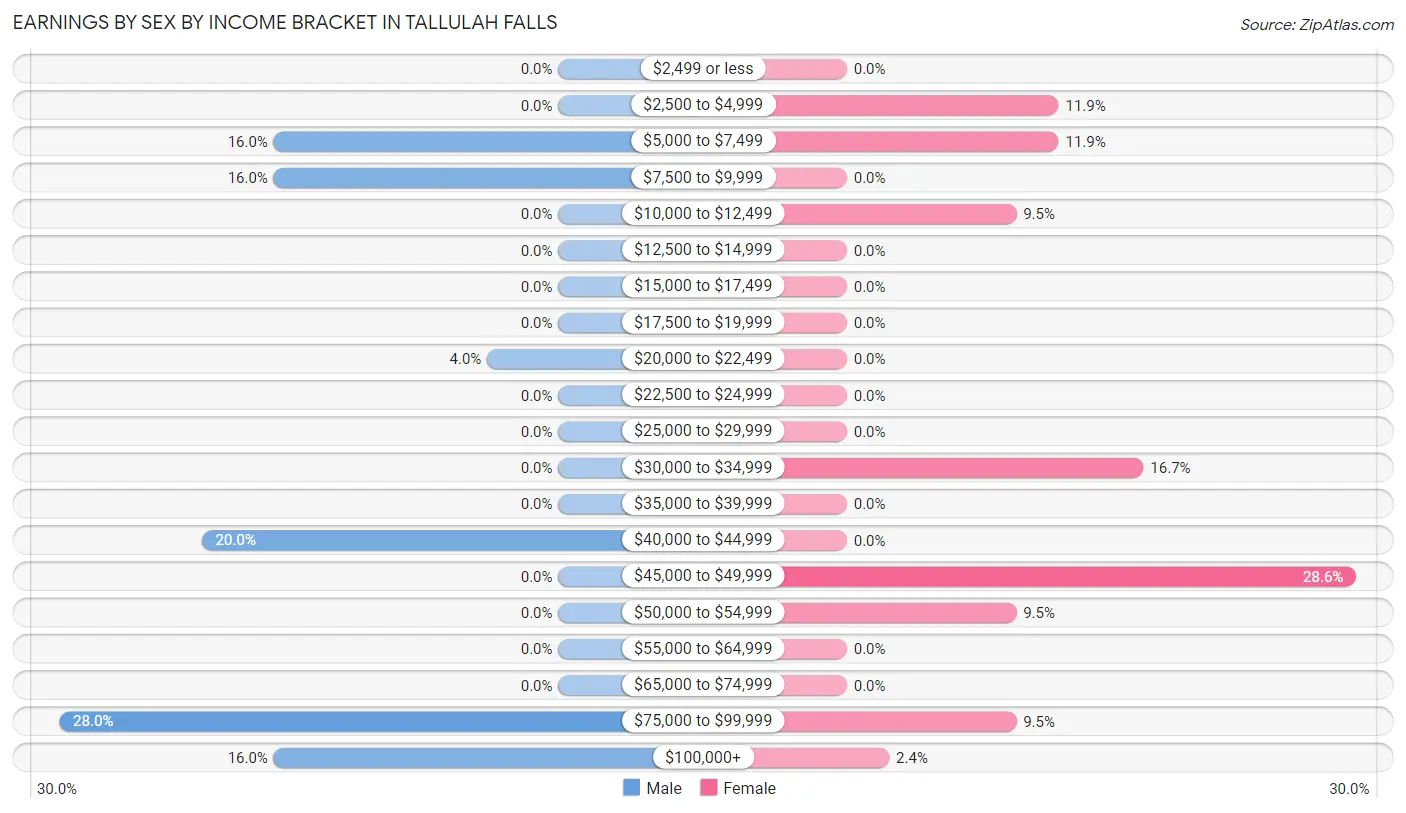
| Income | Male | Female |
| $2,499 or less | 0 (0.0%) | 0 (0.0%) |
| $2,500 to $4,999 | 0 (0.0%) | 5 (11.9%) |
| $5,000 to $7,499 | 4 (16.0%) | 5 (11.9%) |
| $7,500 to $9,999 | 4 (16.0%) | 0 (0.0%) |
| $10,000 to $12,499 | 0 (0.0%) | 4 (9.5%) |
| $12,500 to $14,999 | 0 (0.0%) | 0 (0.0%) |
| $15,000 to $17,499 | 0 (0.0%) | 0 (0.0%) |
| $17,500 to $19,999 | 0 (0.0%) | 0 (0.0%) |
| $20,000 to $22,499 | 1 (4.0%) | 0 (0.0%) |
| $22,500 to $24,999 | 0 (0.0%) | 0 (0.0%) |
| $25,000 to $29,999 | 0 (0.0%) | 0 (0.0%) |
| $30,000 to $34,999 | 0 (0.0%) | 7 (16.7%) |
| $35,000 to $39,999 | 0 (0.0%) | 0 (0.0%) |
| $40,000 to $44,999 | 5 (20.0%) | 0 (0.0%) |
| $45,000 to $49,999 | 0 (0.0%) | 12 (28.6%) |
| $50,000 to $54,999 | 0 (0.0%) | 4 (9.5%) |
| $55,000 to $64,999 | 0 (0.0%) | 0 (0.0%) |
| $65,000 to $74,999 | 0 (0.0%) | 0 (0.0%) |
| $75,000 to $99,999 | 7 (28.0%) | 4 (9.5%) |
| $100,000+ | 4 (16.0%) | 1 (2.4%) |
| Total | 25 (100.0%) | 42 (100.0%) |
Earnings by Sex by Educational Attainment in Tallulah Falls
| Educational Attainment | Male Income | Female Income |
| Less than High School | - | - |
| High School Diploma | - | - |
| College or Associate's Degree | - | - |
| Bachelor's Degree | - | - |
| Graduate Degree | - | - |
| Total | $78,125 | $45,781 |
Family Income in Tallulah Falls
Family Income Brackets in Tallulah Falls
According to the Tallulah Falls family income data, there are 7 families falling into the $25,000 to $34,999 income range, which is the most common income bracket and makes up 23.3% of all families.
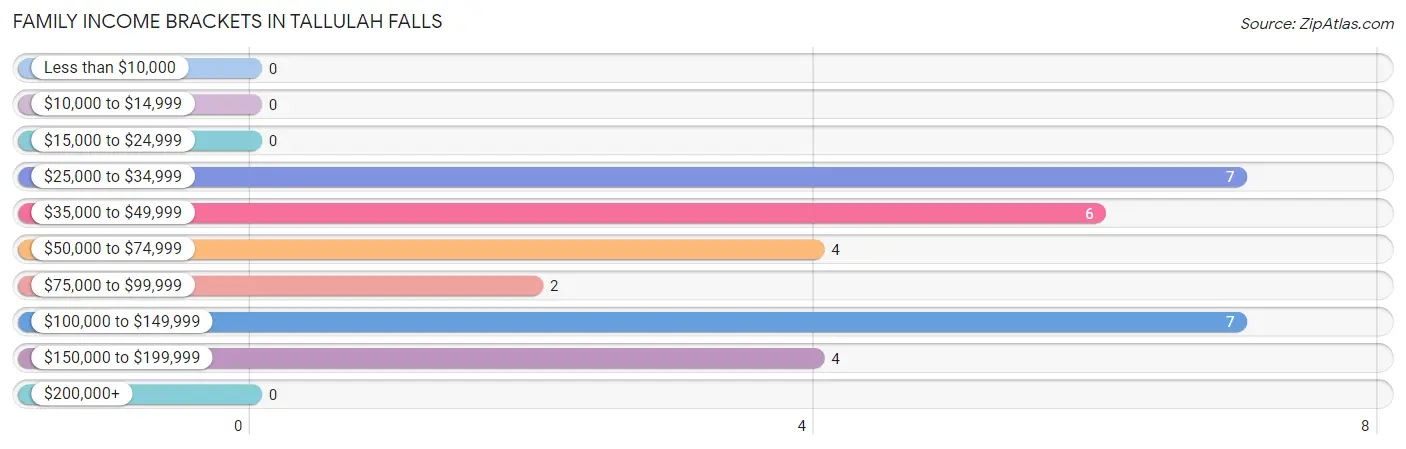
| Income Bracket | # Families | % Families |
| Less than $10,000 | 0 | 0.0% |
| $10,000 to $14,999 | 0 | 0.0% |
| $15,000 to $24,999 | 0 | 0.0% |
| $25,000 to $34,999 | 7 | 23.3% |
| $35,000 to $49,999 | 6 | 20.0% |
| $50,000 to $74,999 | 4 | 13.3% |
| $75,000 to $99,999 | 2 | 6.7% |
| $100,000 to $149,999 | 7 | 23.3% |
| $150,000 to $199,999 | 4 | 13.3% |
| $200,000+ | 0 | 0.0% |
Family Income by Famaliy Size in Tallulah Falls
| Income Bracket | # Families | Median Income |
| 2-Person Families | 24 (80.0%) | $0 |
| 3-Person Families | 4 (13.3%) | $0 |
| 4-Person Families | 0 (0.0%) | $0 |
| 5-Person Families | 2 (6.7%) | $0 |
| 6-Person Families | 0 (0.0%) | $0 |
| 7+ Person Families | 0 (0.0%) | $0 |
| Total | 30 (100.0%) | $71,250 |
Family Income by Number of Earners in Tallulah Falls
| Number of Earners | # Families | Median Income |
| No Earners | 3 (10.0%) | $0 |
| 1 Earner | 13 (43.3%) | $0 |
| 2 Earners | 14 (46.7%) | $0 |
| 3+ Earners | 0 (0.0%) | $0 |
| Total | 30 (100.0%) | $71,250 |
Household Income in Tallulah Falls
Household Income Brackets in Tallulah Falls
With 14 households falling in the category, the $35,000 to $49,999 income range is the most frequent in Tallulah Falls, accounting for 26.9% of all households.
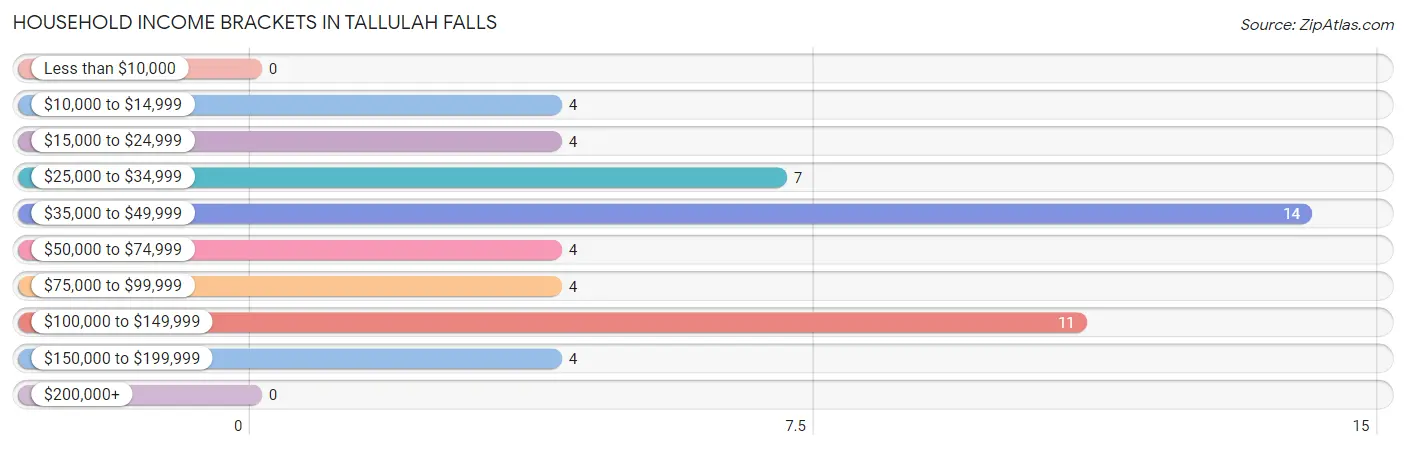
| Income Bracket | # Households | % Households |
| Less than $10,000 | 0 | 0.0% |
| $10,000 to $14,999 | 4 | 7.7% |
| $15,000 to $24,999 | 4 | 7.7% |
| $25,000 to $34,999 | 7 | 13.5% |
| $35,000 to $49,999 | 14 | 26.9% |
| $50,000 to $74,999 | 4 | 7.7% |
| $75,000 to $99,999 | 4 | 7.7% |
| $100,000 to $149,999 | 11 | 21.2% |
| $150,000 to $199,999 | 4 | 7.7% |
| $200,000+ | 0 | 0.0% |
Household Income by Householder Age in Tallulah Falls
The median household income in Tallulah Falls is $48,750, with the highest median household income of $131,667 found in the 25 to 44 years age bracket for the primary householder. A total of 12 households (23.1%) fall into this category.
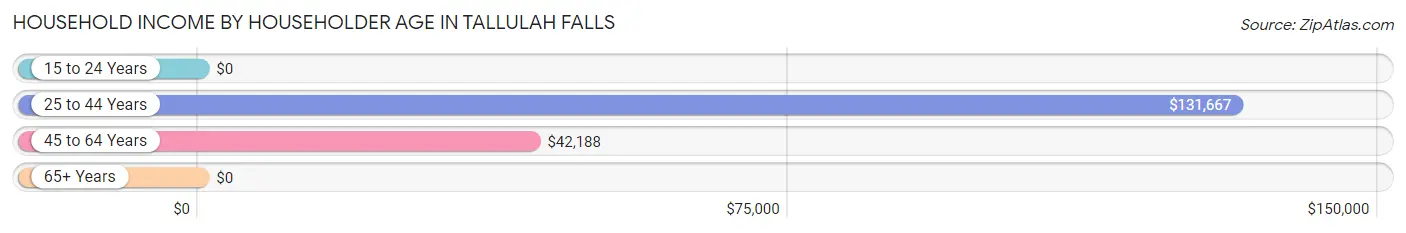
| Income Bracket | # Households | Median Income |
| 15 to 24 Years | 0 (0.0%) | $0 |
| 25 to 44 Years | 12 (23.1%) | $131,667 |
| 45 to 64 Years | 29 (55.8%) | $42,188 |
| 65+ Years | 11 (21.1%) | $0 |
| Total | 52 (100.0%) | $48,750 |
Poverty in Tallulah Falls
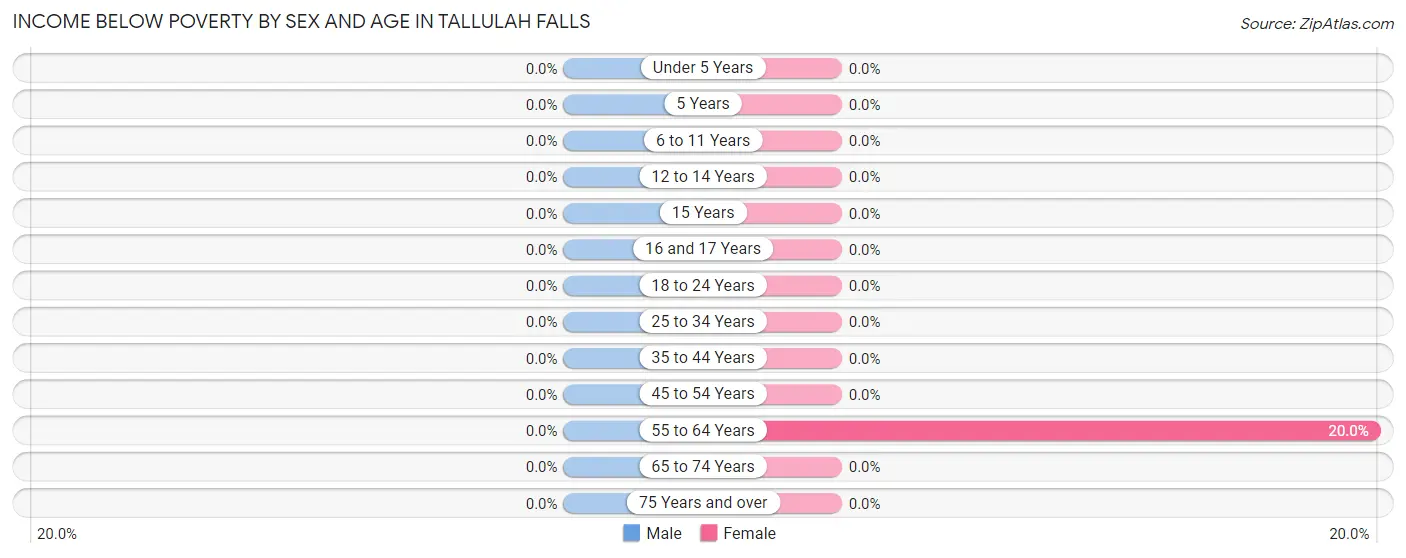
Income Below Poverty by Sex and Age in Tallulah Falls
| Age Bracket | Male | Female |
| Under 5 Years | 0 (0.0%) | 0 (0.0%) |
| 5 Years | 0 (0.0%) | 0 (0.0%) |
| 6 to 11 Years | 0 (0.0%) | 0 (0.0%) |
| 12 to 14 Years | 0 (0.0%) | 0 (0.0%) |
| 15 Years | 0 (0.0%) | 0 (0.0%) |
| 16 and 17 Years | 0 (0.0%) | 0 (0.0%) |
| 18 to 24 Years | 0 (0.0%) | 0 (0.0%) |
| 25 to 34 Years | 0 (0.0%) | 0 (0.0%) |
| 35 to 44 Years | 0 (0.0%) | 0 (0.0%) |
| 45 to 54 Years | 0 (0.0%) | 0 (0.0%) |
| 55 to 64 Years | 0 (0.0%) | 4 (20.0%) |
| 65 to 74 Years | 0 (0.0%) | 0 (0.0%) |
| 75 Years and over | 0 (0.0%) | 0 (0.0%) |
| Total | 0 (0.0%) | 4 (3.4%) |
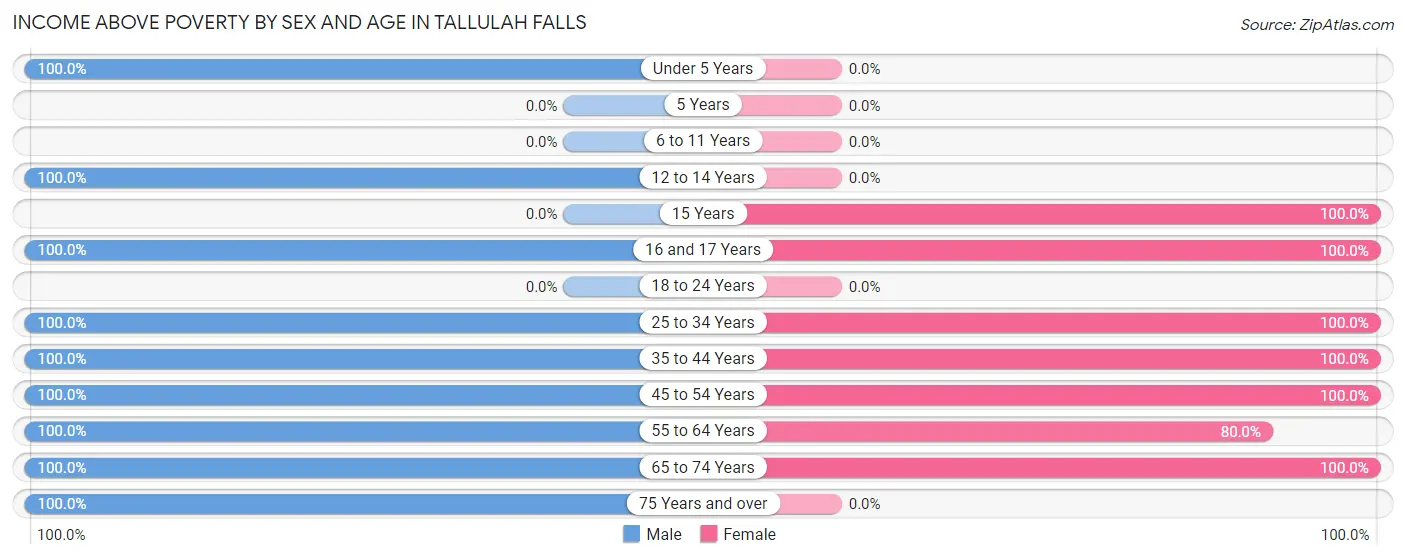
Income Above Poverty by Sex and Age in Tallulah Falls
According to the poverty statistics in Tallulah Falls, males aged under 5 years and females aged 15 years are the age groups that are most secure financially, with 100.0% of males and 100.0% of females in these age groups living above the poverty line.
| Age Bracket | Male | Female |
| Under 5 Years | 5 (100.0%) | 0 (0.0%) |
| 5 Years | 0 (0.0%) | 0 (0.0%) |
| 6 to 11 Years | 0 (0.0%) | 0 (0.0%) |
| 12 to 14 Years | 8 (100.0%) | 0 (0.0%) |
| 15 Years | 0 (0.0%) | 7 (100.0%) |
| 16 and 17 Years | 6 (100.0%) | 66 (100.0%) |
| 18 to 24 Years | 0 (0.0%) | 0 (0.0%) |
| 25 to 34 Years | 13 (100.0%) | 4 (100.0%) |
| 35 to 44 Years | 5 (100.0%) | 4 (100.0%) |
| 45 to 54 Years | 6 (100.0%) | 10 (100.0%) |
| 55 to 64 Years | 10 (100.0%) | 16 (80.0%) |
| 65 to 74 Years | 8 (100.0%) | 6 (100.0%) |
| 75 Years and over | 4 (100.0%) | 0 (0.0%) |
| Total | 65 (100.0%) | 113 (96.6%) |
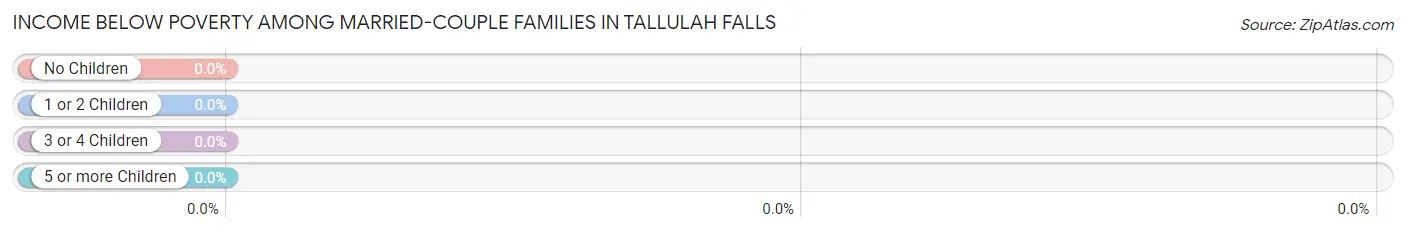
Income Below Poverty Among Married-Couple Families in Tallulah Falls
| Children | Above Poverty | Below Poverty |
| No Children | 13 (100.0%) | 0 (0.0%) |
| 1 or 2 Children | 4 (100.0%) | 0 (0.0%) |
| 3 or 4 Children | 2 (100.0%) | 0 (0.0%) |
| 5 or more Children | 0 (0.0%) | 0 (0.0%) |
| Total | 19 (100.0%) | 0 (0.0%) |
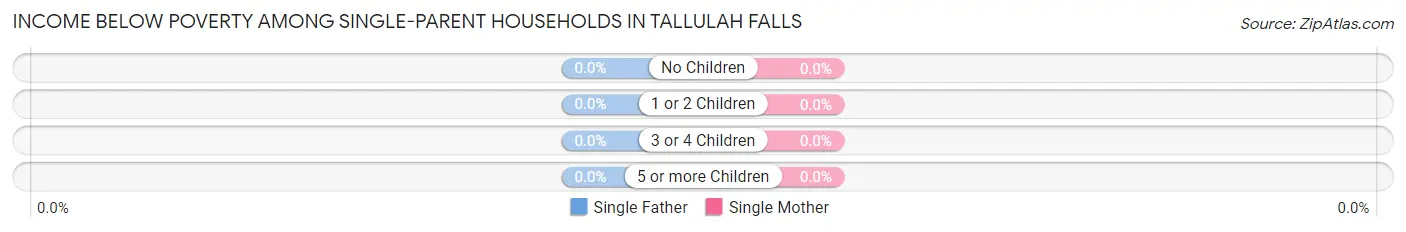
Income Below Poverty Among Single-Parent Households in Tallulah Falls
| Children | Single Father | Single Mother |
| No Children | 0 (0.0%) | 0 (0.0%) |
| 1 or 2 Children | 0 (0.0%) | 0 (0.0%) |
| 3 or 4 Children | 0 (0.0%) | 0 (0.0%) |
| 5 or more Children | 0 (0.0%) | 0 (0.0%) |
| Total | 0 (0.0%) | 0 (0.0%) |
Income Below Poverty Among Married-Couple vs Single-Parent Households in Tallulah Falls
| Children | Married-Couple Families | Single-Parent Households |
| No Children | 0 (0.0%) | 0 (0.0%) |
| 1 or 2 Children | 0 (0.0%) | 0 (0.0%) |
| 3 or 4 Children | 0 (0.0%) | 0 (0.0%) |
| 5 or more Children | 0 (0.0%) | 0 (0.0%) |
| Total | 0 (0.0%) | 0 (0.0%) |
Employment Characteristics in Tallulah Falls
Employment by Class of Employer in Tallulah Falls
Among the 63 employed individuals in Tallulah Falls, private company employees (29 | 46.0%), not-for-profit organizations (12 | 19.1%), and local government employees (7 | 11.1%) make up the most common classes of employment.
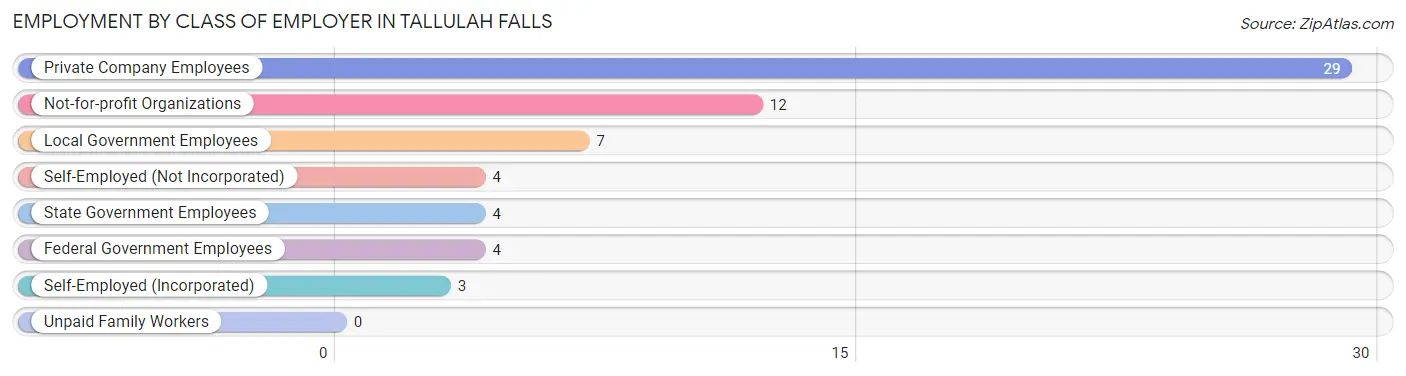
| Employer Class | # Employees | % Employees |
| Private Company Employees | 29 | 46.0% |
| Self-Employed (Incorporated) | 3 | 4.8% |
| Self-Employed (Not Incorporated) | 4 | 6.4% |
| Not-for-profit Organizations | 12 | 19.1% |
| Local Government Employees | 7 | 11.1% |
| State Government Employees | 4 | 6.4% |
| Federal Government Employees | 4 | 6.4% |
| Unpaid Family Workers | 0 | 0.0% |
| Total | 63 | 100.0% |
Employment Status by Age in Tallulah Falls
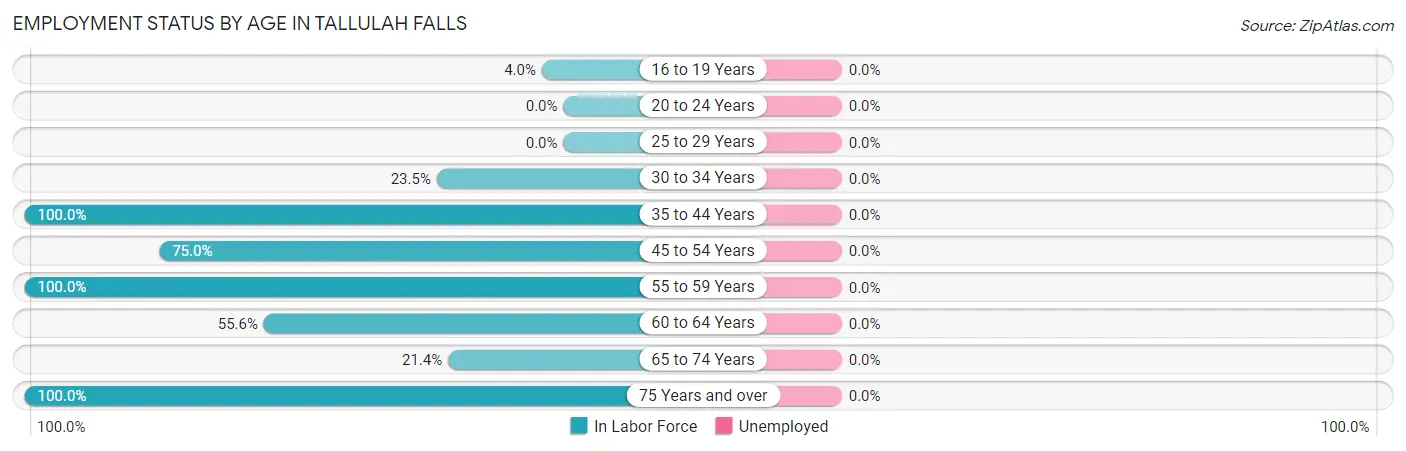
| Age Bracket | In Labor Force | Unemployed |
| 16 to 19 Years | 5 (4.0%) | 0 (0.0%) |
| 20 to 24 Years | 0 (0.0%) | 0 (0.0%) |
| 25 to 29 Years | 0 (0.0%) | 0 (0.0%) |
| 30 to 34 Years | 4 (23.5%) | 0 (0.0%) |
| 35 to 44 Years | 9 (100.0%) | 0 (0.0%) |
| 45 to 54 Years | 12 (75.0%) | 0 (0.0%) |
| 55 to 59 Years | 21 (100.0%) | 0 (0.0%) |
| 60 to 64 Years | 5 (55.6%) | 0 (0.0%) |
| 65 to 74 Years | 3 (21.4%) | 0 (0.0%) |
| 75 Years and over | 4 (100.0%) | 0 (0.0%) |
| Total | 63 (29.2%) | 0 (0.0%) |
Employment Status by Educational Attainment in Tallulah Falls
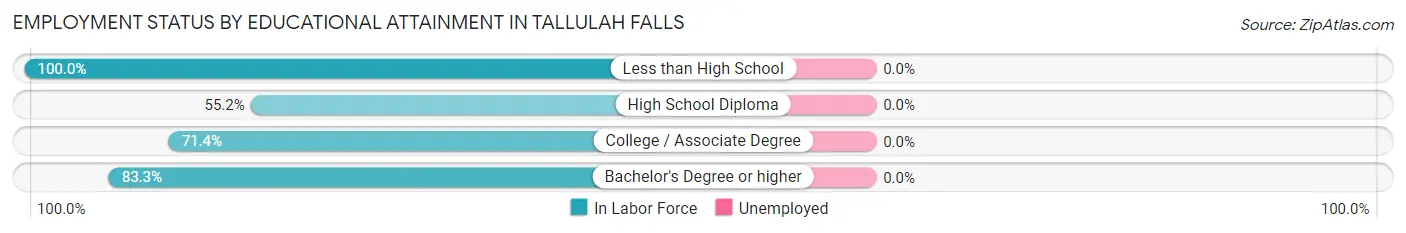
| Educational Attainment | In Labor Force | Unemployed |
| Less than High School | 5 (100.0%) | 0 (0.0%) |
| High School Diploma | 16 (55.2%) | 0 (0.0%) |
| College / Associate Degree | 10 (71.4%) | 0 (0.0%) |
| Bachelor's Degree or higher | 20 (83.3%) | 0 (0.0%) |
| Total | 51 (70.8%) | 0 (0.0%) |
Employment Occupations by Sex in Tallulah Falls
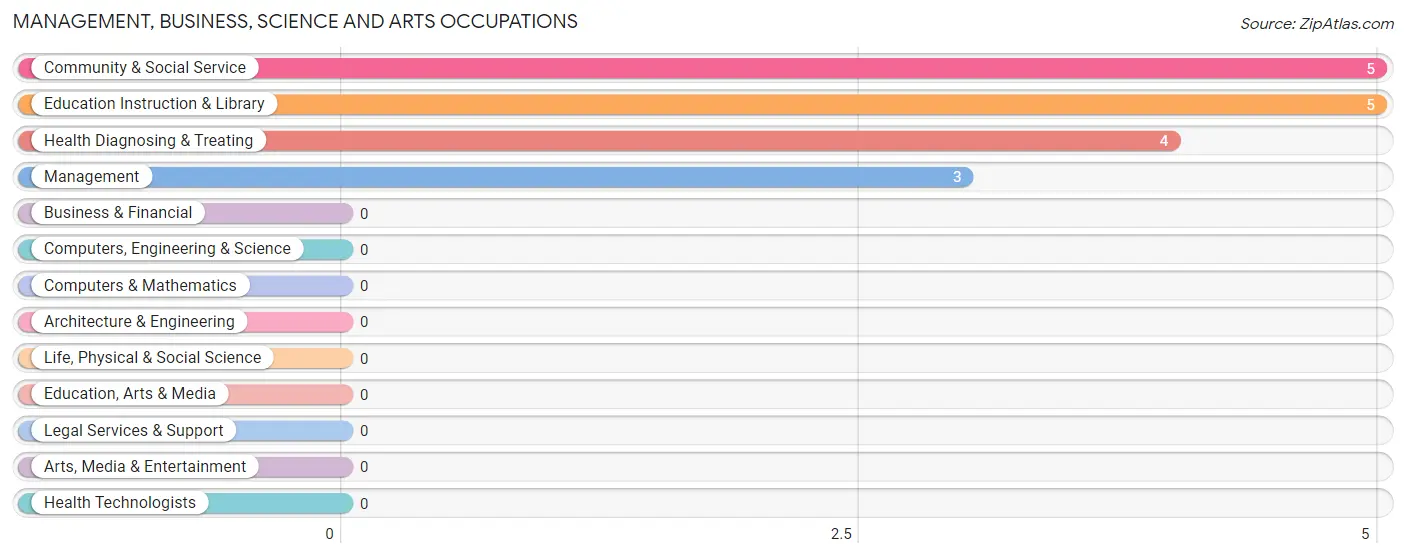
Management, Business, Science and Arts Occupations
The most common Management, Business, Science and Arts occupations in Tallulah Falls are Community & Social Service (5 | 8.5%), Education Instruction & Library (5 | 8.5%), Health Diagnosing & Treating (4 | 6.8%), and Management (3 | 5.1%).
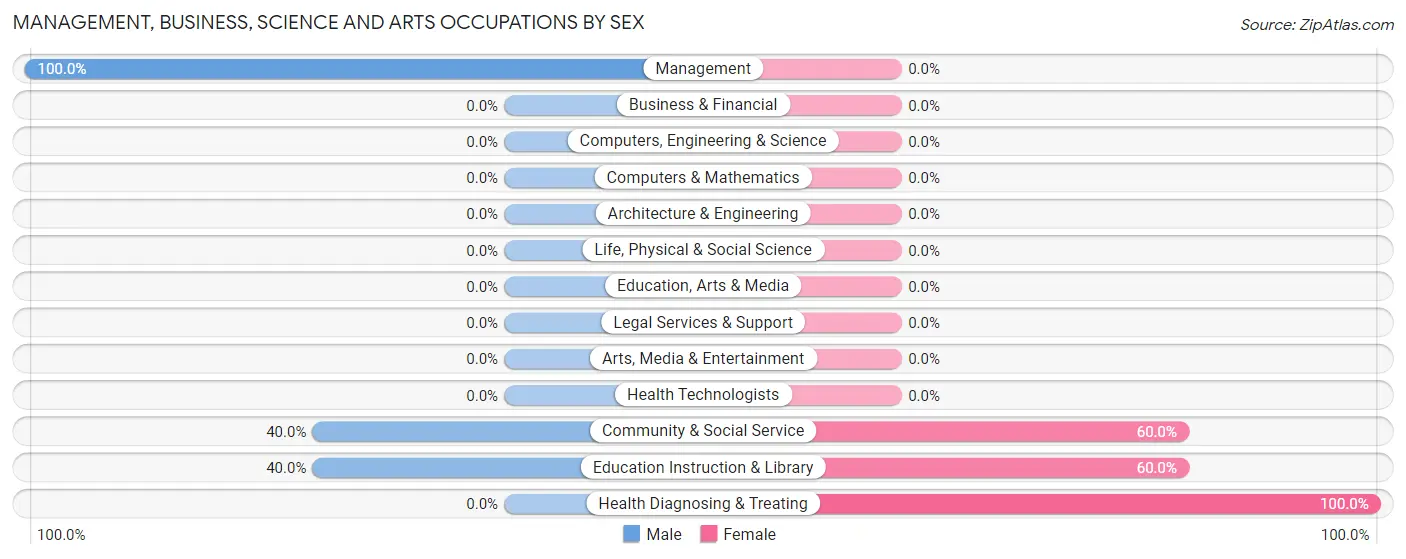
Management, Business, Science and Arts Occupations by Sex
Within the Management, Business, Science and Arts occupations in Tallulah Falls, the most male-oriented occupations are Management (100.0%), Community & Social Service (40.0%), and Education Instruction & Library (40.0%), while the most female-oriented occupations are Health Diagnosing & Treating (100.0%), Community & Social Service (60.0%), and Education Instruction & Library (60.0%).
| Occupation | Male | Female |
| Management | 3 (100.0%) | 0 (0.0%) |
| Business & Financial | 0 (0.0%) | 0 (0.0%) |
| Computers, Engineering & Science | 0 (0.0%) | 0 (0.0%) |
| Computers & Mathematics | 0 (0.0%) | 0 (0.0%) |
| Architecture & Engineering | 0 (0.0%) | 0 (0.0%) |
| Life, Physical & Social Science | 0 (0.0%) | 0 (0.0%) |
| Community & Social Service | 2 (40.0%) | 3 (60.0%) |
| Education, Arts & Media | 0 (0.0%) | 0 (0.0%) |
| Legal Services & Support | 0 (0.0%) | 0 (0.0%) |
| Education Instruction & Library | 2 (40.0%) | 3 (60.0%) |
| Arts, Media & Entertainment | 0 (0.0%) | 0 (0.0%) |
| Health Diagnosing & Treating | 0 (0.0%) | 4 (100.0%) |
| Health Technologists | 0 (0.0%) | 0 (0.0%) |
| Total (Category) | 5 (41.7%) | 7 (58.3%) |
| Total (Overall) | 17 (28.8%) | 42 (71.2%) |
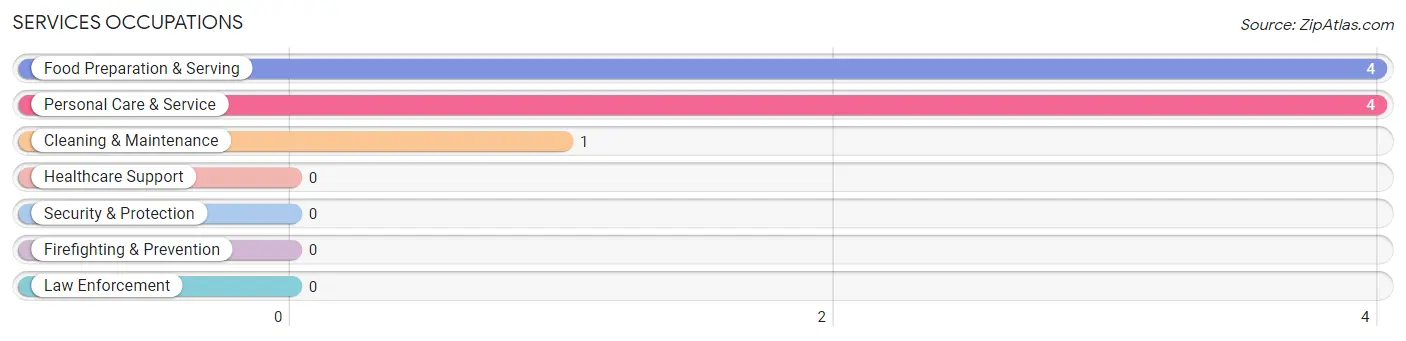
Services Occupations
The most common Services occupations in Tallulah Falls are Food Preparation & Serving (4 | 6.8%), Personal Care & Service (4 | 6.8%), and Cleaning & Maintenance (1 | 1.7%).
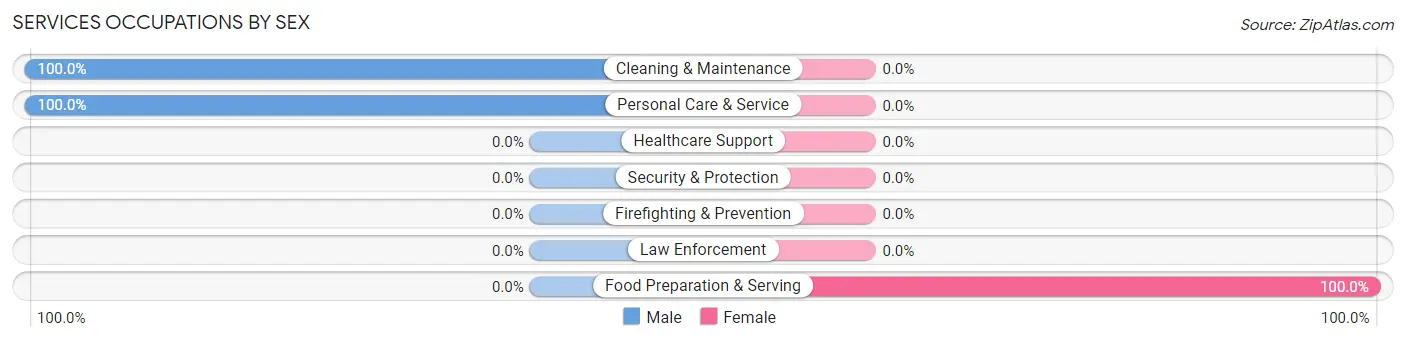
Services Occupations by Sex
| Occupation | Male | Female |
| Healthcare Support | 0 (0.0%) | 0 (0.0%) |
| Security & Protection | 0 (0.0%) | 0 (0.0%) |
| Firefighting & Prevention | 0 (0.0%) | 0 (0.0%) |
| Law Enforcement | 0 (0.0%) | 0 (0.0%) |
| Food Preparation & Serving | 0 (0.0%) | 4 (100.0%) |
| Cleaning & Maintenance | 1 (100.0%) | 0 (0.0%) |
| Personal Care & Service | 4 (100.0%) | 0 (0.0%) |
| Total (Category) | 5 (55.6%) | 4 (44.4%) |
| Total (Overall) | 17 (28.8%) | 42 (71.2%) |
Sales and Office Occupations
The most common Sales and Office occupations in Tallulah Falls are Office & Administration (10 | 17.0%), and Sales & Related (5 | 8.5%).
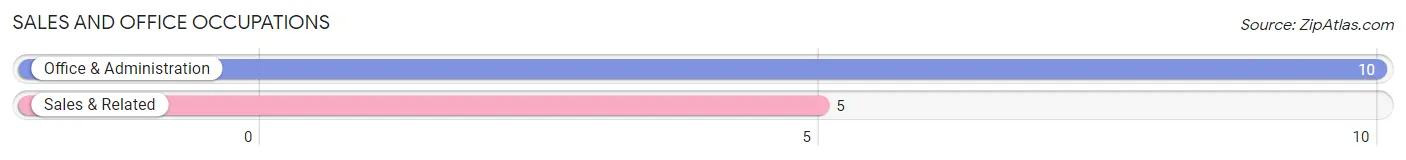
Sales and Office Occupations by Sex
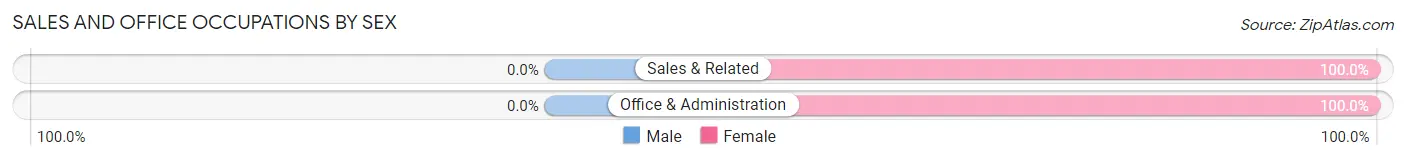
| Occupation | Male | Female |
| Sales & Related | 0 (0.0%) | 5 (100.0%) |
| Office & Administration | 0 (0.0%) | 10 (100.0%) |
| Total (Category) | 0 (0.0%) | 15 (100.0%) |
| Total (Overall) | 17 (28.8%) | 42 (71.2%) |
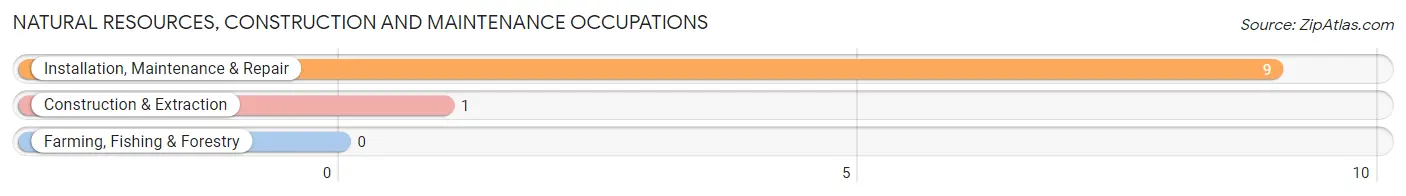
Natural Resources, Construction and Maintenance Occupations
The most common Natural Resources, Construction and Maintenance occupations in Tallulah Falls are Installation, Maintenance & Repair (9 | 15.2%), and Construction & Extraction (1 | 1.7%).
Natural Resources, Construction and Maintenance Occupations by Sex
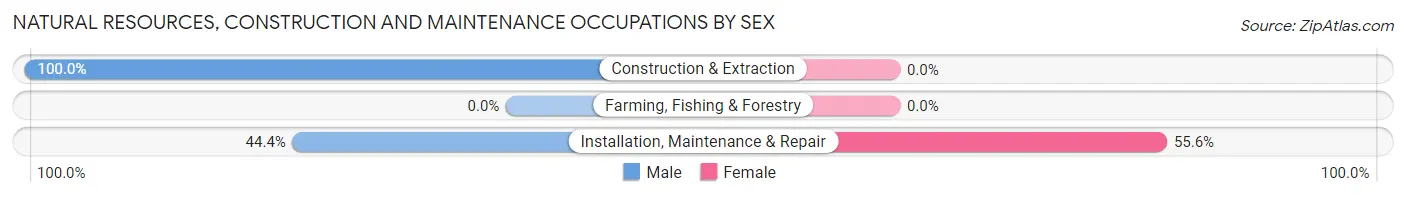
| Occupation | Male | Female |
| Farming, Fishing & Forestry | 0 (0.0%) | 0 (0.0%) |
| Construction & Extraction | 1 (100.0%) | 0 (0.0%) |
| Installation, Maintenance & Repair | 4 (44.4%) | 5 (55.6%) |
| Total (Category) | 5 (50.0%) | 5 (50.0%) |
| Total (Overall) | 17 (28.8%) | 42 (71.2%) |
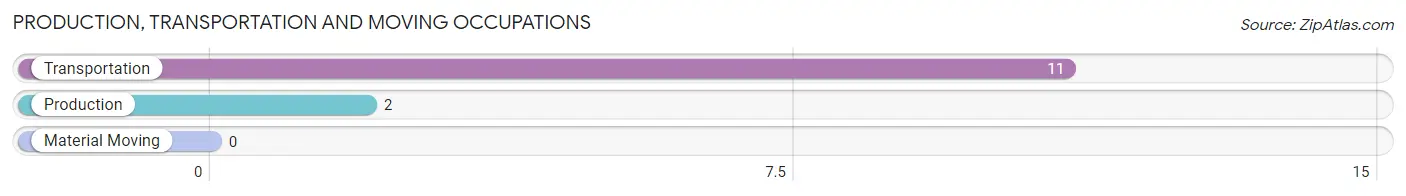
Production, Transportation and Moving Occupations
The most common Production, Transportation and Moving occupations in Tallulah Falls are Transportation (11 | 18.6%), and Production (2 | 3.4%).
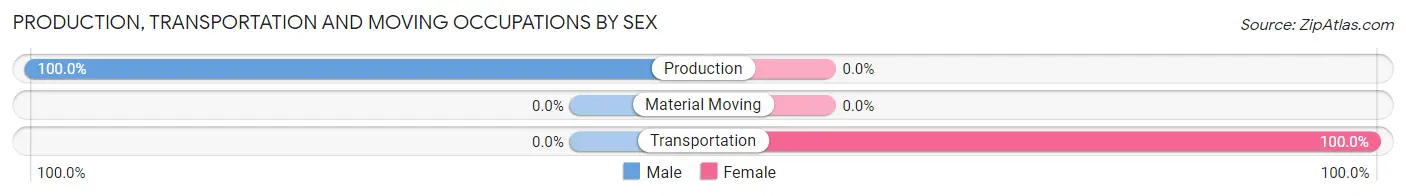
Production, Transportation and Moving Occupations by Sex
| Occupation | Male | Female |
| Production | 2 (100.0%) | 0 (0.0%) |
| Transportation | 0 (0.0%) | 11 (100.0%) |
| Material Moving | 0 (0.0%) | 0 (0.0%) |
| Total (Category) | 2 (15.4%) | 11 (84.6%) |
| Total (Overall) | 17 (28.8%) | 42 (71.2%) |
Employment Industries by Sex in Tallulah Falls
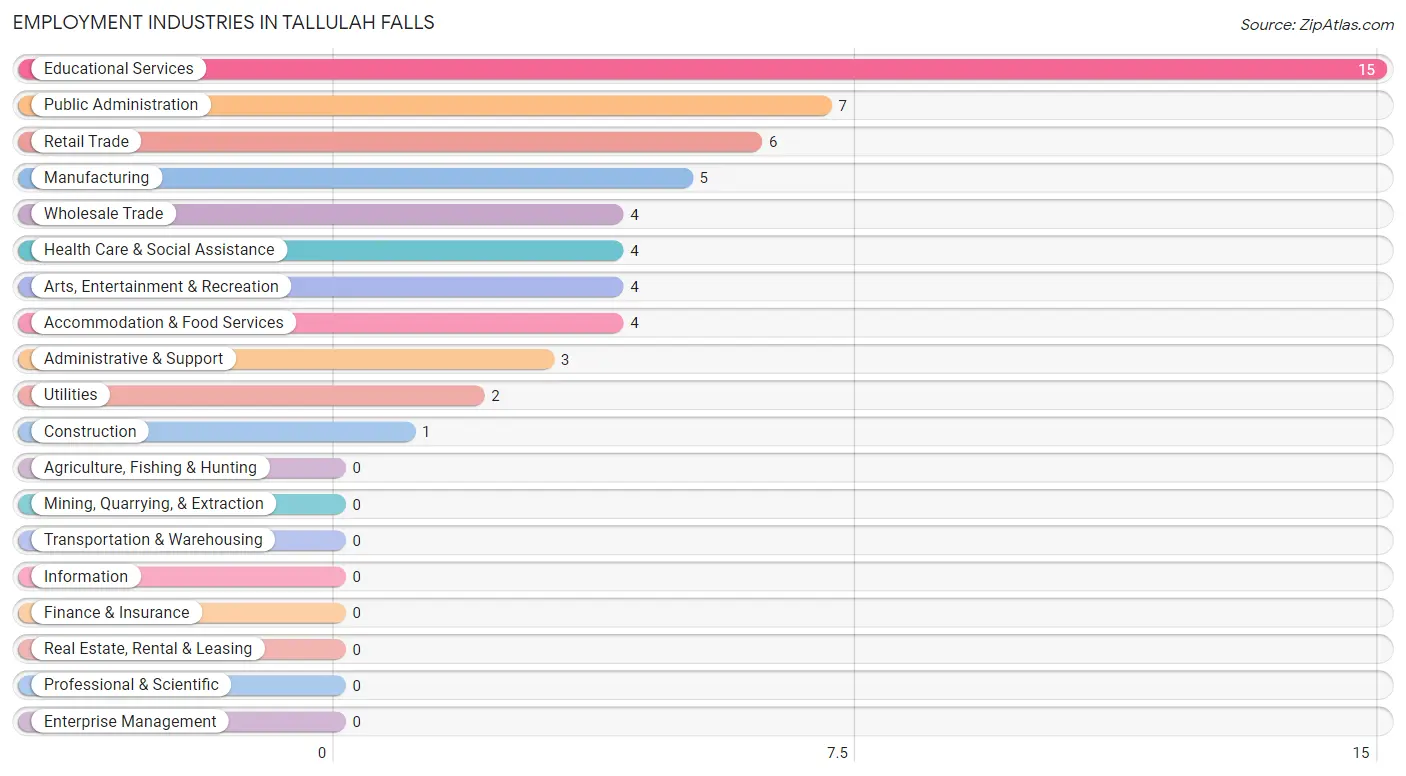
Employment Industries in Tallulah Falls
The major employment industries in Tallulah Falls include Educational Services (15 | 25.4%), Public Administration (7 | 11.9%), Retail Trade (6 | 10.2%), Manufacturing (5 | 8.5%), and Wholesale Trade (4 | 6.8%).
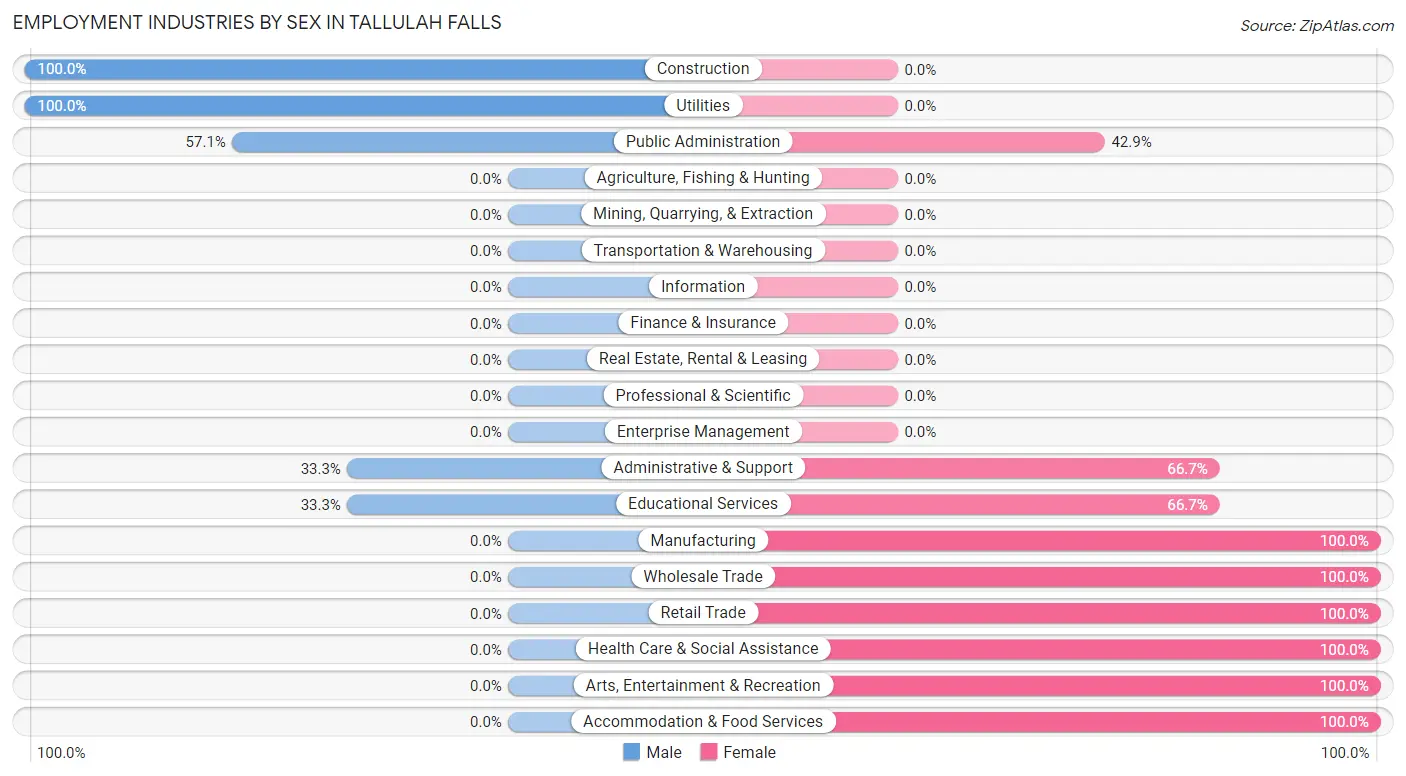
Employment Industries by Sex in Tallulah Falls
The Tallulah Falls industries that see more men than women are Construction (100.0%), Utilities (100.0%), and Public Administration (57.1%), whereas the industries that tend to have a higher number of women are Manufacturing (100.0%), Wholesale Trade (100.0%), and Retail Trade (100.0%).
| Industry | Male | Female |
| Agriculture, Fishing & Hunting | 0 (0.0%) | 0 (0.0%) |
| Mining, Quarrying, & Extraction | 0 (0.0%) | 0 (0.0%) |
| Construction | 1 (100.0%) | 0 (0.0%) |
| Manufacturing | 0 (0.0%) | 5 (100.0%) |
| Wholesale Trade | 0 (0.0%) | 4 (100.0%) |
| Retail Trade | 0 (0.0%) | 6 (100.0%) |
| Transportation & Warehousing | 0 (0.0%) | 0 (0.0%) |
| Utilities | 2 (100.0%) | 0 (0.0%) |
| Information | 0 (0.0%) | 0 (0.0%) |
| Finance & Insurance | 0 (0.0%) | 0 (0.0%) |
| Real Estate, Rental & Leasing | 0 (0.0%) | 0 (0.0%) |
| Professional & Scientific | 0 (0.0%) | 0 (0.0%) |
| Enterprise Management | 0 (0.0%) | 0 (0.0%) |
| Administrative & Support | 1 (33.3%) | 2 (66.7%) |
| Educational Services | 5 (33.3%) | 10 (66.7%) |
| Health Care & Social Assistance | 0 (0.0%) | 4 (100.0%) |
| Arts, Entertainment & Recreation | 0 (0.0%) | 4 (100.0%) |
| Accommodation & Food Services | 0 (0.0%) | 4 (100.0%) |
| Public Administration | 4 (57.1%) | 3 (42.9%) |
| Total | 17 (28.8%) | 42 (71.2%) |
Education in Tallulah Falls
School Enrollment in Tallulah Falls
The most common levels of schooling among the 141 students in Tallulah Falls are high school (79 | 56.0%), college / undergraduate (54 | 38.3%), and middle school (8 | 5.7%).
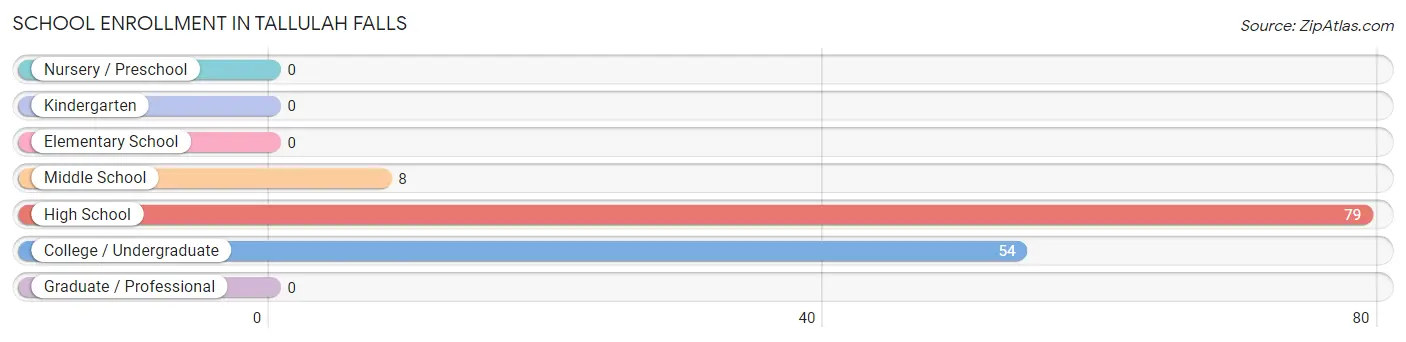
| School Level | # Students | % Students |
| Nursery / Preschool | 0 | 0.0% |
| Kindergarten | 0 | 0.0% |
| Elementary School | 0 | 0.0% |
| Middle School | 8 | 5.7% |
| High School | 79 | 56.0% |
| College / Undergraduate | 54 | 38.3% |
| Graduate / Professional | 0 | 0.0% |
| Total | 141 | 100.0% |
School Enrollment by Age by Funding Source in Tallulah Falls
Out of a total of 141 students who are enrolled in schools in Tallulah Falls, 72 (51.1%) attend a private institution, while the remaining 69 (48.9%) are enrolled in public schools. The age group of 10 to 14 year olds has the highest likelihood of being enrolled in private schools, with 8 (100.0% in the age bracket) enrolled. Conversely, the age group of 15 to 17 year olds has the lowest likelihood of being enrolled in a private school, with 66 (69.5% in the age bracket) attending a public institution.
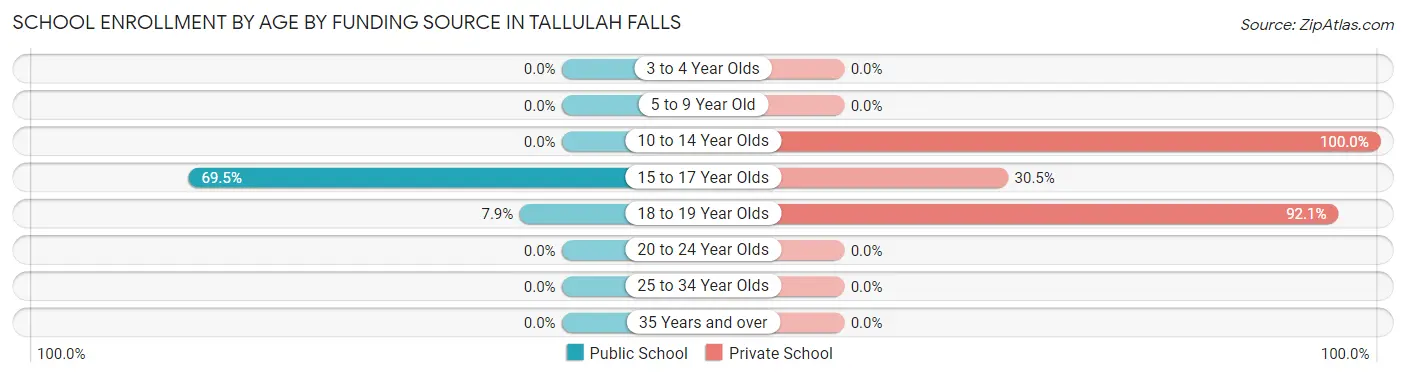
| Age Bracket | Public School | Private School |
| 3 to 4 Year Olds | 0 (0.0%) | 0 (0.0%) |
| 5 to 9 Year Old | 0 (0.0%) | 0 (0.0%) |
| 10 to 14 Year Olds | 0 (0.0%) | 8 (100.0%) |
| 15 to 17 Year Olds | 66 (69.5%) | 29 (30.5%) |
| 18 to 19 Year Olds | 3 (7.9%) | 35 (92.1%) |
| 20 to 24 Year Olds | 0 (0.0%) | 0 (0.0%) |
| 25 to 34 Year Olds | 0 (0.0%) | 0 (0.0%) |
| 35 Years and over | 0 (0.0%) | 0 (0.0%) |
| Total | 69 (48.9%) | 72 (51.1%) |
Educational Attainment by Field of Study in Tallulah Falls
Bio, nature & agricultural (4 | 14.3%), psychology (4 | 14.3%), engineering (4 | 14.3%), business (4 | 14.3%), and communications (4 | 14.3%) are the most common fields of study among 28 individuals in Tallulah Falls who have obtained a bachelor's degree or higher.
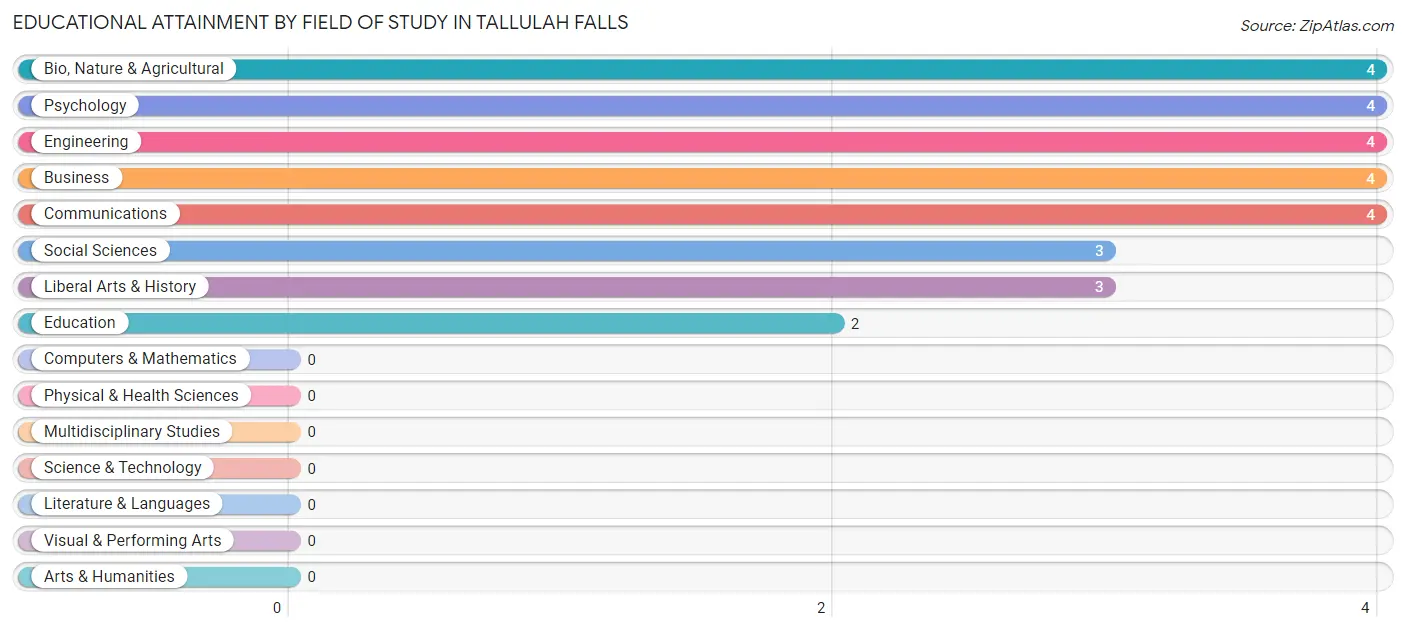
| Field of Study | # Graduates | % Graduates |
| Computers & Mathematics | 0 | 0.0% |
| Bio, Nature & Agricultural | 4 | 14.3% |
| Physical & Health Sciences | 0 | 0.0% |
| Psychology | 4 | 14.3% |
| Social Sciences | 3 | 10.7% |
| Engineering | 4 | 14.3% |
| Multidisciplinary Studies | 0 | 0.0% |
| Science & Technology | 0 | 0.0% |
| Business | 4 | 14.3% |
| Education | 2 | 7.1% |
| Literature & Languages | 0 | 0.0% |
| Liberal Arts & History | 3 | 10.7% |
| Visual & Performing Arts | 0 | 0.0% |
| Communications | 4 | 14.3% |
| Arts & Humanities | 0 | 0.0% |
| Total | 28 | 100.0% |
Transportation & Commute in Tallulah Falls
Vehicle Availability by Sex in Tallulah Falls
The most prevalent vehicle ownership categories in Tallulah Falls are males with 2 vehicles (12, accounting for 57.1%) and females with 2 vehicles (32, making up 32.4%).
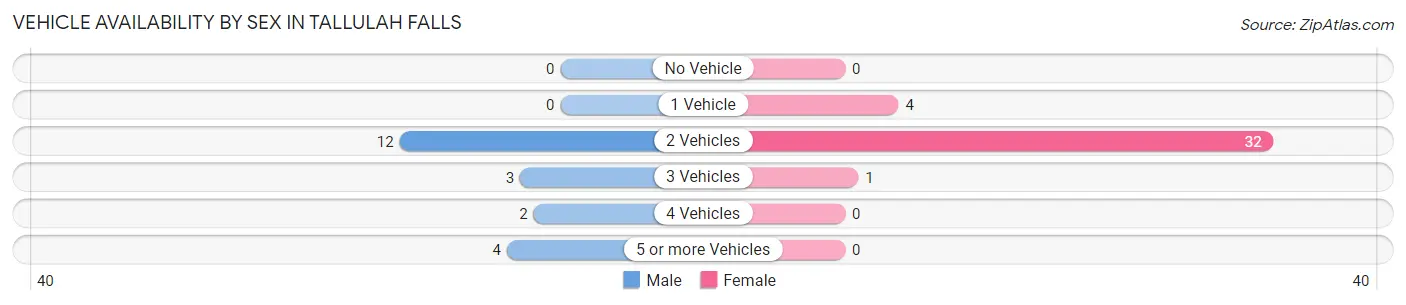
| Vehicles Available | Male | Female |
| No Vehicle | 0 (0.0%) | 0 (0.0%) |
| 1 Vehicle | 0 (0.0%) | 4 (10.8%) |
| 2 Vehicles | 12 (57.1%) | 32 (86.5%) |
| 3 Vehicles | 3 (14.3%) | 1 (2.7%) |
| 4 Vehicles | 2 (9.5%) | 0 (0.0%) |
| 5 or more Vehicles | 4 (19.1%) | 0 (0.0%) |
| Total | 21 (100.0%) | 37 (100.0%) |
Commute Time in Tallulah Falls
The most frequently occuring commute durations in Tallulah Falls are 10 to 14 minutes (19 commuters, 30.2%), less than 5 minutes (11 commuters, 17.5%), and 5 to 9 minutes (11 commuters, 17.5%).
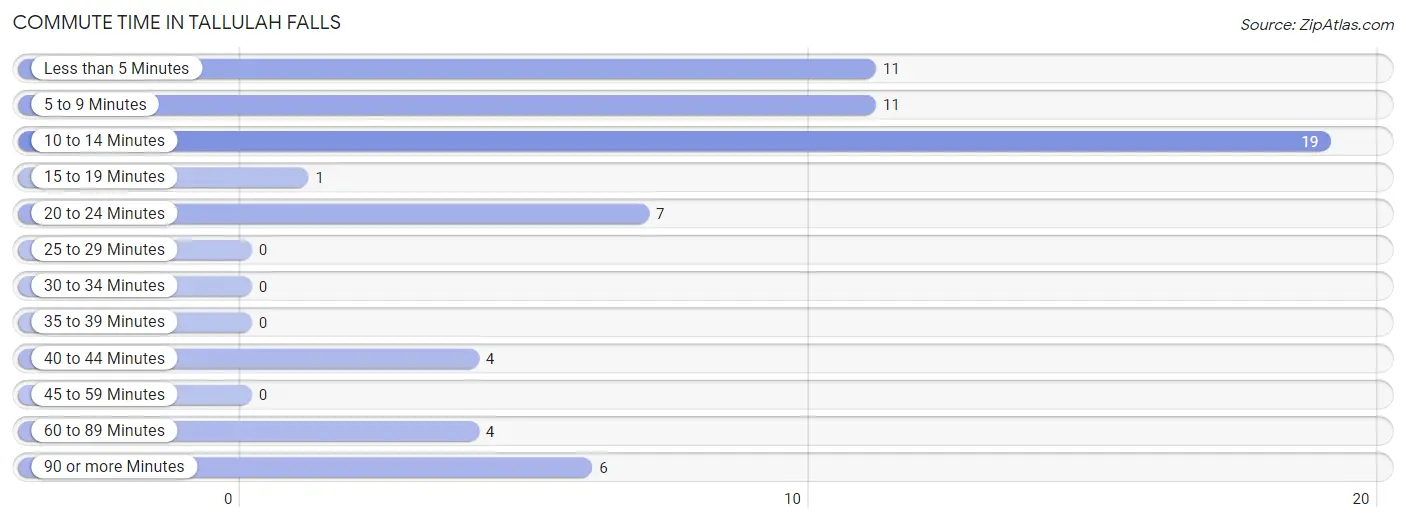
| Commute Time | # Commuters | % Commuters |
| Less than 5 Minutes | 11 | 17.5% |
| 5 to 9 Minutes | 11 | 17.5% |
| 10 to 14 Minutes | 19 | 30.2% |
| 15 to 19 Minutes | 1 | 1.6% |
| 20 to 24 Minutes | 7 | 11.1% |
| 25 to 29 Minutes | 0 | 0.0% |
| 30 to 34 Minutes | 0 | 0.0% |
| 35 to 39 Minutes | 0 | 0.0% |
| 40 to 44 Minutes | 4 | 6.4% |
| 45 to 59 Minutes | 0 | 0.0% |
| 60 to 89 Minutes | 4 | 6.4% |
| 90 or more Minutes | 6 | 9.5% |
Commute Time by Sex in Tallulah Falls
The most common commute times in Tallulah Falls are 10 to 14 minutes (7 commuters, 33.3%) for males and 10 to 14 minutes (12 commuters, 28.6%) for females.
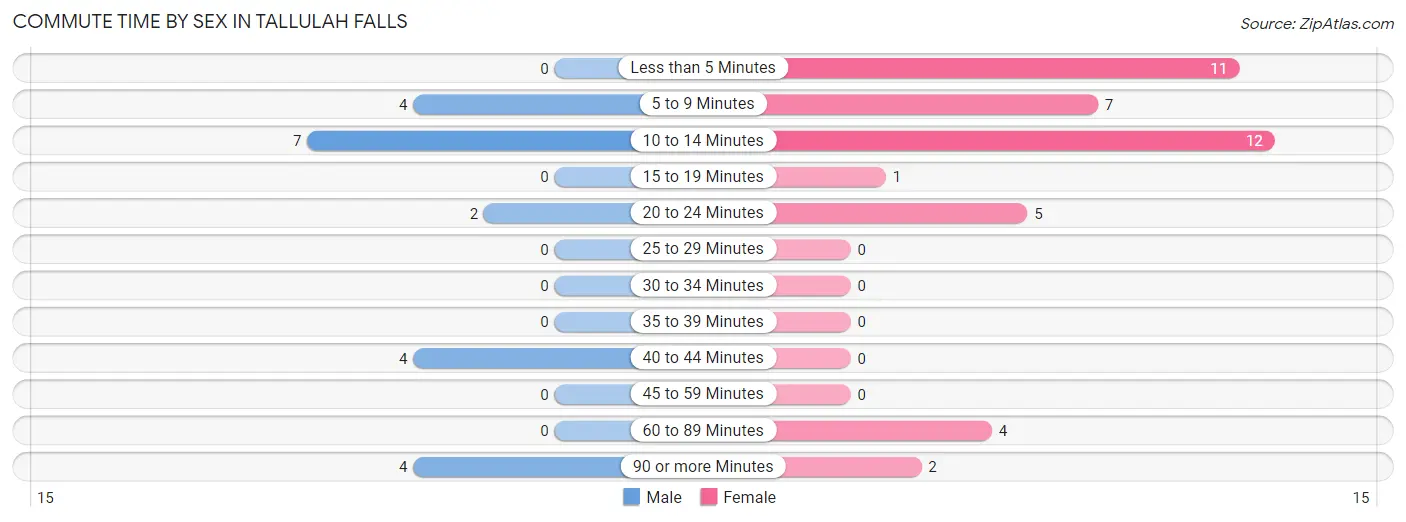
| Commute Time | Male | Female |
| Less than 5 Minutes | 0 (0.0%) | 11 (26.2%) |
| 5 to 9 Minutes | 4 (19.1%) | 7 (16.7%) |
| 10 to 14 Minutes | 7 (33.3%) | 12 (28.6%) |
| 15 to 19 Minutes | 0 (0.0%) | 1 (2.4%) |
| 20 to 24 Minutes | 2 (9.5%) | 5 (11.9%) |
| 25 to 29 Minutes | 0 (0.0%) | 0 (0.0%) |
| 30 to 34 Minutes | 0 (0.0%) | 0 (0.0%) |
| 35 to 39 Minutes | 0 (0.0%) | 0 (0.0%) |
| 40 to 44 Minutes | 4 (19.1%) | 0 (0.0%) |
| 45 to 59 Minutes | 0 (0.0%) | 0 (0.0%) |
| 60 to 89 Minutes | 0 (0.0%) | 4 (9.5%) |
| 90 or more Minutes | 4 (19.1%) | 2 (4.8%) |
Time of Departure to Work by Sex in Tallulah Falls
The most frequent times of departure to work in Tallulah Falls are 7:00 AM to 7:29 AM (7, 33.3%) for males and 7:30 AM to 7:59 AM (18, 42.9%) for females.
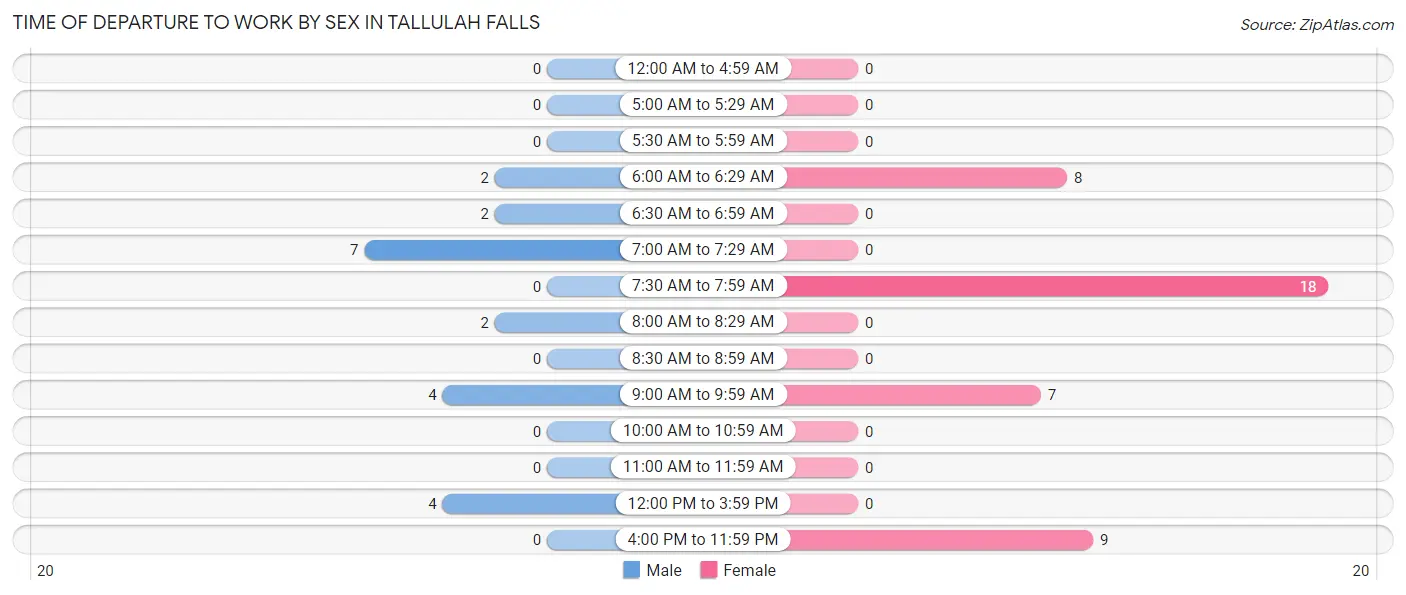
| Time of Departure | Male | Female |
| 12:00 AM to 4:59 AM | 0 (0.0%) | 0 (0.0%) |
| 5:00 AM to 5:29 AM | 0 (0.0%) | 0 (0.0%) |
| 5:30 AM to 5:59 AM | 0 (0.0%) | 0 (0.0%) |
| 6:00 AM to 6:29 AM | 2 (9.5%) | 8 (19.1%) |
| 6:30 AM to 6:59 AM | 2 (9.5%) | 0 (0.0%) |
| 7:00 AM to 7:29 AM | 7 (33.3%) | 0 (0.0%) |
| 7:30 AM to 7:59 AM | 0 (0.0%) | 18 (42.9%) |
| 8:00 AM to 8:29 AM | 2 (9.5%) | 0 (0.0%) |
| 8:30 AM to 8:59 AM | 0 (0.0%) | 0 (0.0%) |
| 9:00 AM to 9:59 AM | 4 (19.1%) | 7 (16.7%) |
| 10:00 AM to 10:59 AM | 0 (0.0%) | 0 (0.0%) |
| 11:00 AM to 11:59 AM | 0 (0.0%) | 0 (0.0%) |
| 12:00 PM to 3:59 PM | 4 (19.1%) | 0 (0.0%) |
| 4:00 PM to 11:59 PM | 0 (0.0%) | 9 (21.4%) |
| Total | 21 (100.0%) | 42 (100.0%) |
Housing Occupancy in Tallulah Falls
Occupancy by Ownership in Tallulah Falls
Of the total 52 dwellings in Tallulah Falls, owner-occupied units account for 26 (50.0%), while renter-occupied units make up 26 (50.0%).
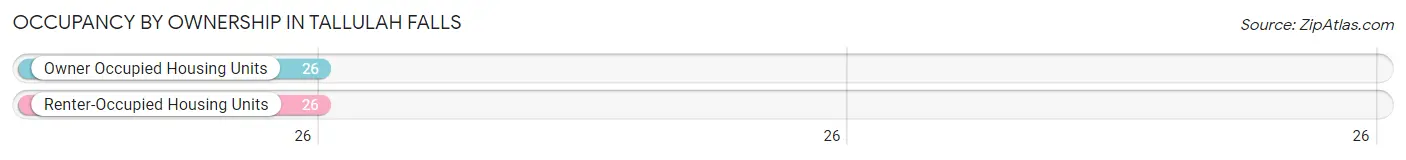
| Occupancy | # Housing Units | % Housing Units |
| Owner Occupied Housing Units | 26 | 50.0% |
| Renter-Occupied Housing Units | 26 | 50.0% |
| Total Occupied Housing Units | 52 | 100.0% |
Occupancy by Household Size in Tallulah Falls
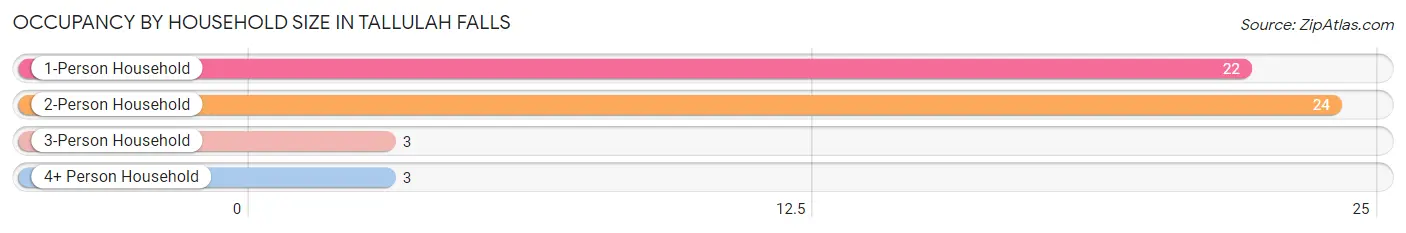
| Household Size | # Housing Units | % Housing Units |
| 1-Person Household | 22 | 42.3% |
| 2-Person Household | 24 | 46.2% |
| 3-Person Household | 3 | 5.8% |
| 4+ Person Household | 3 | 5.8% |
| Total Housing Units | 52 | 100.0% |
Occupancy by Ownership by Household Size in Tallulah Falls
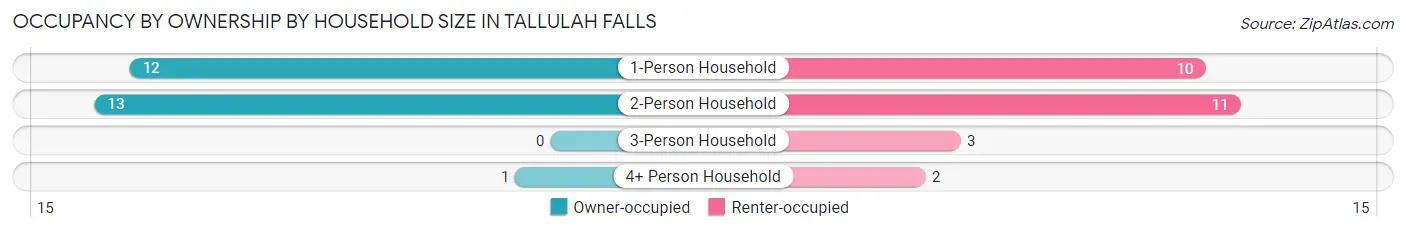
| Household Size | Owner-occupied | Renter-occupied |
| 1-Person Household | 12 (54.5%) | 10 (45.5%) |
| 2-Person Household | 13 (54.2%) | 11 (45.8%) |
| 3-Person Household | 0 (0.0%) | 3 (100.0%) |
| 4+ Person Household | 1 (33.3%) | 2 (66.7%) |
| Total Housing Units | 26 (50.0%) | 26 (50.0%) |
Occupancy by Educational Attainment in Tallulah Falls
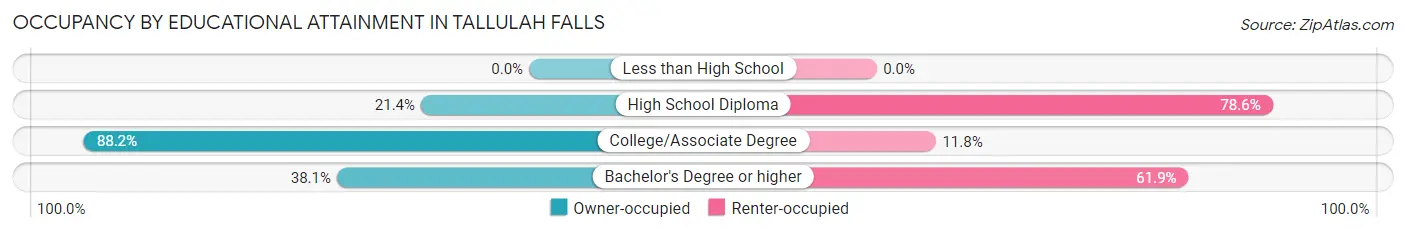
| Household Size | Owner-occupied | Renter-occupied |
| Less than High School | 0 (0.0%) | 0 (0.0%) |
| High School Diploma | 3 (21.4%) | 11 (78.6%) |
| College/Associate Degree | 15 (88.2%) | 2 (11.8%) |
| Bachelor's Degree or higher | 8 (38.1%) | 13 (61.9%) |
Occupancy by Age of Householder in Tallulah Falls
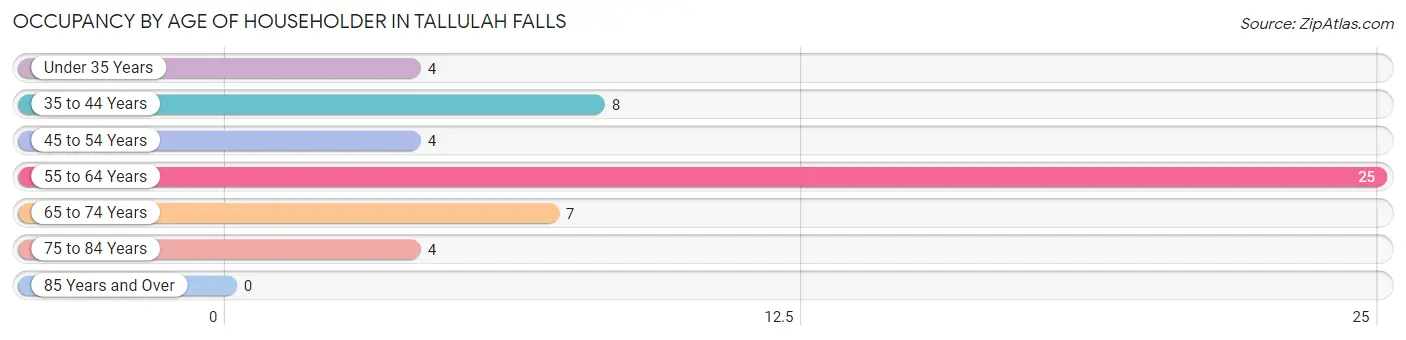
| Age Bracket | # Households | % Households |
| Under 35 Years | 4 | 7.7% |
| 35 to 44 Years | 8 | 15.4% |
| 45 to 54 Years | 4 | 7.7% |
| 55 to 64 Years | 25 | 48.1% |
| 65 to 74 Years | 7 | 13.5% |
| 75 to 84 Years | 4 | 7.7% |
| 85 Years and Over | 0 | 0.0% |
| Total | 52 | 100.0% |
Housing Finances in Tallulah Falls
Median Income by Occupancy in Tallulah Falls
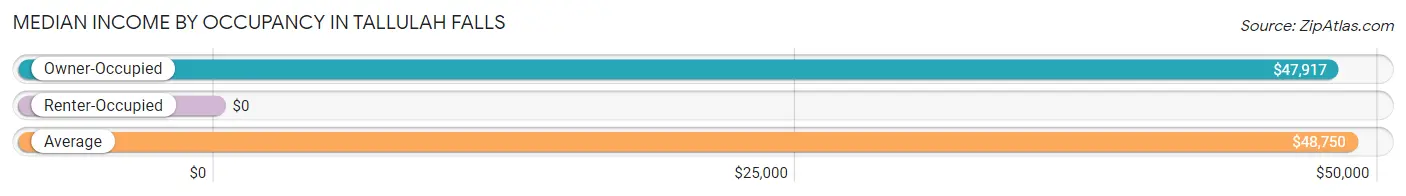
| Occupancy Type | # Households | Median Income |
| Owner-Occupied | 26 (50.0%) | $47,917 |
| Renter-Occupied | 26 (50.0%) | $0 |
| Average | 52 (100.0%) | $48,750 |
Occupancy by Householder Income Bracket in Tallulah Falls
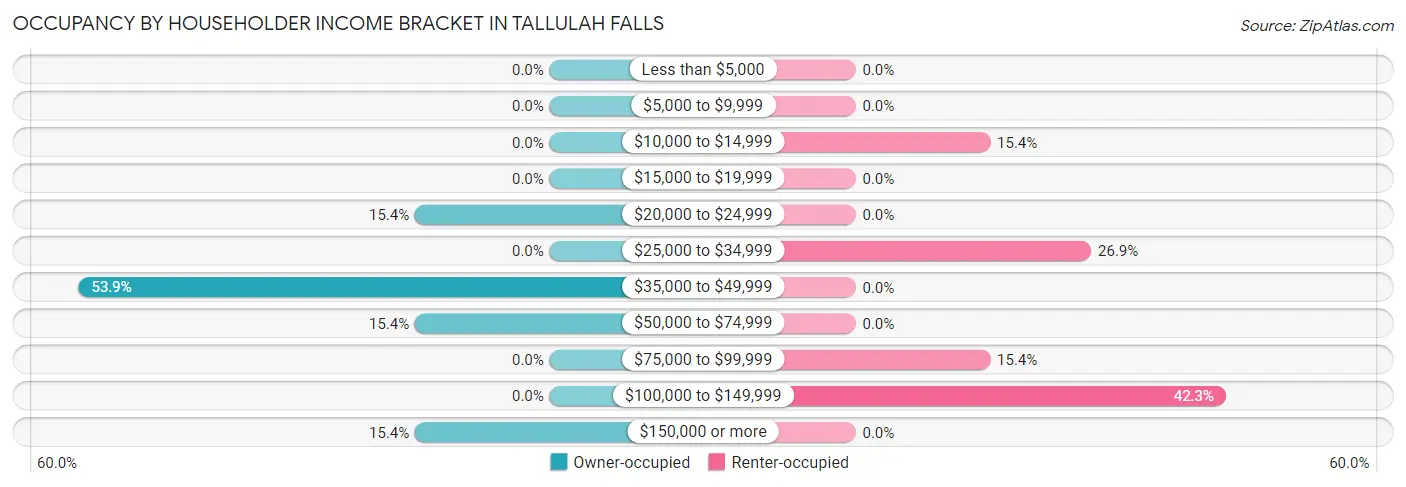
| Income Bracket | Owner-occupied | Renter-occupied |
| Less than $5,000 | 0 (0.0%) | 0 (0.0%) |
| $5,000 to $9,999 | 0 (0.0%) | 0 (0.0%) |
| $10,000 to $14,999 | 0 (0.0%) | 4 (15.4%) |
| $15,000 to $19,999 | 0 (0.0%) | 0 (0.0%) |
| $20,000 to $24,999 | 4 (15.4%) | 0 (0.0%) |
| $25,000 to $34,999 | 0 (0.0%) | 7 (26.9%) |
| $35,000 to $49,999 | 14 (53.8%) | 0 (0.0%) |
| $50,000 to $74,999 | 4 (15.4%) | 0 (0.0%) |
| $75,000 to $99,999 | 0 (0.0%) | 4 (15.4%) |
| $100,000 to $149,999 | 0 (0.0%) | 11 (42.3%) |
| $150,000 or more | 4 (15.4%) | 0 (0.0%) |
| Total | 26 (100.0%) | 26 (100.0%) |
Monthly Housing Cost Tiers in Tallulah Falls
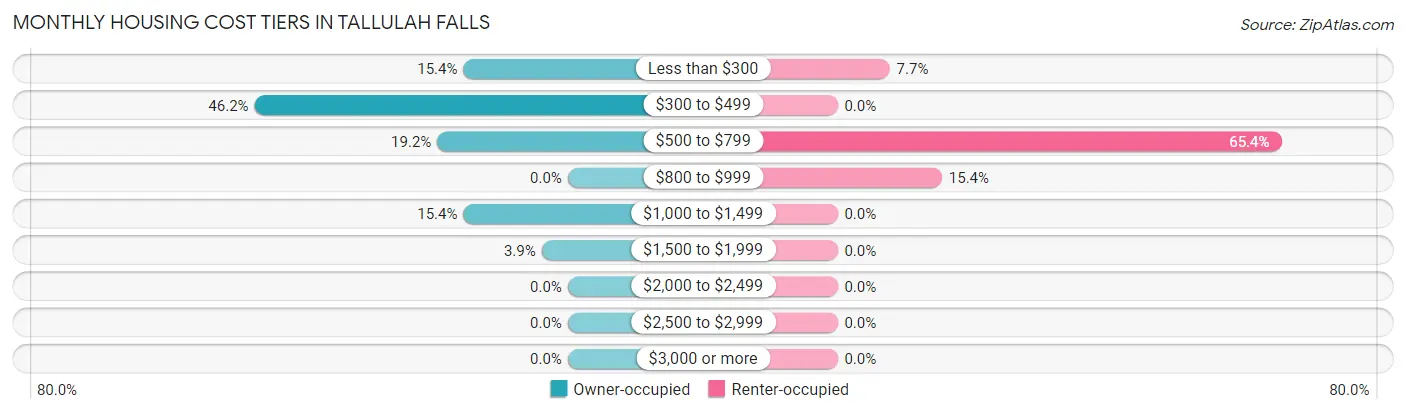
| Monthly Cost | Owner-occupied | Renter-occupied |
| Less than $300 | 4 (15.4%) | 2 (7.7%) |
| $300 to $499 | 12 (46.2%) | 0 (0.0%) |
| $500 to $799 | 5 (19.2%) | 17 (65.4%) |
| $800 to $999 | 0 (0.0%) | 4 (15.4%) |
| $1,000 to $1,499 | 4 (15.4%) | 0 (0.0%) |
| $1,500 to $1,999 | 1 (3.8%) | 0 (0.0%) |
| $2,000 to $2,499 | 0 (0.0%) | 0 (0.0%) |
| $2,500 to $2,999 | 0 (0.0%) | 0 (0.0%) |
| $3,000 or more | 0 (0.0%) | 0 (0.0%) |
| Total | 26 (100.0%) | 26 (100.0%) |
Physical Housing Characteristics in Tallulah Falls
Housing Structures in Tallulah Falls
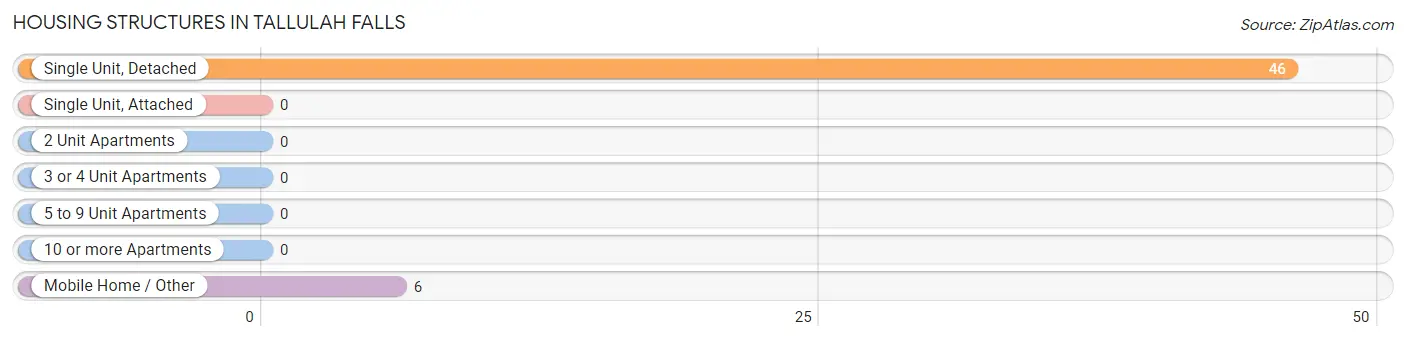
| Structure Type | # Housing Units | % Housing Units |
| Single Unit, Detached | 46 | 88.5% |
| Single Unit, Attached | 0 | 0.0% |
| 2 Unit Apartments | 0 | 0.0% |
| 3 or 4 Unit Apartments | 0 | 0.0% |
| 5 to 9 Unit Apartments | 0 | 0.0% |
| 10 or more Apartments | 0 | 0.0% |
| Mobile Home / Other | 6 | 11.5% |
| Total | 52 | 100.0% |
Housing Structures by Occupancy in Tallulah Falls
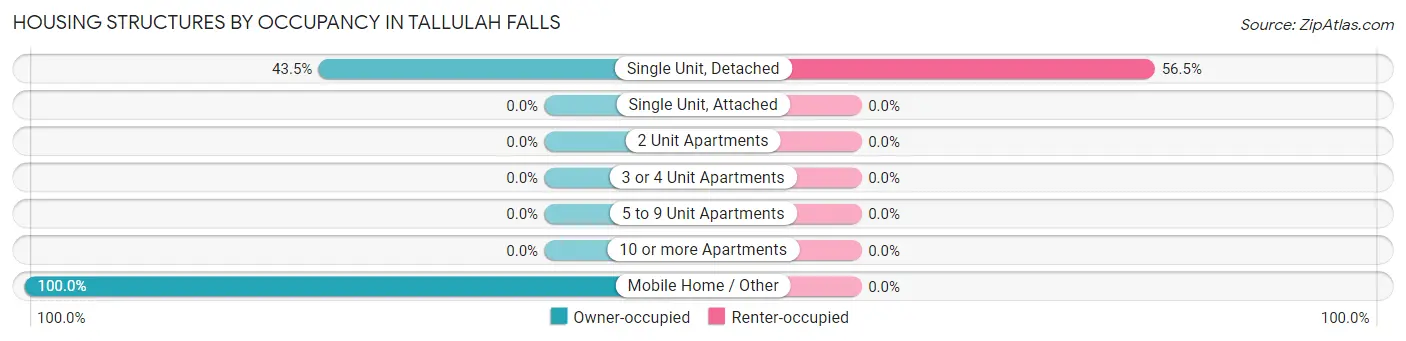
| Structure Type | Owner-occupied | Renter-occupied |
| Single Unit, Detached | 20 (43.5%) | 26 (56.5%) |
| Single Unit, Attached | 0 (0.0%) | 0 (0.0%) |
| 2 Unit Apartments | 0 (0.0%) | 0 (0.0%) |
| 3 or 4 Unit Apartments | 0 (0.0%) | 0 (0.0%) |
| 5 to 9 Unit Apartments | 0 (0.0%) | 0 (0.0%) |
| 10 or more Apartments | 0 (0.0%) | 0 (0.0%) |
| Mobile Home / Other | 6 (100.0%) | 0 (0.0%) |
| Total | 26 (50.0%) | 26 (50.0%) |
Housing Structures by Number of Rooms in Tallulah Falls
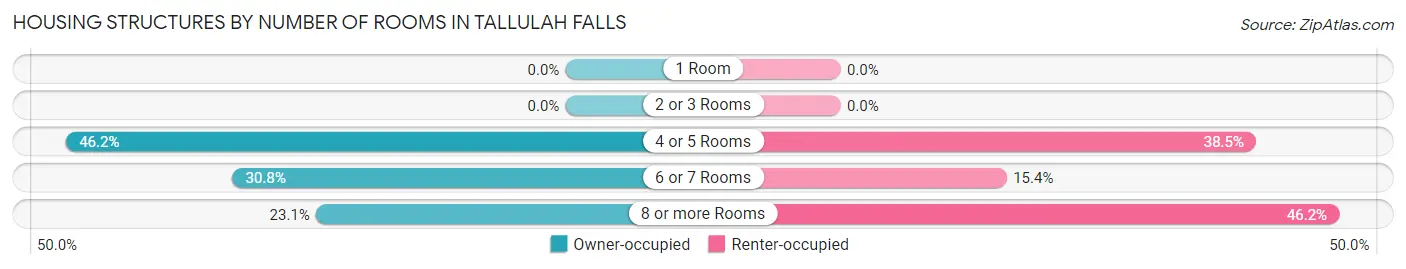
| Number of Rooms | Owner-occupied | Renter-occupied |
| 1 Room | 0 (0.0%) | 0 (0.0%) |
| 2 or 3 Rooms | 0 (0.0%) | 0 (0.0%) |
| 4 or 5 Rooms | 12 (46.2%) | 10 (38.5%) |
| 6 or 7 Rooms | 8 (30.8%) | 4 (15.4%) |
| 8 or more Rooms | 6 (23.1%) | 12 (46.2%) |
| Total | 26 (100.0%) | 26 (100.0%) |
Housing Structure by Heating Type in Tallulah Falls

| Heating Type | Owner-occupied | Renter-occupied |
| Utility Gas | 0 (0.0%) | 11 (42.3%) |
| Bottled, Tank, or LP Gas | 8 (30.8%) | 0 (0.0%) |
| Electricity | 18 (69.2%) | 13 (50.0%) |
| Fuel Oil or Kerosene | 0 (0.0%) | 2 (7.7%) |
| Coal or Coke | 0 (0.0%) | 0 (0.0%) |
| All other Fuels | 0 (0.0%) | 0 (0.0%) |
| No Fuel Used | 0 (0.0%) | 0 (0.0%) |
| Total | 26 (100.0%) | 26 (100.0%) |
Household Vehicle Usage in Tallulah Falls
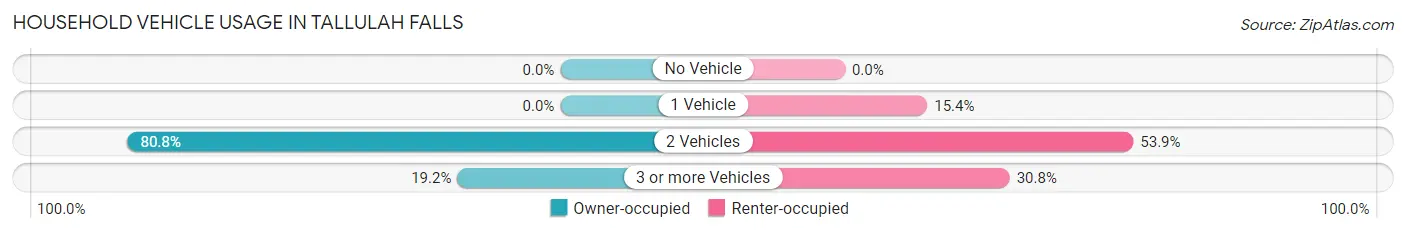
| Vehicles per Household | Owner-occupied | Renter-occupied |
| No Vehicle | 0 (0.0%) | 0 (0.0%) |
| 1 Vehicle | 0 (0.0%) | 4 (15.4%) |
| 2 Vehicles | 21 (80.8%) | 14 (53.8%) |
| 3 or more Vehicles | 5 (19.2%) | 8 (30.8%) |
| Total | 26 (100.0%) | 26 (100.0%) |
Real Estate & Mortgages in Tallulah Falls
Real Estate and Mortgage Overview in Tallulah Falls
| Characteristic | Without Mortgage | With Mortgage |
| Housing Units | 21 | 5 |
| Median Property Value | $173,200 | $0 |
| Median Household Income | $44,063 | $1 |
| Monthly Housing Costs | $454 | $0 |
| Real Estate Taxes | $1,281 | $0 |
Property Value by Mortgage Status in Tallulah Falls
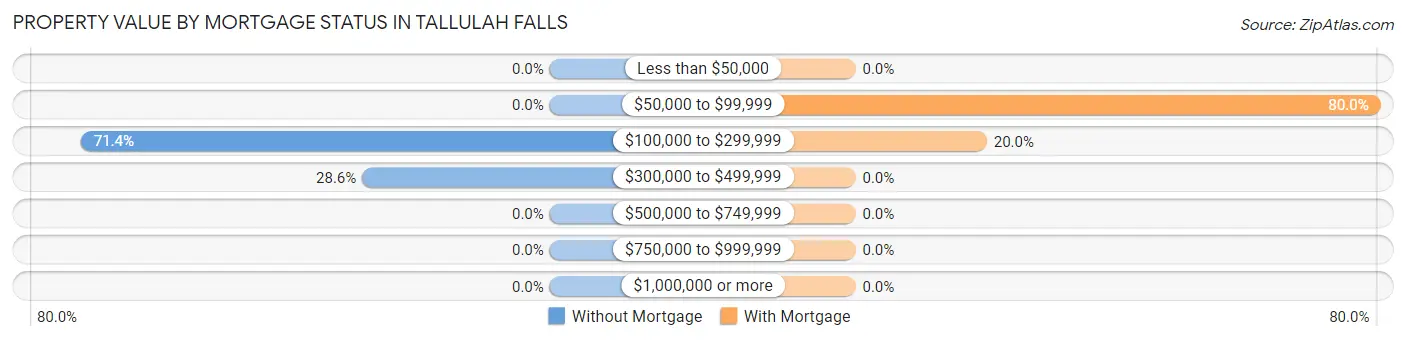
| Property Value | Without Mortgage | With Mortgage |
| Less than $50,000 | 0 (0.0%) | 0 (0.0%) |
| $50,000 to $99,999 | 0 (0.0%) | 4 (80.0%) |
| $100,000 to $299,999 | 15 (71.4%) | 1 (20.0%) |
| $300,000 to $499,999 | 6 (28.6%) | 0 (0.0%) |
| $500,000 to $749,999 | 0 (0.0%) | 0 (0.0%) |
| $750,000 to $999,999 | 0 (0.0%) | 0 (0.0%) |
| $1,000,000 or more | 0 (0.0%) | 0 (0.0%) |
| Total | 21 (100.0%) | 5 (100.0%) |
Household Income by Mortgage Status in Tallulah Falls
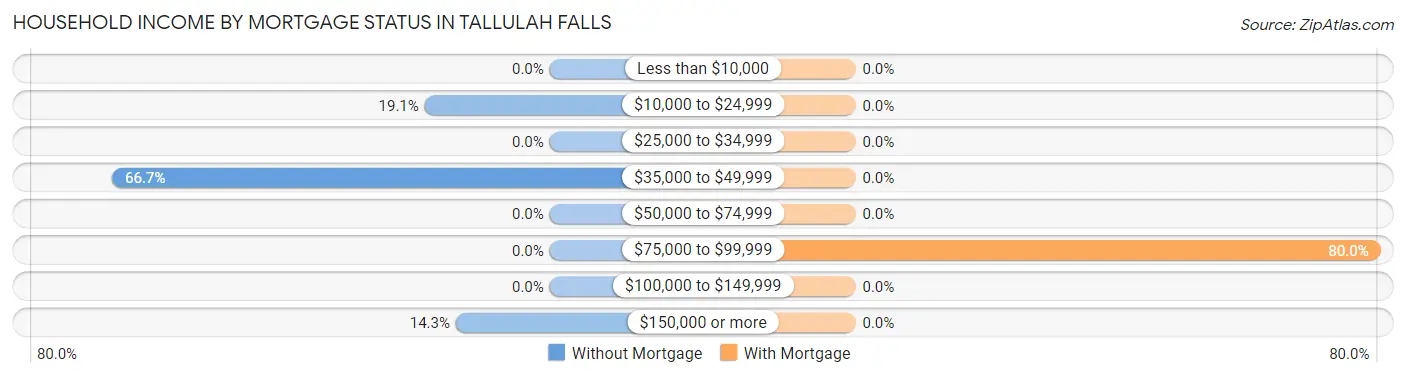
| Household Income | Without Mortgage | With Mortgage |
| Less than $10,000 | 0 (0.0%) | 0 (0.0%) |
| $10,000 to $24,999 | 4 (19.1%) | 0 (0.0%) |
| $25,000 to $34,999 | 0 (0.0%) | 0 (0.0%) |
| $35,000 to $49,999 | 14 (66.7%) | 0 (0.0%) |
| $50,000 to $74,999 | 0 (0.0%) | 0 (0.0%) |
| $75,000 to $99,999 | 0 (0.0%) | 4 (80.0%) |
| $100,000 to $149,999 | 0 (0.0%) | 0 (0.0%) |
| $150,000 or more | 3 (14.3%) | 0 (0.0%) |
| Total | 21 (100.0%) | 5 (100.0%) |
Property Value to Household Income Ratio in Tallulah Falls
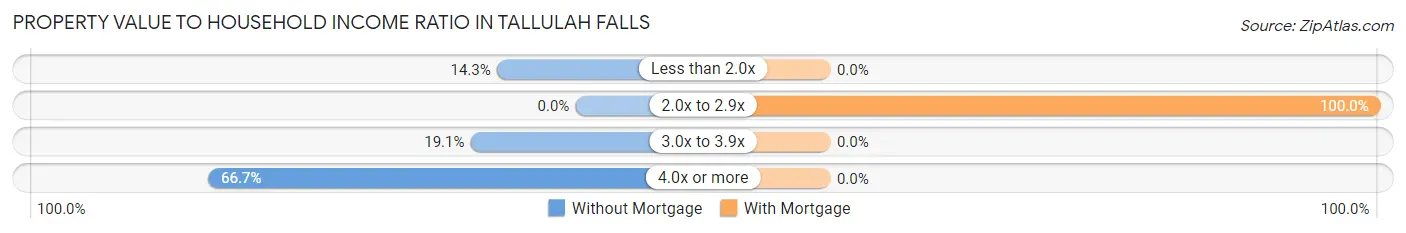
| Value-to-Income Ratio | Without Mortgage | With Mortgage |
| Less than 2.0x | 3 (14.3%) | 0 (0.0%) |
| 2.0x to 2.9x | 0 (0.0%) | 5 (100.0%) |
| 3.0x to 3.9x | 4 (19.1%) | 0 (0.0%) |
| 4.0x or more | 14 (66.7%) | 0 (0.0%) |
| Total | 21 (100.0%) | 5 (100.0%) |
Real Estate Taxes by Mortgage Status in Tallulah Falls
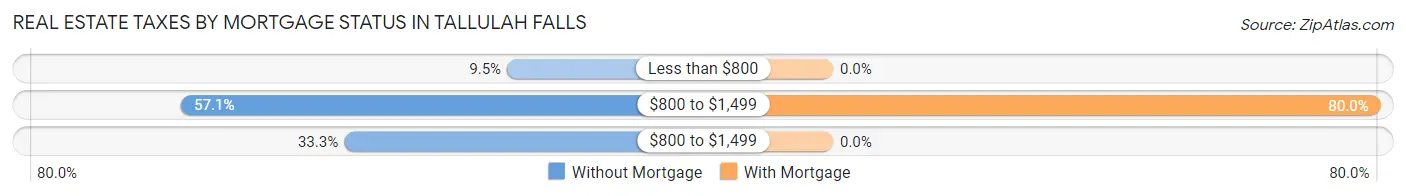
| Property Taxes | Without Mortgage | With Mortgage |
| Less than $800 | 2 (9.5%) | 0 (0.0%) |
| $800 to $1,499 | 12 (57.1%) | 4 (80.0%) |
| $800 to $1,499 | 7 (33.3%) | 0 (0.0%) |
| Total | 21 (100.0%) | 5 (100.0%) |
Health & Disability in Tallulah Falls
Health Insurance Coverage by Age in Tallulah Falls
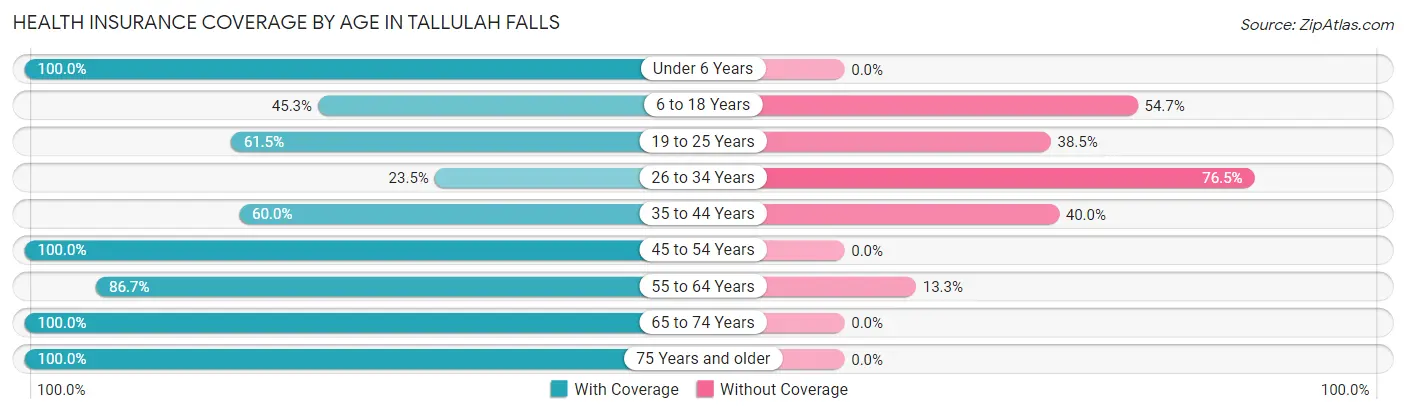
| Age Bracket | With Coverage | Without Coverage |
| Under 6 Years | 5 (100.0%) | 0 (0.0%) |
| 6 to 18 Years | 58 (45.3%) | 70 (54.7%) |
| 19 to 25 Years | 8 (61.5%) | 5 (38.5%) |
| 26 to 34 Years | 4 (23.5%) | 13 (76.5%) |
| 35 to 44 Years | 3 (60.0%) | 2 (40.0%) |
| 45 to 54 Years | 16 (100.0%) | 0 (0.0%) |
| 55 to 64 Years | 26 (86.7%) | 4 (13.3%) |
| 65 to 74 Years | 14 (100.0%) | 0 (0.0%) |
| 75 Years and older | 4 (100.0%) | 0 (0.0%) |
| Total | 138 (59.5%) | 94 (40.5%) |
Health Insurance Coverage by Citizenship Status in Tallulah Falls
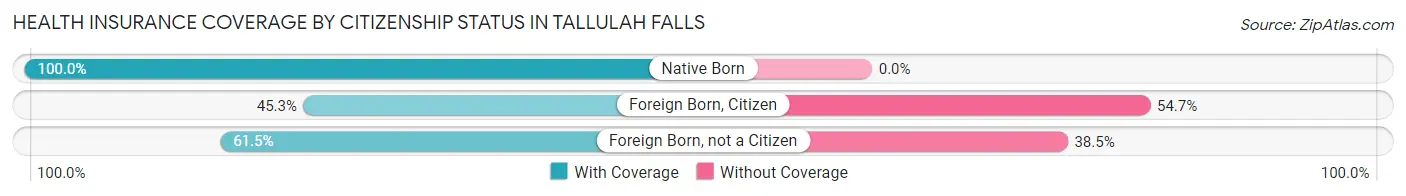
| Citizenship Status | With Coverage | Without Coverage |
| Native Born | 5 (100.0%) | 0 (0.0%) |
| Foreign Born, Citizen | 58 (45.3%) | 70 (54.7%) |
| Foreign Born, not a Citizen | 8 (61.5%) | 5 (38.5%) |
Health Insurance Coverage by Household Income in Tallulah Falls
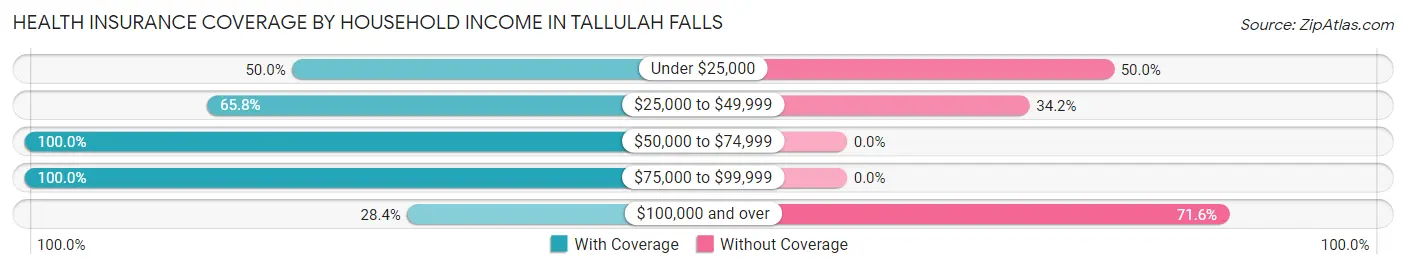
| Household Income | With Coverage | Without Coverage |
| Under $25,000 | 4 (50.0%) | 4 (50.0%) |
| $25,000 to $49,999 | 25 (65.8%) | 13 (34.2%) |
| $50,000 to $74,999 | 8 (100.0%) | 0 (0.0%) |
| $75,000 to $99,999 | 29 (100.0%) | 0 (0.0%) |
| $100,000 and over | 27 (28.4%) | 68 (71.6%) |
Public vs Private Health Insurance Coverage by Age in Tallulah Falls
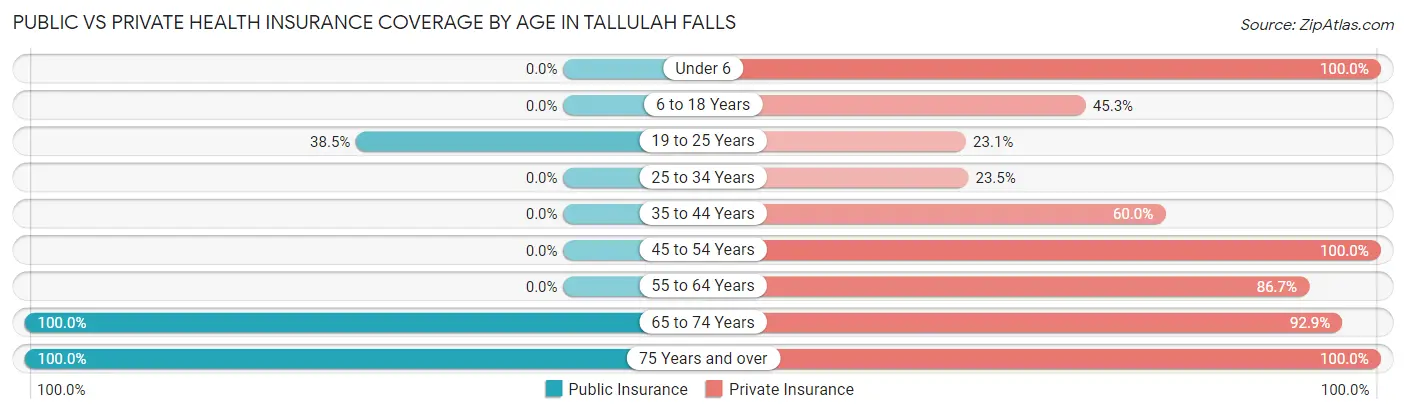
| Age Bracket | Public Insurance | Private Insurance |
| Under 6 | 0 (0.0%) | 5 (100.0%) |
| 6 to 18 Years | 0 (0.0%) | 58 (45.3%) |
| 19 to 25 Years | 5 (38.5%) | 3 (23.1%) |
| 25 to 34 Years | 0 (0.0%) | 4 (23.5%) |
| 35 to 44 Years | 0 (0.0%) | 3 (60.0%) |
| 45 to 54 Years | 0 (0.0%) | 16 (100.0%) |
| 55 to 64 Years | 0 (0.0%) | 26 (86.7%) |
| 65 to 74 Years | 14 (100.0%) | 13 (92.9%) |
| 75 Years and over | 4 (100.0%) | 4 (100.0%) |
| Total | 23 (9.9%) | 132 (56.9%) |
Disability Status by Sex by Age in Tallulah Falls
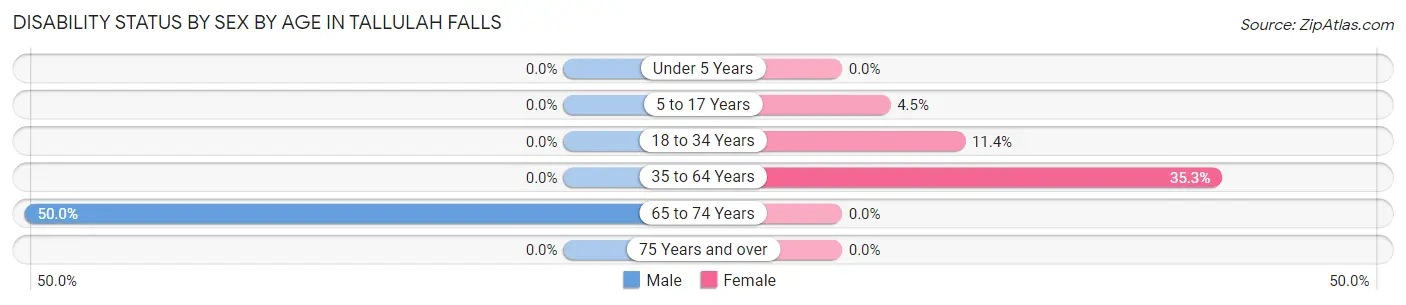
| Age Bracket | Male | Female |
| Under 5 Years | 0 (0.0%) | 0 (0.0%) |
| 5 to 17 Years | 0 (0.0%) | 4 (4.5%) |
| 18 to 34 Years | 0 (0.0%) | 4 (11.4%) |
| 35 to 64 Years | 0 (0.0%) | 12 (35.3%) |
| 65 to 74 Years | 4 (50.0%) | 0 (0.0%) |
| 75 Years and over | 0 (0.0%) | 0 (0.0%) |
Disability Class by Sex by Age in Tallulah Falls
Disability Class: Hearing Difficulty
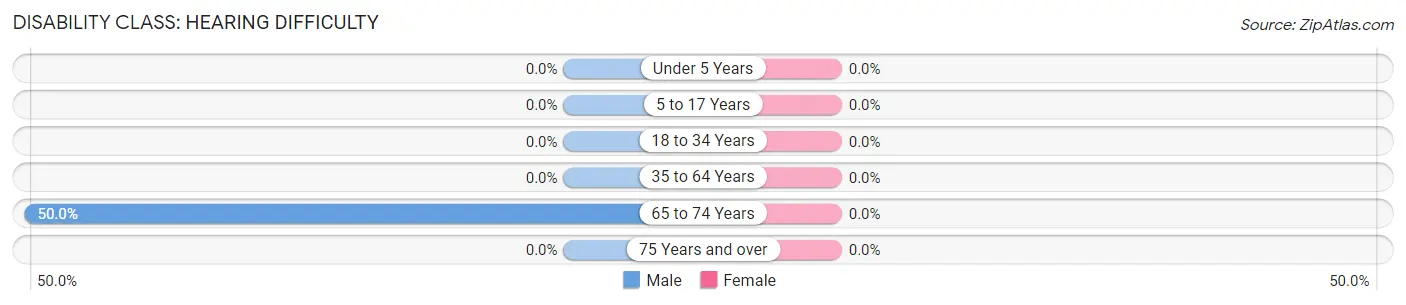
| Age Bracket | Male | Female |
| Under 5 Years | 0 (0.0%) | 0 (0.0%) |
| 5 to 17 Years | 0 (0.0%) | 0 (0.0%) |
| 18 to 34 Years | 0 (0.0%) | 0 (0.0%) |
| 35 to 64 Years | 0 (0.0%) | 0 (0.0%) |
| 65 to 74 Years | 4 (50.0%) | 0 (0.0%) |
| 75 Years and over | 0 (0.0%) | 0 (0.0%) |
Disability Class: Vision Difficulty
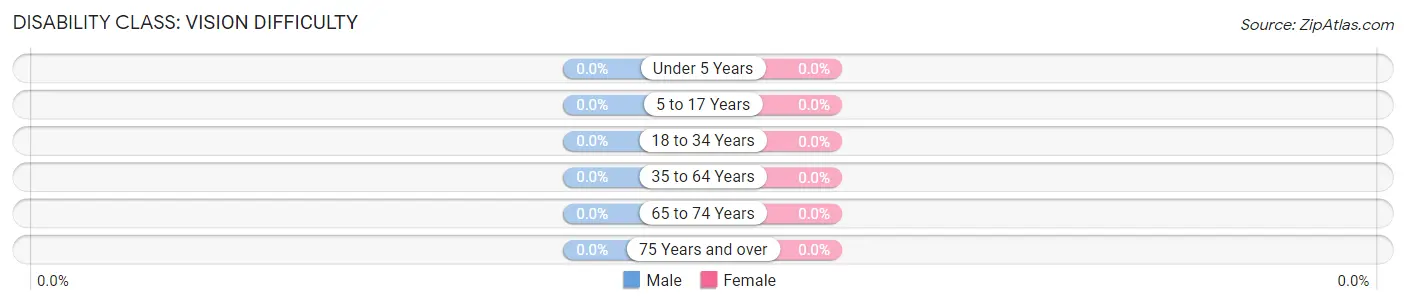
| Age Bracket | Male | Female |
| Under 5 Years | 0 (0.0%) | 0 (0.0%) |
| 5 to 17 Years | 0 (0.0%) | 0 (0.0%) |
| 18 to 34 Years | 0 (0.0%) | 0 (0.0%) |
| 35 to 64 Years | 0 (0.0%) | 0 (0.0%) |
| 65 to 74 Years | 0 (0.0%) | 0 (0.0%) |
| 75 Years and over | 0 (0.0%) | 0 (0.0%) |
Disability Class: Cognitive Difficulty
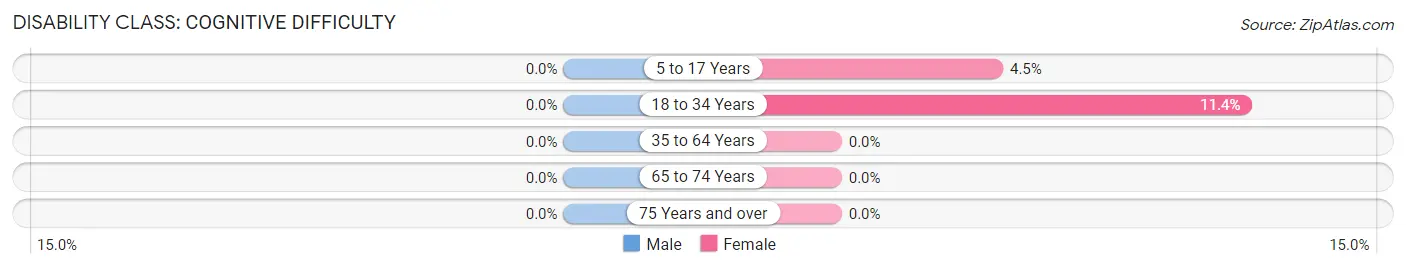
| Age Bracket | Male | Female |
| 5 to 17 Years | 0 (0.0%) | 4 (4.5%) |
| 18 to 34 Years | 0 (0.0%) | 4 (11.4%) |
| 35 to 64 Years | 0 (0.0%) | 0 (0.0%) |
| 65 to 74 Years | 0 (0.0%) | 0 (0.0%) |
| 75 Years and over | 0 (0.0%) | 0 (0.0%) |
Disability Class: Ambulatory Difficulty
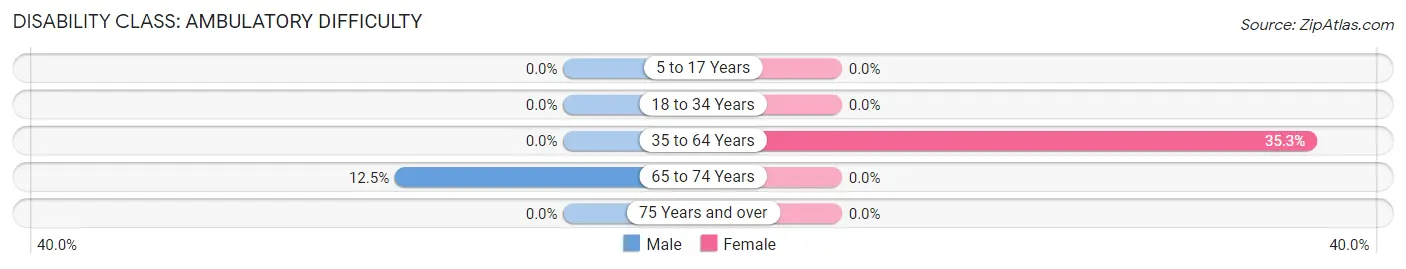
| Age Bracket | Male | Female |
| 5 to 17 Years | 0 (0.0%) | 0 (0.0%) |
| 18 to 34 Years | 0 (0.0%) | 0 (0.0%) |
| 35 to 64 Years | 0 (0.0%) | 12 (35.3%) |
| 65 to 74 Years | 1 (12.5%) | 0 (0.0%) |
| 75 Years and over | 0 (0.0%) | 0 (0.0%) |
Disability Class: Self-Care Difficulty
| Age Bracket | Male | Female |
| 5 to 17 Years | 0 (0.0%) | 0 (0.0%) |
| 18 to 34 Years | 0 (0.0%) | 0 (0.0%) |
| 35 to 64 Years | 0 (0.0%) | 0 (0.0%) |
| 65 to 74 Years | 0 (0.0%) | 0 (0.0%) |
| 75 Years and over | 0 (0.0%) | 0 (0.0%) |
Technology Access in Tallulah Falls
Computing Device Access in Tallulah Falls
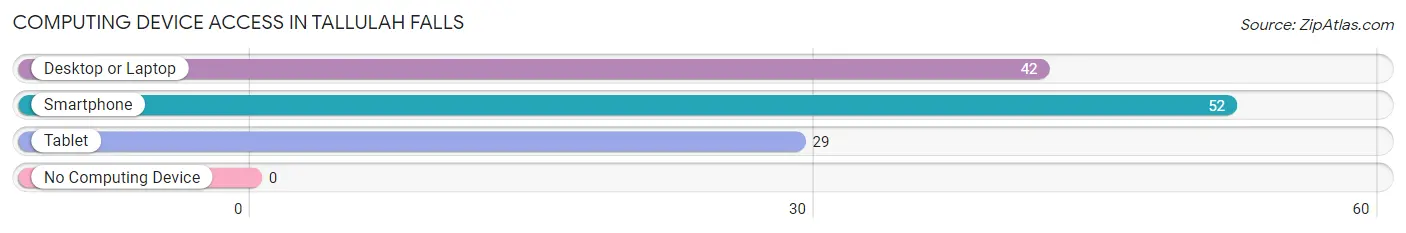
| Device Type | # Households | % Households |
| Desktop or Laptop | 42 | 80.8% |
| Smartphone | 52 | 100.0% |
| Tablet | 29 | 55.8% |
| No Computing Device | 0 | 0.0% |
| Total | 52 | 100.0% |
Internet Access in Tallulah Falls
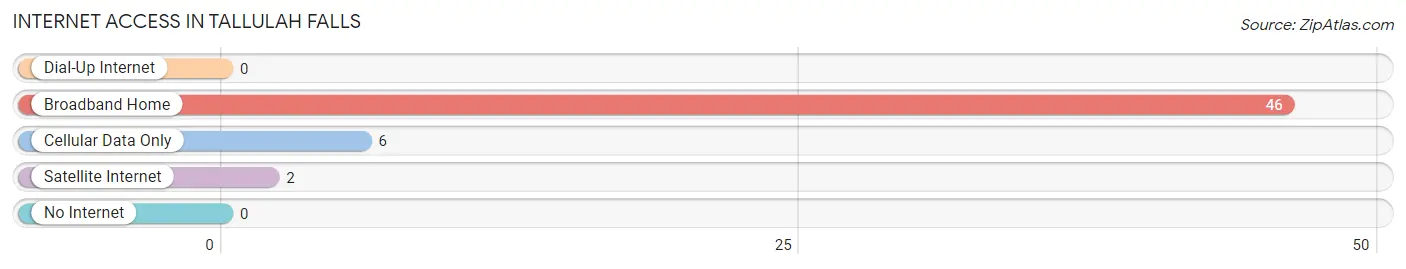
| Internet Type | # Households | % Households |
| Dial-Up Internet | 0 | 0.0% |
| Broadband Home | 46 | 88.5% |
| Cellular Data Only | 6 | 11.5% |
| Satellite Internet | 2 | 3.8% |
| No Internet | 0 | 0.0% |
| Total | 52 | 100.0% |
Tallulah Falls Summary
Tallulah Falls is a small town located in the northeast corner of Georgia, in the foothills of the Blue Ridge Mountains. It is situated in Rabun County, and is part of the Clayton-Rabun County Metropolitan Statistical Area. The town is named after the nearby Tallulah Falls, a series of six waterfalls on the Tallulah River. The town was founded in 1838 and has a population of approximately 500 people.
Geography
Tallulah Falls is located in the northeast corner of Georgia, in the foothills of the Blue Ridge Mountains. It is situated in Rabun County, and is part of the Clayton-Rabun County Metropolitan Statistical Area. The town is located at an elevation of 1,890 feet, and is surrounded by the Chattahoochee National Forest. The town is located on the banks of the Tallulah River, and is home to the Tallulah Falls, a series of six waterfalls on the river. The town is located near the Georgia-North Carolina border, and is approximately 90 miles northeast of Atlanta.
Climate
Tallulah Falls has a humid subtropical climate, with hot, humid summers and mild winters. The average annual temperature is 61°F, with an average high of 76°F in July and an average low of 45°F in January. The average annual precipitation is 55 inches, with the wettest month being July, with an average of 6.5 inches of rain.
Economy
Tallulah Falls is a small, rural town with a limited economy. The town is home to several small businesses, including a grocery store, a hardware store, a restaurant, and a few other small shops. The town is also home to a few tourist attractions, including the Tallulah Falls Railroad, the Tallulah Gorge State Park, and the Tallulah Falls Scenic Byway. The town is also home to a few small manufacturing companies, including a furniture manufacturer and a woodworking company.
Demographics
As of the 2010 census, the population of Tallulah Falls was 498 people, with a population density of 39.3 people per square mile. The median age of the population was 44.7 years, with a gender ratio of 50.2% male and 49.8% female. The median household income was $37,500, and the median family income was $45,000. The town is predominantly white, with 92.2% of the population identifying as white, and the remaining 7.8% identifying as other races.
Conclusion
Tallulah Falls is a small town located in the northeast corner of Georgia, in the foothills of the Blue Ridge Mountains. It is situated in Rabun County, and is part of the Clayton-Rabun County Metropolitan Statistical Area. The town is named after the nearby Tallulah Falls, a series of six waterfalls on the Tallulah River. The town has a population of approximately 500 people, and has a humid subtropical climate. The town has a limited economy, with a few small businesses and tourist attractions. The population is predominantly white, with a median household income of $37,500.
Common Questions
What is the Total Population of Tallulah Falls?
Total Population of Tallulah Falls is 236.
What is the Total Male Population of Tallulah Falls?
Total Male Population of Tallulah Falls is 72.
What is the Total Female Population of Tallulah Falls?
Total Female Population of Tallulah Falls is 164.
What is the Ratio of Males per 100 Females in Tallulah Falls?
There are 43.90 Males per 100 Females in Tallulah Falls.
What is the Ratio of Females per 100 Males in Tallulah Falls?
There are 227.78 Females per 100 Males in Tallulah Falls.
What is the Median Population Age in Tallulah Falls?
Median Population Age in Tallulah Falls is 18.4 Years.
What is the Average Family Size in Tallulah Falls
Average Family Size in Tallulah Falls is 5.3 People.
What is the Average Household Size in Tallulah Falls
Average Household Size in Tallulah Falls is 3.5 People.
What is Per Capita Income in Tallulah Falls?
Per Capita income in Tallulah Falls is $20,730.
What is the Median Family Income in Tallulah Falls?
Median Family Income in Tallulah Falls is $71,250.
What is the Median Household income in Tallulah Falls?
Median Household Income in Tallulah Falls is $48,750.
What is Inequality or Gini Index in Tallulah Falls?
Inequality or Gini Index in Tallulah Falls is 0.38.
How Large is the Labor Force in Tallulah Falls?
There are 63 People in the Labor Forcein in Tallulah Falls.
What is the Percentage of People in the Labor Force in Tallulah Falls?
29.2% of People are in the Labor Force in Tallulah Falls.