Cities with the Most Immigrants from Italy in Arizona
RELATED REPORTS & OPTIONS
Italy
Arizona
Compare Cities
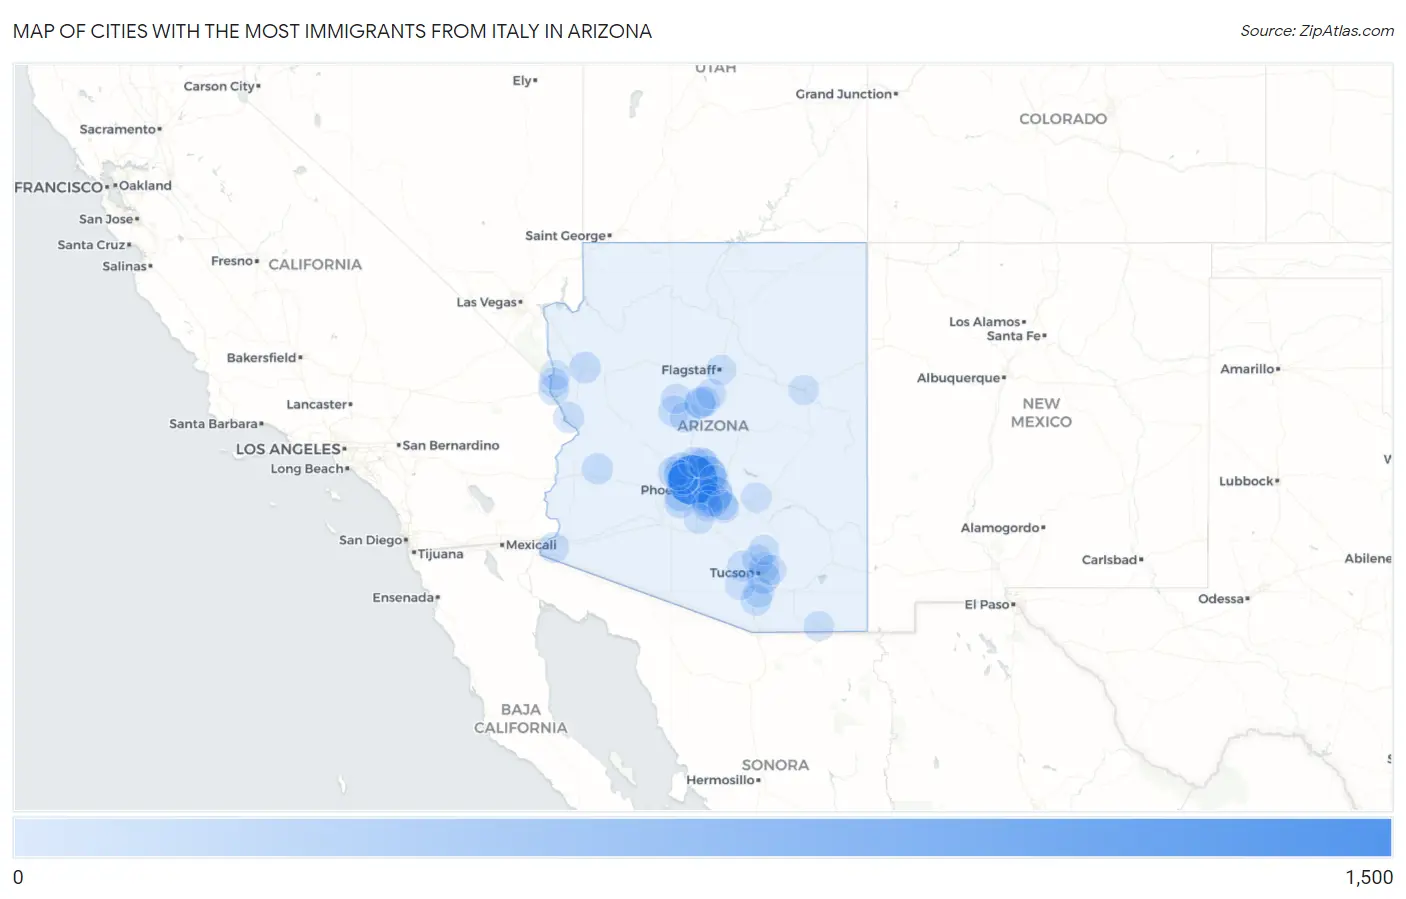
Map of Cities with the Most Immigrants from Italy in Arizona
0
1,500
Cities with the Most Immigrants from Italy in Arizona
| City | Italy | vs State | vs National | |
| 1. | Phoenix | 1,205 | 4,190(28.76%)#1 | 312,941(0.39%)#11 |
| 2. | Scottsdale | 449 | 4,190(10.72%)#2 | 312,941(0.14%)#47 |
| 3. | Mesa | 310 | 4,190(7.40%)#3 | 312,941(0.10%)#98 |
| 4. | Gilbert | 171 | 4,190(4.08%)#4 | 312,941(0.05%)#249 |
| 5. | Tempe | 162 | 4,190(3.87%)#5 | 312,941(0.05%)#270 |
| 6. | Avondale | 159 | 4,190(3.79%)#6 | 312,941(0.05%)#277 |
| 7. | Peoria | 126 | 4,190(3.01%)#7 | 312,941(0.04%)#377 |
| 8. | Tucson | 119 | 4,190(2.84%)#8 | 312,941(0.04%)#402 |
| 9. | Glendale | 110 | 4,190(2.63%)#9 | 312,941(0.04%)#447 |
| 10. | Chandler | 95 | 4,190(2.27%)#10 | 312,941(0.03%)#533 |
| 11. | Surprise | 91 | 4,190(2.17%)#11 | 312,941(0.03%)#557 |
| 12. | Goodyear | 78 | 4,190(1.86%)#12 | 312,941(0.02%)#659 |
| 13. | Kingman | 72 | 4,190(1.72%)#13 | 312,941(0.02%)#714 |
| 14. | Verde Village | 68 | 4,190(1.62%)#14 | 312,941(0.02%)#760 |
| 15. | Sun City | 65 | 4,190(1.55%)#15 | 312,941(0.02%)#788 |
| 16. | Prescott | 64 | 4,190(1.53%)#16 | 312,941(0.02%)#797 |
| 17. | Vicksburg | 61 | 4,190(1.46%)#17 | 312,941(0.02%)#842 |
| 18. | Green Valley | 52 | 4,190(1.24%)#18 | 312,941(0.02%)#957 |
| 19. | Lake Havasu City | 47 | 4,190(1.12%)#19 | 312,941(0.02%)#1,048 |
| 20. | San Tan Valley | 43 | 4,190(1.03%)#20 | 312,941(0.01%)#1,111 |
| 21. | Picture Rocks | 40 | 4,190(0.95%)#21 | 312,941(0.01%)#1,187 |
| 22. | Anthem | 36 | 4,190(0.86%)#22 | 312,941(0.01%)#1,286 |
| 23. | Oro Valley | 33 | 4,190(0.79%)#23 | 312,941(0.01%)#1,351 |
| 24. | Sun City West | 30 | 4,190(0.72%)#24 | 312,941(0.01%)#1,457 |
| 25. | Dewey Humboldt | 27 | 4,190(0.64%)#25 | 312,941(0.01%)#1,590 |
| 26. | Sun Lakes | 24 | 4,190(0.57%)#26 | 312,941(0.01%)#1,689 |
| 27. | Cottonwood | 24 | 4,190(0.57%)#27 | 312,941(0.01%)#1,694 |
| 28. | Mohave Valley | 24 | 4,190(0.57%)#28 | 312,941(0.01%)#1,709 |
| 29. | Yuma | 23 | 4,190(0.55%)#29 | 312,941(0.01%)#1,717 |
| 30. | Catalina Foothills | 21 | 4,190(0.50%)#30 | 312,941(0.01%)#1,816 |
| 31. | Cave Creek | 21 | 4,190(0.50%)#31 | 312,941(0.01%)#1,842 |
| 32. | Cornville | 19 | 4,190(0.45%)#32 | 312,941(0.01%)#1,945 |
| 33. | Chino Valley | 17 | 4,190(0.41%)#33 | 312,941(0.01%)#2,061 |
| 34. | Queen Creek | 16 | 4,190(0.38%)#34 | 312,941(0.01%)#2,103 |
| 35. | Flagstaff | 15 | 4,190(0.36%)#35 | 312,941(0.00%)#2,170 |
| 36. | Sedona | 15 | 4,190(0.36%)#36 | 312,941(0.00%)#2,207 |
| 37. | Carefree | 15 | 4,190(0.36%)#37 | 312,941(0.00%)#2,226 |
| 38. | Sahuarita | 13 | 4,190(0.31%)#38 | 312,941(0.00%)#2,329 |
| 39. | Bisbee | 13 | 4,190(0.31%)#39 | 312,941(0.00%)#2,370 |
| 40. | Saddlebrooke | 12 | 4,190(0.29%)#40 | 312,941(0.00%)#2,445 |
| 41. | Tanque Verde | 11 | 4,190(0.26%)#41 | 312,941(0.00%)#2,514 |
| 42. | Maricopa | 10 | 4,190(0.24%)#42 | 312,941(0.00%)#2,593 |
| 43. | Bullhead City | 9 | 4,190(0.21%)#43 | 312,941(0.00%)#2,731 |
| 44. | Three Points | 8 | 4,190(0.19%)#44 | 312,941(0.00%)#2,900 |
| 45. | Top Of The World | 8 | 4,190(0.19%)#45 | 312,941(0.00%)#2,949 |
| 46. | Fountain Hills | 7 | 4,190(0.17%)#46 | 312,941(0.00%)#2,976 |
| 47. | Fort Mohave | 6 | 4,190(0.14%)#47 | 312,941(0.00%)#3,099 |
| 48. | Holbrook | 6 | 4,190(0.14%)#48 | 312,941(0.00%)#3,121 |
Common Questions
What are the Top 10 Cities with the Most Immigrants from Italy in Arizona?
Top 10 Cities with the Most Immigrants from Italy in Arizona are:
What city has the Most Immigrants from Italy in Arizona?
Phoenix has the Most Immigrants from Italy in Arizona with 1,205.
What is the Total Immigrants from Italy in the State of Arizona?
Total Immigrants from Italy in Arizona is 4,190.
What is the Total Immigrants from Italy in the United States?
Total Immigrants from Italy in the United States is 312,941.