Sierra View, PA
Sierra View Map
Sierra View Overview
5,826
TOTAL POPULATION
2,793
MALE POPULATION
3,033
FEMALE POPULATION
92.09
MALES / 100 FEMALES
108.59
FEMALES / 100 MALES
35.2
MEDIAN AGE
4.1
AVG FAMILY SIZE
3.6
AVG HOUSEHOLD SIZE
$30,419
PER CAPITA INCOME
$101,563
AVG FAMILY INCOME
$91,736
AVG HOUSEHOLD INCOME
39.8%
WAGE / INCOME GAP [ % ]
60.2¢/ $1
WAGE / INCOME GAP [ $ ]
0.40
INEQUALITY / GINI INDEX
2,861
LABOR FORCE [ PEOPLE ]
63.8%
PERCENT IN LABOR FORCE
9.0%
UNEMPLOYMENT RATE
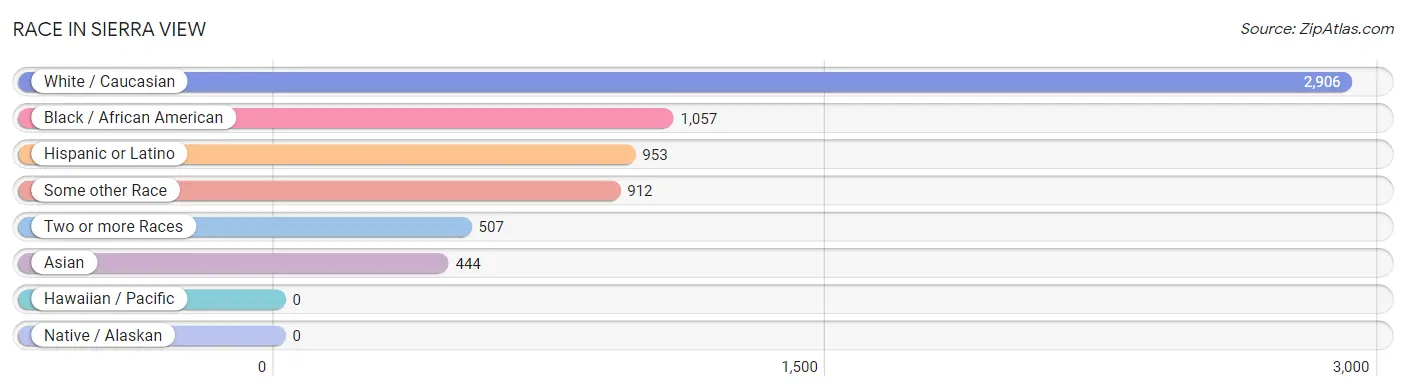
Race in Sierra View
The most populous races in Sierra View are White / Caucasian (2,906 | 49.9%), Black / African American (1,057 | 18.1%), and Hispanic or Latino (953 | 16.4%).
| Race | # Population | % Population |
| Asian | 444 | 7.6% |
| Black / African American | 1,057 | 18.1% |
| Hawaiian / Pacific | 0 | 0.0% |
| Hispanic or Latino | 953 | 16.4% |
| Native / Alaskan | 0 | 0.0% |
| White / Caucasian | 2,906 | 49.9% |
| Two or more Races | 507 | 8.7% |
| Some other Race | 912 | 15.7% |
| Total | 5,826 | 100.0% |
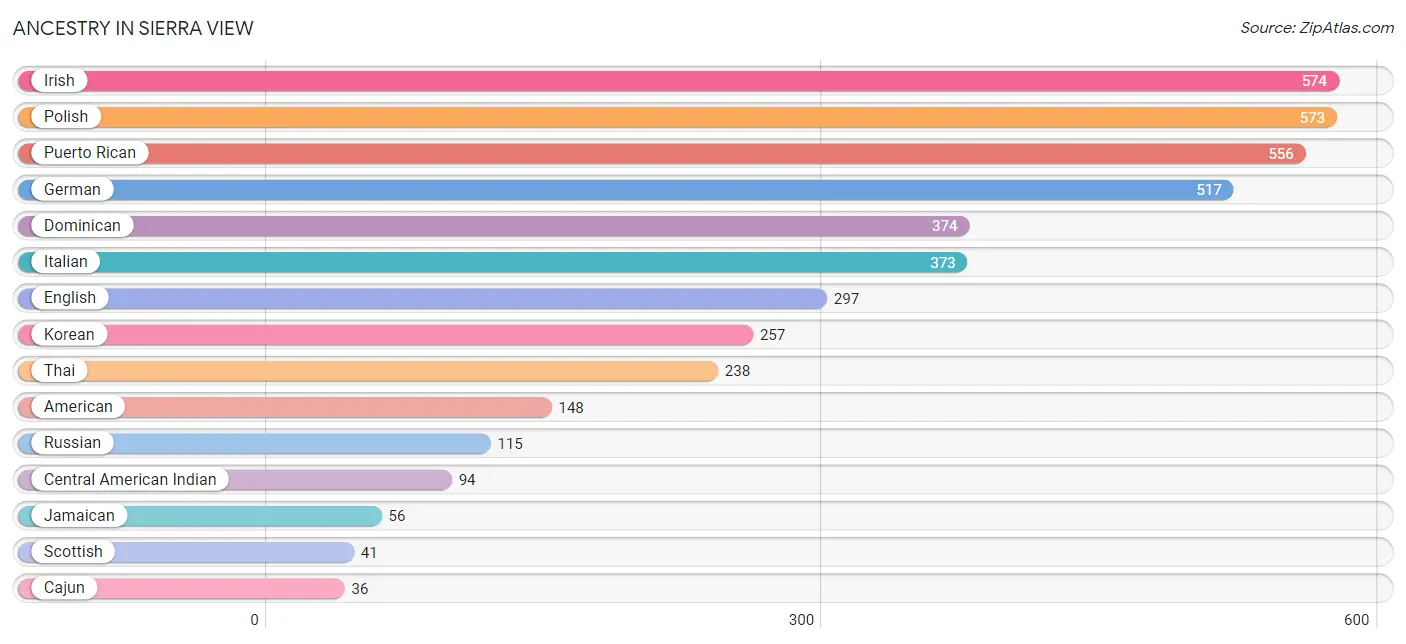
Ancestry in Sierra View
The most populous ancestries reported in Sierra View are Irish (574 | 9.9%), Polish (573 | 9.8%), Puerto Rican (556 | 9.5%), German (517 | 8.9%), and Dominican (374 | 6.4%), together accounting for 44.5% of all Sierra View residents.
| Ancestry | # Population | % Population |
| American | 148 | 2.5% |
| Austrian | 14 | 0.2% |
| Barbadian | 26 | 0.4% |
| Cajun | 36 | 0.6% |
| Central American | 23 | 0.4% |
| Central American Indian | 94 | 1.6% |
| Comanche | 19 | 0.3% |
| Czech | 23 | 0.4% |
| Dominican | 374 | 6.4% |
| Dutch | 34 | 0.6% |
| Eastern European | 29 | 0.5% |
| English | 297 | 5.1% |
| European | 23 | 0.4% |
| French | 16 | 0.3% |
| French Canadian | 31 | 0.5% |
| German | 517 | 8.9% |
| Greek | 7 | 0.1% |
| Irish | 574 | 9.9% |
| Iroquois | 12 | 0.2% |
| Italian | 373 | 6.4% |
| Jamaican | 56 | 1.0% |
| Korean | 257 | 4.4% |
| Lithuanian | 14 | 0.2% |
| Native Hawaiian | 24 | 0.4% |
| Norwegian | 10 | 0.2% |
| Panamanian | 23 | 0.4% |
| Polish | 573 | 9.8% |
| Puerto Rican | 556 | 9.5% |
| Russian | 115 | 2.0% |
| Scottish | 41 | 0.7% |
| Slovak | 14 | 0.2% |
| Swedish | 17 | 0.3% |
| Thai | 238 | 4.1% |
| Trinidadian and Tobagonian | 21 | 0.4% |
| Ukrainian | 16 | 0.3% |
| Welsh | 7 | 0.1% | View All 36 Rows |
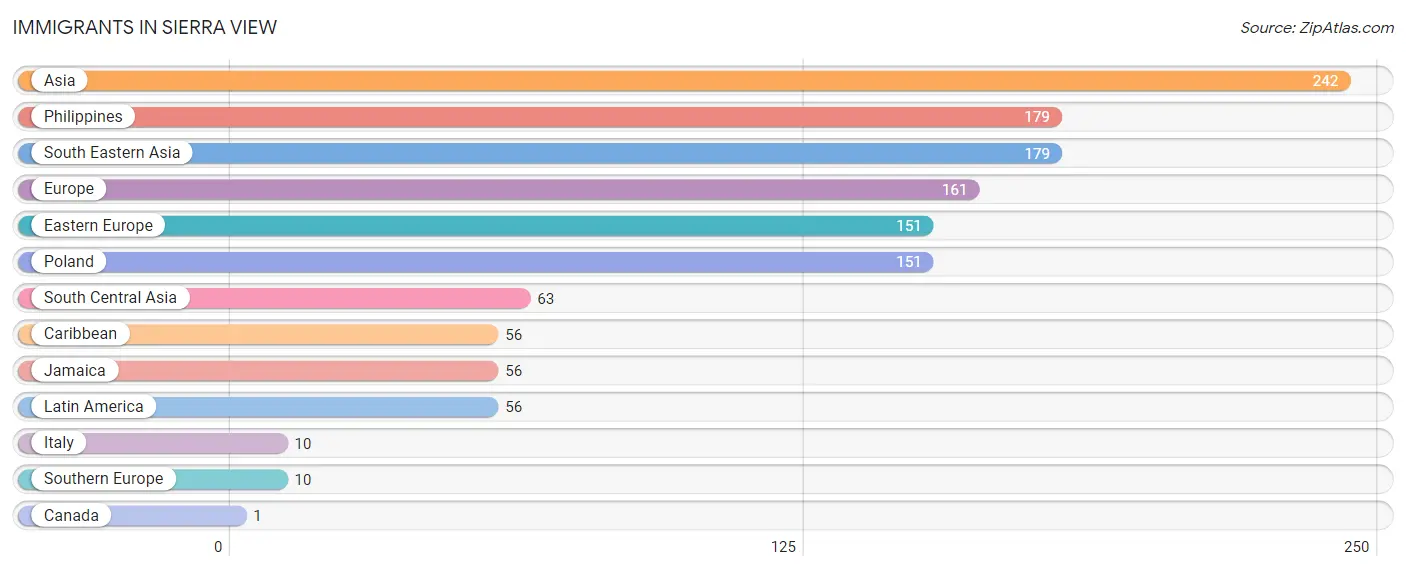
Immigrants in Sierra View
The most numerous immigrant groups reported in Sierra View came from Asia (242 | 4.2%), Philippines (179 | 3.1%), South Eastern Asia (179 | 3.1%), Europe (161 | 2.8%), and Eastern Europe (151 | 2.6%), together accounting for 15.6% of all Sierra View residents.
| Immigration Origin | # Population | % Population |
| Asia | 242 | 4.2% |
| Canada | 1 | 0.0% |
| Caribbean | 56 | 1.0% |
| Eastern Europe | 151 | 2.6% |
| Europe | 161 | 2.8% |
| Italy | 10 | 0.2% |
| Jamaica | 56 | 1.0% |
| Latin America | 56 | 1.0% |
| Philippines | 179 | 3.1% |
| Poland | 151 | 2.6% |
| South Central Asia | 63 | 1.1% |
| South Eastern Asia | 179 | 3.1% |
| Southern Europe | 10 | 0.2% | View All 13 Rows |
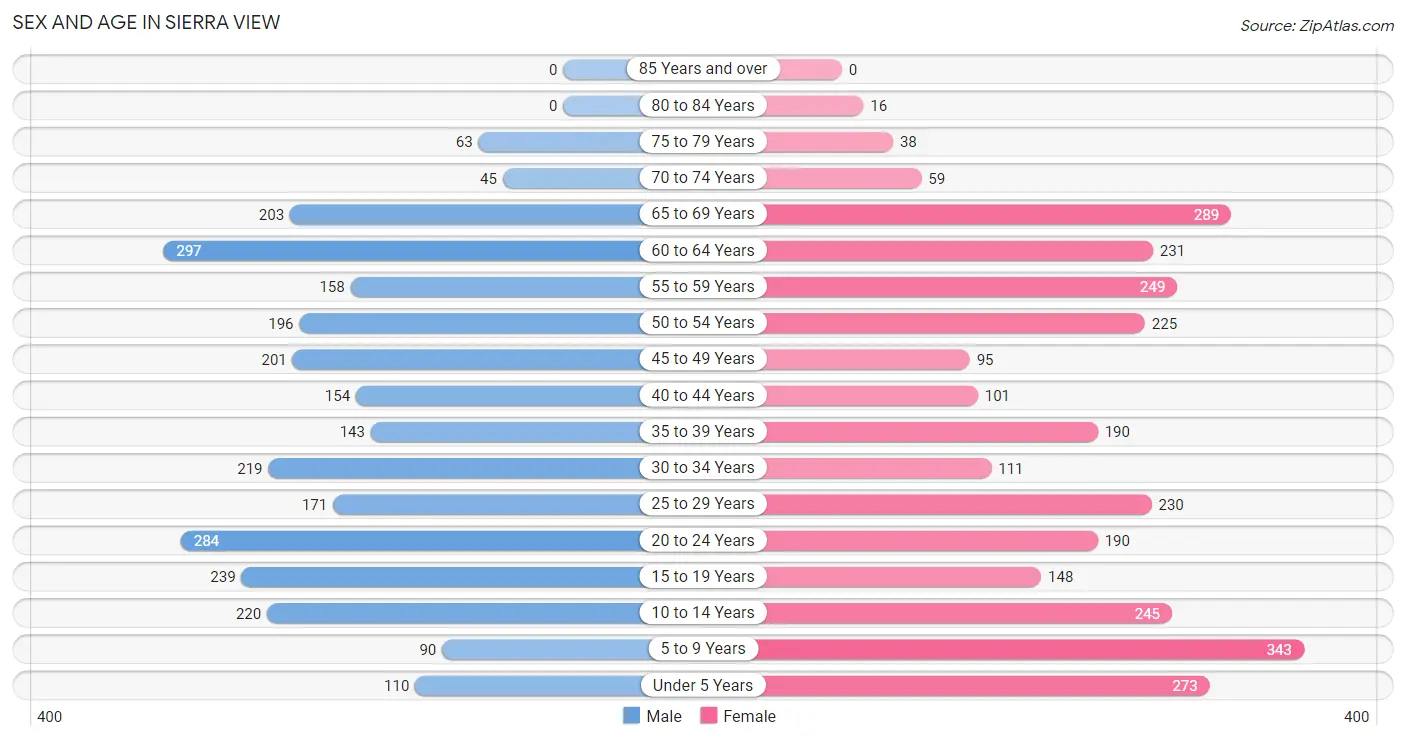
Sex and Age in Sierra View
Sex and Age in Sierra View
The most populous age groups in Sierra View are 60 to 64 Years (297 | 10.6%) for men and 5 to 9 Years (343 | 11.3%) for women.
| Age Bracket | Male | Female |
| Under 5 Years | 110 (3.9%) | 273 (9.0%) |
| 5 to 9 Years | 90 (3.2%) | 343 (11.3%) |
| 10 to 14 Years | 220 (7.9%) | 245 (8.1%) |
| 15 to 19 Years | 239 (8.6%) | 148 (4.9%) |
| 20 to 24 Years | 284 (10.2%) | 190 (6.3%) |
| 25 to 29 Years | 171 (6.1%) | 230 (7.6%) |
| 30 to 34 Years | 219 (7.8%) | 111 (3.7%) |
| 35 to 39 Years | 143 (5.1%) | 190 (6.3%) |
| 40 to 44 Years | 154 (5.5%) | 101 (3.3%) |
| 45 to 49 Years | 201 (7.2%) | 95 (3.1%) |
| 50 to 54 Years | 196 (7.0%) | 225 (7.4%) |
| 55 to 59 Years | 158 (5.7%) | 249 (8.2%) |
| 60 to 64 Years | 297 (10.6%) | 231 (7.6%) |
| 65 to 69 Years | 203 (7.3%) | 289 (9.5%) |
| 70 to 74 Years | 45 (1.6%) | 59 (1.9%) |
| 75 to 79 Years | 63 (2.3%) | 38 (1.3%) |
| 80 to 84 Years | 0 (0.0%) | 16 (0.5%) |
| 85 Years and over | 0 (0.0%) | 0 (0.0%) |
| Total | 2,793 (100.0%) | 3,033 (100.0%) |
Families and Households in Sierra View
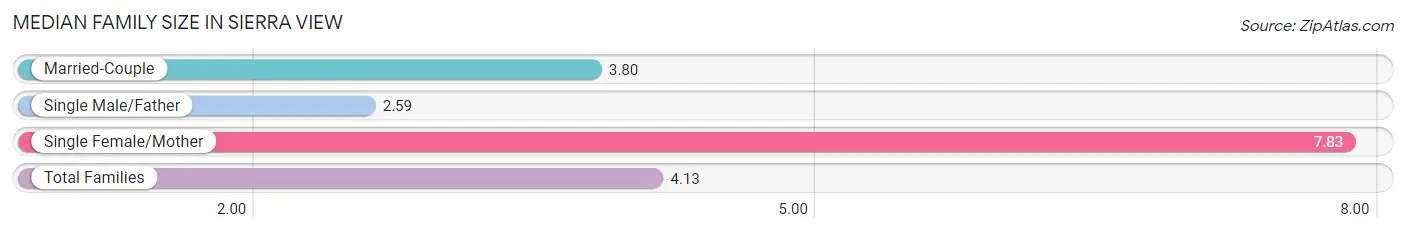
Median Family Size in Sierra View
The median family size in Sierra View is 4.13 persons per family, with single female/mother families (117 | 9.3%) accounting for the largest median family size of 7.83 persons per family. On the other hand, single male/father families (46 | 3.6%) represent the smallest median family size with 2.59 persons per family.
| Family Type | # Families | Family Size |
| Married-Couple | 1,099 (87.1%) | 3.80 |
| Single Male/Father | 46 (3.6%) | 2.59 |
| Single Female/Mother | 117 (9.3%) | 7.83 |
| Total Families | 1,262 (100.0%) | 4.13 |
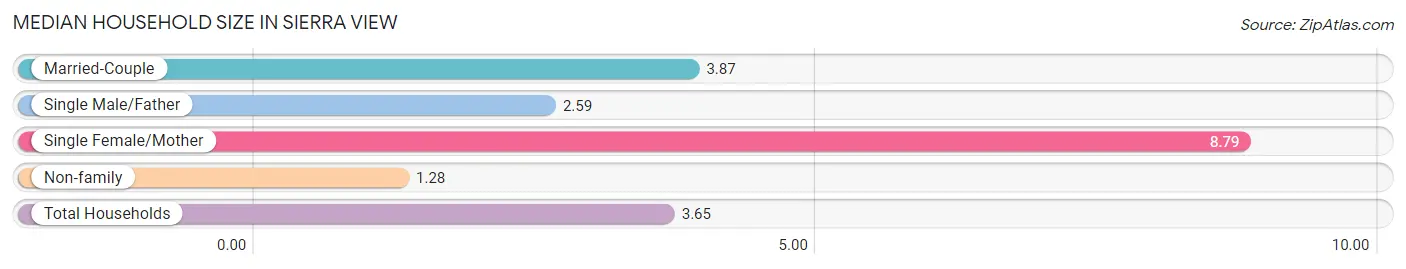
Median Household Size in Sierra View
The median household size in Sierra View is 3.65 persons per household, with single female/mother households (117 | 7.3%) accounting for the largest median household size of 8.79 persons per household. non-family households (335 | 21.0%) represent the smallest median household size with 1.28 persons per household.
| Household Type | # Households | Household Size |
| Married-Couple | 1,099 (68.8%) | 3.87 |
| Single Male/Father | 46 (2.9%) | 2.59 |
| Single Female/Mother | 117 (7.3%) | 8.79 |
| Non-family | 335 (21.0%) | 1.28 |
| Total Households | 1,597 (100.0%) | 3.65 |
Household Size by Marriage Status in Sierra View
Out of a total of 1,597 households in Sierra View, 1,262 (79.0%) are family households, while 335 (21.0%) are nonfamily households. The most numerous type of family households are 2-person households, comprising 480, and the most common type of nonfamily households are 1-person households, comprising 230.

| Household Size | Family Households | Nonfamily Households |
| 1-Person Households | - | 230 (14.4%) |
| 2-Person Households | 480 (30.1%) | 105 (6.6%) |
| 3-Person Households | 193 (12.1%) | 0 (0.0%) |
| 4-Person Households | 279 (17.5%) | 0 (0.0%) |
| 5-Person Households | 83 (5.2%) | 0 (0.0%) |
| 6-Person Households | 172 (10.8%) | 0 (0.0%) |
| 7+ Person Households | 55 (3.4%) | 0 (0.0%) |
| Total | 1,262 (79.0%) | 335 (21.0%) |
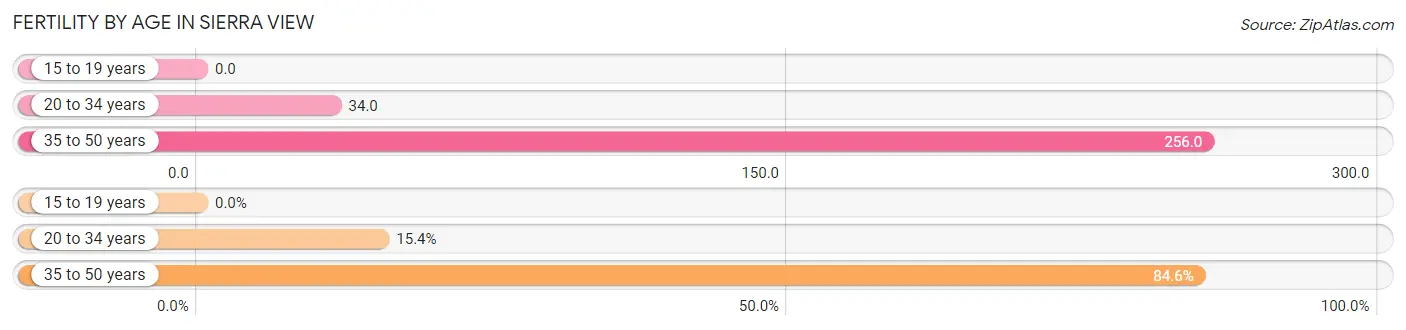
Female Fertility in Sierra View
Fertility by Age in Sierra View
Average fertility rate in Sierra View is 110.0 births per 1,000 women. Women in the age bracket of 35 to 50 years have the highest fertility rate with 256.0 births per 1,000 women. Women in the age bracket of 35 to 50 years acount for 84.6% of all women with births.
| Age Bracket | Women with Births | Births / 1,000 Women |
| 15 to 19 years | 0 (0.0%) | 0.0 |
| 20 to 34 years | 18 (15.4%) | 34.0 |
| 35 to 50 years | 99 (84.6%) | 256.0 |
| Total | 117 (100.0%) | 110.0 |
Fertility by Age by Marriage Status in Sierra View
70.1% of women with births (117) in Sierra View are married. The highest percentage of unmarried women with births falls into 20 to 34 years age bracket with 100.0% of them unmarried at the time of birth, while the lowest percentage of unmarried women with births belong to 35 to 50 years age bracket with 17.2% of them unmarried.
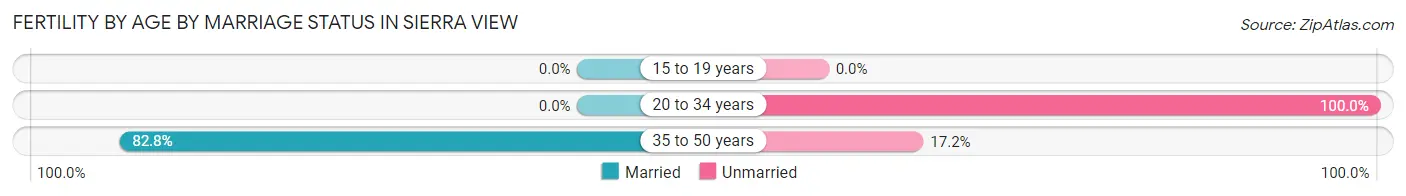
| Age Bracket | Married | Unmarried |
| 15 to 19 years | 0 (0.0%) | 0 (0.0%) |
| 20 to 34 years | 0 (0.0%) | 18 (100.0%) |
| 35 to 50 years | 82 (82.8%) | 17 (17.2%) |
| Total | 82 (70.1%) | 35 (29.9%) |
Fertility by Education in Sierra View
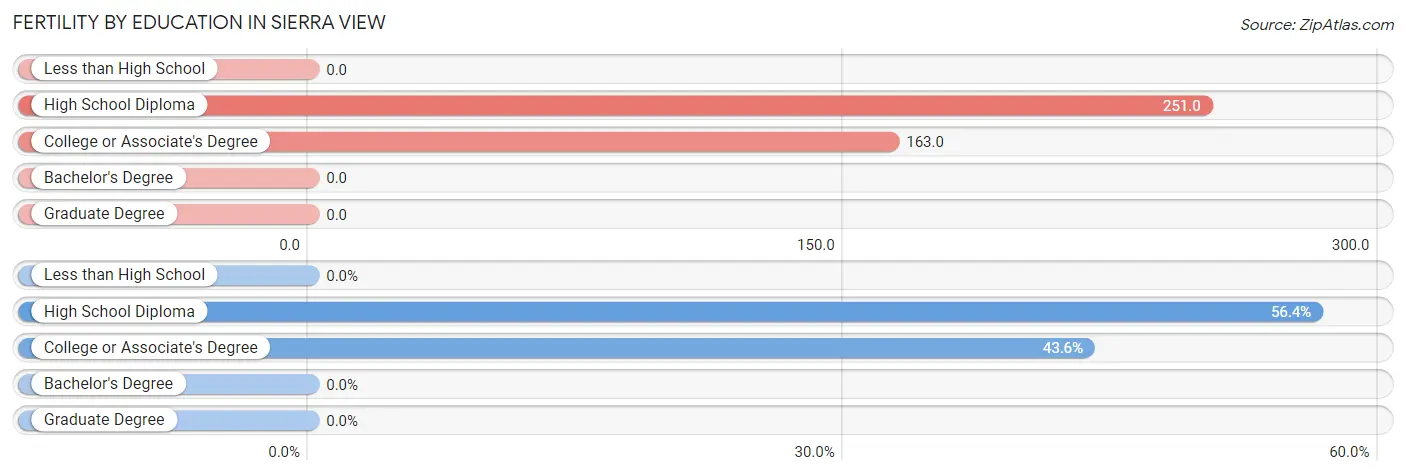
| Educational Attainment | Women with Births | Births / 1,000 Women |
| Less than High School | 0 (0.0%) | 0.0 |
| High School Diploma | 66 (56.4%) | 251.0 |
| College or Associate's Degree | 51 (43.6%) | 163.0 |
| Bachelor's Degree | 0 (0.0%) | 0.0 |
| Graduate Degree | 0 (0.0%) | 0.0 |
| Total | 117 (100.0%) | 110.0 |
Fertility by Education by Marriage Status in Sierra View
29.9% of women with births in Sierra View are unmarried. Women with the educational attainment of high school diploma are most likely to be married with 72.7% of them married at childbirth, while women with the educational attainment of college or associate's degree are least likely to be married with 33.3% of them unmarried at childbirth.
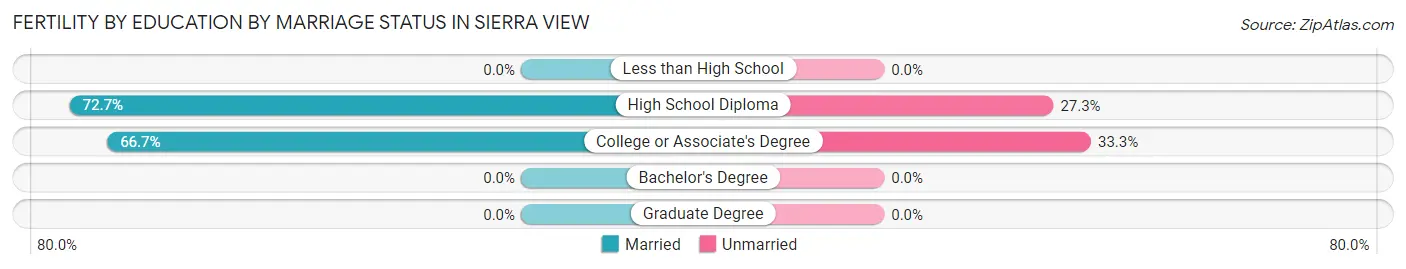
| Educational Attainment | Married | Unmarried |
| Less than High School | 0 (0.0%) | 0 (0.0%) |
| High School Diploma | 48 (72.7%) | 18 (27.3%) |
| College or Associate's Degree | 34 (66.7%) | 17 (33.3%) |
| Bachelor's Degree | 0 (0.0%) | 0 (0.0%) |
| Graduate Degree | 0 (0.0%) | 0 (0.0%) |
| Total | 82 (70.1%) | 35 (29.9%) |
Income in Sierra View
Income Overview in Sierra View
Per Capita Income in Sierra View is $30,419, while median incomes of families and households are $101,563 and $91,736 respectively.
| Characteristic | Number | Measure |
| Per Capita Income | 5,826 | $30,419 |
| Median Family Income | 1,262 | $101,563 |
| Mean Family Income | 1,262 | $116,011 |
| Median Household Income | 1,597 | $91,736 |
| Mean Household Income | 1,597 | $106,191 |
| Income Deficit | 1,262 | $0 |
| Wage / Income Gap (%) | 5,826 | 39.80% |
| Wage / Income Gap ($) | 5,826 | 60.20¢ per $1 |
| Gini / Inequality Index | 5,826 | 0.40 |
Earnings by Sex in Sierra View
Average Earnings in Sierra View are $32,297, $40,597 for men and $24,440 for women, a difference of 39.8%.
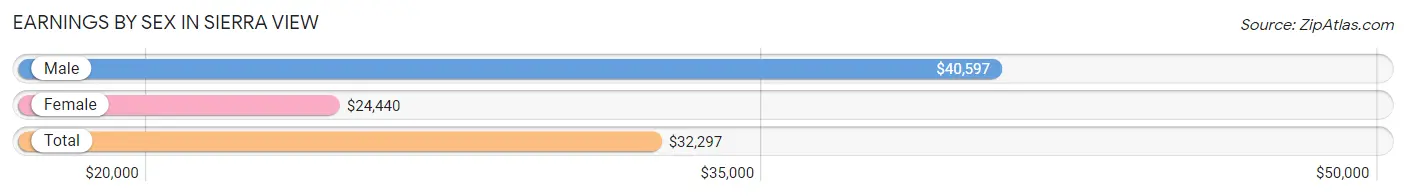
| Sex | Number | Average Earnings |
| Male | 1,438 (50.6%) | $40,597 |
| Female | 1,402 (49.4%) | $24,440 |
| Total | 2,840 (100.0%) | $32,297 |
Earnings by Sex by Income Bracket in Sierra View
The most common earnings brackets in Sierra View are $100,000+ for men (236 | 16.4%) and $25,000 to $29,999 for women (133 | 9.5%).
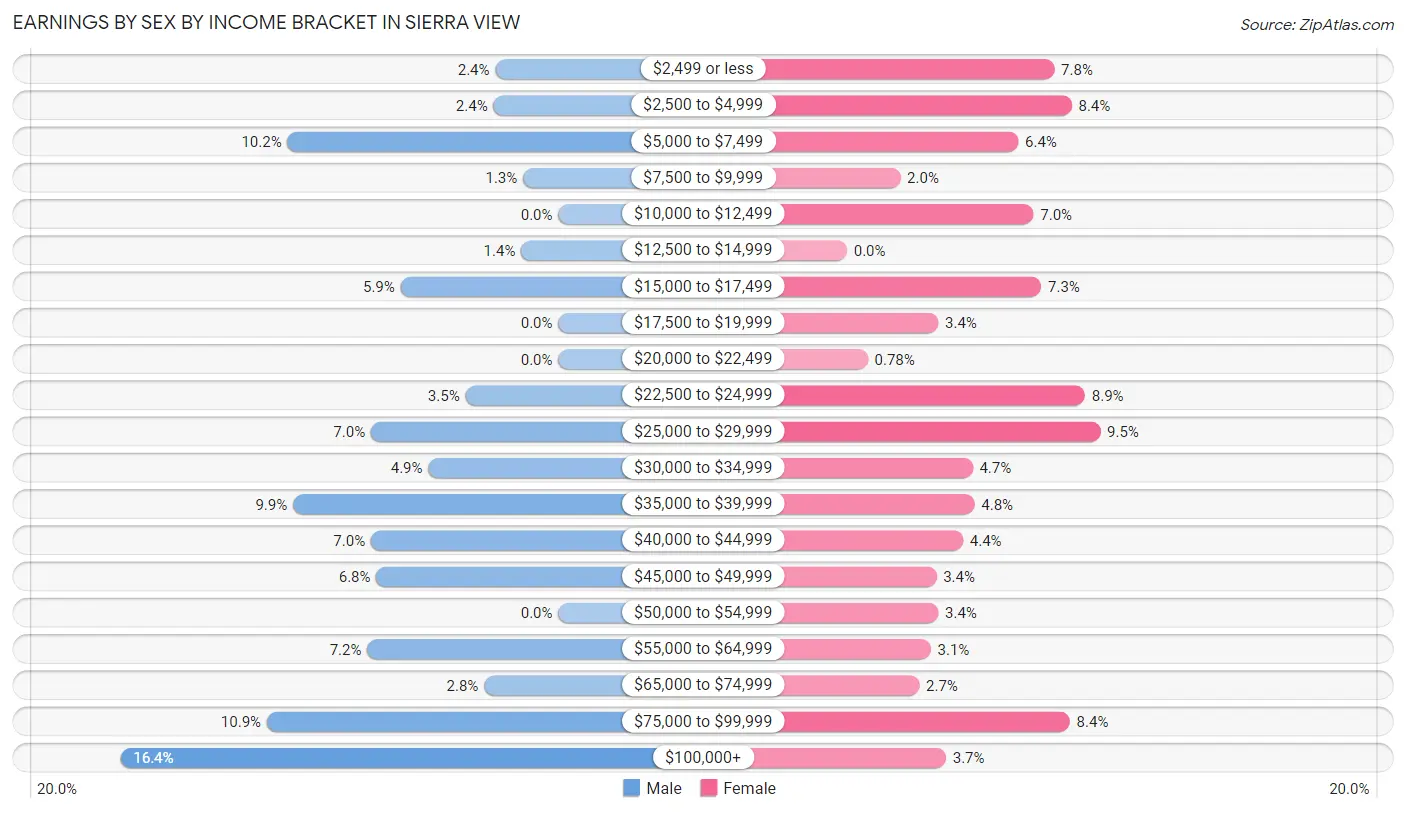
| Income | Male | Female |
| $2,499 or less | 34 (2.4%) | 109 (7.8%) |
| $2,500 to $4,999 | 35 (2.4%) | 118 (8.4%) |
| $5,000 to $7,499 | 146 (10.2%) | 90 (6.4%) |
| $7,500 to $9,999 | 19 (1.3%) | 28 (2.0%) |
| $10,000 to $12,499 | 0 (0.0%) | 98 (7.0%) |
| $12,500 to $14,999 | 20 (1.4%) | 0 (0.0%) |
| $15,000 to $17,499 | 85 (5.9%) | 102 (7.3%) |
| $17,500 to $19,999 | 0 (0.0%) | 48 (3.4%) |
| $20,000 to $22,499 | 0 (0.0%) | 11 (0.8%) |
| $22,500 to $24,999 | 50 (3.5%) | 125 (8.9%) |
| $25,000 to $29,999 | 101 (7.0%) | 133 (9.5%) |
| $30,000 to $34,999 | 70 (4.9%) | 66 (4.7%) |
| $35,000 to $39,999 | 143 (9.9%) | 67 (4.8%) |
| $40,000 to $44,999 | 101 (7.0%) | 61 (4.3%) |
| $45,000 to $49,999 | 98 (6.8%) | 47 (3.4%) |
| $50,000 to $54,999 | 0 (0.0%) | 48 (3.4%) |
| $55,000 to $64,999 | 103 (7.2%) | 44 (3.1%) |
| $65,000 to $74,999 | 40 (2.8%) | 38 (2.7%) |
| $75,000 to $99,999 | 157 (10.9%) | 117 (8.4%) |
| $100,000+ | 236 (16.4%) | 52 (3.7%) |
| Total | 1,438 (100.0%) | 1,402 (100.0%) |
Earnings by Sex by Educational Attainment in Sierra View
Average earnings in Sierra View are $41,754 for men and $26,117 for women, a difference of 37.4%. Men with an educational attainment of less than high school enjoy the highest average annual earnings of $85,788, while those with high school diploma education earn the least with $36,722. Women with an educational attainment of bachelor's degree earn the most with the average annual earnings of $31,193, while those with college or associate's degree education have the smallest earnings of $24,534.
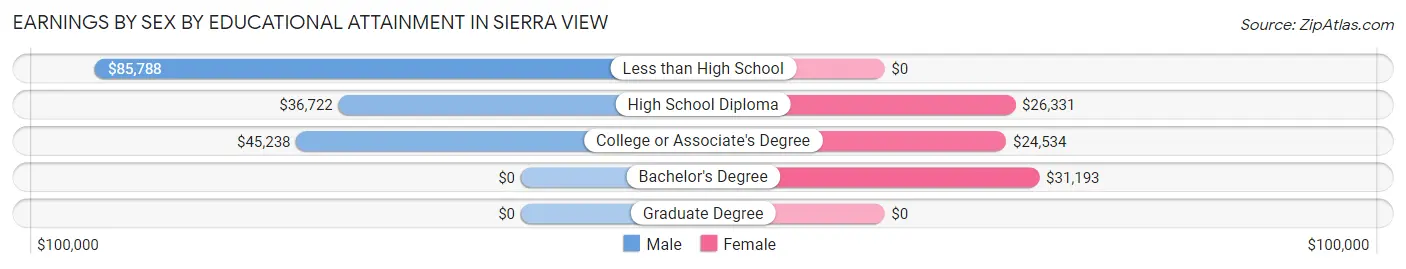
| Educational Attainment | Male Income | Female Income |
| Less than High School | $85,788 | $0 |
| High School Diploma | $36,722 | $26,331 |
| College or Associate's Degree | $45,238 | $24,534 |
| Bachelor's Degree | - | - |
| Graduate Degree | - | - |
| Total | $41,754 | $26,117 |
Family Income in Sierra View
Family Income Brackets in Sierra View
According to the Sierra View family income data, there are 480 families falling into the $100,000 to $149,999 income range, which is the most common income bracket and makes up 38.0% of all families. Conversely, the $10,000 to $14,999 income bracket is the least frequent group with only 14 families (1.1%) belonging to this category.
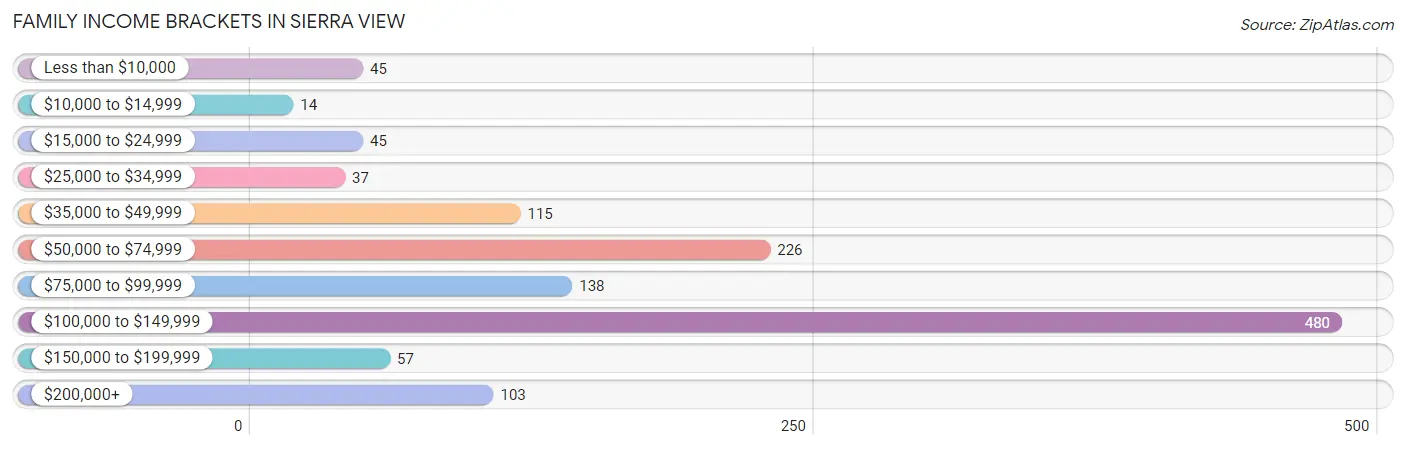
| Income Bracket | # Families | % Families |
| Less than $10,000 | 45 | 3.6% |
| $10,000 to $14,999 | 14 | 1.1% |
| $15,000 to $24,999 | 45 | 3.6% |
| $25,000 to $34,999 | 37 | 2.9% |
| $35,000 to $49,999 | 115 | 9.1% |
| $50,000 to $74,999 | 226 | 17.9% |
| $75,000 to $99,999 | 138 | 10.9% |
| $100,000 to $149,999 | 480 | 38.0% |
| $150,000 to $199,999 | 57 | 4.5% |
| $200,000+ | 103 | 8.2% |
Family Income by Famaliy Size in Sierra View
6-person families (159 | 12.6%) account for the highest median family income in Sierra View with $130,699 per family, while 2-person families (490 | 38.8%) have the highest median income of $32,084 per family member.
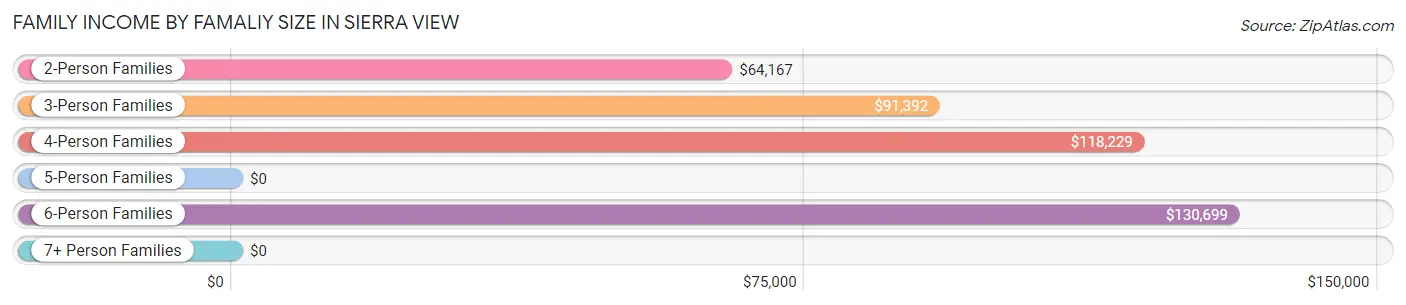
| Income Bracket | # Families | Median Income |
| 2-Person Families | 490 (38.8%) | $64,167 |
| 3-Person Families | 199 (15.8%) | $91,392 |
| 4-Person Families | 305 (24.2%) | $118,229 |
| 5-Person Families | 67 (5.3%) | $0 |
| 6-Person Families | 159 (12.6%) | $130,699 |
| 7+ Person Families | 42 (3.3%) | $0 |
| Total | 1,262 (100.0%) | $101,563 |
Family Income by Number of Earners in Sierra View
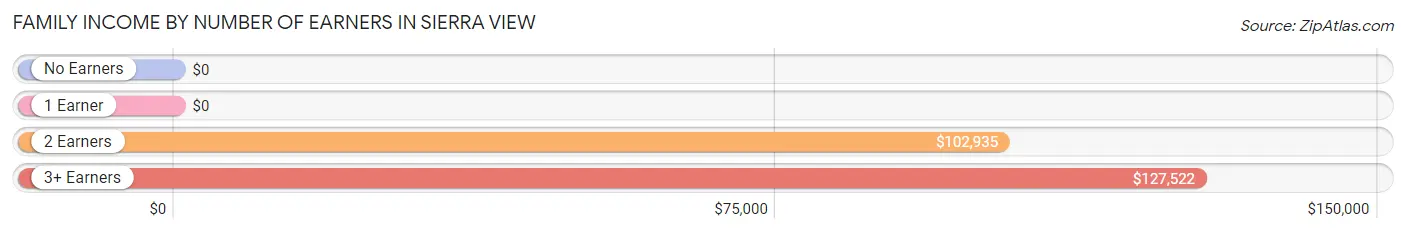
| Number of Earners | # Families | Median Income |
| No Earners | 156 (12.4%) | $0 |
| 1 Earner | 273 (21.6%) | $0 |
| 2 Earners | 508 (40.3%) | $102,935 |
| 3+ Earners | 325 (25.8%) | $127,522 |
| Total | 1,262 (100.0%) | $101,563 |
Household Income in Sierra View
Household Income Brackets in Sierra View
With 541 households falling in the category, the $100,000 to $149,999 income range is the most frequent in Sierra View, accounting for 33.9% of all households. In contrast, only 14 households (0.9%) fall into the $10,000 to $14,999 income bracket, making it the least populous group.
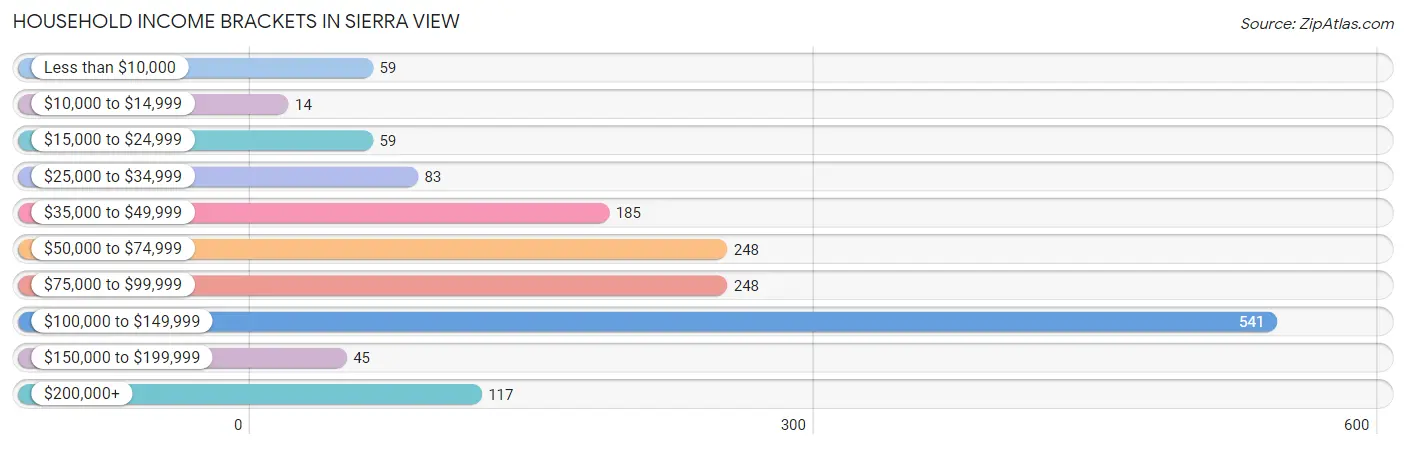
| Income Bracket | # Households | % Households |
| Less than $10,000 | 59 | 3.7% |
| $10,000 to $14,999 | 14 | 0.9% |
| $15,000 to $24,999 | 59 | 3.7% |
| $25,000 to $34,999 | 83 | 5.2% |
| $35,000 to $49,999 | 185 | 11.6% |
| $50,000 to $74,999 | 248 | 15.5% |
| $75,000 to $99,999 | 248 | 15.5% |
| $100,000 to $149,999 | 541 | 33.9% |
| $150,000 to $199,999 | 45 | 2.8% |
| $200,000+ | 117 | 7.3% |
Household Income by Householder Age in Sierra View
The median household income in Sierra View is $91,736, with the highest median household income of $102,109 found in the 25 to 44 years age bracket for the primary householder. A total of 333 households (20.8%) fall into this category.
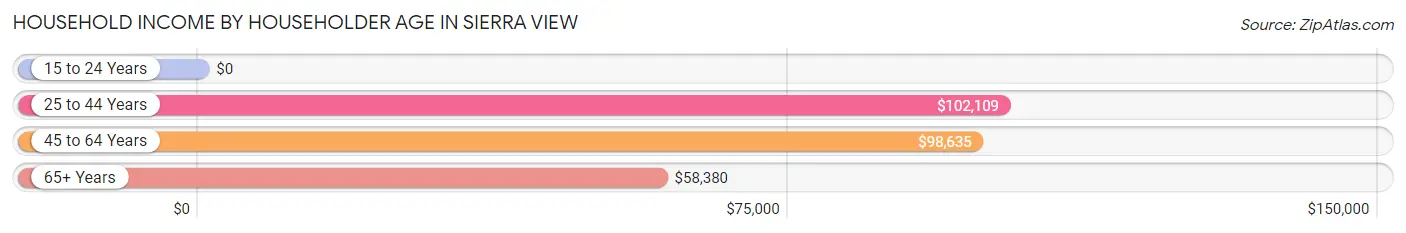
| Income Bracket | # Households | Median Income |
| 15 to 24 Years | 0 (0.0%) | $0 |
| 25 to 44 Years | 333 (20.8%) | $102,109 |
| 45 to 64 Years | 907 (56.8%) | $98,635 |
| 65+ Years | 357 (22.4%) | $58,380 |
| Total | 1,597 (100.0%) | $91,736 |
Poverty in Sierra View
Income Below Poverty by Sex and Age in Sierra View
With 5.9% poverty level for males and 6.1% for females among the residents of Sierra View, 5 year old males and 6 to 11 year old females are the most vulnerable to poverty, with 21 males (100.0%) and 73 females (30.9%) in their respective age groups living below the poverty level.
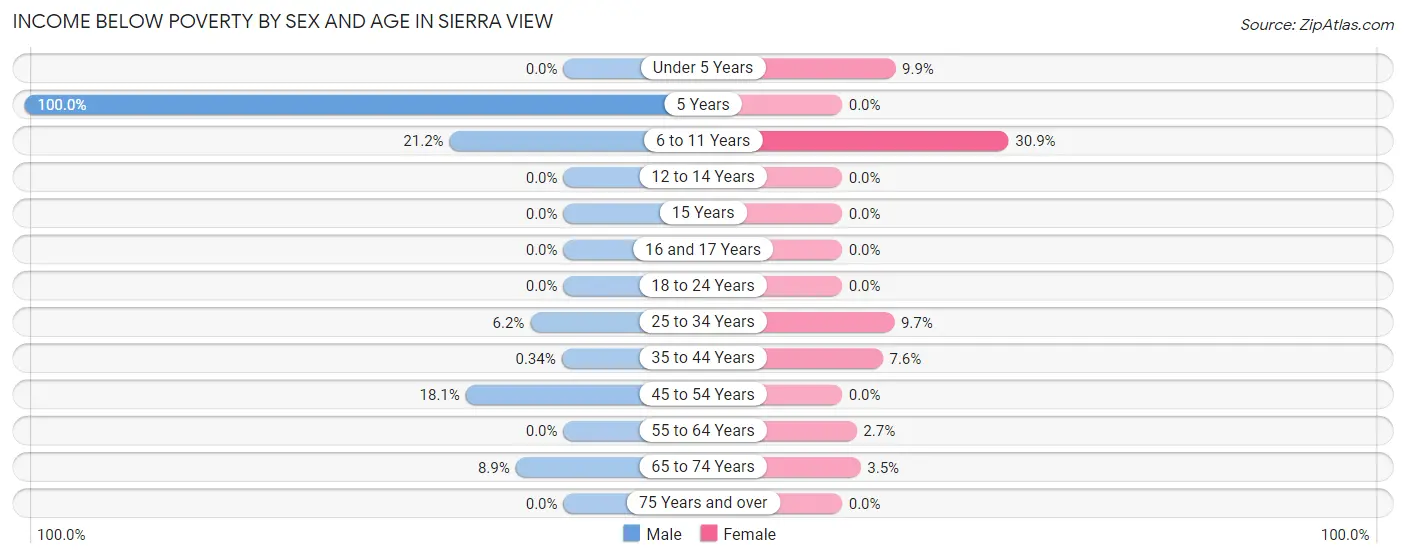
| Age Bracket | Male | Female |
| Under 5 Years | 0 (0.0%) | 27 (9.9%) |
| 5 Years | 21 (100.0%) | 0 (0.0%) |
| 6 to 11 Years | 22 (21.1%) | 73 (30.9%) |
| 12 to 14 Years | 0 (0.0%) | 0 (0.0%) |
| 15 Years | 0 (0.0%) | 0 (0.0%) |
| 16 and 17 Years | 0 (0.0%) | 0 (0.0%) |
| 18 to 24 Years | 0 (0.0%) | 0 (0.0%) |
| 25 to 34 Years | 24 (6.1%) | 33 (9.7%) |
| 35 to 44 Years | 1 (0.3%) | 22 (7.6%) |
| 45 to 54 Years | 72 (18.1%) | 0 (0.0%) |
| 55 to 64 Years | 0 (0.0%) | 13 (2.7%) |
| 65 to 74 Years | 22 (8.9%) | 12 (3.5%) |
| 75 Years and over | 0 (0.0%) | 0 (0.0%) |
| Total | 162 (5.9%) | 180 (6.1%) |
Income Above Poverty by Sex and Age in Sierra View
According to the poverty statistics in Sierra View, males aged under 5 years and females aged 5 years are the age groups that are most secure financially, with 100.0% of males and 100.0% of females in these age groups living above the poverty line.
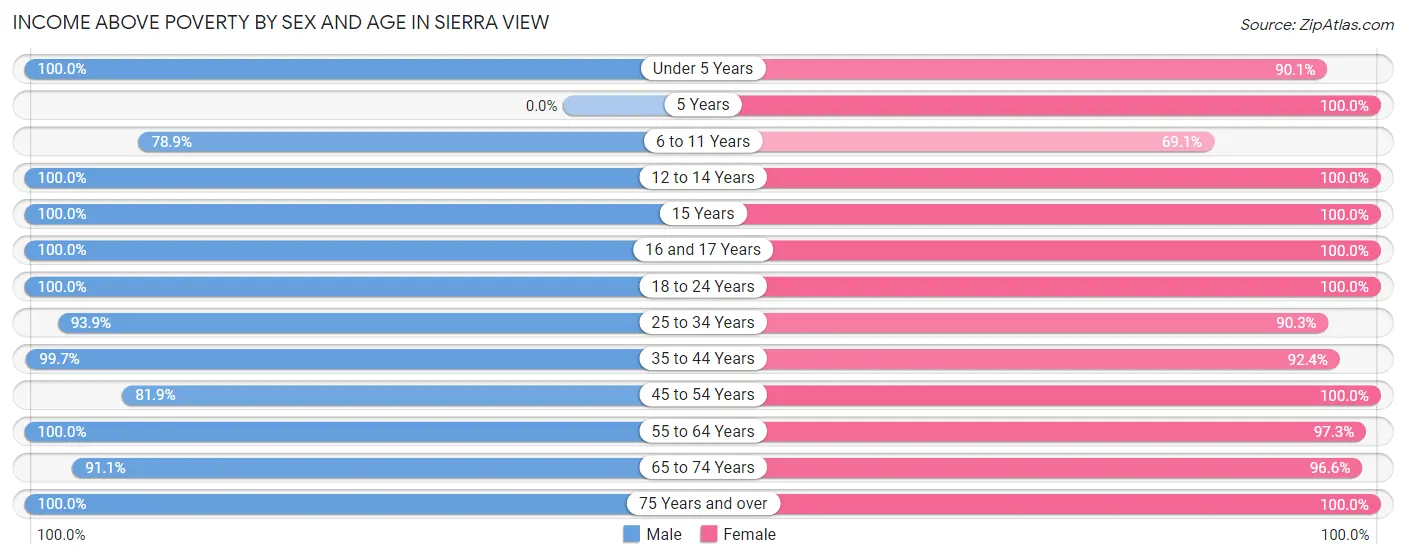
| Age Bracket | Male | Female |
| Under 5 Years | 86 (100.0%) | 246 (90.1%) |
| 5 Years | 0 (0.0%) | 85 (100.0%) |
| 6 to 11 Years | 82 (78.8%) | 163 (69.1%) |
| 12 to 14 Years | 168 (100.0%) | 179 (100.0%) |
| 15 Years | 33 (100.0%) | 28 (100.0%) |
| 16 and 17 Years | 149 (100.0%) | 101 (100.0%) |
| 18 to 24 Years | 341 (100.0%) | 209 (100.0%) |
| 25 to 34 Years | 366 (93.9%) | 308 (90.3%) |
| 35 to 44 Years | 296 (99.7%) | 269 (92.4%) |
| 45 to 54 Years | 325 (81.9%) | 320 (100.0%) |
| 55 to 64 Years | 455 (100.0%) | 467 (97.3%) |
| 65 to 74 Years | 226 (91.1%) | 336 (96.6%) |
| 75 Years and over | 63 (100.0%) | 54 (100.0%) |
| Total | 2,590 (94.1%) | 2,765 (93.9%) |
Income Below Poverty Among Married-Couple Families in Sierra View
The poverty statistics for married-couple families in Sierra View show that 5.5% or 60 of the total 1,099 families live below the poverty line. Families with 1 or 2 children have the highest poverty rate of 13.4%, comprising of 46 families. On the other hand, families with 3 or 4 children have the lowest poverty rate of 0.0%, which includes 0 families.
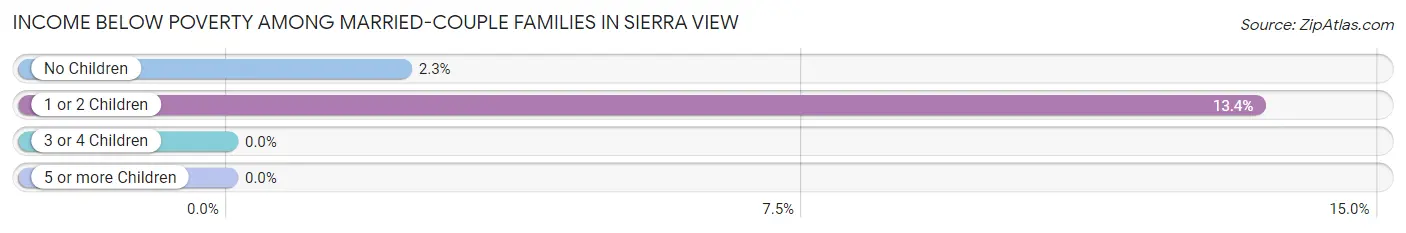
| Children | Above Poverty | Below Poverty |
| No Children | 603 (97.7%) | 14 (2.3%) |
| 1 or 2 Children | 297 (86.6%) | 46 (13.4%) |
| 3 or 4 Children | 139 (100.0%) | 0 (0.0%) |
| 5 or more Children | 0 (0.0%) | 0 (0.0%) |
| Total | 1,039 (94.5%) | 60 (5.5%) |
Income Below Poverty Among Single-Parent Households in Sierra View
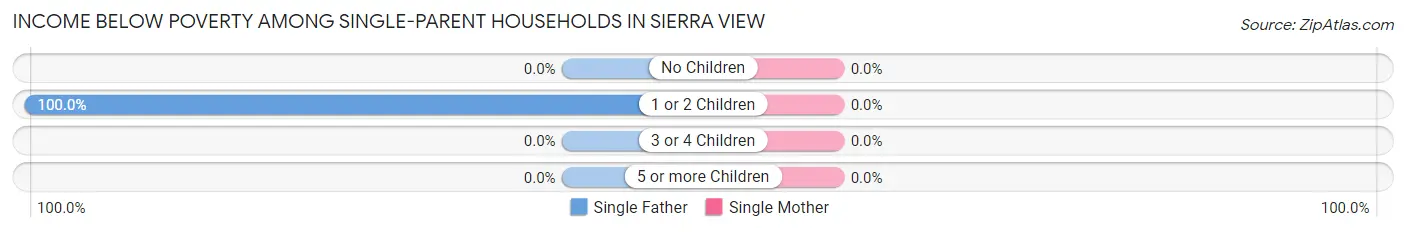
| Children | Single Father | Single Mother |
| No Children | 0 (0.0%) | 0 (0.0%) |
| 1 or 2 Children | 46 (100.0%) | 0 (0.0%) |
| 3 or 4 Children | 0 (0.0%) | 0 (0.0%) |
| 5 or more Children | 0 (0.0%) | 0 (0.0%) |
| Total | 46 (100.0%) | 0 (0.0%) |
Income Below Poverty Among Married-Couple vs Single-Parent Households in Sierra View
The poverty data for Sierra View shows that 60 of the married-couple family households (5.5%) and 46 of the single-parent households (28.2%) are living below the poverty level. Within the married-couple family households, those with 1 or 2 children have the highest poverty rate, with 46 households (13.4%) falling below the poverty line. Among the single-parent households, those with 1 or 2 children have the highest poverty rate, with 46 household (41.8%) living below poverty.
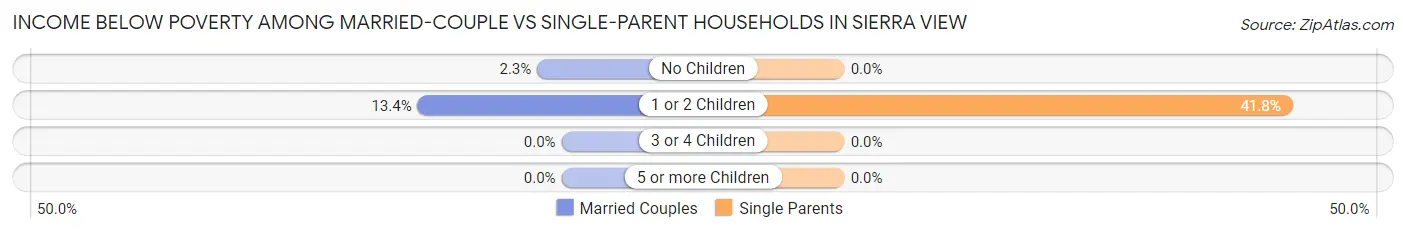
| Children | Married-Couple Families | Single-Parent Households |
| No Children | 14 (2.3%) | 0 (0.0%) |
| 1 or 2 Children | 46 (13.4%) | 46 (41.8%) |
| 3 or 4 Children | 0 (0.0%) | 0 (0.0%) |
| 5 or more Children | 0 (0.0%) | 0 (0.0%) |
| Total | 60 (5.5%) | 46 (28.2%) |
Employment Characteristics in Sierra View
Employment by Class of Employer in Sierra View
Among the 2,532 employed individuals in Sierra View, private company employees (1,954 | 77.2%), not-for-profit organizations (214 | 8.5%), and local government employees (151 | 6.0%) make up the most common classes of employment.
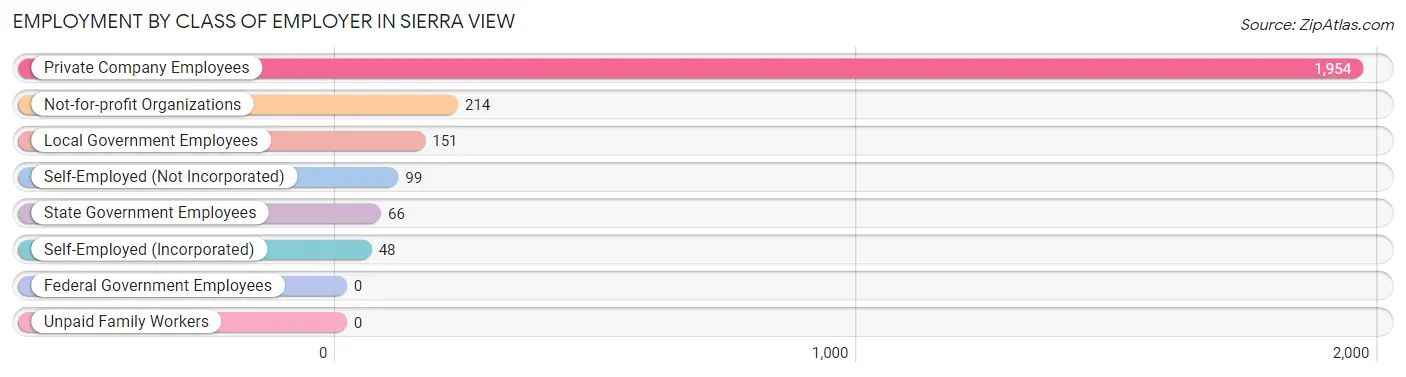
| Employer Class | # Employees | % Employees |
| Private Company Employees | 1,954 | 77.2% |
| Self-Employed (Incorporated) | 48 | 1.9% |
| Self-Employed (Not Incorporated) | 99 | 3.9% |
| Not-for-profit Organizations | 214 | 8.5% |
| Local Government Employees | 151 | 6.0% |
| State Government Employees | 66 | 2.6% |
| Federal Government Employees | 0 | 0.0% |
| Unpaid Family Workers | 0 | 0.0% |
| Total | 2,532 | 100.0% |
Employment Status by Age in Sierra View
According to the labor force statistics for Sierra View, out of the total population over 16 years of age (4,484), 63.8% or 2,861 individuals are in the labor force, with 9.0% or 257 of them unemployed. The age group with the highest labor force participation rate is 30 to 34 years, with 100.0% or 330 individuals in the labor force. Within the labor force, the 16 to 19 years age range has the highest percentage of unemployed individuals, with 62.5% or 180 of them being unemployed.

| Age Bracket | In Labor Force | Unemployed |
| 16 to 19 Years | 288 (88.3%) | 180 (62.5%) |
| 20 to 24 Years | 128 (27.0%) | 0 (0.0%) |
| 25 to 29 Years | 348 (86.8%) | 20 (5.7%) |
| 30 to 34 Years | 330 (100.0%) | 0 (0.0%) |
| 35 to 44 Years | 466 (79.3%) | 0 (0.0%) |
| 45 to 54 Years | 593 (82.7%) | 58 (9.8%) |
| 55 to 59 Years | 312 (76.7%) | 0 (0.0%) |
| 60 to 64 Years | 334 (63.3%) | 0 (0.0%) |
| 65 to 74 Years | 64 (10.7%) | 0 (0.0%) |
| 75 Years and over | 0 (0.0%) | 0 (0.0%) |
| Total | 2,861 (63.8%) | 257 (9.0%) |
Employment Status by Educational Attainment in Sierra View
According to labor force statistics for Sierra View, 80.2% of individuals (2,383) out of the total population between 25 and 64 years of age (2,971) are in the labor force, with 3.3% or 79 of them being unemployed. The group with the highest labor force participation rate are those with the educational attainment of less than high school, with 100.0% or 146 individuals in the labor force. Within the labor force, individuals with high school diploma education have the highest percentage of unemployment, with 5.6% or 46 of them being unemployed.
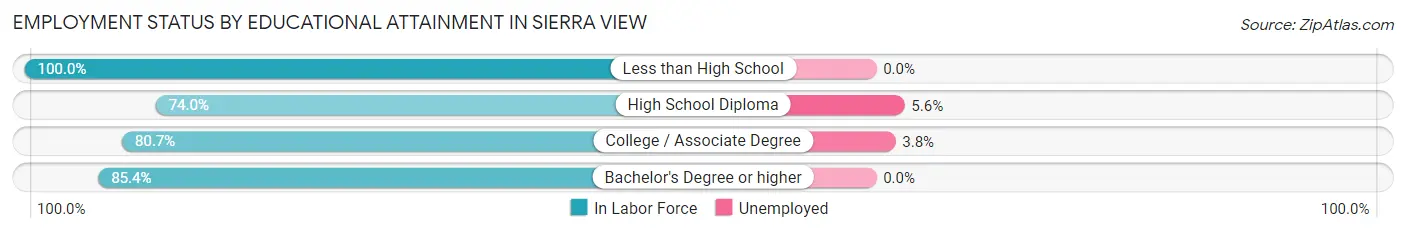
| Educational Attainment | In Labor Force | Unemployed |
| Less than High School | 146 (100.0%) | 0 (0.0%) |
| High School Diploma | 818 (74.0%) | 62 (5.6%) |
| College / Associate Degree | 847 (80.7%) | 40 (3.8%) |
| Bachelor's Degree or higher | 572 (85.4%) | 0 (0.0%) |
| Total | 2,383 (80.2%) | 98 (3.3%) |
Employment Occupations by Sex in Sierra View
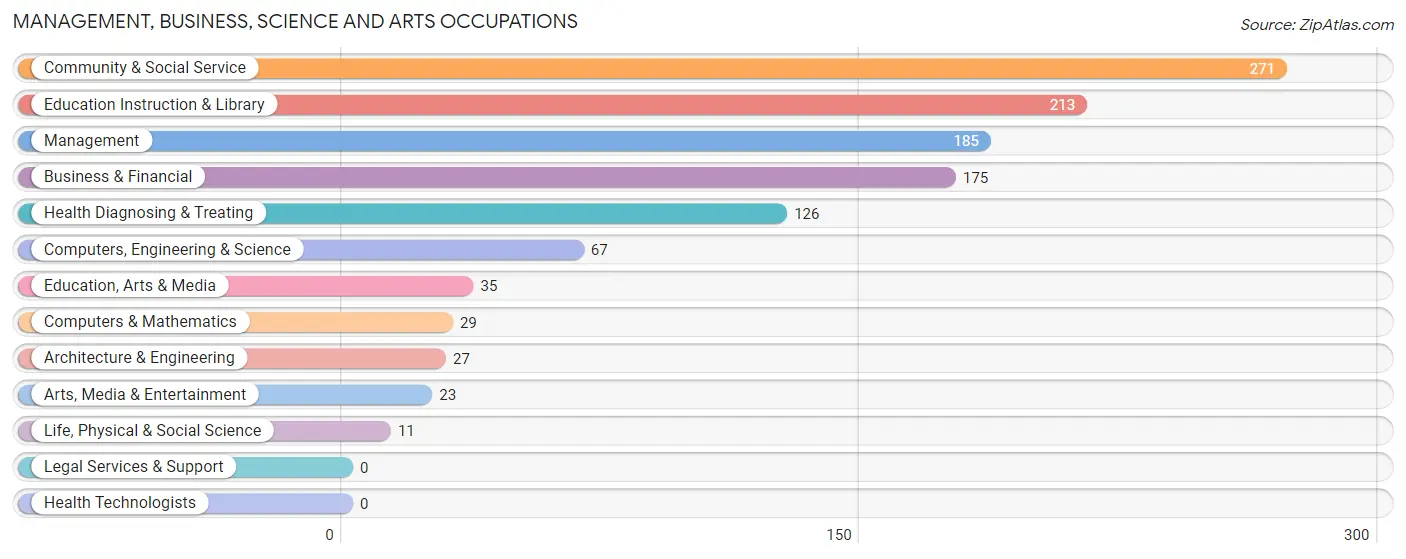
Management, Business, Science and Arts Occupations
The most common Management, Business, Science and Arts occupations in Sierra View are Community & Social Service (271 | 10.4%), Education Instruction & Library (213 | 8.2%), Management (185 | 7.1%), Business & Financial (175 | 6.7%), and Health Diagnosing & Treating (126 | 4.8%).
Management, Business, Science and Arts Occupations by Sex
Within the Management, Business, Science and Arts occupations in Sierra View, the most male-oriented occupations are Architecture & Engineering (100.0%), Arts, Media & Entertainment (100.0%), and Computers, Engineering & Science (68.7%), while the most female-oriented occupations are Life, Physical & Social Science (100.0%), Education, Arts & Media (100.0%), and Education Instruction & Library (100.0%).

| Occupation | Male | Female |
| Management | 90 (48.6%) | 95 (51.3%) |
| Business & Financial | 100 (57.1%) | 75 (42.9%) |
| Computers, Engineering & Science | 46 (68.7%) | 21 (31.3%) |
| Computers & Mathematics | 19 (65.5%) | 10 (34.5%) |
| Architecture & Engineering | 27 (100.0%) | 0 (0.0%) |
| Life, Physical & Social Science | 0 (0.0%) | 11 (100.0%) |
| Community & Social Service | 23 (8.5%) | 248 (91.5%) |
| Education, Arts & Media | 0 (0.0%) | 35 (100.0%) |
| Legal Services & Support | 0 (0.0%) | 0 (0.0%) |
| Education Instruction & Library | 0 (0.0%) | 213 (100.0%) |
| Arts, Media & Entertainment | 23 (100.0%) | 0 (0.0%) |
| Health Diagnosing & Treating | 37 (29.4%) | 89 (70.6%) |
| Health Technologists | 0 (0.0%) | 0 (0.0%) |
| Total (Category) | 296 (35.9%) | 528 (64.1%) |
| Total (Overall) | 1,362 (52.3%) | 1,243 (47.7%) |
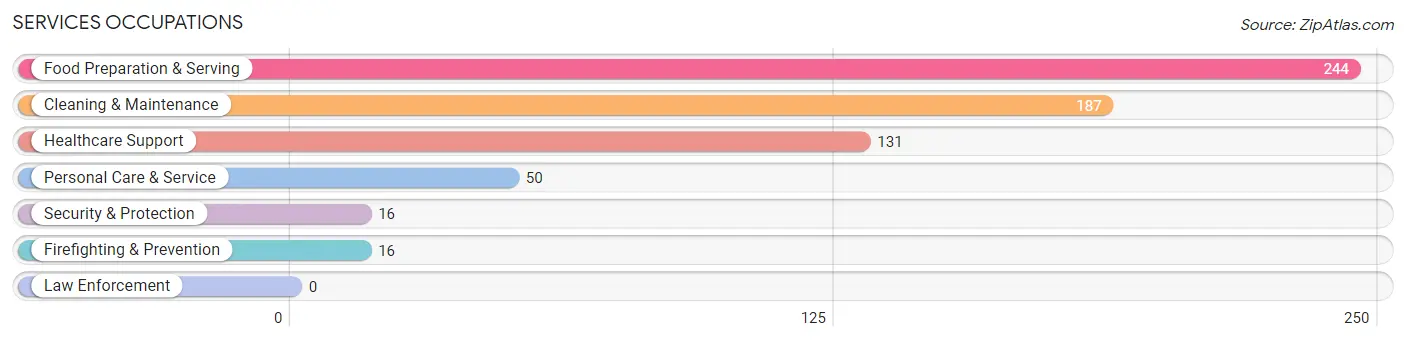
Services Occupations
The most common Services occupations in Sierra View are Food Preparation & Serving (244 | 9.4%), Cleaning & Maintenance (187 | 7.2%), Healthcare Support (131 | 5.0%), Personal Care & Service (50 | 1.9%), and Security & Protection (16 | 0.6%).
Services Occupations by Sex
Within the Services occupations in Sierra View, the most male-oriented occupations are Security & Protection (100.0%), Firefighting & Prevention (100.0%), and Personal Care & Service (100.0%), while the most female-oriented occupations are Food Preparation & Serving (70.1%), Healthcare Support (61.8%), and Cleaning & Maintenance (23.0%).
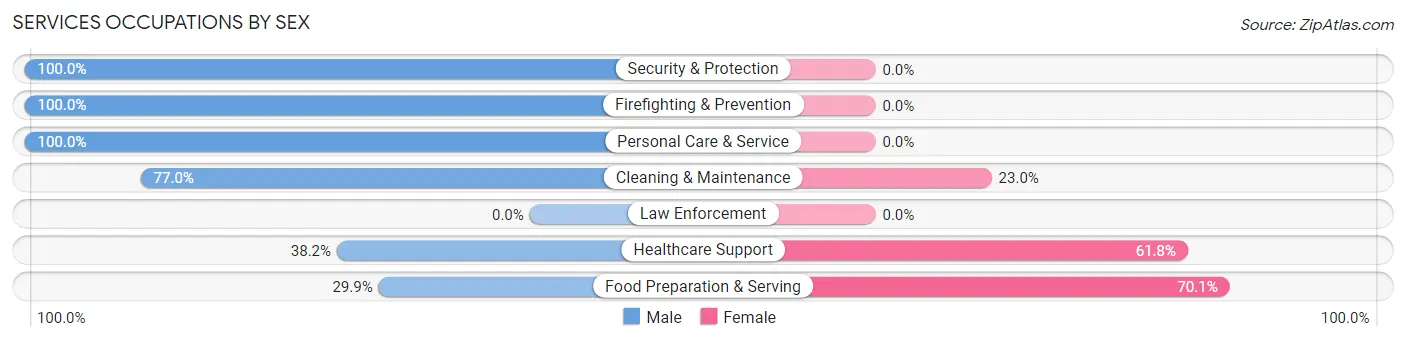
| Occupation | Male | Female |
| Healthcare Support | 50 (38.2%) | 81 (61.8%) |
| Security & Protection | 16 (100.0%) | 0 (0.0%) |
| Firefighting & Prevention | 16 (100.0%) | 0 (0.0%) |
| Law Enforcement | 0 (0.0%) | 0 (0.0%) |
| Food Preparation & Serving | 73 (29.9%) | 171 (70.1%) |
| Cleaning & Maintenance | 144 (77.0%) | 43 (23.0%) |
| Personal Care & Service | 50 (100.0%) | 0 (0.0%) |
| Total (Category) | 333 (53.0%) | 295 (47.0%) |
| Total (Overall) | 1,362 (52.3%) | 1,243 (47.7%) |
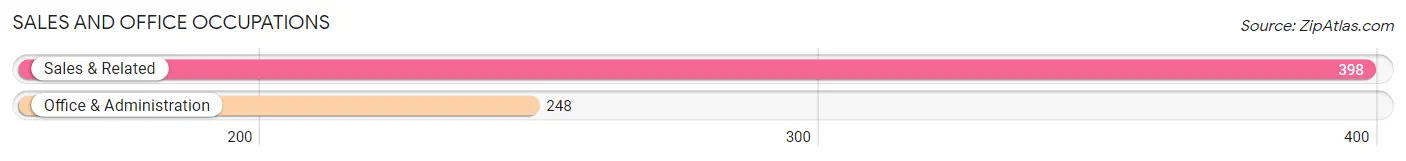
Sales and Office Occupations
The most common Sales and Office occupations in Sierra View are Sales & Related (398 | 15.3%), and Office & Administration (248 | 9.5%).
Sales and Office Occupations by Sex
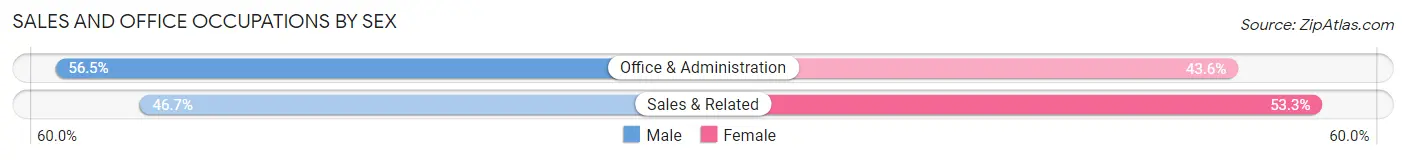
| Occupation | Male | Female |
| Sales & Related | 186 (46.7%) | 212 (53.3%) |
| Office & Administration | 140 (56.5%) | 108 (43.5%) |
| Total (Category) | 326 (50.5%) | 320 (49.5%) |
| Total (Overall) | 1,362 (52.3%) | 1,243 (47.7%) |
Natural Resources, Construction and Maintenance Occupations
The most common Natural Resources, Construction and Maintenance occupations in Sierra View are Construction & Extraction (83 | 3.2%), and Installation, Maintenance & Repair (75 | 2.9%).
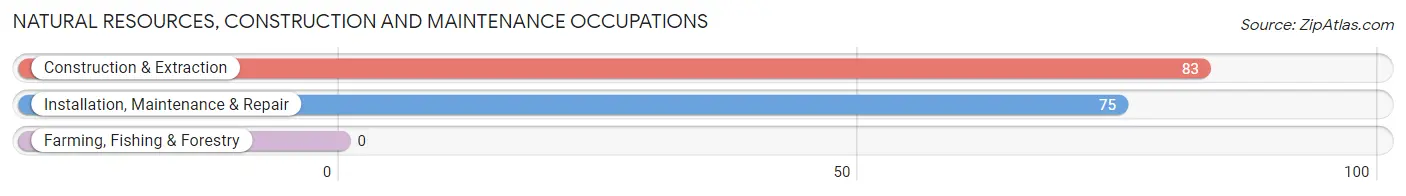
Natural Resources, Construction and Maintenance Occupations by Sex
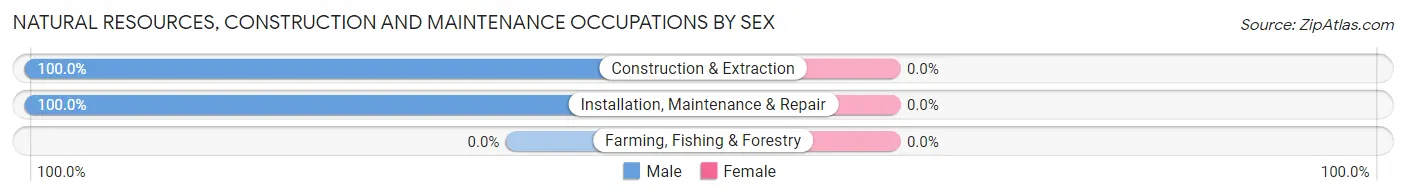
| Occupation | Male | Female |
| Farming, Fishing & Forestry | 0 (0.0%) | 0 (0.0%) |
| Construction & Extraction | 83 (100.0%) | 0 (0.0%) |
| Installation, Maintenance & Repair | 75 (100.0%) | 0 (0.0%) |
| Total (Category) | 158 (100.0%) | 0 (0.0%) |
| Total (Overall) | 1,362 (52.3%) | 1,243 (47.7%) |
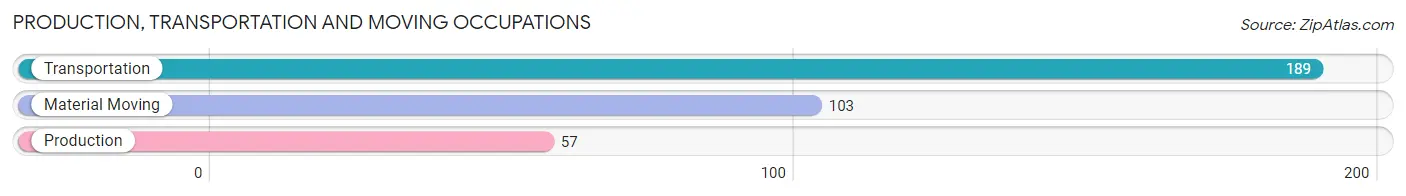
Production, Transportation and Moving Occupations
The most common Production, Transportation and Moving occupations in Sierra View are Transportation (189 | 7.3%), Material Moving (103 | 4.0%), and Production (57 | 2.2%).
Production, Transportation and Moving Occupations by Sex
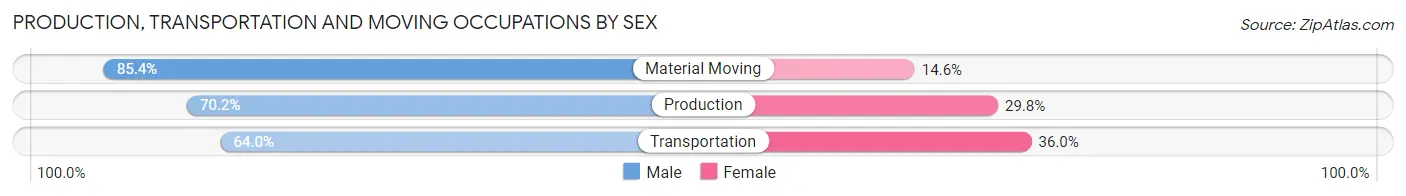
| Occupation | Male | Female |
| Production | 40 (70.2%) | 17 (29.8%) |
| Transportation | 121 (64.0%) | 68 (36.0%) |
| Material Moving | 88 (85.4%) | 15 (14.6%) |
| Total (Category) | 249 (71.4%) | 100 (28.6%) |
| Total (Overall) | 1,362 (52.3%) | 1,243 (47.7%) |
Employment Industries by Sex in Sierra View
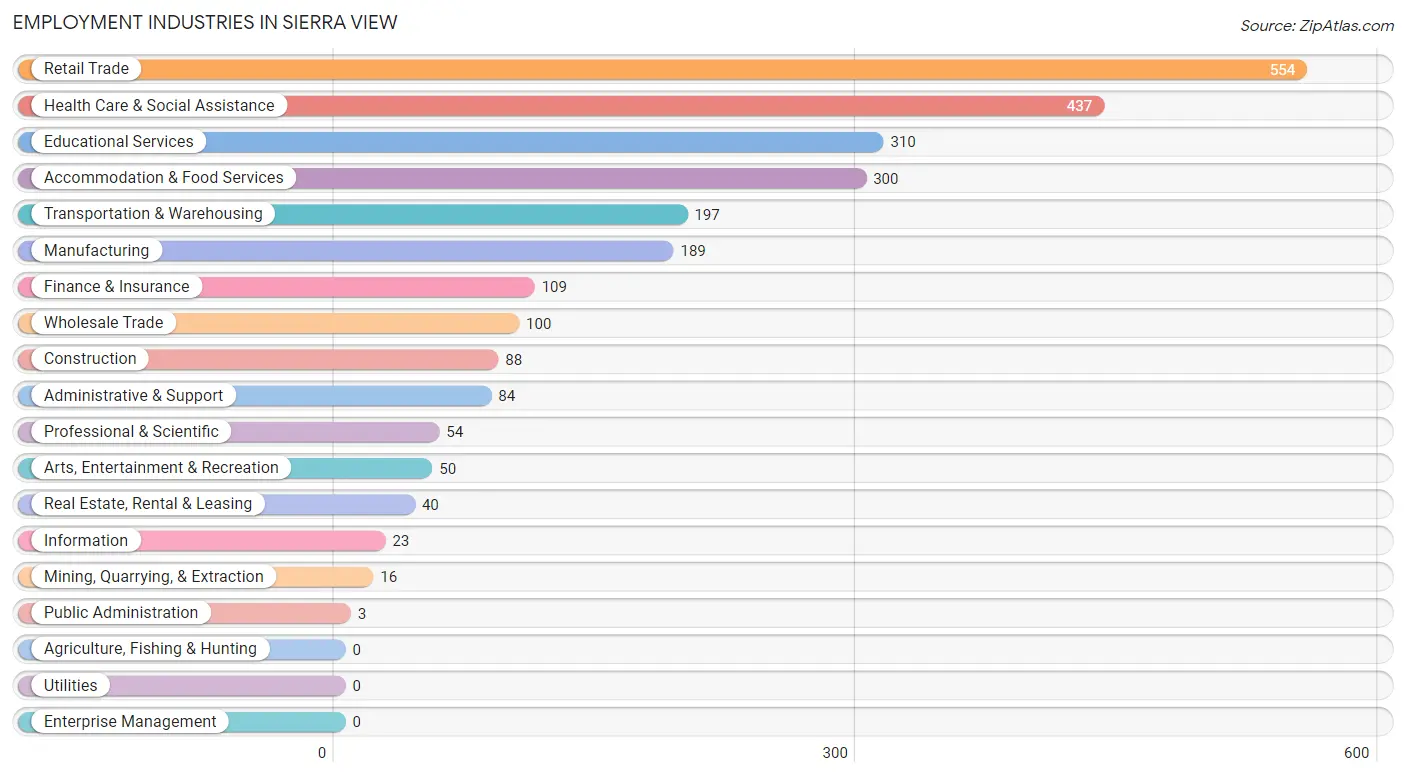
Employment Industries in Sierra View
The major employment industries in Sierra View include Retail Trade (554 | 21.3%), Health Care & Social Assistance (437 | 16.8%), Educational Services (310 | 11.9%), Accommodation & Food Services (300 | 11.5%), and Transportation & Warehousing (197 | 7.6%).
Employment Industries by Sex in Sierra View
The Sierra View industries that see more men than women are Mining, Quarrying, & Extraction (100.0%), Construction (100.0%), and Wholesale Trade (100.0%), whereas the industries that tend to have a higher number of women are Real Estate, Rental & Leasing (100.0%), Educational Services (100.0%), and Public Administration (100.0%).
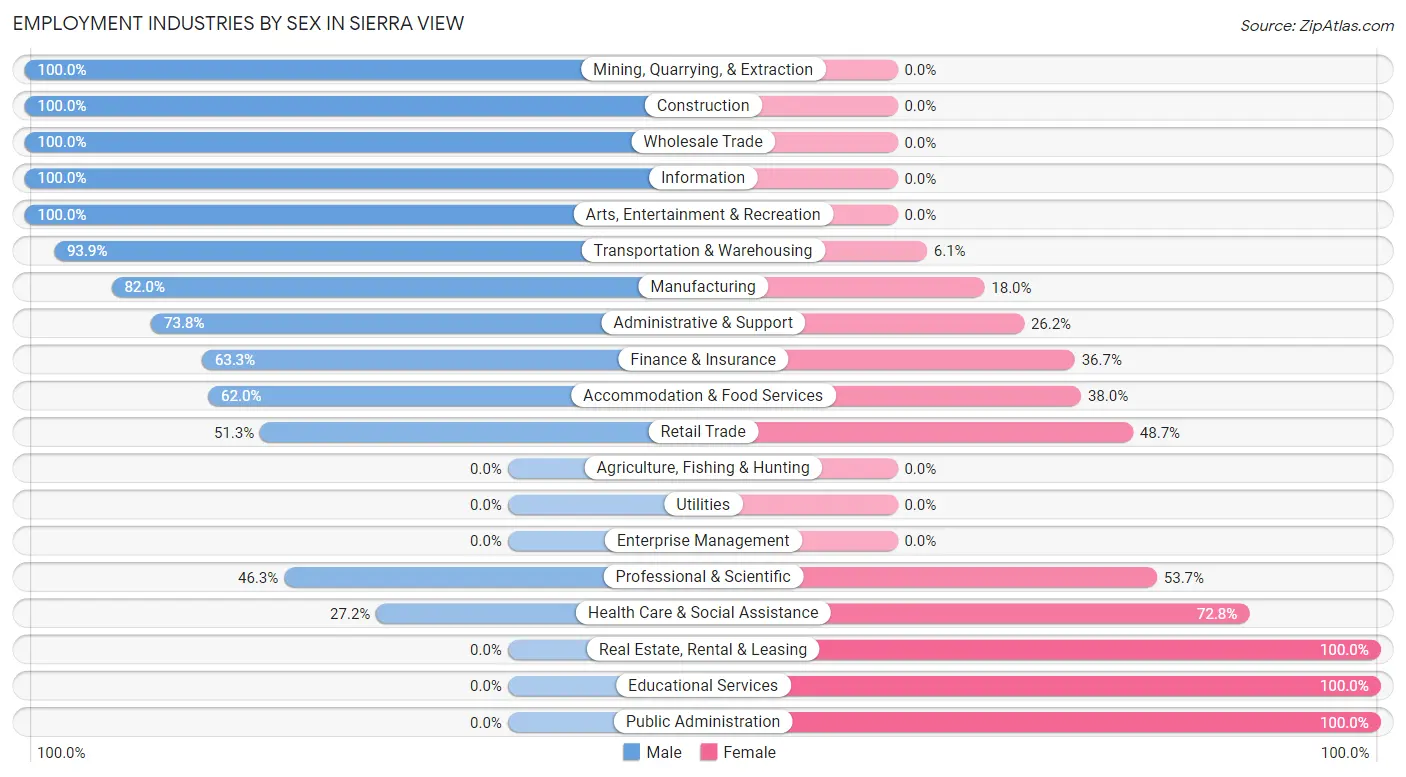
| Industry | Male | Female |
| Agriculture, Fishing & Hunting | 0 (0.0%) | 0 (0.0%) |
| Mining, Quarrying, & Extraction | 16 (100.0%) | 0 (0.0%) |
| Construction | 88 (100.0%) | 0 (0.0%) |
| Manufacturing | 155 (82.0%) | 34 (18.0%) |
| Wholesale Trade | 100 (100.0%) | 0 (0.0%) |
| Retail Trade | 284 (51.3%) | 270 (48.7%) |
| Transportation & Warehousing | 185 (93.9%) | 12 (6.1%) |
| Utilities | 0 (0.0%) | 0 (0.0%) |
| Information | 23 (100.0%) | 0 (0.0%) |
| Finance & Insurance | 69 (63.3%) | 40 (36.7%) |
| Real Estate, Rental & Leasing | 0 (0.0%) | 40 (100.0%) |
| Professional & Scientific | 25 (46.3%) | 29 (53.7%) |
| Enterprise Management | 0 (0.0%) | 0 (0.0%) |
| Administrative & Support | 62 (73.8%) | 22 (26.2%) |
| Educational Services | 0 (0.0%) | 310 (100.0%) |
| Health Care & Social Assistance | 119 (27.2%) | 318 (72.8%) |
| Arts, Entertainment & Recreation | 50 (100.0%) | 0 (0.0%) |
| Accommodation & Food Services | 186 (62.0%) | 114 (38.0%) |
| Public Administration | 0 (0.0%) | 3 (100.0%) |
| Total | 1,362 (52.3%) | 1,243 (47.7%) |
Education in Sierra View
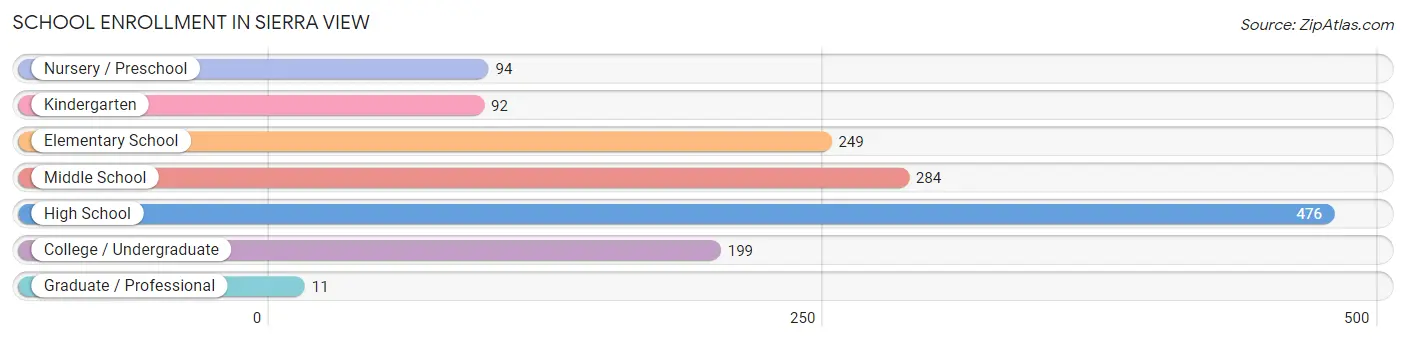
School Enrollment in Sierra View
The most common levels of schooling among the 1,405 students in Sierra View are high school (476 | 33.9%), middle school (284 | 20.2%), and elementary school (249 | 17.7%).
| School Level | # Students | % Students |
| Nursery / Preschool | 94 | 6.7% |
| Kindergarten | 92 | 6.6% |
| Elementary School | 249 | 17.7% |
| Middle School | 284 | 20.2% |
| High School | 476 | 33.9% |
| College / Undergraduate | 199 | 14.2% |
| Graduate / Professional | 11 | 0.8% |
| Total | 1,405 | 100.0% |
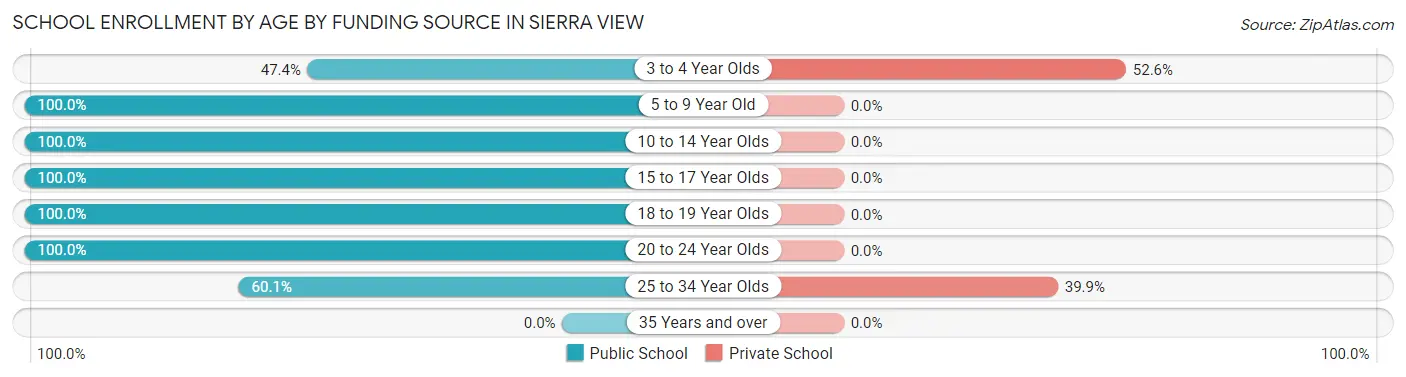
School Enrollment by Age by Funding Source in Sierra View
Out of a total of 1,405 students who are enrolled in schools in Sierra View, 110 (7.8%) attend a private institution, while the remaining 1,295 (92.2%) are enrolled in public schools. The age group of 3 to 4 year olds has the highest likelihood of being enrolled in private schools, with 41 (52.6% in the age bracket) enrolled. Conversely, the age group of 5 to 9 year old has the lowest likelihood of being enrolled in a private school, with 303 (100.0% in the age bracket) attending a public institution.
| Age Bracket | Public School | Private School |
| 3 to 4 Year Olds | 37 (47.4%) | 41 (52.6%) |
| 5 to 9 Year Old | 303 (100.0%) | 0 (0.0%) |
| 10 to 14 Year Olds | 465 (100.0%) | 0 (0.0%) |
| 15 to 17 Year Olds | 311 (100.0%) | 0 (0.0%) |
| 18 to 19 Year Olds | 65 (100.0%) | 0 (0.0%) |
| 20 to 24 Year Olds | 10 (100.0%) | 0 (0.0%) |
| 25 to 34 Year Olds | 104 (60.1%) | 69 (39.9%) |
| 35 Years and over | 0 (0.0%) | 0 (0.0%) |
| Total | 1,295 (92.2%) | 110 (7.8%) |
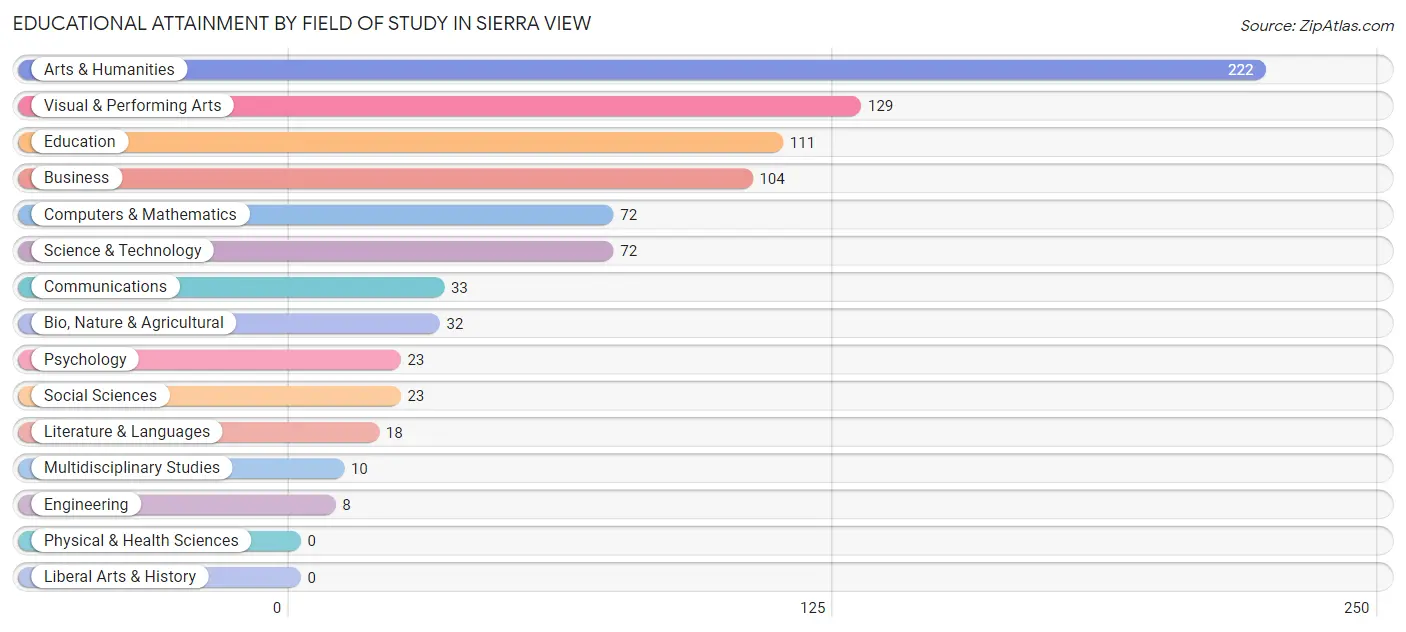
Educational Attainment by Field of Study in Sierra View
Arts & humanities (222 | 25.9%), visual & performing arts (129 | 15.0%), education (111 | 13.0%), business (104 | 12.1%), and computers & mathematics (72 | 8.4%) are the most common fields of study among 857 individuals in Sierra View who have obtained a bachelor's degree or higher.
| Field of Study | # Graduates | % Graduates |
| Computers & Mathematics | 72 | 8.4% |
| Bio, Nature & Agricultural | 32 | 3.7% |
| Physical & Health Sciences | 0 | 0.0% |
| Psychology | 23 | 2.7% |
| Social Sciences | 23 | 2.7% |
| Engineering | 8 | 0.9% |
| Multidisciplinary Studies | 10 | 1.2% |
| Science & Technology | 72 | 8.4% |
| Business | 104 | 12.1% |
| Education | 111 | 13.0% |
| Literature & Languages | 18 | 2.1% |
| Liberal Arts & History | 0 | 0.0% |
| Visual & Performing Arts | 129 | 15.0% |
| Communications | 33 | 3.8% |
| Arts & Humanities | 222 | 25.9% |
| Total | 857 | 100.0% |
Transportation & Commute in Sierra View
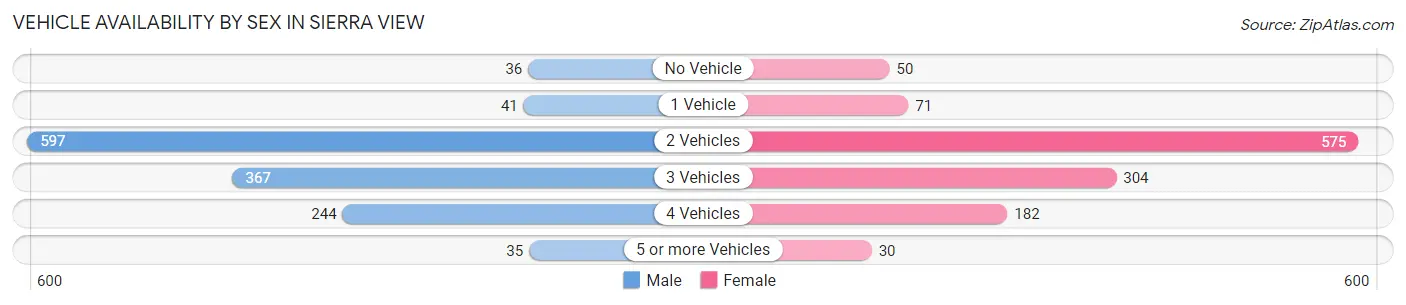
Vehicle Availability by Sex in Sierra View
The most prevalent vehicle ownership categories in Sierra View are males with 2 vehicles (597, accounting for 45.2%) and females with 2 vehicles (575, making up 49.3%).
| Vehicles Available | Male | Female |
| No Vehicle | 36 (2.7%) | 50 (4.1%) |
| 1 Vehicle | 41 (3.1%) | 71 (5.9%) |
| 2 Vehicles | 597 (45.2%) | 575 (47.4%) |
| 3 Vehicles | 367 (27.8%) | 304 (25.1%) |
| 4 Vehicles | 244 (18.5%) | 182 (15.0%) |
| 5 or more Vehicles | 35 (2.6%) | 30 (2.5%) |
| Total | 1,320 (100.0%) | 1,212 (100.0%) |
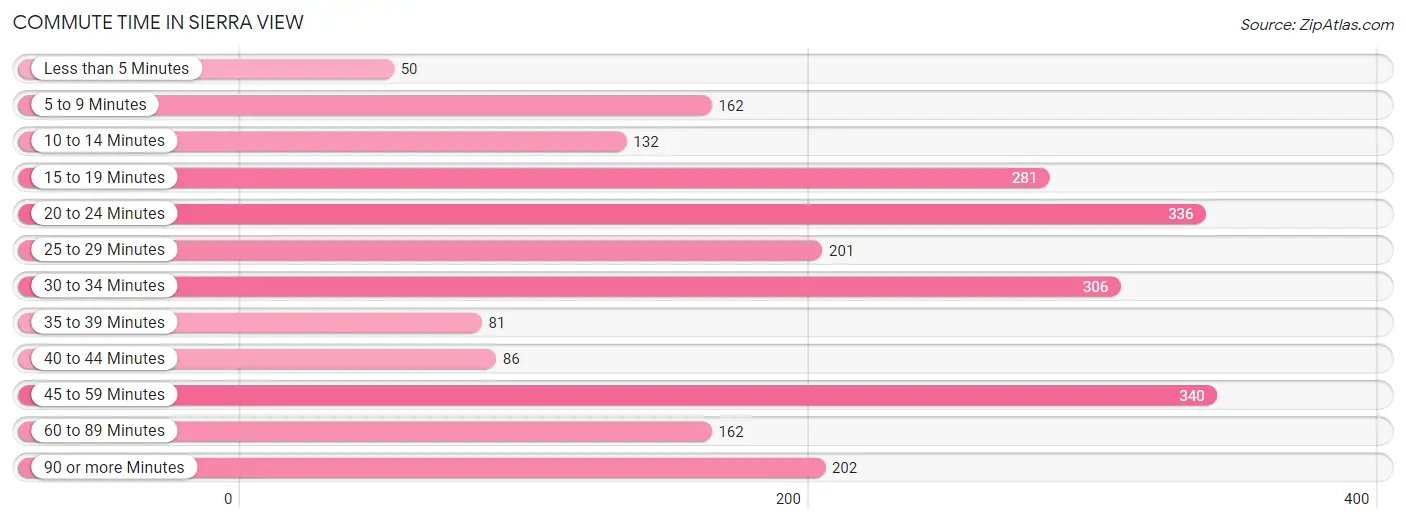
Commute Time in Sierra View
The most frequently occuring commute durations in Sierra View are 45 to 59 minutes (340 commuters, 14.5%), 20 to 24 minutes (336 commuters, 14.4%), and 30 to 34 minutes (306 commuters, 13.1%).
| Commute Time | # Commuters | % Commuters |
| Less than 5 Minutes | 50 | 2.1% |
| 5 to 9 Minutes | 162 | 6.9% |
| 10 to 14 Minutes | 132 | 5.6% |
| 15 to 19 Minutes | 281 | 12.0% |
| 20 to 24 Minutes | 336 | 14.4% |
| 25 to 29 Minutes | 201 | 8.6% |
| 30 to 34 Minutes | 306 | 13.1% |
| 35 to 39 Minutes | 81 | 3.5% |
| 40 to 44 Minutes | 86 | 3.7% |
| 45 to 59 Minutes | 340 | 14.5% |
| 60 to 89 Minutes | 162 | 6.9% |
| 90 or more Minutes | 202 | 8.6% |
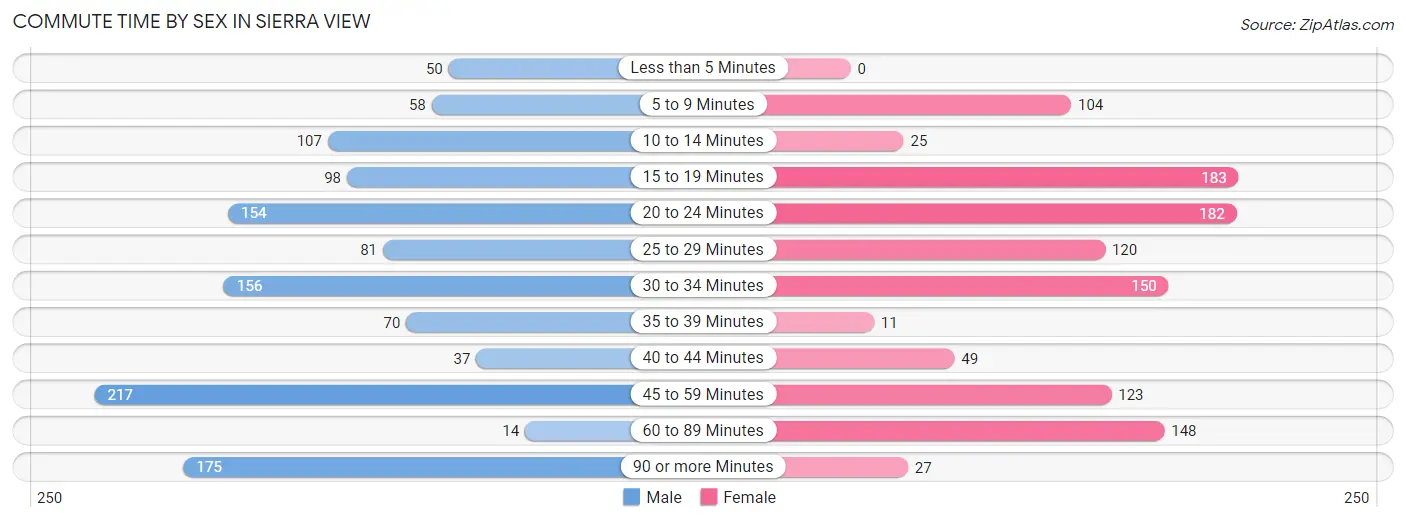
Commute Time by Sex in Sierra View
The most common commute times in Sierra View are 45 to 59 minutes (217 commuters, 17.8%) for males and 15 to 19 minutes (183 commuters, 16.3%) for females.
| Commute Time | Male | Female |
| Less than 5 Minutes | 50 (4.1%) | 0 (0.0%) |
| 5 to 9 Minutes | 58 (4.8%) | 104 (9.3%) |
| 10 to 14 Minutes | 107 (8.8%) | 25 (2.2%) |
| 15 to 19 Minutes | 98 (8.1%) | 183 (16.3%) |
| 20 to 24 Minutes | 154 (12.7%) | 182 (16.2%) |
| 25 to 29 Minutes | 81 (6.7%) | 120 (10.7%) |
| 30 to 34 Minutes | 156 (12.8%) | 150 (13.4%) |
| 35 to 39 Minutes | 70 (5.8%) | 11 (1.0%) |
| 40 to 44 Minutes | 37 (3.0%) | 49 (4.4%) |
| 45 to 59 Minutes | 217 (17.8%) | 123 (11.0%) |
| 60 to 89 Minutes | 14 (1.1%) | 148 (13.2%) |
| 90 or more Minutes | 175 (14.4%) | 27 (2.4%) |
Time of Departure to Work by Sex in Sierra View
The most frequent times of departure to work in Sierra View are 4:00 PM to 11:59 PM (240, 19.7%) for males and 7:30 AM to 7:59 AM (251, 22.4%) for females.

| Time of Departure | Male | Female |
| 12:00 AM to 4:59 AM | 87 (7.1%) | 104 (9.3%) |
| 5:00 AM to 5:29 AM | 111 (9.1%) | 29 (2.6%) |
| 5:30 AM to 5:59 AM | 37 (3.0%) | 6 (0.5%) |
| 6:00 AM to 6:29 AM | 153 (12.6%) | 70 (6.2%) |
| 6:30 AM to 6:59 AM | 30 (2.5%) | 68 (6.1%) |
| 7:00 AM to 7:29 AM | 38 (3.1%) | 11 (1.0%) |
| 7:30 AM to 7:59 AM | 208 (17.1%) | 251 (22.4%) |
| 8:00 AM to 8:29 AM | 56 (4.6%) | 110 (9.8%) |
| 8:30 AM to 8:59 AM | 63 (5.2%) | 66 (5.9%) |
| 9:00 AM to 9:59 AM | 46 (3.8%) | 117 (10.4%) |
| 10:00 AM to 10:59 AM | 44 (3.6%) | 29 (2.6%) |
| 11:00 AM to 11:59 AM | 0 (0.0%) | 0 (0.0%) |
| 12:00 PM to 3:59 PM | 104 (8.6%) | 183 (16.3%) |
| 4:00 PM to 11:59 PM | 240 (19.7%) | 78 (7.0%) |
| Total | 1,217 (100.0%) | 1,122 (100.0%) |
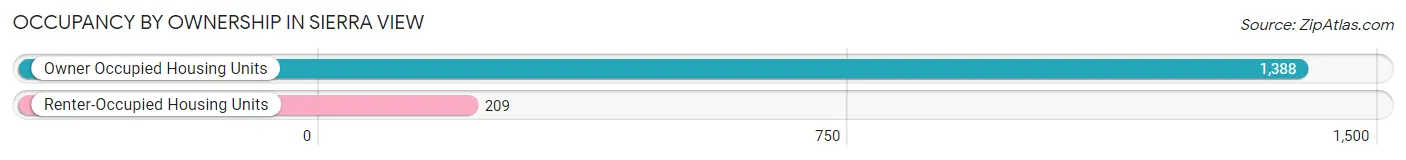
Housing Occupancy in Sierra View
Occupancy by Ownership in Sierra View
Of the total 1,597 dwellings in Sierra View, owner-occupied units account for 1,388 (86.9%), while renter-occupied units make up 209 (13.1%).
| Occupancy | # Housing Units | % Housing Units |
| Owner Occupied Housing Units | 1,388 | 86.9% |
| Renter-Occupied Housing Units | 209 | 13.1% |
| Total Occupied Housing Units | 1,597 | 100.0% |
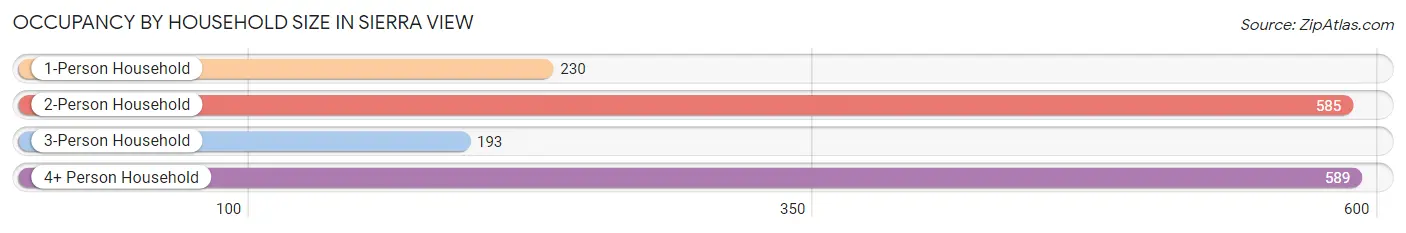
Occupancy by Household Size in Sierra View
| Household Size | # Housing Units | % Housing Units |
| 1-Person Household | 230 | 14.4% |
| 2-Person Household | 585 | 36.6% |
| 3-Person Household | 193 | 12.1% |
| 4+ Person Household | 589 | 36.9% |
| Total Housing Units | 1,597 | 100.0% |
Occupancy by Ownership by Household Size in Sierra View

| Household Size | Owner-occupied | Renter-occupied |
| 1-Person Household | 230 (100.0%) | 0 (0.0%) |
| 2-Person Household | 474 (81.0%) | 111 (19.0%) |
| 3-Person Household | 183 (94.8%) | 10 (5.2%) |
| 4+ Person Household | 501 (85.1%) | 88 (14.9%) |
| Total Housing Units | 1,388 (86.9%) | 209 (13.1%) |
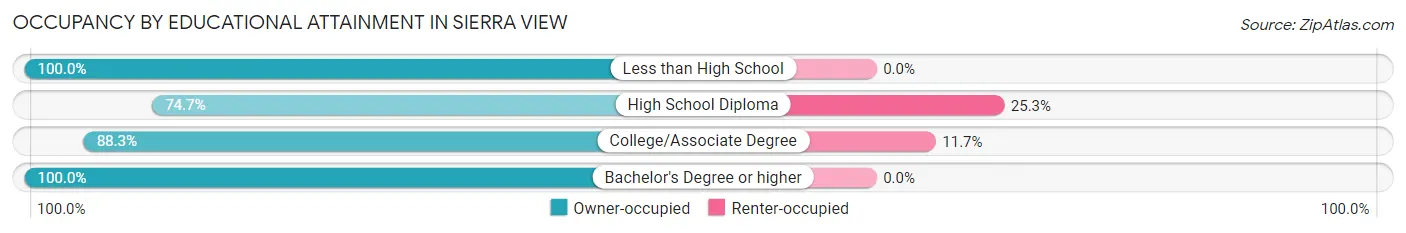
Occupancy by Educational Attainment in Sierra View
| Household Size | Owner-occupied | Renter-occupied |
| Less than High School | 37 (100.0%) | 0 (0.0%) |
| High School Diploma | 357 (74.7%) | 121 (25.3%) |
| College/Associate Degree | 662 (88.3%) | 88 (11.7%) |
| Bachelor's Degree or higher | 332 (100.0%) | 0 (0.0%) |
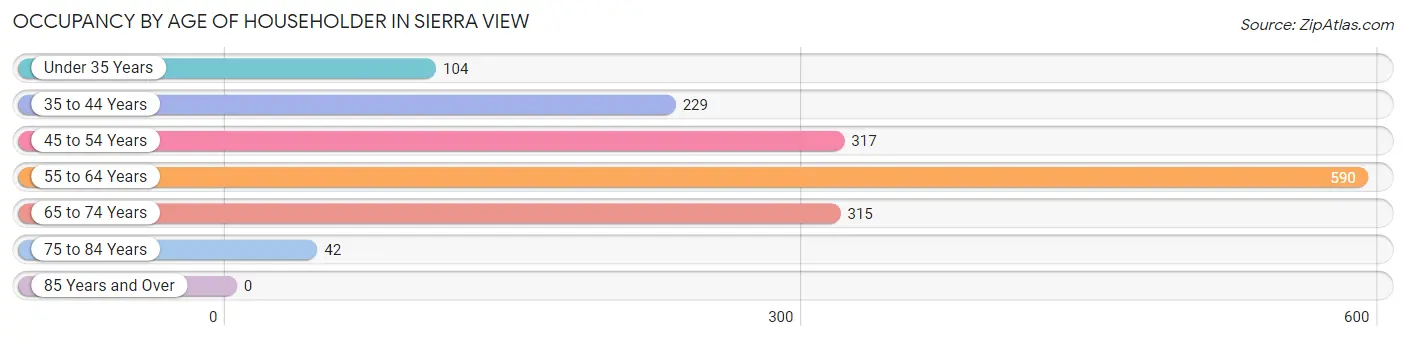
Occupancy by Age of Householder in Sierra View
| Age Bracket | # Households | % Households |
| Under 35 Years | 104 | 6.5% |
| 35 to 44 Years | 229 | 14.3% |
| 45 to 54 Years | 317 | 19.9% |
| 55 to 64 Years | 590 | 36.9% |
| 65 to 74 Years | 315 | 19.7% |
| 75 to 84 Years | 42 | 2.6% |
| 85 Years and Over | 0 | 0.0% |
| Total | 1,597 | 100.0% |
Housing Finances in Sierra View
Median Income by Occupancy in Sierra View
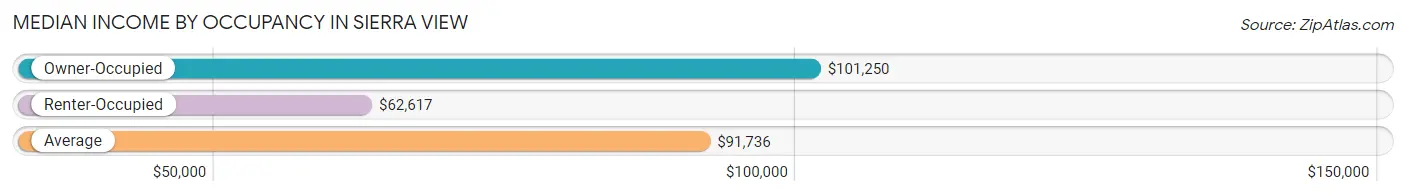
| Occupancy Type | # Households | Median Income |
| Owner-Occupied | 1,388 (86.9%) | $101,250 |
| Renter-Occupied | 209 (13.1%) | $62,617 |
| Average | 1,597 (100.0%) | $91,736 |
Occupancy by Householder Income Bracket in Sierra View
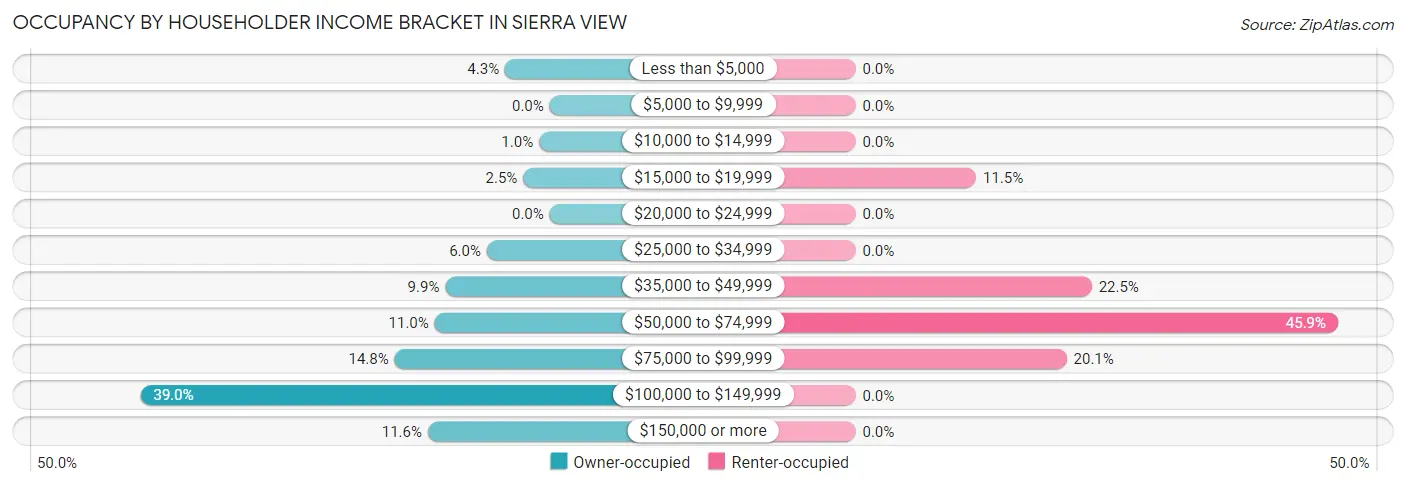
| Income Bracket | Owner-occupied | Renter-occupied |
| Less than $5,000 | 59 (4.3%) | 0 (0.0%) |
| $5,000 to $9,999 | 0 (0.0%) | 0 (0.0%) |
| $10,000 to $14,999 | 14 (1.0%) | 0 (0.0%) |
| $15,000 to $19,999 | 35 (2.5%) | 24 (11.5%) |
| $20,000 to $24,999 | 0 (0.0%) | 0 (0.0%) |
| $25,000 to $34,999 | 83 (6.0%) | 0 (0.0%) |
| $35,000 to $49,999 | 138 (9.9%) | 47 (22.5%) |
| $50,000 to $74,999 | 152 (11.0%) | 96 (45.9%) |
| $75,000 to $99,999 | 205 (14.8%) | 42 (20.1%) |
| $100,000 to $149,999 | 541 (39.0%) | 0 (0.0%) |
| $150,000 or more | 161 (11.6%) | 0 (0.0%) |
| Total | 1,388 (100.0%) | 209 (100.0%) |
Monthly Housing Cost Tiers in Sierra View

| Monthly Cost | Owner-occupied | Renter-occupied |
| Less than $300 | 0 (0.0%) | 0 (0.0%) |
| $300 to $499 | 27 (1.9%) | 0 (0.0%) |
| $500 to $799 | 248 (17.9%) | 32 (15.3%) |
| $800 to $999 | 87 (6.3%) | 32 (15.3%) |
| $1,000 to $1,499 | 369 (26.6%) | 34 (16.3%) |
| $1,500 to $1,999 | 135 (9.7%) | 79 (37.8%) |
| $2,000 to $2,499 | 116 (8.4%) | 0 (0.0%) |
| $2,500 to $2,999 | 373 (26.9%) | 0 (0.0%) |
| $3,000 or more | 33 (2.4%) | 0 (0.0%) |
| Total | 1,388 (100.0%) | 209 (100.0%) |
Physical Housing Characteristics in Sierra View
Housing Structures in Sierra View
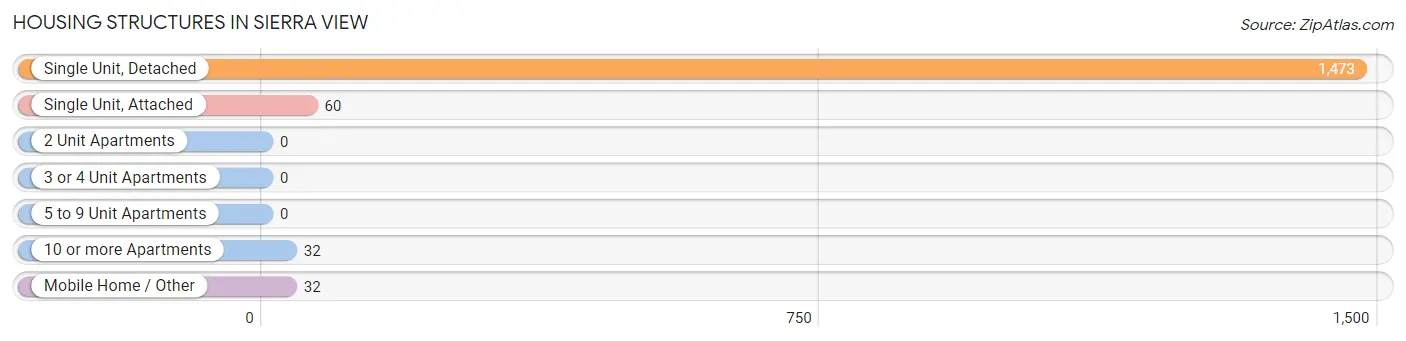
| Structure Type | # Housing Units | % Housing Units |
| Single Unit, Detached | 1,473 | 92.2% |
| Single Unit, Attached | 60 | 3.8% |
| 2 Unit Apartments | 0 | 0.0% |
| 3 or 4 Unit Apartments | 0 | 0.0% |
| 5 to 9 Unit Apartments | 0 | 0.0% |
| 10 or more Apartments | 32 | 2.0% |
| Mobile Home / Other | 32 | 2.0% |
| Total | 1,597 | 100.0% |
Housing Structures by Occupancy in Sierra View
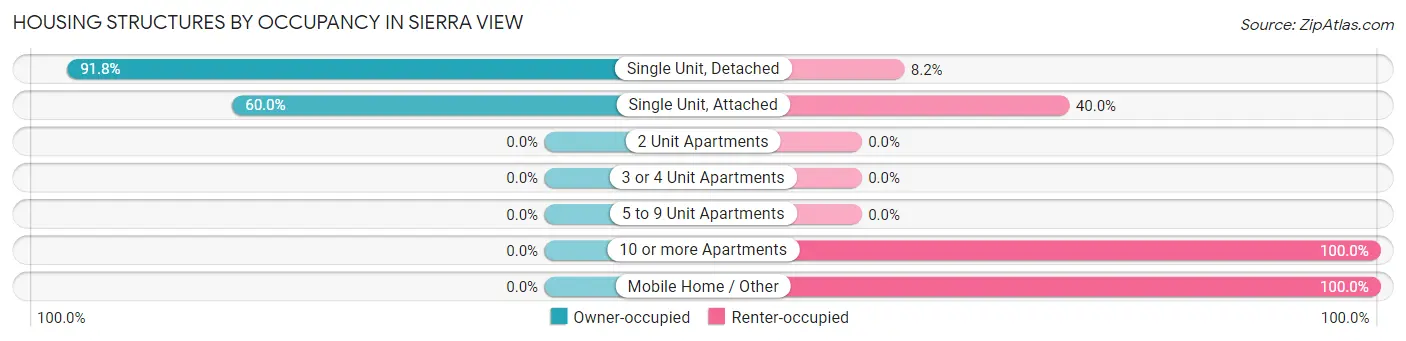
| Structure Type | Owner-occupied | Renter-occupied |
| Single Unit, Detached | 1,352 (91.8%) | 121 (8.2%) |
| Single Unit, Attached | 36 (60.0%) | 24 (40.0%) |
| 2 Unit Apartments | 0 (0.0%) | 0 (0.0%) |
| 3 or 4 Unit Apartments | 0 (0.0%) | 0 (0.0%) |
| 5 to 9 Unit Apartments | 0 (0.0%) | 0 (0.0%) |
| 10 or more Apartments | 0 (0.0%) | 32 (100.0%) |
| Mobile Home / Other | 0 (0.0%) | 32 (100.0%) |
| Total | 1,388 (86.9%) | 209 (13.1%) |
Housing Structures by Number of Rooms in Sierra View
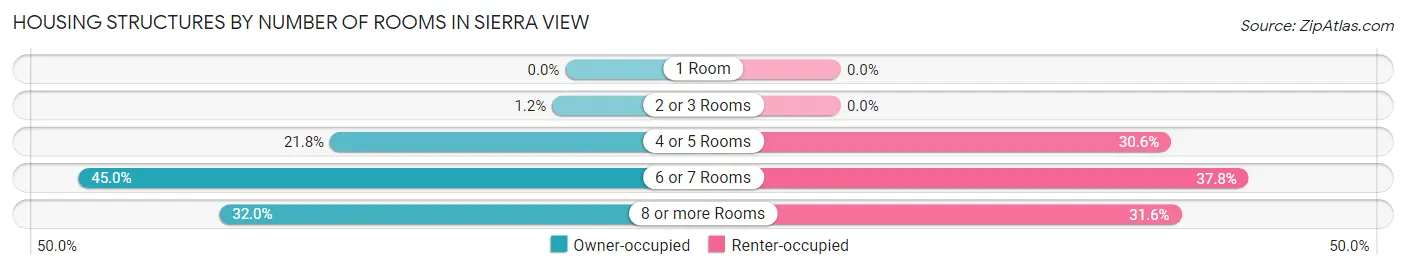
| Number of Rooms | Owner-occupied | Renter-occupied |
| 1 Room | 0 (0.0%) | 0 (0.0%) |
| 2 or 3 Rooms | 17 (1.2%) | 0 (0.0%) |
| 4 or 5 Rooms | 302 (21.8%) | 64 (30.6%) |
| 6 or 7 Rooms | 625 (45.0%) | 79 (37.8%) |
| 8 or more Rooms | 444 (32.0%) | 66 (31.6%) |
| Total | 1,388 (100.0%) | 209 (100.0%) |
Housing Structure by Heating Type in Sierra View
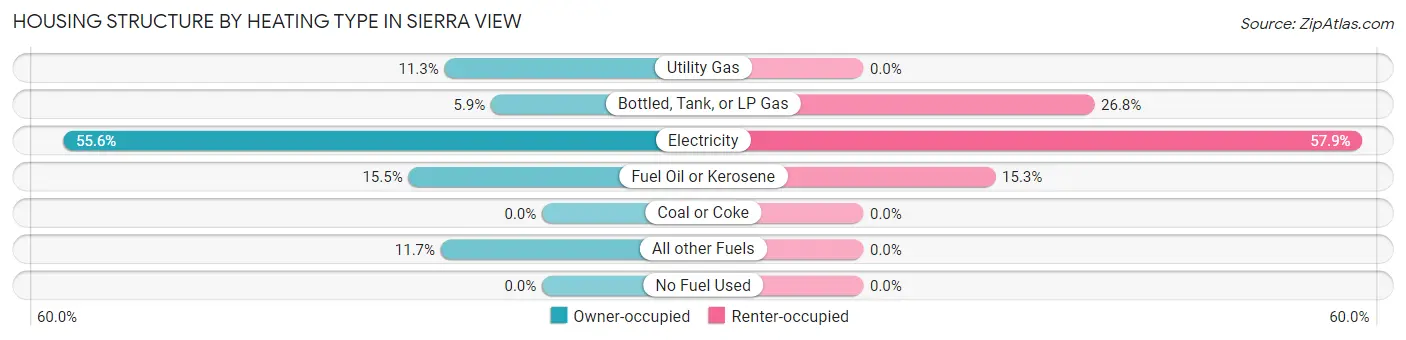
| Heating Type | Owner-occupied | Renter-occupied |
| Utility Gas | 157 (11.3%) | 0 (0.0%) |
| Bottled, Tank, or LP Gas | 82 (5.9%) | 56 (26.8%) |
| Electricity | 771 (55.5%) | 121 (57.9%) |
| Fuel Oil or Kerosene | 215 (15.5%) | 32 (15.3%) |
| Coal or Coke | 0 (0.0%) | 0 (0.0%) |
| All other Fuels | 163 (11.7%) | 0 (0.0%) |
| No Fuel Used | 0 (0.0%) | 0 (0.0%) |
| Total | 1,388 (100.0%) | 209 (100.0%) |
Household Vehicle Usage in Sierra View
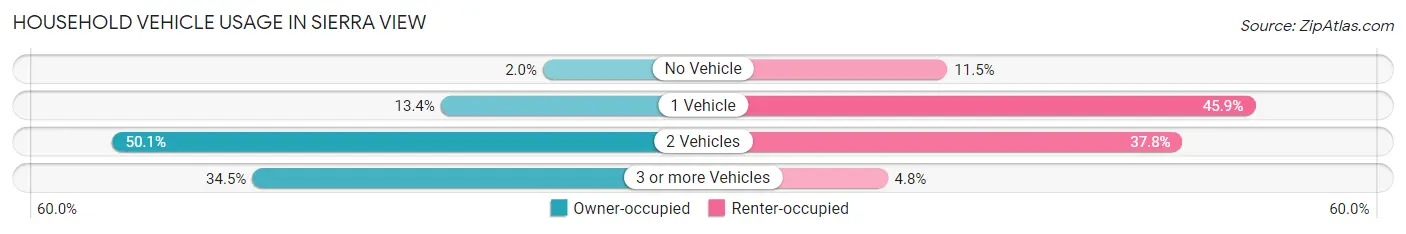
| Vehicles per Household | Owner-occupied | Renter-occupied |
| No Vehicle | 27 (1.9%) | 24 (11.5%) |
| 1 Vehicle | 186 (13.4%) | 96 (45.9%) |
| 2 Vehicles | 696 (50.1%) | 79 (37.8%) |
| 3 or more Vehicles | 479 (34.5%) | 10 (4.8%) |
| Total | 1,388 (100.0%) | 209 (100.0%) |
Real Estate & Mortgages in Sierra View
Real Estate and Mortgage Overview in Sierra View
| Characteristic | Without Mortgage | With Mortgage |
| Housing Units | 372 | 1,016 |
| Median Property Value | $209,300 | $224,900 |
| Median Household Income | $91,250 | $111 |
| Monthly Housing Costs | $690 | $33 |
| Real Estate Taxes | $4,194 | $0 |
Property Value by Mortgage Status in Sierra View
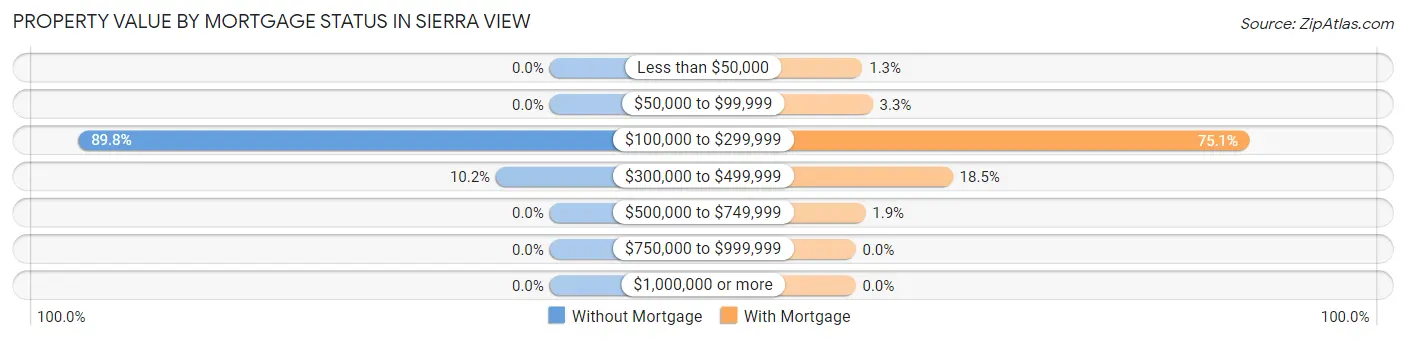
| Property Value | Without Mortgage | With Mortgage |
| Less than $50,000 | 0 (0.0%) | 13 (1.3%) |
| $50,000 to $99,999 | 0 (0.0%) | 33 (3.3%) |
| $100,000 to $299,999 | 334 (89.8%) | 763 (75.1%) |
| $300,000 to $499,999 | 38 (10.2%) | 188 (18.5%) |
| $500,000 to $749,999 | 0 (0.0%) | 19 (1.9%) |
| $750,000 to $999,999 | 0 (0.0%) | 0 (0.0%) |
| $1,000,000 or more | 0 (0.0%) | 0 (0.0%) |
| Total | 372 (100.0%) | 1,016 (100.0%) |
Household Income by Mortgage Status in Sierra View
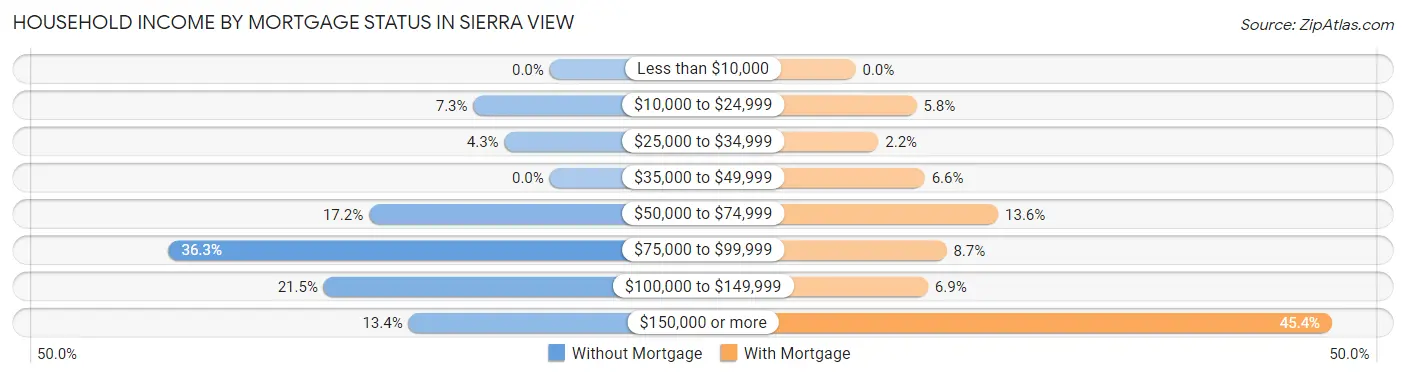
| Household Income | Without Mortgage | With Mortgage |
| Less than $10,000 | 0 (0.0%) | 0 (0.0%) |
| $10,000 to $24,999 | 27 (7.3%) | 59 (5.8%) |
| $25,000 to $34,999 | 16 (4.3%) | 22 (2.2%) |
| $35,000 to $49,999 | 0 (0.0%) | 67 (6.6%) |
| $50,000 to $74,999 | 64 (17.2%) | 138 (13.6%) |
| $75,000 to $99,999 | 135 (36.3%) | 88 (8.7%) |
| $100,000 to $149,999 | 80 (21.5%) | 70 (6.9%) |
| $150,000 or more | 50 (13.4%) | 461 (45.4%) |
| Total | 372 (100.0%) | 1,016 (100.0%) |
Property Value to Household Income Ratio in Sierra View
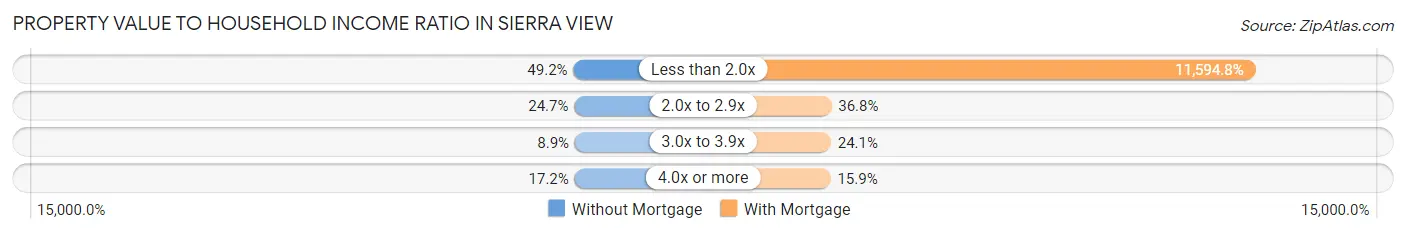
| Value-to-Income Ratio | Without Mortgage | With Mortgage |
| Less than 2.0x | 183 (49.2%) | 117,803 (11,594.8%) |
| 2.0x to 2.9x | 92 (24.7%) | 374 (36.8%) |
| 3.0x to 3.9x | 33 (8.9%) | 245 (24.1%) |
| 4.0x or more | 64 (17.2%) | 161 (15.9%) |
| Total | 372 (100.0%) | 1,016 (100.0%) |
Real Estate Taxes by Mortgage Status in Sierra View
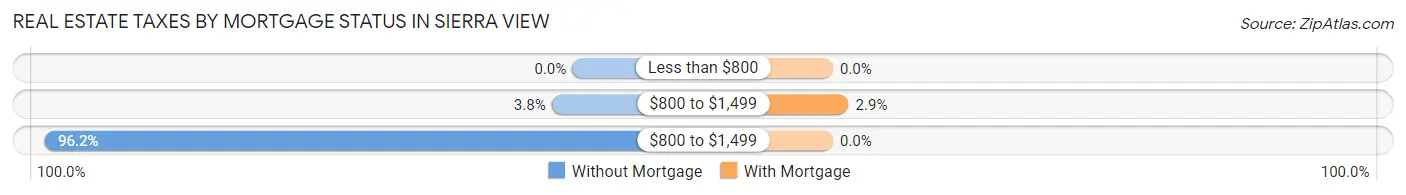
| Property Taxes | Without Mortgage | With Mortgage |
| Less than $800 | 0 (0.0%) | 0 (0.0%) |
| $800 to $1,499 | 14 (3.8%) | 29 (2.9%) |
| $800 to $1,499 | 358 (96.2%) | 0 (0.0%) |
| Total | 372 (100.0%) | 1,016 (100.0%) |
Health & Disability in Sierra View
Health Insurance Coverage by Age in Sierra View
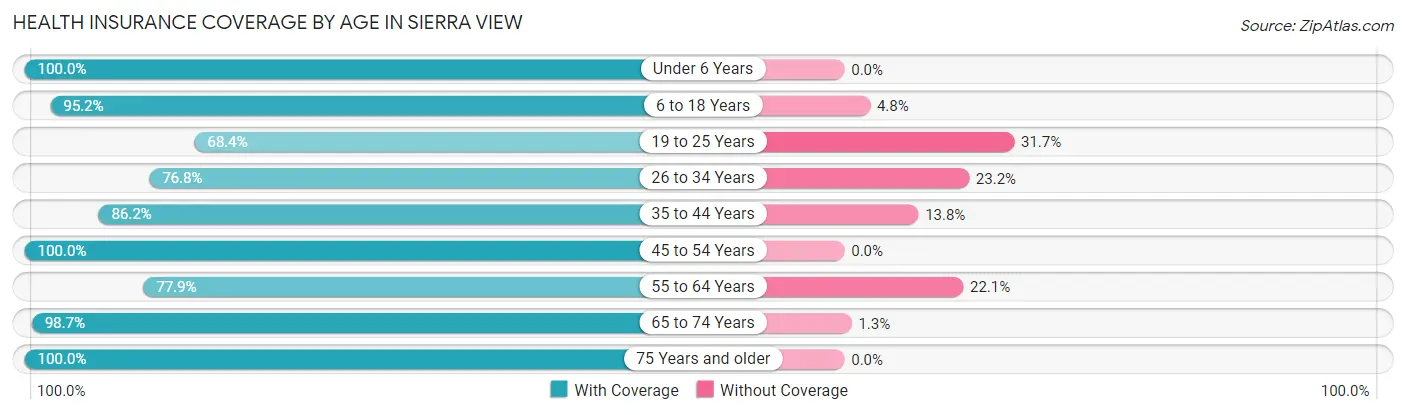
| Age Bracket | With Coverage | Without Coverage |
| Under 6 Years | 489 (100.0%) | 0 (0.0%) |
| 6 to 18 Years | 1,094 (95.2%) | 55 (4.8%) |
| 19 to 25 Years | 447 (68.3%) | 207 (31.7%) |
| 26 to 34 Years | 446 (76.8%) | 135 (23.2%) |
| 35 to 44 Years | 507 (86.2%) | 81 (13.8%) |
| 45 to 54 Years | 717 (100.0%) | 0 (0.0%) |
| 55 to 64 Years | 728 (77.9%) | 207 (22.1%) |
| 65 to 74 Years | 588 (98.7%) | 8 (1.3%) |
| 75 Years and older | 117 (100.0%) | 0 (0.0%) |
| Total | 5,133 (88.1%) | 693 (11.9%) |
Health Insurance Coverage by Citizenship Status in Sierra View
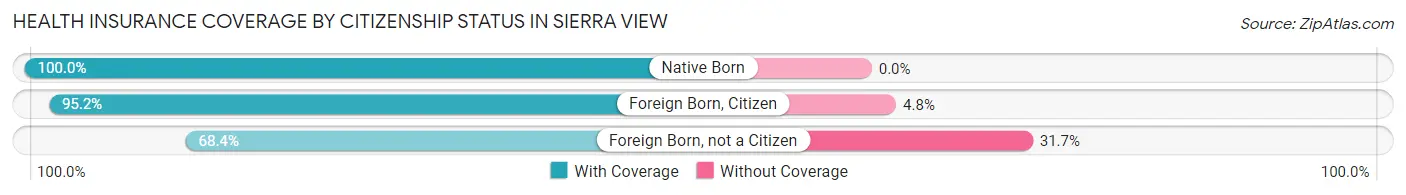
| Citizenship Status | With Coverage | Without Coverage |
| Native Born | 489 (100.0%) | 0 (0.0%) |
| Foreign Born, Citizen | 1,094 (95.2%) | 55 (4.8%) |
| Foreign Born, not a Citizen | 447 (68.3%) | 207 (31.7%) |
Health Insurance Coverage by Household Income in Sierra View
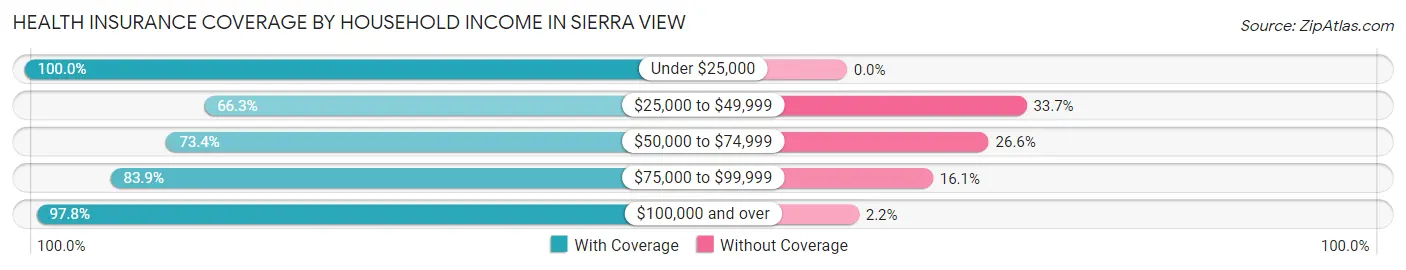
| Household Income | With Coverage | Without Coverage |
| Under $25,000 | 332 (100.0%) | 0 (0.0%) |
| $25,000 to $49,999 | 341 (66.3%) | 173 (33.7%) |
| $50,000 to $74,999 | 981 (73.4%) | 355 (26.6%) |
| $75,000 to $99,999 | 505 (83.9%) | 97 (16.1%) |
| $100,000 and over | 2,973 (97.8%) | 68 (2.2%) |
Public vs Private Health Insurance Coverage by Age in Sierra View
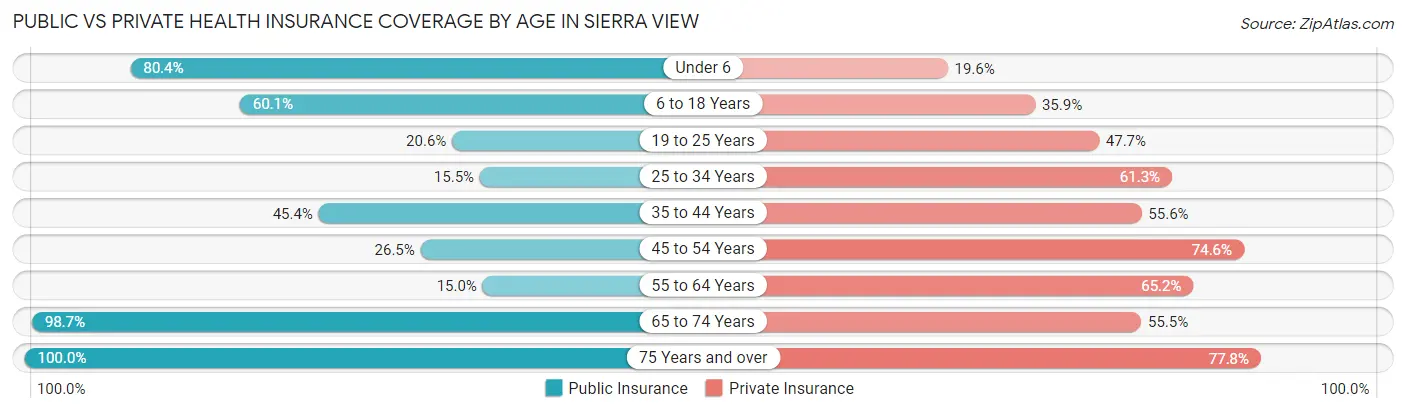
| Age Bracket | Public Insurance | Private Insurance |
| Under 6 | 393 (80.4%) | 96 (19.6%) |
| 6 to 18 Years | 690 (60.1%) | 412 (35.9%) |
| 19 to 25 Years | 135 (20.6%) | 312 (47.7%) |
| 25 to 34 Years | 90 (15.5%) | 356 (61.3%) |
| 35 to 44 Years | 267 (45.4%) | 327 (55.6%) |
| 45 to 54 Years | 190 (26.5%) | 535 (74.6%) |
| 55 to 64 Years | 140 (15.0%) | 610 (65.2%) |
| 65 to 74 Years | 588 (98.7%) | 331 (55.5%) |
| 75 Years and over | 117 (100.0%) | 91 (77.8%) |
| Total | 2,610 (44.8%) | 3,070 (52.7%) |
Disability Status by Sex by Age in Sierra View
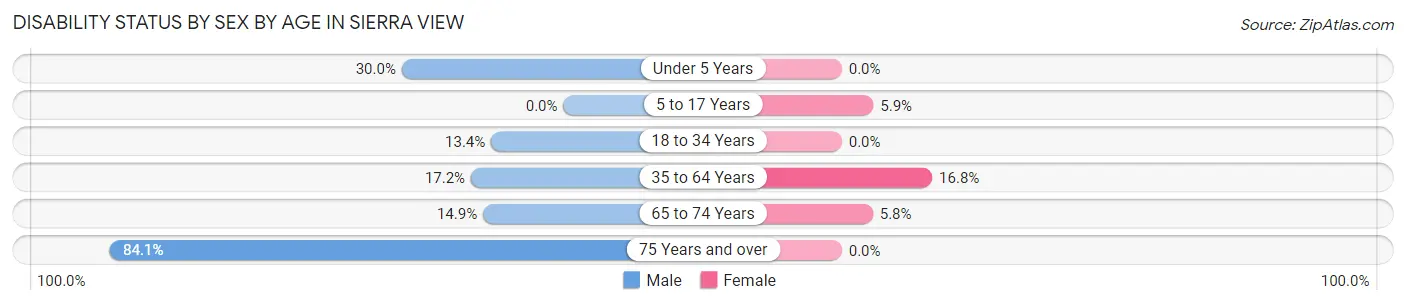
| Age Bracket | Male | Female |
| Under 5 Years | 33 (30.0%) | 0 (0.0%) |
| 5 to 17 Years | 0 (0.0%) | 42 (5.9%) |
| 18 to 34 Years | 98 (13.4%) | 0 (0.0%) |
| 35 to 64 Years | 197 (17.2%) | 183 (16.8%) |
| 65 to 74 Years | 37 (14.9%) | 20 (5.8%) |
| 75 Years and over | 53 (84.1%) | 0 (0.0%) |
Disability Class by Sex by Age in Sierra View
Disability Class: Hearing Difficulty
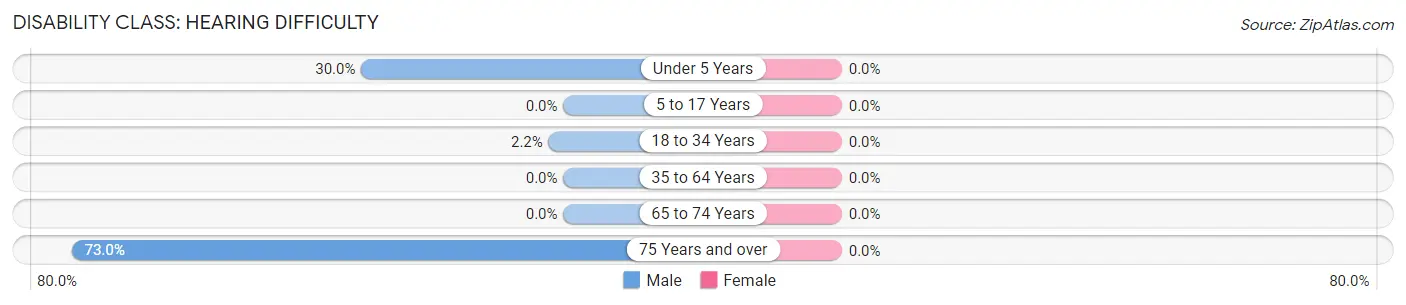
| Age Bracket | Male | Female |
| Under 5 Years | 33 (30.0%) | 0 (0.0%) |
| 5 to 17 Years | 0 (0.0%) | 0 (0.0%) |
| 18 to 34 Years | 16 (2.2%) | 0 (0.0%) |
| 35 to 64 Years | 0 (0.0%) | 0 (0.0%) |
| 65 to 74 Years | 0 (0.0%) | 0 (0.0%) |
| 75 Years and over | 46 (73.0%) | 0 (0.0%) |
Disability Class: Vision Difficulty
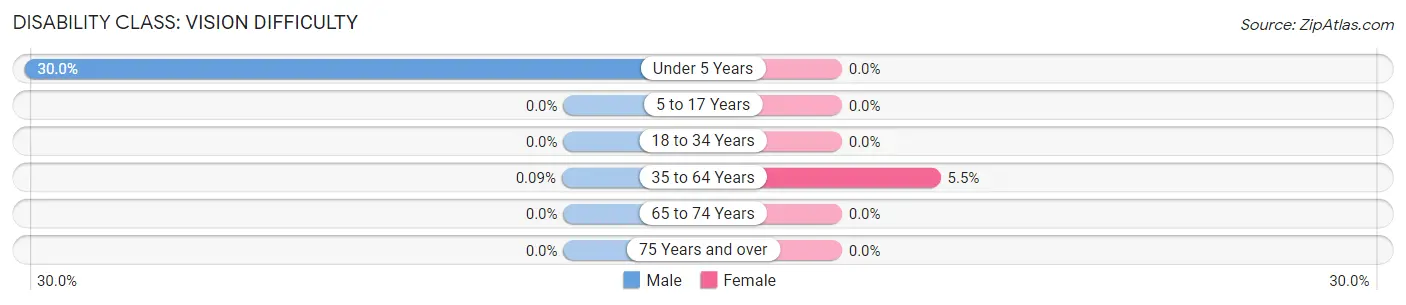
| Age Bracket | Male | Female |
| Under 5 Years | 33 (30.0%) | 0 (0.0%) |
| 5 to 17 Years | 0 (0.0%) | 0 (0.0%) |
| 18 to 34 Years | 0 (0.0%) | 0 (0.0%) |
| 35 to 64 Years | 1 (0.1%) | 60 (5.5%) |
| 65 to 74 Years | 0 (0.0%) | 0 (0.0%) |
| 75 Years and over | 0 (0.0%) | 0 (0.0%) |
Disability Class: Cognitive Difficulty
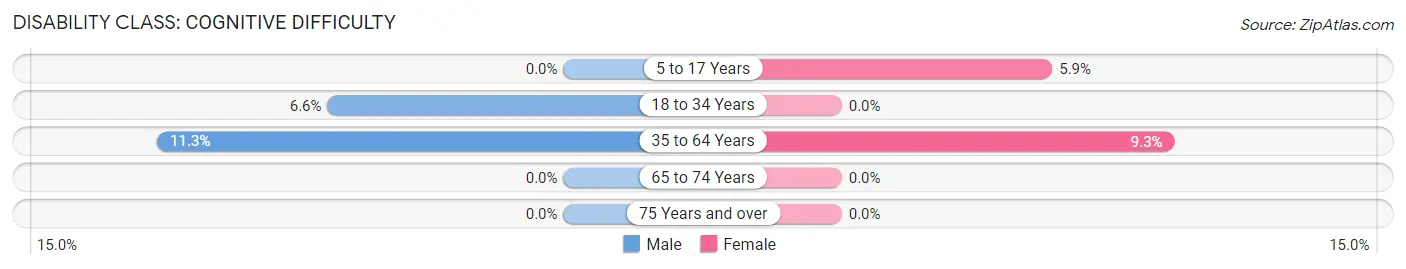
| Age Bracket | Male | Female |
| 5 to 17 Years | 0 (0.0%) | 42 (5.9%) |
| 18 to 34 Years | 48 (6.6%) | 0 (0.0%) |
| 35 to 64 Years | 130 (11.3%) | 101 (9.3%) |
| 65 to 74 Years | 0 (0.0%) | 0 (0.0%) |
| 75 Years and over | 0 (0.0%) | 0 (0.0%) |
Disability Class: Ambulatory Difficulty
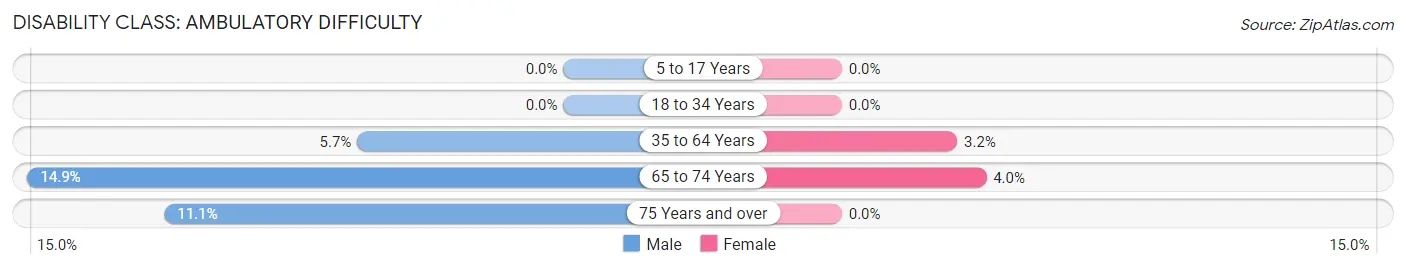
| Age Bracket | Male | Female |
| 5 to 17 Years | 0 (0.0%) | 0 (0.0%) |
| 18 to 34 Years | 0 (0.0%) | 0 (0.0%) |
| 35 to 64 Years | 66 (5.7%) | 35 (3.2%) |
| 65 to 74 Years | 37 (14.9%) | 14 (4.0%) |
| 75 Years and over | 7 (11.1%) | 0 (0.0%) |
Disability Class: Self-Care Difficulty
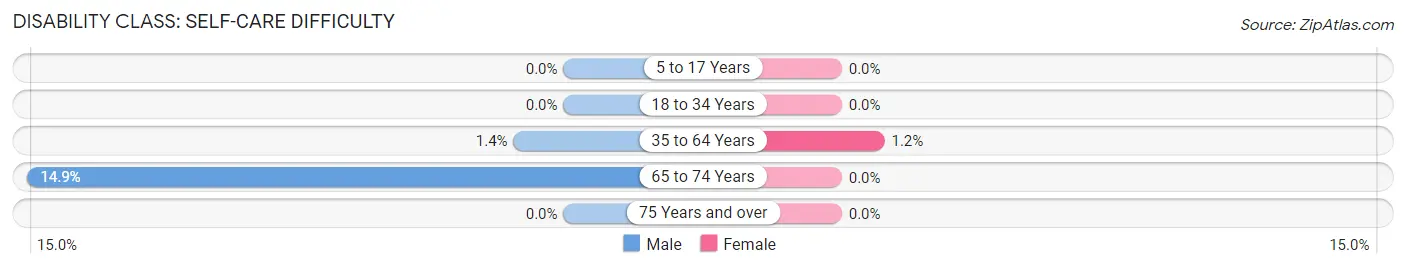
| Age Bracket | Male | Female |
| 5 to 17 Years | 0 (0.0%) | 0 (0.0%) |
| 18 to 34 Years | 0 (0.0%) | 0 (0.0%) |
| 35 to 64 Years | 16 (1.4%) | 13 (1.2%) |
| 65 to 74 Years | 37 (14.9%) | 0 (0.0%) |
| 75 Years and over | 0 (0.0%) | 0 (0.0%) |
Technology Access in Sierra View
Computing Device Access in Sierra View
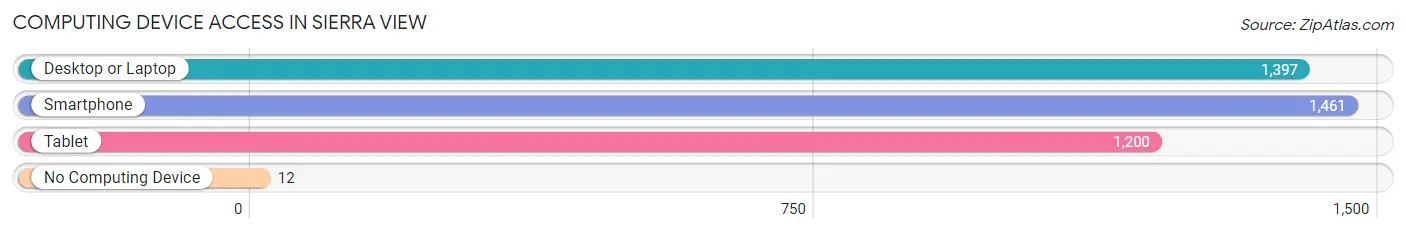
| Device Type | # Households | % Households |
| Desktop or Laptop | 1,397 | 87.5% |
| Smartphone | 1,461 | 91.5% |
| Tablet | 1,200 | 75.1% |
| No Computing Device | 12 | 0.7% |
| Total | 1,597 | 100.0% |
Internet Access in Sierra View
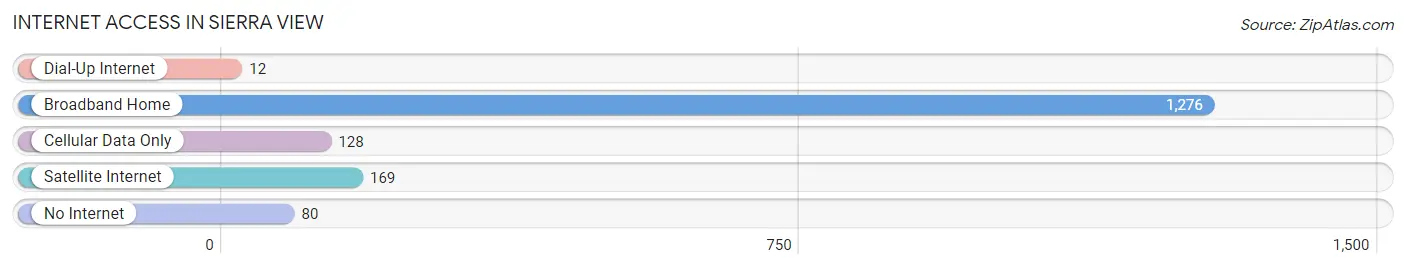
| Internet Type | # Households | % Households |
| Dial-Up Internet | 12 | 0.7% |
| Broadband Home | 1,276 | 79.9% |
| Cellular Data Only | 128 | 8.0% |
| Satellite Internet | 169 | 10.6% |
| No Internet | 80 | 5.0% |
| Total | 1,597 | 100.0% |
Sierra View Summary
Sierra View is a small borough located in the Allegheny Mountains of Pennsylvania. It is situated in the northern part of the state, in the county of Clearfield. The borough is located in a rural area, surrounded by forests and mountains. The population of Sierra View was 1,093 in the year 2000, according to the United States Census Bureau.
Geography
Sierra View is located in the Allegheny Mountains of Pennsylvania. It is situated in the northern part of the state, in the county of Clearfield. The borough is located in a rural area, surrounded by forests and mountains. The borough is located at an elevation of 1,890 feet above sea level. The total area of Sierra View is 0.7 square miles, all of which is land.
The climate in Sierra View is classified as humid continental, with cold winters and warm summers. The average annual temperature is 46.2 degrees Fahrenheit. The average annual precipitation is 40.2 inches.
History
Sierra View was founded in 1876 by a group of settlers from the nearby town of Clearfield. The settlers were looking for a place to settle and start a new life. The town was named after the nearby Sierra View Mountain. The town was incorporated in 1887.
In the early 1900s, Sierra View was a thriving community. The town had a post office, a general store, a blacksmith shop, a sawmill, and a grist mill. The town also had a school, a church, and a hotel.
In the late 1900s, the town began to decline. The sawmill and grist mill closed, and the population began to decline. By the year 2000, the population had dropped to 1,093.
Economy
The economy of Sierra View is largely based on tourism. The town is a popular destination for hikers, campers, and other outdoor enthusiasts. The town also has a few small businesses, including a general store, a restaurant, and a few other small shops.
Demographics
As of the year 2000, the population of Sierra View was 1,093. The racial makeup of the town was 97.3% White, 0.7% African American, 0.4% Native American, 0.2% Asian, and 1.4% from other races. The median household income was $30,938, and the median family income was $37,500. The per capita income was $15,945.
Conclusion
Sierra View is a small borough located in the Allegheny Mountains of Pennsylvania. It is situated in the northern part of the state, in the county of Clearfield. The borough is located in a rural area, surrounded by forests and mountains. The population of Sierra View was 1,093 in the year 2000, according to the United States Census Bureau. The economy of Sierra View is largely based on tourism, and the town is a popular destination for hikers, campers, and other outdoor enthusiasts. The racial makeup of the town was 97.3% White, 0.7% African American, 0.4% Native American, 0.2% Asian, and 1.4% from other races. The median household income was $30,938, and the median family income was $37,500. The per capita income was $15,945.
Common Questions
What is the Total Population of Sierra View?
Total Population of Sierra View is 5,826.
What is the Total Male Population of Sierra View?
Total Male Population of Sierra View is 2,793.
What is the Total Female Population of Sierra View?
Total Female Population of Sierra View is 3,033.
What is the Ratio of Males per 100 Females in Sierra View?
There are 92.09 Males per 100 Females in Sierra View.
What is the Ratio of Females per 100 Males in Sierra View?
There are 108.59 Females per 100 Males in Sierra View.
What is the Median Population Age in Sierra View?
Median Population Age in Sierra View is 35.2 Years.
What is the Average Family Size in Sierra View
Average Family Size in Sierra View is 4.1 People.
What is the Average Household Size in Sierra View
Average Household Size in Sierra View is 3.6 People.
What is Per Capita Income in Sierra View?
Per Capita income in Sierra View is $30,419.
What is the Median Family Income in Sierra View?
Median Family Income in Sierra View is $101,563.
What is the Median Household income in Sierra View?
Median Household Income in Sierra View is $91,736.
What is Income or Wage Gap in Sierra View?
Income or Wage Gap in Sierra View is 39.8%.
Women in Sierra View earn 60.2 cents for every dollar earned by a man.
What is Inequality or Gini Index in Sierra View?
Inequality or Gini Index in Sierra View is 0.40.
How Large is the Labor Force in Sierra View?
There are 2,861 People in the Labor Forcein in Sierra View.
What is the Percentage of People in the Labor Force in Sierra View?
63.8% of People are in the Labor Force in Sierra View.
What is the Unemployment Rate in Sierra View?
Unemployment Rate in Sierra View is 9.0%.