Greenock, PA
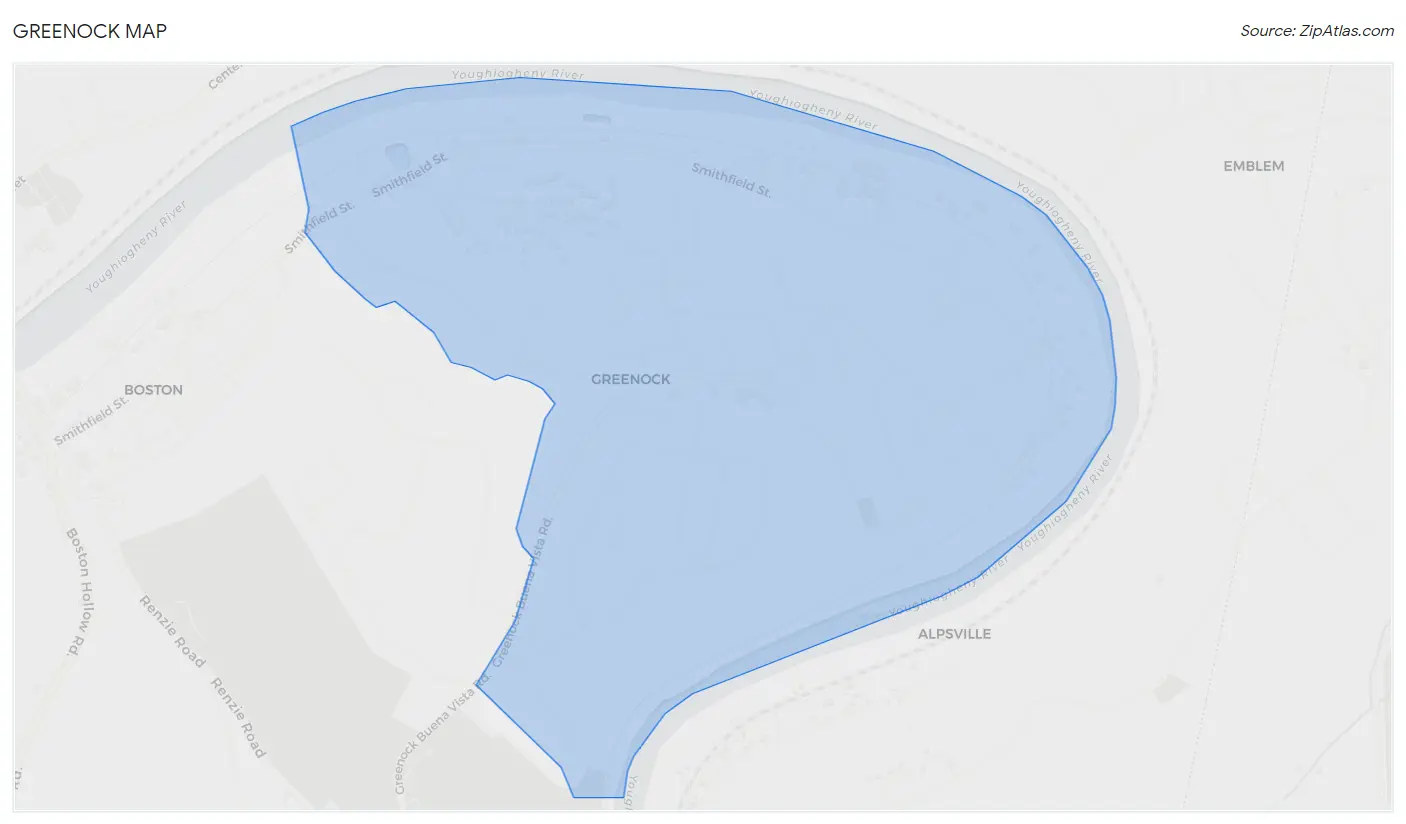
Greenock Map
Greenock Overview
1,895
TOTAL POPULATION
649
MALE POPULATION
1,246
FEMALE POPULATION
52.09
MALES / 100 FEMALES
191.99
FEMALES / 100 MALES
47.0
MEDIAN AGE
2.9
AVG FAMILY SIZE
2.3
AVG HOUSEHOLD SIZE
$40,690
PER CAPITA INCOME
$68,036
AVG FAMILY INCOME
$50,074
AVG HOUSEHOLD INCOME
36.6%
WAGE / INCOME GAP [ % ]
63.4¢/ $1
WAGE / INCOME GAP [ $ ]
0.48
INEQUALITY / GINI INDEX
1,146
LABOR FORCE [ PEOPLE ]
67.2%
PERCENT IN LABOR FORCE
Greenock Zip Codes
Greenock Area Codes
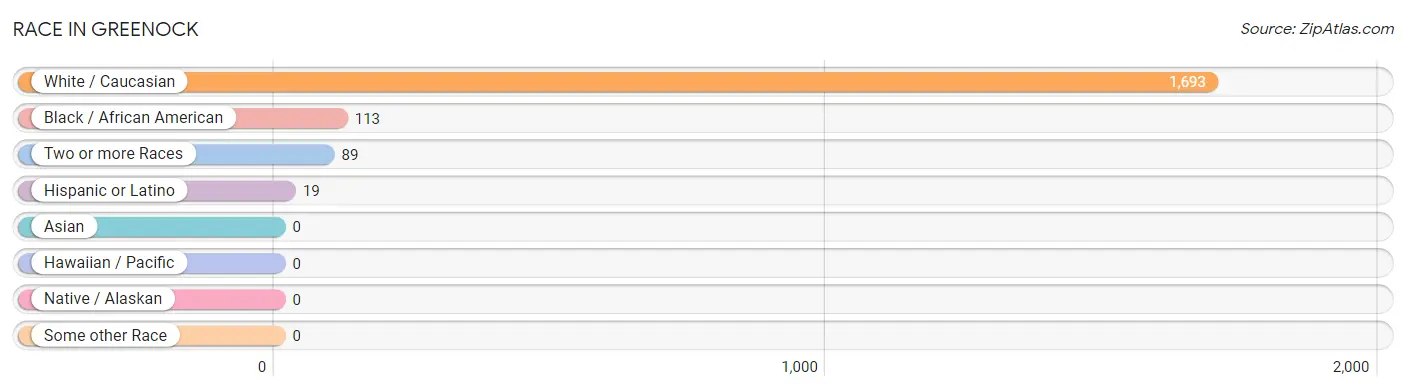
Race in Greenock
The most populous races in Greenock are White / Caucasian (1,693 | 89.3%), Black / African American (113 | 6.0%), and Two or more Races (89 | 4.7%).
| Race | # Population | % Population |
| Asian | 0 | 0.0% |
| Black / African American | 113 | 6.0% |
| Hawaiian / Pacific | 0 | 0.0% |
| Hispanic or Latino | 19 | 1.0% |
| Native / Alaskan | 0 | 0.0% |
| White / Caucasian | 1,693 | 89.3% |
| Two or more Races | 89 | 4.7% |
| Some other Race | 0 | 0.0% |
| Total | 1,895 | 100.0% |
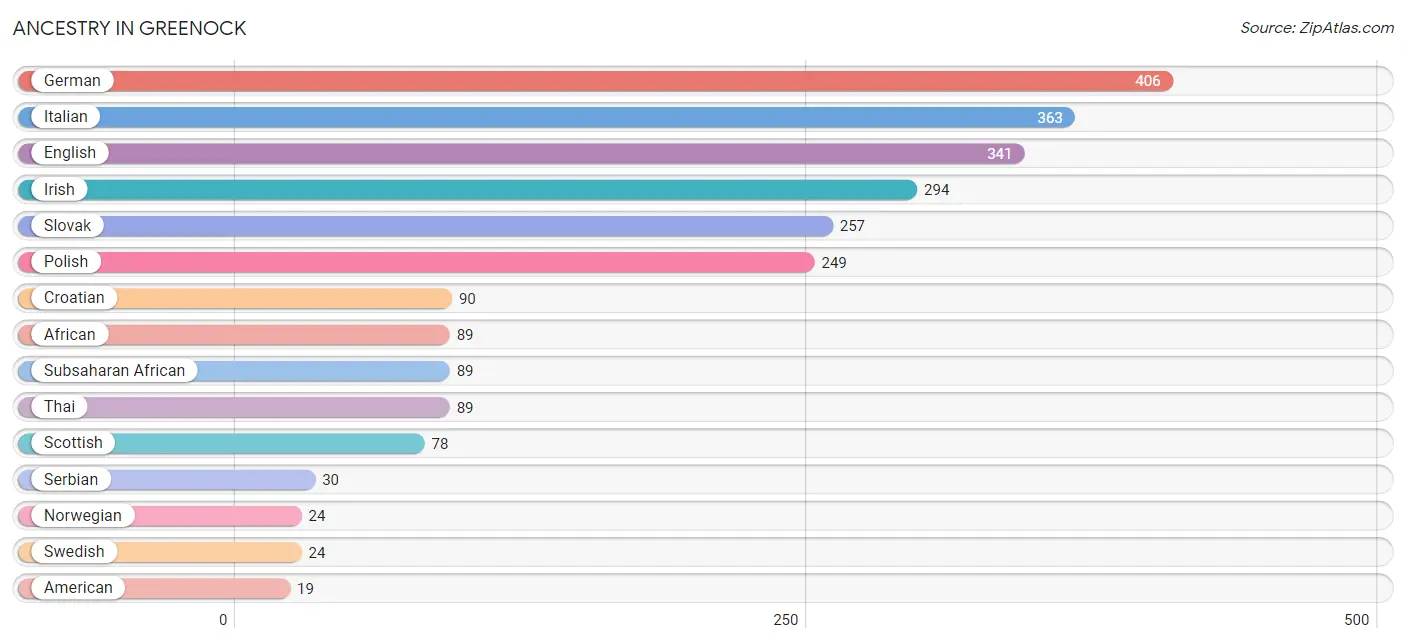
Ancestry in Greenock
The most populous ancestries reported in Greenock are German (406 | 21.4%), Italian (363 | 19.2%), English (341 | 18.0%), Irish (294 | 15.5%), and Slovak (257 | 13.6%), together accounting for 87.6% of all Greenock residents.
| Ancestry | # Population | % Population |
| African | 89 | 4.7% |
| American | 19 | 1.0% |
| Austrian | 4 | 0.2% |
| Croatian | 90 | 4.8% |
| Czechoslovakian | 18 | 0.9% |
| English | 341 | 18.0% |
| French | 11 | 0.6% |
| German | 406 | 21.4% |
| Hungarian | 15 | 0.8% |
| Irish | 294 | 15.5% |
| Italian | 363 | 19.2% |
| Mexican | 19 | 1.0% |
| Norwegian | 24 | 1.3% |
| Polish | 249 | 13.1% |
| Scotch-Irish | 18 | 0.9% |
| Scottish | 78 | 4.1% |
| Serbian | 30 | 1.6% |
| Slovak | 257 | 13.6% |
| Subsaharan African | 89 | 4.7% |
| Swedish | 24 | 1.3% |
| Thai | 89 | 4.7% | View All 21 Rows |
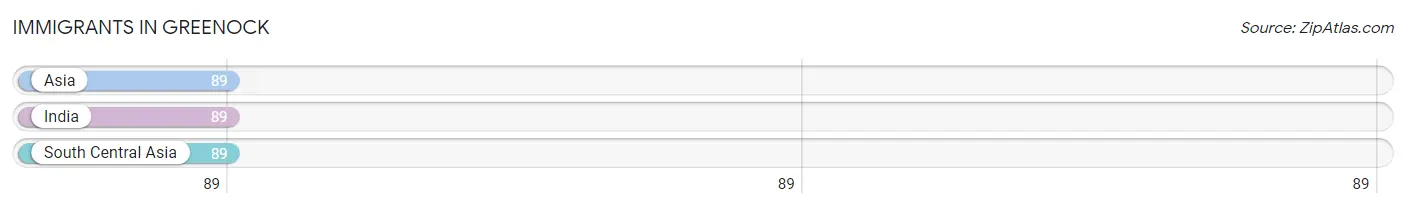
Immigrants in Greenock
The most numerous immigrant groups reported in Greenock came from Asia (89 | 4.7%), India (89 | 4.7%), and South Central Asia (89 | 4.7%), together accounting for 14.1% of all Greenock residents.
| Immigration Origin | # Population | % Population |
| Asia | 89 | 4.7% |
| India | 89 | 4.7% |
| South Central Asia | 89 | 4.7% | View All 3 Rows |
Sex and Age in Greenock
Sex and Age in Greenock
The most populous age groups in Greenock are 60 to 64 Years (109 | 16.8%) for men and 50 to 54 Years (166 | 13.3%) for women.
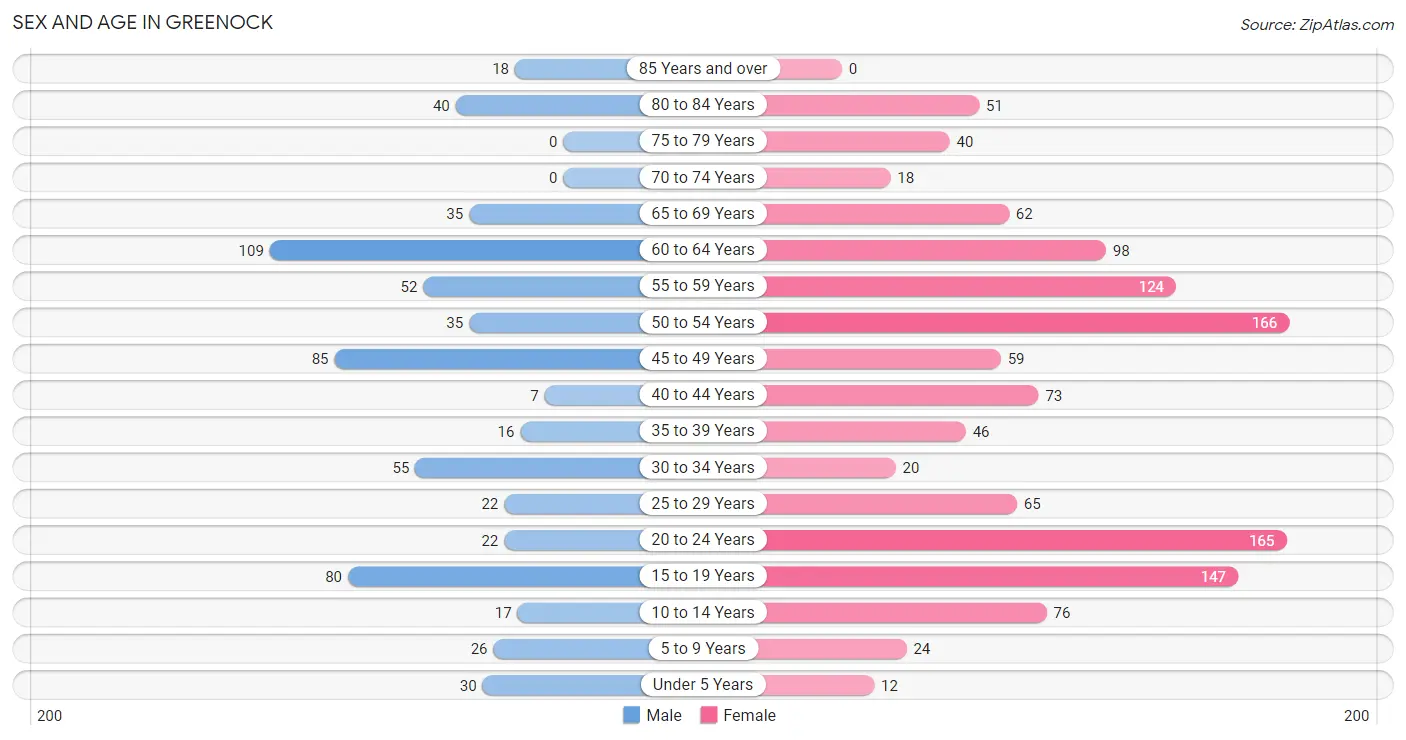
| Age Bracket | Male | Female |
| Under 5 Years | 30 (4.6%) | 12 (1.0%) |
| 5 to 9 Years | 26 (4.0%) | 24 (1.9%) |
| 10 to 14 Years | 17 (2.6%) | 76 (6.1%) |
| 15 to 19 Years | 80 (12.3%) | 147 (11.8%) |
| 20 to 24 Years | 22 (3.4%) | 165 (13.2%) |
| 25 to 29 Years | 22 (3.4%) | 65 (5.2%) |
| 30 to 34 Years | 55 (8.5%) | 20 (1.6%) |
| 35 to 39 Years | 16 (2.5%) | 46 (3.7%) |
| 40 to 44 Years | 7 (1.1%) | 73 (5.9%) |
| 45 to 49 Years | 85 (13.1%) | 59 (4.7%) |
| 50 to 54 Years | 35 (5.4%) | 166 (13.3%) |
| 55 to 59 Years | 52 (8.0%) | 124 (10.0%) |
| 60 to 64 Years | 109 (16.8%) | 98 (7.9%) |
| 65 to 69 Years | 35 (5.4%) | 62 (5.0%) |
| 70 to 74 Years | 0 (0.0%) | 18 (1.4%) |
| 75 to 79 Years | 0 (0.0%) | 40 (3.2%) |
| 80 to 84 Years | 40 (6.2%) | 51 (4.1%) |
| 85 Years and over | 18 (2.8%) | 0 (0.0%) |
| Total | 649 (100.0%) | 1,246 (100.0%) |
Families and Households in Greenock
Median Family Size in Greenock
The median family size in Greenock is 2.85 persons per family, with married-couple families (302 | 55.3%) accounting for the largest median family size of 3.29 persons per family. On the other hand, single male/father families (16 | 2.9%) represent the smallest median family size with 1.94 persons per family.
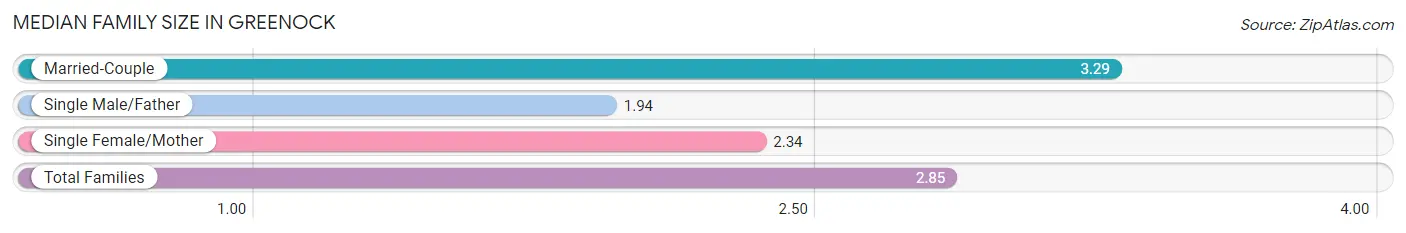
| Family Type | # Families | Family Size |
| Married-Couple | 302 (55.3%) | 3.29 |
| Single Male/Father | 16 (2.9%) | 1.94 |
| Single Female/Mother | 228 (41.8%) | 2.34 |
| Total Families | 546 (100.0%) | 2.85 |
Median Household Size in Greenock
The median household size in Greenock is 2.26 persons per household, with married-couple households (302 | 36.1%) accounting for the largest median household size of 3.29 persons per household. non-family households (291 | 34.8%) represent the smallest median household size with 1.12 persons per household.
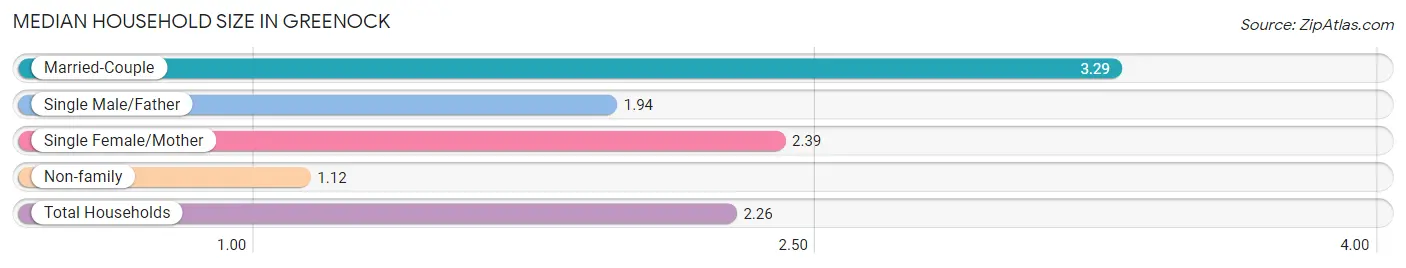
| Household Type | # Households | Household Size |
| Married-Couple | 302 (36.1%) | 3.29 |
| Single Male/Father | 16 (1.9%) | 1.94 |
| Single Female/Mother | 228 (27.2%) | 2.39 |
| Non-family | 291 (34.8%) | 1.12 |
| Total Households | 837 (100.0%) | 2.26 |
Household Size by Marriage Status in Greenock
Out of a total of 837 households in Greenock, 546 (65.2%) are family households, while 291 (34.8%) are nonfamily households. The most numerous type of family households are 2-person households, comprising 327, and the most common type of nonfamily households are 1-person households, comprising 248.
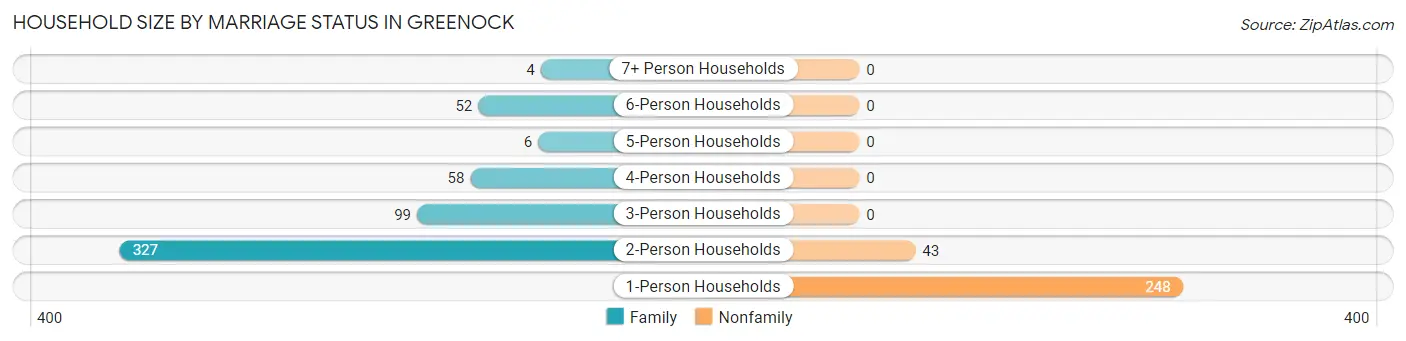
| Household Size | Family Households | Nonfamily Households |
| 1-Person Households | - | 248 (29.6%) |
| 2-Person Households | 327 (39.1%) | 43 (5.1%) |
| 3-Person Households | 99 (11.8%) | 0 (0.0%) |
| 4-Person Households | 58 (6.9%) | 0 (0.0%) |
| 5-Person Households | 6 (0.7%) | 0 (0.0%) |
| 6-Person Households | 52 (6.2%) | 0 (0.0%) |
| 7+ Person Households | 4 (0.5%) | 0 (0.0%) |
| Total | 546 (65.2%) | 291 (34.8%) |
Female Fertility in Greenock
Fertility by Age in Greenock
| Age Bracket | Women with Births | Births / 1,000 Women |
| 15 to 19 years | 0 (0.0%) | 0.0 |
| 20 to 34 years | 0 (0.0%) | 0.0 |
| 35 to 50 years | 0 (0.0%) | 0.0 |
| Total | 0 (0.0%) | 0.0 |
Fertility by Age by Marriage Status in Greenock
| Age Bracket | Married | Unmarried |
| 15 to 19 years | 0 (0.0%) | 0 (0.0%) |
| 20 to 34 years | 0 (0.0%) | 0 (0.0%) |
| 35 to 50 years | 0 (0.0%) | 0 (0.0%) |
| Total | 0 (0.0%) | 0 (0.0%) |
Fertility by Education in Greenock
| Educational Attainment | Women with Births | Births / 1,000 Women |
| Less than High School | 0 (0.0%) | 0.0 |
| High School Diploma | 0 (0.0%) | 0.0 |
| College or Associate's Degree | 0 (0.0%) | 0.0 |
| Bachelor's Degree | 0 (0.0%) | 0.0 |
| Graduate Degree | 0 (0.0%) | 0.0 |
| Total | 0 (0.0%) | 0.0 |
Fertility by Education by Marriage Status in Greenock
| Educational Attainment | Married | Unmarried |
| Less than High School | 0 (0.0%) | 0 (0.0%) |
| High School Diploma | 0 (0.0%) | 0 (0.0%) |
| College or Associate's Degree | 0 (0.0%) | 0 (0.0%) |
| Bachelor's Degree | 0 (0.0%) | 0 (0.0%) |
| Graduate Degree | 0 (0.0%) | 0 (0.0%) |
| Total | 0 (0.0%) | 0 (0.0%) |
Income in Greenock
Income Overview in Greenock
Per Capita Income in Greenock is $40,690, while median incomes of families and households are $68,036 and $50,074 respectively.
| Characteristic | Number | Measure |
| Per Capita Income | 1,895 | $40,690 |
| Median Family Income | 546 | $68,036 |
| Mean Family Income | 546 | $114,579 |
| Median Household Income | 837 | $50,074 |
| Mean Household Income | 837 | $92,724 |
| Income Deficit | 546 | $0 |
| Wage / Income Gap (%) | 1,895 | 36.58% |
| Wage / Income Gap ($) | 1,895 | 63.42¢ per $1 |
| Gini / Inequality Index | 1,895 | 0.48 |
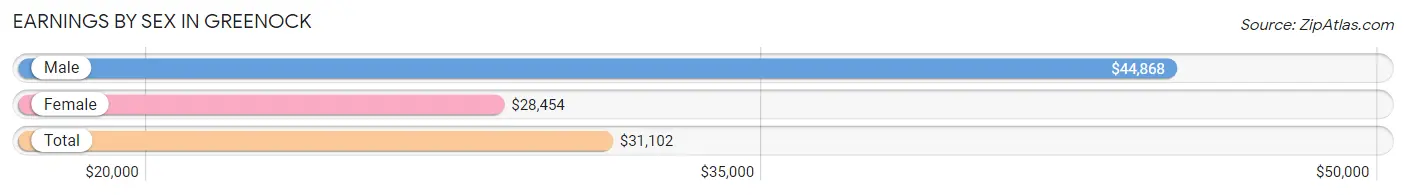
Earnings by Sex in Greenock
Average Earnings in Greenock are $31,102, $44,868 for men and $28,454 for women, a difference of 36.6%.
| Sex | Number | Average Earnings |
| Male | 394 (33.2%) | $44,868 |
| Female | 792 (66.8%) | $28,454 |
| Total | 1,186 (100.0%) | $31,102 |
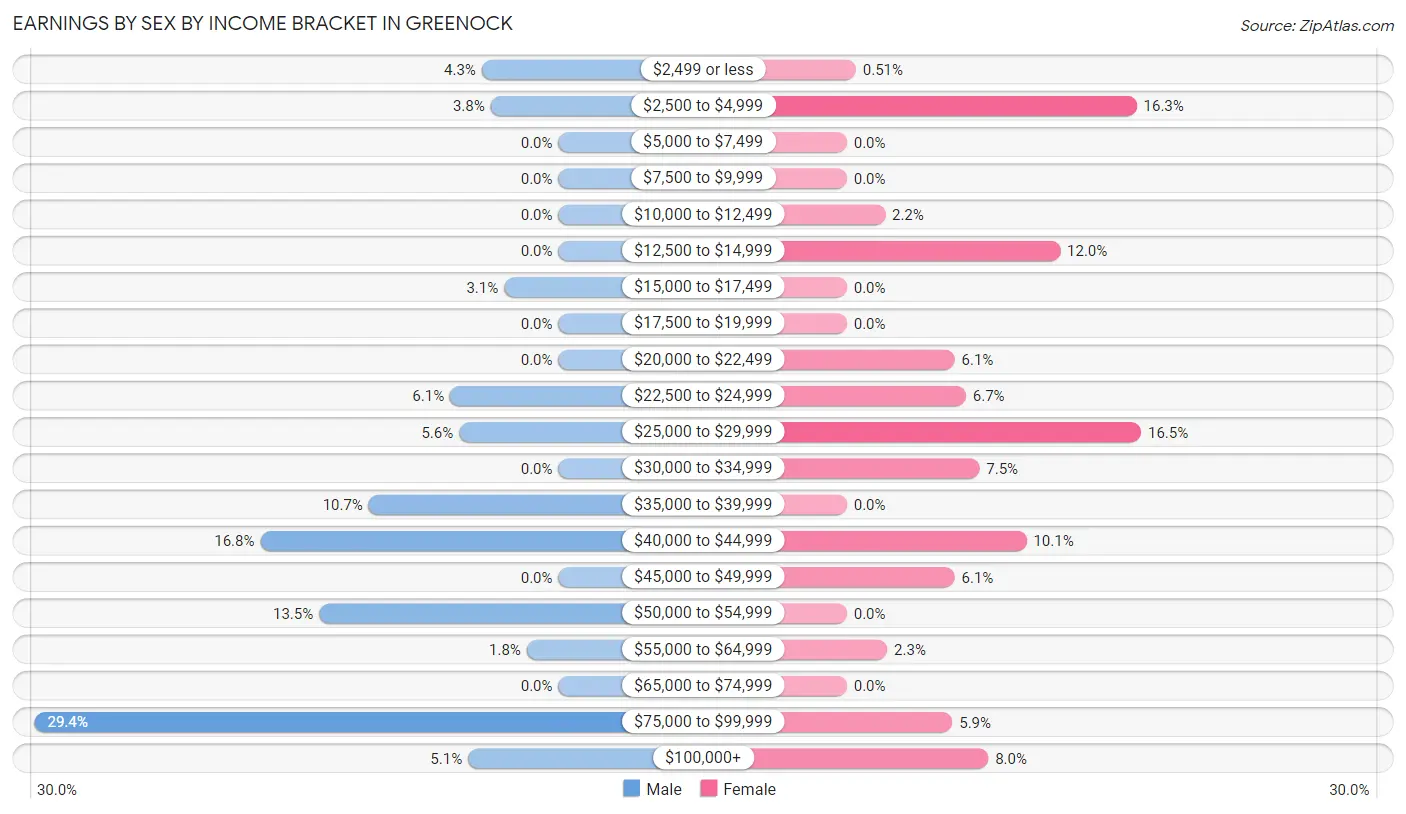
Earnings by Sex by Income Bracket in Greenock
The most common earnings brackets in Greenock are $75,000 to $99,999 for men (116 | 29.4%) and $25,000 to $29,999 for women (131 | 16.5%).
| Income | Male | Female |
| $2,499 or less | 17 (4.3%) | 4 (0.5%) |
| $2,500 to $4,999 | 15 (3.8%) | 129 (16.3%) |
| $5,000 to $7,499 | 0 (0.0%) | 0 (0.0%) |
| $7,500 to $9,999 | 0 (0.0%) | 0 (0.0%) |
| $10,000 to $12,499 | 0 (0.0%) | 17 (2.1%) |
| $12,500 to $14,999 | 0 (0.0%) | 95 (12.0%) |
| $15,000 to $17,499 | 12 (3.0%) | 0 (0.0%) |
| $17,500 to $19,999 | 0 (0.0%) | 0 (0.0%) |
| $20,000 to $22,499 | 0 (0.0%) | 48 (6.1%) |
| $22,500 to $24,999 | 24 (6.1%) | 53 (6.7%) |
| $25,000 to $29,999 | 22 (5.6%) | 131 (16.5%) |
| $30,000 to $34,999 | 0 (0.0%) | 59 (7.4%) |
| $35,000 to $39,999 | 42 (10.7%) | 0 (0.0%) |
| $40,000 to $44,999 | 66 (16.8%) | 80 (10.1%) |
| $45,000 to $49,999 | 0 (0.0%) | 48 (6.1%) |
| $50,000 to $54,999 | 53 (13.5%) | 0 (0.0%) |
| $55,000 to $64,999 | 7 (1.8%) | 18 (2.3%) |
| $65,000 to $74,999 | 0 (0.0%) | 0 (0.0%) |
| $75,000 to $99,999 | 116 (29.4%) | 47 (5.9%) |
| $100,000+ | 20 (5.1%) | 63 (8.0%) |
| Total | 394 (100.0%) | 792 (100.0%) |
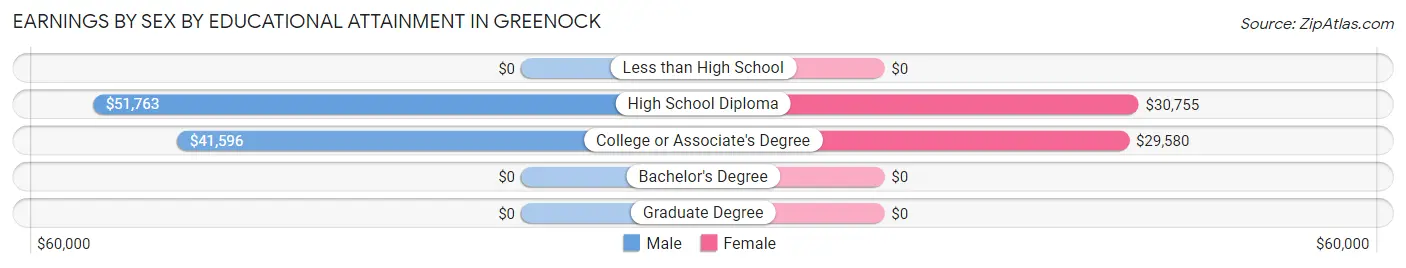
Earnings by Sex by Educational Attainment in Greenock
Average earnings in Greenock are $50,825 for men and $29,955 for women, a difference of 41.1%. Men with an educational attainment of high school diploma enjoy the highest average annual earnings of $51,763, while those with college or associate's degree education earn the least with $41,596. Women with an educational attainment of high school diploma earn the most with the average annual earnings of $30,755, while those with college or associate's degree education have the smallest earnings of $29,580.
| Educational Attainment | Male Income | Female Income |
| Less than High School | - | - |
| High School Diploma | $51,763 | $30,755 |
| College or Associate's Degree | $41,596 | $29,580 |
| Bachelor's Degree | - | - |
| Graduate Degree | - | - |
| Total | $50,825 | $29,955 |
Family Income in Greenock
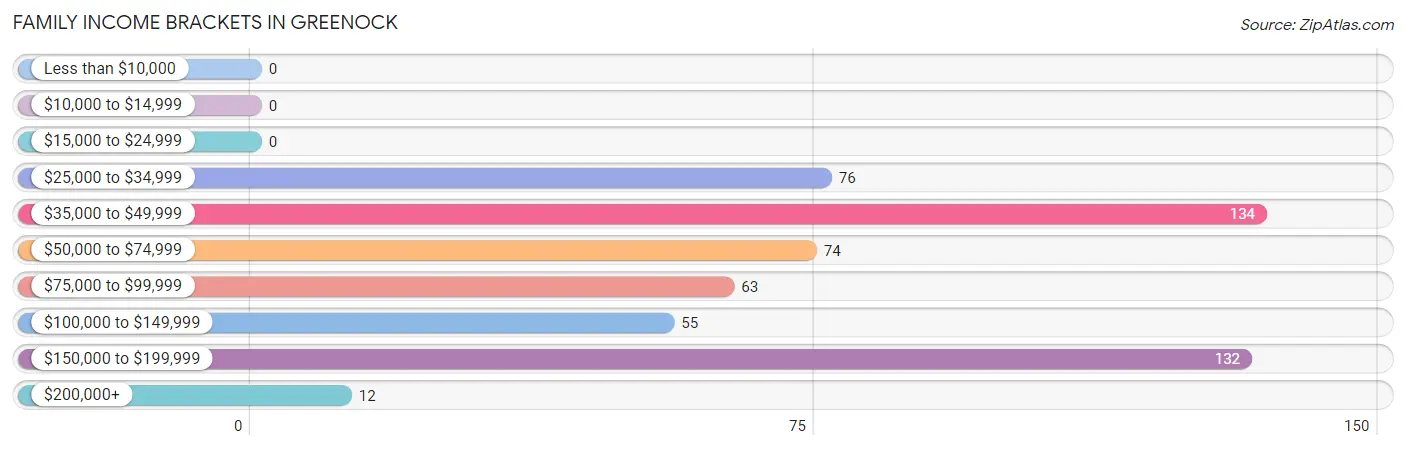
Family Income Brackets in Greenock
According to the Greenock family income data, there are 134 families falling into the $35,000 to $49,999 income range, which is the most common income bracket and makes up 24.5% of all families.
| Income Bracket | # Families | % Families |
| Less than $10,000 | 0 | 0.0% |
| $10,000 to $14,999 | 0 | 0.0% |
| $15,000 to $24,999 | 0 | 0.0% |
| $25,000 to $34,999 | 76 | 13.9% |
| $35,000 to $49,999 | 134 | 24.5% |
| $50,000 to $74,999 | 74 | 13.6% |
| $75,000 to $99,999 | 63 | 11.5% |
| $100,000 to $149,999 | 55 | 10.1% |
| $150,000 to $199,999 | 132 | 24.2% |
| $200,000+ | 12 | 2.2% |
Family Income by Famaliy Size in Greenock
4-person families (47 | 8.6%) account for the highest median family income in Greenock with $195,809 per family, while 4-person families (47 | 8.6%) have the highest median income of $48,952 per family member.
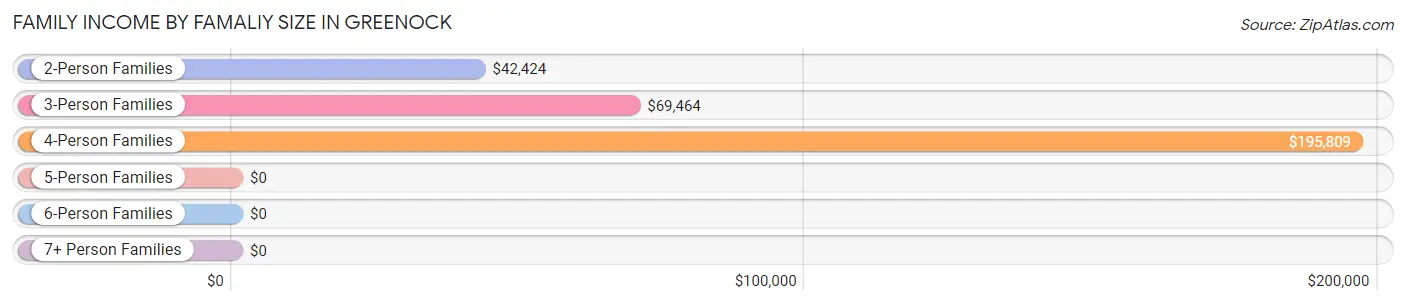
| Income Bracket | # Families | Median Income |
| 2-Person Families | 327 (59.9%) | $42,424 |
| 3-Person Families | 110 (20.2%) | $69,464 |
| 4-Person Families | 47 (8.6%) | $195,809 |
| 5-Person Families | 6 (1.1%) | $0 |
| 6-Person Families | 52 (9.5%) | $0 |
| 7+ Person Families | 4 (0.7%) | $0 |
| Total | 546 (100.0%) | $68,036 |
Family Income by Number of Earners in Greenock
The median family income in Greenock is $68,036, with families comprising 2 earners (138) having the highest median family income of $153,438, while families with 1 earner (172) have the lowest median family income of $40,823, accounting for 25.3% and 31.5% of families, respectively.
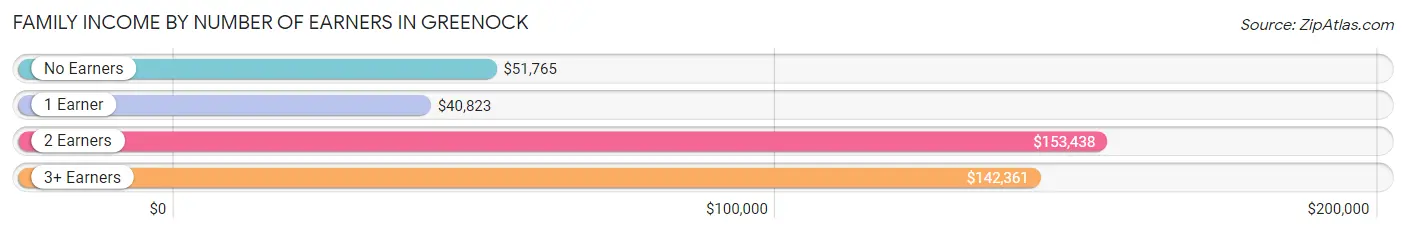
| Number of Earners | # Families | Median Income |
| No Earners | 96 (17.6%) | $51,765 |
| 1 Earner | 172 (31.5%) | $40,823 |
| 2 Earners | 138 (25.3%) | $153,438 |
| 3+ Earners | 140 (25.6%) | $142,361 |
| Total | 546 (100.0%) | $68,036 |
Household Income in Greenock
Household Income Brackets in Greenock
With 261 households falling in the category, the $35,000 to $49,999 income range is the most frequent in Greenock, accounting for 31.2% of all households.
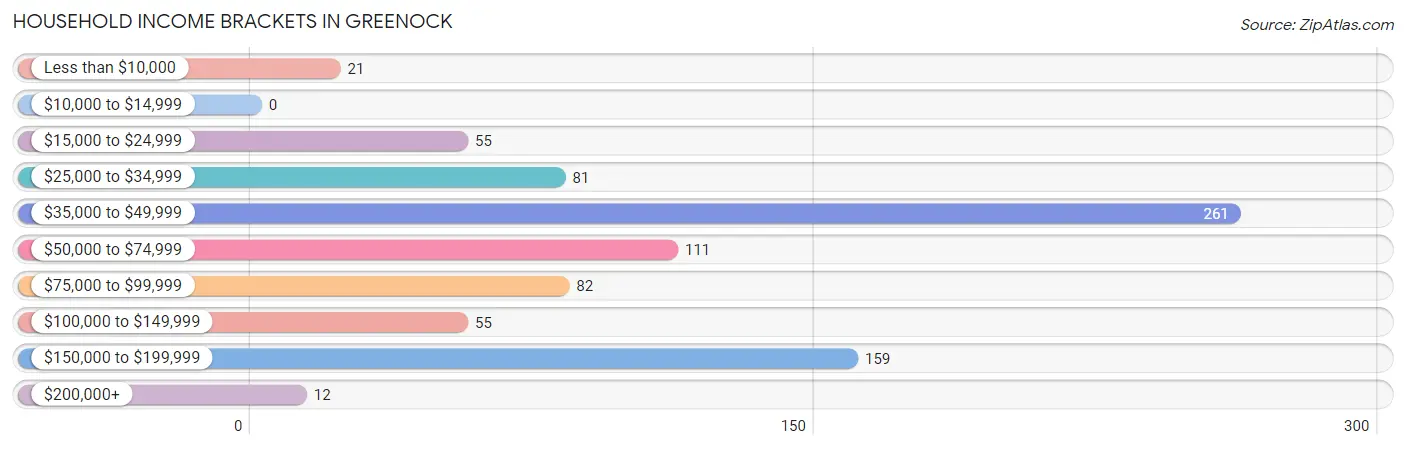
| Income Bracket | # Households | % Households |
| Less than $10,000 | 21 | 2.5% |
| $10,000 to $14,999 | 0 | 0.0% |
| $15,000 to $24,999 | 55 | 6.6% |
| $25,000 to $34,999 | 81 | 9.7% |
| $35,000 to $49,999 | 261 | 31.2% |
| $50,000 to $74,999 | 111 | 13.3% |
| $75,000 to $99,999 | 82 | 9.8% |
| $100,000 to $149,999 | 55 | 6.6% |
| $150,000 to $199,999 | 159 | 19.0% |
| $200,000+ | 12 | 1.4% |
Household Income by Householder Age in Greenock
The median household income in Greenock is $50,074, with the highest median household income of $55,417 found in the 45 to 64 years age bracket for the primary householder. A total of 558 households (66.7%) fall into this category.
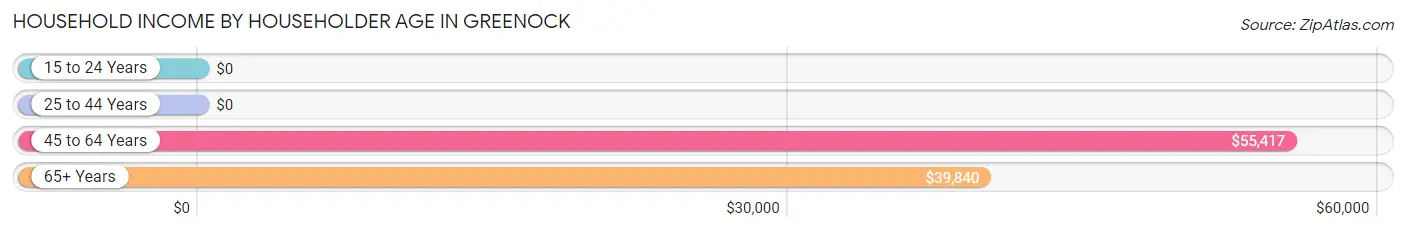
| Income Bracket | # Households | Median Income |
| 15 to 24 Years | 0 (0.0%) | $0 |
| 25 to 44 Years | 83 (9.9%) | $0 |
| 45 to 64 Years | 558 (66.7%) | $55,417 |
| 65+ Years | 196 (23.4%) | $39,840 |
| Total | 837 (100.0%) | $50,074 |
Poverty in Greenock
Income Below Poverty by Sex and Age in Greenock
With 0.2% poverty level for males and 3.0% for females among the residents of Greenock, 45 to 54 year old males and 75 year old and over females are the most vulnerable to poverty, with 1 males (0.8%) and 21 females (23.1%) in their respective age groups living below the poverty level.
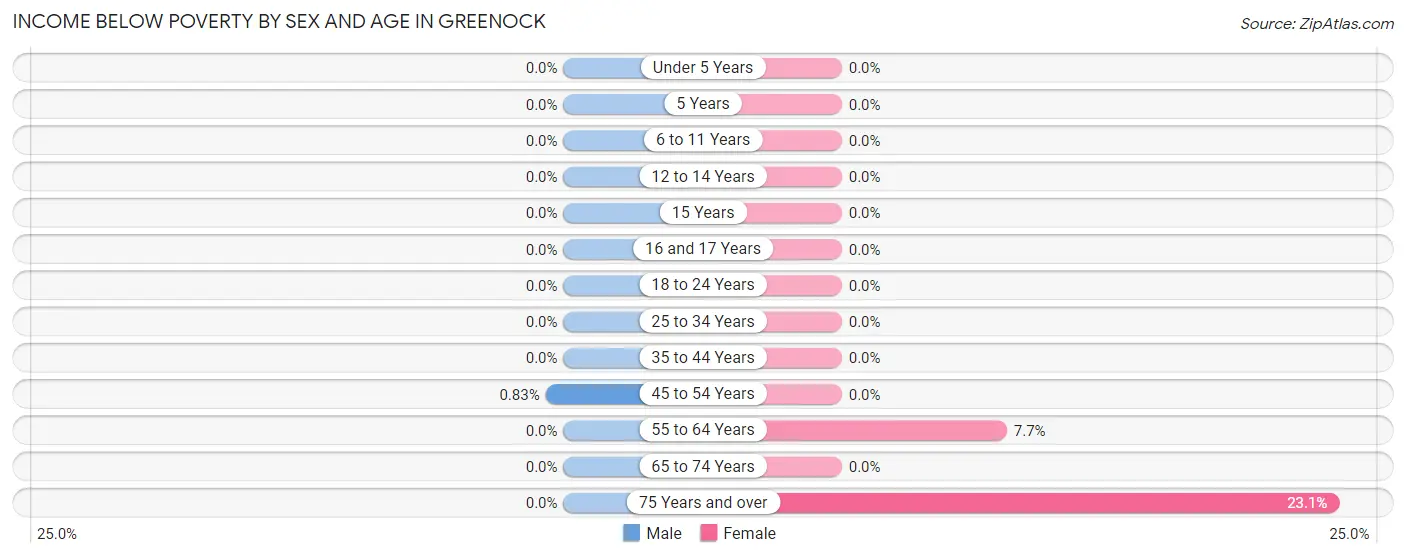
| Age Bracket | Male | Female |
| Under 5 Years | 0 (0.0%) | 0 (0.0%) |
| 5 Years | 0 (0.0%) | 0 (0.0%) |
| 6 to 11 Years | 0 (0.0%) | 0 (0.0%) |
| 12 to 14 Years | 0 (0.0%) | 0 (0.0%) |
| 15 Years | 0 (0.0%) | 0 (0.0%) |
| 16 and 17 Years | 0 (0.0%) | 0 (0.0%) |
| 18 to 24 Years | 0 (0.0%) | 0 (0.0%) |
| 25 to 34 Years | 0 (0.0%) | 0 (0.0%) |
| 35 to 44 Years | 0 (0.0%) | 0 (0.0%) |
| 45 to 54 Years | 1 (0.8%) | 0 (0.0%) |
| 55 to 64 Years | 0 (0.0%) | 17 (7.7%) |
| 65 to 74 Years | 0 (0.0%) | 0 (0.0%) |
| 75 Years and over | 0 (0.0%) | 21 (23.1%) |
| Total | 1 (0.2%) | 38 (3.0%) |
Income Above Poverty by Sex and Age in Greenock
According to the poverty statistics in Greenock, males aged under 5 years and females aged under 5 years are the age groups that are most secure financially, with 100.0% of males and 100.0% of females in these age groups living above the poverty line.
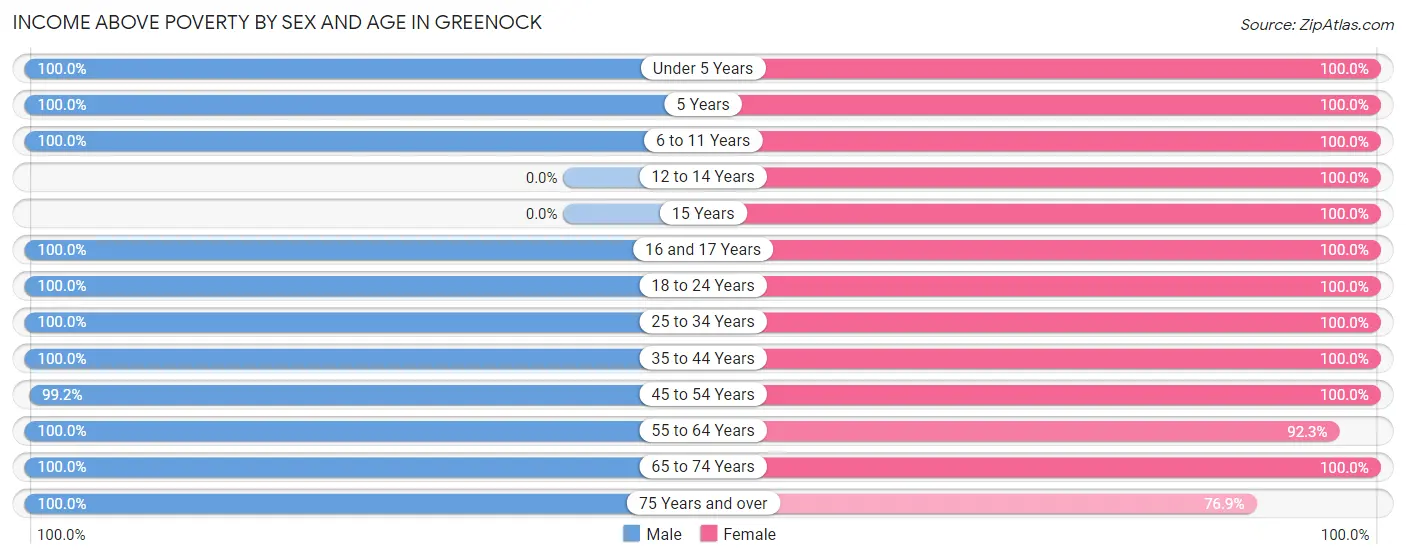
| Age Bracket | Male | Female |
| Under 5 Years | 30 (100.0%) | 12 (100.0%) |
| 5 Years | 13 (100.0%) | 7 (100.0%) |
| 6 to 11 Years | 30 (100.0%) | 22 (100.0%) |
| 12 to 14 Years | 0 (0.0%) | 71 (100.0%) |
| 15 Years | 0 (0.0%) | 4 (100.0%) |
| 16 and 17 Years | 80 (100.0%) | 89 (100.0%) |
| 18 to 24 Years | 22 (100.0%) | 219 (100.0%) |
| 25 to 34 Years | 77 (100.0%) | 85 (100.0%) |
| 35 to 44 Years | 23 (100.0%) | 119 (100.0%) |
| 45 to 54 Years | 119 (99.2%) | 225 (100.0%) |
| 55 to 64 Years | 161 (100.0%) | 205 (92.3%) |
| 65 to 74 Years | 35 (100.0%) | 80 (100.0%) |
| 75 Years and over | 58 (100.0%) | 70 (76.9%) |
| Total | 648 (99.9%) | 1,208 (97.0%) |
Income Below Poverty Among Married-Couple Families in Greenock
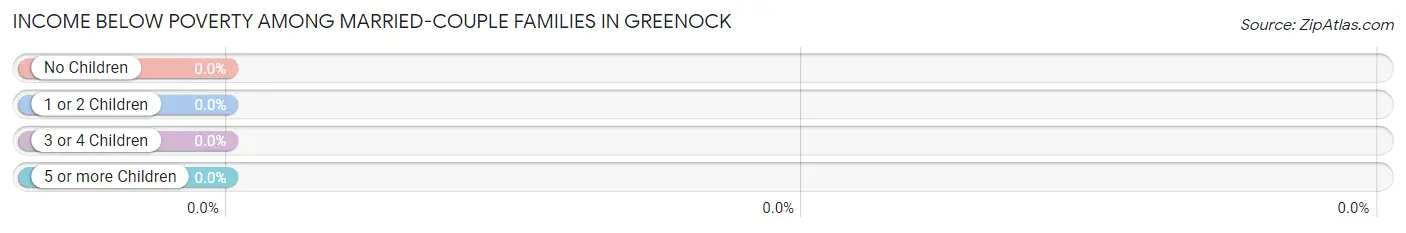
| Children | Above Poverty | Below Poverty |
| No Children | 164 (100.0%) | 0 (0.0%) |
| 1 or 2 Children | 134 (100.0%) | 0 (0.0%) |
| 3 or 4 Children | 0 (0.0%) | 0 (0.0%) |
| 5 or more Children | 4 (100.0%) | 0 (0.0%) |
| Total | 302 (100.0%) | 0 (0.0%) |
Income Below Poverty Among Single-Parent Households in Greenock
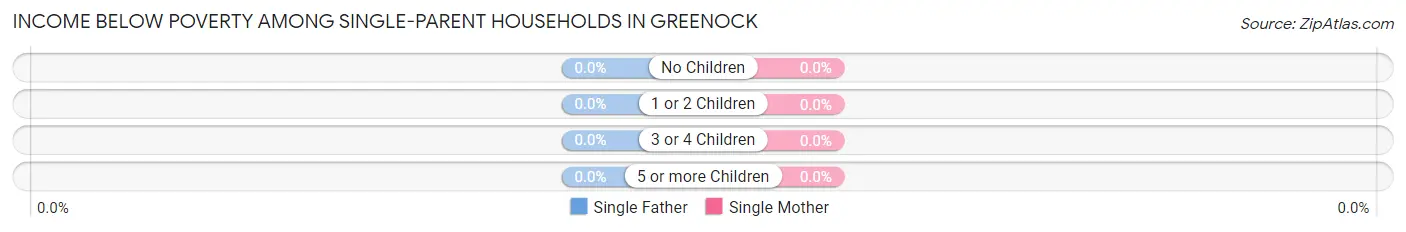
| Children | Single Father | Single Mother |
| No Children | 0 (0.0%) | 0 (0.0%) |
| 1 or 2 Children | 0 (0.0%) | 0 (0.0%) |
| 3 or 4 Children | 0 (0.0%) | 0 (0.0%) |
| 5 or more Children | 0 (0.0%) | 0 (0.0%) |
| Total | 0 (0.0%) | 0 (0.0%) |
Income Below Poverty Among Married-Couple vs Single-Parent Households in Greenock
| Children | Married-Couple Families | Single-Parent Households |
| No Children | 0 (0.0%) | 0 (0.0%) |
| 1 or 2 Children | 0 (0.0%) | 0 (0.0%) |
| 3 or 4 Children | 0 (0.0%) | 0 (0.0%) |
| 5 or more Children | 0 (0.0%) | 0 (0.0%) |
| Total | 0 (0.0%) | 0 (0.0%) |
Employment Characteristics in Greenock
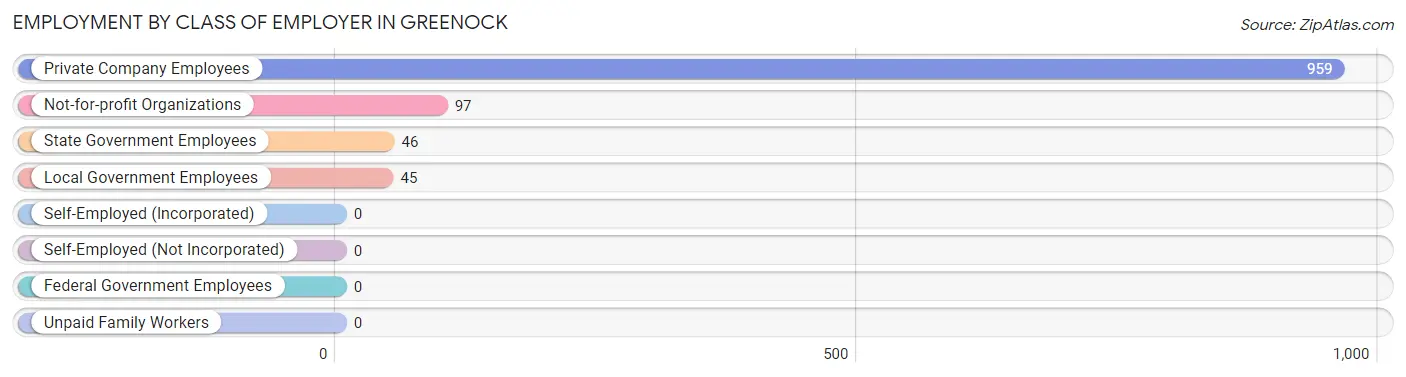
Employment by Class of Employer in Greenock
Among the 1,147 employed individuals in Greenock, private company employees (959 | 83.6%), not-for-profit organizations (97 | 8.5%), and state government employees (46 | 4.0%) make up the most common classes of employment.
| Employer Class | # Employees | % Employees |
| Private Company Employees | 959 | 83.6% |
| Self-Employed (Incorporated) | 0 | 0.0% |
| Self-Employed (Not Incorporated) | 0 | 0.0% |
| Not-for-profit Organizations | 97 | 8.5% |
| Local Government Employees | 45 | 3.9% |
| State Government Employees | 46 | 4.0% |
| Federal Government Employees | 0 | 0.0% |
| Unpaid Family Workers | 0 | 0.0% |
| Total | 1,147 | 100.0% |
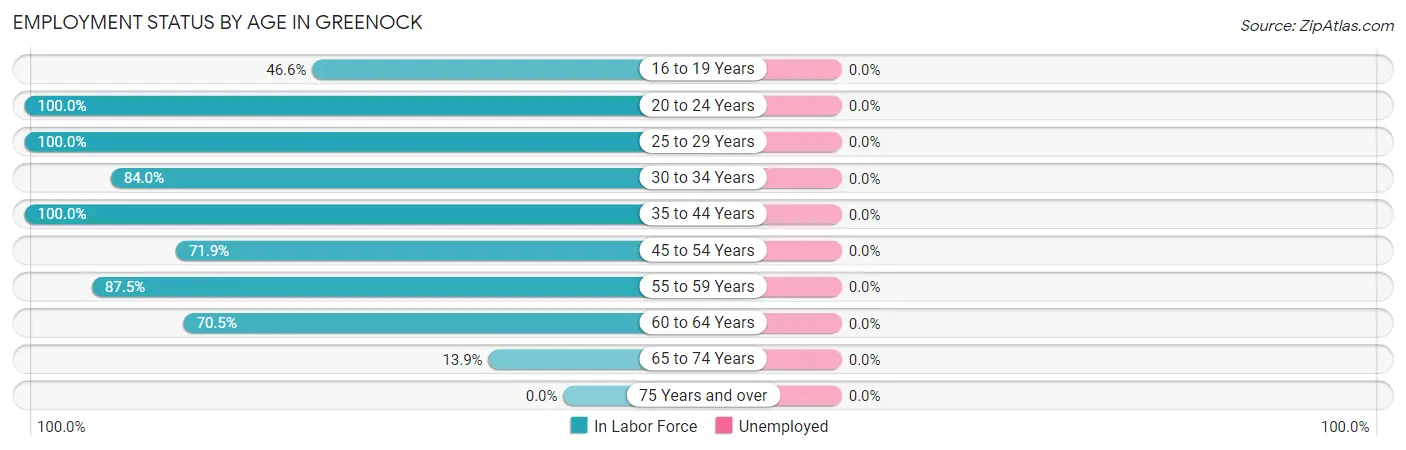
Employment Status by Age in Greenock
| Age Bracket | In Labor Force | Unemployed |
| 16 to 19 Years | 104 (46.6%) | 0 (0.0%) |
| 20 to 24 Years | 187 (100.0%) | 0 (0.0%) |
| 25 to 29 Years | 87 (100.0%) | 0 (0.0%) |
| 30 to 34 Years | 63 (84.0%) | 0 (0.0%) |
| 35 to 44 Years | 142 (100.0%) | 0 (0.0%) |
| 45 to 54 Years | 248 (71.9%) | 0 (0.0%) |
| 55 to 59 Years | 154 (87.5%) | 0 (0.0%) |
| 60 to 64 Years | 146 (70.5%) | 0 (0.0%) |
| 65 to 74 Years | 16 (13.9%) | 0 (0.0%) |
| 75 Years and over | 0 (0.0%) | 0 (0.0%) |
| Total | 1,146 (67.2%) | 0 (0.0%) |
Employment Status by Educational Attainment in Greenock
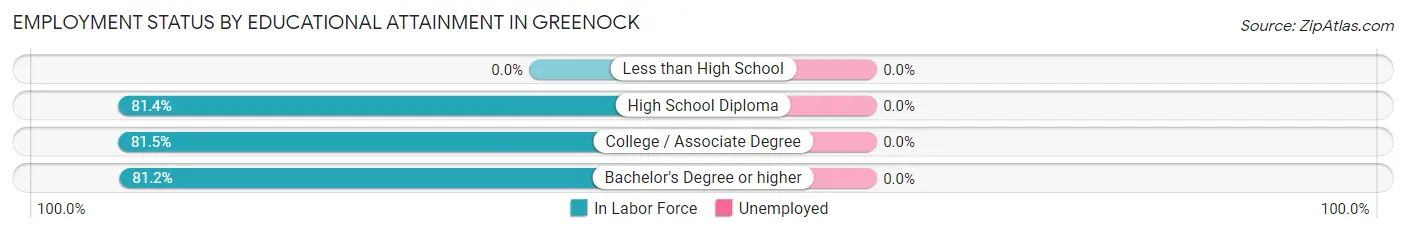
| Educational Attainment | In Labor Force | Unemployed |
| Less than High School | 0 (0.0%) | 0 (0.0%) |
| High School Diploma | 249 (81.4%) | 0 (0.0%) |
| College / Associate Degree | 423 (81.5%) | 0 (0.0%) |
| Bachelor's Degree or higher | 168 (81.2%) | 0 (0.0%) |
| Total | 840 (81.4%) | 0 (0.0%) |
Employment Occupations by Sex in Greenock
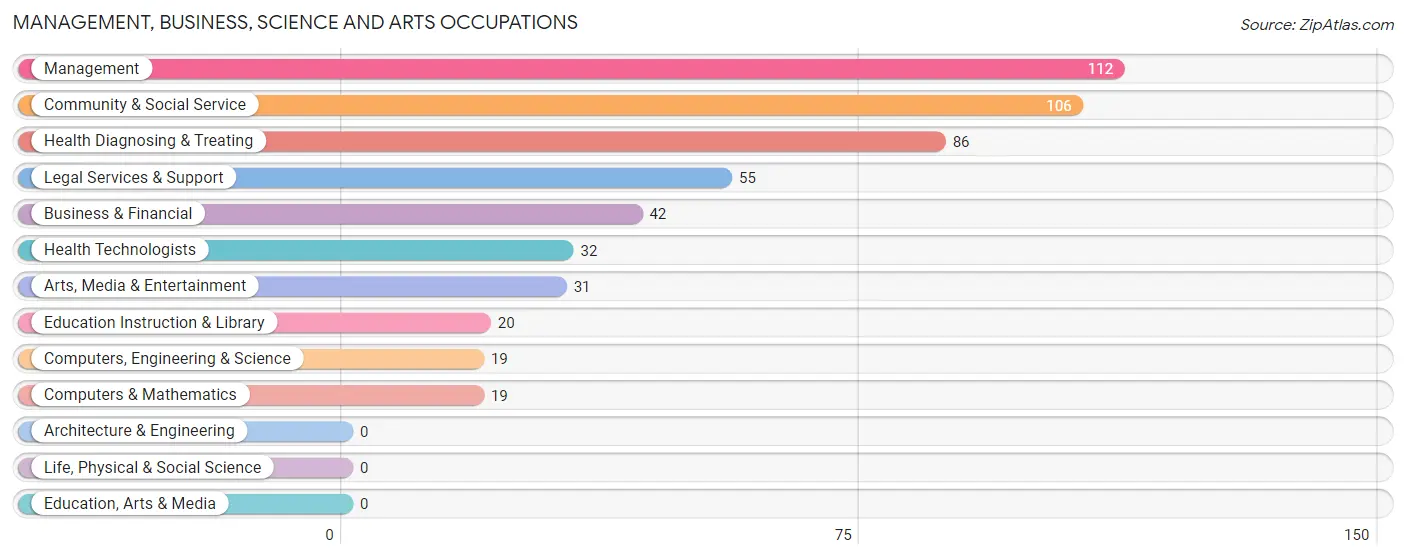
Management, Business, Science and Arts Occupations
The most common Management, Business, Science and Arts occupations in Greenock are Management (112 | 9.8%), Community & Social Service (106 | 9.2%), Health Diagnosing & Treating (86 | 7.5%), Legal Services & Support (55 | 4.8%), and Business & Financial (42 | 3.7%).
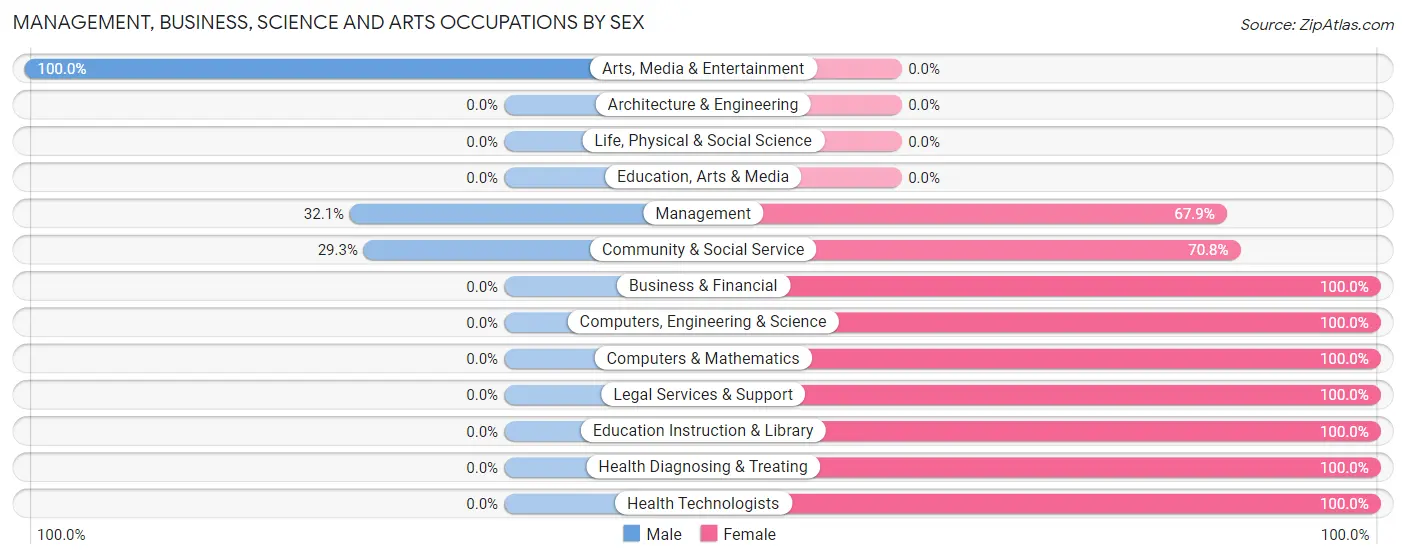
Management, Business, Science and Arts Occupations by Sex
Within the Management, Business, Science and Arts occupations in Greenock, the most male-oriented occupations are Arts, Media & Entertainment (100.0%), Management (32.1%), and Community & Social Service (29.2%), while the most female-oriented occupations are Business & Financial (100.0%), Computers, Engineering & Science (100.0%), and Computers & Mathematics (100.0%).
| Occupation | Male | Female |
| Management | 36 (32.1%) | 76 (67.9%) |
| Business & Financial | 0 (0.0%) | 42 (100.0%) |
| Computers, Engineering & Science | 0 (0.0%) | 19 (100.0%) |
| Computers & Mathematics | 0 (0.0%) | 19 (100.0%) |
| Architecture & Engineering | 0 (0.0%) | 0 (0.0%) |
| Life, Physical & Social Science | 0 (0.0%) | 0 (0.0%) |
| Community & Social Service | 31 (29.2%) | 75 (70.8%) |
| Education, Arts & Media | 0 (0.0%) | 0 (0.0%) |
| Legal Services & Support | 0 (0.0%) | 55 (100.0%) |
| Education Instruction & Library | 0 (0.0%) | 20 (100.0%) |
| Arts, Media & Entertainment | 31 (100.0%) | 0 (0.0%) |
| Health Diagnosing & Treating | 0 (0.0%) | 86 (100.0%) |
| Health Technologists | 0 (0.0%) | 32 (100.0%) |
| Total (Category) | 67 (18.4%) | 298 (81.6%) |
| Total (Overall) | 355 (30.9%) | 792 (69.1%) |
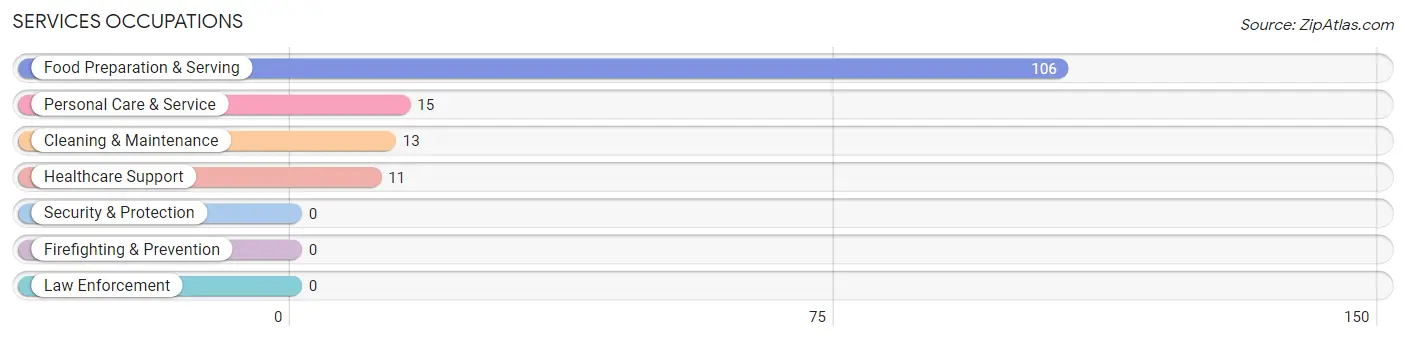
Services Occupations
The most common Services occupations in Greenock are Food Preparation & Serving (106 | 9.2%), Personal Care & Service (15 | 1.3%), Cleaning & Maintenance (13 | 1.1%), and Healthcare Support (11 | 1.0%).
Services Occupations by Sex
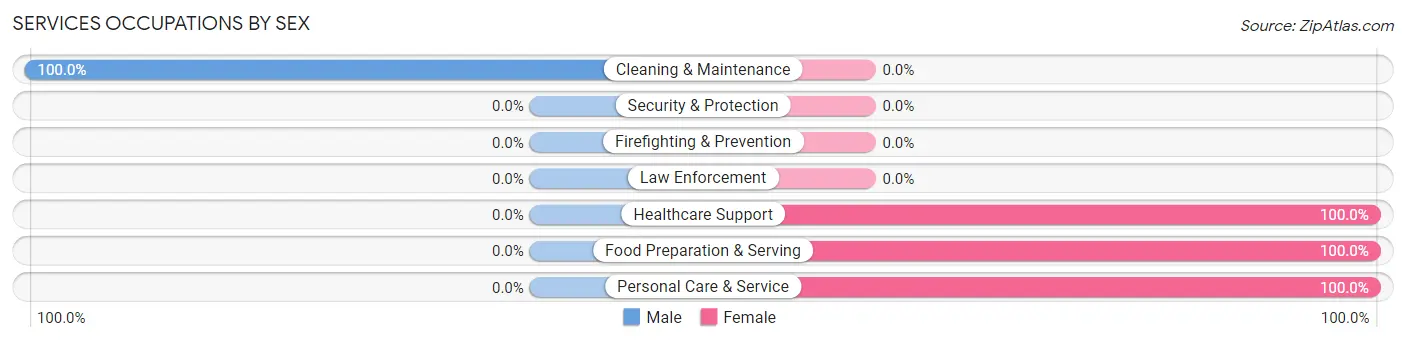
| Occupation | Male | Female |
| Healthcare Support | 0 (0.0%) | 11 (100.0%) |
| Security & Protection | 0 (0.0%) | 0 (0.0%) |
| Firefighting & Prevention | 0 (0.0%) | 0 (0.0%) |
| Law Enforcement | 0 (0.0%) | 0 (0.0%) |
| Food Preparation & Serving | 0 (0.0%) | 106 (100.0%) |
| Cleaning & Maintenance | 13 (100.0%) | 0 (0.0%) |
| Personal Care & Service | 0 (0.0%) | 15 (100.0%) |
| Total (Category) | 13 (9.0%) | 132 (91.0%) |
| Total (Overall) | 355 (30.9%) | 792 (69.1%) |
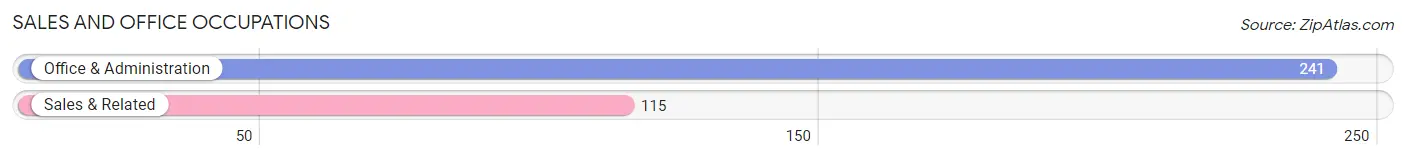
Sales and Office Occupations
The most common Sales and Office occupations in Greenock are Office & Administration (241 | 21.0%), and Sales & Related (115 | 10.0%).
Sales and Office Occupations by Sex
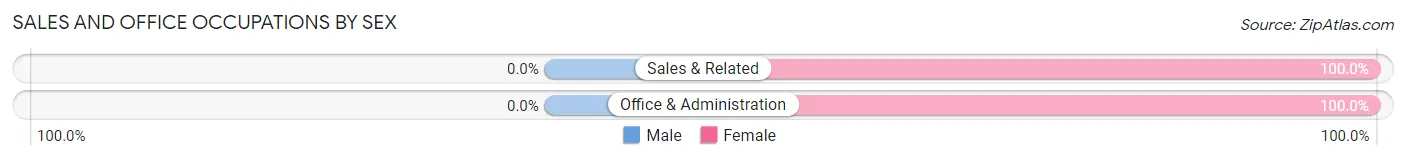
| Occupation | Male | Female |
| Sales & Related | 0 (0.0%) | 115 (100.0%) |
| Office & Administration | 0 (0.0%) | 241 (100.0%) |
| Total (Category) | 0 (0.0%) | 356 (100.0%) |
| Total (Overall) | 355 (30.9%) | 792 (69.1%) |
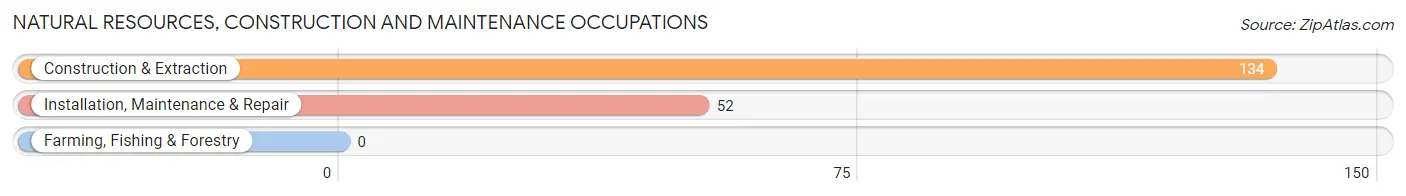
Natural Resources, Construction and Maintenance Occupations
The most common Natural Resources, Construction and Maintenance occupations in Greenock are Construction & Extraction (134 | 11.7%), and Installation, Maintenance & Repair (52 | 4.5%).
Natural Resources, Construction and Maintenance Occupations by Sex
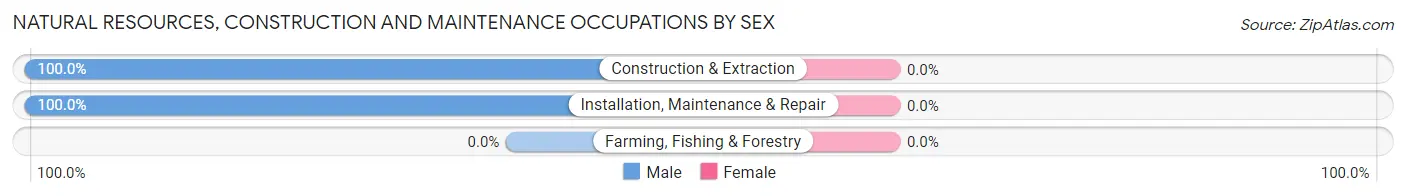
| Occupation | Male | Female |
| Farming, Fishing & Forestry | 0 (0.0%) | 0 (0.0%) |
| Construction & Extraction | 134 (100.0%) | 0 (0.0%) |
| Installation, Maintenance & Repair | 52 (100.0%) | 0 (0.0%) |
| Total (Category) | 186 (100.0%) | 0 (0.0%) |
| Total (Overall) | 355 (30.9%) | 792 (69.1%) |
Production, Transportation and Moving Occupations
The most common Production, Transportation and Moving occupations in Greenock are Production (77 | 6.7%), and Material Moving (18 | 1.6%).
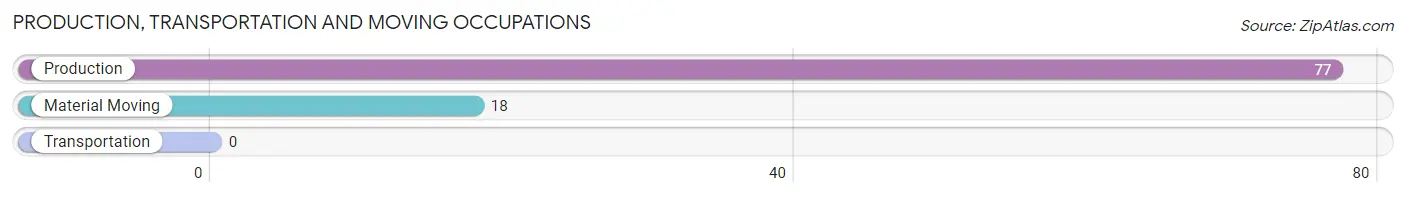
Production, Transportation and Moving Occupations by Sex
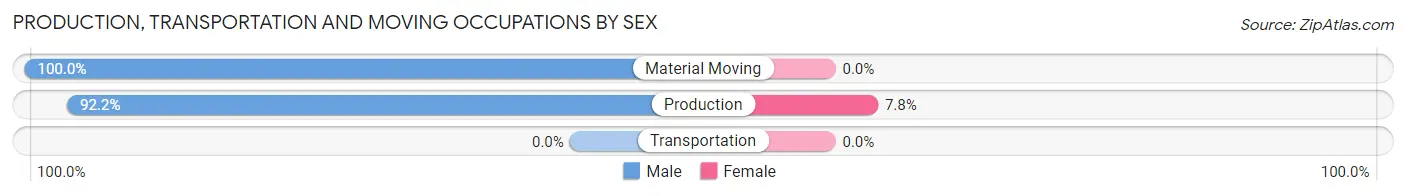
| Occupation | Male | Female |
| Production | 71 (92.2%) | 6 (7.8%) |
| Transportation | 0 (0.0%) | 0 (0.0%) |
| Material Moving | 18 (100.0%) | 0 (0.0%) |
| Total (Category) | 89 (93.7%) | 6 (6.3%) |
| Total (Overall) | 355 (30.9%) | 792 (69.1%) |
Employment Industries by Sex in Greenock
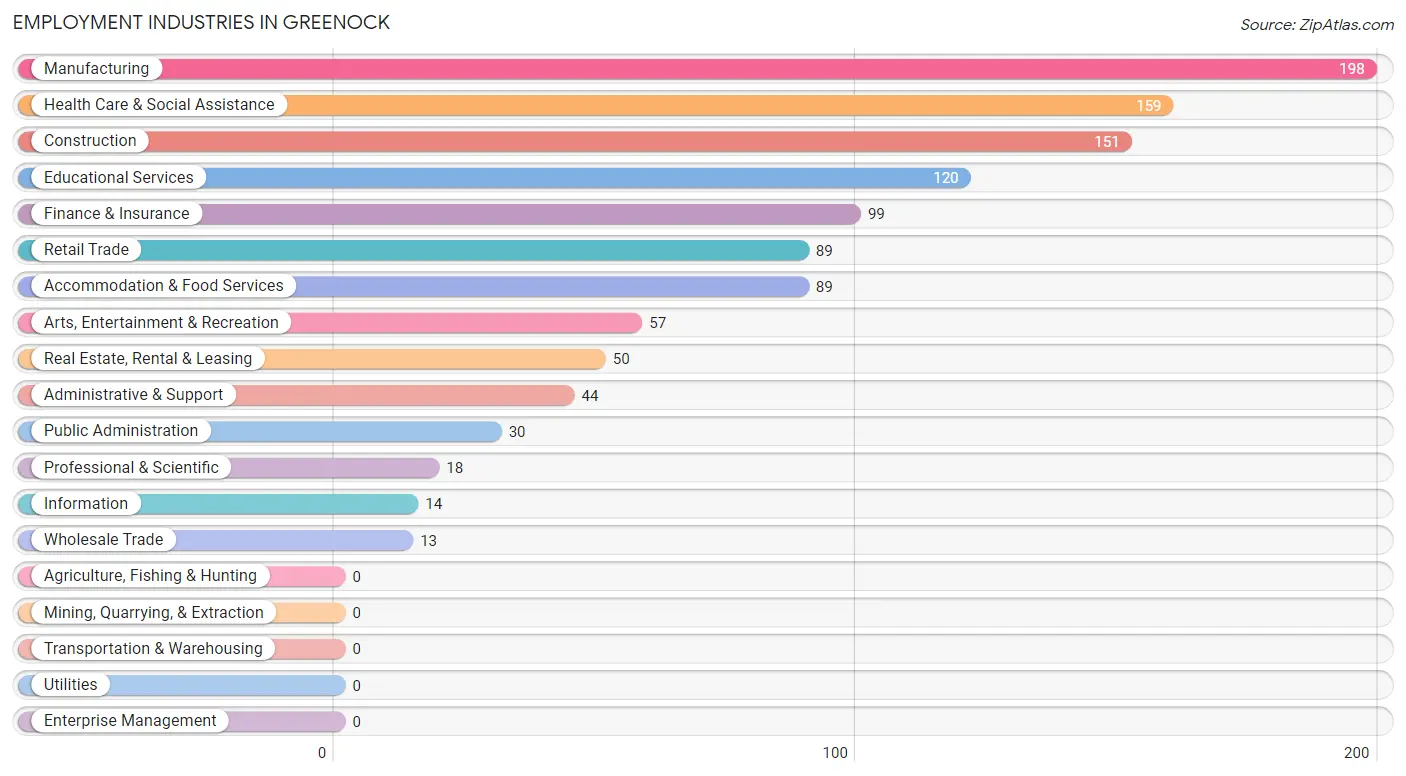
Employment Industries in Greenock
The major employment industries in Greenock include Manufacturing (198 | 17.3%), Health Care & Social Assistance (159 | 13.9%), Construction (151 | 13.2%), Educational Services (120 | 10.5%), and Finance & Insurance (99 | 8.6%).
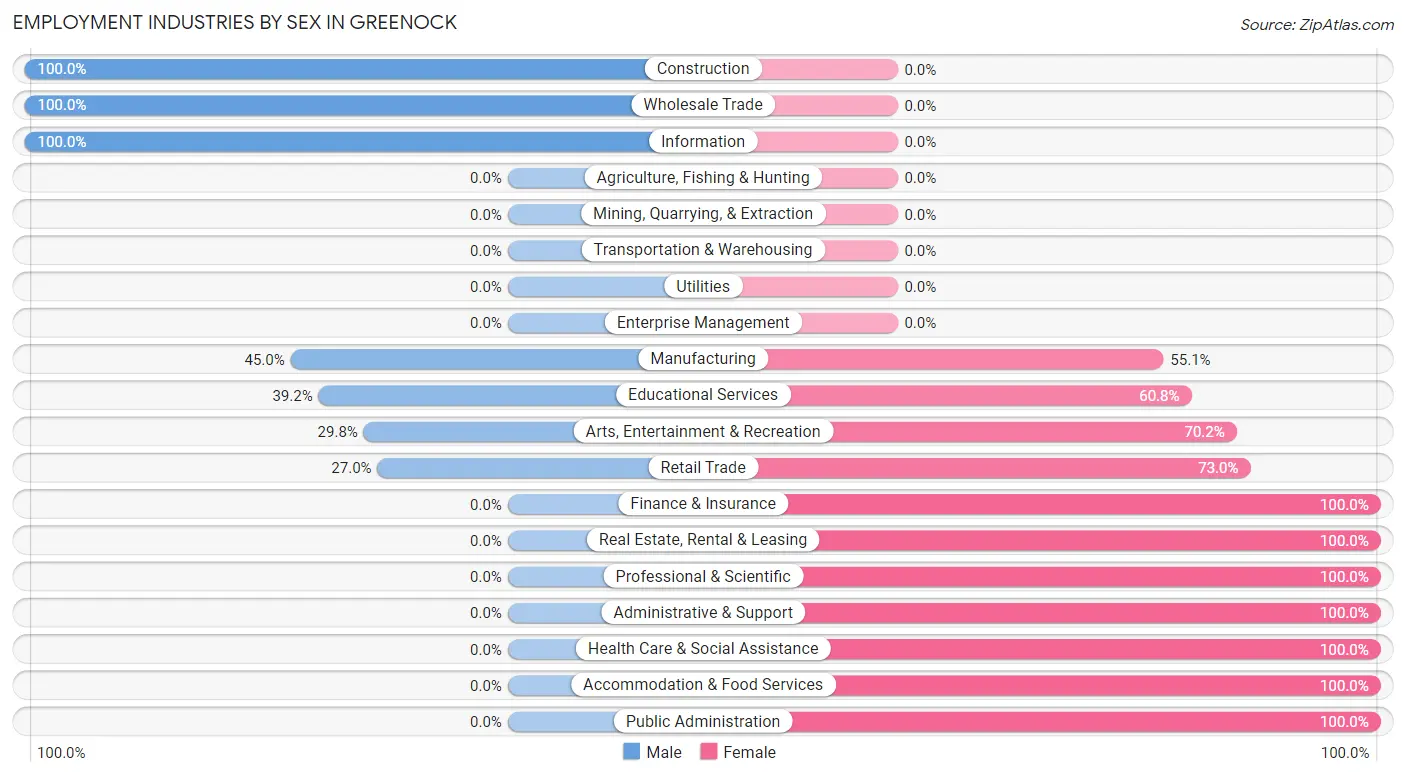
Employment Industries by Sex in Greenock
The Greenock industries that see more men than women are Construction (100.0%), Wholesale Trade (100.0%), and Information (100.0%), whereas the industries that tend to have a higher number of women are Finance & Insurance (100.0%), Real Estate, Rental & Leasing (100.0%), and Professional & Scientific (100.0%).
| Industry | Male | Female |
| Agriculture, Fishing & Hunting | 0 (0.0%) | 0 (0.0%) |
| Mining, Quarrying, & Extraction | 0 (0.0%) | 0 (0.0%) |
| Construction | 151 (100.0%) | 0 (0.0%) |
| Manufacturing | 89 (45.0%) | 109 (55.0%) |
| Wholesale Trade | 13 (100.0%) | 0 (0.0%) |
| Retail Trade | 24 (27.0%) | 65 (73.0%) |
| Transportation & Warehousing | 0 (0.0%) | 0 (0.0%) |
| Utilities | 0 (0.0%) | 0 (0.0%) |
| Information | 14 (100.0%) | 0 (0.0%) |
| Finance & Insurance | 0 (0.0%) | 99 (100.0%) |
| Real Estate, Rental & Leasing | 0 (0.0%) | 50 (100.0%) |
| Professional & Scientific | 0 (0.0%) | 18 (100.0%) |
| Enterprise Management | 0 (0.0%) | 0 (0.0%) |
| Administrative & Support | 0 (0.0%) | 44 (100.0%) |
| Educational Services | 47 (39.2%) | 73 (60.8%) |
| Health Care & Social Assistance | 0 (0.0%) | 159 (100.0%) |
| Arts, Entertainment & Recreation | 17 (29.8%) | 40 (70.2%) |
| Accommodation & Food Services | 0 (0.0%) | 89 (100.0%) |
| Public Administration | 0 (0.0%) | 30 (100.0%) |
| Total | 355 (30.9%) | 792 (69.1%) |
Education in Greenock
School Enrollment in Greenock
The most common levels of schooling among the 433 students in Greenock are high school (227 | 52.4%), middle school (93 | 21.5%), and college / undergraduate (44 | 10.2%).
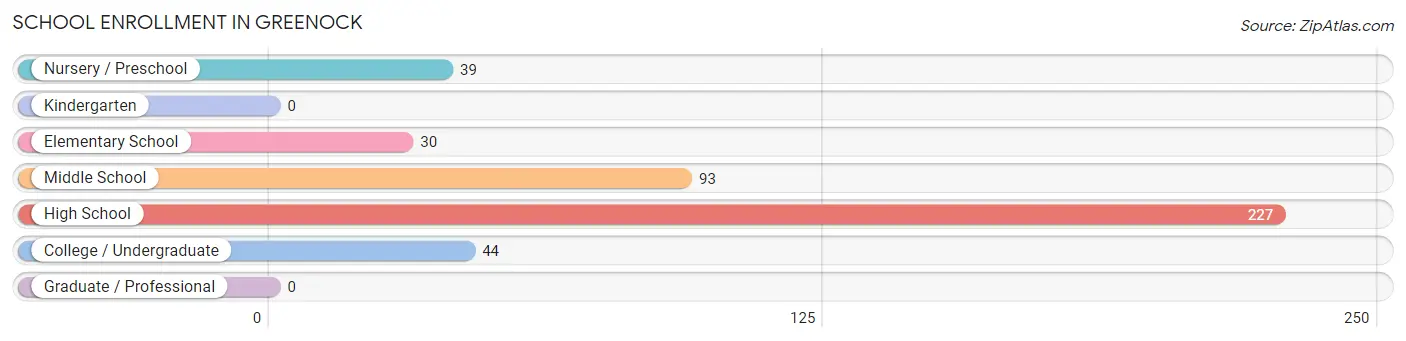
| School Level | # Students | % Students |
| Nursery / Preschool | 39 | 9.0% |
| Kindergarten | 0 | 0.0% |
| Elementary School | 30 | 6.9% |
| Middle School | 93 | 21.5% |
| High School | 227 | 52.4% |
| College / Undergraduate | 44 | 10.2% |
| Graduate / Professional | 0 | 0.0% |
| Total | 433 | 100.0% |
School Enrollment by Age by Funding Source in Greenock
Out of a total of 433 students who are enrolled in schools in Greenock, 44 (10.2%) attend a private institution, while the remaining 389 (89.8%) are enrolled in public schools. The age group of 20 to 24 year olds has the highest likelihood of being enrolled in private schools, with 40 (100.0% in the age bracket) enrolled. Conversely, the age group of 3 to 4 year olds has the lowest likelihood of being enrolled in a private school, with 19 (100.0% in the age bracket) attending a public institution.
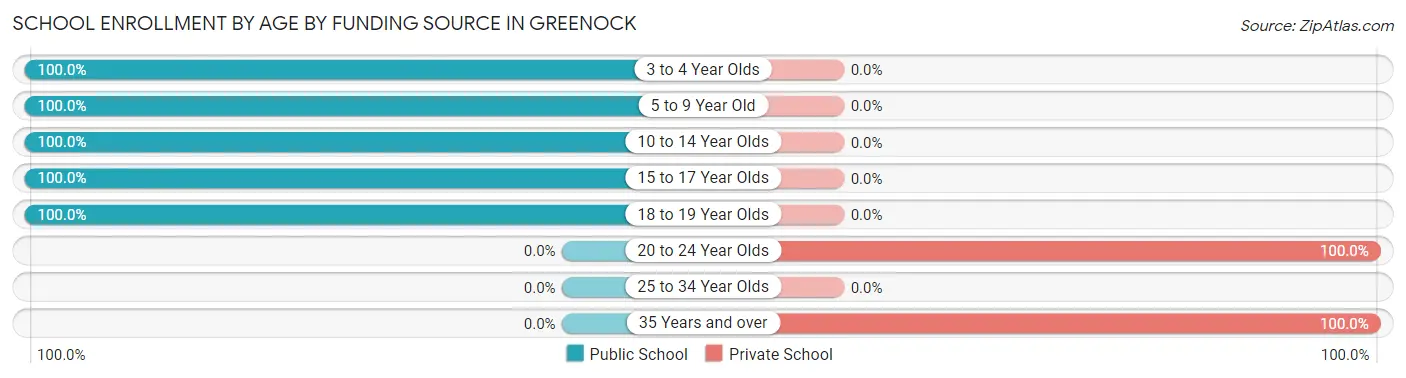
| Age Bracket | Public School | Private School |
| 3 to 4 Year Olds | 19 (100.0%) | 0 (0.0%) |
| 5 to 9 Year Old | 50 (100.0%) | 0 (0.0%) |
| 10 to 14 Year Olds | 93 (100.0%) | 0 (0.0%) |
| 15 to 17 Year Olds | 173 (100.0%) | 0 (0.0%) |
| 18 to 19 Year Olds | 54 (100.0%) | 0 (0.0%) |
| 20 to 24 Year Olds | 0 (0.0%) | 40 (100.0%) |
| 25 to 34 Year Olds | 0 (0.0%) | 0 (0.0%) |
| 35 Years and over | 0 (0.0%) | 4 (100.0%) |
| Total | 389 (89.8%) | 44 (10.2%) |
Educational Attainment by Field of Study in Greenock
Business (86 | 35.4%), education (75 | 30.9%), science & technology (68 | 28.0%), and communications (14 | 5.8%) are the most common fields of study among 243 individuals in Greenock who have obtained a bachelor's degree or higher.
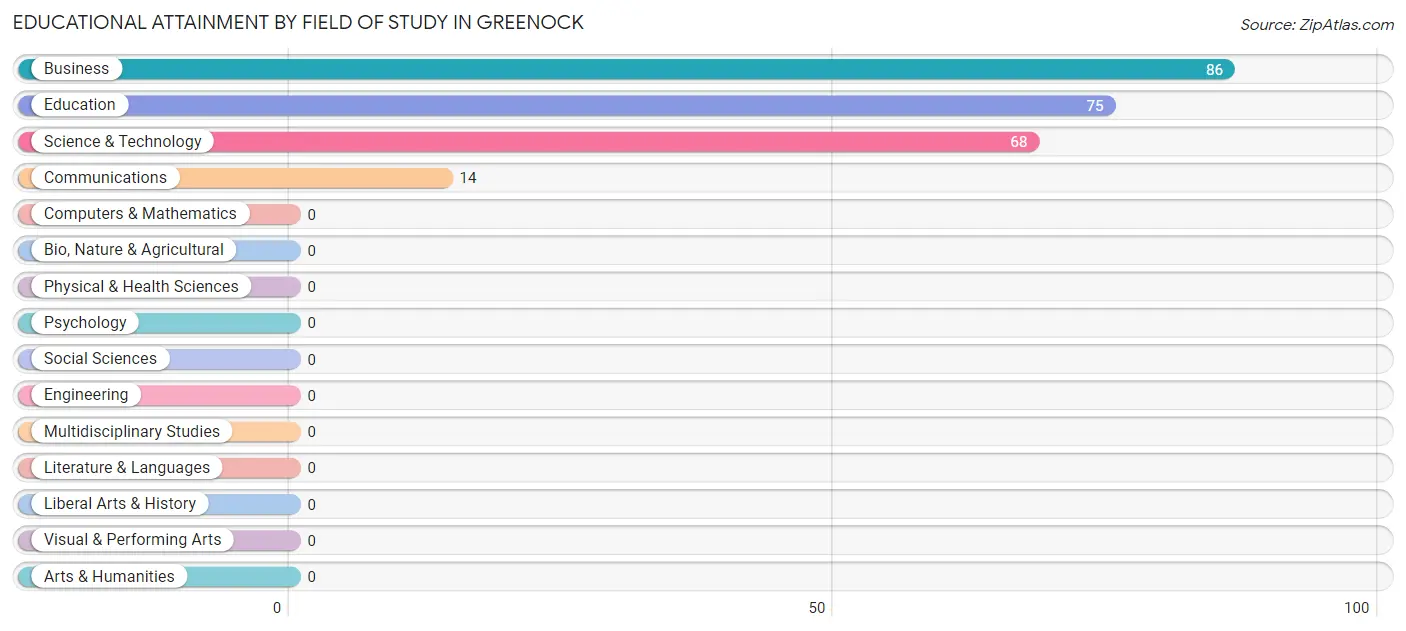
| Field of Study | # Graduates | % Graduates |
| Computers & Mathematics | 0 | 0.0% |
| Bio, Nature & Agricultural | 0 | 0.0% |
| Physical & Health Sciences | 0 | 0.0% |
| Psychology | 0 | 0.0% |
| Social Sciences | 0 | 0.0% |
| Engineering | 0 | 0.0% |
| Multidisciplinary Studies | 0 | 0.0% |
| Science & Technology | 68 | 28.0% |
| Business | 86 | 35.4% |
| Education | 75 | 30.9% |
| Literature & Languages | 0 | 0.0% |
| Liberal Arts & History | 0 | 0.0% |
| Visual & Performing Arts | 0 | 0.0% |
| Communications | 14 | 5.8% |
| Arts & Humanities | 0 | 0.0% |
| Total | 243 | 100.0% |
Transportation & Commute in Greenock
Vehicle Availability by Sex in Greenock
The most prevalent vehicle ownership categories in Greenock are males with 2 vehicles (134, accounting for 37.8%) and females with 2 vehicles (207, making up 16.9%).
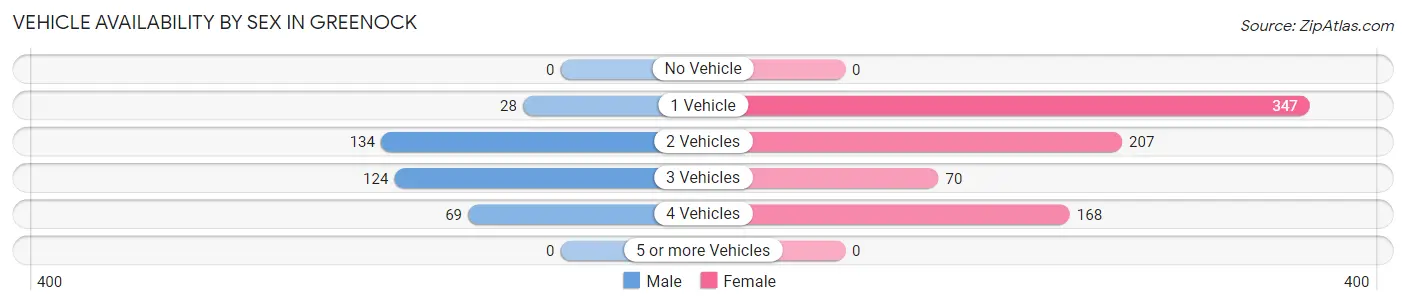
| Vehicles Available | Male | Female |
| No Vehicle | 0 (0.0%) | 0 (0.0%) |
| 1 Vehicle | 28 (7.9%) | 347 (43.8%) |
| 2 Vehicles | 134 (37.8%) | 207 (26.1%) |
| 3 Vehicles | 124 (34.9%) | 70 (8.8%) |
| 4 Vehicles | 69 (19.4%) | 168 (21.2%) |
| 5 or more Vehicles | 0 (0.0%) | 0 (0.0%) |
| Total | 355 (100.0%) | 792 (100.0%) |
Commute Time in Greenock
The most frequently occuring commute durations in Greenock are 60 to 89 minutes (250 commuters, 26.5%), 45 to 59 minutes (214 commuters, 22.7%), and 20 to 24 minutes (145 commuters, 15.4%).
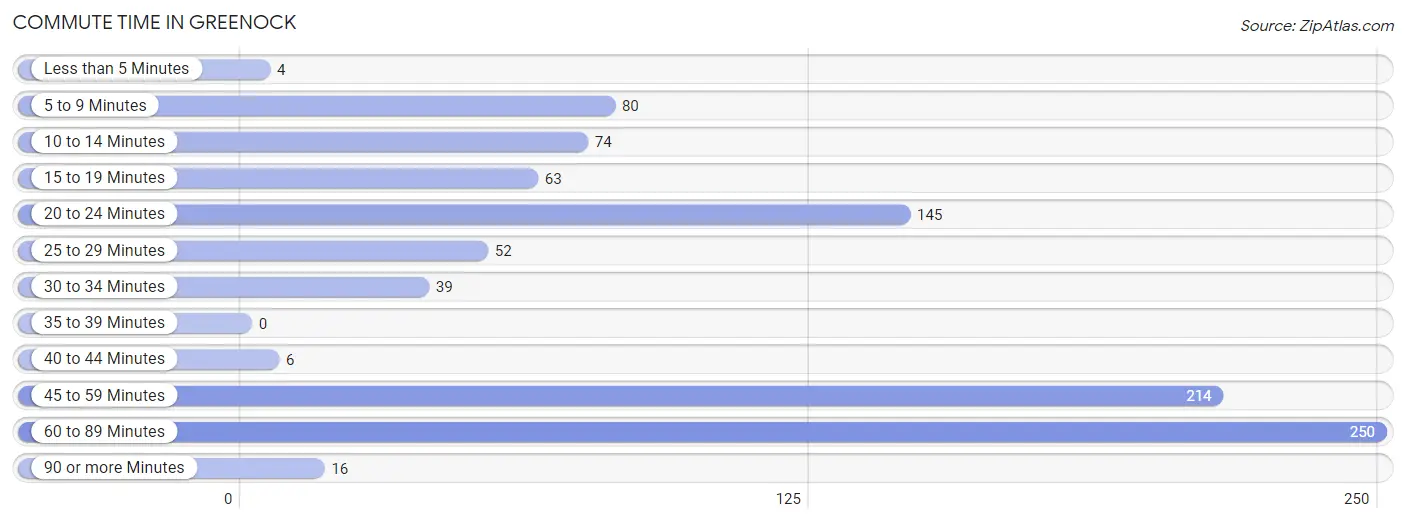
| Commute Time | # Commuters | % Commuters |
| Less than 5 Minutes | 4 | 0.4% |
| 5 to 9 Minutes | 80 | 8.5% |
| 10 to 14 Minutes | 74 | 7.9% |
| 15 to 19 Minutes | 63 | 6.7% |
| 20 to 24 Minutes | 145 | 15.4% |
| 25 to 29 Minutes | 52 | 5.5% |
| 30 to 34 Minutes | 39 | 4.1% |
| 35 to 39 Minutes | 0 | 0.0% |
| 40 to 44 Minutes | 6 | 0.6% |
| 45 to 59 Minutes | 214 | 22.7% |
| 60 to 89 Minutes | 250 | 26.5% |
| 90 or more Minutes | 16 | 1.7% |
Commute Time by Sex in Greenock
The most common commute times in Greenock are 60 to 89 minutes (147 commuters, 41.4%) for males and 45 to 59 minutes (172 commuters, 29.2%) for females.
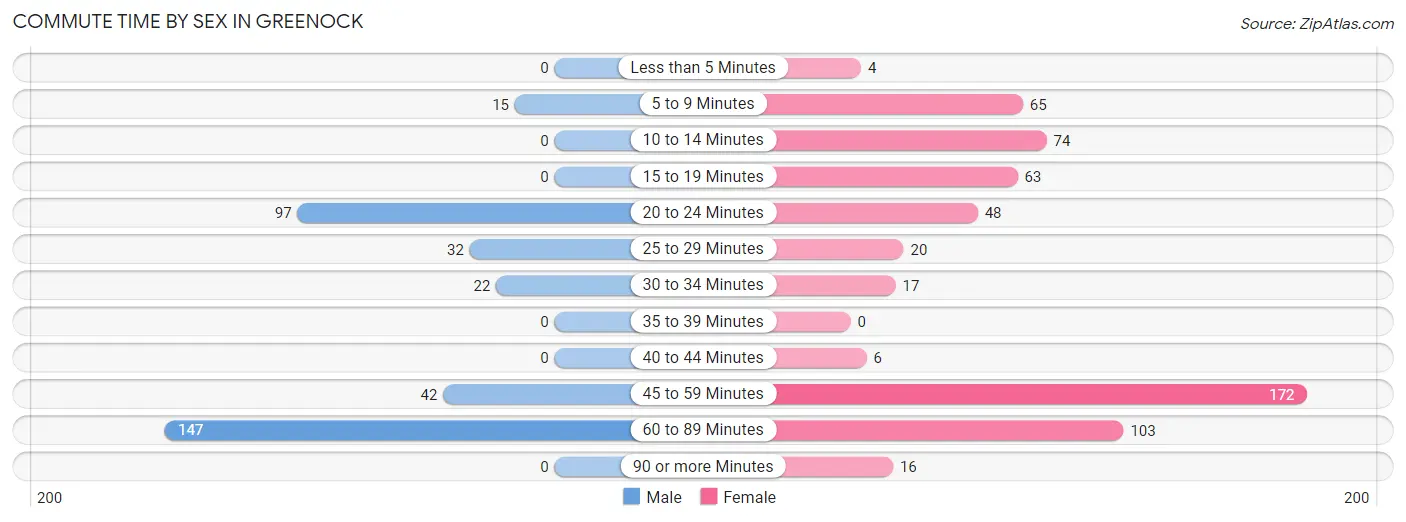
| Commute Time | Male | Female |
| Less than 5 Minutes | 0 (0.0%) | 4 (0.7%) |
| 5 to 9 Minutes | 15 (4.2%) | 65 (11.1%) |
| 10 to 14 Minutes | 0 (0.0%) | 74 (12.6%) |
| 15 to 19 Minutes | 0 (0.0%) | 63 (10.7%) |
| 20 to 24 Minutes | 97 (27.3%) | 48 (8.2%) |
| 25 to 29 Minutes | 32 (9.0%) | 20 (3.4%) |
| 30 to 34 Minutes | 22 (6.2%) | 17 (2.9%) |
| 35 to 39 Minutes | 0 (0.0%) | 0 (0.0%) |
| 40 to 44 Minutes | 0 (0.0%) | 6 (1.0%) |
| 45 to 59 Minutes | 42 (11.8%) | 172 (29.2%) |
| 60 to 89 Minutes | 147 (41.4%) | 103 (17.5%) |
| 90 or more Minutes | 0 (0.0%) | 16 (2.7%) |
Time of Departure to Work by Sex in Greenock
The most frequent times of departure to work in Greenock are 7:30 AM to 7:59 AM (106, 29.9%) for males and 7:00 AM to 7:29 AM (177, 30.1%) for females.
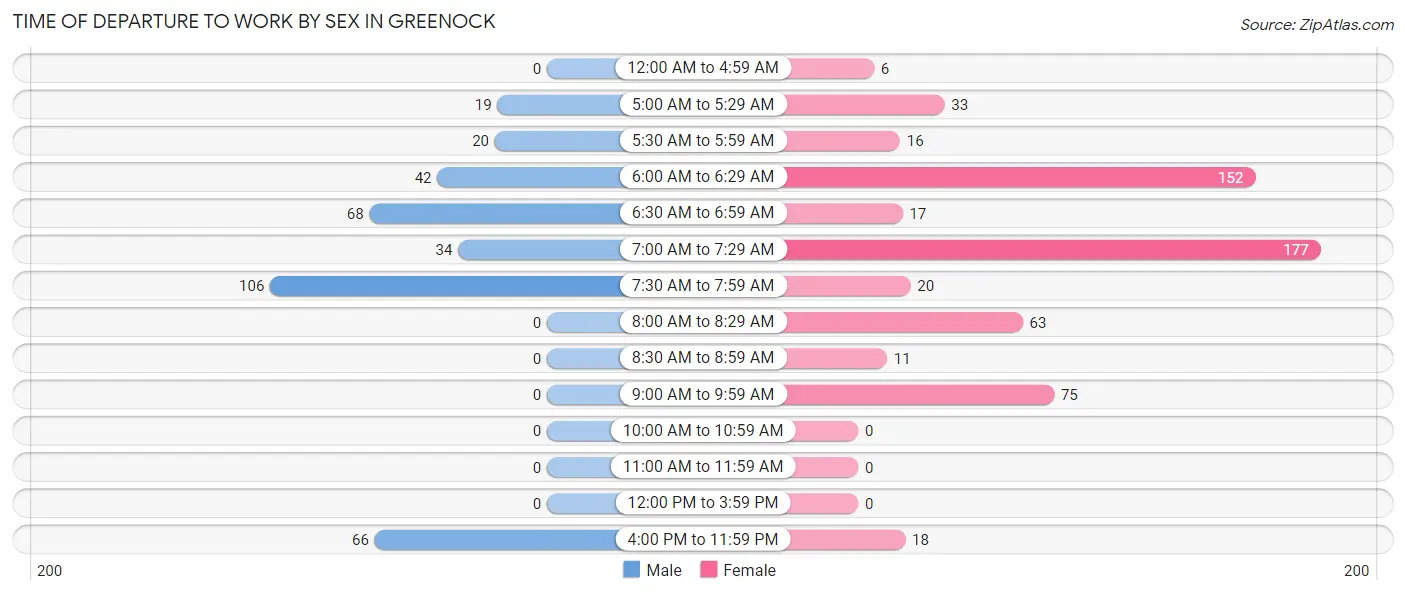
| Time of Departure | Male | Female |
| 12:00 AM to 4:59 AM | 0 (0.0%) | 6 (1.0%) |
| 5:00 AM to 5:29 AM | 19 (5.3%) | 33 (5.6%) |
| 5:30 AM to 5:59 AM | 20 (5.6%) | 16 (2.7%) |
| 6:00 AM to 6:29 AM | 42 (11.8%) | 152 (25.9%) |
| 6:30 AM to 6:59 AM | 68 (19.2%) | 17 (2.9%) |
| 7:00 AM to 7:29 AM | 34 (9.6%) | 177 (30.1%) |
| 7:30 AM to 7:59 AM | 106 (29.9%) | 20 (3.4%) |
| 8:00 AM to 8:29 AM | 0 (0.0%) | 63 (10.7%) |
| 8:30 AM to 8:59 AM | 0 (0.0%) | 11 (1.9%) |
| 9:00 AM to 9:59 AM | 0 (0.0%) | 75 (12.8%) |
| 10:00 AM to 10:59 AM | 0 (0.0%) | 0 (0.0%) |
| 11:00 AM to 11:59 AM | 0 (0.0%) | 0 (0.0%) |
| 12:00 PM to 3:59 PM | 0 (0.0%) | 0 (0.0%) |
| 4:00 PM to 11:59 PM | 66 (18.6%) | 18 (3.1%) |
| Total | 355 (100.0%) | 588 (100.0%) |
Housing Occupancy in Greenock
Occupancy by Ownership in Greenock
Of the total 837 dwellings in Greenock, owner-occupied units account for 593 (70.9%), while renter-occupied units make up 244 (29.1%).
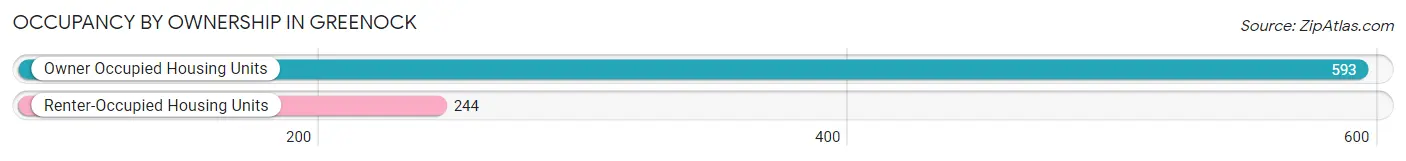
| Occupancy | # Housing Units | % Housing Units |
| Owner Occupied Housing Units | 593 | 70.9% |
| Renter-Occupied Housing Units | 244 | 29.1% |
| Total Occupied Housing Units | 837 | 100.0% |
Occupancy by Household Size in Greenock
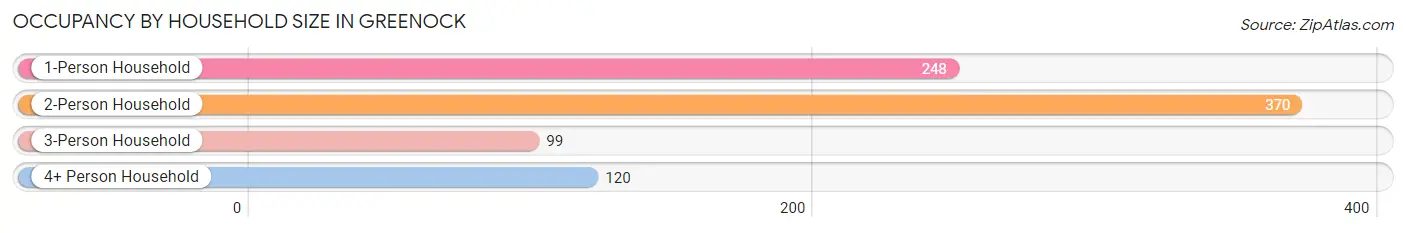
| Household Size | # Housing Units | % Housing Units |
| 1-Person Household | 248 | 29.6% |
| 2-Person Household | 370 | 44.2% |
| 3-Person Household | 99 | 11.8% |
| 4+ Person Household | 120 | 14.3% |
| Total Housing Units | 837 | 100.0% |
Occupancy by Ownership by Household Size in Greenock
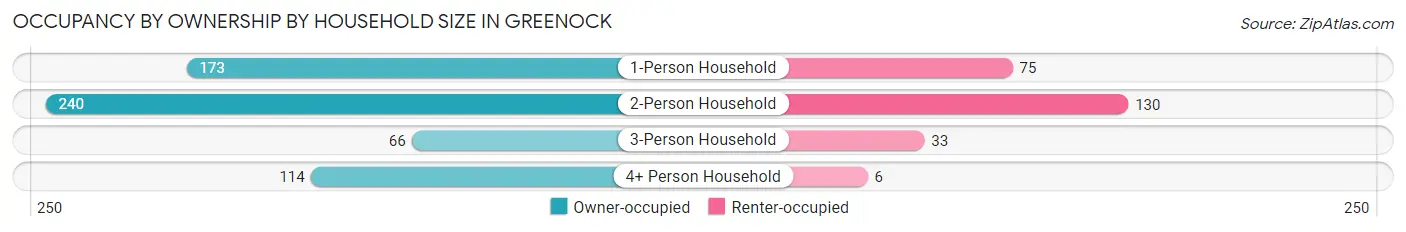
| Household Size | Owner-occupied | Renter-occupied |
| 1-Person Household | 173 (69.8%) | 75 (30.2%) |
| 2-Person Household | 240 (64.9%) | 130 (35.1%) |
| 3-Person Household | 66 (66.7%) | 33 (33.3%) |
| 4+ Person Household | 114 (95.0%) | 6 (5.0%) |
| Total Housing Units | 593 (70.9%) | 244 (29.1%) |
Occupancy by Educational Attainment in Greenock
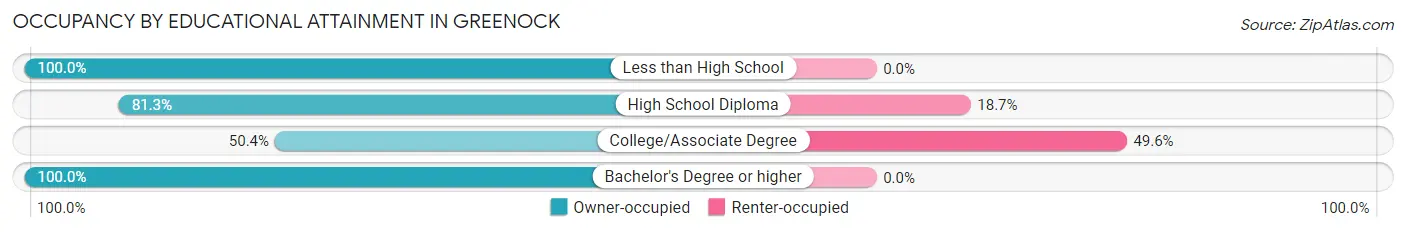
| Household Size | Owner-occupied | Renter-occupied |
| Less than High School | 33 (100.0%) | 0 (0.0%) |
| High School Diploma | 209 (81.3%) | 48 (18.7%) |
| College/Associate Degree | 199 (50.4%) | 196 (49.6%) |
| Bachelor's Degree or higher | 152 (100.0%) | 0 (0.0%) |
Occupancy by Age of Householder in Greenock
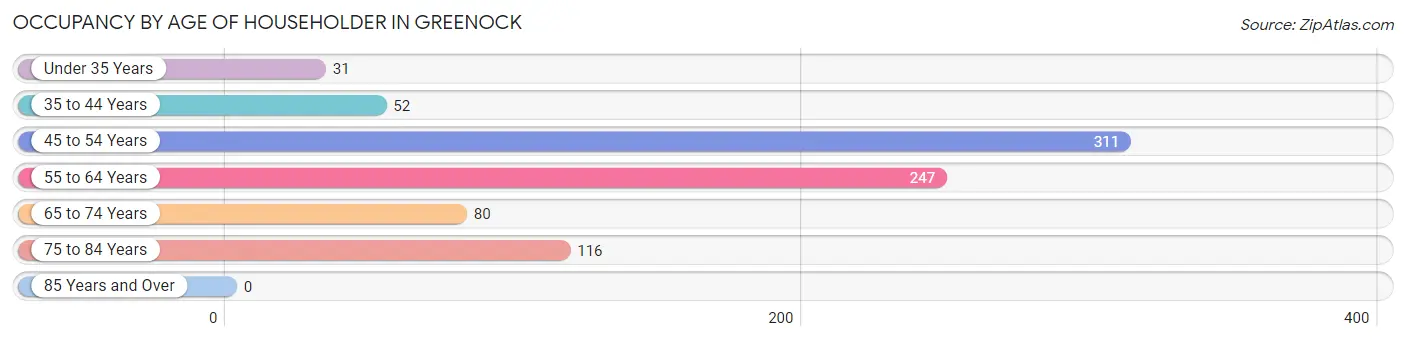
| Age Bracket | # Households | % Households |
| Under 35 Years | 31 | 3.7% |
| 35 to 44 Years | 52 | 6.2% |
| 45 to 54 Years | 311 | 37.2% |
| 55 to 64 Years | 247 | 29.5% |
| 65 to 74 Years | 80 | 9.6% |
| 75 to 84 Years | 116 | 13.9% |
| 85 Years and Over | 0 | 0.0% |
| Total | 837 | 100.0% |
Housing Finances in Greenock
Median Income by Occupancy in Greenock
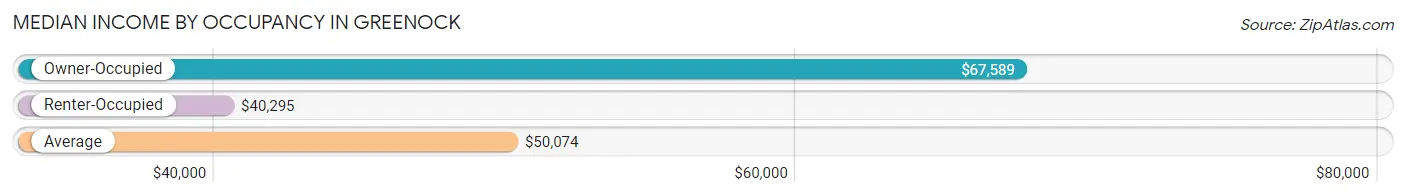
| Occupancy Type | # Households | Median Income |
| Owner-Occupied | 593 (70.9%) | $67,589 |
| Renter-Occupied | 244 (29.1%) | $40,295 |
| Average | 837 (100.0%) | $50,074 |
Occupancy by Householder Income Bracket in Greenock
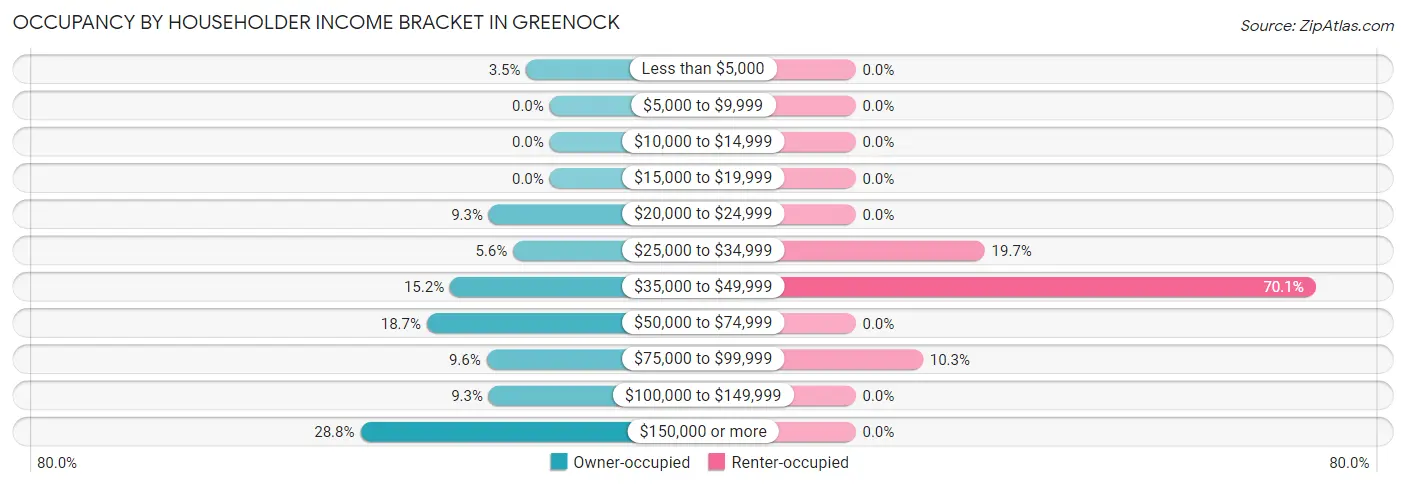
| Income Bracket | Owner-occupied | Renter-occupied |
| Less than $5,000 | 21 (3.5%) | 0 (0.0%) |
| $5,000 to $9,999 | 0 (0.0%) | 0 (0.0%) |
| $10,000 to $14,999 | 0 (0.0%) | 0 (0.0%) |
| $15,000 to $19,999 | 0 (0.0%) | 0 (0.0%) |
| $20,000 to $24,999 | 55 (9.3%) | 0 (0.0%) |
| $25,000 to $34,999 | 33 (5.6%) | 48 (19.7%) |
| $35,000 to $49,999 | 90 (15.2%) | 171 (70.1%) |
| $50,000 to $74,999 | 111 (18.7%) | 0 (0.0%) |
| $75,000 to $99,999 | 57 (9.6%) | 25 (10.2%) |
| $100,000 to $149,999 | 55 (9.3%) | 0 (0.0%) |
| $150,000 or more | 171 (28.8%) | 0 (0.0%) |
| Total | 593 (100.0%) | 244 (100.0%) |
Monthly Housing Cost Tiers in Greenock
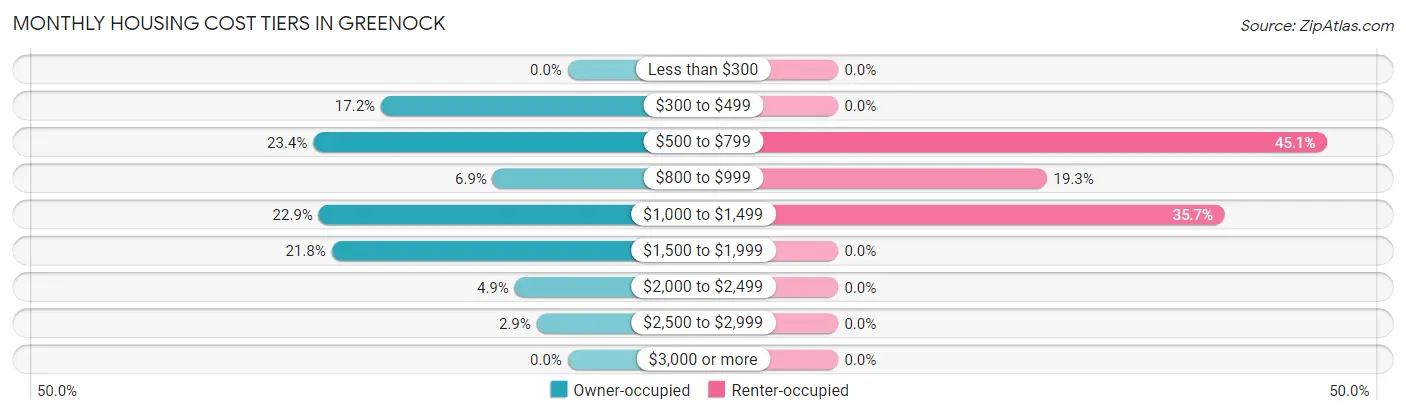
| Monthly Cost | Owner-occupied | Renter-occupied |
| Less than $300 | 0 (0.0%) | 0 (0.0%) |
| $300 to $499 | 102 (17.2%) | 0 (0.0%) |
| $500 to $799 | 139 (23.4%) | 110 (45.1%) |
| $800 to $999 | 41 (6.9%) | 47 (19.3%) |
| $1,000 to $1,499 | 136 (22.9%) | 87 (35.7%) |
| $1,500 to $1,999 | 129 (21.7%) | 0 (0.0%) |
| $2,000 to $2,499 | 29 (4.9%) | 0 (0.0%) |
| $2,500 to $2,999 | 17 (2.9%) | 0 (0.0%) |
| $3,000 or more | 0 (0.0%) | 0 (0.0%) |
| Total | 593 (100.0%) | 244 (100.0%) |
Physical Housing Characteristics in Greenock
Housing Structures in Greenock
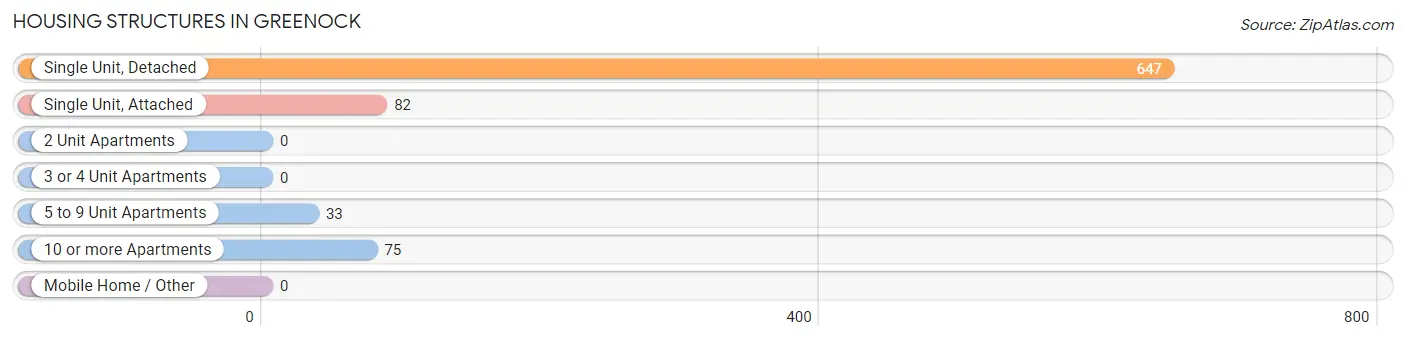
| Structure Type | # Housing Units | % Housing Units |
| Single Unit, Detached | 647 | 77.3% |
| Single Unit, Attached | 82 | 9.8% |
| 2 Unit Apartments | 0 | 0.0% |
| 3 or 4 Unit Apartments | 0 | 0.0% |
| 5 to 9 Unit Apartments | 33 | 3.9% |
| 10 or more Apartments | 75 | 9.0% |
| Mobile Home / Other | 0 | 0.0% |
| Total | 837 | 100.0% |
Housing Structures by Occupancy in Greenock
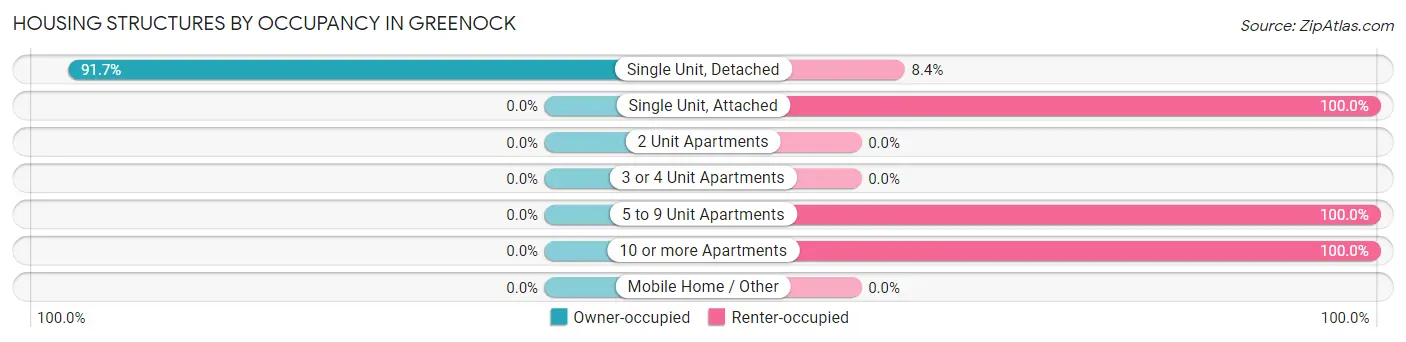
| Structure Type | Owner-occupied | Renter-occupied |
| Single Unit, Detached | 593 (91.6%) | 54 (8.4%) |
| Single Unit, Attached | 0 (0.0%) | 82 (100.0%) |
| 2 Unit Apartments | 0 (0.0%) | 0 (0.0%) |
| 3 or 4 Unit Apartments | 0 (0.0%) | 0 (0.0%) |
| 5 to 9 Unit Apartments | 0 (0.0%) | 33 (100.0%) |
| 10 or more Apartments | 0 (0.0%) | 75 (100.0%) |
| Mobile Home / Other | 0 (0.0%) | 0 (0.0%) |
| Total | 593 (70.9%) | 244 (29.1%) |
Housing Structures by Number of Rooms in Greenock
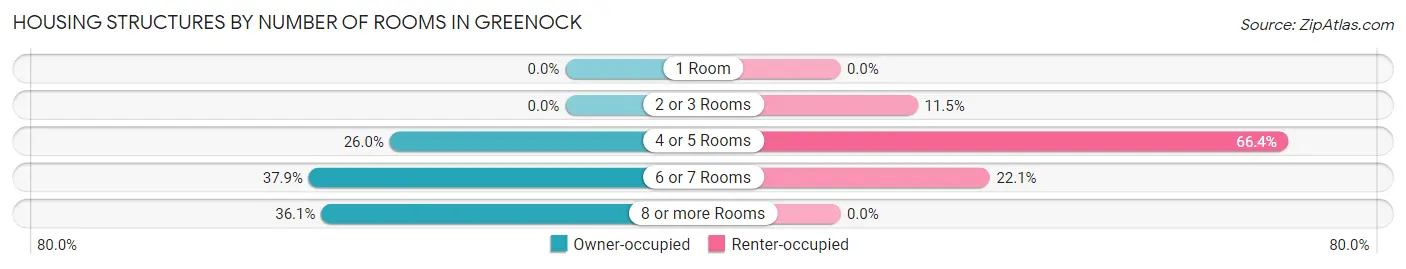
| Number of Rooms | Owner-occupied | Renter-occupied |
| 1 Room | 0 (0.0%) | 0 (0.0%) |
| 2 or 3 Rooms | 0 (0.0%) | 28 (11.5%) |
| 4 or 5 Rooms | 154 (26.0%) | 162 (66.4%) |
| 6 or 7 Rooms | 225 (37.9%) | 54 (22.1%) |
| 8 or more Rooms | 214 (36.1%) | 0 (0.0%) |
| Total | 593 (100.0%) | 244 (100.0%) |
Housing Structure by Heating Type in Greenock
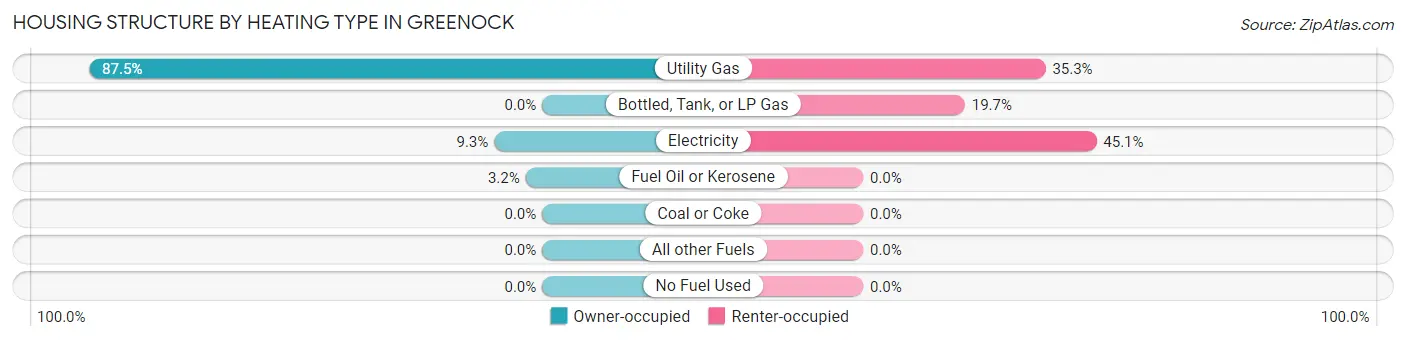
| Heating Type | Owner-occupied | Renter-occupied |
| Utility Gas | 519 (87.5%) | 86 (35.2%) |
| Bottled, Tank, or LP Gas | 0 (0.0%) | 48 (19.7%) |
| Electricity | 55 (9.3%) | 110 (45.1%) |
| Fuel Oil or Kerosene | 19 (3.2%) | 0 (0.0%) |
| Coal or Coke | 0 (0.0%) | 0 (0.0%) |
| All other Fuels | 0 (0.0%) | 0 (0.0%) |
| No Fuel Used | 0 (0.0%) | 0 (0.0%) |
| Total | 593 (100.0%) | 244 (100.0%) |
Household Vehicle Usage in Greenock
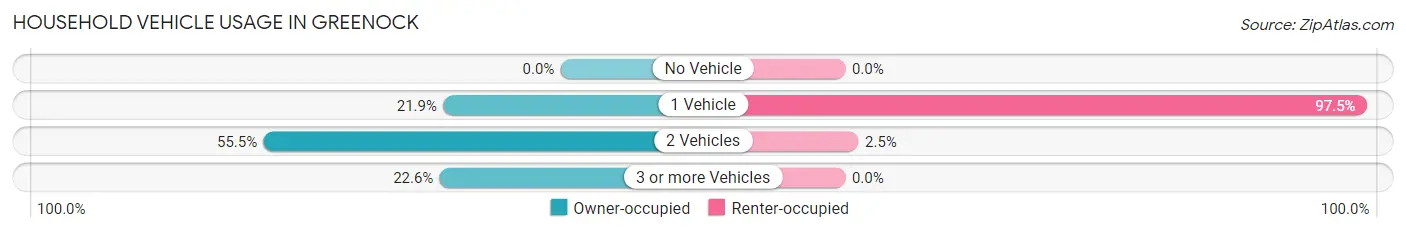
| Vehicles per Household | Owner-occupied | Renter-occupied |
| No Vehicle | 0 (0.0%) | 0 (0.0%) |
| 1 Vehicle | 130 (21.9%) | 238 (97.5%) |
| 2 Vehicles | 329 (55.5%) | 6 (2.5%) |
| 3 or more Vehicles | 134 (22.6%) | 0 (0.0%) |
| Total | 593 (100.0%) | 244 (100.0%) |
Real Estate & Mortgages in Greenock
Real Estate and Mortgage Overview in Greenock
| Characteristic | Without Mortgage | With Mortgage |
| Housing Units | 241 | 352 |
| Median Property Value | $100,900 | $160,100 |
| Median Household Income | $57,240 | $111 |
| Monthly Housing Costs | $519 | $0 |
| Real Estate Taxes | $2,337 | $0 |
Property Value by Mortgage Status in Greenock
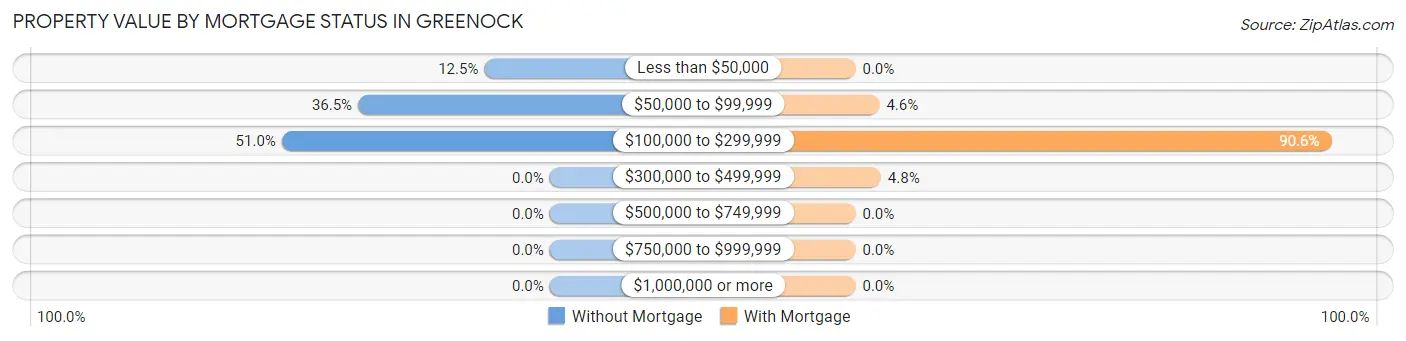
| Property Value | Without Mortgage | With Mortgage |
| Less than $50,000 | 30 (12.4%) | 0 (0.0%) |
| $50,000 to $99,999 | 88 (36.5%) | 16 (4.5%) |
| $100,000 to $299,999 | 123 (51.0%) | 319 (90.6%) |
| $300,000 to $499,999 | 0 (0.0%) | 17 (4.8%) |
| $500,000 to $749,999 | 0 (0.0%) | 0 (0.0%) |
| $750,000 to $999,999 | 0 (0.0%) | 0 (0.0%) |
| $1,000,000 or more | 0 (0.0%) | 0 (0.0%) |
| Total | 241 (100.0%) | 352 (100.0%) |
Household Income by Mortgage Status in Greenock
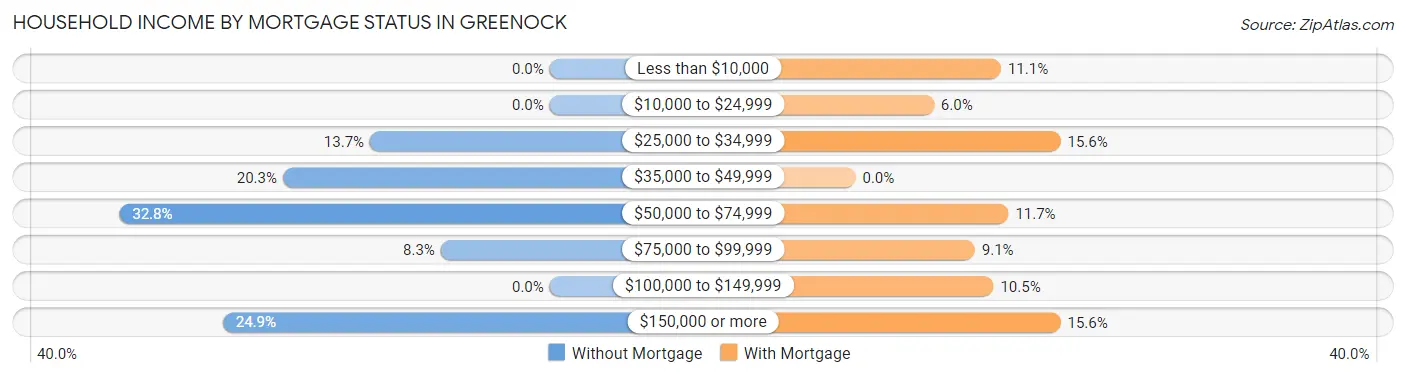
| Household Income | Without Mortgage | With Mortgage |
| Less than $10,000 | 0 (0.0%) | 39 (11.1%) |
| $10,000 to $24,999 | 0 (0.0%) | 21 (6.0%) |
| $25,000 to $34,999 | 33 (13.7%) | 55 (15.6%) |
| $35,000 to $49,999 | 49 (20.3%) | 0 (0.0%) |
| $50,000 to $74,999 | 79 (32.8%) | 41 (11.7%) |
| $75,000 to $99,999 | 20 (8.3%) | 32 (9.1%) |
| $100,000 to $149,999 | 0 (0.0%) | 37 (10.5%) |
| $150,000 or more | 60 (24.9%) | 55 (15.6%) |
| Total | 241 (100.0%) | 352 (100.0%) |
Property Value to Household Income Ratio in Greenock
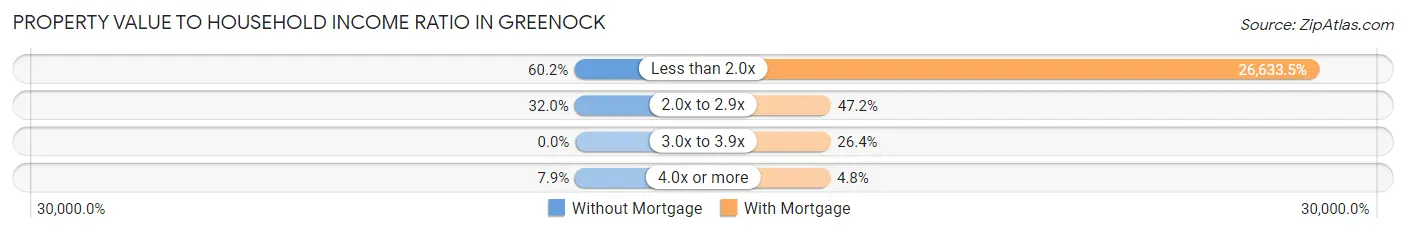
| Value-to-Income Ratio | Without Mortgage | With Mortgage |
| Less than 2.0x | 145 (60.2%) | 93,750 (26,633.5%) |
| 2.0x to 2.9x | 77 (32.0%) | 166 (47.2%) |
| 3.0x to 3.9x | 0 (0.0%) | 93 (26.4%) |
| 4.0x or more | 19 (7.9%) | 17 (4.8%) |
| Total | 241 (100.0%) | 352 (100.0%) |
Real Estate Taxes by Mortgage Status in Greenock
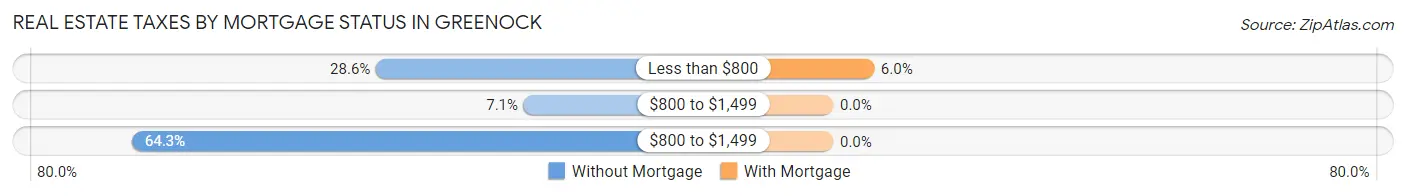
| Property Taxes | Without Mortgage | With Mortgage |
| Less than $800 | 69 (28.6%) | 21 (6.0%) |
| $800 to $1,499 | 17 (7.0%) | 0 (0.0%) |
| $800 to $1,499 | 155 (64.3%) | 0 (0.0%) |
| Total | 241 (100.0%) | 352 (100.0%) |
Health & Disability in Greenock
Health Insurance Coverage by Age in Greenock
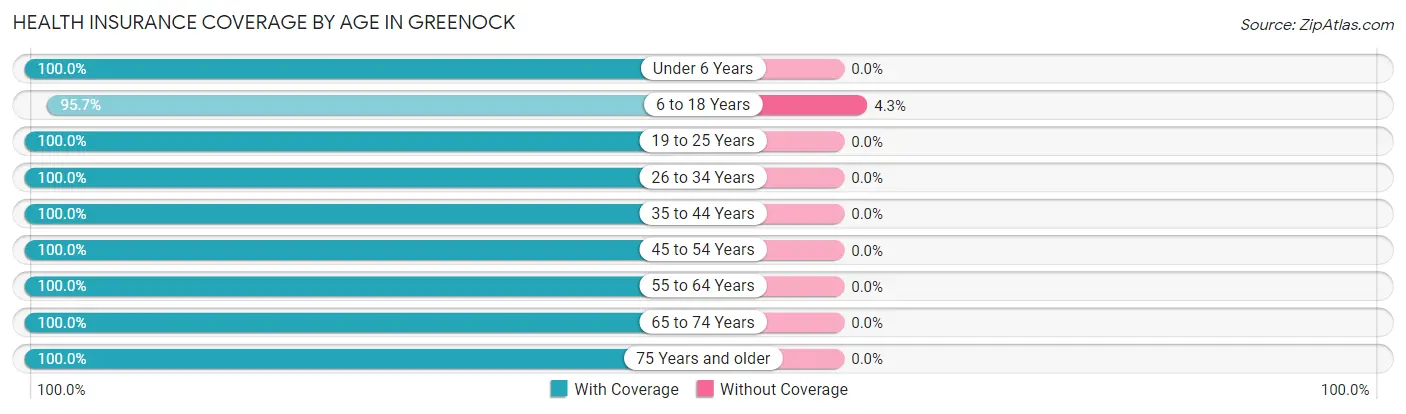
| Age Bracket | With Coverage | Without Coverage |
| Under 6 Years | 62 (100.0%) | 0 (0.0%) |
| 6 to 18 Years | 335 (95.7%) | 15 (4.3%) |
| 19 to 25 Years | 241 (100.0%) | 0 (0.0%) |
| 26 to 34 Years | 108 (100.0%) | 0 (0.0%) |
| 35 to 44 Years | 142 (100.0%) | 0 (0.0%) |
| 45 to 54 Years | 345 (100.0%) | 0 (0.0%) |
| 55 to 64 Years | 383 (100.0%) | 0 (0.0%) |
| 65 to 74 Years | 115 (100.0%) | 0 (0.0%) |
| 75 Years and older | 149 (100.0%) | 0 (0.0%) |
| Total | 1,880 (99.2%) | 15 (0.8%) |
Health Insurance Coverage by Citizenship Status in Greenock
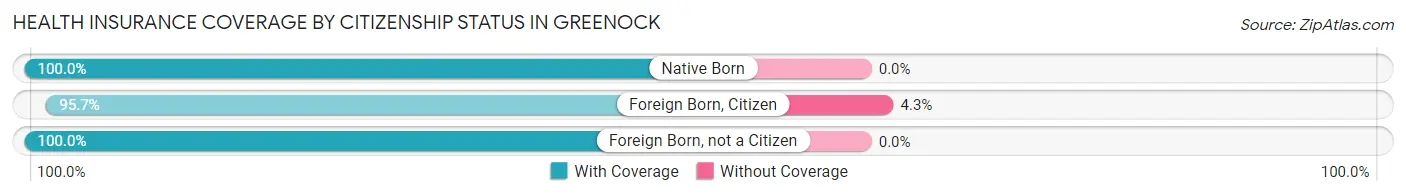
| Citizenship Status | With Coverage | Without Coverage |
| Native Born | 62 (100.0%) | 0 (0.0%) |
| Foreign Born, Citizen | 335 (95.7%) | 15 (4.3%) |
| Foreign Born, not a Citizen | 241 (100.0%) | 0 (0.0%) |
Health Insurance Coverage by Household Income in Greenock
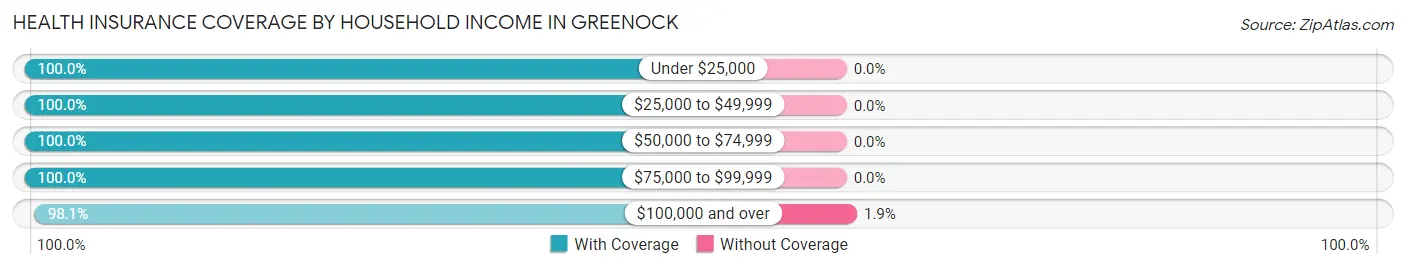
| Household Income | With Coverage | Without Coverage |
| Under $25,000 | 76 (100.0%) | 0 (0.0%) |
| $25,000 to $49,999 | 652 (100.0%) | 0 (0.0%) |
| $50,000 to $74,999 | 189 (100.0%) | 0 (0.0%) |
| $75,000 to $99,999 | 197 (100.0%) | 0 (0.0%) |
| $100,000 and over | 765 (98.1%) | 15 (1.9%) |
Public vs Private Health Insurance Coverage by Age in Greenock
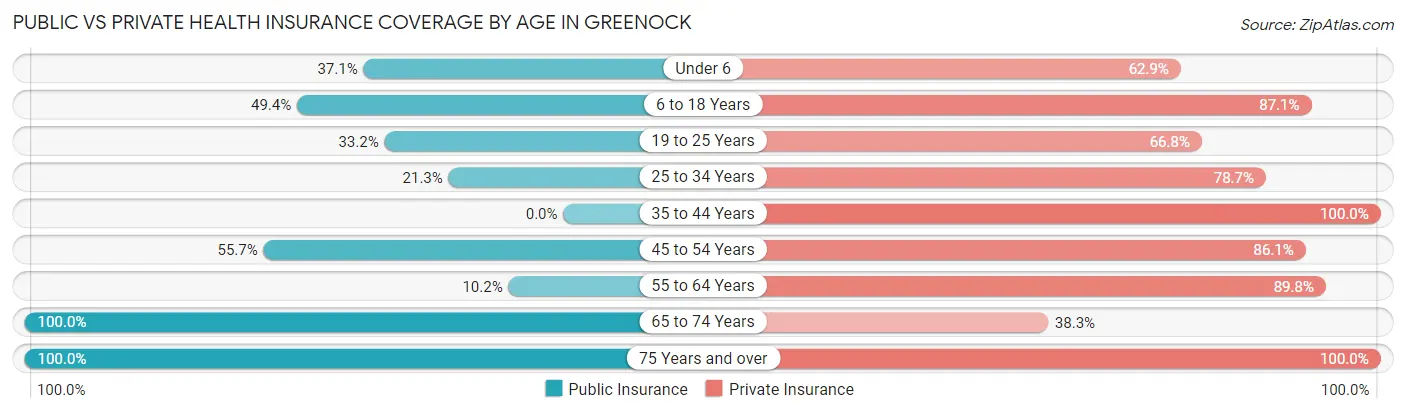
| Age Bracket | Public Insurance | Private Insurance |
| Under 6 | 23 (37.1%) | 39 (62.9%) |
| 6 to 18 Years | 173 (49.4%) | 305 (87.1%) |
| 19 to 25 Years | 80 (33.2%) | 161 (66.8%) |
| 25 to 34 Years | 23 (21.3%) | 85 (78.7%) |
| 35 to 44 Years | 0 (0.0%) | 142 (100.0%) |
| 45 to 54 Years | 192 (55.6%) | 297 (86.1%) |
| 55 to 64 Years | 39 (10.2%) | 344 (89.8%) |
| 65 to 74 Years | 115 (100.0%) | 44 (38.3%) |
| 75 Years and over | 149 (100.0%) | 149 (100.0%) |
| Total | 794 (41.9%) | 1,566 (82.6%) |
Disability Status by Sex by Age in Greenock
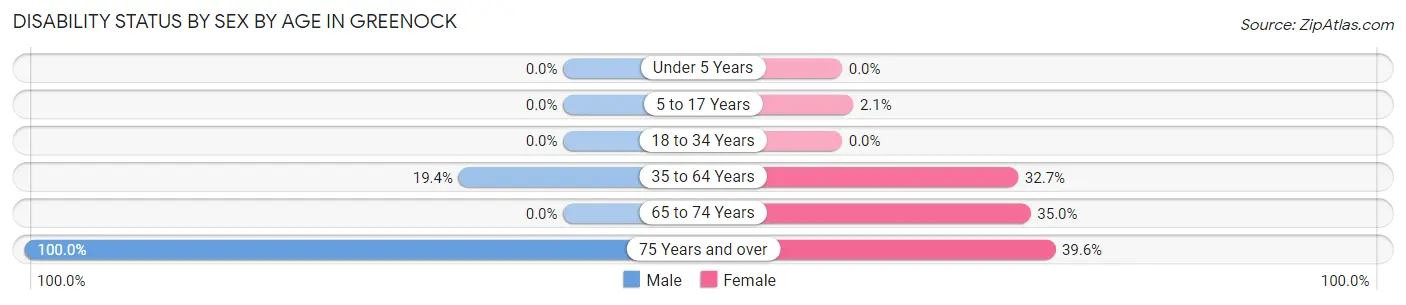
| Age Bracket | Male | Female |
| Under 5 Years | 0 (0.0%) | 0 (0.0%) |
| 5 to 17 Years | 0 (0.0%) | 4 (2.1%) |
| 18 to 34 Years | 0 (0.0%) | 0 (0.0%) |
| 35 to 64 Years | 59 (19.4%) | 185 (32.7%) |
| 65 to 74 Years | 0 (0.0%) | 28 (35.0%) |
| 75 Years and over | 58 (100.0%) | 36 (39.6%) |
Disability Class by Sex by Age in Greenock
Disability Class: Hearing Difficulty
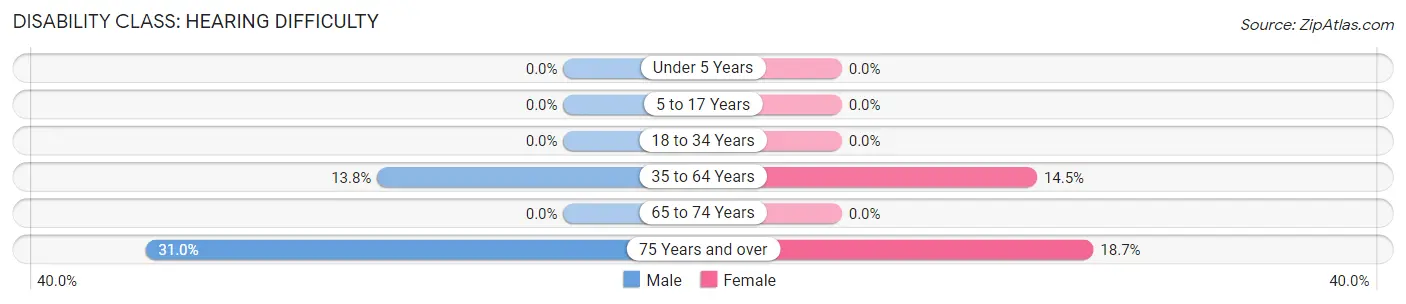
| Age Bracket | Male | Female |
| Under 5 Years | 0 (0.0%) | 0 (0.0%) |
| 5 to 17 Years | 0 (0.0%) | 0 (0.0%) |
| 18 to 34 Years | 0 (0.0%) | 0 (0.0%) |
| 35 to 64 Years | 42 (13.8%) | 82 (14.5%) |
| 65 to 74 Years | 0 (0.0%) | 0 (0.0%) |
| 75 Years and over | 18 (31.0%) | 17 (18.7%) |
Disability Class: Vision Difficulty
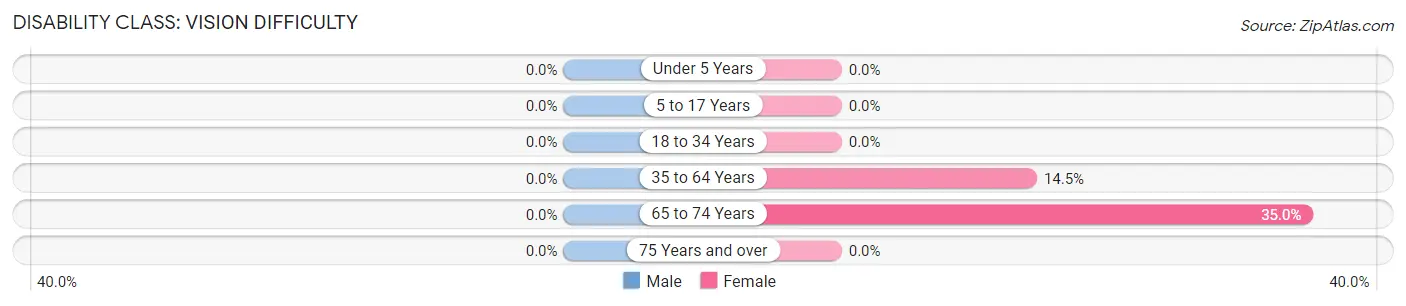
| Age Bracket | Male | Female |
| Under 5 Years | 0 (0.0%) | 0 (0.0%) |
| 5 to 17 Years | 0 (0.0%) | 0 (0.0%) |
| 18 to 34 Years | 0 (0.0%) | 0 (0.0%) |
| 35 to 64 Years | 0 (0.0%) | 82 (14.5%) |
| 65 to 74 Years | 0 (0.0%) | 28 (35.0%) |
| 75 Years and over | 0 (0.0%) | 0 (0.0%) |
Disability Class: Cognitive Difficulty
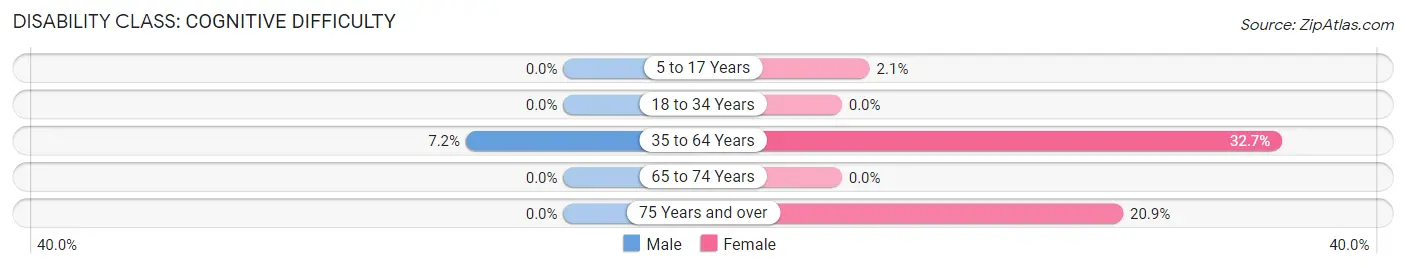
| Age Bracket | Male | Female |
| 5 to 17 Years | 0 (0.0%) | 4 (2.1%) |
| 18 to 34 Years | 0 (0.0%) | 0 (0.0%) |
| 35 to 64 Years | 22 (7.2%) | 185 (32.7%) |
| 65 to 74 Years | 0 (0.0%) | 0 (0.0%) |
| 75 Years and over | 0 (0.0%) | 19 (20.9%) |
Disability Class: Ambulatory Difficulty
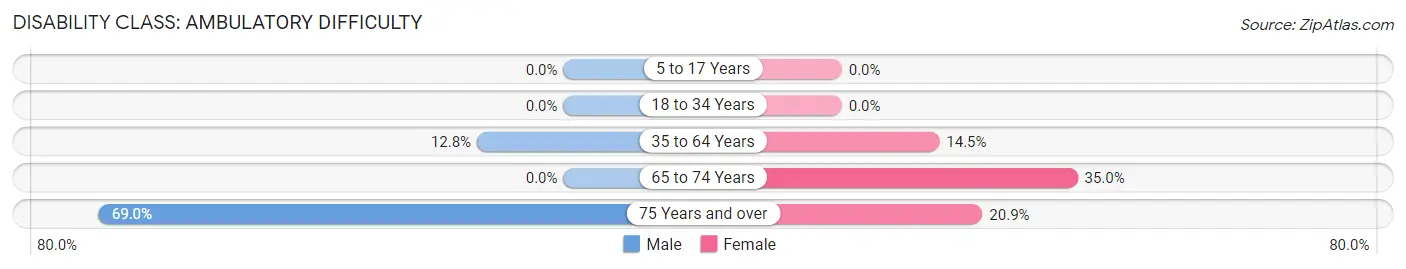
| Age Bracket | Male | Female |
| 5 to 17 Years | 0 (0.0%) | 0 (0.0%) |
| 18 to 34 Years | 0 (0.0%) | 0 (0.0%) |
| 35 to 64 Years | 39 (12.8%) | 82 (14.5%) |
| 65 to 74 Years | 0 (0.0%) | 28 (35.0%) |
| 75 Years and over | 40 (69.0%) | 19 (20.9%) |
Disability Class: Self-Care Difficulty
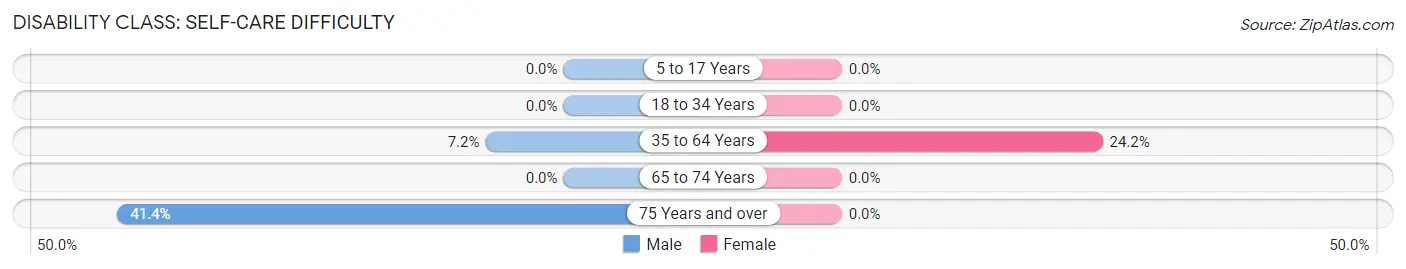
| Age Bracket | Male | Female |
| 5 to 17 Years | 0 (0.0%) | 0 (0.0%) |
| 18 to 34 Years | 0 (0.0%) | 0 (0.0%) |
| 35 to 64 Years | 22 (7.2%) | 137 (24.2%) |
| 65 to 74 Years | 0 (0.0%) | 0 (0.0%) |
| 75 Years and over | 24 (41.4%) | 0 (0.0%) |
Technology Access in Greenock
Computing Device Access in Greenock
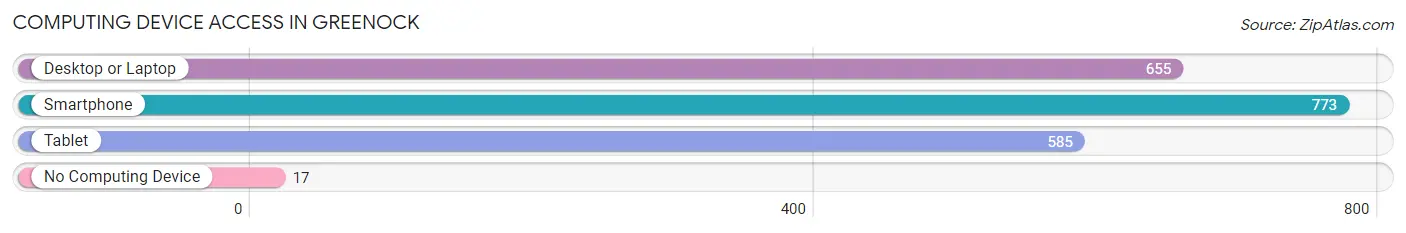
| Device Type | # Households | % Households |
| Desktop or Laptop | 655 | 78.3% |
| Smartphone | 773 | 92.3% |
| Tablet | 585 | 69.9% |
| No Computing Device | 17 | 2.0% |
| Total | 837 | 100.0% |
Internet Access in Greenock
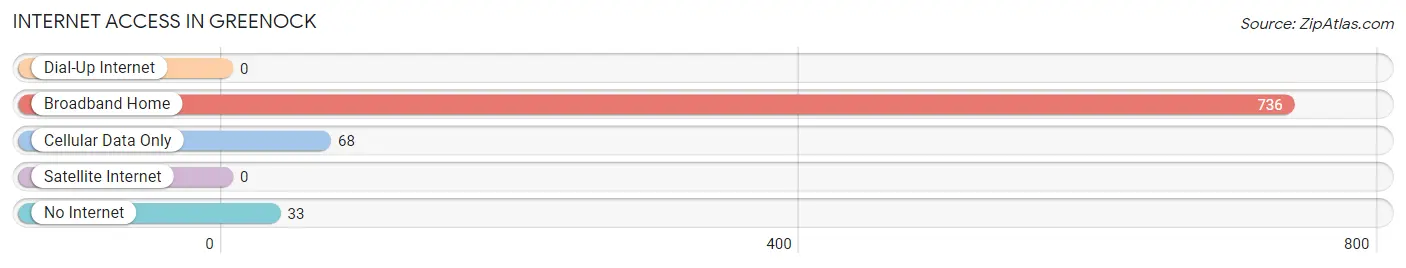
| Internet Type | # Households | % Households |
| Dial-Up Internet | 0 | 0.0% |
| Broadband Home | 736 | 87.9% |
| Cellular Data Only | 68 | 8.1% |
| Satellite Internet | 0 | 0.0% |
| No Internet | 33 | 3.9% |
| Total | 837 | 100.0% |
Greenock Summary
Greenock is a small borough located in western Pennsylvania, in the United States. It is situated in the Allegheny Valley, about 25 miles northeast of Pittsburgh. The borough was founded in 1832 and is named after the town of Greenock, Scotland. As of the 2010 census, the population of Greenock was 1,845.
Geography
Greenock is located at 40°33'N 79°51'W (40.55, -79.85). It is situated in the Allegheny Valley, about 25 miles northeast of Pittsburgh. The borough is bordered by the townships of North Versailles, East McKeesport, and Wilkins. The borough is located on the banks of the Youghiogheny River, which flows through the borough.
The total area of Greenock is 0.7 square miles, all of which is land. The borough is mostly flat, with some rolling hills. The elevation of Greenock is 890 feet above sea level.
History
Greenock was founded in 1832 by John and William Greenock, two brothers from Scotland. The brothers purchased a tract of land along the Youghiogheny River and named the area after their hometown of Greenock, Scotland. The borough was incorporated in 1867.
Greenock was a small farming community for much of its history. In the late 19th century, the borough began to grow as a result of the coal mining industry. The coal mines provided employment for many of the residents of Greenock.
Economy
Greenock’s economy is largely based on the coal mining industry. The borough is home to several coal mines, which provide employment for many of the residents. In addition to coal mining, Greenock is also home to several small businesses, including restaurants, retail stores, and service providers.
Demographics
As of the 2010 census, the population of Greenock was 1,845. The racial makeup of the borough was 97.2% White, 0.9% African American, 0.2% Native American, 0.2% Asian, 0.2% from other races, and 1.3% from two or more races. Hispanic or Latino of any race were 0.7% of the population.
The median household income in Greenock was $37,917, and the median family income was $45,000. The per capita income for the borough was $18,945. About 11.2% of families and 13.2% of the population were below the poverty line, including 17.2% of those under age 18 and 8.2% of those age 65 or over.
Conclusion
Greenock is a small borough located in western Pennsylvania. It was founded in 1832 and is named after the town of Greenock, Scotland. The borough is situated in the Allegheny Valley, about 25 miles northeast of Pittsburgh. The economy of Greenock is largely based on the coal mining industry. As of the 2010 census, the population of Greenock was 1,845. The median household income in Greenock was $37,917, and the median family income was $45,000.
Common Questions
What is the Total Population of Greenock?
Total Population of Greenock is 1,895.
What is the Total Male Population of Greenock?
Total Male Population of Greenock is 649.
What is the Total Female Population of Greenock?
Total Female Population of Greenock is 1,246.
What is the Ratio of Males per 100 Females in Greenock?
There are 52.09 Males per 100 Females in Greenock.
What is the Ratio of Females per 100 Males in Greenock?
There are 191.99 Females per 100 Males in Greenock.
What is the Median Population Age in Greenock?
Median Population Age in Greenock is 47.0 Years.
What is the Average Family Size in Greenock
Average Family Size in Greenock is 2.9 People.
What is the Average Household Size in Greenock
Average Household Size in Greenock is 2.3 People.
What is Per Capita Income in Greenock?
Per Capita income in Greenock is $40,690.
What is the Median Family Income in Greenock?
Median Family Income in Greenock is $68,036.
What is the Median Household income in Greenock?
Median Household Income in Greenock is $50,074.
What is Income or Wage Gap in Greenock?
Income or Wage Gap in Greenock is 36.6%.
Women in Greenock earn 63.4 cents for every dollar earned by a man.
What is Inequality or Gini Index in Greenock?
Inequality or Gini Index in Greenock is 0.48.
How Large is the Labor Force in Greenock?
There are 1,146 People in the Labor Forcein in Greenock.
What is the Percentage of People in the Labor Force in Greenock?
67.2% of People are in the Labor Force in Greenock.