Greenfields, PA
Greenfields Map
Greenfields Overview
957
TOTAL POPULATION
435
MALE POPULATION
522
FEMALE POPULATION
83.33
MALES / 100 FEMALES
120.00
FEMALES / 100 MALES
61.9
MEDIAN AGE
2.5
AVG FAMILY SIZE
2.0
AVG HOUSEHOLD SIZE
$36,079
PER CAPITA INCOME
$74,620
AVG FAMILY INCOME
$60,563
AVG HOUSEHOLD INCOME
56.1%
WAGE / INCOME GAP [ % ]
43.9¢/ $1
WAGE / INCOME GAP [ $ ]
0.35
INEQUALITY / GINI INDEX
385
LABOR FORCE [ PEOPLE ]
44.2%
PERCENT IN LABOR FORCE
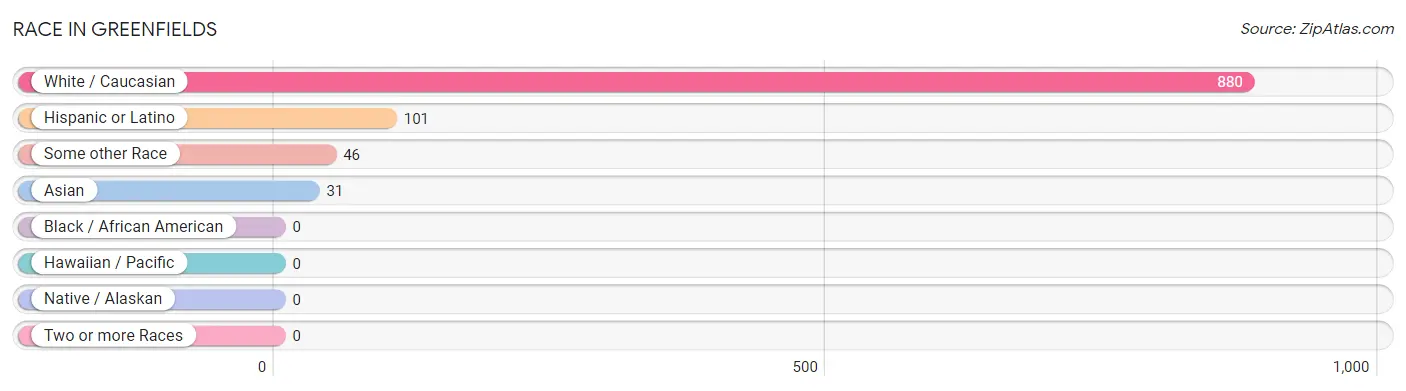
Race in Greenfields
The most populous races in Greenfields are White / Caucasian (880 | 91.9%), Hispanic or Latino (101 | 10.5%), and Some other Race (46 | 4.8%).
| Race | # Population | % Population |
| Asian | 31 | 3.2% |
| Black / African American | 0 | 0.0% |
| Hawaiian / Pacific | 0 | 0.0% |
| Hispanic or Latino | 101 | 10.5% |
| Native / Alaskan | 0 | 0.0% |
| White / Caucasian | 880 | 91.9% |
| Two or more Races | 0 | 0.0% |
| Some other Race | 46 | 4.8% |
| Total | 957 | 100.0% |
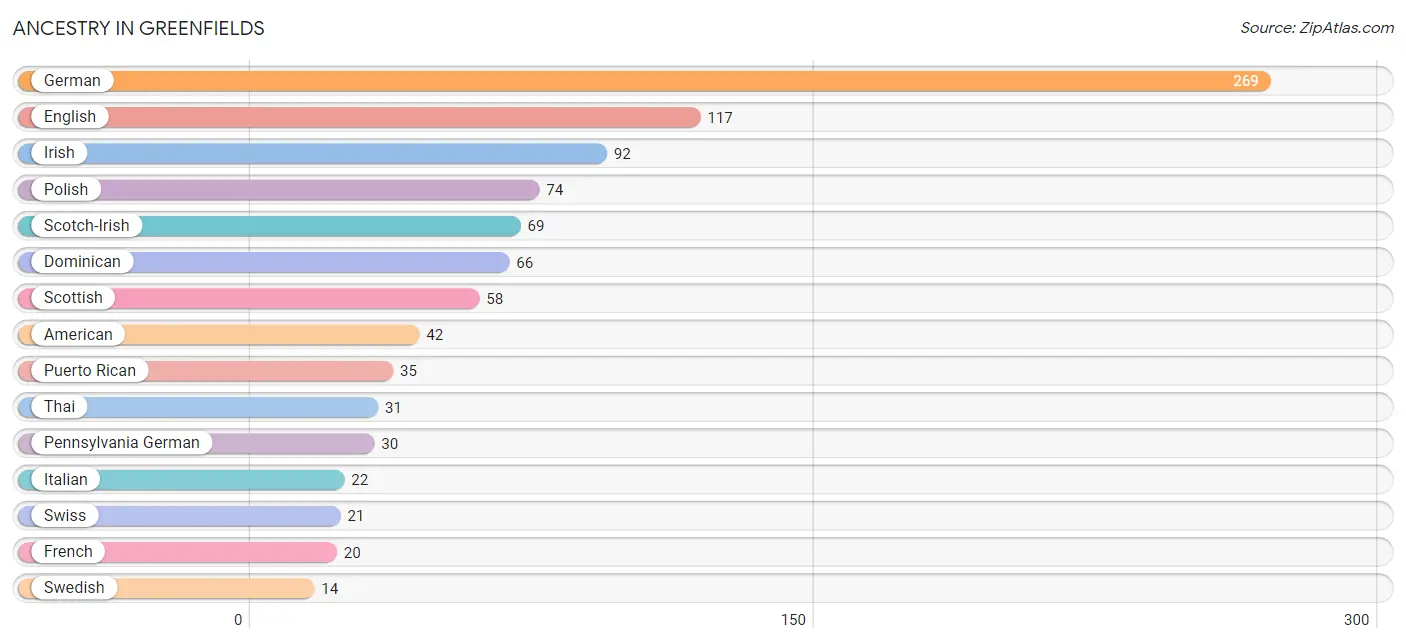
Ancestry in Greenfields
The most populous ancestries reported in Greenfields are German (269 | 28.1%), English (117 | 12.2%), Irish (92 | 9.6%), Polish (74 | 7.7%), and Scotch-Irish (69 | 7.2%), together accounting for 64.9% of all Greenfields residents.
| Ancestry | # Population | % Population |
| American | 42 | 4.4% |
| Dominican | 66 | 6.9% |
| Dutch | 11 | 1.1% |
| Eastern European | 10 | 1.0% |
| English | 117 | 12.2% |
| French | 20 | 2.1% |
| German | 269 | 28.1% |
| Irish | 92 | 9.6% |
| Italian | 22 | 2.3% |
| Pennsylvania German | 30 | 3.1% |
| Polish | 74 | 7.7% |
| Puerto Rican | 35 | 3.7% |
| Scotch-Irish | 69 | 7.2% |
| Scottish | 58 | 6.1% |
| Swedish | 14 | 1.5% |
| Swiss | 21 | 2.2% |
| Thai | 31 | 3.2% |
| Welsh | 13 | 1.4% | View All 18 Rows |
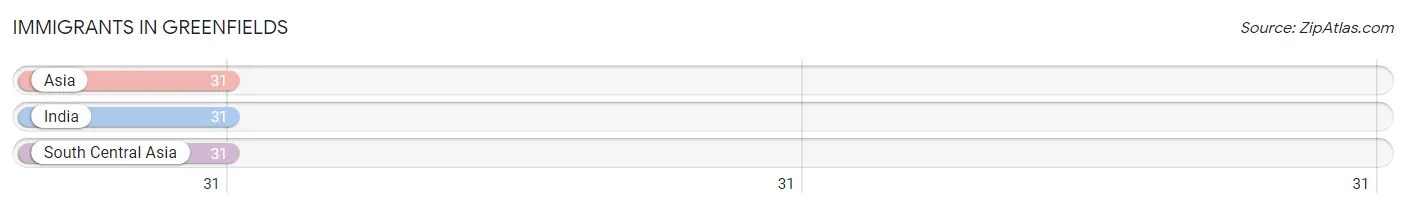
Immigrants in Greenfields
The most numerous immigrant groups reported in Greenfields came from Asia (31 | 3.2%), India (31 | 3.2%), and South Central Asia (31 | 3.2%), together accounting for 9.7% of all Greenfields residents.
| Immigration Origin | # Population | % Population |
| Asia | 31 | 3.2% |
| India | 31 | 3.2% |
| South Central Asia | 31 | 3.2% | View All 3 Rows |
Sex and Age in Greenfields
Sex and Age in Greenfields
The most populous age groups in Greenfields are 65 to 69 Years (77 | 17.7%) for men and 70 to 74 Years (106 | 20.3%) for women.
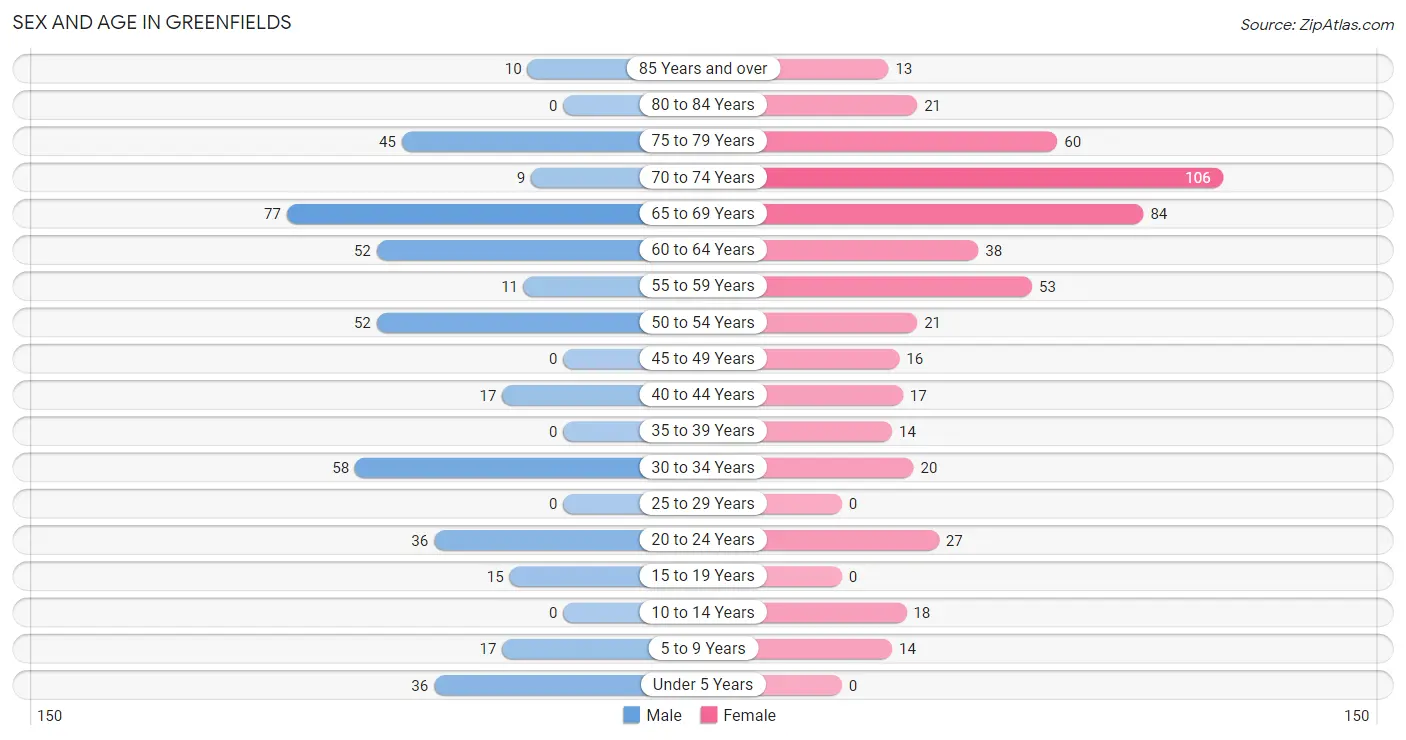
| Age Bracket | Male | Female |
| Under 5 Years | 36 (8.3%) | 0 (0.0%) |
| 5 to 9 Years | 17 (3.9%) | 14 (2.7%) |
| 10 to 14 Years | 0 (0.0%) | 18 (3.5%) |
| 15 to 19 Years | 15 (3.5%) | 0 (0.0%) |
| 20 to 24 Years | 36 (8.3%) | 27 (5.2%) |
| 25 to 29 Years | 0 (0.0%) | 0 (0.0%) |
| 30 to 34 Years | 58 (13.3%) | 20 (3.8%) |
| 35 to 39 Years | 0 (0.0%) | 14 (2.7%) |
| 40 to 44 Years | 17 (3.9%) | 17 (3.3%) |
| 45 to 49 Years | 0 (0.0%) | 16 (3.1%) |
| 50 to 54 Years | 52 (11.9%) | 21 (4.0%) |
| 55 to 59 Years | 11 (2.5%) | 53 (10.2%) |
| 60 to 64 Years | 52 (11.9%) | 38 (7.3%) |
| 65 to 69 Years | 77 (17.7%) | 84 (16.1%) |
| 70 to 74 Years | 9 (2.1%) | 106 (20.3%) |
| 75 to 79 Years | 45 (10.3%) | 60 (11.5%) |
| 80 to 84 Years | 0 (0.0%) | 21 (4.0%) |
| 85 Years and over | 10 (2.3%) | 13 (2.5%) |
| Total | 435 (100.0%) | 522 (100.0%) |
Families and Households in Greenfields
Median Family Size in Greenfields
The median family size in Greenfields is 2.48 persons per family, with single male/father families (16 | 5.2%) accounting for the largest median family size of 2.88 persons per family. On the other hand, single female/mother families (37 | 12.0%) represent the smallest median family size with 2.30 persons per family.
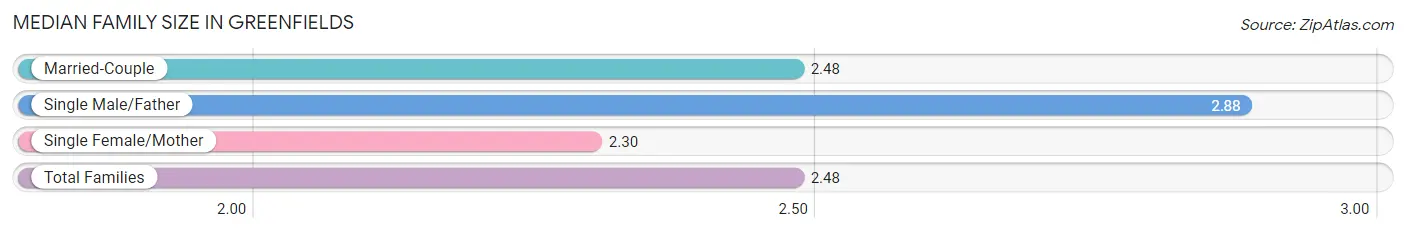
| Family Type | # Families | Family Size |
| Married-Couple | 255 (82.8%) | 2.48 |
| Single Male/Father | 16 (5.2%) | 2.88 |
| Single Female/Mother | 37 (12.0%) | 2.30 |
| Total Families | 308 (100.0%) | 2.48 |
Median Household Size in Greenfields
The median household size in Greenfields is 2.01 persons per household, with single male/father households (16 | 3.4%) accounting for the largest median household size of 2.88 persons per household. non-family households (167 | 35.2%) represent the smallest median household size with 1.09 persons per household.
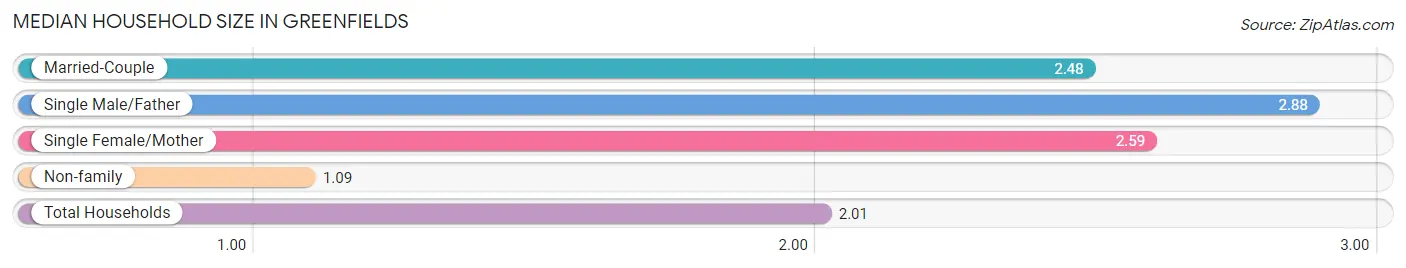
| Household Type | # Households | Household Size |
| Married-Couple | 255 (53.7%) | 2.48 |
| Single Male/Father | 16 (3.4%) | 2.88 |
| Single Female/Mother | 37 (7.8%) | 2.59 |
| Non-family | 167 (35.2%) | 1.09 |
| Total Households | 475 (100.0%) | 2.01 |
Household Size by Marriage Status in Greenfields
Out of a total of 475 households in Greenfields, 308 (64.8%) are family households, while 167 (35.2%) are nonfamily households. The most numerous type of family households are 2-person households, comprising 185, and the most common type of nonfamily households are 1-person households, comprising 154.
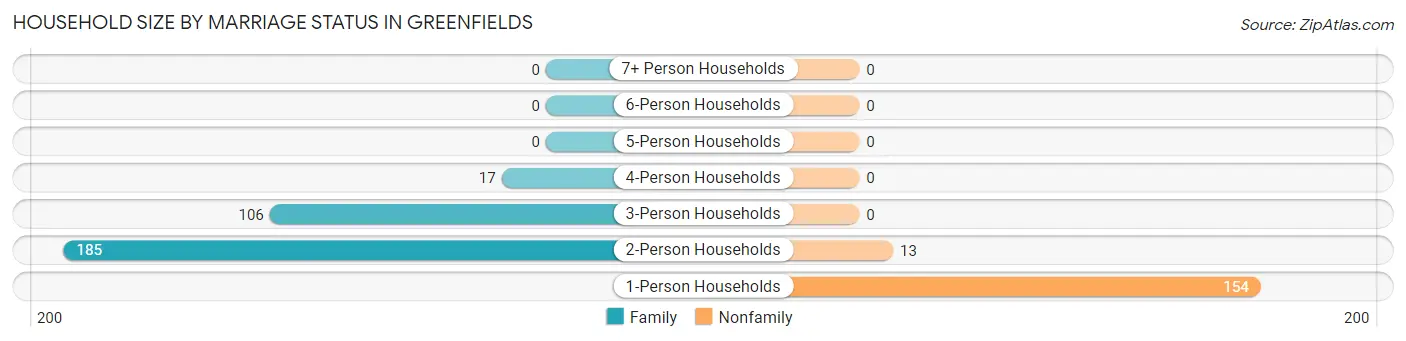
| Household Size | Family Households | Nonfamily Households |
| 1-Person Households | - | 154 (32.4%) |
| 2-Person Households | 185 (39.0%) | 13 (2.7%) |
| 3-Person Households | 106 (22.3%) | 0 (0.0%) |
| 4-Person Households | 17 (3.6%) | 0 (0.0%) |
| 5-Person Households | 0 (0.0%) | 0 (0.0%) |
| 6-Person Households | 0 (0.0%) | 0 (0.0%) |
| 7+ Person Households | 0 (0.0%) | 0 (0.0%) |
| Total | 308 (64.8%) | 167 (35.2%) |
Female Fertility in Greenfields
Fertility by Age in Greenfields
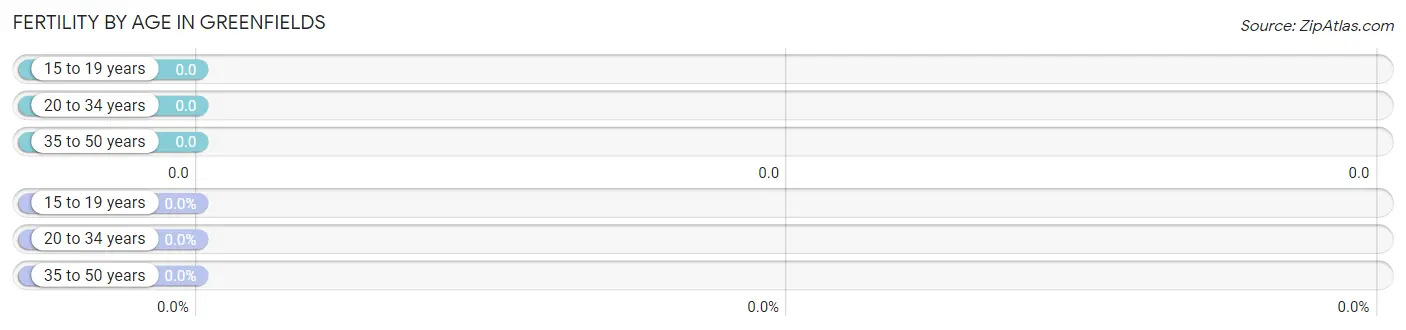
| Age Bracket | Women with Births | Births / 1,000 Women |
| 15 to 19 years | 0 (0.0%) | 0.0 |
| 20 to 34 years | 0 (0.0%) | 0.0 |
| 35 to 50 years | 0 (0.0%) | 0.0 |
| Total | 0 (0.0%) | 0.0 |
Fertility by Age by Marriage Status in Greenfields
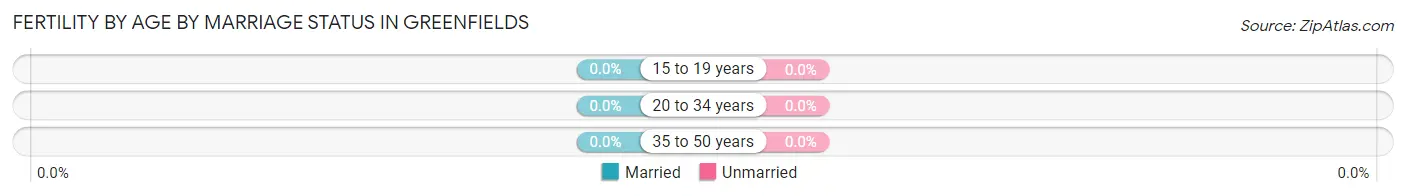
| Age Bracket | Married | Unmarried |
| 15 to 19 years | 0 (0.0%) | 0 (0.0%) |
| 20 to 34 years | 0 (0.0%) | 0 (0.0%) |
| 35 to 50 years | 0 (0.0%) | 0 (0.0%) |
| Total | 0 (0.0%) | 0 (0.0%) |
Fertility by Education in Greenfields
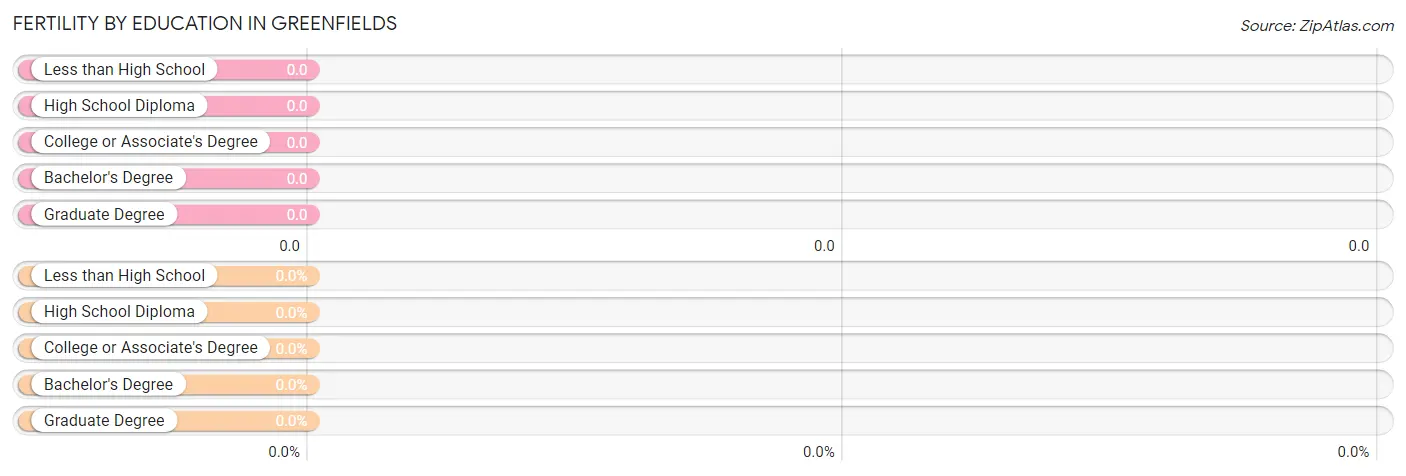
| Educational Attainment | Women with Births | Births / 1,000 Women |
| Less than High School | 0 (0.0%) | 0.0 |
| High School Diploma | 0 (0.0%) | 0.0 |
| College or Associate's Degree | 0 (0.0%) | 0.0 |
| Bachelor's Degree | 0 (0.0%) | 0.0 |
| Graduate Degree | 0 (0.0%) | 0.0 |
| Total | 0 (0.0%) | 0.0 |
Fertility by Education by Marriage Status in Greenfields
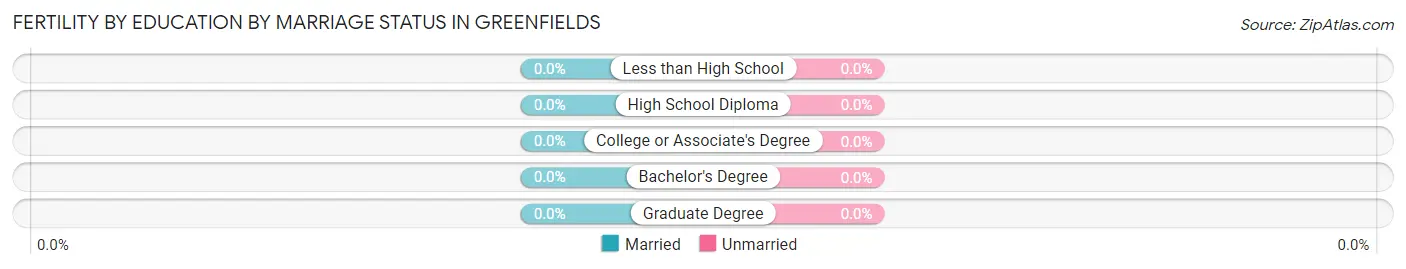
| Educational Attainment | Married | Unmarried |
| Less than High School | 0 (0.0%) | 0 (0.0%) |
| High School Diploma | 0 (0.0%) | 0 (0.0%) |
| College or Associate's Degree | 0 (0.0%) | 0 (0.0%) |
| Bachelor's Degree | 0 (0.0%) | 0 (0.0%) |
| Graduate Degree | 0 (0.0%) | 0 (0.0%) |
| Total | 0 (0.0%) | 0 (0.0%) |
Income in Greenfields
Income Overview in Greenfields
Per Capita Income in Greenfields is $36,079, while median incomes of families and households are $74,620 and $60,563 respectively.
| Characteristic | Number | Measure |
| Per Capita Income | 957 | $36,079 |
| Median Family Income | 308 | $74,620 |
| Mean Family Income | 308 | $91,645 |
| Median Household Income | 475 | $60,563 |
| Mean Household Income | 475 | $72,313 |
| Income Deficit | 308 | $0 |
| Wage / Income Gap (%) | 957 | 56.10% |
| Wage / Income Gap ($) | 957 | 43.90¢ per $1 |
| Gini / Inequality Index | 957 | 0.35 |
Earnings by Sex in Greenfields
Average Earnings in Greenfields are $27,117, $25,510 for men and $58,105 for women, a difference of 56.1%.
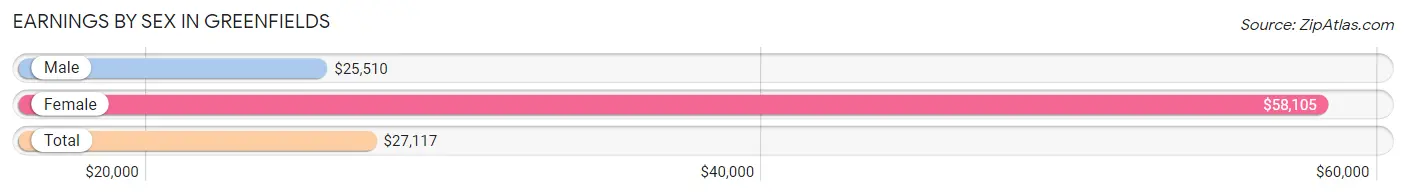
| Sex | Number | Average Earnings |
| Male | 276 (63.2%) | $25,510 |
| Female | 161 (36.8%) | $58,105 |
| Total | 437 (100.0%) | $27,117 |
Earnings by Sex by Income Bracket in Greenfields
The most common earnings brackets in Greenfields are $20,000 to $22,499 for men (58 | 21.0%) and $55,000 to $64,999 for women (31 | 19.3%).
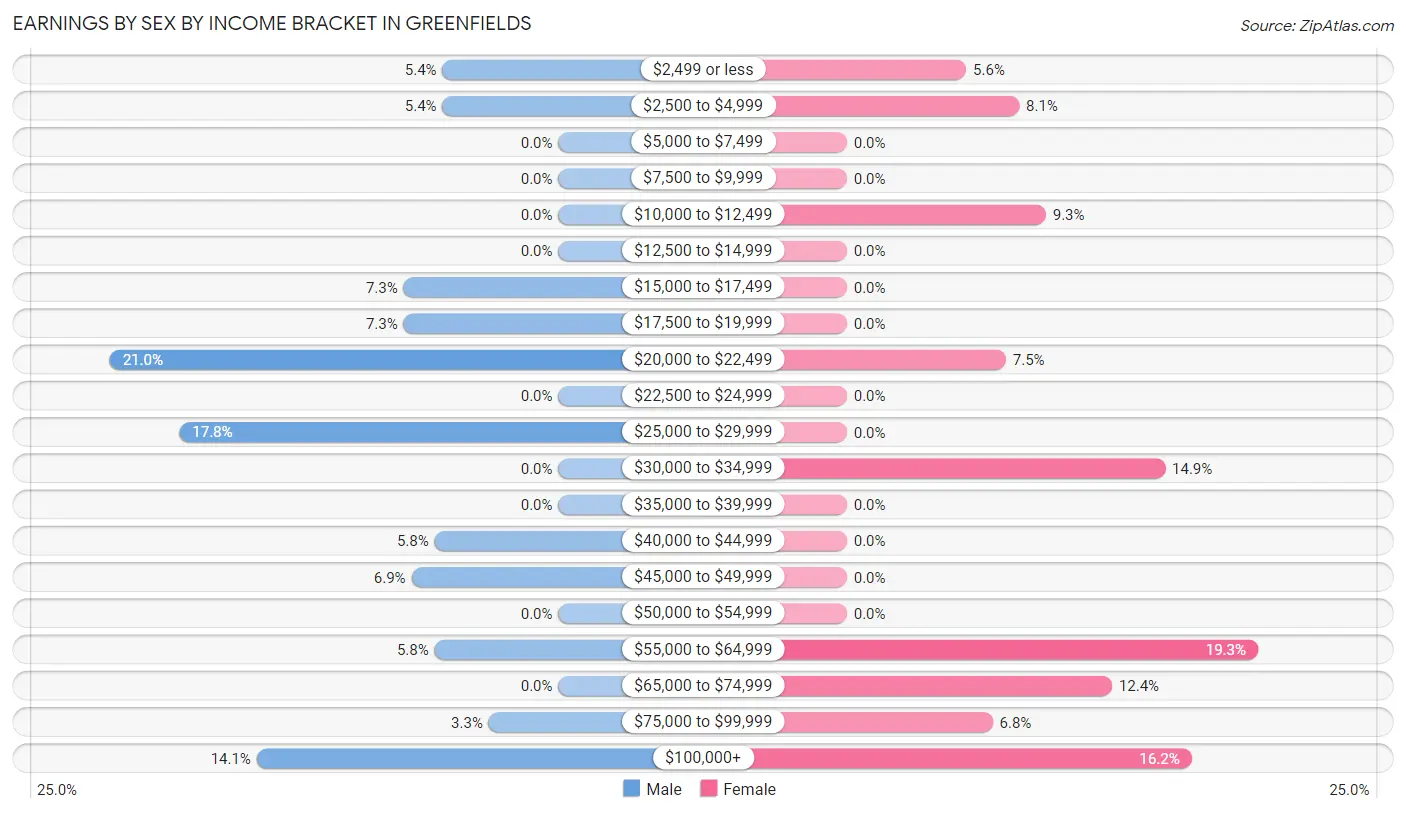
| Income | Male | Female |
| $2,499 or less | 15 (5.4%) | 9 (5.6%) |
| $2,500 to $4,999 | 15 (5.4%) | 13 (8.1%) |
| $5,000 to $7,499 | 0 (0.0%) | 0 (0.0%) |
| $7,500 to $9,999 | 0 (0.0%) | 0 (0.0%) |
| $10,000 to $12,499 | 0 (0.0%) | 15 (9.3%) |
| $12,500 to $14,999 | 0 (0.0%) | 0 (0.0%) |
| $15,000 to $17,499 | 20 (7.2%) | 0 (0.0%) |
| $17,500 to $19,999 | 20 (7.2%) | 0 (0.0%) |
| $20,000 to $22,499 | 58 (21.0%) | 12 (7.4%) |
| $22,500 to $24,999 | 0 (0.0%) | 0 (0.0%) |
| $25,000 to $29,999 | 49 (17.7%) | 0 (0.0%) |
| $30,000 to $34,999 | 0 (0.0%) | 24 (14.9%) |
| $35,000 to $39,999 | 0 (0.0%) | 0 (0.0%) |
| $40,000 to $44,999 | 16 (5.8%) | 0 (0.0%) |
| $45,000 to $49,999 | 19 (6.9%) | 0 (0.0%) |
| $50,000 to $54,999 | 0 (0.0%) | 0 (0.0%) |
| $55,000 to $64,999 | 16 (5.8%) | 31 (19.3%) |
| $65,000 to $74,999 | 0 (0.0%) | 20 (12.4%) |
| $75,000 to $99,999 | 9 (3.3%) | 11 (6.8%) |
| $100,000+ | 39 (14.1%) | 26 (16.2%) |
| Total | 276 (100.0%) | 161 (100.0%) |
Earnings by Sex by Educational Attainment in Greenfields
Average earnings in Greenfields are $25,995 for men and $59,194 for women, a difference of 56.1%. Men with an educational attainment of college or associate's degree enjoy the highest average annual earnings of $21,875, while those with college or associate's degree education earn the least with $21,875. Women with an educational attainment of high school diploma earn the most with the average annual earnings of $31,823, while those with high school diploma education have the smallest earnings of $31,823.
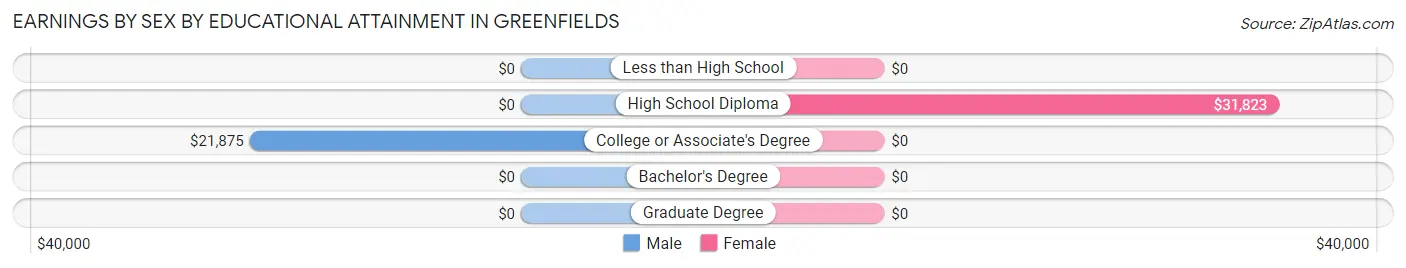
| Educational Attainment | Male Income | Female Income |
| Less than High School | - | - |
| High School Diploma | - | - |
| College or Associate's Degree | $21,875 | $0 |
| Bachelor's Degree | - | - |
| Graduate Degree | - | - |
| Total | $25,995 | $59,194 |
Family Income in Greenfields
Family Income Brackets in Greenfields
According to the Greenfields family income data, there are 99 families falling into the $50,000 to $74,999 income range, which is the most common income bracket and makes up 32.1% of all families.
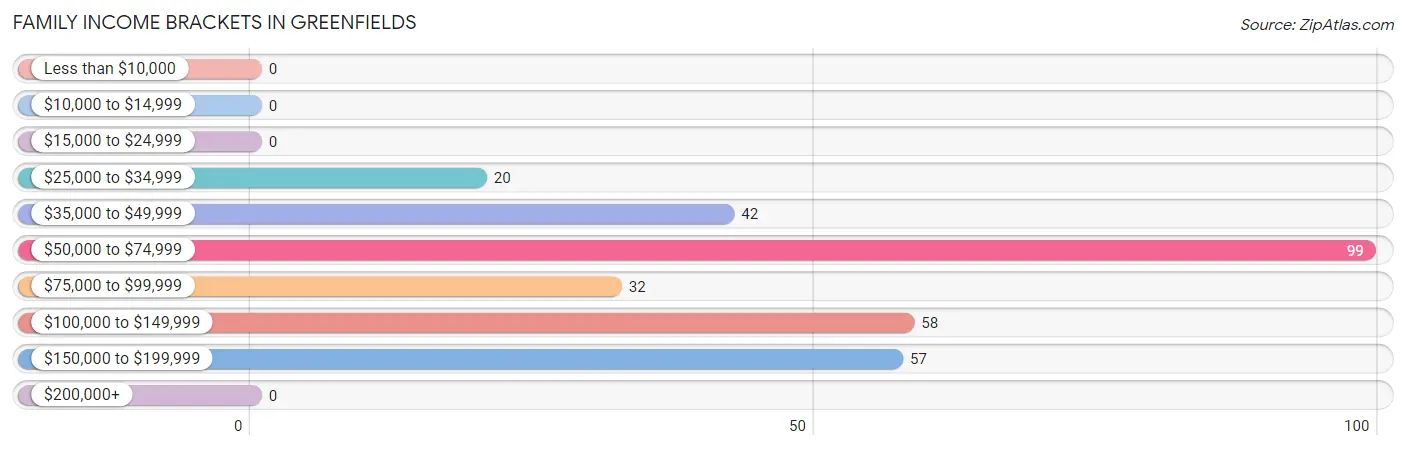
| Income Bracket | # Families | % Families |
| Less than $10,000 | 0 | 0.0% |
| $10,000 to $14,999 | 0 | 0.0% |
| $15,000 to $24,999 | 0 | 0.0% |
| $25,000 to $34,999 | 20 | 6.5% |
| $35,000 to $49,999 | 42 | 13.6% |
| $50,000 to $74,999 | 99 | 32.1% |
| $75,000 to $99,999 | 32 | 10.4% |
| $100,000 to $149,999 | 58 | 18.8% |
| $150,000 to $199,999 | 57 | 18.5% |
| $200,000+ | 0 | 0.0% |
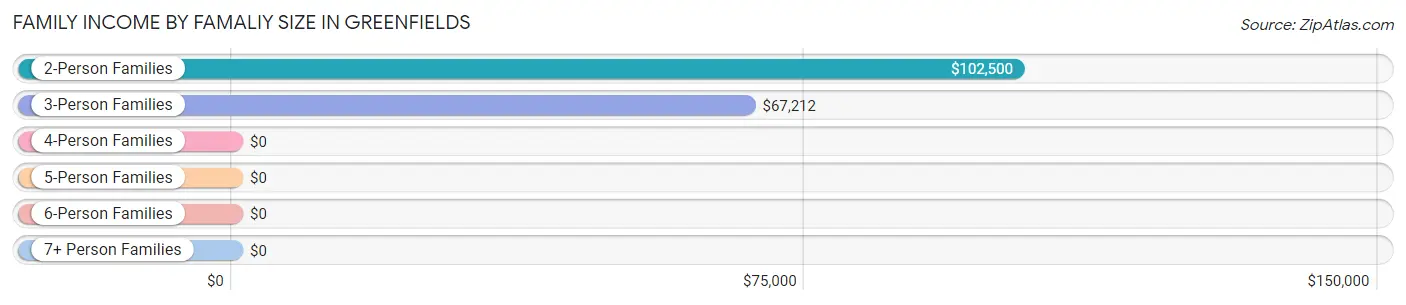
Family Income by Famaliy Size in Greenfields
2-person families (196 | 63.6%) account for the highest median family income in Greenfields with $102,500 per family, while 2-person families (196 | 63.6%) have the highest median income of $51,250 per family member.
| Income Bracket | # Families | Median Income |
| 2-Person Families | 196 (63.6%) | $102,500 |
| 3-Person Families | 95 (30.8%) | $67,212 |
| 4-Person Families | 17 (5.5%) | $0 |
| 5-Person Families | 0 (0.0%) | $0 |
| 6-Person Families | 0 (0.0%) | $0 |
| 7+ Person Families | 0 (0.0%) | $0 |
| Total | 308 (100.0%) | $74,620 |
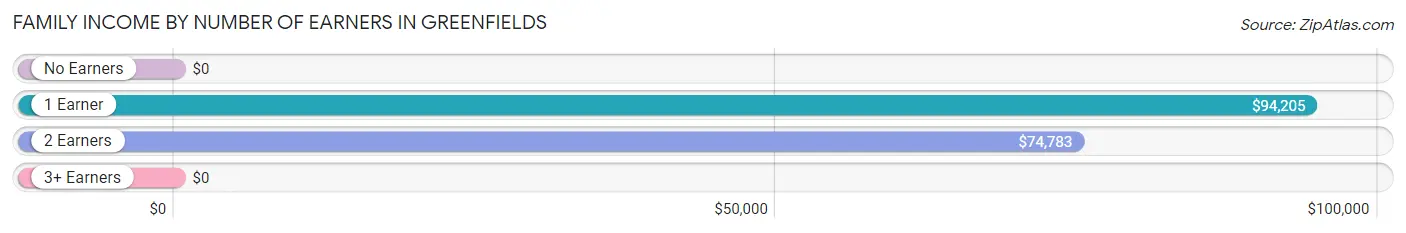
Family Income by Number of Earners in Greenfields
| Number of Earners | # Families | Median Income |
| No Earners | 63 (20.4%) | $0 |
| 1 Earner | 121 (39.3%) | $94,205 |
| 2 Earners | 124 (40.3%) | $74,783 |
| 3+ Earners | 0 (0.0%) | $0 |
| Total | 308 (100.0%) | $74,620 |
Household Income in Greenfields
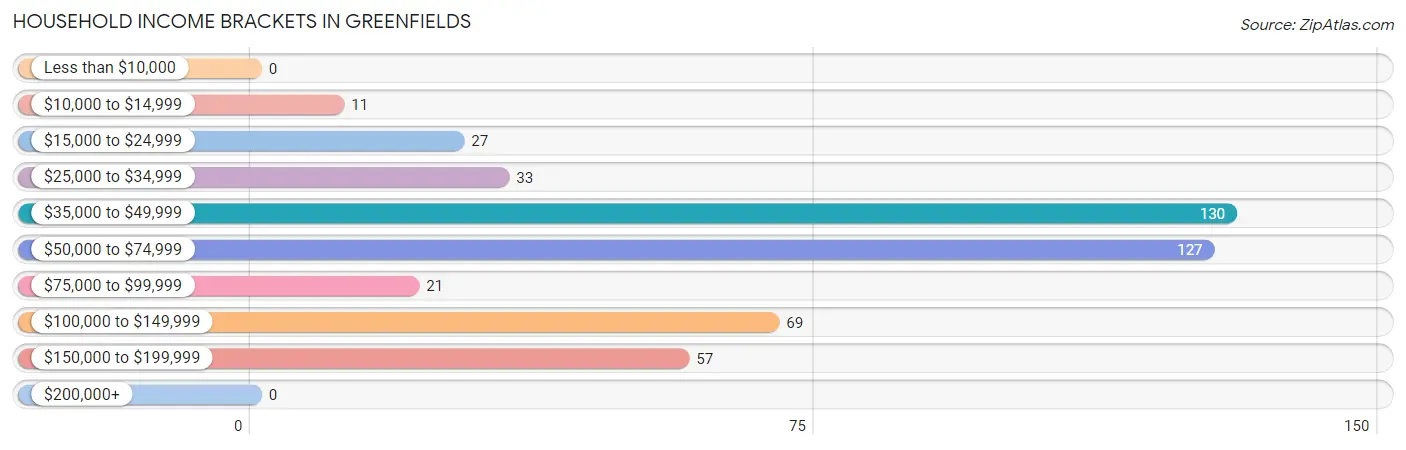
Household Income Brackets in Greenfields
With 130 households falling in the category, the $35,000 to $49,999 income range is the most frequent in Greenfields, accounting for 27.4% of all households.
| Income Bracket | # Households | % Households |
| Less than $10,000 | 0 | 0.0% |
| $10,000 to $14,999 | 11 | 2.3% |
| $15,000 to $24,999 | 27 | 5.7% |
| $25,000 to $34,999 | 33 | 6.9% |
| $35,000 to $49,999 | 130 | 27.4% |
| $50,000 to $74,999 | 127 | 26.7% |
| $75,000 to $99,999 | 21 | 4.4% |
| $100,000 to $149,999 | 69 | 14.5% |
| $150,000 to $199,999 | 57 | 12.0% |
| $200,000+ | 0 | 0.0% |
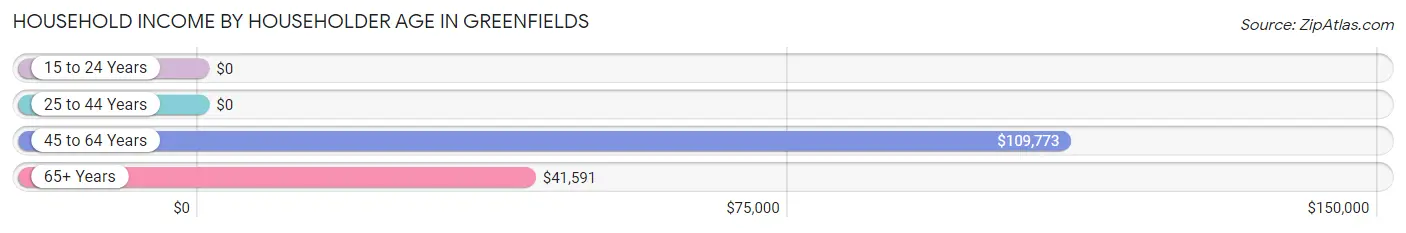
Household Income by Householder Age in Greenfields
The median household income in Greenfields is $60,563, with the highest median household income of $109,773 found in the 45 to 64 years age bracket for the primary householder. A total of 128 households (27.0%) fall into this category. Meanwhile, the 15 to 24 years age bracket for the primary householder has the lowest median household income of $0, with 36 households (7.6%) in this group.
| Income Bracket | # Households | Median Income |
| 15 to 24 Years | 36 (7.6%) | $0 |
| 25 to 44 Years | 37 (7.8%) | $0 |
| 45 to 64 Years | 128 (27.0%) | $109,773 |
| 65+ Years | 274 (57.7%) | $41,591 |
| Total | 475 (100.0%) | $60,563 |
Poverty in Greenfields
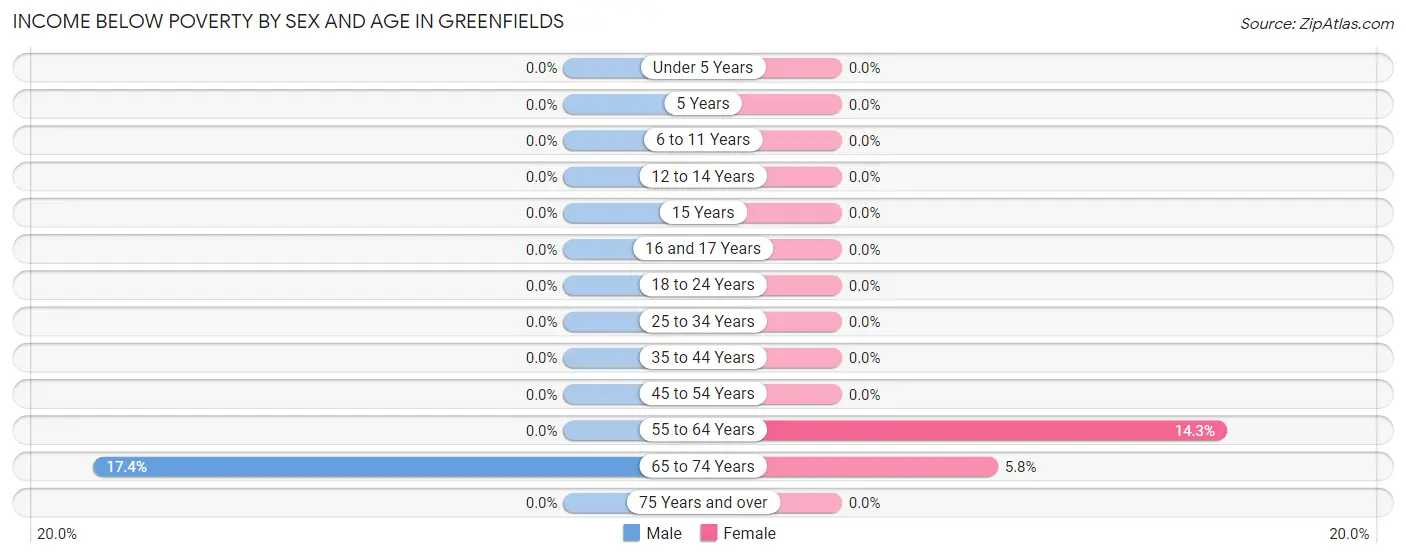
Income Below Poverty by Sex and Age in Greenfields
With 3.5% poverty level for males and 4.6% for females among the residents of Greenfields, 65 to 74 year old males and 55 to 64 year old females are the most vulnerable to poverty, with 15 males (17.4%) and 13 females (14.3%) in their respective age groups living below the poverty level.
| Age Bracket | Male | Female |
| Under 5 Years | 0 (0.0%) | 0 (0.0%) |
| 5 Years | 0 (0.0%) | 0 (0.0%) |
| 6 to 11 Years | 0 (0.0%) | 0 (0.0%) |
| 12 to 14 Years | 0 (0.0%) | 0 (0.0%) |
| 15 Years | 0 (0.0%) | 0 (0.0%) |
| 16 and 17 Years | 0 (0.0%) | 0 (0.0%) |
| 18 to 24 Years | 0 (0.0%) | 0 (0.0%) |
| 25 to 34 Years | 0 (0.0%) | 0 (0.0%) |
| 35 to 44 Years | 0 (0.0%) | 0 (0.0%) |
| 45 to 54 Years | 0 (0.0%) | 0 (0.0%) |
| 55 to 64 Years | 0 (0.0%) | 13 (14.3%) |
| 65 to 74 Years | 15 (17.4%) | 11 (5.8%) |
| 75 Years and over | 0 (0.0%) | 0 (0.0%) |
| Total | 15 (3.5%) | 24 (4.6%) |
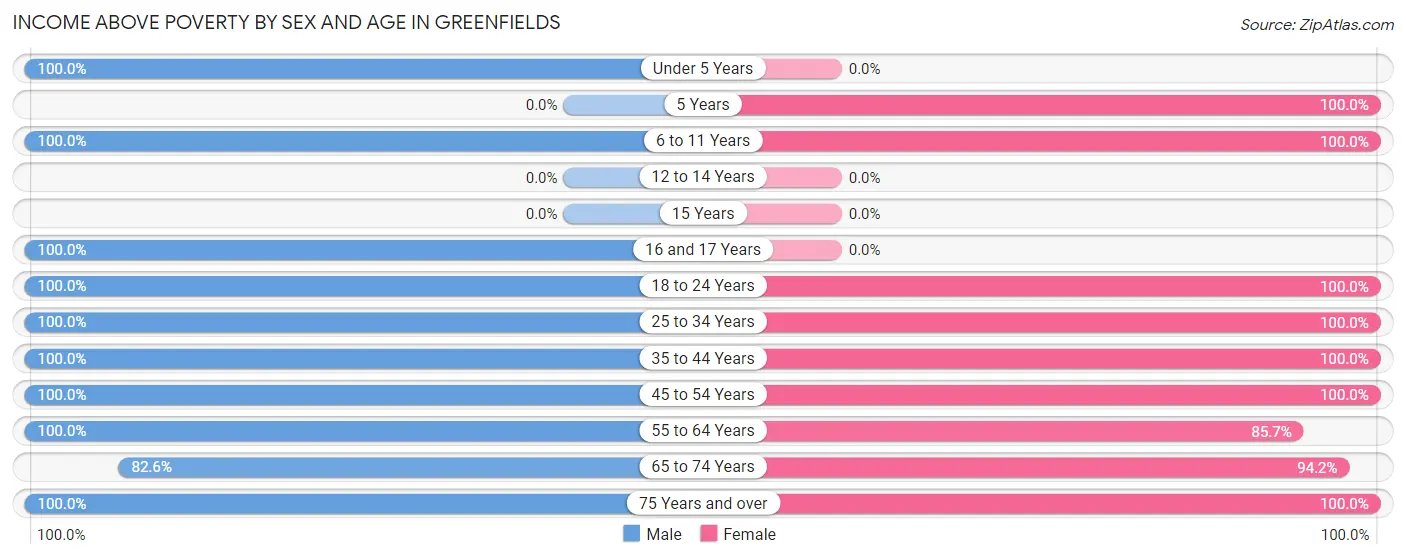
Income Above Poverty by Sex and Age in Greenfields
According to the poverty statistics in Greenfields, males aged under 5 years and females aged 5 years are the age groups that are most secure financially, with 100.0% of males and 100.0% of females in these age groups living above the poverty line.
| Age Bracket | Male | Female |
| Under 5 Years | 36 (100.0%) | 0 (0.0%) |
| 5 Years | 0 (0.0%) | 14 (100.0%) |
| 6 to 11 Years | 17 (100.0%) | 18 (100.0%) |
| 12 to 14 Years | 0 (0.0%) | 0 (0.0%) |
| 15 Years | 0 (0.0%) | 0 (0.0%) |
| 16 and 17 Years | 15 (100.0%) | 0 (0.0%) |
| 18 to 24 Years | 36 (100.0%) | 27 (100.0%) |
| 25 to 34 Years | 58 (100.0%) | 20 (100.0%) |
| 35 to 44 Years | 17 (100.0%) | 31 (100.0%) |
| 45 to 54 Years | 52 (100.0%) | 37 (100.0%) |
| 55 to 64 Years | 63 (100.0%) | 78 (85.7%) |
| 65 to 74 Years | 71 (82.6%) | 179 (94.2%) |
| 75 Years and over | 55 (100.0%) | 94 (100.0%) |
| Total | 420 (96.6%) | 498 (95.4%) |
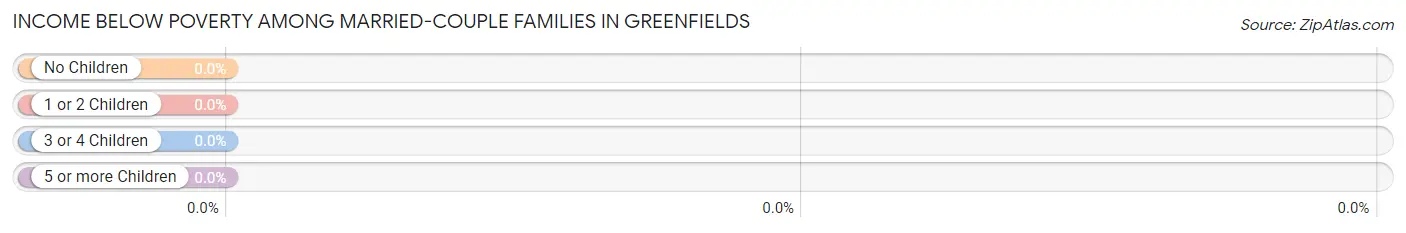
Income Below Poverty Among Married-Couple Families in Greenfields
| Children | Above Poverty | Below Poverty |
| No Children | 218 (100.0%) | 0 (0.0%) |
| 1 or 2 Children | 37 (100.0%) | 0 (0.0%) |
| 3 or 4 Children | 0 (0.0%) | 0 (0.0%) |
| 5 or more Children | 0 (0.0%) | 0 (0.0%) |
| Total | 255 (100.0%) | 0 (0.0%) |
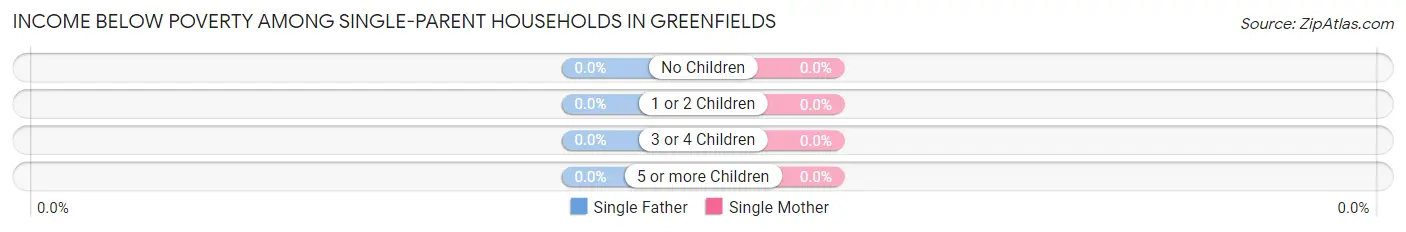
Income Below Poverty Among Single-Parent Households in Greenfields
| Children | Single Father | Single Mother |
| No Children | 0 (0.0%) | 0 (0.0%) |
| 1 or 2 Children | 0 (0.0%) | 0 (0.0%) |
| 3 or 4 Children | 0 (0.0%) | 0 (0.0%) |
| 5 or more Children | 0 (0.0%) | 0 (0.0%) |
| Total | 0 (0.0%) | 0 (0.0%) |
Income Below Poverty Among Married-Couple vs Single-Parent Households in Greenfields
| Children | Married-Couple Families | Single-Parent Households |
| No Children | 0 (0.0%) | 0 (0.0%) |
| 1 or 2 Children | 0 (0.0%) | 0 (0.0%) |
| 3 or 4 Children | 0 (0.0%) | 0 (0.0%) |
| 5 or more Children | 0 (0.0%) | 0 (0.0%) |
| Total | 0 (0.0%) | 0 (0.0%) |
Employment Characteristics in Greenfields
Employment by Class of Employer in Greenfields
Among the 385 employed individuals in Greenfields, private company employees (212 | 55.1%), self-employed (not incorporated) (89 | 23.1%), and not-for-profit organizations (48 | 12.5%) make up the most common classes of employment.
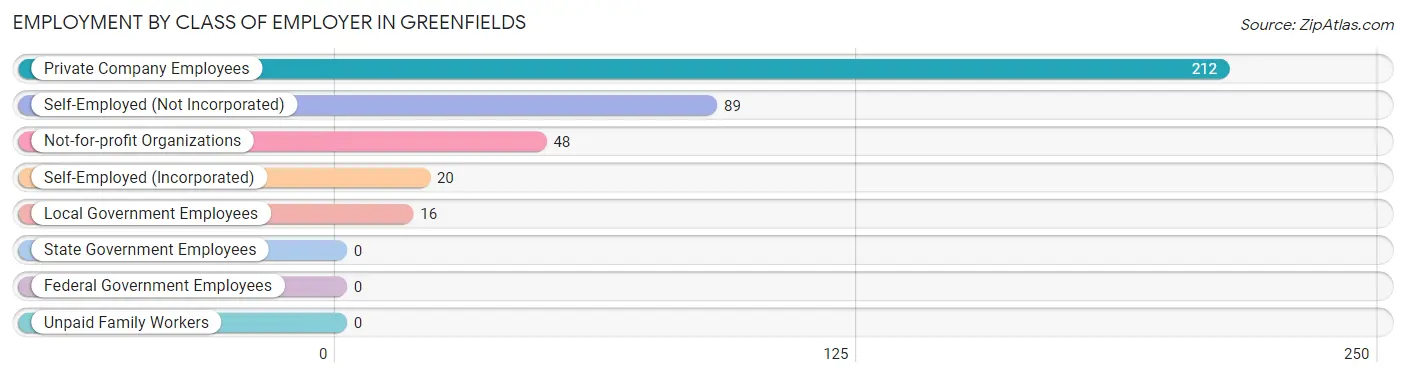
| Employer Class | # Employees | % Employees |
| Private Company Employees | 212 | 55.1% |
| Self-Employed (Incorporated) | 20 | 5.2% |
| Self-Employed (Not Incorporated) | 89 | 23.1% |
| Not-for-profit Organizations | 48 | 12.5% |
| Local Government Employees | 16 | 4.2% |
| State Government Employees | 0 | 0.0% |
| Federal Government Employees | 0 | 0.0% |
| Unpaid Family Workers | 0 | 0.0% |
| Total | 385 | 100.0% |
Employment Status by Age in Greenfields
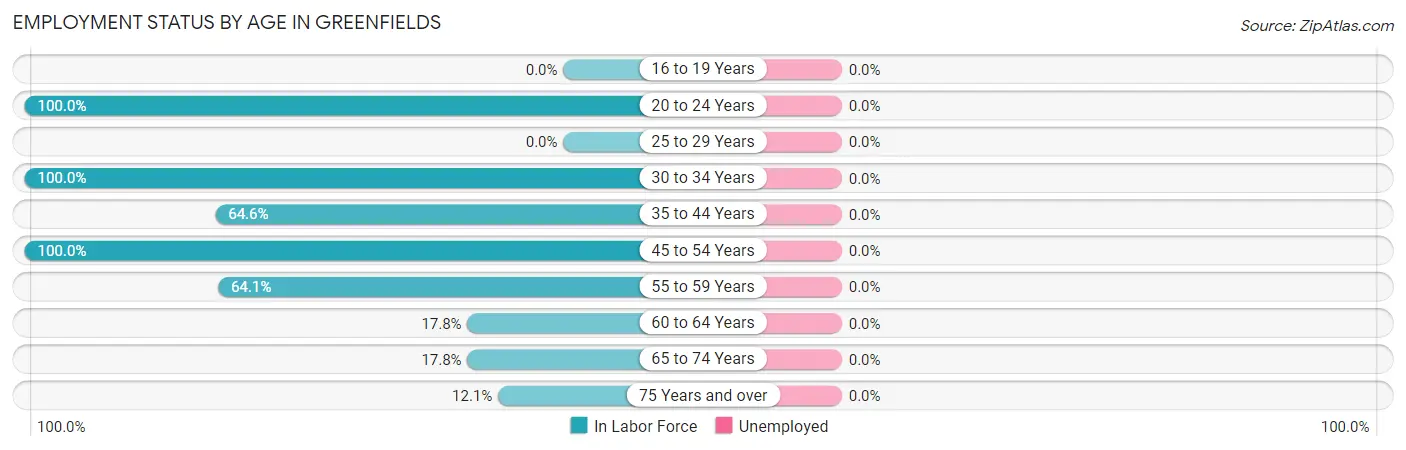
| Age Bracket | In Labor Force | Unemployed |
| 16 to 19 Years | 0 (0.0%) | 0 (0.0%) |
| 20 to 24 Years | 63 (100.0%) | 0 (0.0%) |
| 25 to 29 Years | 0 (0.0%) | 0 (0.0%) |
| 30 to 34 Years | 78 (100.0%) | 0 (0.0%) |
| 35 to 44 Years | 31 (64.6%) | 0 (0.0%) |
| 45 to 54 Years | 89 (100.0%) | 0 (0.0%) |
| 55 to 59 Years | 41 (64.1%) | 0 (0.0%) |
| 60 to 64 Years | 16 (17.8%) | 0 (0.0%) |
| 65 to 74 Years | 49 (17.8%) | 0 (0.0%) |
| 75 Years and over | 18 (12.1%) | 0 (0.0%) |
| Total | 385 (44.2%) | 0 (0.0%) |
Employment Status by Educational Attainment in Greenfields
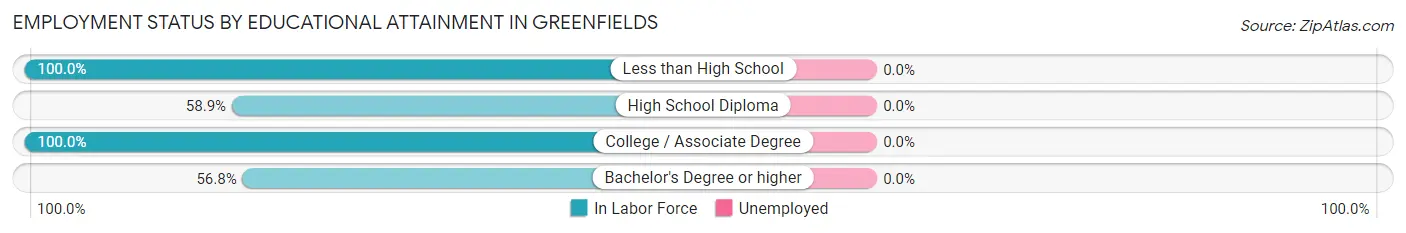
| Educational Attainment | In Labor Force | Unemployed |
| Less than High School | 19 (100.0%) | 0 (0.0%) |
| High School Diploma | 73 (58.9%) | 0 (0.0%) |
| College / Associate Degree | 80 (100.0%) | 0 (0.0%) |
| Bachelor's Degree or higher | 83 (56.8%) | 0 (0.0%) |
| Total | 255 (69.1%) | 0 (0.0%) |
Employment Occupations by Sex in Greenfields
Management, Business, Science and Arts Occupations
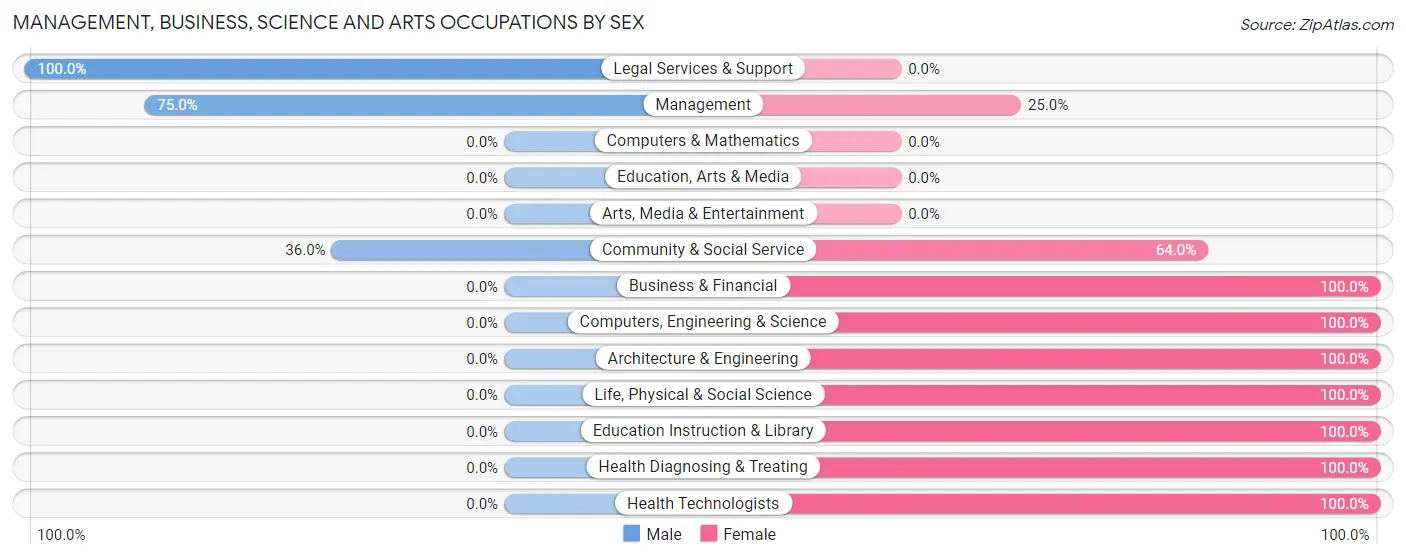
The most common Management, Business, Science and Arts occupations in Greenfields are Management (80 | 20.8%), Community & Social Service (25 | 6.5%), Computers, Engineering & Science (23 | 6.0%), Business & Financial (21 | 5.4%), and Health Diagnosing & Treating (20 | 5.2%).

Management, Business, Science and Arts Occupations by Sex
Within the Management, Business, Science and Arts occupations in Greenfields, the most male-oriented occupations are Legal Services & Support (100.0%), Management (75.0%), and Community & Social Service (36.0%), while the most female-oriented occupations are Business & Financial (100.0%), Computers, Engineering & Science (100.0%), and Architecture & Engineering (100.0%).
| Occupation | Male | Female |
| Management | 60 (75.0%) | 20 (25.0%) |
| Business & Financial | 0 (0.0%) | 21 (100.0%) |
| Computers, Engineering & Science | 0 (0.0%) | 23 (100.0%) |
| Computers & Mathematics | 0 (0.0%) | 0 (0.0%) |
| Architecture & Engineering | 0 (0.0%) | 11 (100.0%) |
| Life, Physical & Social Science | 0 (0.0%) | 12 (100.0%) |
| Community & Social Service | 9 (36.0%) | 16 (64.0%) |
| Education, Arts & Media | 0 (0.0%) | 0 (0.0%) |
| Legal Services & Support | 9 (100.0%) | 0 (0.0%) |
| Education Instruction & Library | 0 (0.0%) | 16 (100.0%) |
| Arts, Media & Entertainment | 0 (0.0%) | 0 (0.0%) |
| Health Diagnosing & Treating | 0 (0.0%) | 20 (100.0%) |
| Health Technologists | 0 (0.0%) | 20 (100.0%) |
| Total (Category) | 69 (40.8%) | 100 (59.2%) |
| Total (Overall) | 246 (63.9%) | 139 (36.1%) |
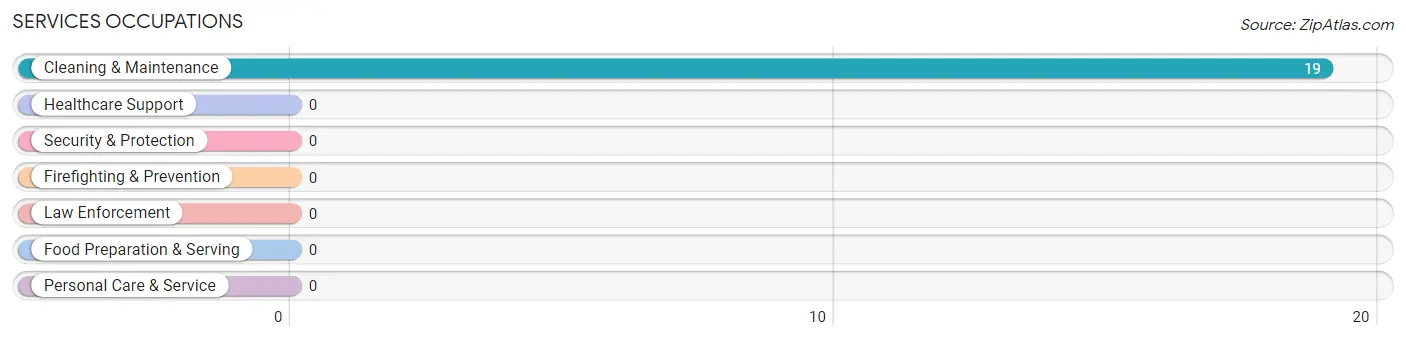
Services Occupations
The most common Services occupations in Greenfields are , and Cleaning & Maintenance (19 | 4.9%).
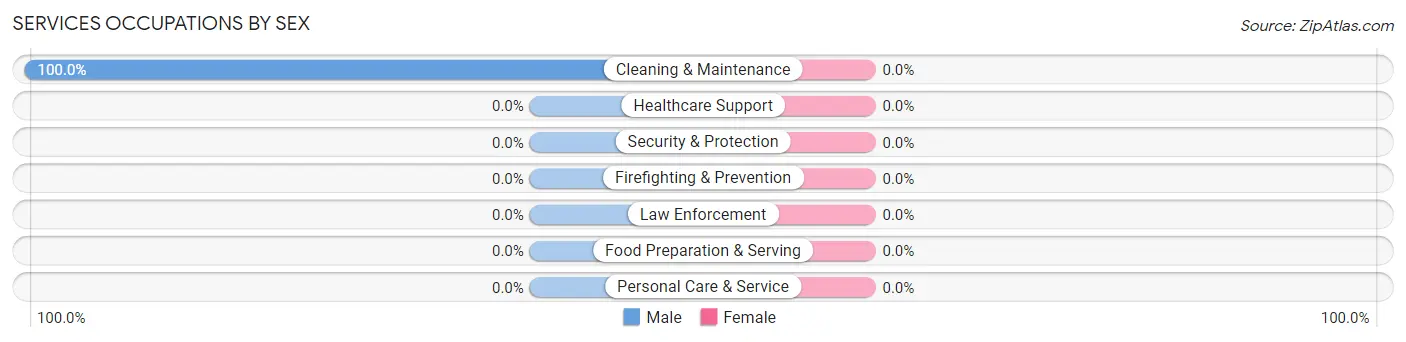
Services Occupations by Sex
| Occupation | Male | Female |
| Healthcare Support | 0 (0.0%) | 0 (0.0%) |
| Security & Protection | 0 (0.0%) | 0 (0.0%) |
| Firefighting & Prevention | 0 (0.0%) | 0 (0.0%) |
| Law Enforcement | 0 (0.0%) | 0 (0.0%) |
| Food Preparation & Serving | 0 (0.0%) | 0 (0.0%) |
| Cleaning & Maintenance | 19 (100.0%) | 0 (0.0%) |
| Personal Care & Service | 0 (0.0%) | 0 (0.0%) |
| Total (Category) | 19 (100.0%) | 0 (0.0%) |
| Total (Overall) | 246 (63.9%) | 139 (36.1%) |
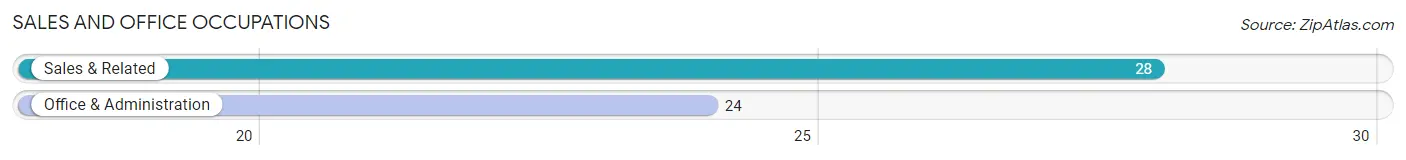
Sales and Office Occupations
The most common Sales and Office occupations in Greenfields are Sales & Related (28 | 7.3%), and Office & Administration (24 | 6.2%).
Sales and Office Occupations by Sex
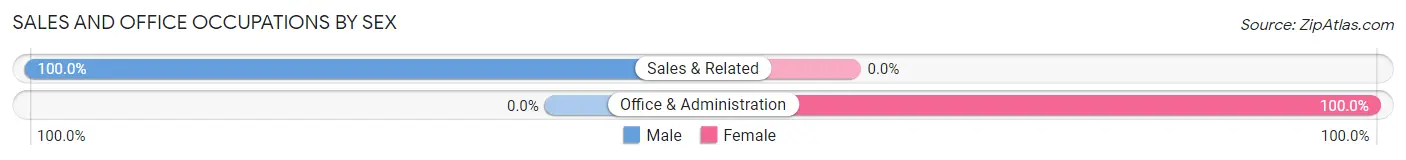
| Occupation | Male | Female |
| Sales & Related | 28 (100.0%) | 0 (0.0%) |
| Office & Administration | 0 (0.0%) | 24 (100.0%) |
| Total (Category) | 28 (53.8%) | 24 (46.2%) |
| Total (Overall) | 246 (63.9%) | 139 (36.1%) |
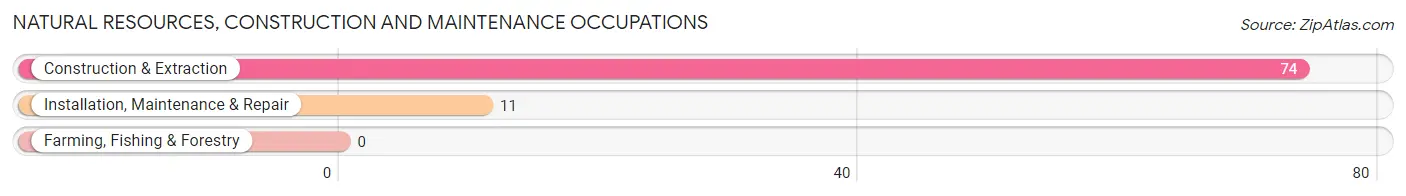
Natural Resources, Construction and Maintenance Occupations
The most common Natural Resources, Construction and Maintenance occupations in Greenfields are Construction & Extraction (74 | 19.2%), and Installation, Maintenance & Repair (11 | 2.9%).
Natural Resources, Construction and Maintenance Occupations by Sex
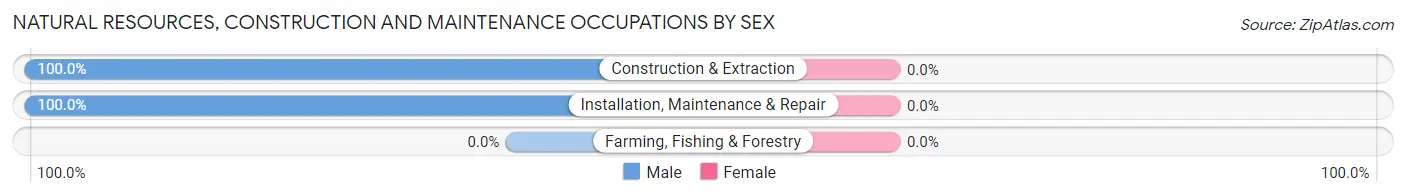
| Occupation | Male | Female |
| Farming, Fishing & Forestry | 0 (0.0%) | 0 (0.0%) |
| Construction & Extraction | 74 (100.0%) | 0 (0.0%) |
| Installation, Maintenance & Repair | 11 (100.0%) | 0 (0.0%) |
| Total (Category) | 85 (100.0%) | 0 (0.0%) |
| Total (Overall) | 246 (63.9%) | 139 (36.1%) |
Production, Transportation and Moving Occupations
The most common Production, Transportation and Moving occupations in Greenfields are Material Moving (35 | 9.1%), Production (16 | 4.2%), and Transportation (9 | 2.3%).
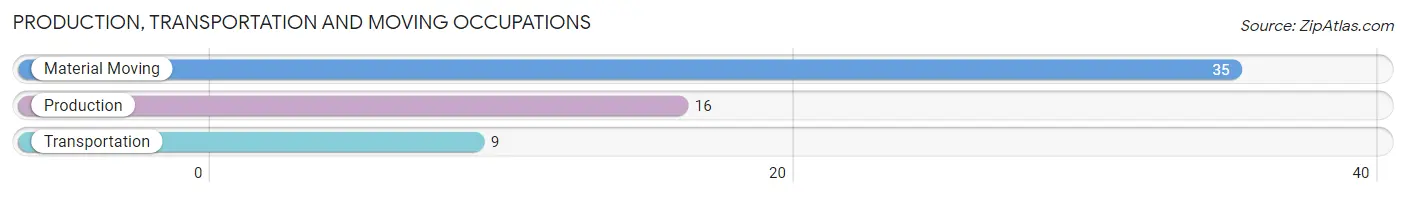
Production, Transportation and Moving Occupations by Sex
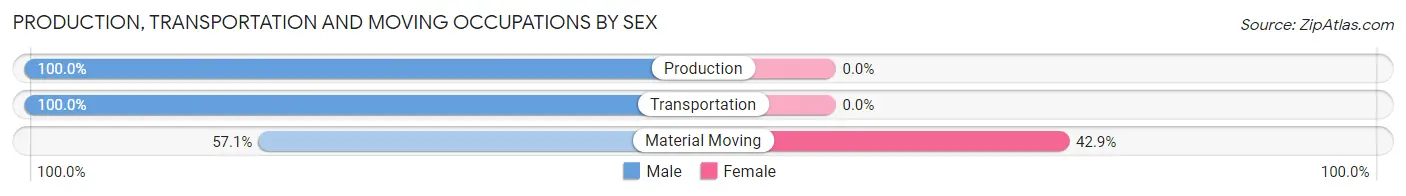
| Occupation | Male | Female |
| Production | 16 (100.0%) | 0 (0.0%) |
| Transportation | 9 (100.0%) | 0 (0.0%) |
| Material Moving | 20 (57.1%) | 15 (42.9%) |
| Total (Category) | 45 (75.0%) | 15 (25.0%) |
| Total (Overall) | 246 (63.9%) | 139 (36.1%) |
Employment Industries by Sex in Greenfields
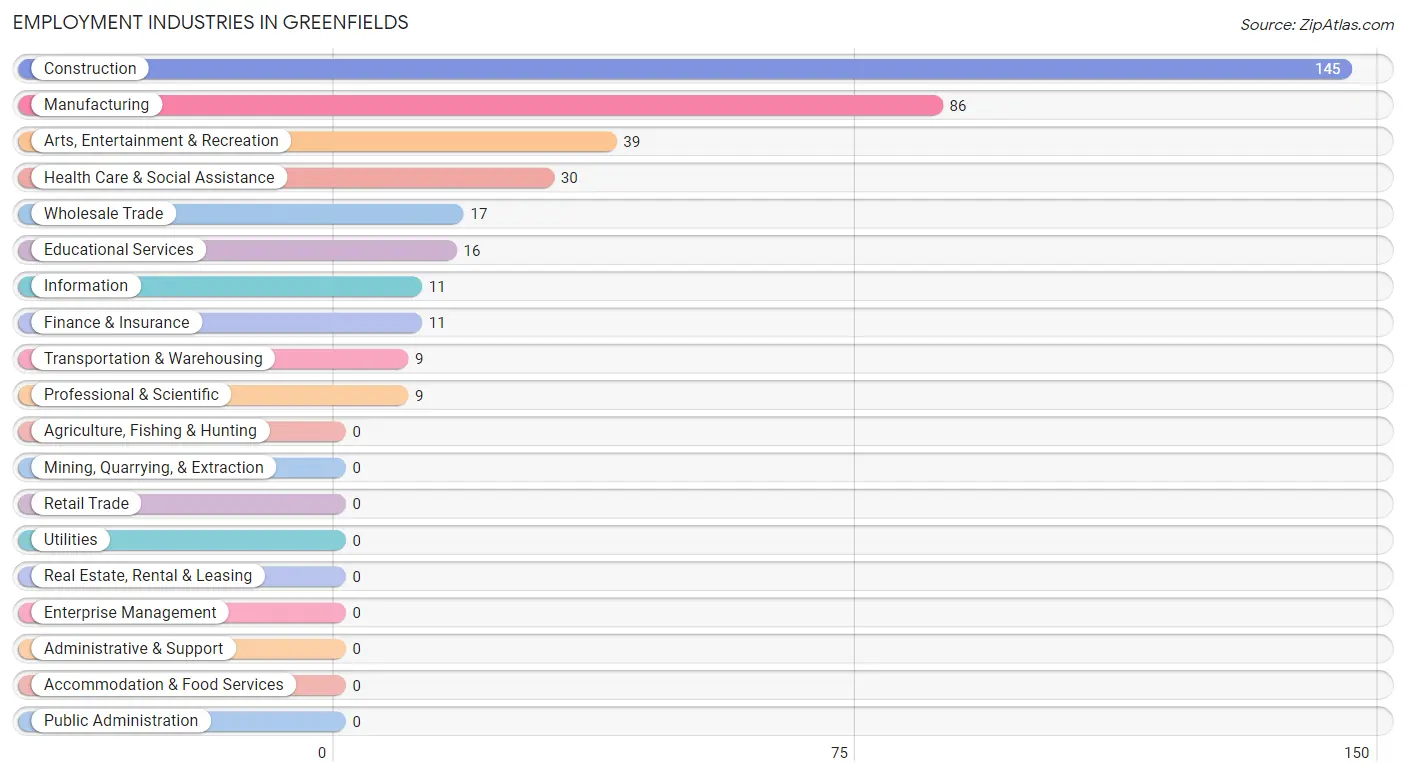
Employment Industries in Greenfields
The major employment industries in Greenfields include Construction (145 | 37.7%), Manufacturing (86 | 22.3%), Arts, Entertainment & Recreation (39 | 10.1%), Health Care & Social Assistance (30 | 7.8%), and Wholesale Trade (17 | 4.4%).
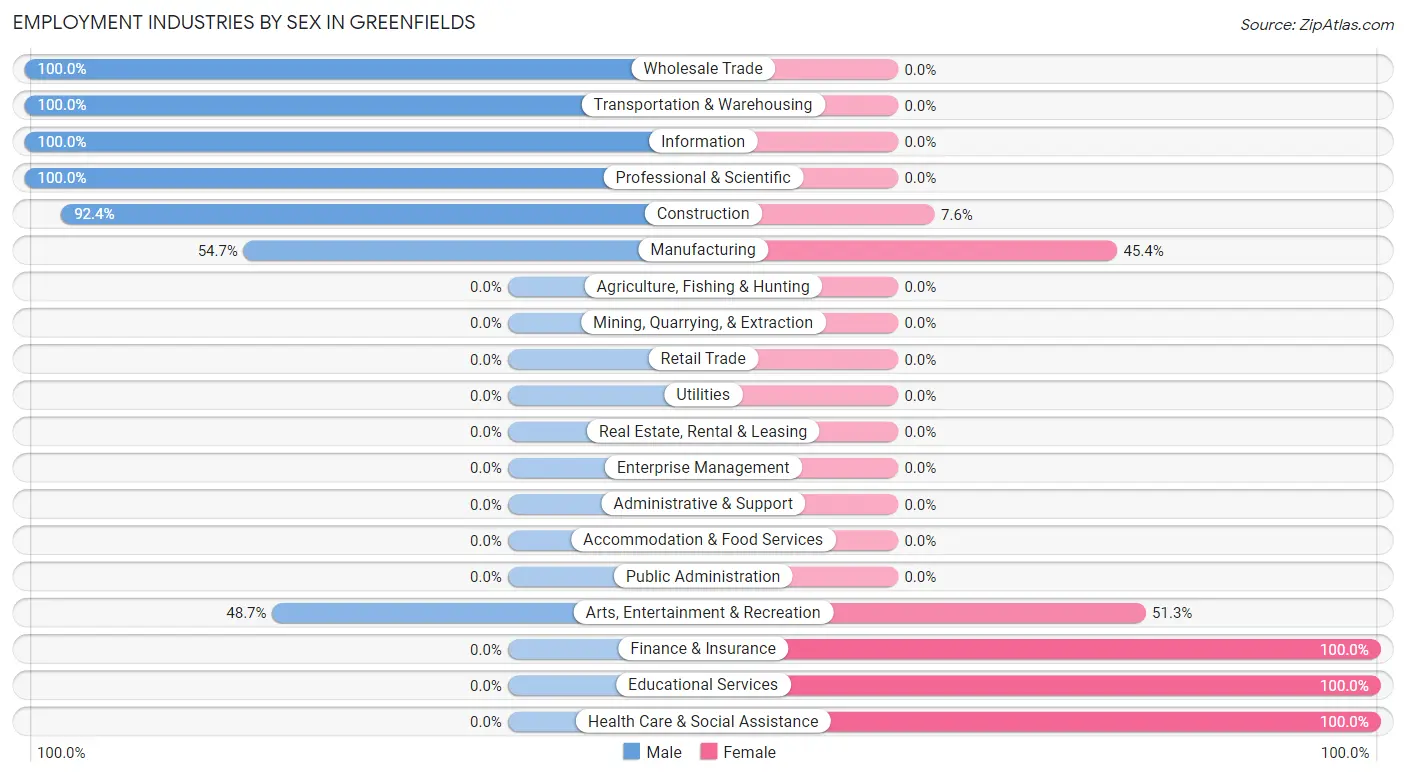
Employment Industries by Sex in Greenfields
The Greenfields industries that see more men than women are Wholesale Trade (100.0%), Transportation & Warehousing (100.0%), and Information (100.0%), whereas the industries that tend to have a higher number of women are Finance & Insurance (100.0%), Educational Services (100.0%), and Health Care & Social Assistance (100.0%).
| Industry | Male | Female |
| Agriculture, Fishing & Hunting | 0 (0.0%) | 0 (0.0%) |
| Mining, Quarrying, & Extraction | 0 (0.0%) | 0 (0.0%) |
| Construction | 134 (92.4%) | 11 (7.6%) |
| Manufacturing | 47 (54.6%) | 39 (45.4%) |
| Wholesale Trade | 17 (100.0%) | 0 (0.0%) |
| Retail Trade | 0 (0.0%) | 0 (0.0%) |
| Transportation & Warehousing | 9 (100.0%) | 0 (0.0%) |
| Utilities | 0 (0.0%) | 0 (0.0%) |
| Information | 11 (100.0%) | 0 (0.0%) |
| Finance & Insurance | 0 (0.0%) | 11 (100.0%) |
| Real Estate, Rental & Leasing | 0 (0.0%) | 0 (0.0%) |
| Professional & Scientific | 9 (100.0%) | 0 (0.0%) |
| Enterprise Management | 0 (0.0%) | 0 (0.0%) |
| Administrative & Support | 0 (0.0%) | 0 (0.0%) |
| Educational Services | 0 (0.0%) | 16 (100.0%) |
| Health Care & Social Assistance | 0 (0.0%) | 30 (100.0%) |
| Arts, Entertainment & Recreation | 19 (48.7%) | 20 (51.3%) |
| Accommodation & Food Services | 0 (0.0%) | 0 (0.0%) |
| Public Administration | 0 (0.0%) | 0 (0.0%) |
| Total | 246 (63.9%) | 139 (36.1%) |
Education in Greenfields
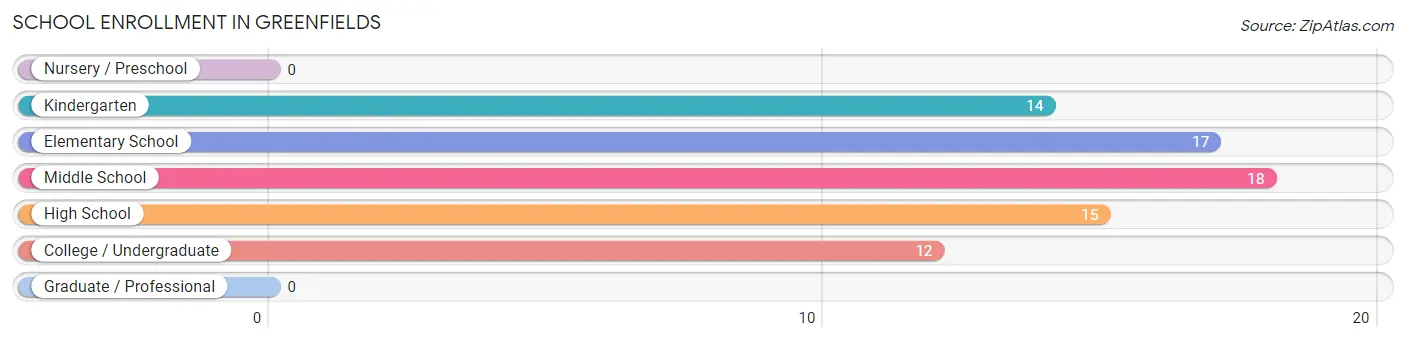
School Enrollment in Greenfields
The most common levels of schooling among the 76 students in Greenfields are middle school (18 | 23.7%), elementary school (17 | 22.4%), and high school (15 | 19.7%).
| School Level | # Students | % Students |
| Nursery / Preschool | 0 | 0.0% |
| Kindergarten | 14 | 18.4% |
| Elementary School | 17 | 22.4% |
| Middle School | 18 | 23.7% |
| High School | 15 | 19.7% |
| College / Undergraduate | 12 | 15.8% |
| Graduate / Professional | 0 | 0.0% |
| Total | 76 | 100.0% |
School Enrollment by Age by Funding Source in Greenfields
Out of a total of 76 students who are enrolled in schools in Greenfields, 47 (61.8%) attend a private institution, while the remaining 29 (38.2%) are enrolled in public schools. The age group of 10 to 14 year olds has the highest likelihood of being enrolled in private schools, with 18 (100.0% in the age bracket) enrolled. Conversely, the age group of 15 to 17 year olds has the lowest likelihood of being enrolled in a private school, with 15 (100.0% in the age bracket) attending a public institution.
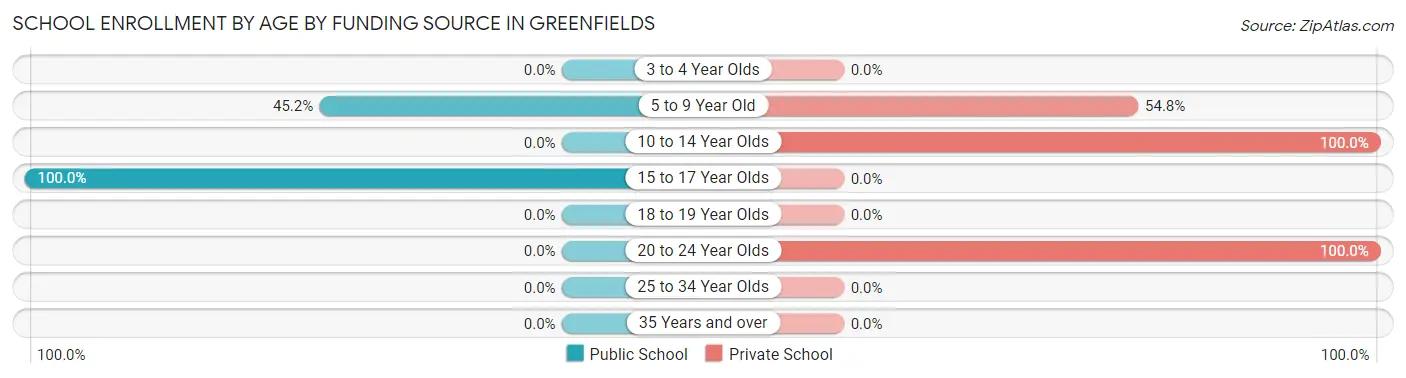
| Age Bracket | Public School | Private School |
| 3 to 4 Year Olds | 0 (0.0%) | 0 (0.0%) |
| 5 to 9 Year Old | 14 (45.2%) | 17 (54.8%) |
| 10 to 14 Year Olds | 0 (0.0%) | 18 (100.0%) |
| 15 to 17 Year Olds | 15 (100.0%) | 0 (0.0%) |
| 18 to 19 Year Olds | 0 (0.0%) | 0 (0.0%) |
| 20 to 24 Year Olds | 0 (0.0%) | 12 (100.0%) |
| 25 to 34 Year Olds | 0 (0.0%) | 0 (0.0%) |
| 35 Years and over | 0 (0.0%) | 0 (0.0%) |
| Total | 29 (38.2%) | 47 (61.8%) |
Educational Attainment by Field of Study in Greenfields
Business (75 | 28.6%), science & technology (53 | 20.2%), education (38 | 14.5%), physical & health sciences (27 | 10.3%), and visual & performing arts (20 | 7.6%) are the most common fields of study among 262 individuals in Greenfields who have obtained a bachelor's degree or higher.
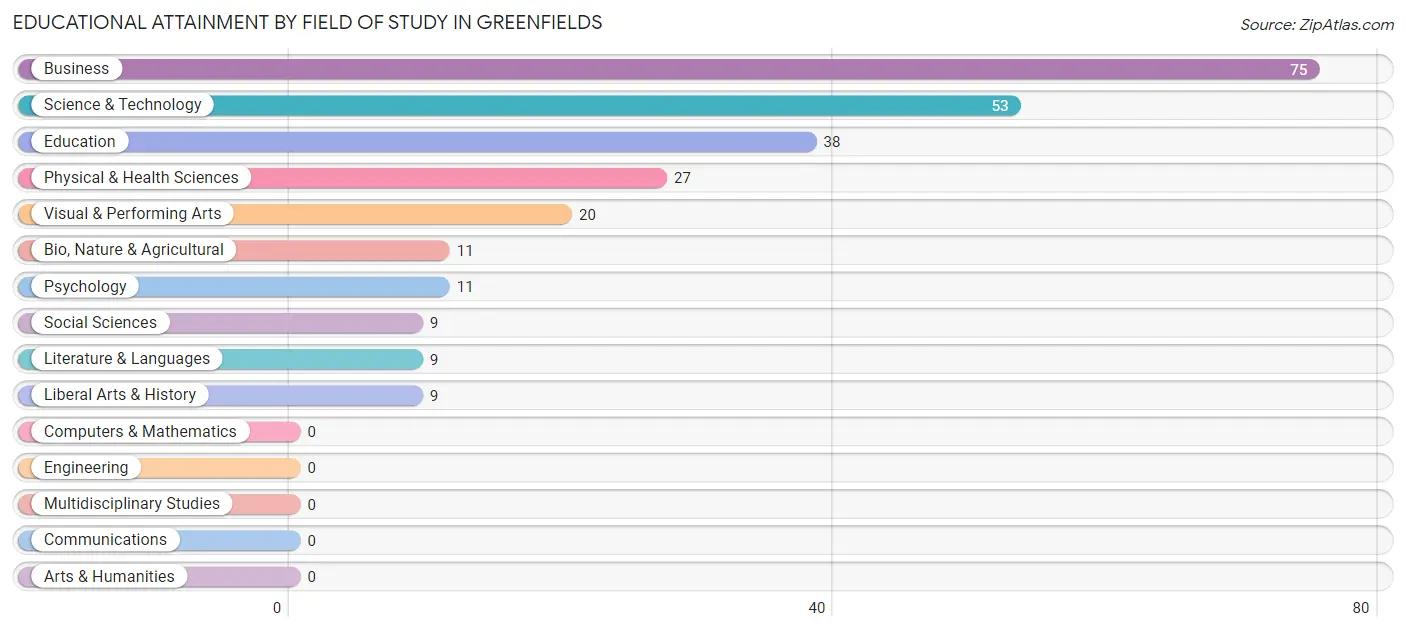
| Field of Study | # Graduates | % Graduates |
| Computers & Mathematics | 0 | 0.0% |
| Bio, Nature & Agricultural | 11 | 4.2% |
| Physical & Health Sciences | 27 | 10.3% |
| Psychology | 11 | 4.2% |
| Social Sciences | 9 | 3.4% |
| Engineering | 0 | 0.0% |
| Multidisciplinary Studies | 0 | 0.0% |
| Science & Technology | 53 | 20.2% |
| Business | 75 | 28.6% |
| Education | 38 | 14.5% |
| Literature & Languages | 9 | 3.4% |
| Liberal Arts & History | 9 | 3.4% |
| Visual & Performing Arts | 20 | 7.6% |
| Communications | 0 | 0.0% |
| Arts & Humanities | 0 | 0.0% |
| Total | 262 | 100.0% |
Transportation & Commute in Greenfields
Vehicle Availability by Sex in Greenfields
The most prevalent vehicle ownership categories in Greenfields are males with 3 vehicles (116, accounting for 47.1%) and females with 3 vehicles (0, making up 83.5%).
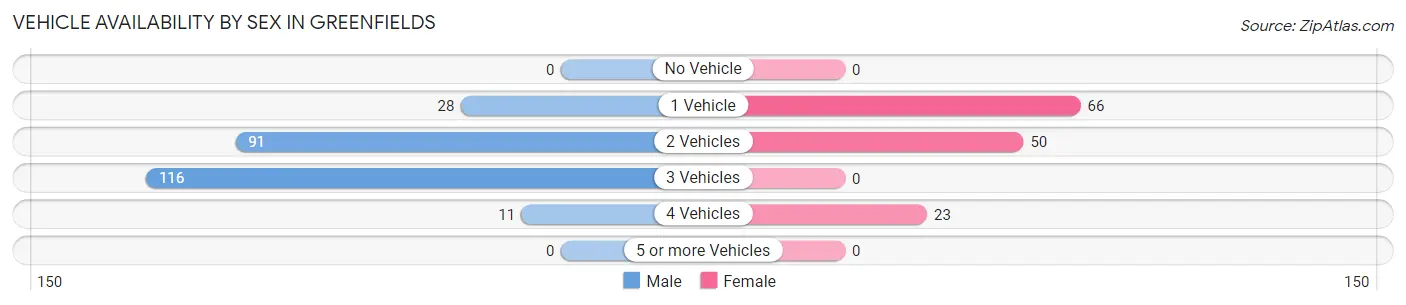
| Vehicles Available | Male | Female |
| No Vehicle | 0 (0.0%) | 0 (0.0%) |
| 1 Vehicle | 28 (11.4%) | 66 (47.5%) |
| 2 Vehicles | 91 (37.0%) | 50 (36.0%) |
| 3 Vehicles | 116 (47.1%) | 0 (0.0%) |
| 4 Vehicles | 11 (4.5%) | 23 (16.6%) |
| 5 or more Vehicles | 0 (0.0%) | 0 (0.0%) |
| Total | 246 (100.0%) | 139 (100.0%) |
Commute Time in Greenfields
The most frequently occuring commute durations in Greenfields are 10 to 14 minutes (142 commuters, 37.8%), 15 to 19 minutes (73 commuters, 19.4%), and 5 to 9 minutes (52 commuters, 13.8%).
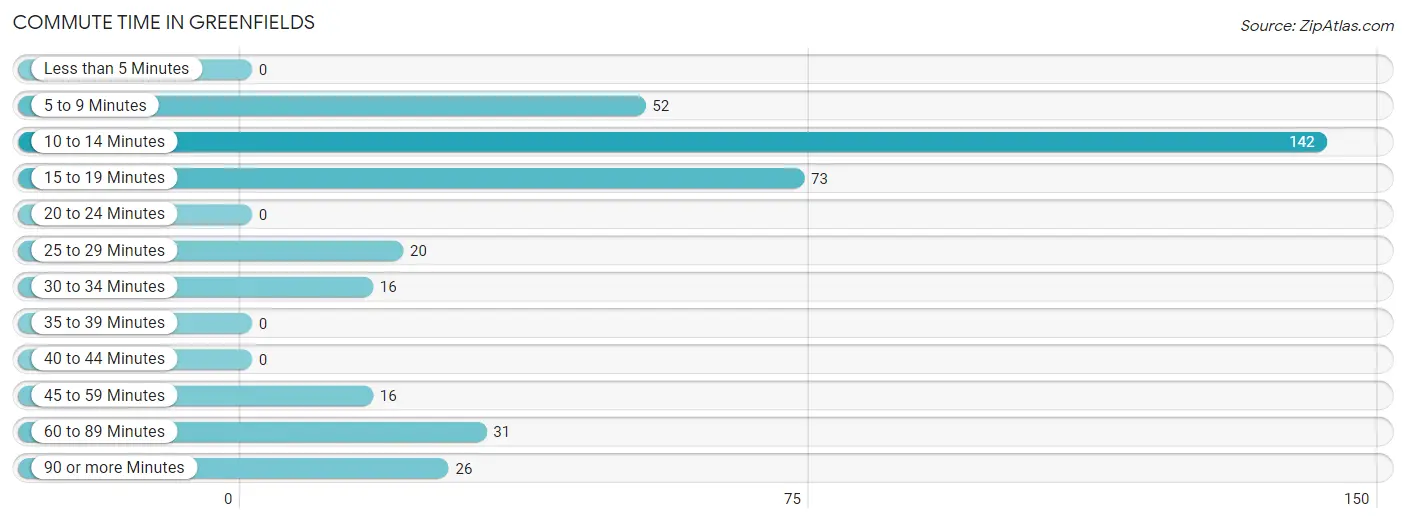
| Commute Time | # Commuters | % Commuters |
| Less than 5 Minutes | 0 | 0.0% |
| 5 to 9 Minutes | 52 | 13.8% |
| 10 to 14 Minutes | 142 | 37.8% |
| 15 to 19 Minutes | 73 | 19.4% |
| 20 to 24 Minutes | 0 | 0.0% |
| 25 to 29 Minutes | 20 | 5.3% |
| 30 to 34 Minutes | 16 | 4.3% |
| 35 to 39 Minutes | 0 | 0.0% |
| 40 to 44 Minutes | 0 | 0.0% |
| 45 to 59 Minutes | 16 | 4.3% |
| 60 to 89 Minutes | 31 | 8.2% |
| 90 or more Minutes | 26 | 6.9% |
Commute Time by Sex in Greenfields
The most common commute times in Greenfields are 10 to 14 minutes (76 commuters, 32.1%) for males and 10 to 14 minutes (66 commuters, 47.5%) for females.
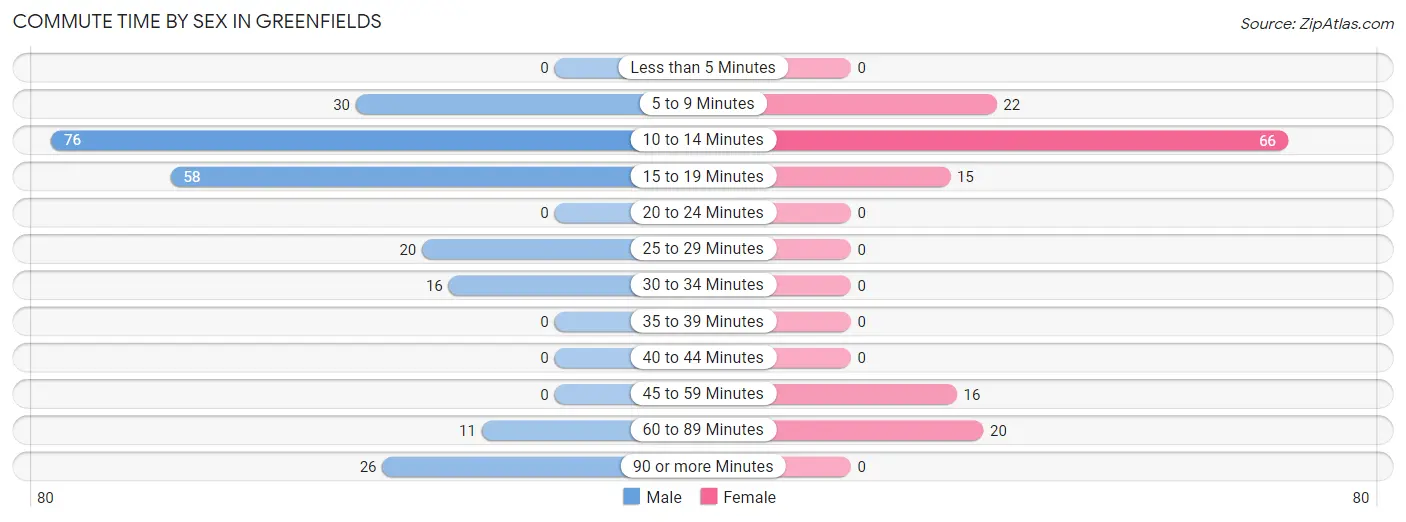
| Commute Time | Male | Female |
| Less than 5 Minutes | 0 (0.0%) | 0 (0.0%) |
| 5 to 9 Minutes | 30 (12.7%) | 22 (15.8%) |
| 10 to 14 Minutes | 76 (32.1%) | 66 (47.5%) |
| 15 to 19 Minutes | 58 (24.5%) | 15 (10.8%) |
| 20 to 24 Minutes | 0 (0.0%) | 0 (0.0%) |
| 25 to 29 Minutes | 20 (8.4%) | 0 (0.0%) |
| 30 to 34 Minutes | 16 (6.8%) | 0 (0.0%) |
| 35 to 39 Minutes | 0 (0.0%) | 0 (0.0%) |
| 40 to 44 Minutes | 0 (0.0%) | 0 (0.0%) |
| 45 to 59 Minutes | 0 (0.0%) | 16 (11.5%) |
| 60 to 89 Minutes | 11 (4.6%) | 20 (14.4%) |
| 90 or more Minutes | 26 (11.0%) | 0 (0.0%) |
Time of Departure to Work by Sex in Greenfields
The most frequent times of departure to work in Greenfields are 8:00 AM to 8:29 AM (91, 38.4%) for males and 8:00 AM to 8:29 AM (25, 18.0%) for females.
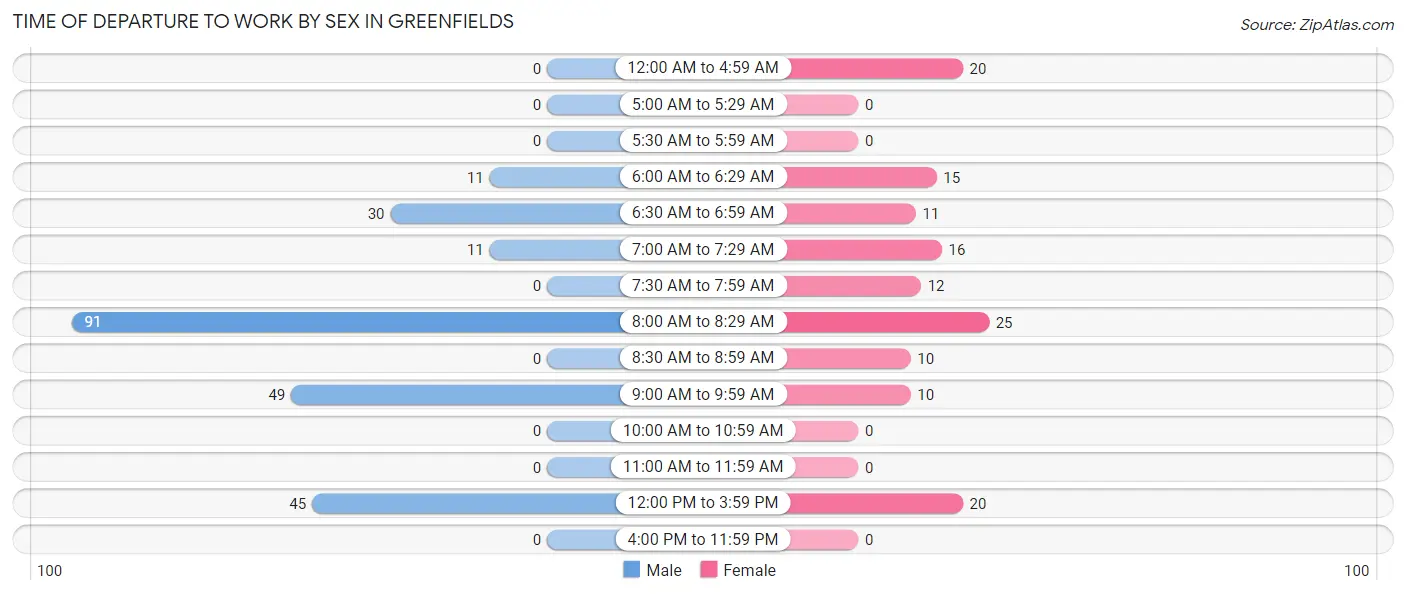
| Time of Departure | Male | Female |
| 12:00 AM to 4:59 AM | 0 (0.0%) | 20 (14.4%) |
| 5:00 AM to 5:29 AM | 0 (0.0%) | 0 (0.0%) |
| 5:30 AM to 5:59 AM | 0 (0.0%) | 0 (0.0%) |
| 6:00 AM to 6:29 AM | 11 (4.6%) | 15 (10.8%) |
| 6:30 AM to 6:59 AM | 30 (12.7%) | 11 (7.9%) |
| 7:00 AM to 7:29 AM | 11 (4.6%) | 16 (11.5%) |
| 7:30 AM to 7:59 AM | 0 (0.0%) | 12 (8.6%) |
| 8:00 AM to 8:29 AM | 91 (38.4%) | 25 (18.0%) |
| 8:30 AM to 8:59 AM | 0 (0.0%) | 10 (7.2%) |
| 9:00 AM to 9:59 AM | 49 (20.7%) | 10 (7.2%) |
| 10:00 AM to 10:59 AM | 0 (0.0%) | 0 (0.0%) |
| 11:00 AM to 11:59 AM | 0 (0.0%) | 0 (0.0%) |
| 12:00 PM to 3:59 PM | 45 (19.0%) | 20 (14.4%) |
| 4:00 PM to 11:59 PM | 0 (0.0%) | 0 (0.0%) |
| Total | 237 (100.0%) | 139 (100.0%) |
Housing Occupancy in Greenfields
Occupancy by Ownership in Greenfields
Of the total 475 dwellings in Greenfields, owner-occupied units account for 418 (88.0%), while renter-occupied units make up 57 (12.0%).
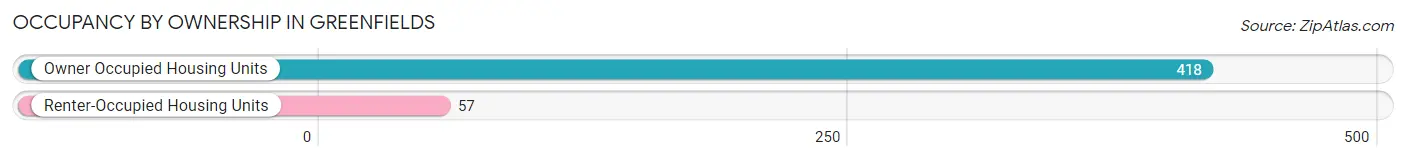
| Occupancy | # Housing Units | % Housing Units |
| Owner Occupied Housing Units | 418 | 88.0% |
| Renter-Occupied Housing Units | 57 | 12.0% |
| Total Occupied Housing Units | 475 | 100.0% |
Occupancy by Household Size in Greenfields
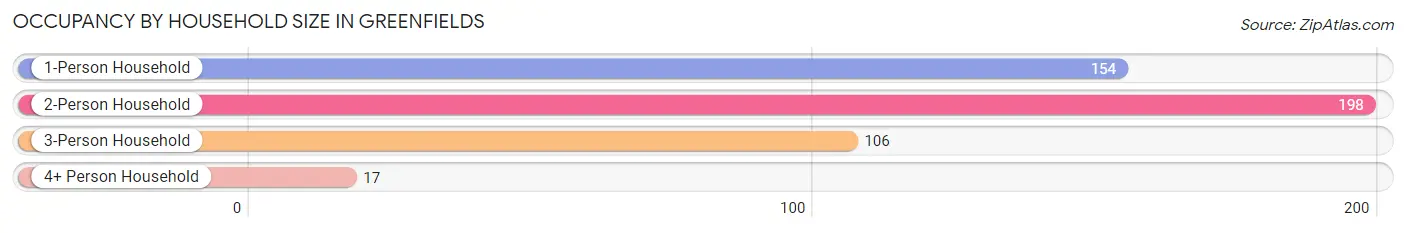
| Household Size | # Housing Units | % Housing Units |
| 1-Person Household | 154 | 32.4% |
| 2-Person Household | 198 | 41.7% |
| 3-Person Household | 106 | 22.3% |
| 4+ Person Household | 17 | 3.6% |
| Total Housing Units | 475 | 100.0% |
Occupancy by Ownership by Household Size in Greenfields
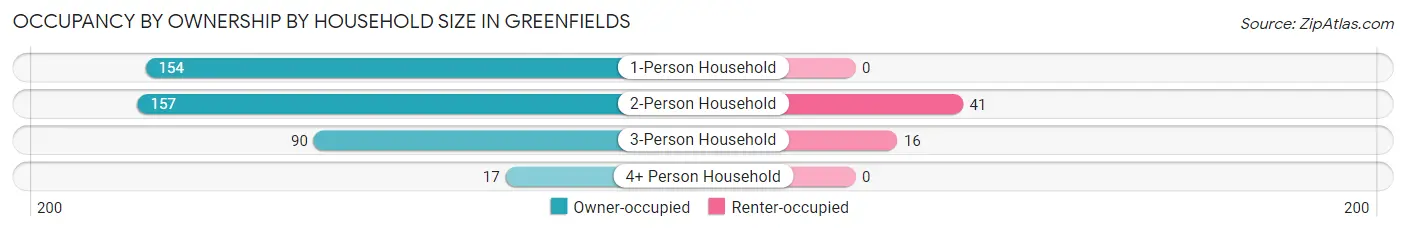
| Household Size | Owner-occupied | Renter-occupied |
| 1-Person Household | 154 (100.0%) | 0 (0.0%) |
| 2-Person Household | 157 (79.3%) | 41 (20.7%) |
| 3-Person Household | 90 (84.9%) | 16 (15.1%) |
| 4+ Person Household | 17 (100.0%) | 0 (0.0%) |
| Total Housing Units | 418 (88.0%) | 57 (12.0%) |
Occupancy by Educational Attainment in Greenfields
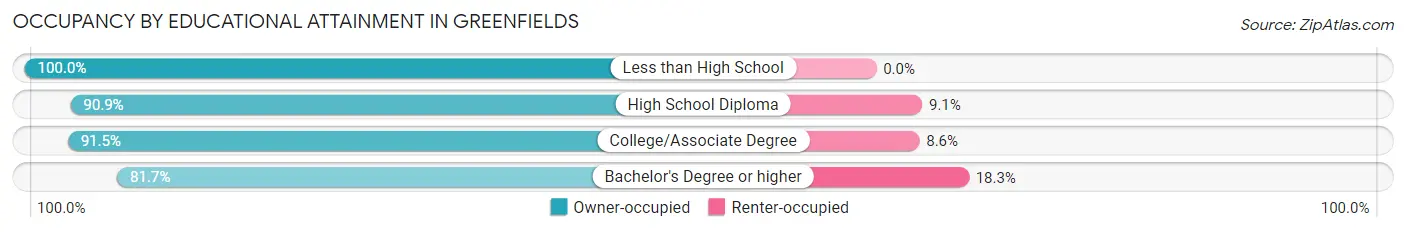
| Household Size | Owner-occupied | Renter-occupied |
| Less than High School | 13 (100.0%) | 0 (0.0%) |
| High School Diploma | 160 (90.9%) | 16 (9.1%) |
| College/Associate Degree | 107 (91.4%) | 10 (8.6%) |
| Bachelor's Degree or higher | 138 (81.7%) | 31 (18.3%) |
Occupancy by Age of Householder in Greenfields
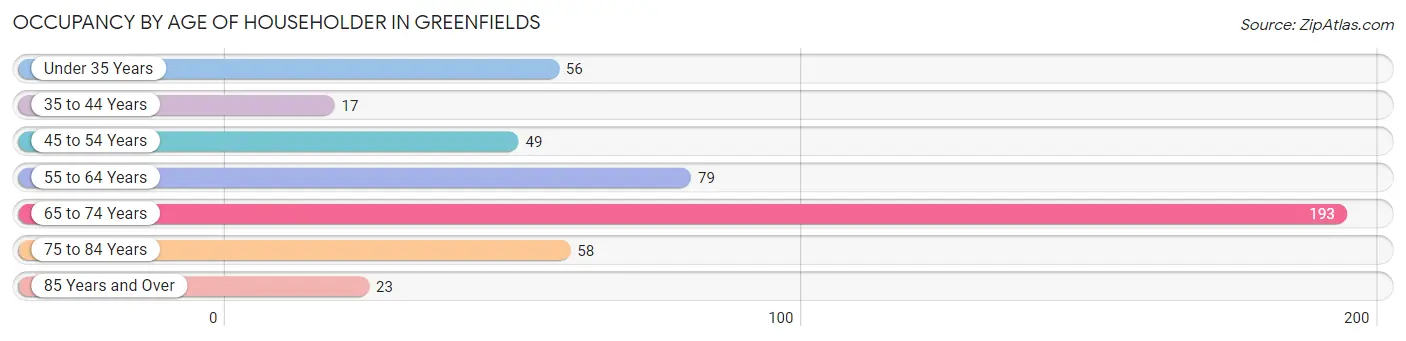
| Age Bracket | # Households | % Households |
| Under 35 Years | 56 | 11.8% |
| 35 to 44 Years | 17 | 3.6% |
| 45 to 54 Years | 49 | 10.3% |
| 55 to 64 Years | 79 | 16.6% |
| 65 to 74 Years | 193 | 40.6% |
| 75 to 84 Years | 58 | 12.2% |
| 85 Years and Over | 23 | 4.8% |
| Total | 475 | 100.0% |
Housing Finances in Greenfields
Median Income by Occupancy in Greenfields
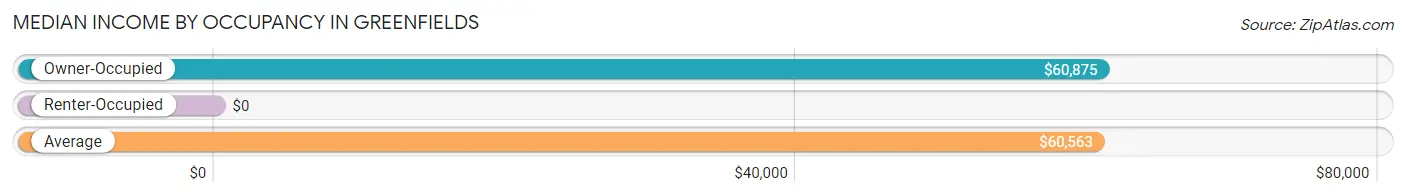
| Occupancy Type | # Households | Median Income |
| Owner-Occupied | 418 (88.0%) | $60,875 |
| Renter-Occupied | 57 (12.0%) | $0 |
| Average | 475 (100.0%) | $60,563 |
Occupancy by Householder Income Bracket in Greenfields
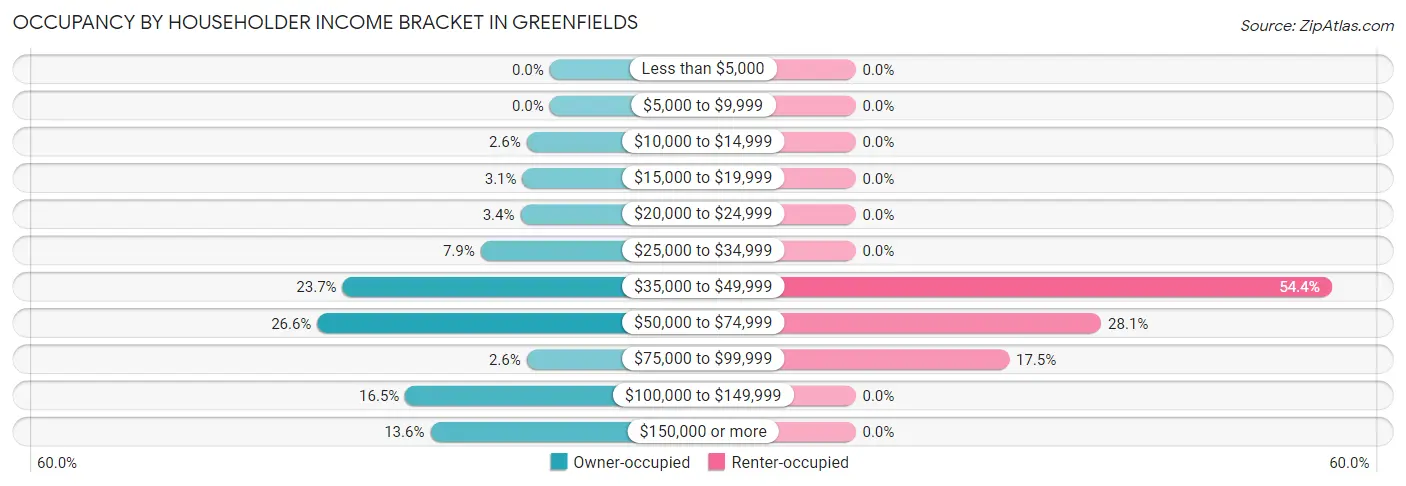
| Income Bracket | Owner-occupied | Renter-occupied |
| Less than $5,000 | 0 (0.0%) | 0 (0.0%) |
| $5,000 to $9,999 | 0 (0.0%) | 0 (0.0%) |
| $10,000 to $14,999 | 11 (2.6%) | 0 (0.0%) |
| $15,000 to $19,999 | 13 (3.1%) | 0 (0.0%) |
| $20,000 to $24,999 | 14 (3.4%) | 0 (0.0%) |
| $25,000 to $34,999 | 33 (7.9%) | 0 (0.0%) |
| $35,000 to $49,999 | 99 (23.7%) | 31 (54.4%) |
| $50,000 to $74,999 | 111 (26.6%) | 16 (28.1%) |
| $75,000 to $99,999 | 11 (2.6%) | 10 (17.5%) |
| $100,000 to $149,999 | 69 (16.5%) | 0 (0.0%) |
| $150,000 or more | 57 (13.6%) | 0 (0.0%) |
| Total | 418 (100.0%) | 57 (100.0%) |
Monthly Housing Cost Tiers in Greenfields
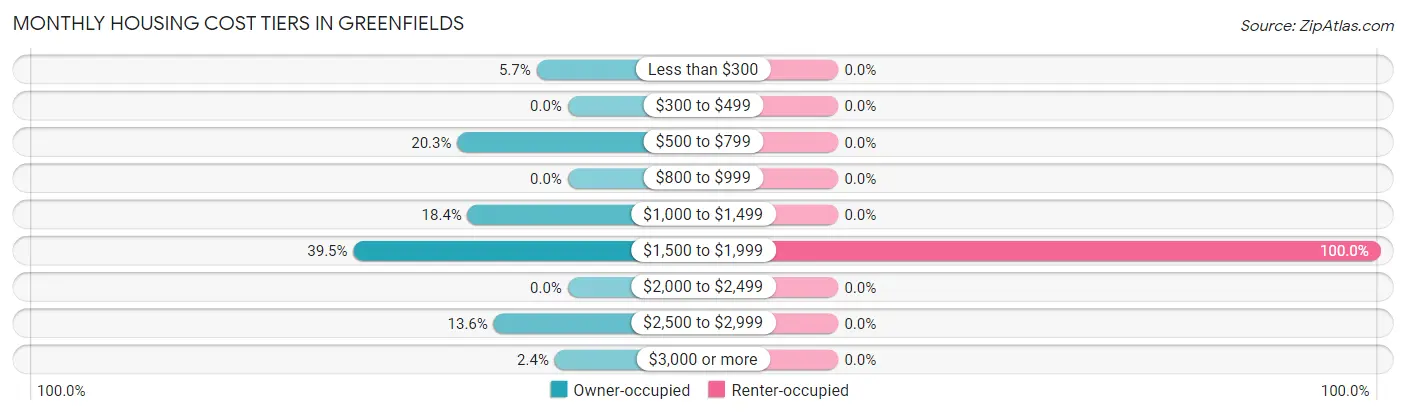
| Monthly Cost | Owner-occupied | Renter-occupied |
| Less than $300 | 24 (5.7%) | 0 (0.0%) |
| $300 to $499 | 0 (0.0%) | 0 (0.0%) |
| $500 to $799 | 85 (20.3%) | 0 (0.0%) |
| $800 to $999 | 0 (0.0%) | 0 (0.0%) |
| $1,000 to $1,499 | 77 (18.4%) | 0 (0.0%) |
| $1,500 to $1,999 | 165 (39.5%) | 57 (100.0%) |
| $2,000 to $2,499 | 0 (0.0%) | 0 (0.0%) |
| $2,500 to $2,999 | 57 (13.6%) | 0 (0.0%) |
| $3,000 or more | 10 (2.4%) | 0 (0.0%) |
| Total | 418 (100.0%) | 57 (100.0%) |
Physical Housing Characteristics in Greenfields
Housing Structures in Greenfields
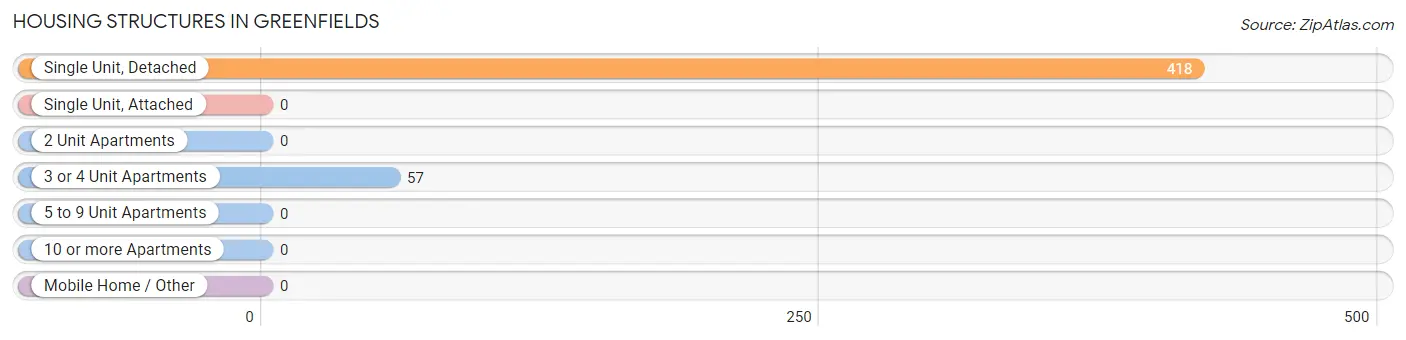
| Structure Type | # Housing Units | % Housing Units |
| Single Unit, Detached | 418 | 88.0% |
| Single Unit, Attached | 0 | 0.0% |
| 2 Unit Apartments | 0 | 0.0% |
| 3 or 4 Unit Apartments | 57 | 12.0% |
| 5 to 9 Unit Apartments | 0 | 0.0% |
| 10 or more Apartments | 0 | 0.0% |
| Mobile Home / Other | 0 | 0.0% |
| Total | 475 | 100.0% |
Housing Structures by Occupancy in Greenfields
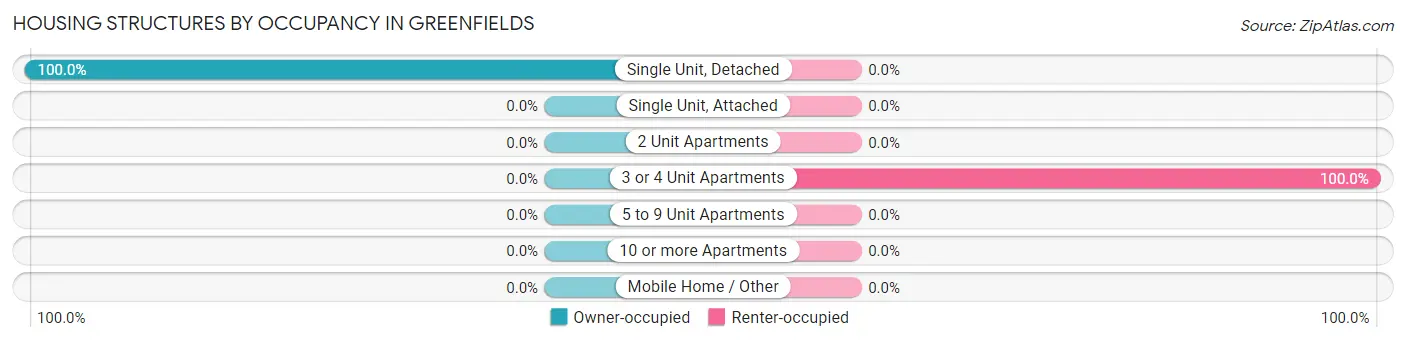
| Structure Type | Owner-occupied | Renter-occupied |
| Single Unit, Detached | 418 (100.0%) | 0 (0.0%) |
| Single Unit, Attached | 0 (0.0%) | 0 (0.0%) |
| 2 Unit Apartments | 0 (0.0%) | 0 (0.0%) |
| 3 or 4 Unit Apartments | 0 (0.0%) | 57 (100.0%) |
| 5 to 9 Unit Apartments | 0 (0.0%) | 0 (0.0%) |
| 10 or more Apartments | 0 (0.0%) | 0 (0.0%) |
| Mobile Home / Other | 0 (0.0%) | 0 (0.0%) |
| Total | 418 (88.0%) | 57 (12.0%) |
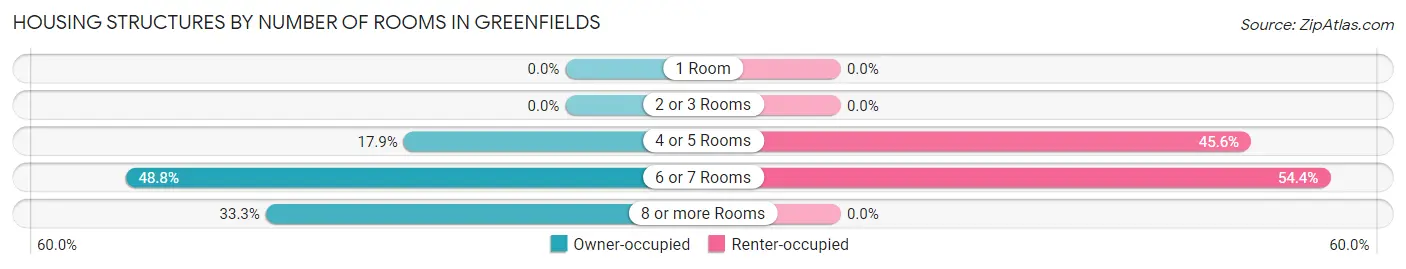
Housing Structures by Number of Rooms in Greenfields
| Number of Rooms | Owner-occupied | Renter-occupied |
| 1 Room | 0 (0.0%) | 0 (0.0%) |
| 2 or 3 Rooms | 0 (0.0%) | 0 (0.0%) |
| 4 or 5 Rooms | 75 (17.9%) | 26 (45.6%) |
| 6 or 7 Rooms | 204 (48.8%) | 31 (54.4%) |
| 8 or more Rooms | 139 (33.3%) | 0 (0.0%) |
| Total | 418 (100.0%) | 57 (100.0%) |
Housing Structure by Heating Type in Greenfields
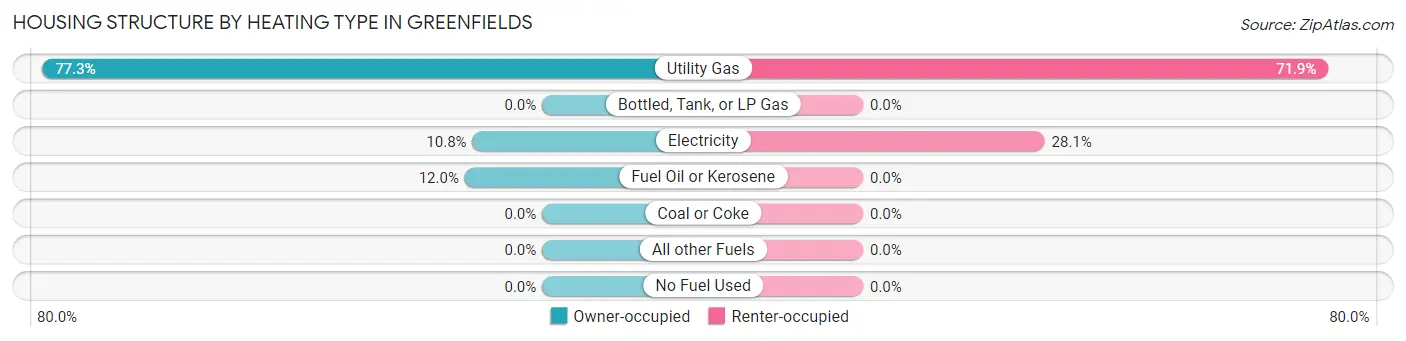
| Heating Type | Owner-occupied | Renter-occupied |
| Utility Gas | 323 (77.3%) | 41 (71.9%) |
| Bottled, Tank, or LP Gas | 0 (0.0%) | 0 (0.0%) |
| Electricity | 45 (10.8%) | 16 (28.1%) |
| Fuel Oil or Kerosene | 50 (12.0%) | 0 (0.0%) |
| Coal or Coke | 0 (0.0%) | 0 (0.0%) |
| All other Fuels | 0 (0.0%) | 0 (0.0%) |
| No Fuel Used | 0 (0.0%) | 0 (0.0%) |
| Total | 418 (100.0%) | 57 (100.0%) |
Household Vehicle Usage in Greenfields
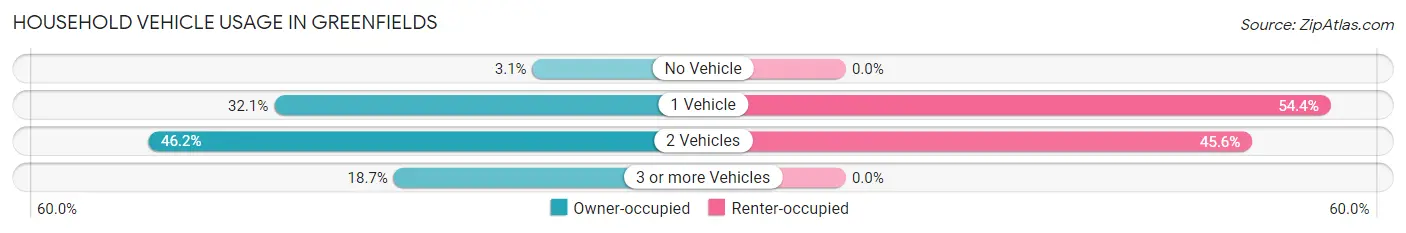
| Vehicles per Household | Owner-occupied | Renter-occupied |
| No Vehicle | 13 (3.1%) | 0 (0.0%) |
| 1 Vehicle | 134 (32.1%) | 31 (54.4%) |
| 2 Vehicles | 193 (46.2%) | 26 (45.6%) |
| 3 or more Vehicles | 78 (18.7%) | 0 (0.0%) |
| Total | 418 (100.0%) | 57 (100.0%) |
Real Estate & Mortgages in Greenfields
Real Estate and Mortgage Overview in Greenfields
| Characteristic | Without Mortgage | With Mortgage |
| Housing Units | 142 | 276 |
| Median Property Value | $191,700 | $244,400 |
| Median Household Income | $44,423 | $48 |
| Monthly Housing Costs | $613 | $10 |
| Real Estate Taxes | $4,192 | $0 |
Property Value by Mortgage Status in Greenfields
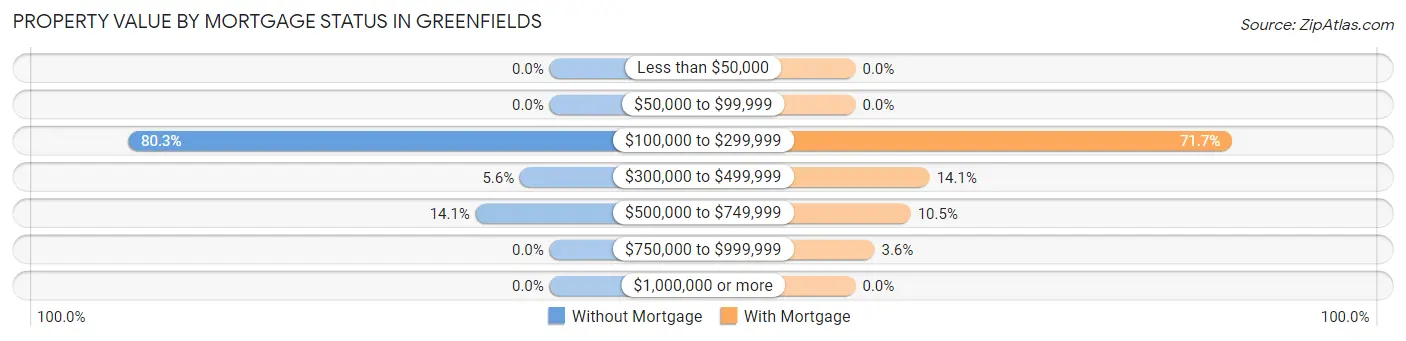
| Property Value | Without Mortgage | With Mortgage |
| Less than $50,000 | 0 (0.0%) | 0 (0.0%) |
| $50,000 to $99,999 | 0 (0.0%) | 0 (0.0%) |
| $100,000 to $299,999 | 114 (80.3%) | 198 (71.7%) |
| $300,000 to $499,999 | 8 (5.6%) | 39 (14.1%) |
| $500,000 to $749,999 | 20 (14.1%) | 29 (10.5%) |
| $750,000 to $999,999 | 0 (0.0%) | 10 (3.6%) |
| $1,000,000 or more | 0 (0.0%) | 0 (0.0%) |
| Total | 142 (100.0%) | 276 (100.0%) |
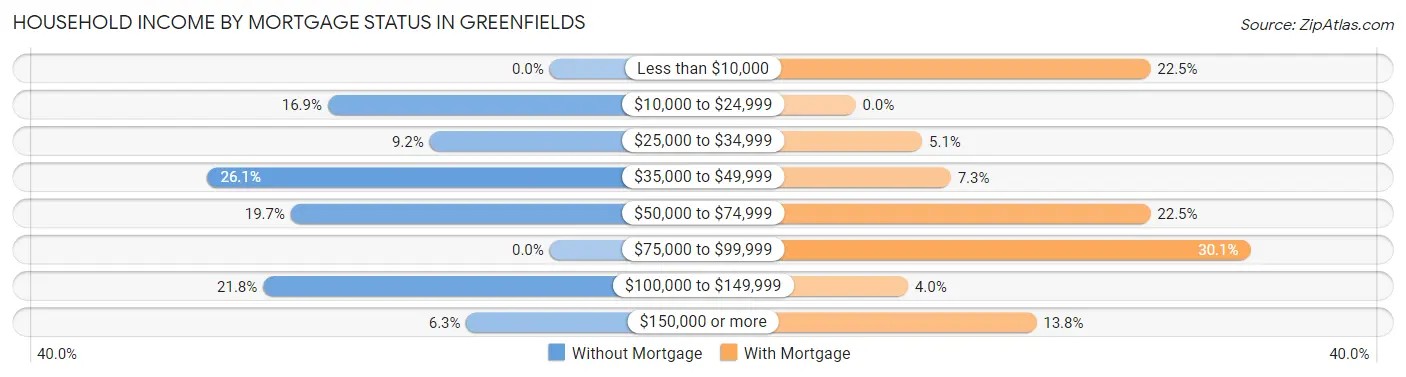
Household Income by Mortgage Status in Greenfields
| Household Income | Without Mortgage | With Mortgage |
| Less than $10,000 | 0 (0.0%) | 62 (22.5%) |
| $10,000 to $24,999 | 24 (16.9%) | 0 (0.0%) |
| $25,000 to $34,999 | 13 (9.1%) | 14 (5.1%) |
| $35,000 to $49,999 | 37 (26.1%) | 20 (7.2%) |
| $50,000 to $74,999 | 28 (19.7%) | 62 (22.5%) |
| $75,000 to $99,999 | 0 (0.0%) | 83 (30.1%) |
| $100,000 to $149,999 | 31 (21.8%) | 11 (4.0%) |
| $150,000 or more | 9 (6.3%) | 38 (13.8%) |
| Total | 142 (100.0%) | 276 (100.0%) |
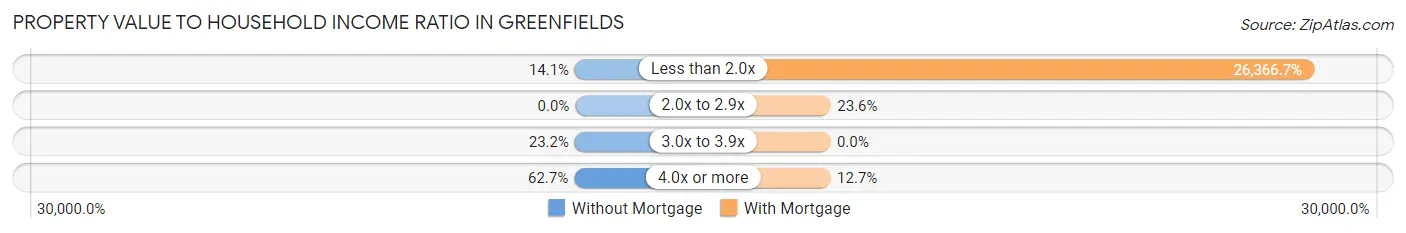
Property Value to Household Income Ratio in Greenfields
| Value-to-Income Ratio | Without Mortgage | With Mortgage |
| Less than 2.0x | 20 (14.1%) | 72,772 (26,366.7%) |
| 2.0x to 2.9x | 0 (0.0%) | 65 (23.5%) |
| 3.0x to 3.9x | 33 (23.2%) | 0 (0.0%) |
| 4.0x or more | 89 (62.7%) | 35 (12.7%) |
| Total | 142 (100.0%) | 276 (100.0%) |
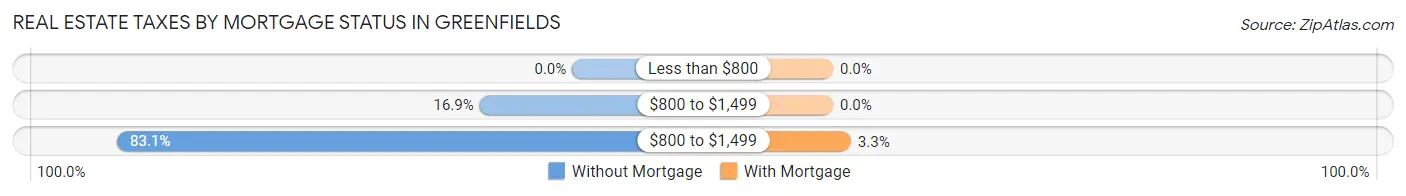
Real Estate Taxes by Mortgage Status in Greenfields
| Property Taxes | Without Mortgage | With Mortgage |
| Less than $800 | 0 (0.0%) | 0 (0.0%) |
| $800 to $1,499 | 24 (16.9%) | 0 (0.0%) |
| $800 to $1,499 | 118 (83.1%) | 9 (3.3%) |
| Total | 142 (100.0%) | 276 (100.0%) |
Health & Disability in Greenfields
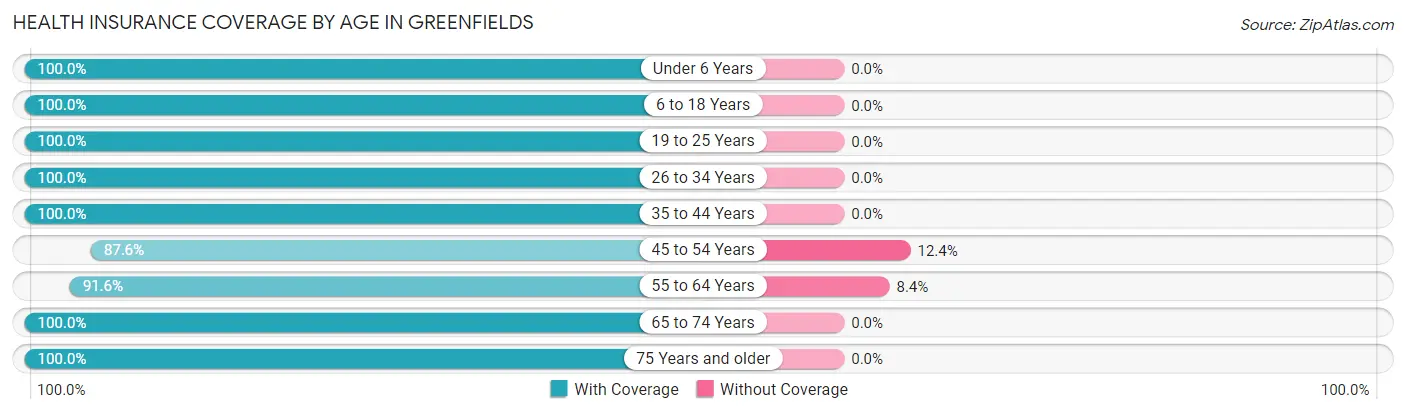
Health Insurance Coverage by Age in Greenfields
| Age Bracket | With Coverage | Without Coverage |
| Under 6 Years | 50 (100.0%) | 0 (0.0%) |
| 6 to 18 Years | 50 (100.0%) | 0 (0.0%) |
| 19 to 25 Years | 63 (100.0%) | 0 (0.0%) |
| 26 to 34 Years | 78 (100.0%) | 0 (0.0%) |
| 35 to 44 Years | 48 (100.0%) | 0 (0.0%) |
| 45 to 54 Years | 78 (87.6%) | 11 (12.4%) |
| 55 to 64 Years | 141 (91.6%) | 13 (8.4%) |
| 65 to 74 Years | 276 (100.0%) | 0 (0.0%) |
| 75 Years and older | 149 (100.0%) | 0 (0.0%) |
| Total | 933 (97.5%) | 24 (2.5%) |
Health Insurance Coverage by Citizenship Status in Greenfields
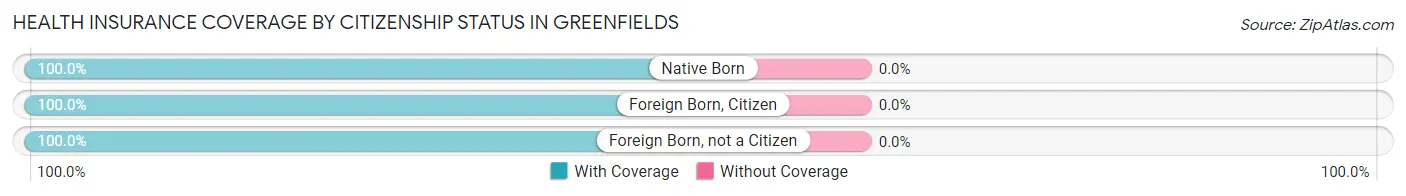
| Citizenship Status | With Coverage | Without Coverage |
| Native Born | 50 (100.0%) | 0 (0.0%) |
| Foreign Born, Citizen | 50 (100.0%) | 0 (0.0%) |
| Foreign Born, not a Citizen | 63 (100.0%) | 0 (0.0%) |
Health Insurance Coverage by Household Income in Greenfields
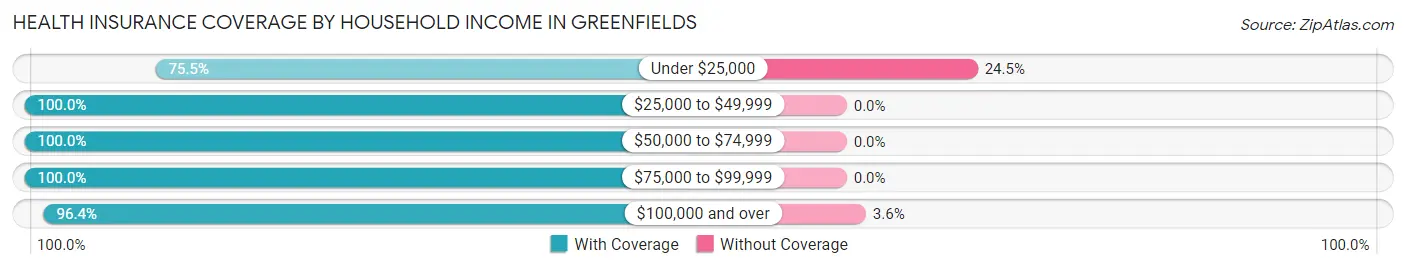
| Household Income | With Coverage | Without Coverage |
| Under $25,000 | 40 (75.5%) | 13 (24.5%) |
| $25,000 to $49,999 | 236 (100.0%) | 0 (0.0%) |
| $50,000 to $74,999 | 319 (100.0%) | 0 (0.0%) |
| $75,000 to $99,999 | 42 (100.0%) | 0 (0.0%) |
| $100,000 and over | 296 (96.4%) | 11 (3.6%) |
Public vs Private Health Insurance Coverage by Age in Greenfields
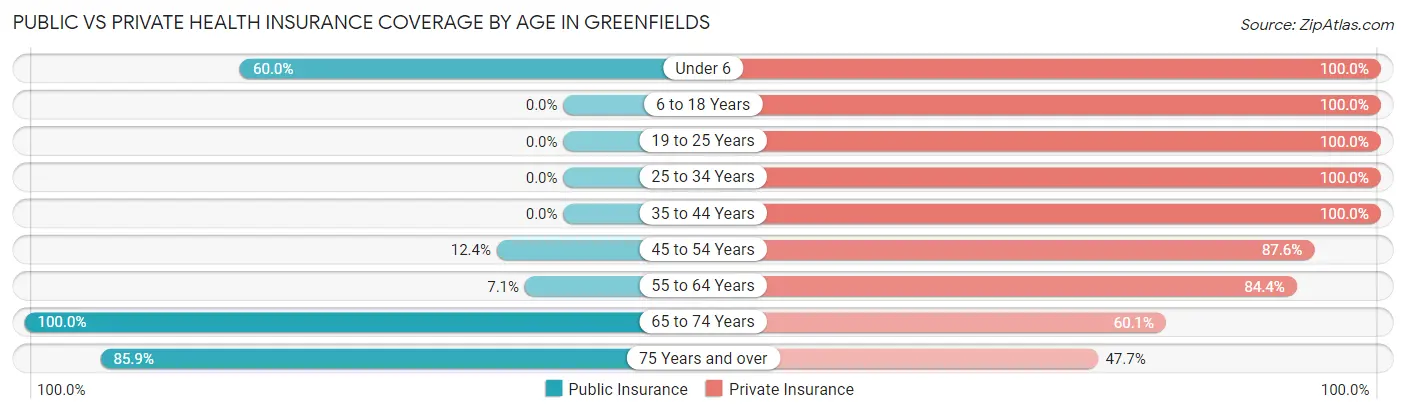
| Age Bracket | Public Insurance | Private Insurance |
| Under 6 | 30 (60.0%) | 50 (100.0%) |
| 6 to 18 Years | 0 (0.0%) | 50 (100.0%) |
| 19 to 25 Years | 0 (0.0%) | 63 (100.0%) |
| 25 to 34 Years | 0 (0.0%) | 78 (100.0%) |
| 35 to 44 Years | 0 (0.0%) | 48 (100.0%) |
| 45 to 54 Years | 11 (12.4%) | 78 (87.6%) |
| 55 to 64 Years | 11 (7.1%) | 130 (84.4%) |
| 65 to 74 Years | 276 (100.0%) | 166 (60.1%) |
| 75 Years and over | 128 (85.9%) | 71 (47.6%) |
| Total | 456 (47.6%) | 734 (76.7%) |
Disability Status by Sex by Age in Greenfields
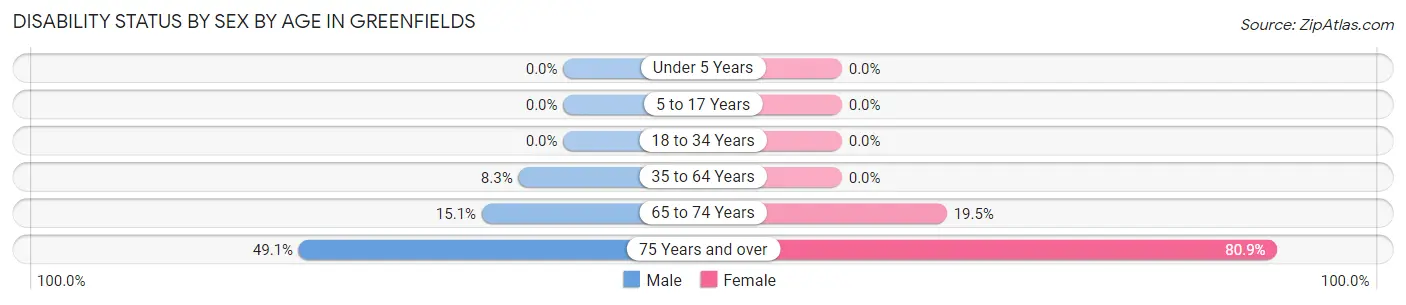
| Age Bracket | Male | Female |
| Under 5 Years | 0 (0.0%) | 0 (0.0%) |
| 5 to 17 Years | 0 (0.0%) | 0 (0.0%) |
| 18 to 34 Years | 0 (0.0%) | 0 (0.0%) |
| 35 to 64 Years | 11 (8.3%) | 0 (0.0%) |
| 65 to 74 Years | 13 (15.1%) | 37 (19.5%) |
| 75 Years and over | 27 (49.1%) | 76 (80.8%) |
Disability Class by Sex by Age in Greenfields
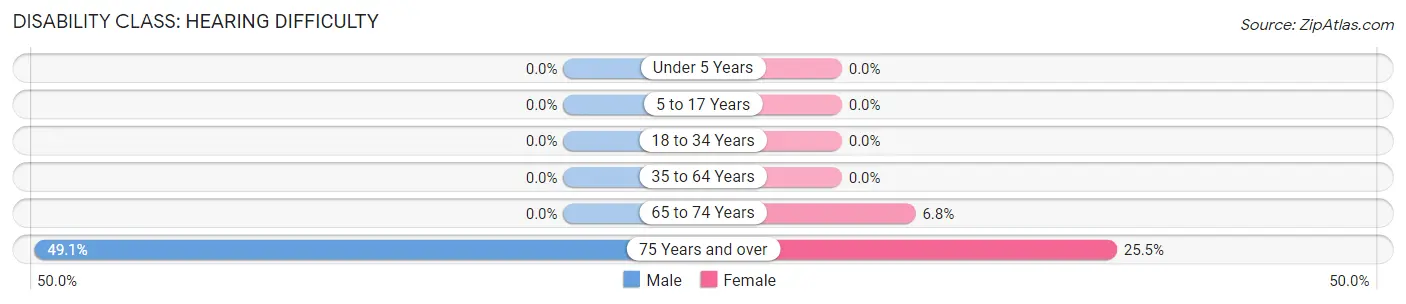
Disability Class: Hearing Difficulty
| Age Bracket | Male | Female |
| Under 5 Years | 0 (0.0%) | 0 (0.0%) |
| 5 to 17 Years | 0 (0.0%) | 0 (0.0%) |
| 18 to 34 Years | 0 (0.0%) | 0 (0.0%) |
| 35 to 64 Years | 0 (0.0%) | 0 (0.0%) |
| 65 to 74 Years | 0 (0.0%) | 13 (6.8%) |
| 75 Years and over | 27 (49.1%) | 24 (25.5%) |
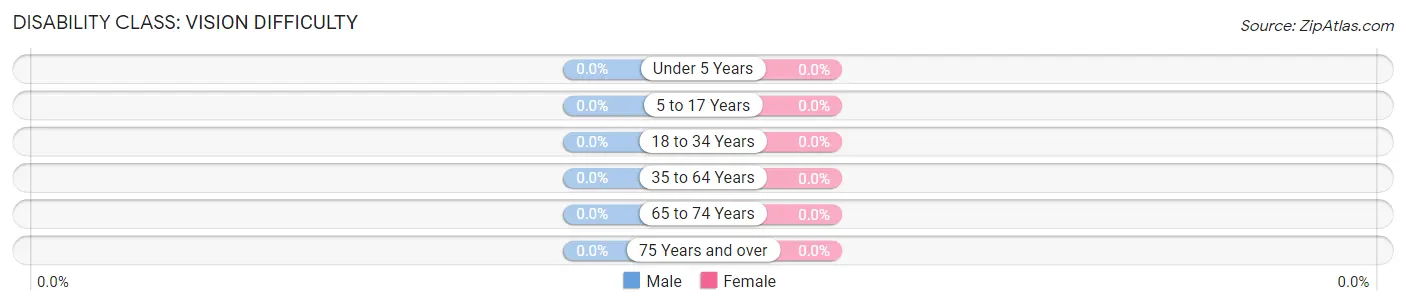
Disability Class: Vision Difficulty
| Age Bracket | Male | Female |
| Under 5 Years | 0 (0.0%) | 0 (0.0%) |
| 5 to 17 Years | 0 (0.0%) | 0 (0.0%) |
| 18 to 34 Years | 0 (0.0%) | 0 (0.0%) |
| 35 to 64 Years | 0 (0.0%) | 0 (0.0%) |
| 65 to 74 Years | 0 (0.0%) | 0 (0.0%) |
| 75 Years and over | 0 (0.0%) | 0 (0.0%) |
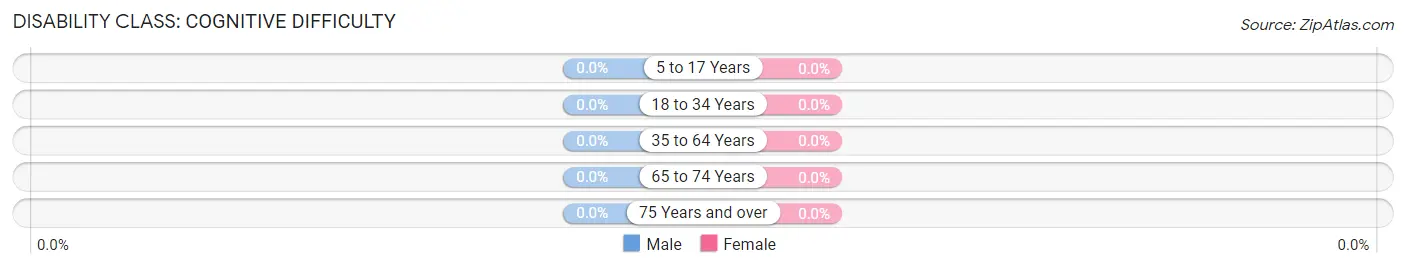
Disability Class: Cognitive Difficulty
| Age Bracket | Male | Female |
| 5 to 17 Years | 0 (0.0%) | 0 (0.0%) |
| 18 to 34 Years | 0 (0.0%) | 0 (0.0%) |
| 35 to 64 Years | 0 (0.0%) | 0 (0.0%) |
| 65 to 74 Years | 0 (0.0%) | 0 (0.0%) |
| 75 Years and over | 0 (0.0%) | 0 (0.0%) |
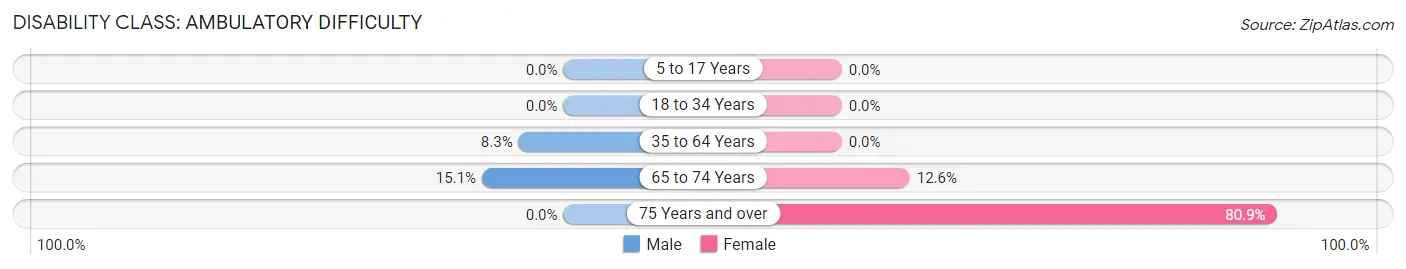
Disability Class: Ambulatory Difficulty
| Age Bracket | Male | Female |
| 5 to 17 Years | 0 (0.0%) | 0 (0.0%) |
| 18 to 34 Years | 0 (0.0%) | 0 (0.0%) |
| 35 to 64 Years | 11 (8.3%) | 0 (0.0%) |
| 65 to 74 Years | 13 (15.1%) | 24 (12.6%) |
| 75 Years and over | 0 (0.0%) | 76 (80.8%) |
Disability Class: Self-Care Difficulty
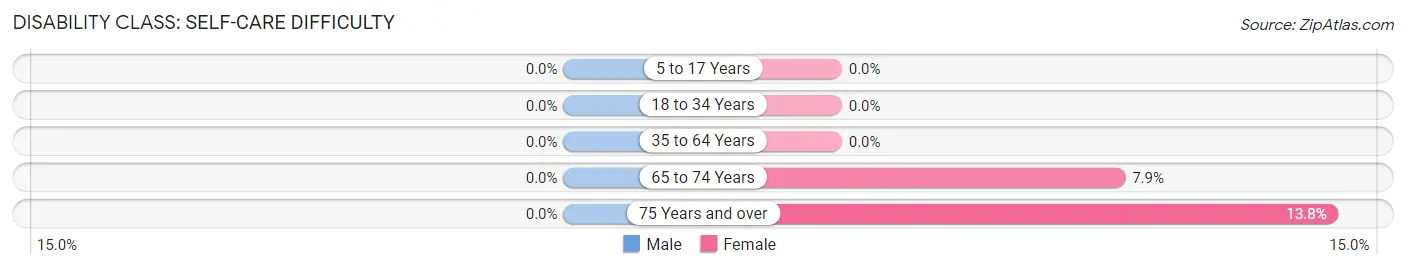
| Age Bracket | Male | Female |
| 5 to 17 Years | 0 (0.0%) | 0 (0.0%) |
| 18 to 34 Years | 0 (0.0%) | 0 (0.0%) |
| 35 to 64 Years | 0 (0.0%) | 0 (0.0%) |
| 65 to 74 Years | 0 (0.0%) | 15 (7.9%) |
| 75 Years and over | 0 (0.0%) | 13 (13.8%) |
Technology Access in Greenfields
Computing Device Access in Greenfields
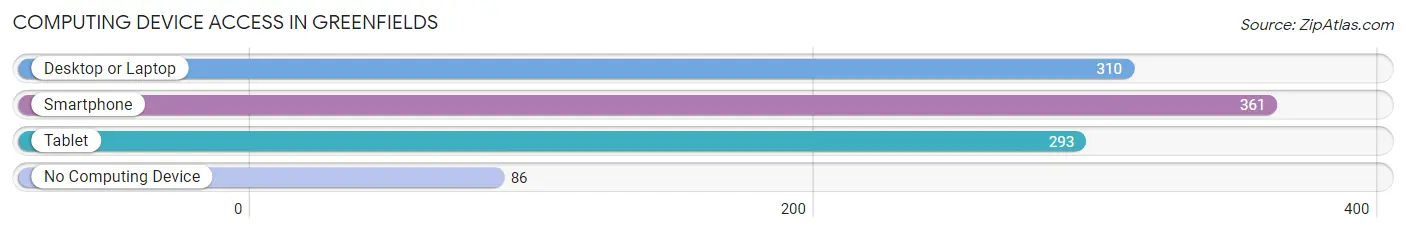
| Device Type | # Households | % Households |
| Desktop or Laptop | 310 | 65.3% |
| Smartphone | 361 | 76.0% |
| Tablet | 293 | 61.7% |
| No Computing Device | 86 | 18.1% |
| Total | 475 | 100.0% |
Internet Access in Greenfields
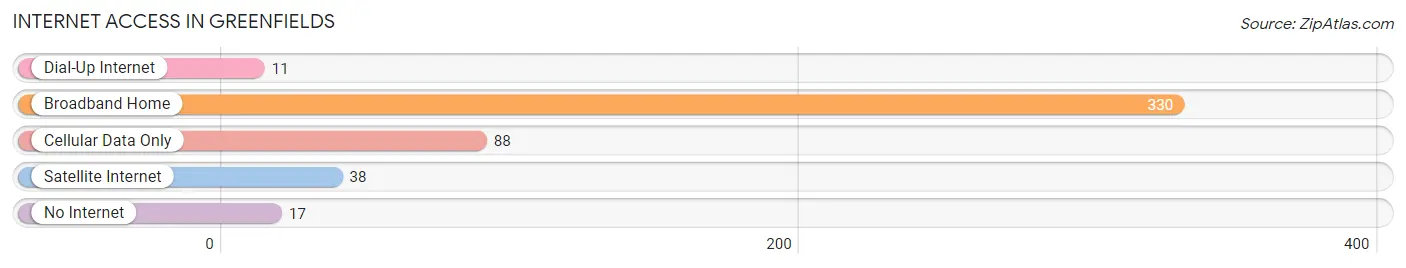
| Internet Type | # Households | % Households |
| Dial-Up Internet | 11 | 2.3% |
| Broadband Home | 330 | 69.5% |
| Cellular Data Only | 88 | 18.5% |
| Satellite Internet | 38 | 8.0% |
| No Internet | 17 | 3.6% |
| Total | 475 | 100.0% |
Greenfields Summary
Greenfields, Pennsylvania is a small borough located in the southwestern corner of the state. It is situated in the foothills of the Allegheny Mountains and is part of the greater Pittsburgh metropolitan area. The borough is home to a population of approximately 2,000 people and is known for its rural charm and small-town atmosphere.
History
Greenfields was founded in 1817 by a group of settlers from the nearby town of Greensburg. The settlers were looking for a place to call home and found the area to be ideal for farming and raising livestock. The town was originally called “Greenfield” but was later changed to “Greenfields” to avoid confusion with another town in the area.
The town grew slowly but steadily over the years, and by the late 19th century, it had become a thriving agricultural community. The town was home to several small businesses, including a general store, a blacksmith, and a sawmill. The town also had a post office, a school, and a church.
In the early 20th century, the town began to experience a period of growth and development. The population increased, and new businesses opened, including a bank, a movie theater, and a hotel. The town also had a trolley line that connected it to the nearby city of Pittsburgh.
Geography
Greenfields is located in the southwestern corner of Pennsylvania, in the foothills of the Allegheny Mountains. The borough is situated on the banks of the Youghiogheny River, which flows through the area. The borough is bordered by the towns of Greensburg, Westmoreland County, and New Stanton.
The borough is home to several parks and recreational areas, including the Greenfields Community Park, which features a playground, a basketball court, and a picnic pavilion. The borough also has several hiking trails, including the Youghiogheny River Trail, which runs along the river.
Economy
Greenfields is a small, rural community with a largely agricultural economy. The town is home to several farms, which produce a variety of crops, including corn, soybeans, and wheat. The town also has several small businesses, including a general store, a hardware store, and a restaurant.
The town is also home to several manufacturing companies, including a plastics factory and a metal fabrication plant. The town is also home to a small airport, which serves the surrounding area.
Demographics
As of the 2010 census, the population of Greenfields was 2,000. The population is largely white (95.2%), with small percentages of African American (2.2%), Asian (0.8%), and Hispanic (1.8%) residents. The median household income is $45,000, and the median home value is $150,000.
The town is served by the Greenfields School District, which includes two elementary schools, a middle school, and a high school. The town is also home to several churches, including the Greenfields United Methodist Church and the Greenfields Presbyterian Church.
Conclusion
Greenfields, Pennsylvania is a small borough located in the southwestern corner of the state. It is situated in the foothills of the Allegheny Mountains and is part of the greater Pittsburgh metropolitan area. The borough is home to a population of approximately 2,000 people and is known for its rural charm and small-town atmosphere. The town has a largely agricultural economy, with several farms and small businesses. The population is largely white, with small percentages of African American, Asian, and Hispanic residents. The town is served by the Greenfields School District and is home to several churches.
Common Questions
What is the Total Population of Greenfields?
Total Population of Greenfields is 957.
What is the Total Male Population of Greenfields?
Total Male Population of Greenfields is 435.
What is the Total Female Population of Greenfields?
Total Female Population of Greenfields is 522.
What is the Ratio of Males per 100 Females in Greenfields?
There are 83.33 Males per 100 Females in Greenfields.
What is the Ratio of Females per 100 Males in Greenfields?
There are 120.00 Females per 100 Males in Greenfields.
What is the Median Population Age in Greenfields?
Median Population Age in Greenfields is 61.9 Years.
What is the Average Family Size in Greenfields
Average Family Size in Greenfields is 2.5 People.
What is the Average Household Size in Greenfields
Average Household Size in Greenfields is 2.0 People.
What is Per Capita Income in Greenfields?
Per Capita income in Greenfields is $36,079.
What is the Median Family Income in Greenfields?
Median Family Income in Greenfields is $74,620.
What is the Median Household income in Greenfields?
Median Household Income in Greenfields is $60,563.
What is Income or Wage Gap in Greenfields?
Income or Wage Gap in Greenfields is 56.1%.
Women in Greenfields earn 43.9 cents for every dollar earned by a man.
What is Inequality or Gini Index in Greenfields?
Inequality or Gini Index in Greenfields is 0.35.
How Large is the Labor Force in Greenfields?
There are 385 People in the Labor Forcein in Greenfields.
What is the Percentage of People in the Labor Force in Greenfields?
44.2% of People are in the Labor Force in Greenfields.