Skippack, PA
Skippack Map
Skippack Overview
3,854
TOTAL POPULATION
2,065
MALE POPULATION
1,789
FEMALE POPULATION
115.43
MALES / 100 FEMALES
86.63
FEMALES / 100 MALES
42.3
MEDIAN AGE
3.0
AVG FAMILY SIZE
2.7
AVG HOUSEHOLD SIZE
$68,412
PER CAPITA INCOME
$148,016
AVG FAMILY INCOME
$137,806
AVG HOUSEHOLD INCOME
20.0%
WAGE / INCOME GAP [ % ]
80.0¢/ $1
WAGE / INCOME GAP [ $ ]
0.38
INEQUALITY / GINI INDEX
2,242
LABOR FORCE [ PEOPLE ]
70.8%
PERCENT IN LABOR FORCE
1.2%
UNEMPLOYMENT RATE
Skippack Zip Codes
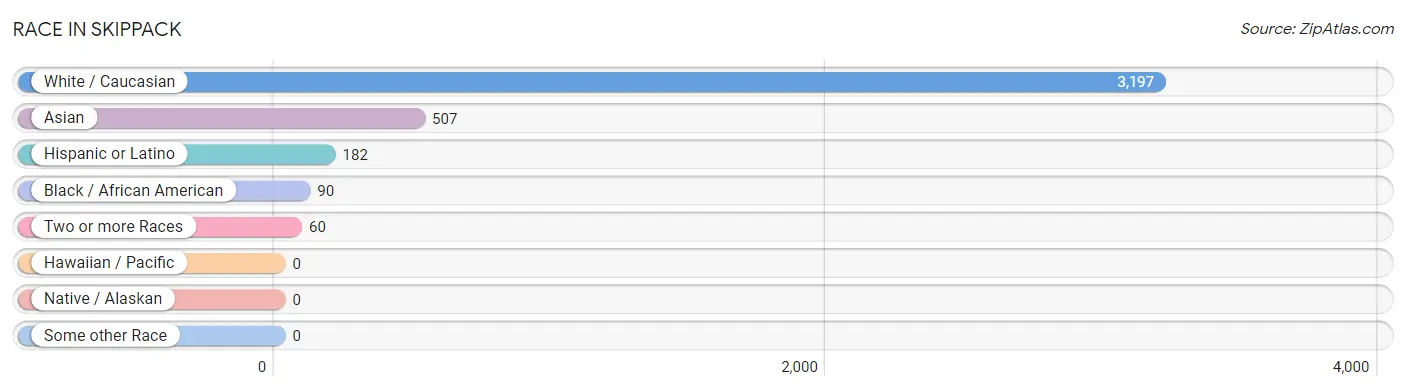
Race in Skippack
The most populous races in Skippack are White / Caucasian (3,197 | 83.0%), Asian (507 | 13.2%), and Hispanic or Latino (182 | 4.7%).
| Race | # Population | % Population |
| Asian | 507 | 13.2% |
| Black / African American | 90 | 2.3% |
| Hawaiian / Pacific | 0 | 0.0% |
| Hispanic or Latino | 182 | 4.7% |
| Native / Alaskan | 0 | 0.0% |
| White / Caucasian | 3,197 | 83.0% |
| Two or more Races | 60 | 1.6% |
| Some other Race | 0 | 0.0% |
| Total | 3,854 | 100.0% |
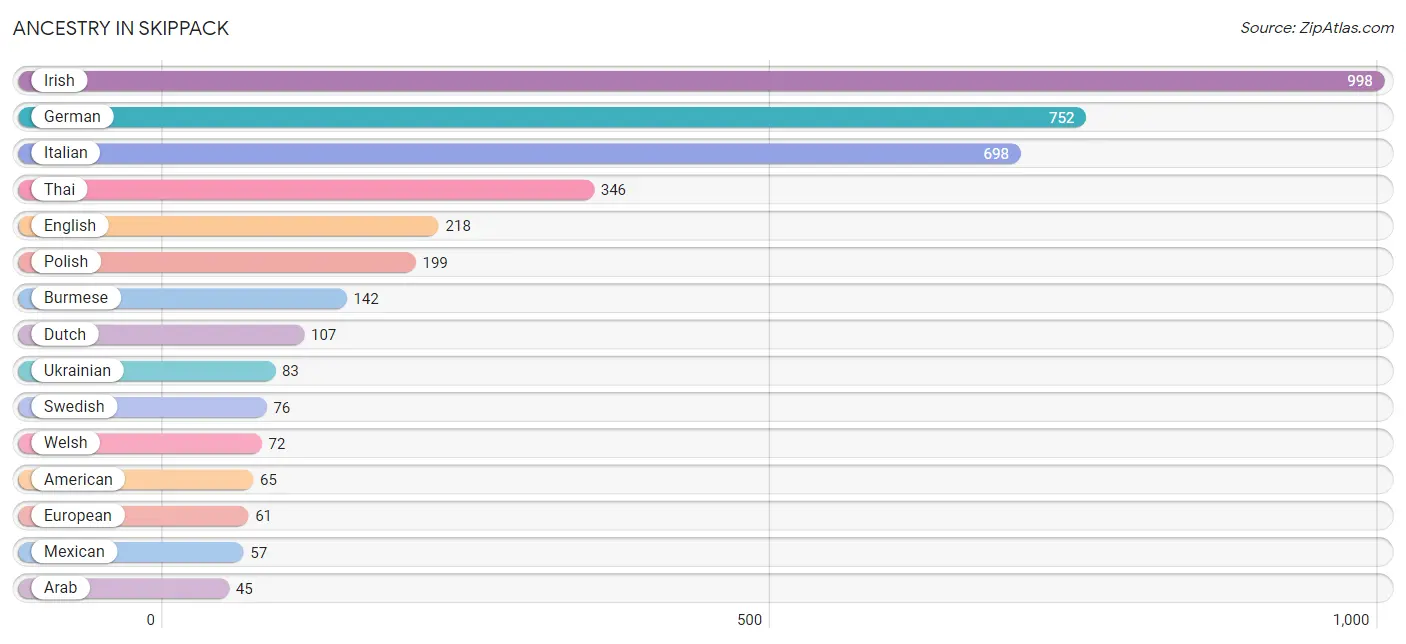
Ancestry in Skippack
The most populous ancestries reported in Skippack are Irish (998 | 25.9%), German (752 | 19.5%), Italian (698 | 18.1%), Thai (346 | 9.0%), and English (218 | 5.7%), together accounting for 78.2% of all Skippack residents.
| Ancestry | # Population | % Population |
| American | 65 | 1.7% |
| Arab | 45 | 1.2% |
| Austrian | 21 | 0.5% |
| British | 27 | 0.7% |
| Burmese | 142 | 3.7% |
| Colombian | 41 | 1.1% |
| Cuban | 7 | 0.2% |
| Czech | 9 | 0.2% |
| Dutch | 107 | 2.8% |
| Eastern European | 15 | 0.4% |
| Egyptian | 45 | 1.2% |
| English | 218 | 5.7% |
| European | 61 | 1.6% |
| French | 21 | 0.5% |
| French Canadian | 37 | 1.0% |
| German | 752 | 19.5% |
| Greek | 32 | 0.8% |
| Hungarian | 44 | 1.1% |
| Indian (Asian) | 9 | 0.2% |
| Irish | 998 | 25.9% |
| Italian | 698 | 18.1% |
| Korean | 10 | 0.3% |
| Mexican | 57 | 1.5% |
| Norwegian | 35 | 0.9% |
| Polish | 199 | 5.2% |
| Russian | 10 | 0.3% |
| Scotch-Irish | 44 | 1.1% |
| Scottish | 21 | 0.5% |
| Slovak | 18 | 0.5% |
| South American | 41 | 1.1% |
| Swedish | 76 | 2.0% |
| Thai | 346 | 9.0% |
| Ukrainian | 83 | 2.1% |
| Welsh | 72 | 1.9% | View All 34 Rows |
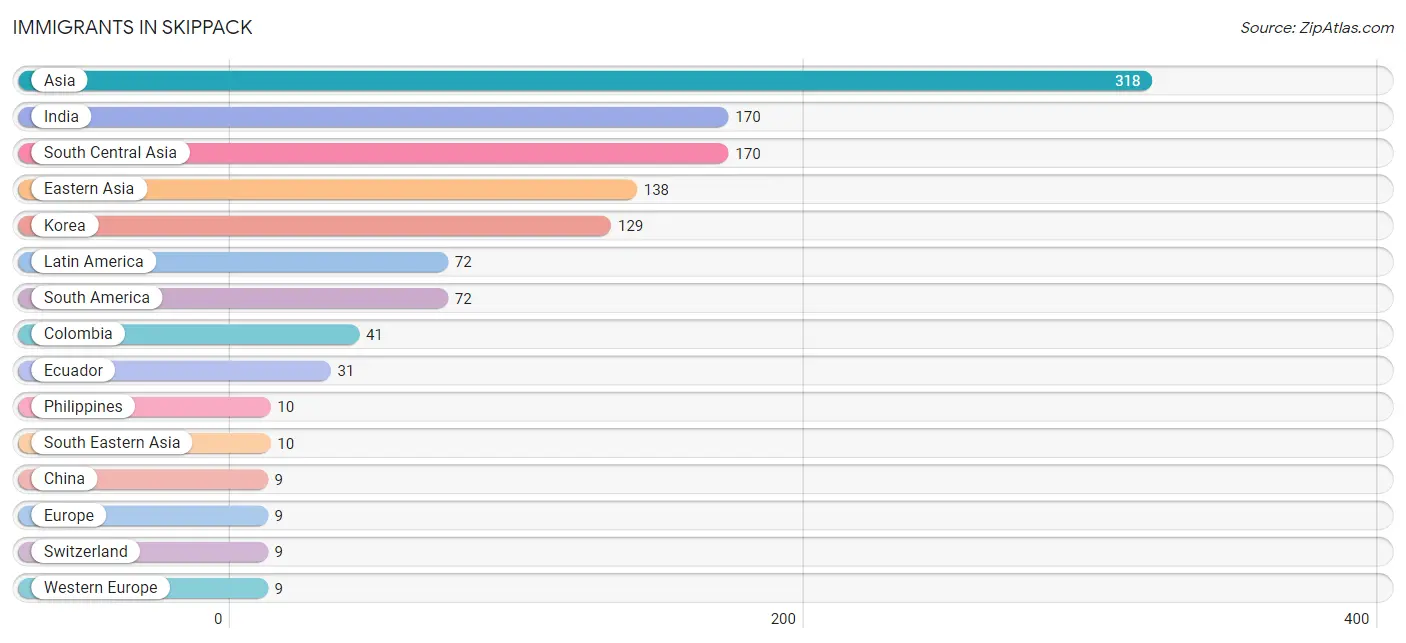
Immigrants in Skippack
The most numerous immigrant groups reported in Skippack came from Asia (318 | 8.3%), India (170 | 4.4%), South Central Asia (170 | 4.4%), Eastern Asia (138 | 3.6%), and Korea (129 | 3.4%), together accounting for 24.0% of all Skippack residents.
| Immigration Origin | # Population | % Population |
| Asia | 318 | 8.3% |
| China | 9 | 0.2% |
| Colombia | 41 | 1.1% |
| Eastern Asia | 138 | 3.6% |
| Ecuador | 31 | 0.8% |
| Europe | 9 | 0.2% |
| India | 170 | 4.4% |
| Korea | 129 | 3.4% |
| Latin America | 72 | 1.9% |
| Philippines | 10 | 0.3% |
| South America | 72 | 1.9% |
| South Central Asia | 170 | 4.4% |
| South Eastern Asia | 10 | 0.3% |
| Switzerland | 9 | 0.2% |
| Western Europe | 9 | 0.2% | View All 15 Rows |
Sex and Age in Skippack
Sex and Age in Skippack
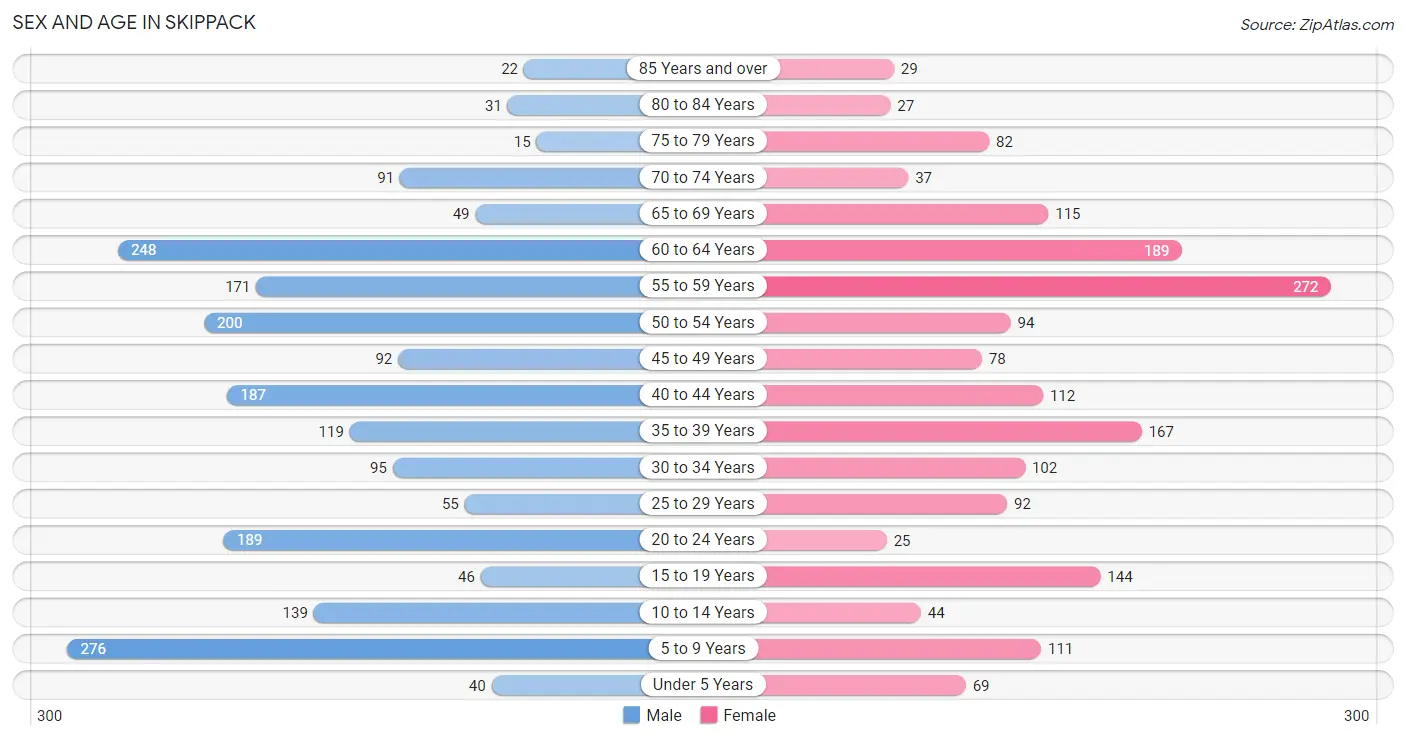
The most populous age groups in Skippack are 5 to 9 Years (276 | 13.4%) for men and 55 to 59 Years (272 | 15.2%) for women.
| Age Bracket | Male | Female |
| Under 5 Years | 40 (1.9%) | 69 (3.9%) |
| 5 to 9 Years | 276 (13.4%) | 111 (6.2%) |
| 10 to 14 Years | 139 (6.7%) | 44 (2.5%) |
| 15 to 19 Years | 46 (2.2%) | 144 (8.1%) |
| 20 to 24 Years | 189 (9.1%) | 25 (1.4%) |
| 25 to 29 Years | 55 (2.7%) | 92 (5.1%) |
| 30 to 34 Years | 95 (4.6%) | 102 (5.7%) |
| 35 to 39 Years | 119 (5.8%) | 167 (9.3%) |
| 40 to 44 Years | 187 (9.1%) | 112 (6.3%) |
| 45 to 49 Years | 92 (4.5%) | 78 (4.4%) |
| 50 to 54 Years | 200 (9.7%) | 94 (5.2%) |
| 55 to 59 Years | 171 (8.3%) | 272 (15.2%) |
| 60 to 64 Years | 248 (12.0%) | 189 (10.6%) |
| 65 to 69 Years | 49 (2.4%) | 115 (6.4%) |
| 70 to 74 Years | 91 (4.4%) | 37 (2.1%) |
| 75 to 79 Years | 15 (0.7%) | 82 (4.6%) |
| 80 to 84 Years | 31 (1.5%) | 27 (1.5%) |
| 85 Years and over | 22 (1.1%) | 29 (1.6%) |
| Total | 2,065 (100.0%) | 1,789 (100.0%) |
Families and Households in Skippack
Median Family Size in Skippack
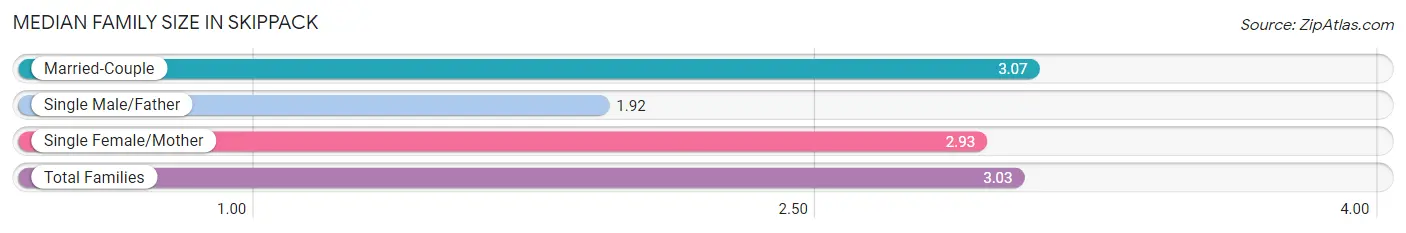
The median family size in Skippack is 3.03 persons per family, with married-couple families (1,025 | 89.5%) accounting for the largest median family size of 3.07 persons per family. On the other hand, single male/father families (36 | 3.1%) represent the smallest median family size with 1.92 persons per family.
| Family Type | # Families | Family Size |
| Married-Couple | 1,025 (89.5%) | 3.07 |
| Single Male/Father | 36 (3.1%) | 1.92 |
| Single Female/Mother | 84 (7.3%) | 2.93 |
| Total Families | 1,145 (100.0%) | 3.03 |
Median Household Size in Skippack
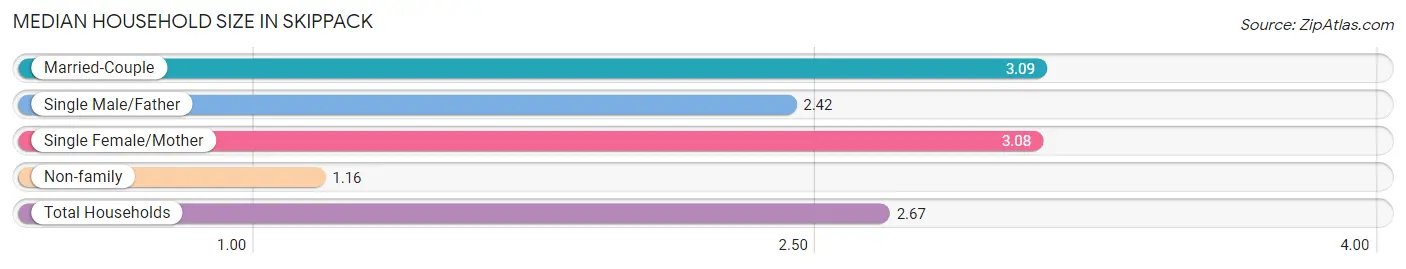
The median household size in Skippack is 2.67 persons per household, with married-couple households (1,025 | 71.1%) accounting for the largest median household size of 3.09 persons per household. non-family households (296 | 20.5%) represent the smallest median household size with 1.16 persons per household.
| Household Type | # Households | Household Size |
| Married-Couple | 1,025 (71.1%) | 3.09 |
| Single Male/Father | 36 (2.5%) | 2.42 |
| Single Female/Mother | 84 (5.8%) | 3.08 |
| Non-family | 296 (20.5%) | 1.16 |
| Total Households | 1,441 (100.0%) | 2.67 |
Household Size by Marriage Status in Skippack
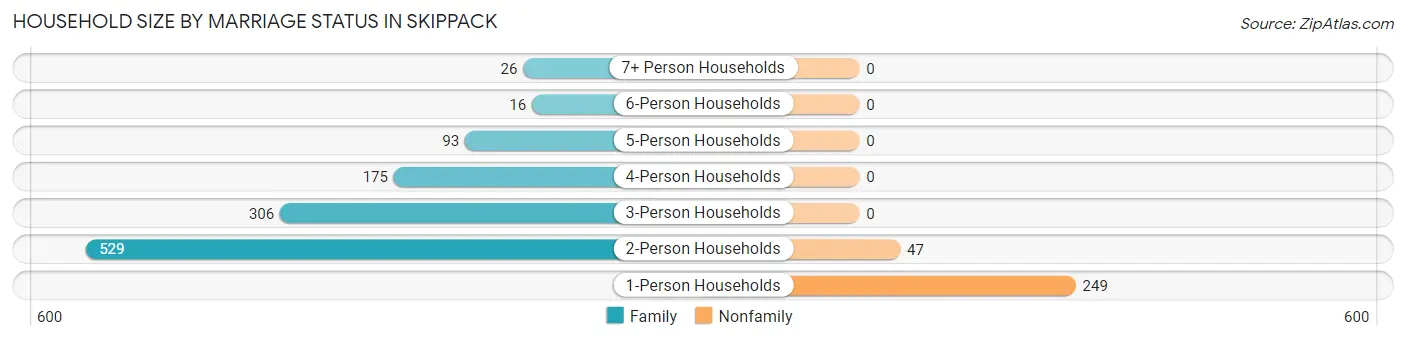
Out of a total of 1,441 households in Skippack, 1,145 (79.5%) are family households, while 296 (20.5%) are nonfamily households. The most numerous type of family households are 2-person households, comprising 529, and the most common type of nonfamily households are 1-person households, comprising 249.
| Household Size | Family Households | Nonfamily Households |
| 1-Person Households | - | 249 (17.3%) |
| 2-Person Households | 529 (36.7%) | 47 (3.3%) |
| 3-Person Households | 306 (21.2%) | 0 (0.0%) |
| 4-Person Households | 175 (12.1%) | 0 (0.0%) |
| 5-Person Households | 93 (6.5%) | 0 (0.0%) |
| 6-Person Households | 16 (1.1%) | 0 (0.0%) |
| 7+ Person Households | 26 (1.8%) | 0 (0.0%) |
| Total | 1,145 (79.5%) | 296 (20.5%) |
Female Fertility in Skippack
Fertility by Age in Skippack
Average fertility rate in Skippack is 56.0 births per 1,000 women. Women in the age bracket of 20 to 34 years have the highest fertility rate with 187.0 births per 1,000 women. Women in the age bracket of 20 to 34 years acount for 100.0% of all women with births.
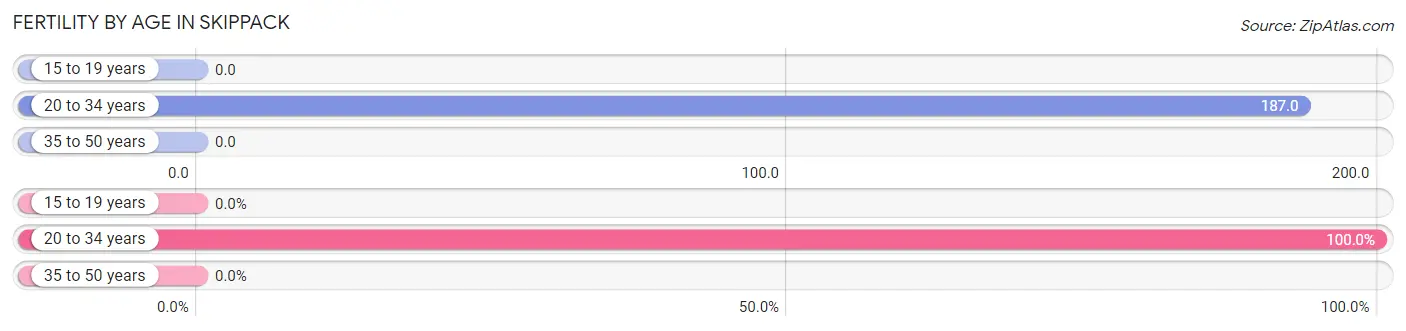
| Age Bracket | Women with Births | Births / 1,000 Women |
| 15 to 19 years | 0 (0.0%) | 0.0 |
| 20 to 34 years | 41 (100.0%) | 187.0 |
| 35 to 50 years | 0 (0.0%) | 0.0 |
| Total | 41 (100.0%) | 56.0 |
Fertility by Age by Marriage Status in Skippack
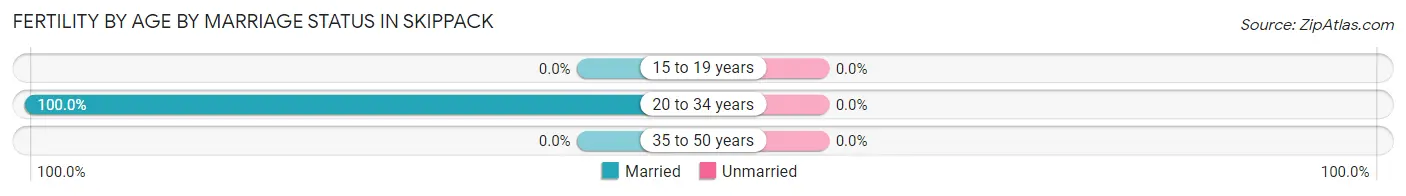
| Age Bracket | Married | Unmarried |
| 15 to 19 years | 0 (0.0%) | 0 (0.0%) |
| 20 to 34 years | 41 (100.0%) | 0 (0.0%) |
| 35 to 50 years | 0 (0.0%) | 0 (0.0%) |
| Total | 41 (100.0%) | 0 (0.0%) |
Fertility by Education in Skippack
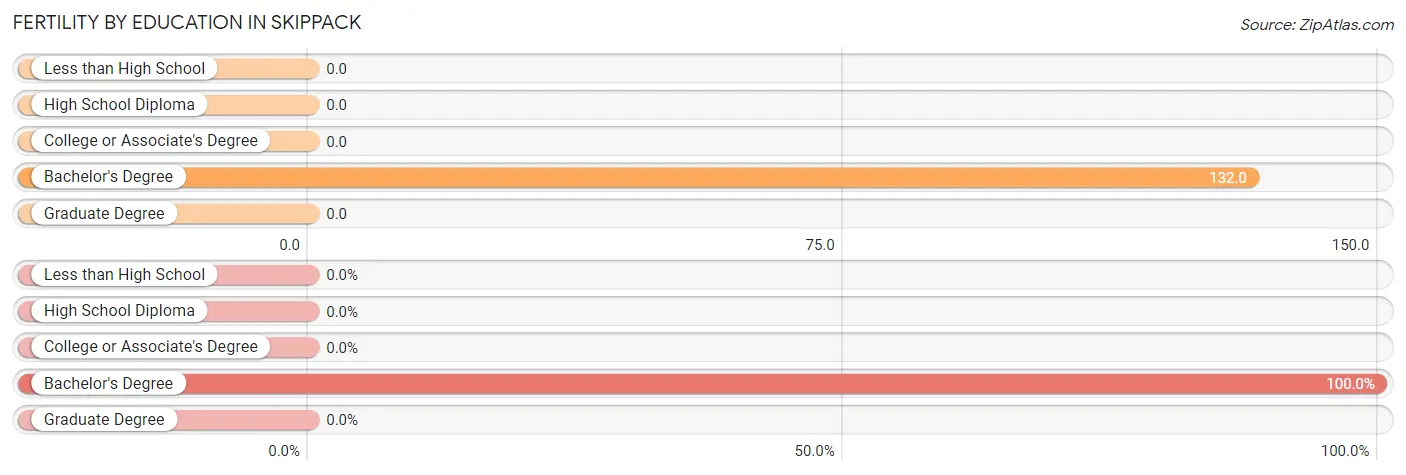
| Educational Attainment | Women with Births | Births / 1,000 Women |
| Less than High School | 0 (0.0%) | 0.0 |
| High School Diploma | 0 (0.0%) | 0.0 |
| College or Associate's Degree | 0 (0.0%) | 0.0 |
| Bachelor's Degree | 41 (100.0%) | 132.0 |
| Graduate Degree | 0 (0.0%) | 0.0 |
| Total | 41 (100.0%) | 56.0 |
Fertility by Education by Marriage Status in Skippack
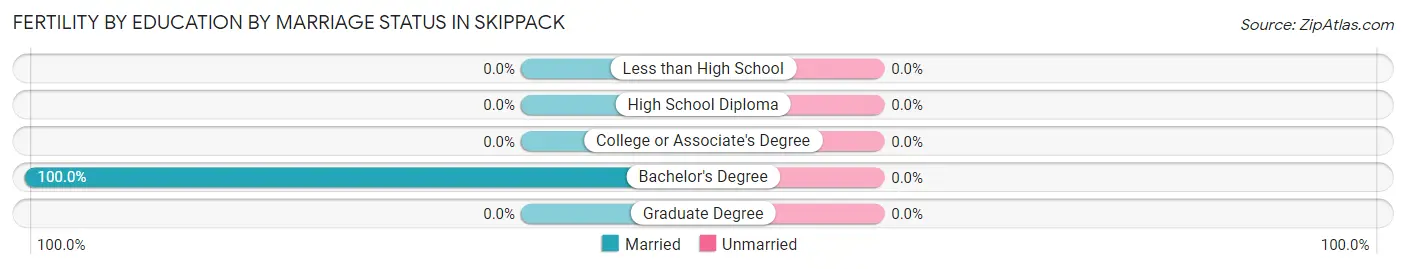
| Educational Attainment | Married | Unmarried |
| Less than High School | 0 (0.0%) | 0 (0.0%) |
| High School Diploma | 0 (0.0%) | 0 (0.0%) |
| College or Associate's Degree | 0 (0.0%) | 0 (0.0%) |
| Bachelor's Degree | 41 (100.0%) | 0 (0.0%) |
| Graduate Degree | 0 (0.0%) | 0 (0.0%) |
| Total | 41 (100.0%) | 0 (0.0%) |
Income in Skippack
Income Overview in Skippack
Per Capita Income in Skippack is $68,412, while median incomes of families and households are $148,016 and $137,806 respectively.
| Characteristic | Number | Measure |
| Per Capita Income | 3,854 | $68,412 |
| Median Family Income | 1,145 | $148,016 |
| Mean Family Income | 1,145 | $197,285 |
| Median Household Income | 1,441 | $137,806 |
| Mean Household Income | 1,441 | $183,749 |
| Income Deficit | 1,145 | $0 |
| Wage / Income Gap (%) | 3,854 | 20.04% |
| Wage / Income Gap ($) | 3,854 | 79.96¢ per $1 |
| Gini / Inequality Index | 3,854 | 0.38 |
Earnings by Sex in Skippack
Average Earnings in Skippack are $76,509, $85,473 for men and $68,342 for women, a difference of 20.0%.
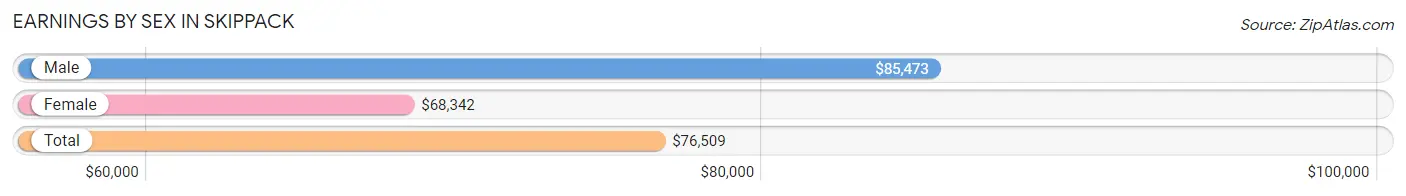
| Sex | Number | Average Earnings |
| Male | 1,227 (52.5%) | $85,473 |
| Female | 1,109 (47.5%) | $68,342 |
| Total | 2,336 (100.0%) | $76,509 |
Earnings by Sex by Income Bracket in Skippack
The most common earnings brackets in Skippack are $100,000+ for men (501 | 40.8%) and $100,000+ for women (313 | 28.2%).
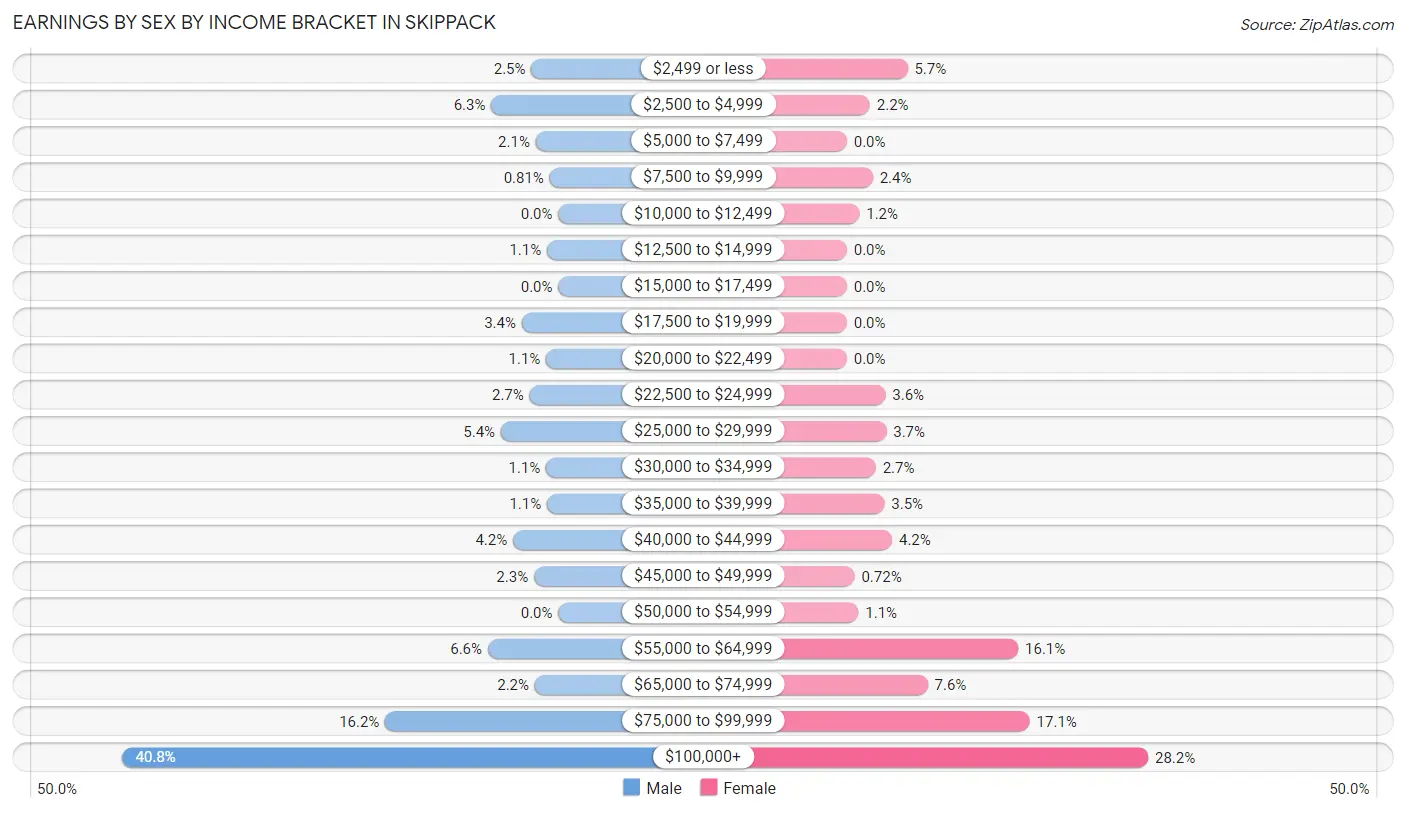
| Income | Male | Female |
| $2,499 or less | 31 (2.5%) | 63 (5.7%) |
| $2,500 to $4,999 | 77 (6.3%) | 24 (2.2%) |
| $5,000 to $7,499 | 26 (2.1%) | 0 (0.0%) |
| $7,500 to $9,999 | 10 (0.8%) | 27 (2.4%) |
| $10,000 to $12,499 | 0 (0.0%) | 13 (1.2%) |
| $12,500 to $14,999 | 13 (1.1%) | 0 (0.0%) |
| $15,000 to $17,499 | 0 (0.0%) | 0 (0.0%) |
| $17,500 to $19,999 | 42 (3.4%) | 0 (0.0%) |
| $20,000 to $22,499 | 14 (1.1%) | 0 (0.0%) |
| $22,500 to $24,999 | 33 (2.7%) | 40 (3.6%) |
| $25,000 to $29,999 | 66 (5.4%) | 41 (3.7%) |
| $30,000 to $34,999 | 14 (1.1%) | 30 (2.7%) |
| $35,000 to $39,999 | 13 (1.1%) | 39 (3.5%) |
| $40,000 to $44,999 | 52 (4.2%) | 47 (4.2%) |
| $45,000 to $49,999 | 28 (2.3%) | 8 (0.7%) |
| $50,000 to $54,999 | 0 (0.0%) | 12 (1.1%) |
| $55,000 to $64,999 | 81 (6.6%) | 178 (16.1%) |
| $65,000 to $74,999 | 27 (2.2%) | 84 (7.6%) |
| $75,000 to $99,999 | 199 (16.2%) | 190 (17.1%) |
| $100,000+ | 501 (40.8%) | 313 (28.2%) |
| Total | 1,227 (100.0%) | 1,109 (100.0%) |
Earnings by Sex by Educational Attainment in Skippack
Average earnings in Skippack are $110,735 for men and $75,977 for women, a difference of 31.4%. Men with an educational attainment of graduate degree enjoy the highest average annual earnings of $178,750, while those with high school diploma education earn the least with $58,875. Women with an educational attainment of graduate degree earn the most with the average annual earnings of $91,806, while those with college or associate's degree education have the smallest earnings of $61,302.
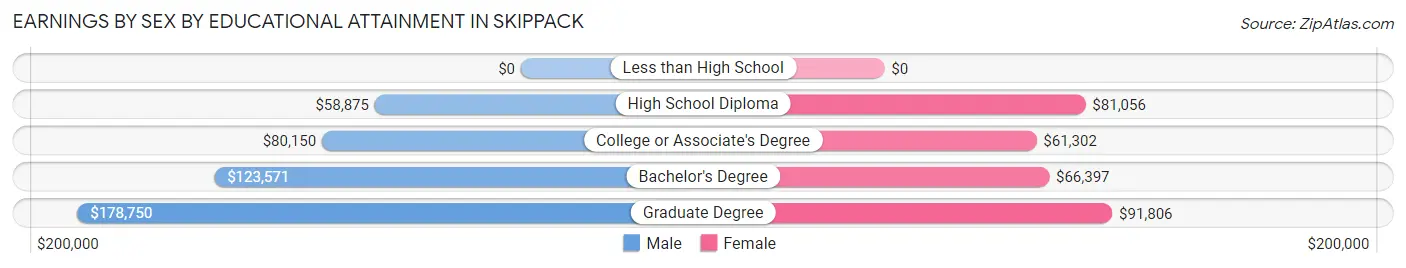
| Educational Attainment | Male Income | Female Income |
| Less than High School | - | - |
| High School Diploma | $58,875 | $81,056 |
| College or Associate's Degree | $80,150 | $61,302 |
| Bachelor's Degree | $123,571 | $66,397 |
| Graduate Degree | $178,750 | $91,806 |
| Total | $110,735 | $75,977 |
Family Income in Skippack
Family Income Brackets in Skippack
According to the Skippack family income data, there are 372 families falling into the $100,000 to $149,999 income range, which is the most common income bracket and makes up 32.5% of all families.
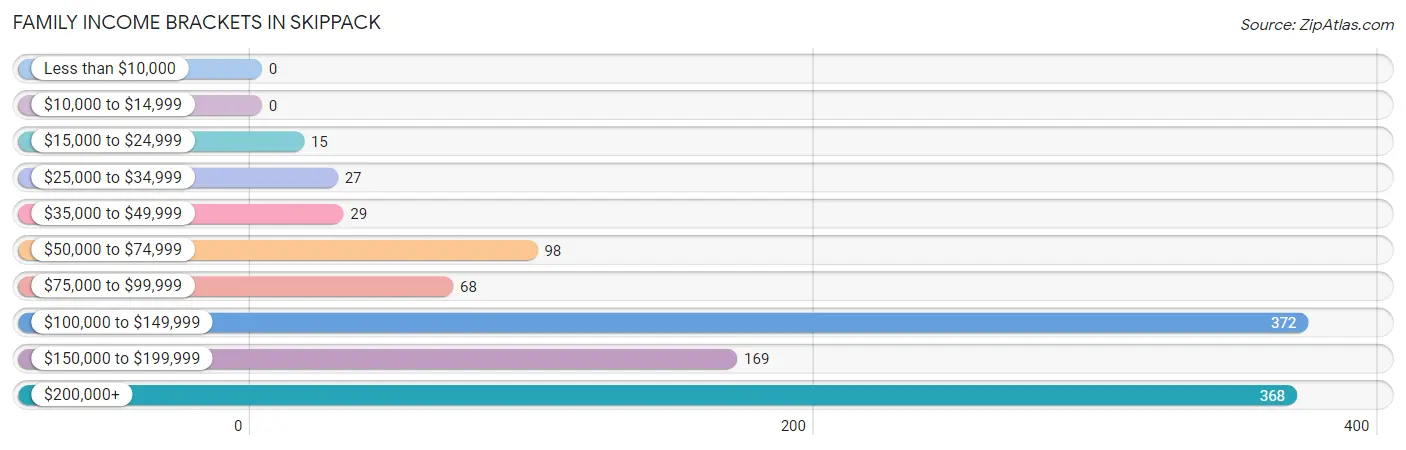
| Income Bracket | # Families | % Families |
| Less than $10,000 | 0 | 0.0% |
| $10,000 to $14,999 | 0 | 0.0% |
| $15,000 to $24,999 | 15 | 1.3% |
| $25,000 to $34,999 | 27 | 2.4% |
| $35,000 to $49,999 | 29 | 2.5% |
| $50,000 to $74,999 | 98 | 8.6% |
| $75,000 to $99,999 | 68 | 5.9% |
| $100,000 to $149,999 | 372 | 32.5% |
| $150,000 to $199,999 | 169 | 14.8% |
| $200,000+ | 368 | 32.1% |
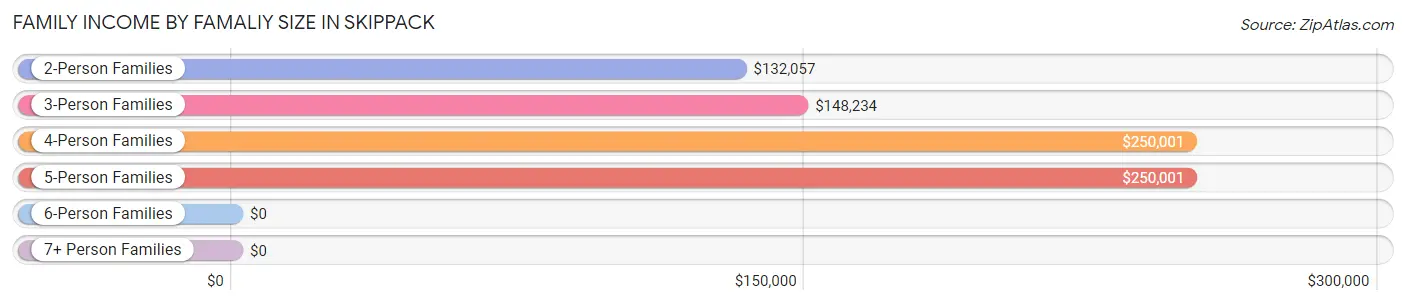
Family Income by Famaliy Size in Skippack
4-person families (168 | 14.7%) account for the highest median family income in Skippack with $250,001 per family, while 2-person families (539 | 47.1%) have the highest median income of $66,028 per family member.
| Income Bracket | # Families | Median Income |
| 2-Person Families | 539 (47.1%) | $132,057 |
| 3-Person Families | 317 (27.7%) | $148,234 |
| 4-Person Families | 168 (14.7%) | $250,001 |
| 5-Person Families | 79 (6.9%) | $250,001 |
| 6-Person Families | 16 (1.4%) | $0 |
| 7+ Person Families | 26 (2.3%) | $0 |
| Total | 1,145 (100.0%) | $148,016 |
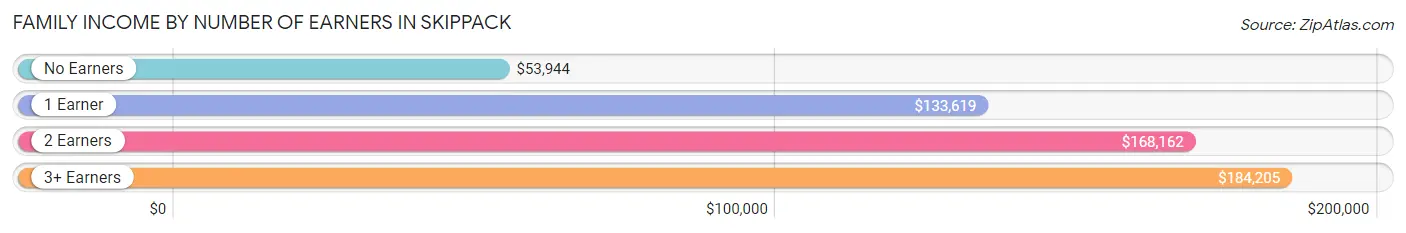
Family Income by Number of Earners in Skippack
The median family income in Skippack is $148,016, with families comprising 3+ earners (199) having the highest median family income of $184,205, while families with no earners (114) have the lowest median family income of $53,944, accounting for 17.4% and 10.0% of families, respectively.
| Number of Earners | # Families | Median Income |
| No Earners | 114 (10.0%) | $53,944 |
| 1 Earner | 275 (24.0%) | $133,619 |
| 2 Earners | 557 (48.6%) | $168,162 |
| 3+ Earners | 199 (17.4%) | $184,205 |
| Total | 1,145 (100.0%) | $148,016 |
Household Income in Skippack
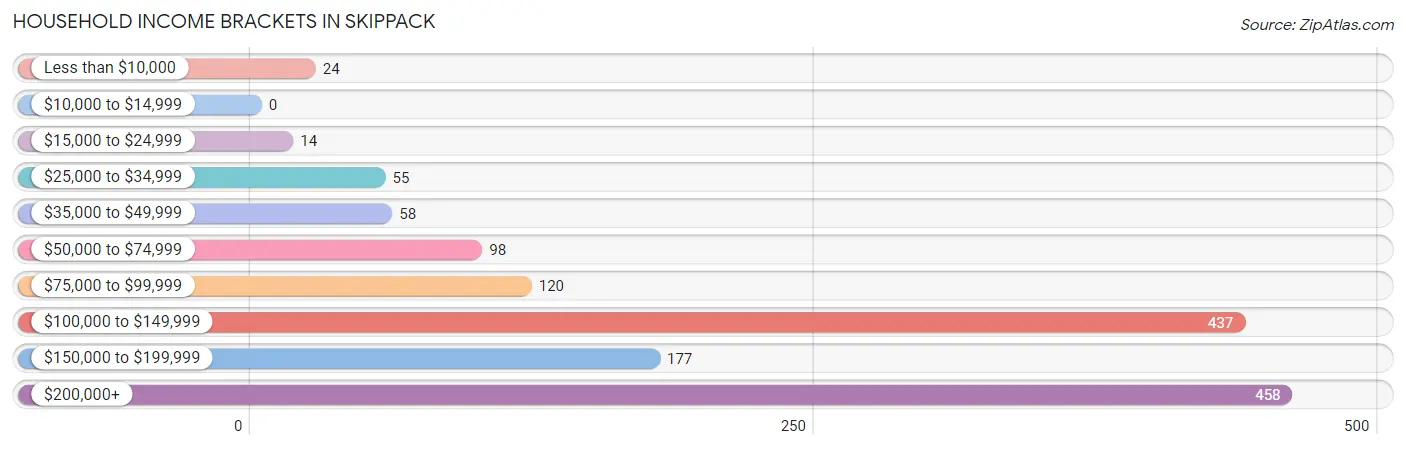
Household Income Brackets in Skippack
With 458 households falling in the category, the $200,000+ income range is the most frequent in Skippack, accounting for 31.8% of all households.
| Income Bracket | # Households | % Households |
| Less than $10,000 | 24 | 1.7% |
| $10,000 to $14,999 | 0 | 0.0% |
| $15,000 to $24,999 | 14 | 1.0% |
| $25,000 to $34,999 | 55 | 3.8% |
| $35,000 to $49,999 | 58 | 4.0% |
| $50,000 to $74,999 | 98 | 6.8% |
| $75,000 to $99,999 | 120 | 8.3% |
| $100,000 to $149,999 | 437 | 30.3% |
| $150,000 to $199,999 | 177 | 12.3% |
| $200,000+ | 458 | 31.8% |
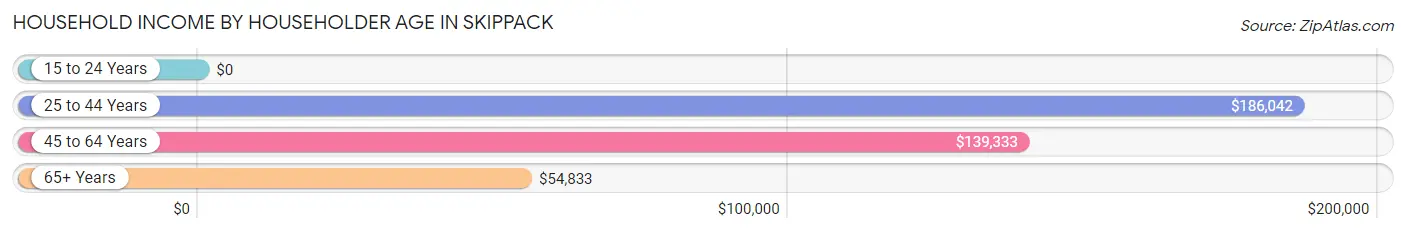
Household Income by Householder Age in Skippack
The median household income in Skippack is $137,806, with the highest median household income of $186,042 found in the 25 to 44 years age bracket for the primary householder. A total of 411 households (28.5%) fall into this category.
| Income Bracket | # Households | Median Income |
| 15 to 24 Years | 0 (0.0%) | $0 |
| 25 to 44 Years | 411 (28.5%) | $186,042 |
| 45 to 64 Years | 726 (50.4%) | $139,333 |
| 65+ Years | 304 (21.1%) | $54,833 |
| Total | 1,441 (100.0%) | $137,806 |
Poverty in Skippack
Income Below Poverty by Sex and Age in Skippack
With 1.2% poverty level for males and 2.2% for females among the residents of Skippack, 75 year old and over males and 75 year old and over females are the most vulnerable to poverty, with 15 males (22.1%) and 25 females (18.1%) in their respective age groups living below the poverty level.
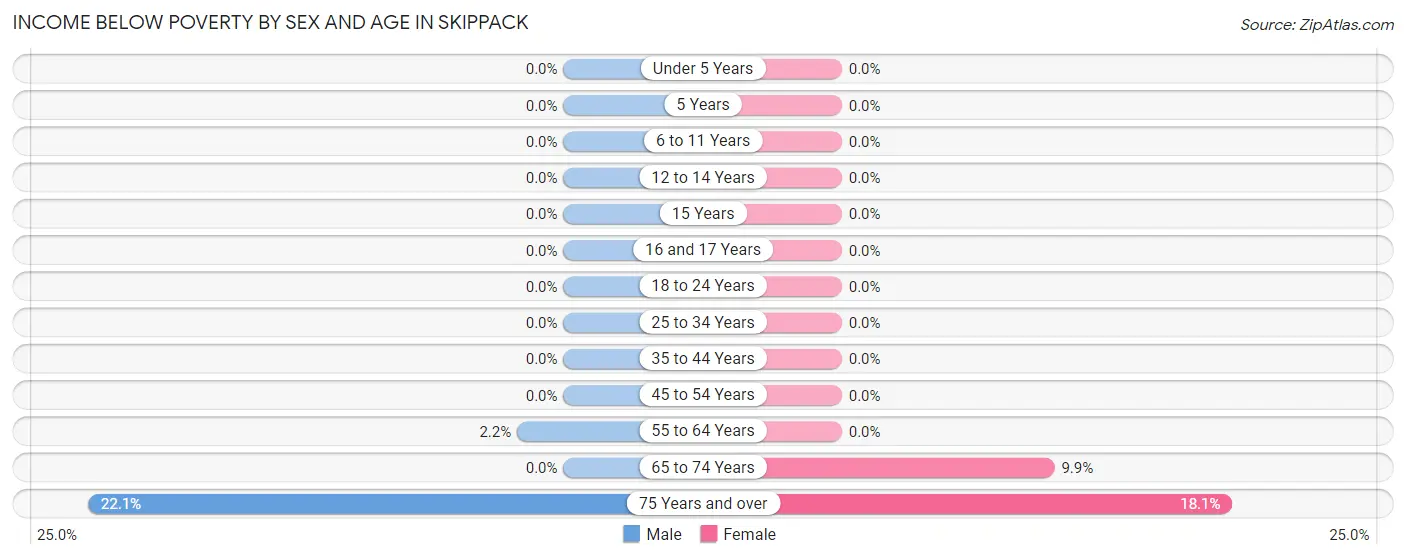
| Age Bracket | Male | Female |
| Under 5 Years | 0 (0.0%) | 0 (0.0%) |
| 5 Years | 0 (0.0%) | 0 (0.0%) |
| 6 to 11 Years | 0 (0.0%) | 0 (0.0%) |
| 12 to 14 Years | 0 (0.0%) | 0 (0.0%) |
| 15 Years | 0 (0.0%) | 0 (0.0%) |
| 16 and 17 Years | 0 (0.0%) | 0 (0.0%) |
| 18 to 24 Years | 0 (0.0%) | 0 (0.0%) |
| 25 to 34 Years | 0 (0.0%) | 0 (0.0%) |
| 35 to 44 Years | 0 (0.0%) | 0 (0.0%) |
| 45 to 54 Years | 0 (0.0%) | 0 (0.0%) |
| 55 to 64 Years | 9 (2.1%) | 0 (0.0%) |
| 65 to 74 Years | 0 (0.0%) | 15 (9.9%) |
| 75 Years and over | 15 (22.1%) | 25 (18.1%) |
| Total | 24 (1.2%) | 40 (2.2%) |
Income Above Poverty by Sex and Age in Skippack
According to the poverty statistics in Skippack, males aged under 5 years and females aged under 5 years are the age groups that are most secure financially, with 100.0% of males and 100.0% of females in these age groups living above the poverty line.
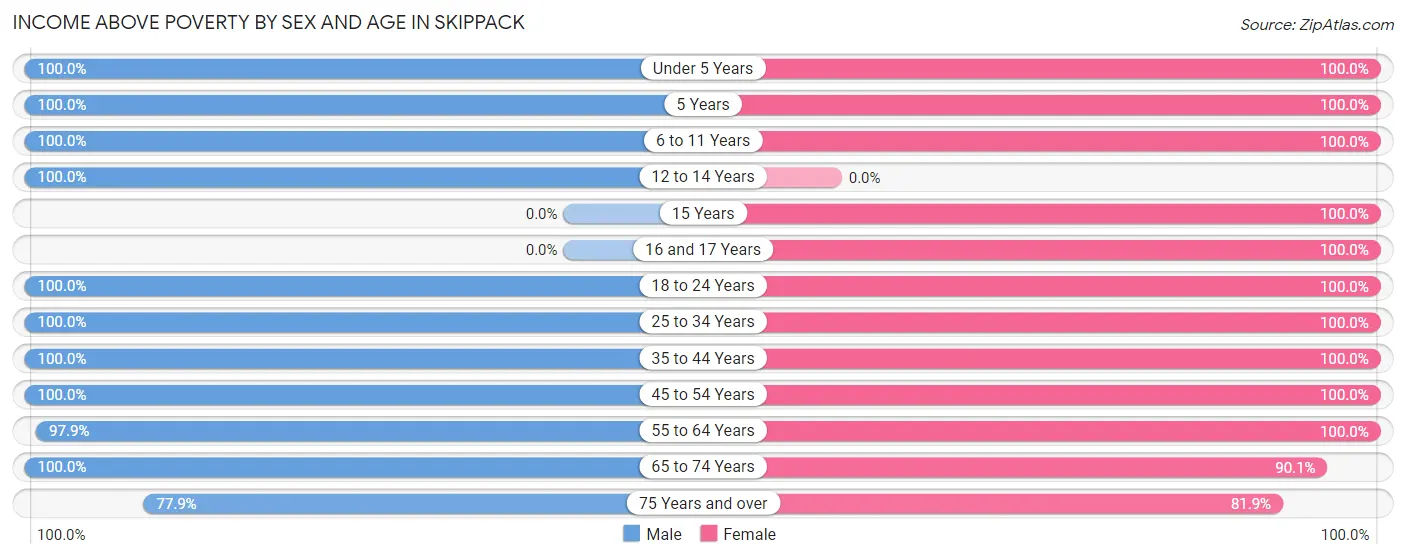
| Age Bracket | Male | Female |
| Under 5 Years | 40 (100.0%) | 69 (100.0%) |
| 5 Years | 6 (100.0%) | 34 (100.0%) |
| 6 to 11 Years | 389 (100.0%) | 112 (100.0%) |
| 12 to 14 Years | 20 (100.0%) | 0 (0.0%) |
| 15 Years | 0 (0.0%) | 9 (100.0%) |
| 16 and 17 Years | 0 (0.0%) | 73 (100.0%) |
| 18 to 24 Years | 235 (100.0%) | 87 (100.0%) |
| 25 to 34 Years | 150 (100.0%) | 194 (100.0%) |
| 35 to 44 Years | 306 (100.0%) | 279 (100.0%) |
| 45 to 54 Years | 292 (100.0%) | 172 (100.0%) |
| 55 to 64 Years | 410 (97.9%) | 461 (100.0%) |
| 65 to 74 Years | 140 (100.0%) | 137 (90.1%) |
| 75 Years and over | 53 (77.9%) | 113 (81.9%) |
| Total | 2,041 (98.8%) | 1,740 (97.8%) |
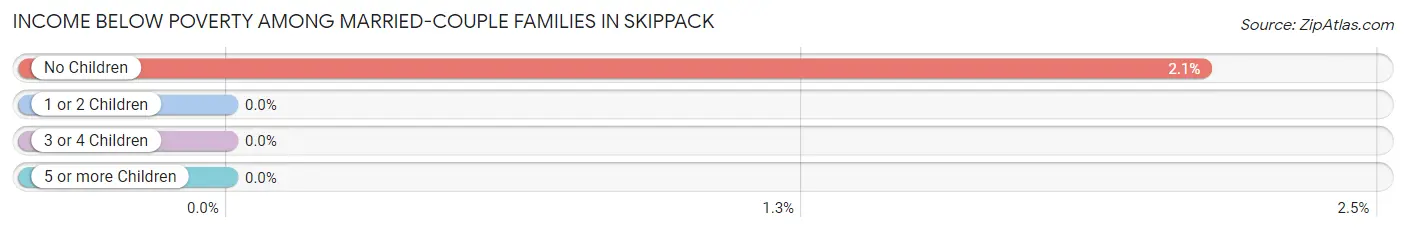
Income Below Poverty Among Married-Couple Families in Skippack
The poverty statistics for married-couple families in Skippack show that 1.5% or 15 of the total 1,025 families live below the poverty line. Families with no children have the highest poverty rate of 2.1%, comprising of 15 families. On the other hand, families with 1 or 2 children have the lowest poverty rate of 0.0%, which includes 0 families.
| Children | Above Poverty | Below Poverty |
| No Children | 693 (97.9%) | 15 (2.1%) |
| 1 or 2 Children | 215 (100.0%) | 0 (0.0%) |
| 3 or 4 Children | 76 (100.0%) | 0 (0.0%) |
| 5 or more Children | 26 (100.0%) | 0 (0.0%) |
| Total | 1,010 (98.5%) | 15 (1.5%) |
Income Below Poverty Among Single-Parent Households in Skippack
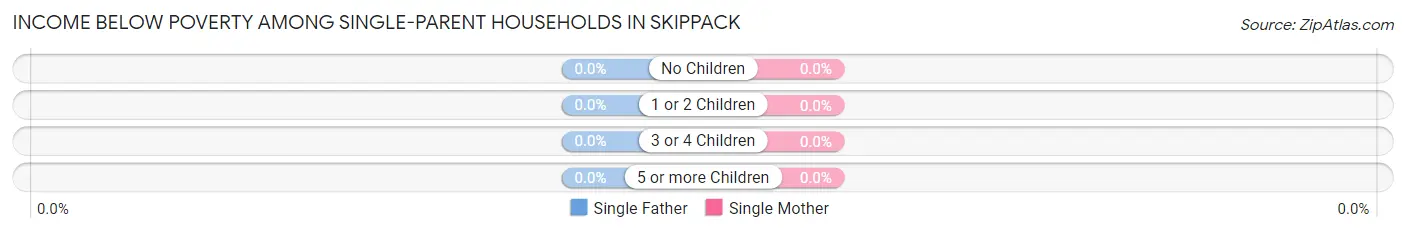
| Children | Single Father | Single Mother |
| No Children | 0 (0.0%) | 0 (0.0%) |
| 1 or 2 Children | 0 (0.0%) | 0 (0.0%) |
| 3 or 4 Children | 0 (0.0%) | 0 (0.0%) |
| 5 or more Children | 0 (0.0%) | 0 (0.0%) |
| Total | 0 (0.0%) | 0 (0.0%) |
Income Below Poverty Among Married-Couple vs Single-Parent Households in Skippack
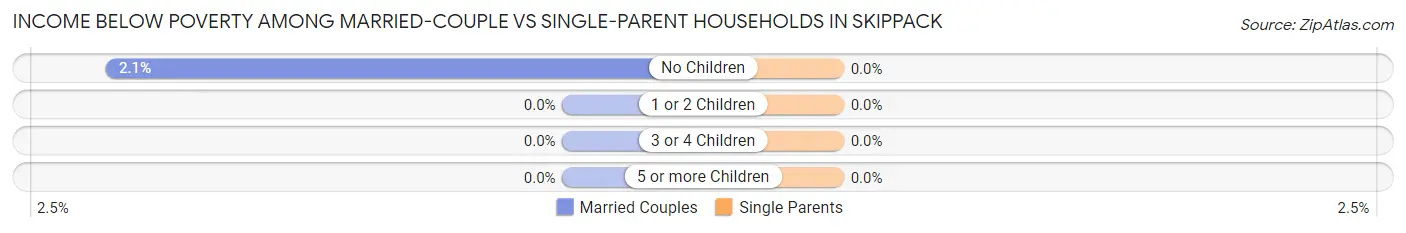
| Children | Married-Couple Families | Single-Parent Households |
| No Children | 15 (2.1%) | 0 (0.0%) |
| 1 or 2 Children | 0 (0.0%) | 0 (0.0%) |
| 3 or 4 Children | 0 (0.0%) | 0 (0.0%) |
| 5 or more Children | 0 (0.0%) | 0 (0.0%) |
| Total | 15 (1.5%) | 0 (0.0%) |
Employment Characteristics in Skippack
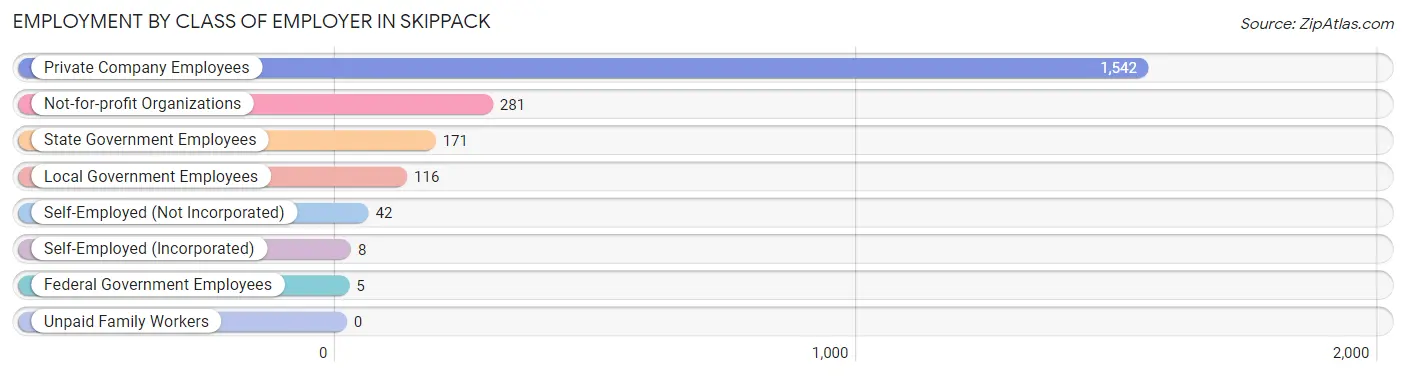
Employment by Class of Employer in Skippack
Among the 2,165 employed individuals in Skippack, private company employees (1,542 | 71.2%), not-for-profit organizations (281 | 13.0%), and state government employees (171 | 7.9%) make up the most common classes of employment.
| Employer Class | # Employees | % Employees |
| Private Company Employees | 1,542 | 71.2% |
| Self-Employed (Incorporated) | 8 | 0.4% |
| Self-Employed (Not Incorporated) | 42 | 1.9% |
| Not-for-profit Organizations | 281 | 13.0% |
| Local Government Employees | 116 | 5.4% |
| State Government Employees | 171 | 7.9% |
| Federal Government Employees | 5 | 0.2% |
| Unpaid Family Workers | 0 | 0.0% |
| Total | 2,165 | 100.0% |
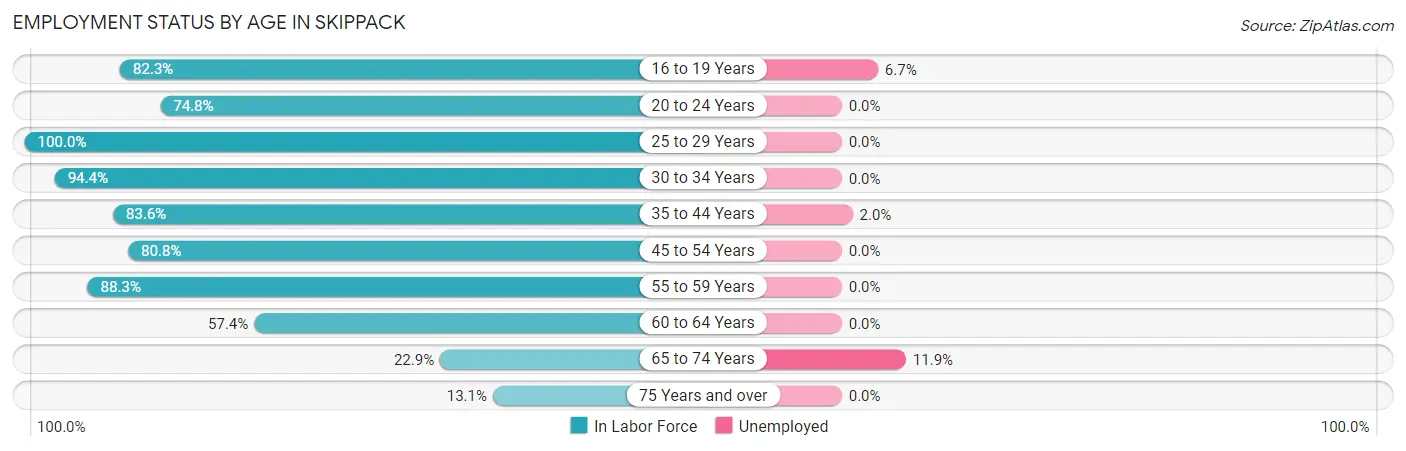
Employment Status by Age in Skippack
According to the labor force statistics for Skippack, out of the total population over 16 years of age (3,166), 70.8% or 2,242 individuals are in the labor force, with 1.2% or 27 of them unemployed. The age group with the highest labor force participation rate is 25 to 29 years, with 100.0% or 147 individuals in the labor force. Within the labor force, the 65 to 74 years age range has the highest percentage of unemployed individuals, with 11.9% or 8 of them being unemployed.
| Age Bracket | In Labor Force | Unemployed |
| 16 to 19 Years | 149 (82.3%) | 10 (6.7%) |
| 20 to 24 Years | 160 (74.8%) | 0 (0.0%) |
| 25 to 29 Years | 147 (100.0%) | 0 (0.0%) |
| 30 to 34 Years | 186 (94.4%) | 0 (0.0%) |
| 35 to 44 Years | 489 (83.6%) | 10 (2.0%) |
| 45 to 54 Years | 375 (80.8%) | 0 (0.0%) |
| 55 to 59 Years | 391 (88.3%) | 0 (0.0%) |
| 60 to 64 Years | 251 (57.4%) | 0 (0.0%) |
| 65 to 74 Years | 67 (22.9%) | 8 (11.9%) |
| 75 Years and over | 27 (13.1%) | 0 (0.0%) |
| Total | 2,242 (70.8%) | 27 (1.2%) |
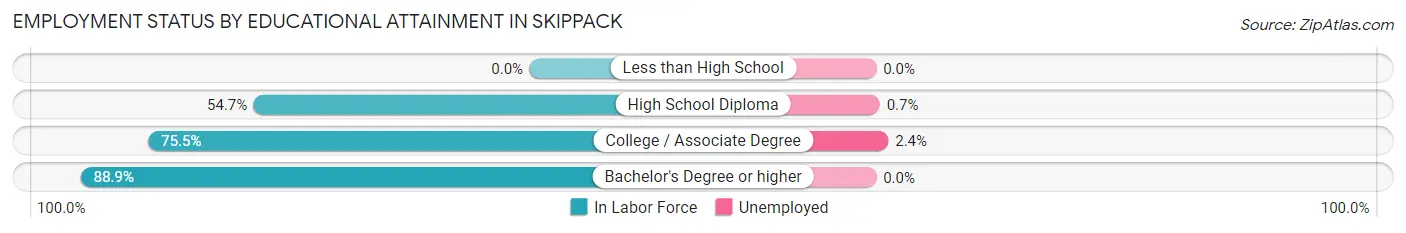
Employment Status by Educational Attainment in Skippack
According to labor force statistics for Skippack, 80.9% of individuals (1,839) out of the total population between 25 and 64 years of age (2,273) are in the labor force, with 0.5% or 9 of them being unemployed. The group with the highest labor force participation rate are those with the educational attainment of bachelor's degree or higher, with 88.9% or 1,328 individuals in the labor force. Within the labor force, individuals with college / associate degree education have the highest percentage of unemployment, with 2.4% or 9 of them being unemployed.
| Educational Attainment | In Labor Force | Unemployed |
| Less than High School | 0 (0.0%) | 0 (0.0%) |
| High School Diploma | 139 (54.7%) | 2 (0.7%) |
| College / Associate Degree | 372 (75.5%) | 12 (2.4%) |
| Bachelor's Degree or higher | 1,328 (88.9%) | 0 (0.0%) |
| Total | 1,839 (80.9%) | 11 (0.5%) |
Employment Occupations by Sex in Skippack
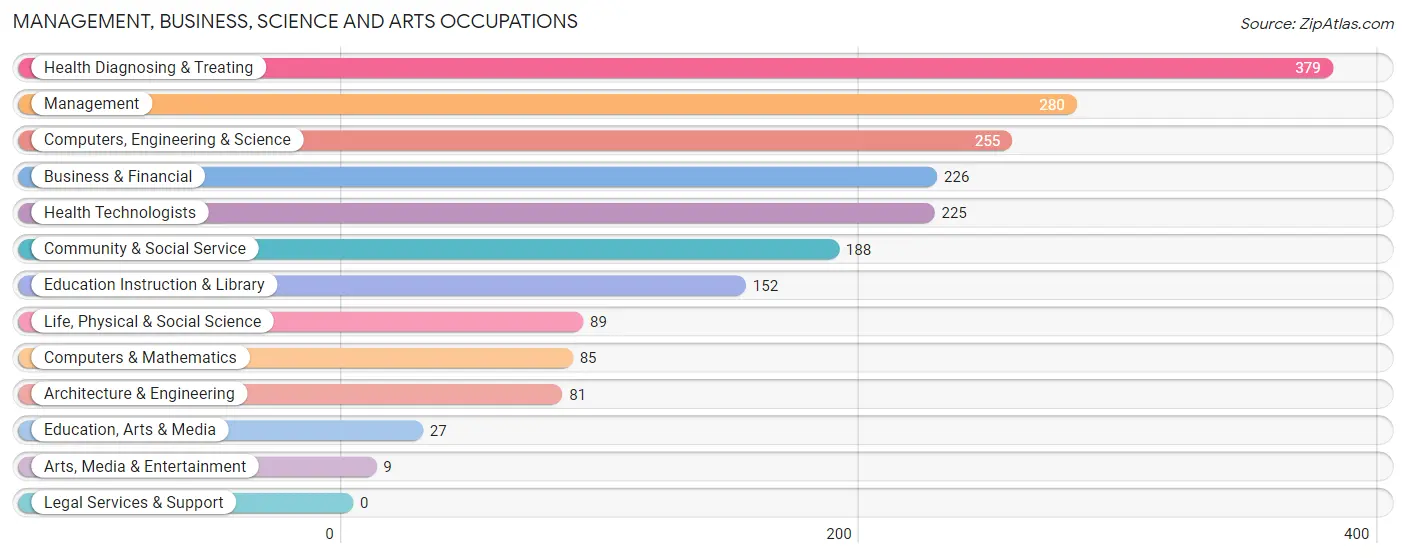
Management, Business, Science and Arts Occupations
The most common Management, Business, Science and Arts occupations in Skippack are Health Diagnosing & Treating (379 | 17.1%), Management (280 | 12.7%), Computers, Engineering & Science (255 | 11.5%), Business & Financial (226 | 10.2%), and Health Technologists (225 | 10.2%).
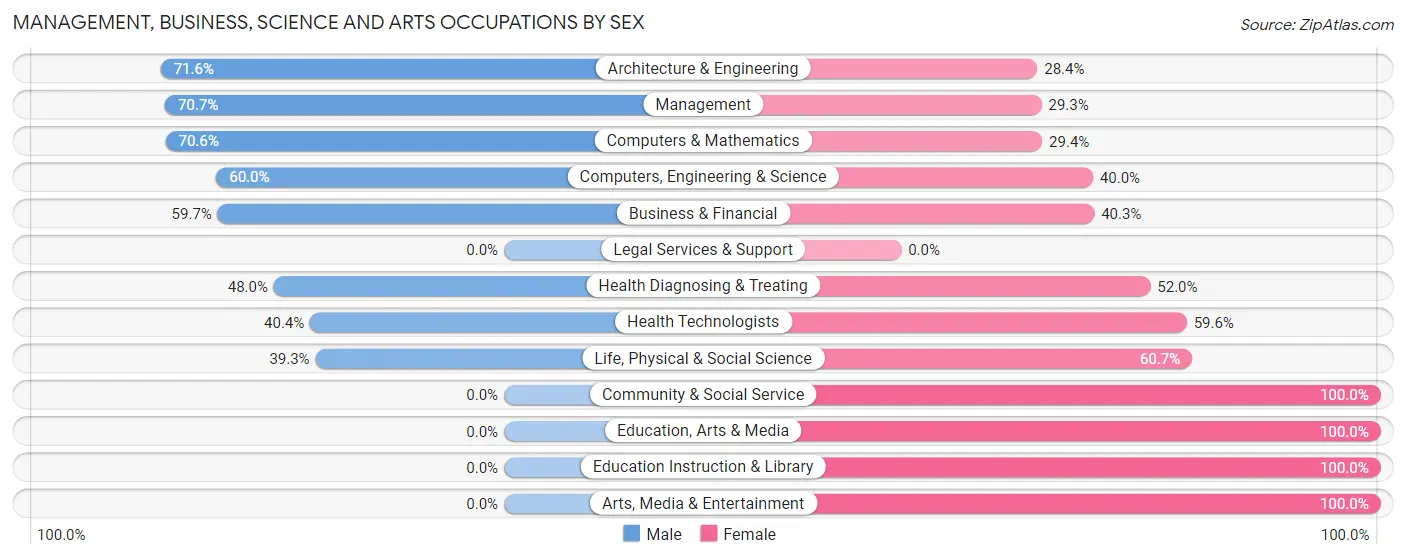
Management, Business, Science and Arts Occupations by Sex
Within the Management, Business, Science and Arts occupations in Skippack, the most male-oriented occupations are Architecture & Engineering (71.6%), Management (70.7%), and Computers & Mathematics (70.6%), while the most female-oriented occupations are Community & Social Service (100.0%), Education, Arts & Media (100.0%), and Education Instruction & Library (100.0%).
| Occupation | Male | Female |
| Management | 198 (70.7%) | 82 (29.3%) |
| Business & Financial | 135 (59.7%) | 91 (40.3%) |
| Computers, Engineering & Science | 153 (60.0%) | 102 (40.0%) |
| Computers & Mathematics | 60 (70.6%) | 25 (29.4%) |
| Architecture & Engineering | 58 (71.6%) | 23 (28.4%) |
| Life, Physical & Social Science | 35 (39.3%) | 54 (60.7%) |
| Community & Social Service | 0 (0.0%) | 188 (100.0%) |
| Education, Arts & Media | 0 (0.0%) | 27 (100.0%) |
| Legal Services & Support | 0 (0.0%) | 0 (0.0%) |
| Education Instruction & Library | 0 (0.0%) | 152 (100.0%) |
| Arts, Media & Entertainment | 0 (0.0%) | 9 (100.0%) |
| Health Diagnosing & Treating | 182 (48.0%) | 197 (52.0%) |
| Health Technologists | 91 (40.4%) | 134 (59.6%) |
| Total (Category) | 668 (50.3%) | 660 (49.7%) |
| Total (Overall) | 1,139 (51.4%) | 1,075 (48.5%) |
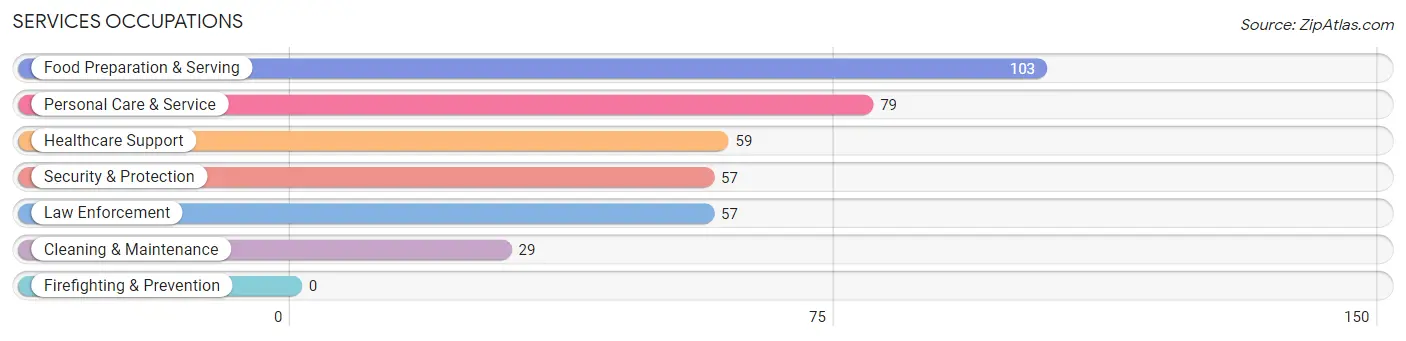
Services Occupations
The most common Services occupations in Skippack are Food Preparation & Serving (103 | 4.6%), Personal Care & Service (79 | 3.6%), Healthcare Support (59 | 2.7%), Security & Protection (57 | 2.6%), and Law Enforcement (57 | 2.6%).
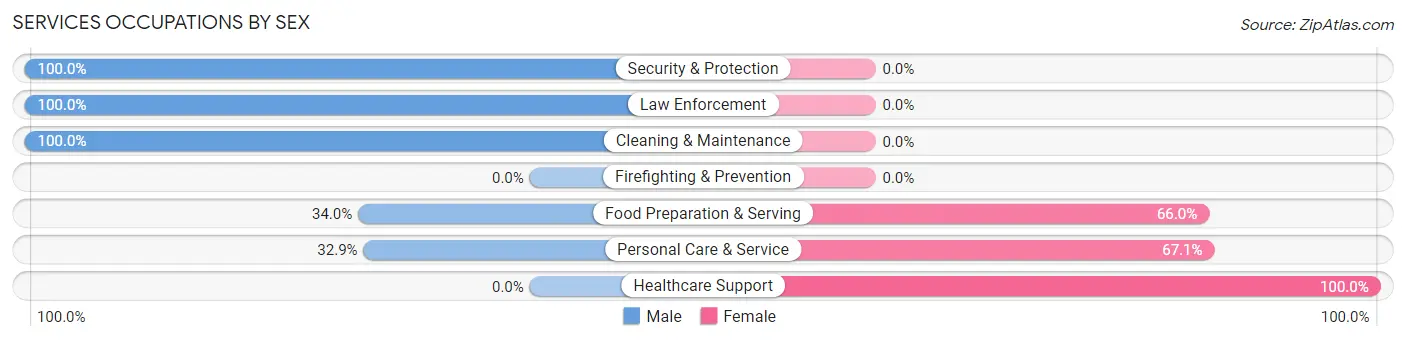
Services Occupations by Sex
Within the Services occupations in Skippack, the most male-oriented occupations are Security & Protection (100.0%), Law Enforcement (100.0%), and Cleaning & Maintenance (100.0%), while the most female-oriented occupations are Healthcare Support (100.0%), Personal Care & Service (67.1%), and Food Preparation & Serving (66.0%).
| Occupation | Male | Female |
| Healthcare Support | 0 (0.0%) | 59 (100.0%) |
| Security & Protection | 57 (100.0%) | 0 (0.0%) |
| Firefighting & Prevention | 0 (0.0%) | 0 (0.0%) |
| Law Enforcement | 57 (100.0%) | 0 (0.0%) |
| Food Preparation & Serving | 35 (34.0%) | 68 (66.0%) |
| Cleaning & Maintenance | 29 (100.0%) | 0 (0.0%) |
| Personal Care & Service | 26 (32.9%) | 53 (67.1%) |
| Total (Category) | 147 (45.0%) | 180 (55.0%) |
| Total (Overall) | 1,139 (51.4%) | 1,075 (48.5%) |
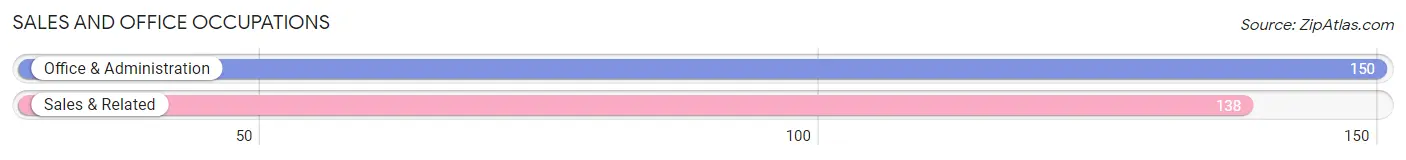
Sales and Office Occupations
The most common Sales and Office occupations in Skippack are Office & Administration (150 | 6.8%), and Sales & Related (138 | 6.2%).
Sales and Office Occupations by Sex
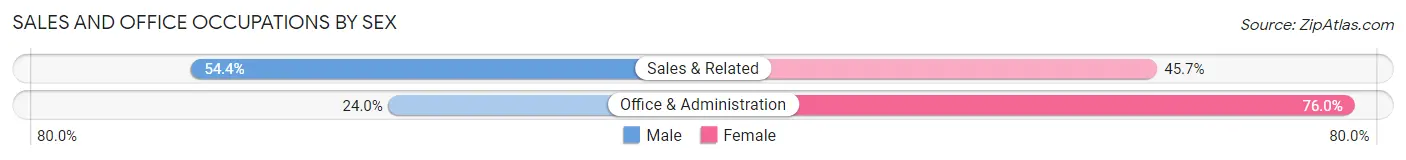
| Occupation | Male | Female |
| Sales & Related | 75 (54.3%) | 63 (45.7%) |
| Office & Administration | 36 (24.0%) | 114 (76.0%) |
| Total (Category) | 111 (38.5%) | 177 (61.5%) |
| Total (Overall) | 1,139 (51.4%) | 1,075 (48.5%) |
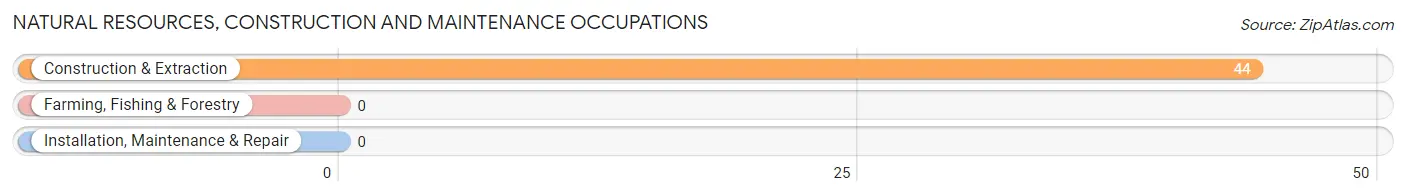
Natural Resources, Construction and Maintenance Occupations
The most common Natural Resources, Construction and Maintenance occupations in Skippack are , and Construction & Extraction (44 | 2.0%).
Natural Resources, Construction and Maintenance Occupations by Sex
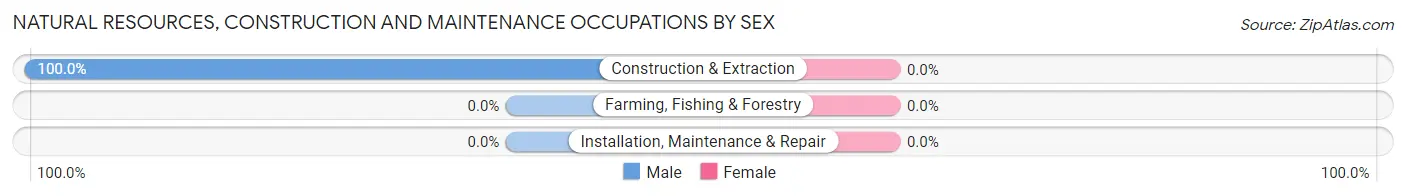
| Occupation | Male | Female |
| Farming, Fishing & Forestry | 0 (0.0%) | 0 (0.0%) |
| Construction & Extraction | 44 (100.0%) | 0 (0.0%) |
| Installation, Maintenance & Repair | 0 (0.0%) | 0 (0.0%) |
| Total (Category) | 44 (100.0%) | 0 (0.0%) |
| Total (Overall) | 1,139 (51.4%) | 1,075 (48.5%) |
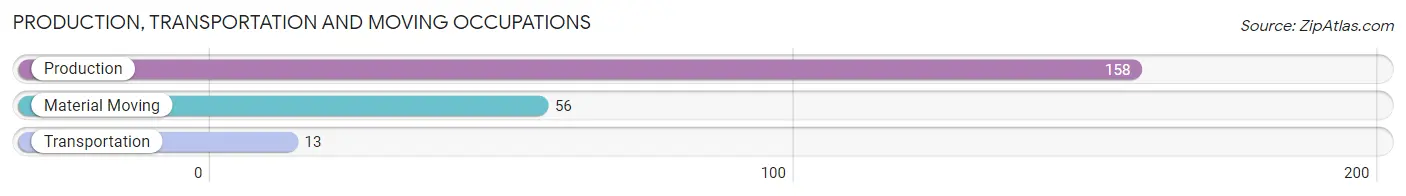
Production, Transportation and Moving Occupations
The most common Production, Transportation and Moving occupations in Skippack are Production (158 | 7.1%), Material Moving (56 | 2.5%), and Transportation (13 | 0.6%).
Production, Transportation and Moving Occupations by Sex
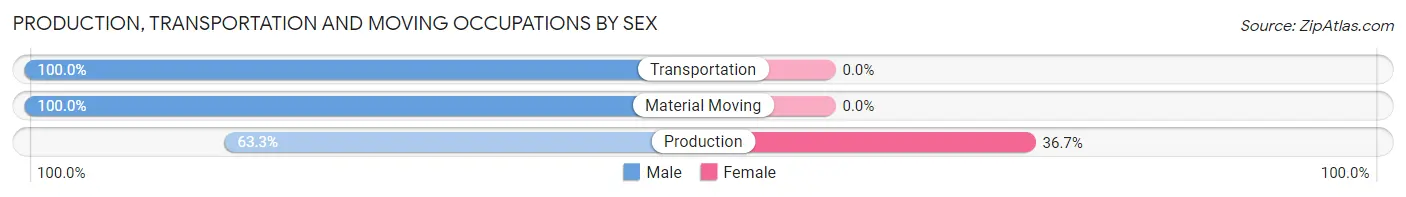
| Occupation | Male | Female |
| Production | 100 (63.3%) | 58 (36.7%) |
| Transportation | 13 (100.0%) | 0 (0.0%) |
| Material Moving | 56 (100.0%) | 0 (0.0%) |
| Total (Category) | 169 (74.5%) | 58 (25.6%) |
| Total (Overall) | 1,139 (51.4%) | 1,075 (48.5%) |
Employment Industries by Sex in Skippack
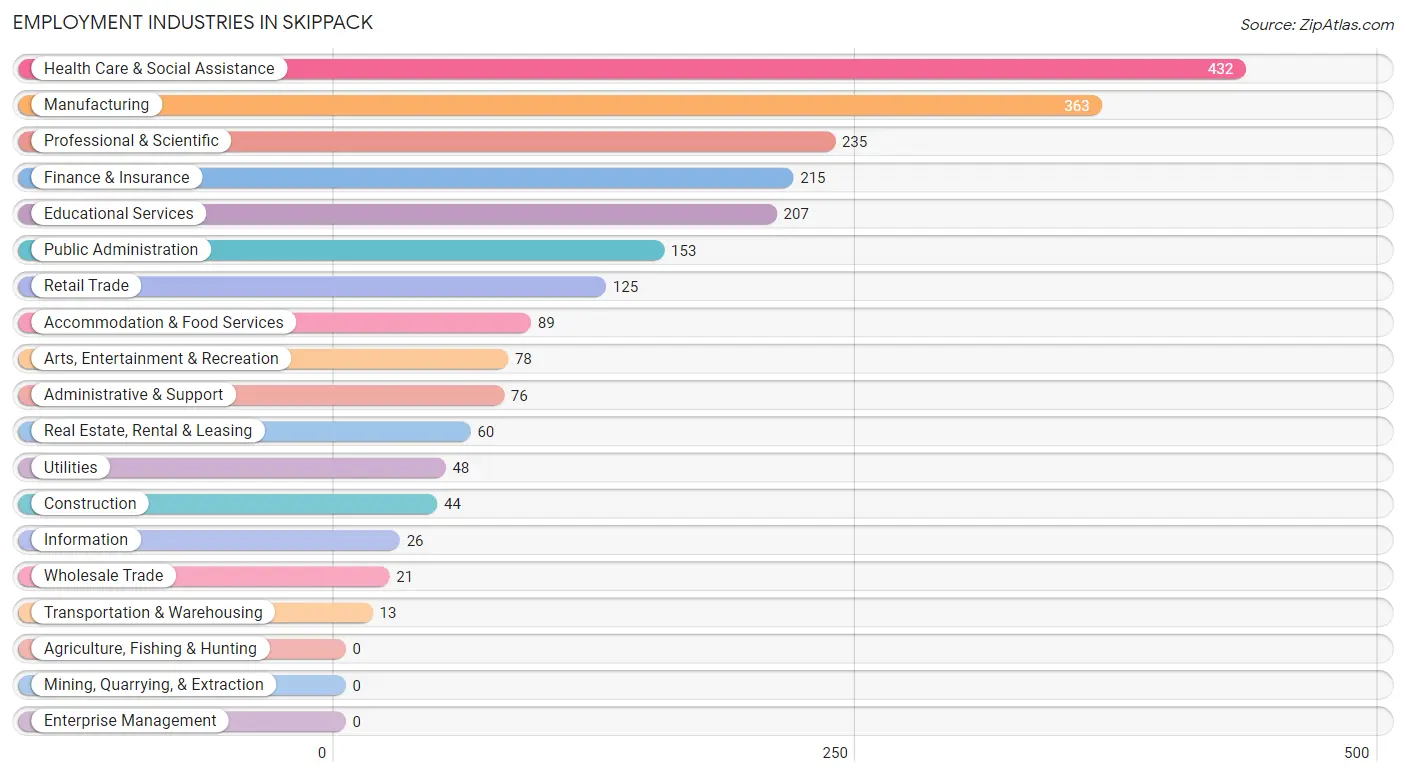
Employment Industries in Skippack
The major employment industries in Skippack include Health Care & Social Assistance (432 | 19.5%), Manufacturing (363 | 16.4%), Professional & Scientific (235 | 10.6%), Finance & Insurance (215 | 9.7%), and Educational Services (207 | 9.3%).
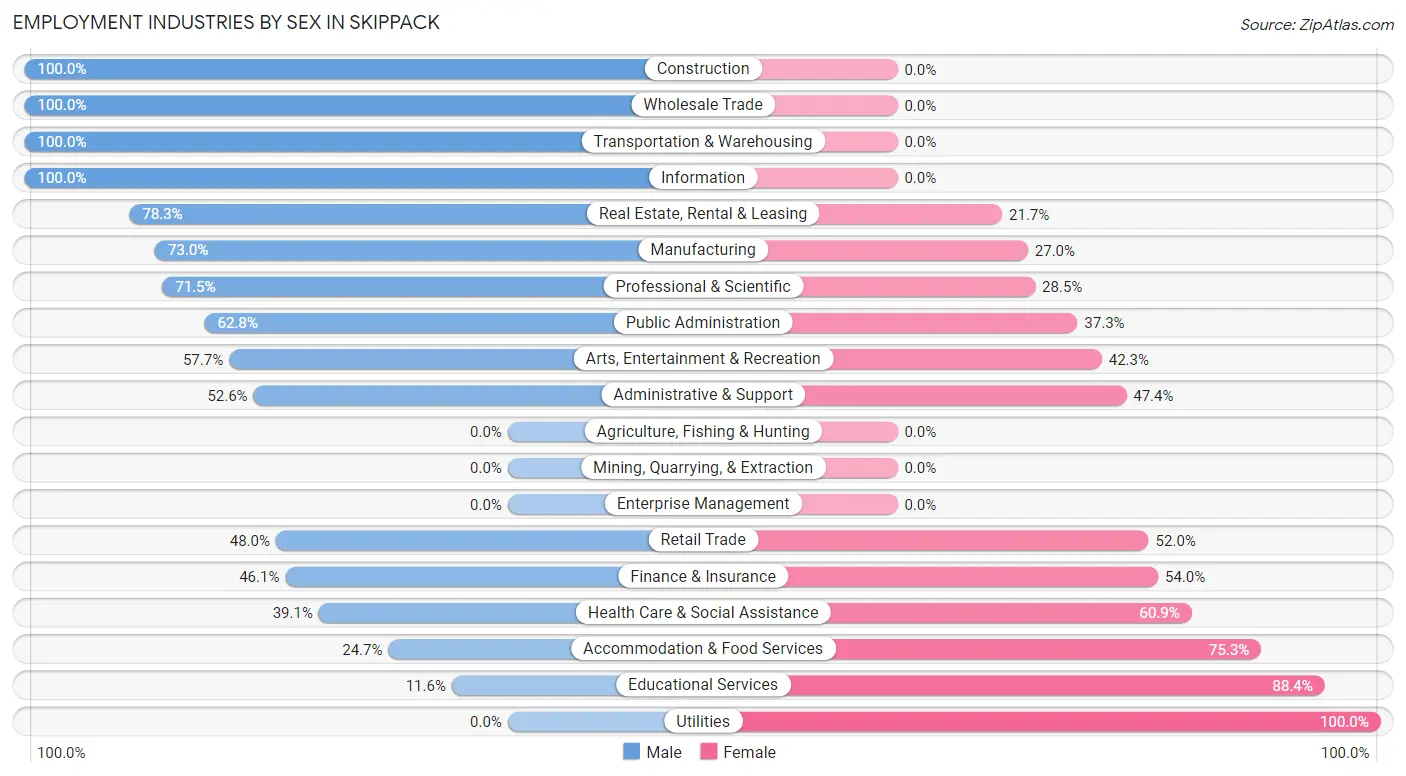
Employment Industries by Sex in Skippack
The Skippack industries that see more men than women are Construction (100.0%), Wholesale Trade (100.0%), and Transportation & Warehousing (100.0%), whereas the industries that tend to have a higher number of women are Utilities (100.0%), Educational Services (88.4%), and Accommodation & Food Services (75.3%).
| Industry | Male | Female |
| Agriculture, Fishing & Hunting | 0 (0.0%) | 0 (0.0%) |
| Mining, Quarrying, & Extraction | 0 (0.0%) | 0 (0.0%) |
| Construction | 44 (100.0%) | 0 (0.0%) |
| Manufacturing | 265 (73.0%) | 98 (27.0%) |
| Wholesale Trade | 21 (100.0%) | 0 (0.0%) |
| Retail Trade | 60 (48.0%) | 65 (52.0%) |
| Transportation & Warehousing | 13 (100.0%) | 0 (0.0%) |
| Utilities | 0 (0.0%) | 48 (100.0%) |
| Information | 26 (100.0%) | 0 (0.0%) |
| Finance & Insurance | 99 (46.1%) | 116 (53.9%) |
| Real Estate, Rental & Leasing | 47 (78.3%) | 13 (21.7%) |
| Professional & Scientific | 168 (71.5%) | 67 (28.5%) |
| Enterprise Management | 0 (0.0%) | 0 (0.0%) |
| Administrative & Support | 40 (52.6%) | 36 (47.4%) |
| Educational Services | 24 (11.6%) | 183 (88.4%) |
| Health Care & Social Assistance | 169 (39.1%) | 263 (60.9%) |
| Arts, Entertainment & Recreation | 45 (57.7%) | 33 (42.3%) |
| Accommodation & Food Services | 22 (24.7%) | 67 (75.3%) |
| Public Administration | 96 (62.7%) | 57 (37.2%) |
| Total | 1,139 (51.4%) | 1,075 (48.5%) |
Education in Skippack
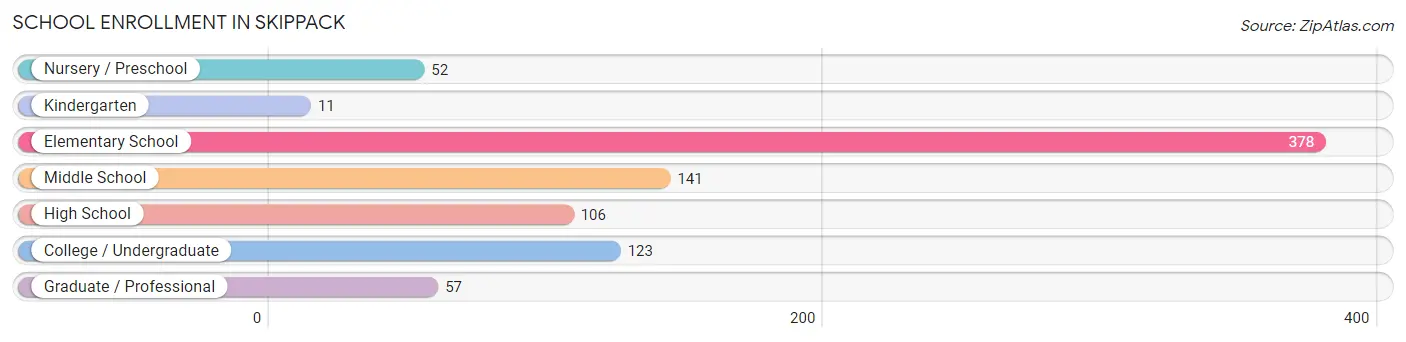
School Enrollment in Skippack
The most common levels of schooling among the 868 students in Skippack are elementary school (378 | 43.5%), middle school (141 | 16.2%), and college / undergraduate (123 | 14.2%).
| School Level | # Students | % Students |
| Nursery / Preschool | 52 | 6.0% |
| Kindergarten | 11 | 1.3% |
| Elementary School | 378 | 43.5% |
| Middle School | 141 | 16.2% |
| High School | 106 | 12.2% |
| College / Undergraduate | 123 | 14.2% |
| Graduate / Professional | 57 | 6.6% |
| Total | 868 | 100.0% |
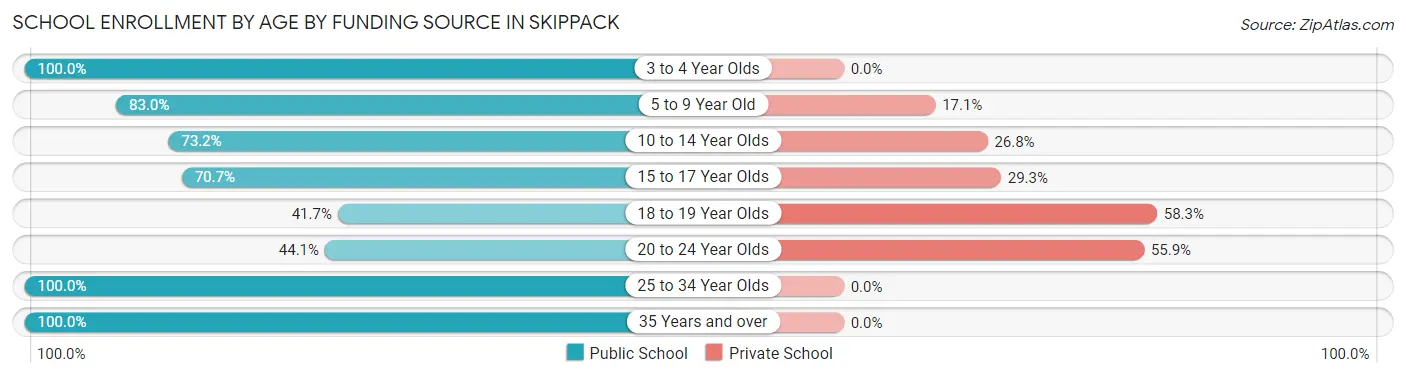
School Enrollment by Age by Funding Source in Skippack
Out of a total of 868 students who are enrolled in schools in Skippack, 186 (21.4%) attend a private institution, while the remaining 682 (78.6%) are enrolled in public schools. The age group of 18 to 19 year olds has the highest likelihood of being enrolled in private schools, with 14 (58.3% in the age bracket) enrolled. Conversely, the age group of 3 to 4 year olds has the lowest likelihood of being enrolled in a private school, with 12 (100.0% in the age bracket) attending a public institution.
| Age Bracket | Public School | Private School |
| 3 to 4 Year Olds | 12 (100.0%) | 0 (0.0%) |
| 5 to 9 Year Old | 321 (83.0%) | 66 (17.1%) |
| 10 to 14 Year Olds | 134 (73.2%) | 49 (26.8%) |
| 15 to 17 Year Olds | 58 (70.7%) | 24 (29.3%) |
| 18 to 19 Year Olds | 10 (41.7%) | 14 (58.3%) |
| 20 to 24 Year Olds | 26 (44.1%) | 33 (55.9%) |
| 25 to 34 Year Olds | 52 (100.0%) | 0 (0.0%) |
| 35 Years and over | 69 (100.0%) | 0 (0.0%) |
| Total | 682 (78.6%) | 186 (21.4%) |
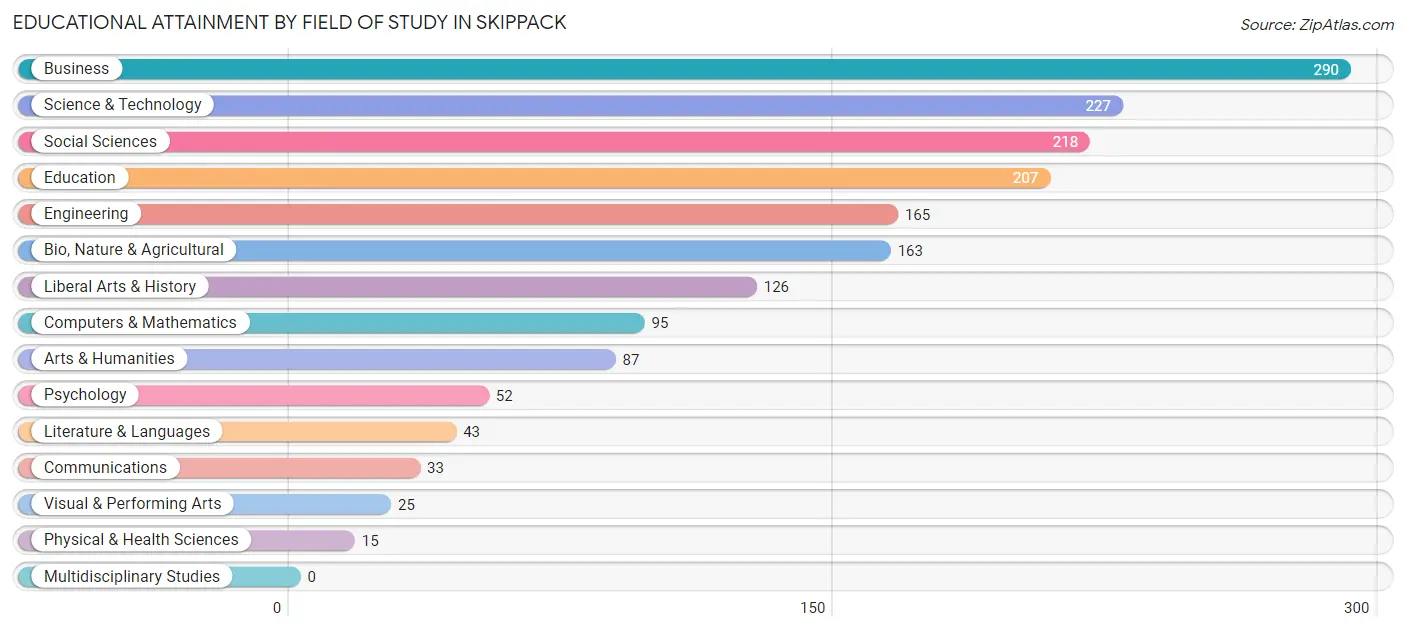
Educational Attainment by Field of Study in Skippack
Business (290 | 16.6%), science & technology (227 | 13.0%), social sciences (218 | 12.5%), education (207 | 11.9%), and engineering (165 | 9.5%) are the most common fields of study among 1,746 individuals in Skippack who have obtained a bachelor's degree or higher.
| Field of Study | # Graduates | % Graduates |
| Computers & Mathematics | 95 | 5.4% |
| Bio, Nature & Agricultural | 163 | 9.3% |
| Physical & Health Sciences | 15 | 0.9% |
| Psychology | 52 | 3.0% |
| Social Sciences | 218 | 12.5% |
| Engineering | 165 | 9.5% |
| Multidisciplinary Studies | 0 | 0.0% |
| Science & Technology | 227 | 13.0% |
| Business | 290 | 16.6% |
| Education | 207 | 11.9% |
| Literature & Languages | 43 | 2.5% |
| Liberal Arts & History | 126 | 7.2% |
| Visual & Performing Arts | 25 | 1.4% |
| Communications | 33 | 1.9% |
| Arts & Humanities | 87 | 5.0% |
| Total | 1,746 | 100.0% |
Transportation & Commute in Skippack
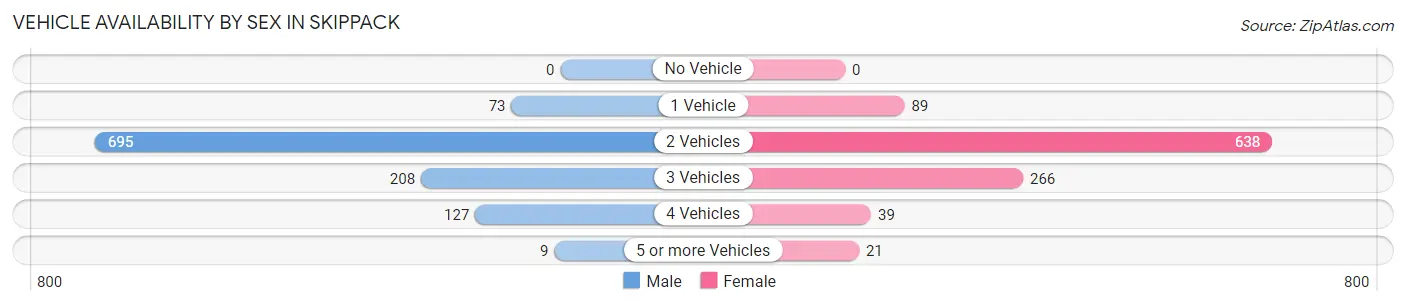
Vehicle Availability by Sex in Skippack
The most prevalent vehicle ownership categories in Skippack are males with 2 vehicles (695, accounting for 62.5%) and females with 2 vehicles (638, making up 66.0%).
| Vehicles Available | Male | Female |
| No Vehicle | 0 (0.0%) | 0 (0.0%) |
| 1 Vehicle | 73 (6.6%) | 89 (8.5%) |
| 2 Vehicles | 695 (62.5%) | 638 (60.6%) |
| 3 Vehicles | 208 (18.7%) | 266 (25.3%) |
| 4 Vehicles | 127 (11.4%) | 39 (3.7%) |
| 5 or more Vehicles | 9 (0.8%) | 21 (2.0%) |
| Total | 1,112 (100.0%) | 1,053 (100.0%) |
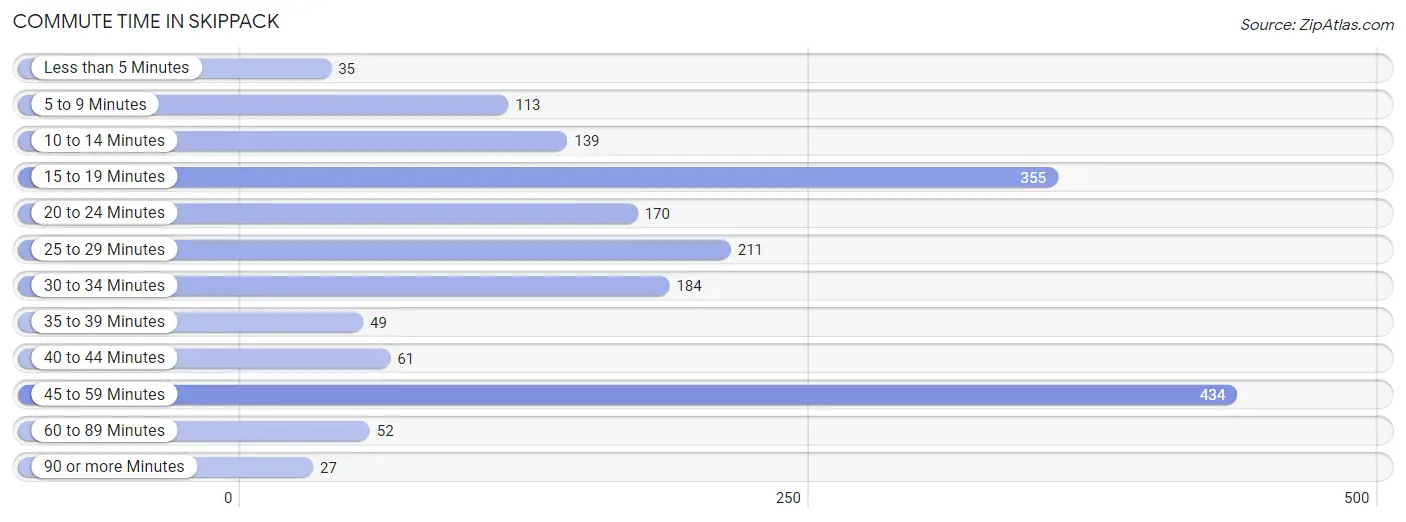
Commute Time in Skippack
The most frequently occuring commute durations in Skippack are 45 to 59 minutes (434 commuters, 23.7%), 15 to 19 minutes (355 commuters, 19.4%), and 25 to 29 minutes (211 commuters, 11.5%).
| Commute Time | # Commuters | % Commuters |
| Less than 5 Minutes | 35 | 1.9% |
| 5 to 9 Minutes | 113 | 6.2% |
| 10 to 14 Minutes | 139 | 7.6% |
| 15 to 19 Minutes | 355 | 19.4% |
| 20 to 24 Minutes | 170 | 9.3% |
| 25 to 29 Minutes | 211 | 11.5% |
| 30 to 34 Minutes | 184 | 10.1% |
| 35 to 39 Minutes | 49 | 2.7% |
| 40 to 44 Minutes | 61 | 3.3% |
| 45 to 59 Minutes | 434 | 23.7% |
| 60 to 89 Minutes | 52 | 2.8% |
| 90 or more Minutes | 27 | 1.5% |
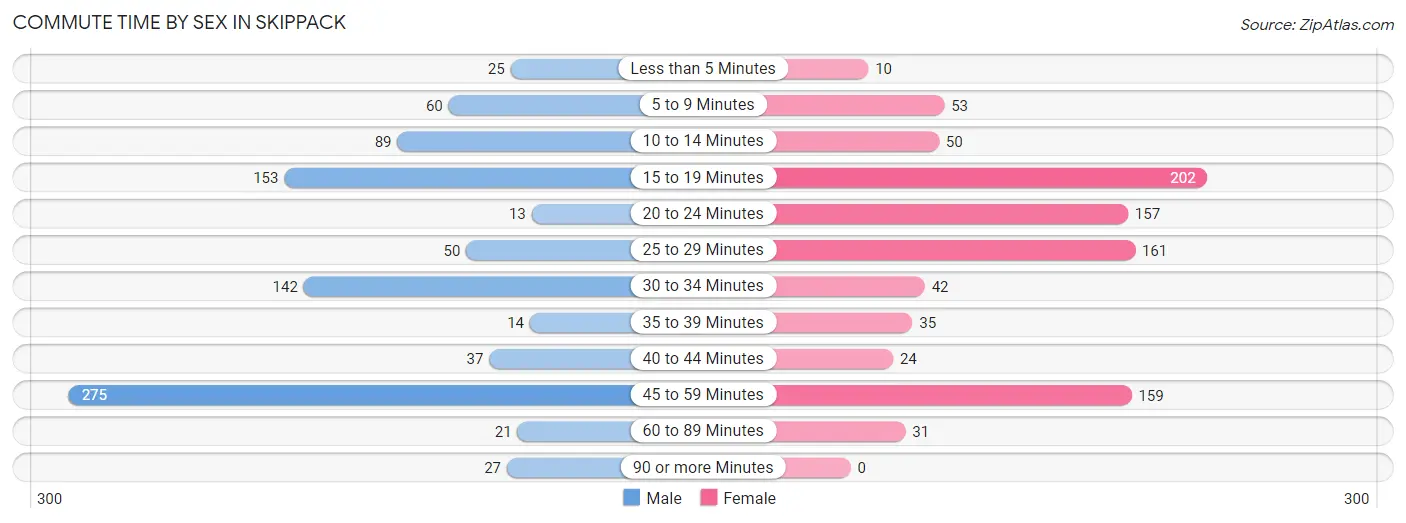
Commute Time by Sex in Skippack
The most common commute times in Skippack are 45 to 59 minutes (275 commuters, 30.3%) for males and 15 to 19 minutes (202 commuters, 21.9%) for females.
| Commute Time | Male | Female |
| Less than 5 Minutes | 25 (2.8%) | 10 (1.1%) |
| 5 to 9 Minutes | 60 (6.6%) | 53 (5.7%) |
| 10 to 14 Minutes | 89 (9.8%) | 50 (5.4%) |
| 15 to 19 Minutes | 153 (16.9%) | 202 (21.9%) |
| 20 to 24 Minutes | 13 (1.4%) | 157 (17.0%) |
| 25 to 29 Minutes | 50 (5.5%) | 161 (17.4%) |
| 30 to 34 Minutes | 142 (15.7%) | 42 (4.5%) |
| 35 to 39 Minutes | 14 (1.5%) | 35 (3.8%) |
| 40 to 44 Minutes | 37 (4.1%) | 24 (2.6%) |
| 45 to 59 Minutes | 275 (30.3%) | 159 (17.2%) |
| 60 to 89 Minutes | 21 (2.3%) | 31 (3.4%) |
| 90 or more Minutes | 27 (3.0%) | 0 (0.0%) |
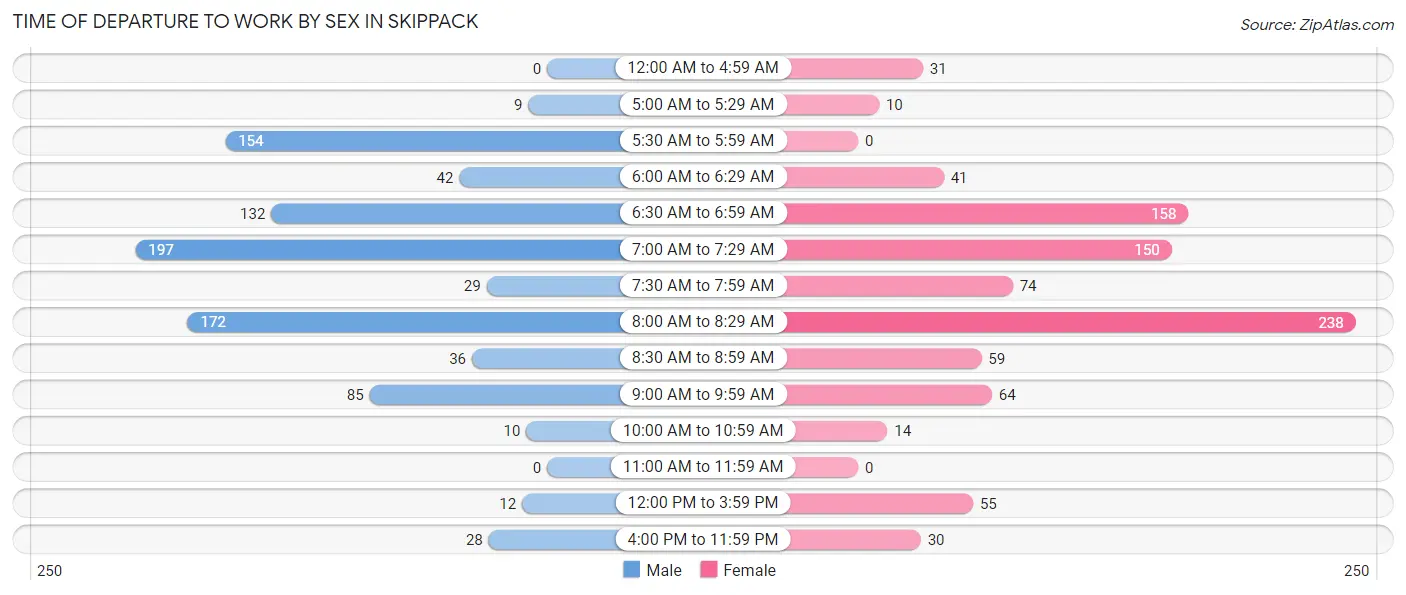
Time of Departure to Work by Sex in Skippack
The most frequent times of departure to work in Skippack are 7:00 AM to 7:29 AM (197, 21.7%) for males and 8:00 AM to 8:29 AM (238, 25.8%) for females.
| Time of Departure | Male | Female |
| 12:00 AM to 4:59 AM | 0 (0.0%) | 31 (3.4%) |
| 5:00 AM to 5:29 AM | 9 (1.0%) | 10 (1.1%) |
| 5:30 AM to 5:59 AM | 154 (17.0%) | 0 (0.0%) |
| 6:00 AM to 6:29 AM | 42 (4.6%) | 41 (4.4%) |
| 6:30 AM to 6:59 AM | 132 (14.6%) | 158 (17.1%) |
| 7:00 AM to 7:29 AM | 197 (21.7%) | 150 (16.2%) |
| 7:30 AM to 7:59 AM | 29 (3.2%) | 74 (8.0%) |
| 8:00 AM to 8:29 AM | 172 (19.0%) | 238 (25.8%) |
| 8:30 AM to 8:59 AM | 36 (4.0%) | 59 (6.4%) |
| 9:00 AM to 9:59 AM | 85 (9.4%) | 64 (6.9%) |
| 10:00 AM to 10:59 AM | 10 (1.1%) | 14 (1.5%) |
| 11:00 AM to 11:59 AM | 0 (0.0%) | 0 (0.0%) |
| 12:00 PM to 3:59 PM | 12 (1.3%) | 55 (5.9%) |
| 4:00 PM to 11:59 PM | 28 (3.1%) | 30 (3.3%) |
| Total | 906 (100.0%) | 924 (100.0%) |
Housing Occupancy in Skippack
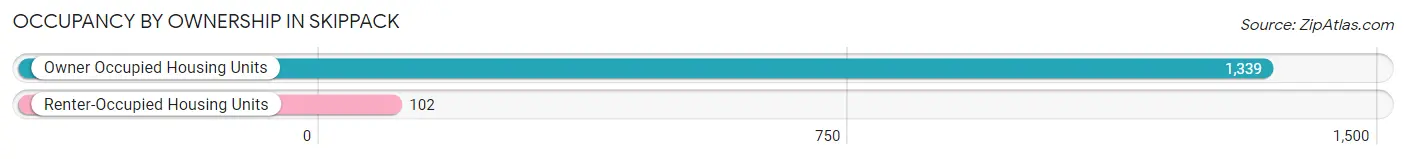
Occupancy by Ownership in Skippack
Of the total 1,441 dwellings in Skippack, owner-occupied units account for 1,339 (92.9%), while renter-occupied units make up 102 (7.1%).
| Occupancy | # Housing Units | % Housing Units |
| Owner Occupied Housing Units | 1,339 | 92.9% |
| Renter-Occupied Housing Units | 102 | 7.1% |
| Total Occupied Housing Units | 1,441 | 100.0% |
Occupancy by Household Size in Skippack
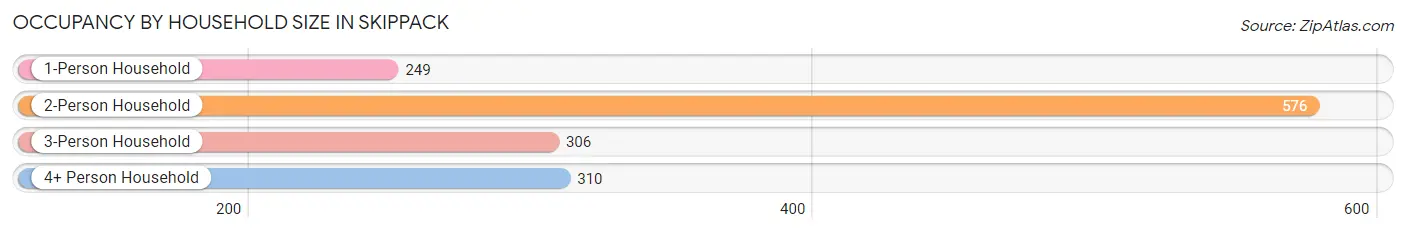
| Household Size | # Housing Units | % Housing Units |
| 1-Person Household | 249 | 17.3% |
| 2-Person Household | 576 | 40.0% |
| 3-Person Household | 306 | 21.2% |
| 4+ Person Household | 310 | 21.5% |
| Total Housing Units | 1,441 | 100.0% |
Occupancy by Ownership by Household Size in Skippack
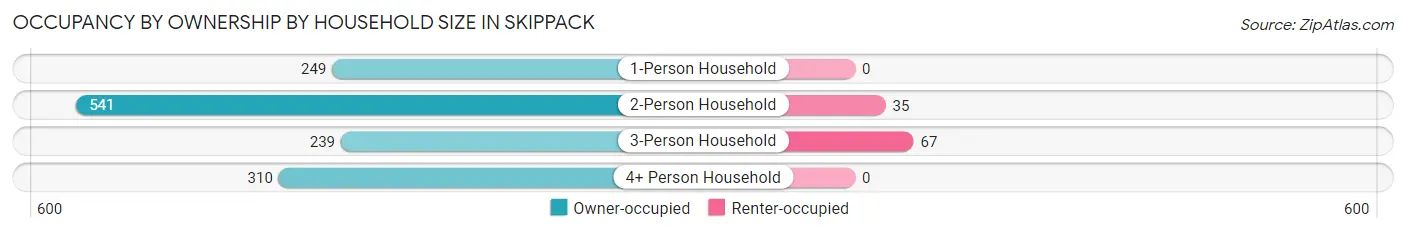
| Household Size | Owner-occupied | Renter-occupied |
| 1-Person Household | 249 (100.0%) | 0 (0.0%) |
| 2-Person Household | 541 (93.9%) | 35 (6.1%) |
| 3-Person Household | 239 (78.1%) | 67 (21.9%) |
| 4+ Person Household | 310 (100.0%) | 0 (0.0%) |
| Total Housing Units | 1,339 (92.9%) | 102 (7.1%) |
Occupancy by Educational Attainment in Skippack
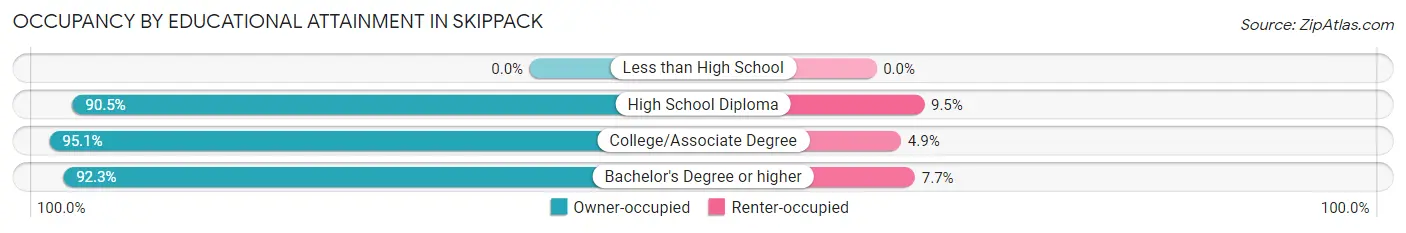
| Household Size | Owner-occupied | Renter-occupied |
| Less than High School | 0 (0.0%) | 0 (0.0%) |
| High School Diploma | 143 (90.5%) | 15 (9.5%) |
| College/Associate Degree | 388 (95.1%) | 20 (4.9%) |
| Bachelor's Degree or higher | 808 (92.3%) | 67 (7.7%) |
Occupancy by Age of Householder in Skippack
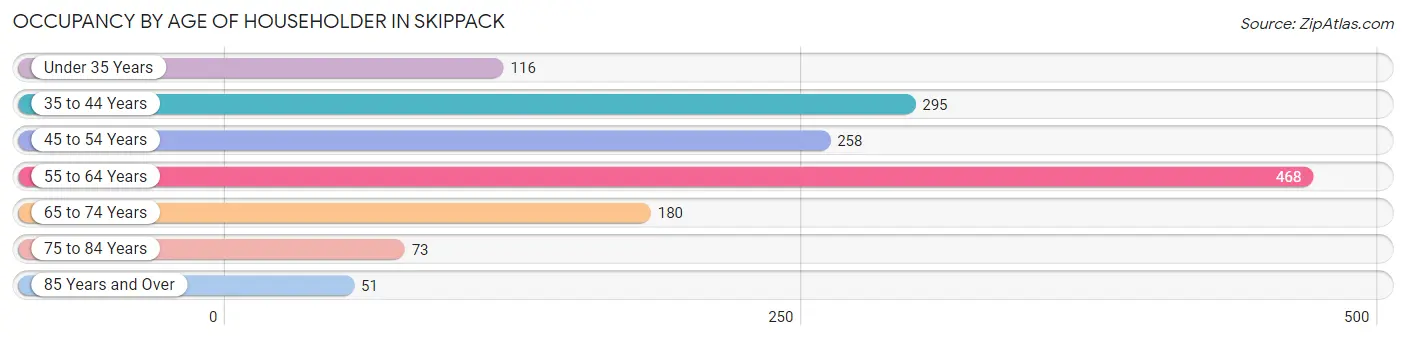
| Age Bracket | # Households | % Households |
| Under 35 Years | 116 | 8.1% |
| 35 to 44 Years | 295 | 20.5% |
| 45 to 54 Years | 258 | 17.9% |
| 55 to 64 Years | 468 | 32.5% |
| 65 to 74 Years | 180 | 12.5% |
| 75 to 84 Years | 73 | 5.1% |
| 85 Years and Over | 51 | 3.5% |
| Total | 1,441 | 100.0% |
Housing Finances in Skippack
Median Income by Occupancy in Skippack
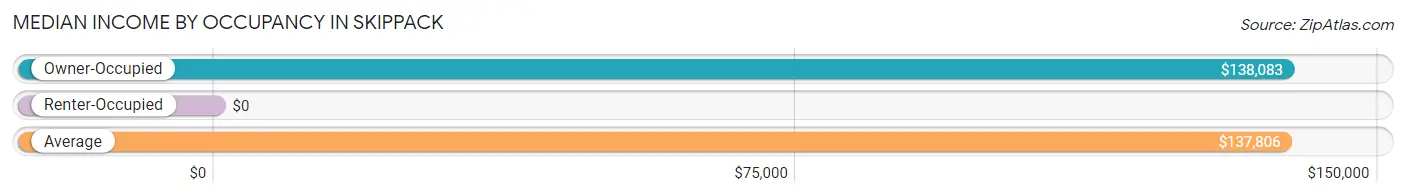
| Occupancy Type | # Households | Median Income |
| Owner-Occupied | 1,339 (92.9%) | $138,083 |
| Renter-Occupied | 102 (7.1%) | $0 |
| Average | 1,441 (100.0%) | $137,806 |
Occupancy by Householder Income Bracket in Skippack
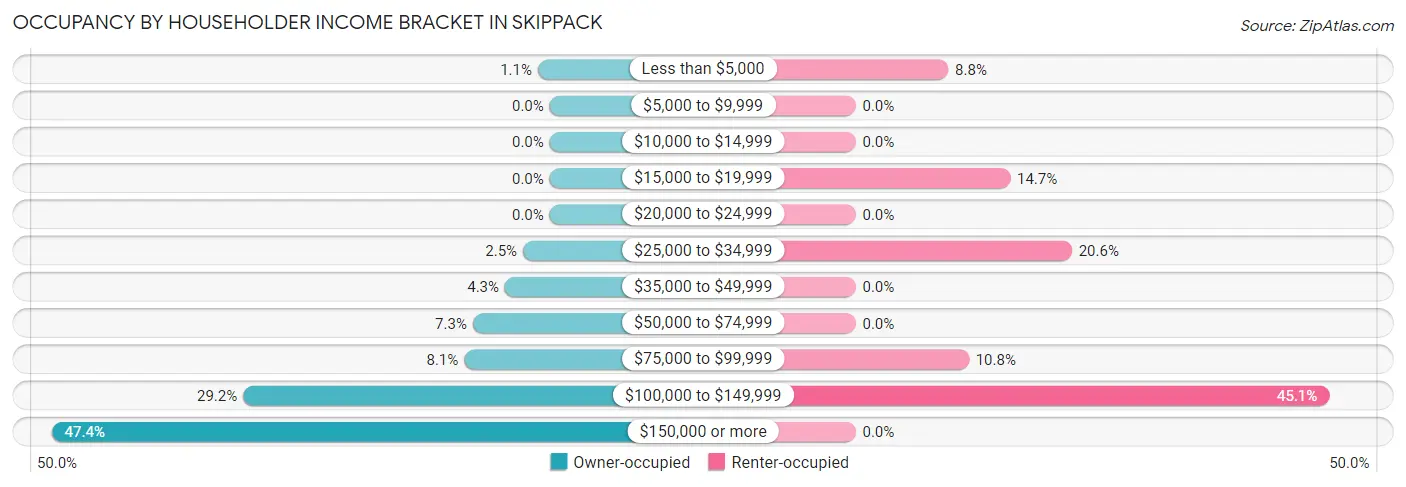
| Income Bracket | Owner-occupied | Renter-occupied |
| Less than $5,000 | 15 (1.1%) | 9 (8.8%) |
| $5,000 to $9,999 | 0 (0.0%) | 0 (0.0%) |
| $10,000 to $14,999 | 0 (0.0%) | 0 (0.0%) |
| $15,000 to $19,999 | 0 (0.0%) | 15 (14.7%) |
| $20,000 to $24,999 | 0 (0.0%) | 0 (0.0%) |
| $25,000 to $34,999 | 34 (2.5%) | 21 (20.6%) |
| $35,000 to $49,999 | 57 (4.3%) | 0 (0.0%) |
| $50,000 to $74,999 | 98 (7.3%) | 0 (0.0%) |
| $75,000 to $99,999 | 109 (8.1%) | 11 (10.8%) |
| $100,000 to $149,999 | 391 (29.2%) | 46 (45.1%) |
| $150,000 or more | 635 (47.4%) | 0 (0.0%) |
| Total | 1,339 (100.0%) | 102 (100.0%) |
Monthly Housing Cost Tiers in Skippack
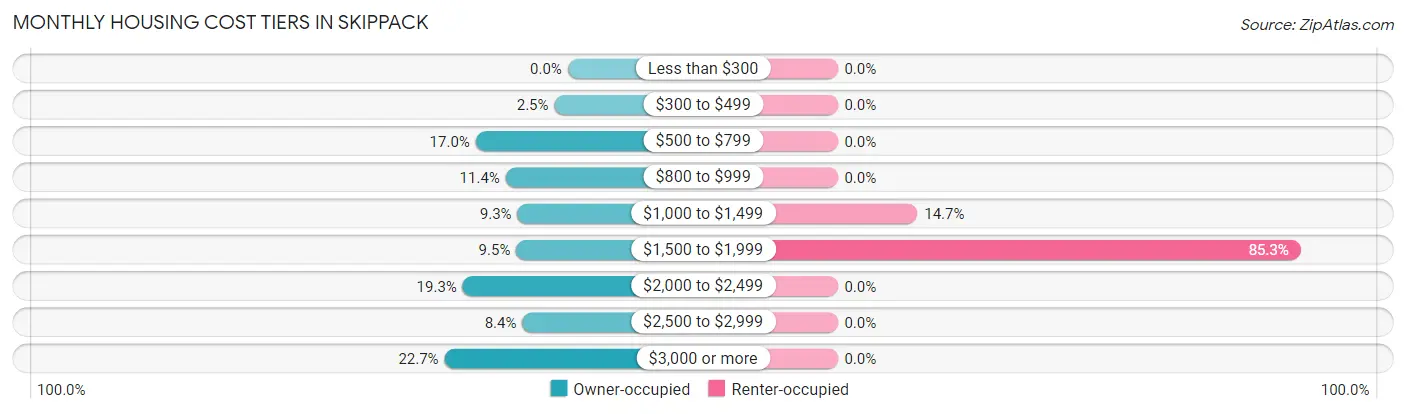
| Monthly Cost | Owner-occupied | Renter-occupied |
| Less than $300 | 0 (0.0%) | 0 (0.0%) |
| $300 to $499 | 33 (2.5%) | 0 (0.0%) |
| $500 to $799 | 227 (17.0%) | 0 (0.0%) |
| $800 to $999 | 153 (11.4%) | 0 (0.0%) |
| $1,000 to $1,499 | 124 (9.3%) | 15 (14.7%) |
| $1,500 to $1,999 | 127 (9.5%) | 87 (85.3%) |
| $2,000 to $2,499 | 259 (19.3%) | 0 (0.0%) |
| $2,500 to $2,999 | 112 (8.4%) | 0 (0.0%) |
| $3,000 or more | 304 (22.7%) | 0 (0.0%) |
| Total | 1,339 (100.0%) | 102 (100.0%) |
Physical Housing Characteristics in Skippack
Housing Structures in Skippack
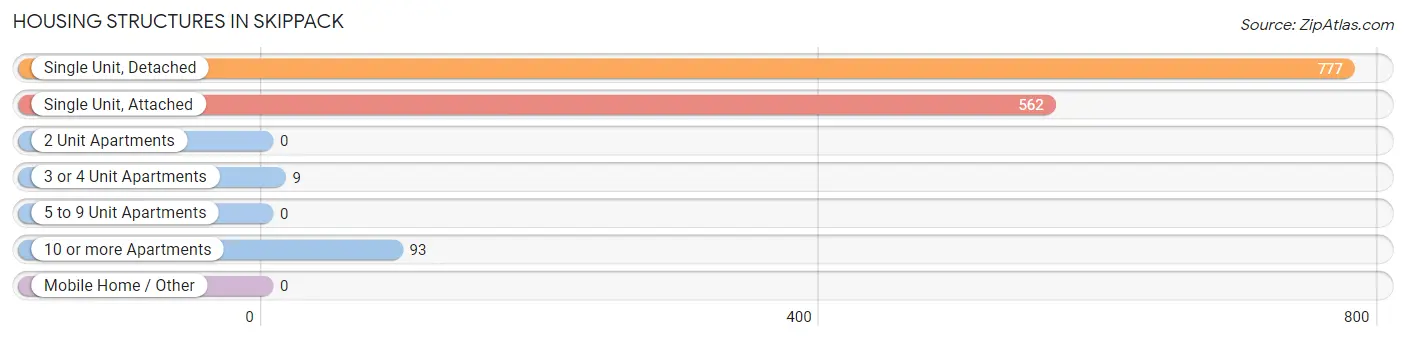
| Structure Type | # Housing Units | % Housing Units |
| Single Unit, Detached | 777 | 53.9% |
| Single Unit, Attached | 562 | 39.0% |
| 2 Unit Apartments | 0 | 0.0% |
| 3 or 4 Unit Apartments | 9 | 0.6% |
| 5 to 9 Unit Apartments | 0 | 0.0% |
| 10 or more Apartments | 93 | 6.5% |
| Mobile Home / Other | 0 | 0.0% |
| Total | 1,441 | 100.0% |
Housing Structures by Occupancy in Skippack
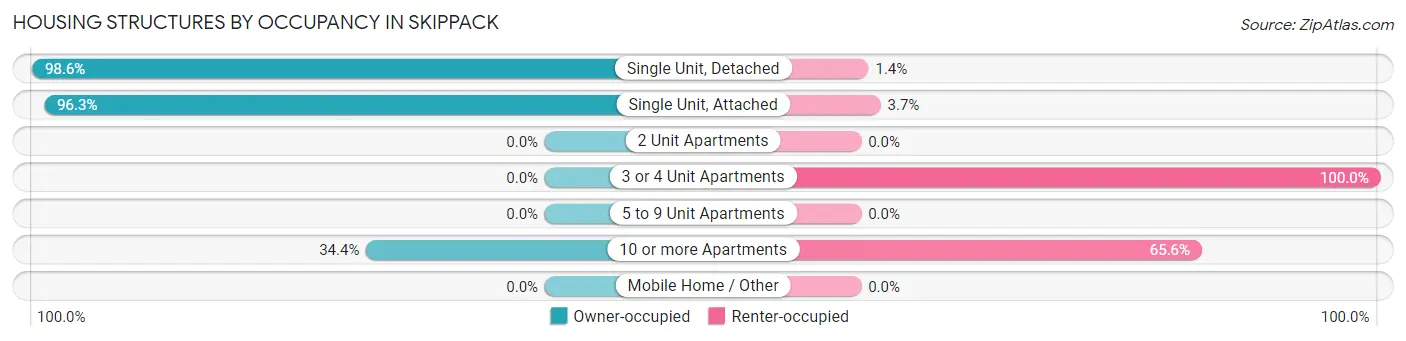
| Structure Type | Owner-occupied | Renter-occupied |
| Single Unit, Detached | 766 (98.6%) | 11 (1.4%) |
| Single Unit, Attached | 541 (96.3%) | 21 (3.7%) |
| 2 Unit Apartments | 0 (0.0%) | 0 (0.0%) |
| 3 or 4 Unit Apartments | 0 (0.0%) | 9 (100.0%) |
| 5 to 9 Unit Apartments | 0 (0.0%) | 0 (0.0%) |
| 10 or more Apartments | 32 (34.4%) | 61 (65.6%) |
| Mobile Home / Other | 0 (0.0%) | 0 (0.0%) |
| Total | 1,339 (92.9%) | 102 (7.1%) |
Housing Structures by Number of Rooms in Skippack
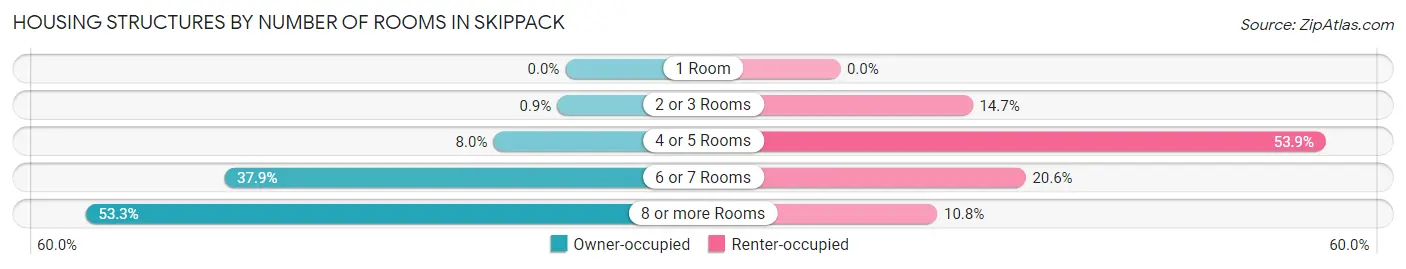
| Number of Rooms | Owner-occupied | Renter-occupied |
| 1 Room | 0 (0.0%) | 0 (0.0%) |
| 2 or 3 Rooms | 12 (0.9%) | 15 (14.7%) |
| 4 or 5 Rooms | 107 (8.0%) | 55 (53.9%) |
| 6 or 7 Rooms | 507 (37.9%) | 21 (20.6%) |
| 8 or more Rooms | 713 (53.2%) | 11 (10.8%) |
| Total | 1,339 (100.0%) | 102 (100.0%) |
Housing Structure by Heating Type in Skippack
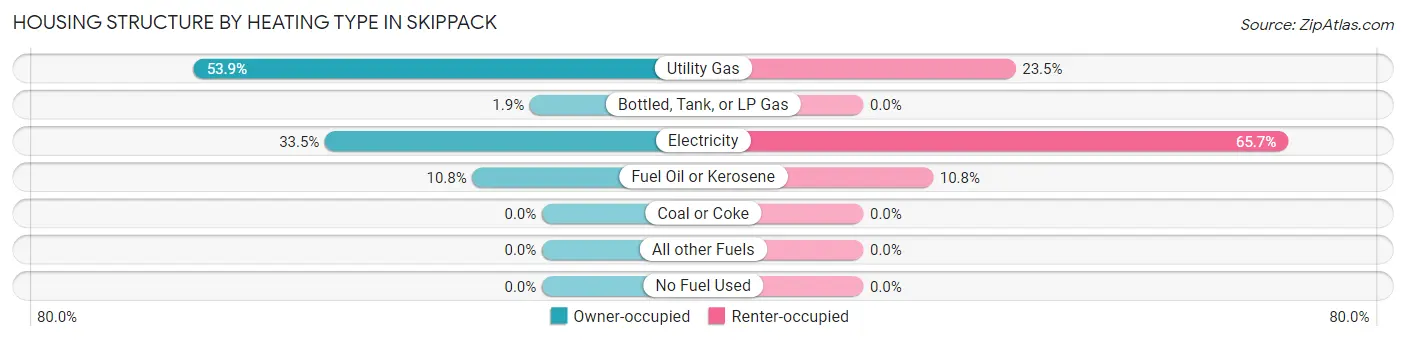
| Heating Type | Owner-occupied | Renter-occupied |
| Utility Gas | 721 (53.8%) | 24 (23.5%) |
| Bottled, Tank, or LP Gas | 25 (1.9%) | 0 (0.0%) |
| Electricity | 449 (33.5%) | 67 (65.7%) |
| Fuel Oil or Kerosene | 144 (10.7%) | 11 (10.8%) |
| Coal or Coke | 0 (0.0%) | 0 (0.0%) |
| All other Fuels | 0 (0.0%) | 0 (0.0%) |
| No Fuel Used | 0 (0.0%) | 0 (0.0%) |
| Total | 1,339 (100.0%) | 102 (100.0%) |
Household Vehicle Usage in Skippack
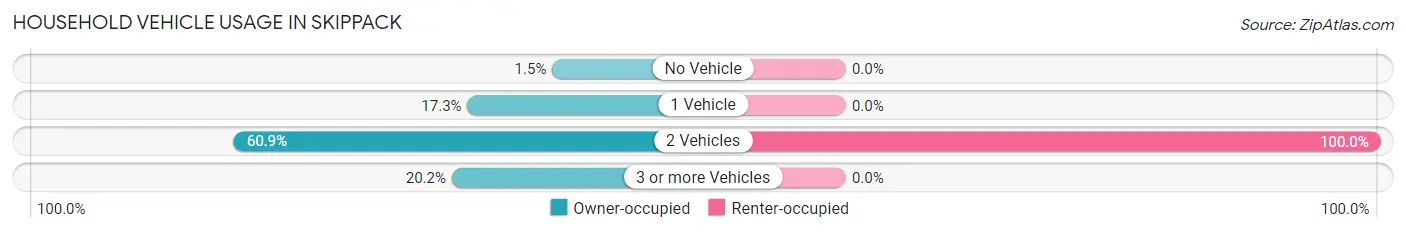
| Vehicles per Household | Owner-occupied | Renter-occupied |
| No Vehicle | 20 (1.5%) | 0 (0.0%) |
| 1 Vehicle | 232 (17.3%) | 0 (0.0%) |
| 2 Vehicles | 816 (60.9%) | 102 (100.0%) |
| 3 or more Vehicles | 271 (20.2%) | 0 (0.0%) |
| Total | 1,339 (100.0%) | 102 (100.0%) |
Real Estate & Mortgages in Skippack
Real Estate and Mortgage Overview in Skippack
| Characteristic | Without Mortgage | With Mortgage |
| Housing Units | 497 | 842 |
| Median Property Value | $419,600 | $418,100 |
| Median Household Income | $130,568 | $524 |
| Monthly Housing Costs | $778 | $304 |
| Real Estate Taxes | $4,784 | $0 |
Property Value by Mortgage Status in Skippack
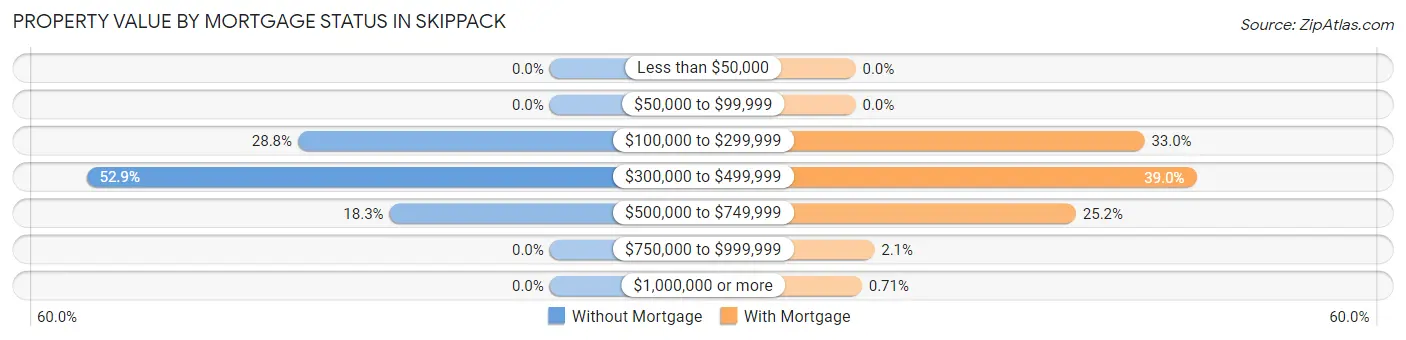
| Property Value | Without Mortgage | With Mortgage |
| Less than $50,000 | 0 (0.0%) | 0 (0.0%) |
| $50,000 to $99,999 | 0 (0.0%) | 0 (0.0%) |
| $100,000 to $299,999 | 143 (28.8%) | 278 (33.0%) |
| $300,000 to $499,999 | 263 (52.9%) | 328 (39.0%) |
| $500,000 to $749,999 | 91 (18.3%) | 212 (25.2%) |
| $750,000 to $999,999 | 0 (0.0%) | 18 (2.1%) |
| $1,000,000 or more | 0 (0.0%) | 6 (0.7%) |
| Total | 497 (100.0%) | 842 (100.0%) |
Household Income by Mortgage Status in Skippack
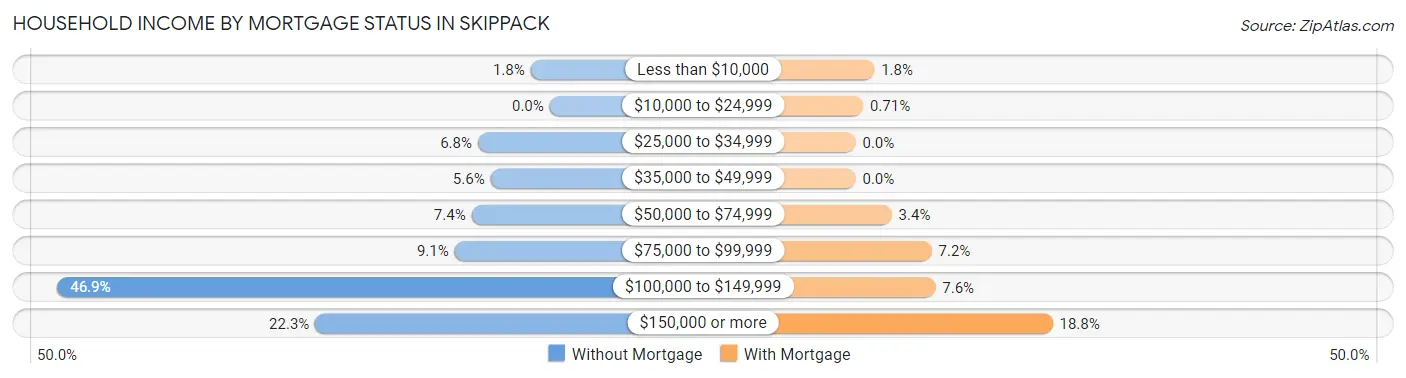
| Household Income | Without Mortgage | With Mortgage |
| Less than $10,000 | 9 (1.8%) | 15 (1.8%) |
| $10,000 to $24,999 | 0 (0.0%) | 6 (0.7%) |
| $25,000 to $34,999 | 34 (6.8%) | 0 (0.0%) |
| $35,000 to $49,999 | 28 (5.6%) | 0 (0.0%) |
| $50,000 to $74,999 | 37 (7.4%) | 29 (3.4%) |
| $75,000 to $99,999 | 45 (9.0%) | 61 (7.2%) |
| $100,000 to $149,999 | 233 (46.9%) | 64 (7.6%) |
| $150,000 or more | 111 (22.3%) | 158 (18.8%) |
| Total | 497 (100.0%) | 842 (100.0%) |
Property Value to Household Income Ratio in Skippack
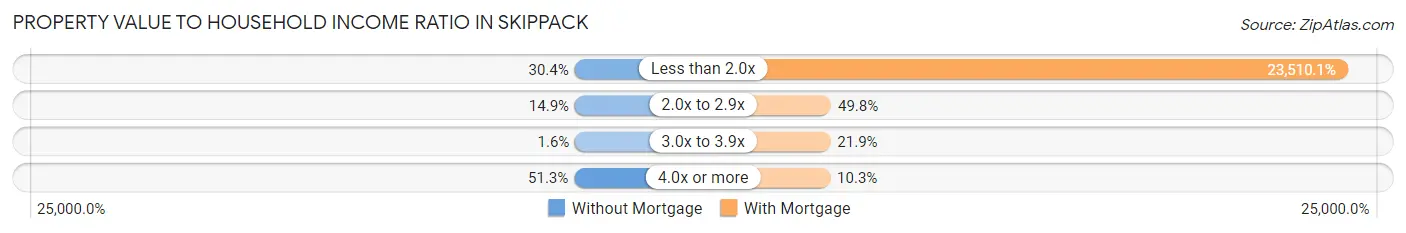
| Value-to-Income Ratio | Without Mortgage | With Mortgage |
| Less than 2.0x | 151 (30.4%) | 197,955 (23,510.1%) |
| 2.0x to 2.9x | 74 (14.9%) | 419 (49.8%) |
| 3.0x to 3.9x | 8 (1.6%) | 184 (21.8%) |
| 4.0x or more | 255 (51.3%) | 87 (10.3%) |
| Total | 497 (100.0%) | 842 (100.0%) |
Real Estate Taxes by Mortgage Status in Skippack
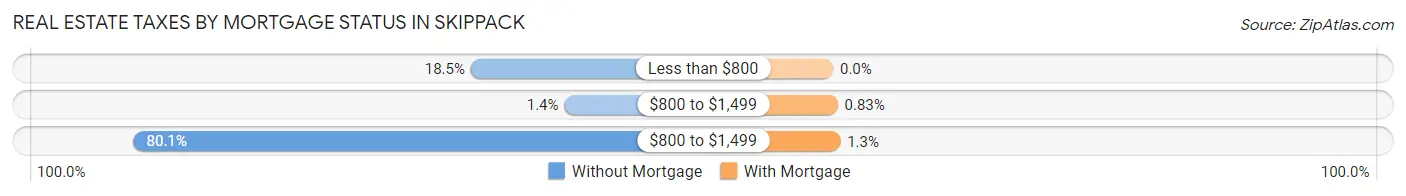
| Property Taxes | Without Mortgage | With Mortgage |
| Less than $800 | 92 (18.5%) | 0 (0.0%) |
| $800 to $1,499 | 7 (1.4%) | 7 (0.8%) |
| $800 to $1,499 | 398 (80.1%) | 11 (1.3%) |
| Total | 497 (100.0%) | 842 (100.0%) |
Health & Disability in Skippack
Health Insurance Coverage by Age in Skippack
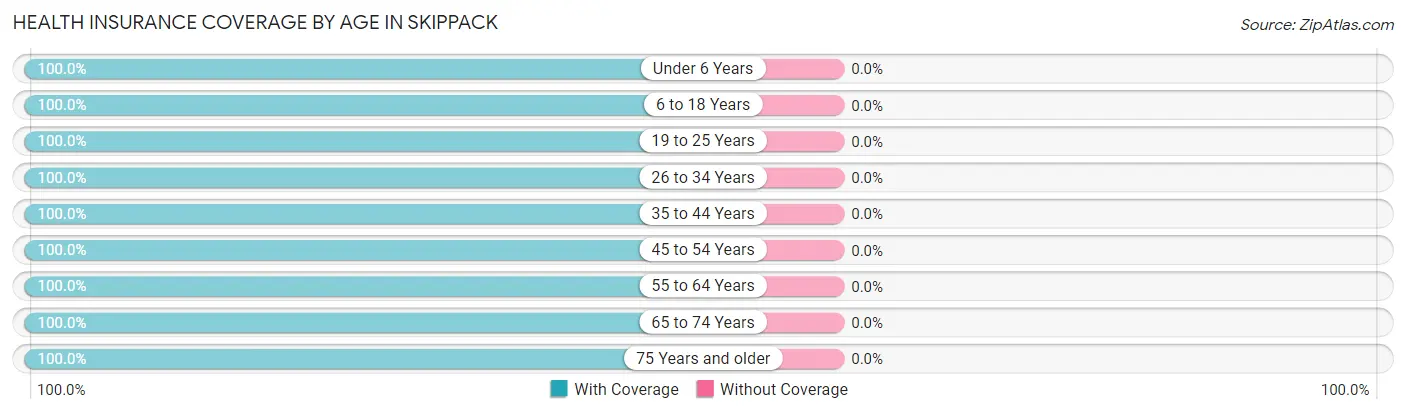
| Age Bracket | With Coverage | Without Coverage |
| Under 6 Years | 149 (100.0%) | 0 (0.0%) |
| 6 to 18 Years | 658 (100.0%) | 0 (0.0%) |
| 19 to 25 Years | 328 (100.0%) | 0 (0.0%) |
| 26 to 34 Years | 292 (100.0%) | 0 (0.0%) |
| 35 to 44 Years | 585 (100.0%) | 0 (0.0%) |
| 45 to 54 Years | 464 (100.0%) | 0 (0.0%) |
| 55 to 64 Years | 880 (100.0%) | 0 (0.0%) |
| 65 to 74 Years | 292 (100.0%) | 0 (0.0%) |
| 75 Years and older | 206 (100.0%) | 0 (0.0%) |
| Total | 3,854 (100.0%) | 0 (0.0%) |
Health Insurance Coverage by Citizenship Status in Skippack
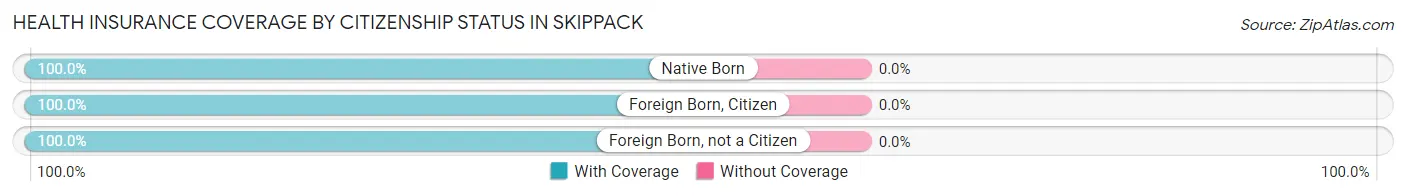
| Citizenship Status | With Coverage | Without Coverage |
| Native Born | 149 (100.0%) | 0 (0.0%) |
| Foreign Born, Citizen | 658 (100.0%) | 0 (0.0%) |
| Foreign Born, not a Citizen | 328 (100.0%) | 0 (0.0%) |
Health Insurance Coverage by Household Income in Skippack
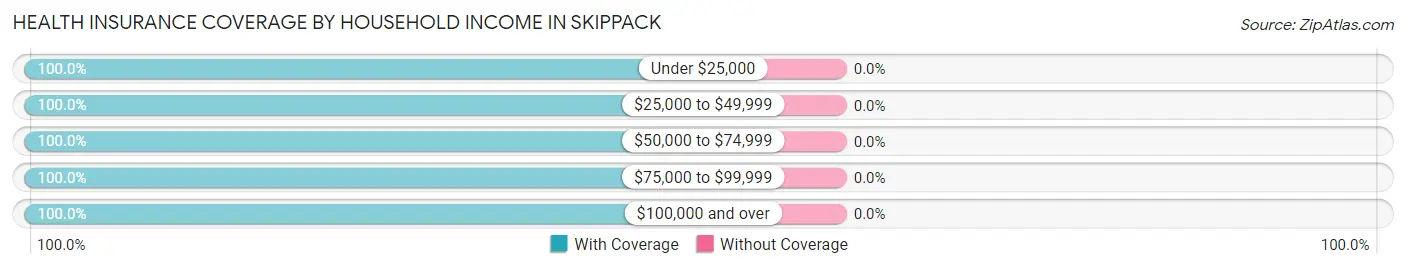
| Household Income | With Coverage | Without Coverage |
| Under $25,000 | 64 (100.0%) | 0 (0.0%) |
| $25,000 to $49,999 | 193 (100.0%) | 0 (0.0%) |
| $50,000 to $74,999 | 265 (100.0%) | 0 (0.0%) |
| $75,000 to $99,999 | 201 (100.0%) | 0 (0.0%) |
| $100,000 and over | 3,130 (100.0%) | 0 (0.0%) |
Public vs Private Health Insurance Coverage by Age in Skippack
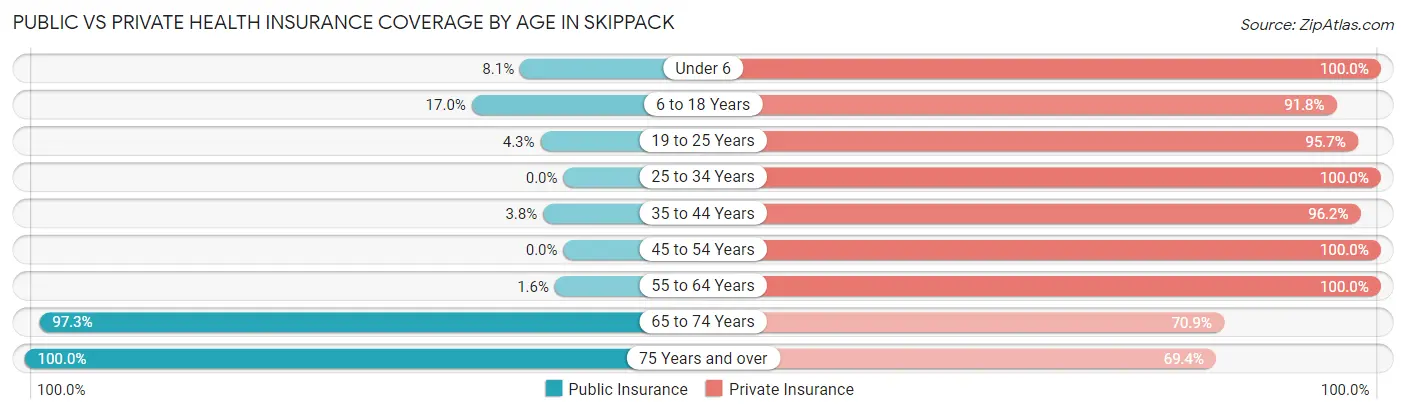
| Age Bracket | Public Insurance | Private Insurance |
| Under 6 | 12 (8.1%) | 149 (100.0%) |
| 6 to 18 Years | 112 (17.0%) | 604 (91.8%) |
| 19 to 25 Years | 14 (4.3%) | 314 (95.7%) |
| 25 to 34 Years | 0 (0.0%) | 292 (100.0%) |
| 35 to 44 Years | 22 (3.8%) | 563 (96.2%) |
| 45 to 54 Years | 0 (0.0%) | 464 (100.0%) |
| 55 to 64 Years | 14 (1.6%) | 880 (100.0%) |
| 65 to 74 Years | 284 (97.3%) | 207 (70.9%) |
| 75 Years and over | 206 (100.0%) | 143 (69.4%) |
| Total | 664 (17.2%) | 3,616 (93.8%) |
Disability Status by Sex by Age in Skippack
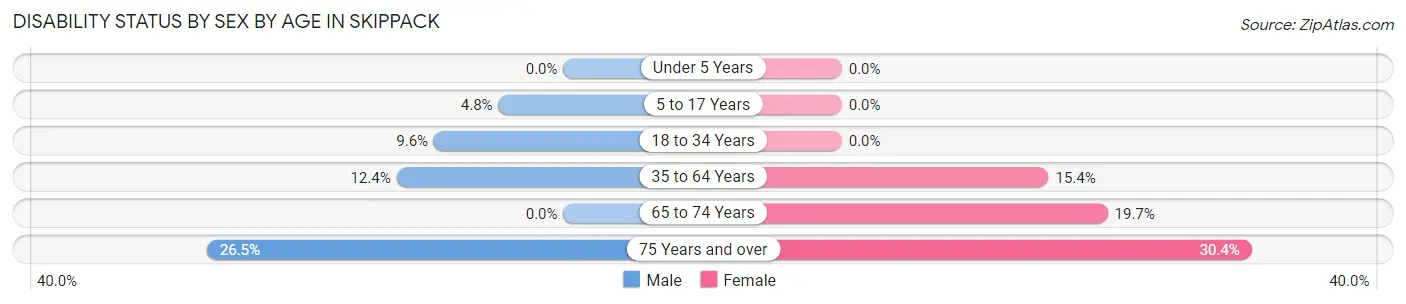
| Age Bracket | Male | Female |
| Under 5 Years | 0 (0.0%) | 0 (0.0%) |
| 5 to 17 Years | 20 (4.8%) | 0 (0.0%) |
| 18 to 34 Years | 37 (9.6%) | 0 (0.0%) |
| 35 to 64 Years | 126 (12.4%) | 140 (15.3%) |
| 65 to 74 Years | 0 (0.0%) | 30 (19.7%) |
| 75 Years and over | 18 (26.5%) | 42 (30.4%) |
Disability Class by Sex by Age in Skippack
Disability Class: Hearing Difficulty
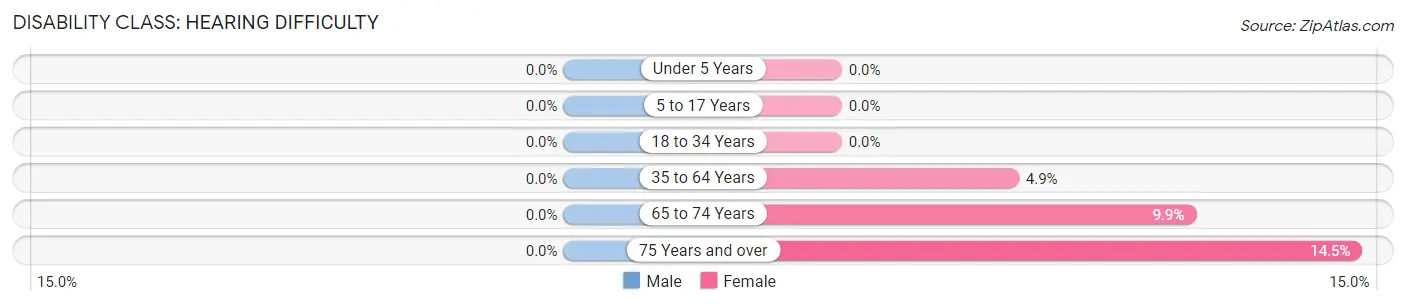
| Age Bracket | Male | Female |
| Under 5 Years | 0 (0.0%) | 0 (0.0%) |
| 5 to 17 Years | 0 (0.0%) | 0 (0.0%) |
| 18 to 34 Years | 0 (0.0%) | 0 (0.0%) |
| 35 to 64 Years | 0 (0.0%) | 45 (4.9%) |
| 65 to 74 Years | 0 (0.0%) | 15 (9.9%) |
| 75 Years and over | 0 (0.0%) | 20 (14.5%) |
Disability Class: Vision Difficulty
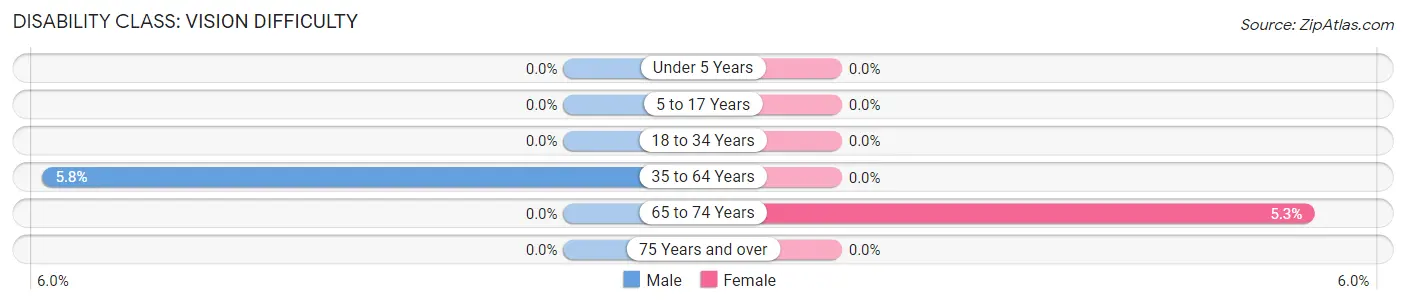
| Age Bracket | Male | Female |
| Under 5 Years | 0 (0.0%) | 0 (0.0%) |
| 5 to 17 Years | 0 (0.0%) | 0 (0.0%) |
| 18 to 34 Years | 0 (0.0%) | 0 (0.0%) |
| 35 to 64 Years | 59 (5.8%) | 0 (0.0%) |
| 65 to 74 Years | 0 (0.0%) | 8 (5.3%) |
| 75 Years and over | 0 (0.0%) | 0 (0.0%) |
Disability Class: Cognitive Difficulty
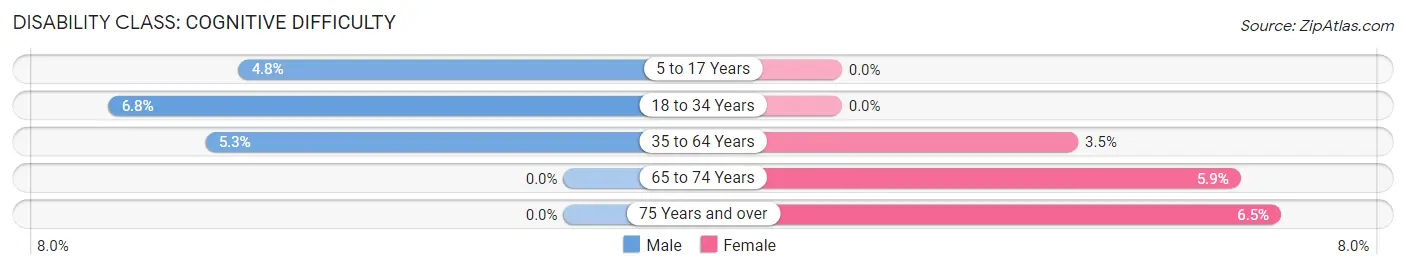
| Age Bracket | Male | Female |
| 5 to 17 Years | 20 (4.8%) | 0 (0.0%) |
| 18 to 34 Years | 26 (6.8%) | 0 (0.0%) |
| 35 to 64 Years | 54 (5.3%) | 32 (3.5%) |
| 65 to 74 Years | 0 (0.0%) | 9 (5.9%) |
| 75 Years and over | 0 (0.0%) | 9 (6.5%) |
Disability Class: Ambulatory Difficulty
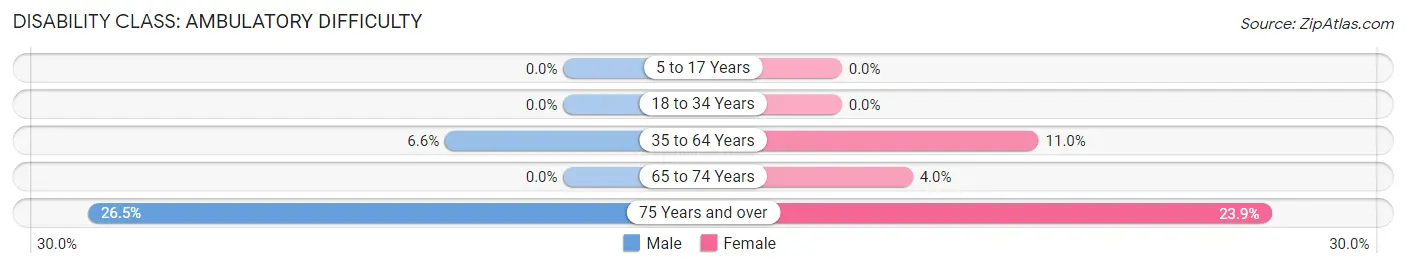
| Age Bracket | Male | Female |
| 5 to 17 Years | 0 (0.0%) | 0 (0.0%) |
| 18 to 34 Years | 0 (0.0%) | 0 (0.0%) |
| 35 to 64 Years | 67 (6.6%) | 100 (11.0%) |
| 65 to 74 Years | 0 (0.0%) | 6 (4.0%) |
| 75 Years and over | 18 (26.5%) | 33 (23.9%) |
Disability Class: Self-Care Difficulty
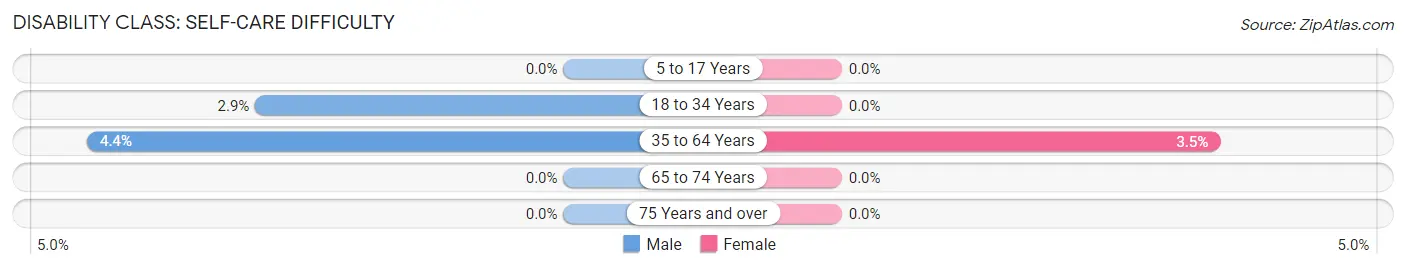
| Age Bracket | Male | Female |
| 5 to 17 Years | 0 (0.0%) | 0 (0.0%) |
| 18 to 34 Years | 11 (2.9%) | 0 (0.0%) |
| 35 to 64 Years | 45 (4.4%) | 32 (3.5%) |
| 65 to 74 Years | 0 (0.0%) | 0 (0.0%) |
| 75 Years and over | 0 (0.0%) | 0 (0.0%) |
Technology Access in Skippack
Computing Device Access in Skippack
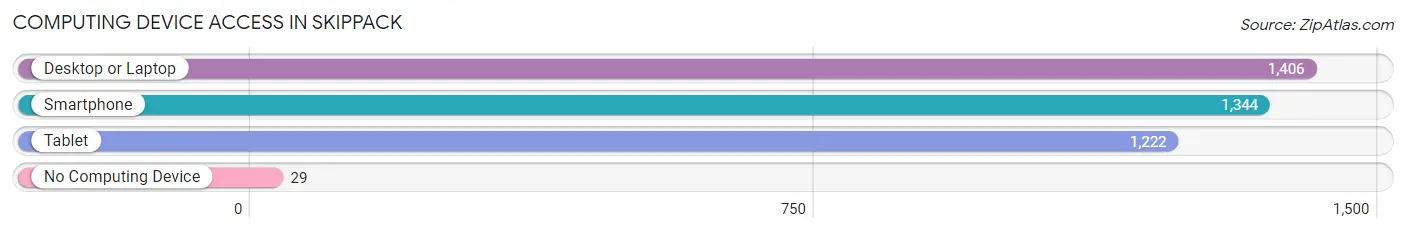
| Device Type | # Households | % Households |
| Desktop or Laptop | 1,406 | 97.6% |
| Smartphone | 1,344 | 93.3% |
| Tablet | 1,222 | 84.8% |
| No Computing Device | 29 | 2.0% |
| Total | 1,441 | 100.0% |
Internet Access in Skippack
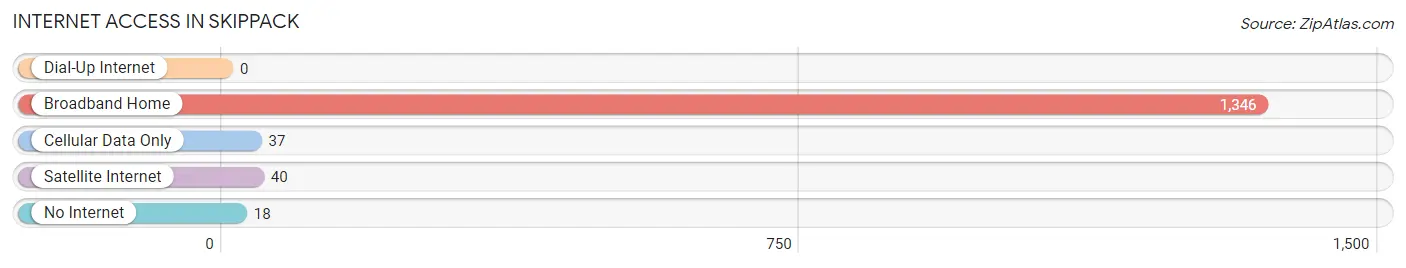
| Internet Type | # Households | % Households |
| Dial-Up Internet | 0 | 0.0% |
| Broadband Home | 1,346 | 93.4% |
| Cellular Data Only | 37 | 2.6% |
| Satellite Internet | 40 | 2.8% |
| No Internet | 18 | 1.3% |
| Total | 1,441 | 100.0% |
Skippack Summary
Skippack, Pennsylvania is a small town located in Montgomery County, Pennsylvania. It is situated in the southeastern part of the state, about 25 miles northwest of Philadelphia. The town is part of the Philadelphia metropolitan area and is home to a population of approximately 4,000 people.
History
Skippack was founded in 1702 by Mennonite settlers from Germany. The town was originally known as “Schippack”, which is derived from the German word “schippen”, meaning “to skip”. The town was officially incorporated in 1845.
The town was a major stop on the Underground Railroad, with many of the town’s residents helping to hide and transport escaped slaves. During the Civil War, Skippack was a major supplier of food and supplies to the Union Army.
Geography
Skippack is located in southeastern Pennsylvania, about 25 miles northwest of Philadelphia. The town is situated in the Perkiomen Valley, which is part of the Great Valley of Pennsylvania. The town is bordered by the townships of Lower Salford, Upper Salford, Franconia, and Perkiomen.
The town is situated on the banks of the Perkiomen Creek, which is a tributary of the Schuylkill River. The town is also home to several small lakes, including Lake Galena and Lake Nockamixon.
Economy
Skippack’s economy is largely based on tourism and retail. The town is home to several small businesses, including restaurants, antique shops, and art galleries. The town is also home to several wineries, including the Stonekeep Meadery and the Skippack Winery.
The town is also home to several large employers, including the Montgomery County government, the Montgomery County Community College, and the Montgomery County Public Schools.
Demographics
As of the 2010 census, Skippack had a population of 4,077 people. The racial makeup of the town was 94.3% White, 1.7% African American, 0.3% Native American, 1.2% Asian, 0.1% Pacific Islander, 1.2% from other races, and 1.4% from two or more races. Hispanic or Latino of any race were 3.2% of the population.
The median household income in Skippack was $68,958, and the median family income was $77,917. The per capita income for the town was $30,945. About 4.2% of families and 5.3% of the population were below the poverty line, including 6.2% of those under age 18 and 4.2% of those age 65 or over.
Common Questions
What is the Total Population of Skippack?
Total Population of Skippack is 3,854.
What is the Total Male Population of Skippack?
Total Male Population of Skippack is 2,065.
What is the Total Female Population of Skippack?
Total Female Population of Skippack is 1,789.
What is the Ratio of Males per 100 Females in Skippack?
There are 115.43 Males per 100 Females in Skippack.
What is the Ratio of Females per 100 Males in Skippack?
There are 86.63 Females per 100 Males in Skippack.
What is the Median Population Age in Skippack?
Median Population Age in Skippack is 42.3 Years.
What is the Average Family Size in Skippack
Average Family Size in Skippack is 3.0 People.
What is the Average Household Size in Skippack
Average Household Size in Skippack is 2.7 People.
What is Per Capita Income in Skippack?
Per Capita income in Skippack is $68,412.
What is the Median Family Income in Skippack?
Median Family Income in Skippack is $148,016.
What is the Median Household income in Skippack?
Median Household Income in Skippack is $137,806.
What is Income or Wage Gap in Skippack?
Income or Wage Gap in Skippack is 20.0%.
Women in Skippack earn 80.0 cents for every dollar earned by a man.
What is Inequality or Gini Index in Skippack?
Inequality or Gini Index in Skippack is 0.38.
How Large is the Labor Force in Skippack?
There are 2,242 People in the Labor Forcein in Skippack.
What is the Percentage of People in the Labor Force in Skippack?
70.8% of People are in the Labor Force in Skippack.
What is the Unemployment Rate in Skippack?
Unemployment Rate in Skippack is 1.2%.