Evansburg, PA
Evansburg Map
Evansburg Overview
2,100
TOTAL POPULATION
910
MALE POPULATION
1,190
FEMALE POPULATION
76.47
MALES / 100 FEMALES
130.77
FEMALES / 100 MALES
41.3
MEDIAN AGE
3.1
AVG FAMILY SIZE
2.4
AVG HOUSEHOLD SIZE
$55,924
PER CAPITA INCOME
$144,563
AVG FAMILY INCOME
$115,386
AVG HOUSEHOLD INCOME
20.0%
WAGE / INCOME GAP [ % ]
80.0¢/ $1
WAGE / INCOME GAP [ $ ]
0.45
INEQUALITY / GINI INDEX
1,159
LABOR FORCE [ PEOPLE ]
64.9%
PERCENT IN LABOR FORCE
7.6%
UNEMPLOYMENT RATE
Race in Evansburg
The most populous races in Evansburg are White / Caucasian (1,814 | 86.4%), Asian (204 | 9.7%), and Black / African American (54 | 2.6%).
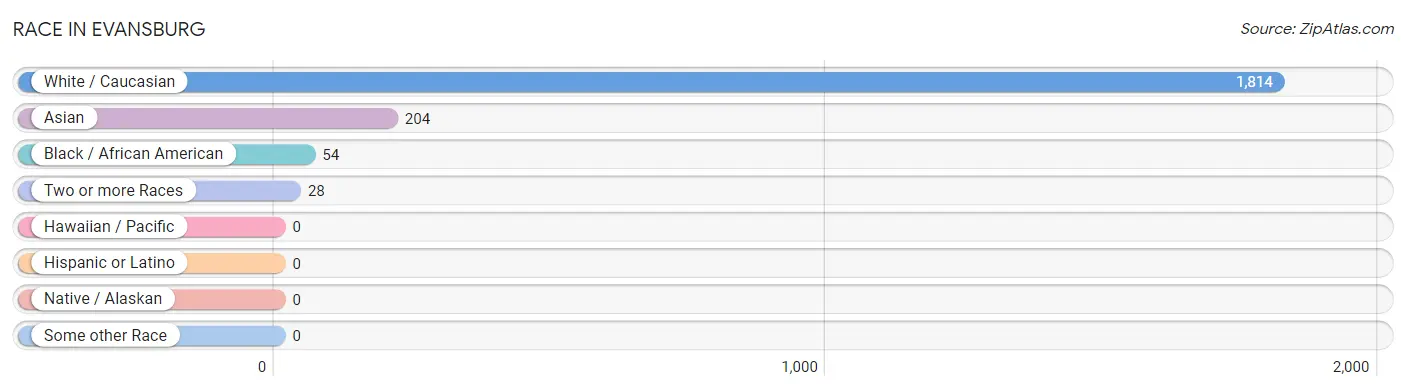
| Race | # Population | % Population |
| Asian | 204 | 9.7% |
| Black / African American | 54 | 2.6% |
| Hawaiian / Pacific | 0 | 0.0% |
| Hispanic or Latino | 0 | 0.0% |
| Native / Alaskan | 0 | 0.0% |
| White / Caucasian | 1,814 | 86.4% |
| Two or more Races | 28 | 1.3% |
| Some other Race | 0 | 0.0% |
| Total | 2,100 | 100.0% |
Ancestry in Evansburg
The most populous ancestries reported in Evansburg are Irish (496 | 23.6%), English (431 | 20.5%), Italian (360 | 17.1%), German (351 | 16.7%), and French (165 | 7.9%), together accounting for 85.9% of all Evansburg residents.
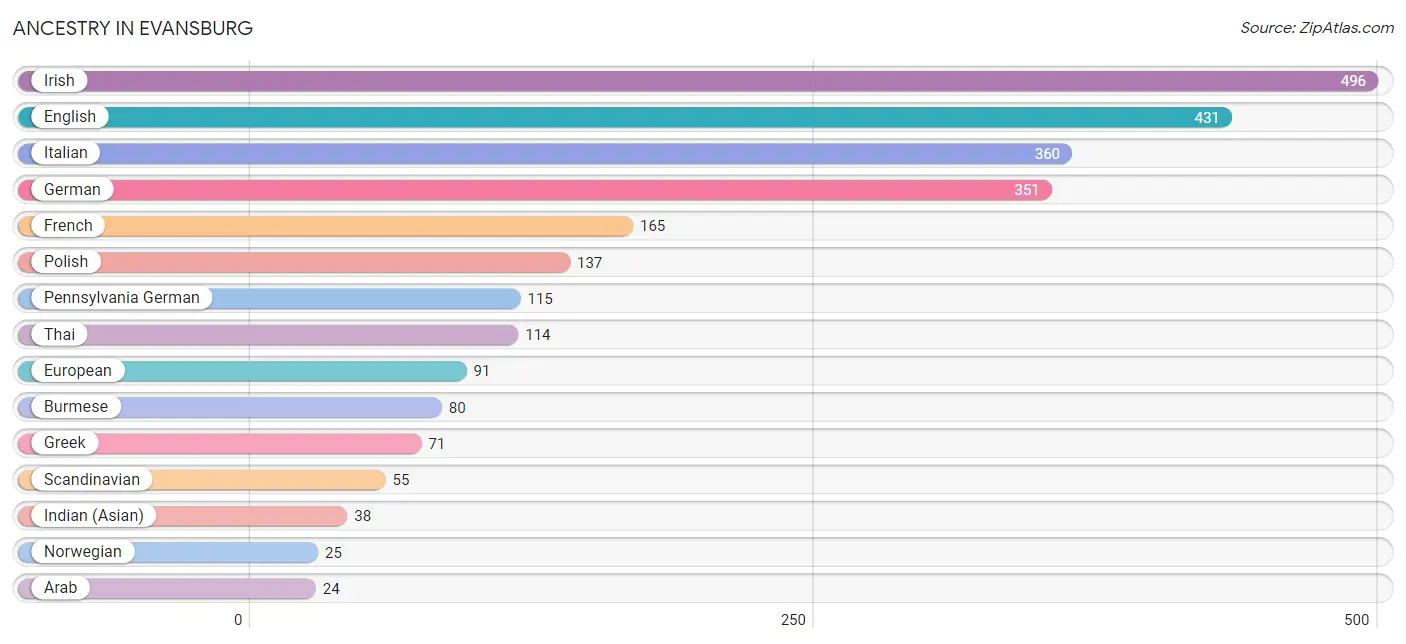
| Ancestry | # Population | % Population |
| American | 14 | 0.7% |
| Arab | 24 | 1.1% |
| Austrian | 6 | 0.3% |
| Burmese | 80 | 3.8% |
| Czech | 21 | 1.0% |
| Dutch | 14 | 0.7% |
| English | 431 | 20.5% |
| European | 91 | 4.3% |
| French | 165 | 7.9% |
| German | 351 | 16.7% |
| Greek | 71 | 3.4% |
| Indian (Asian) | 38 | 1.8% |
| Irish | 496 | 23.6% |
| Italian | 360 | 17.1% |
| Lebanese | 24 | 1.1% |
| Norwegian | 25 | 1.2% |
| Pennsylvania German | 115 | 5.5% |
| Polish | 137 | 6.5% |
| Russian | 6 | 0.3% |
| Scandinavian | 55 | 2.6% |
| Thai | 114 | 5.4% |
| Ukrainian | 10 | 0.5% | View All 22 Rows |
Immigrants in Evansburg
The most numerous immigrant groups reported in Evansburg came from Asia (141 | 6.7%), India (92 | 4.4%), South Central Asia (92 | 4.4%), Eastern Asia (49 | 2.3%), and Korea (29 | 1.4%), together accounting for 19.2% of all Evansburg residents.
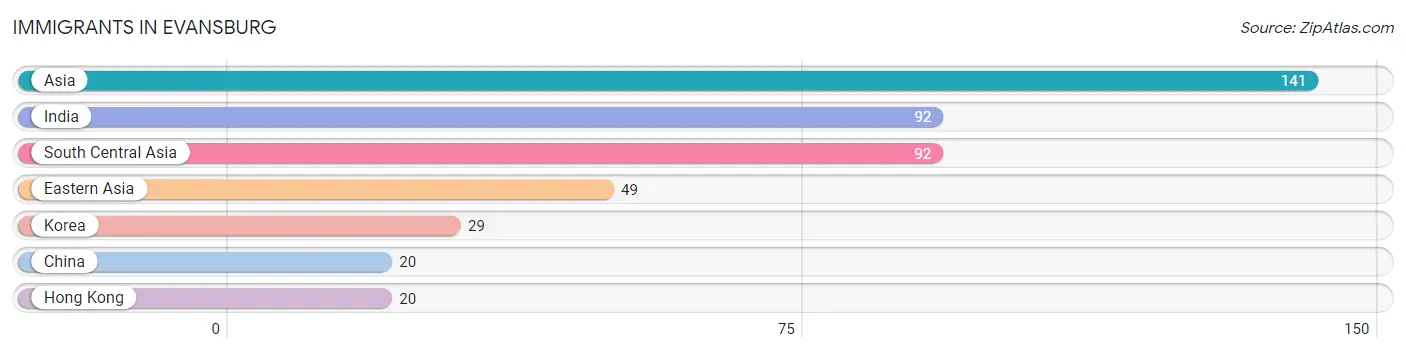
| Immigration Origin | # Population | % Population |
| Asia | 141 | 6.7% |
| China | 20 | 0.9% |
| Eastern Asia | 49 | 2.3% |
| Hong Kong | 20 | 0.9% |
| India | 92 | 4.4% |
| Korea | 29 | 1.4% |
| South Central Asia | 92 | 4.4% | View All 7 Rows |
Sex and Age in Evansburg
Sex and Age in Evansburg
The most populous age groups in Evansburg are 25 to 29 Years (239 | 26.3%) for men and 25 to 29 Years (194 | 16.3%) for women.
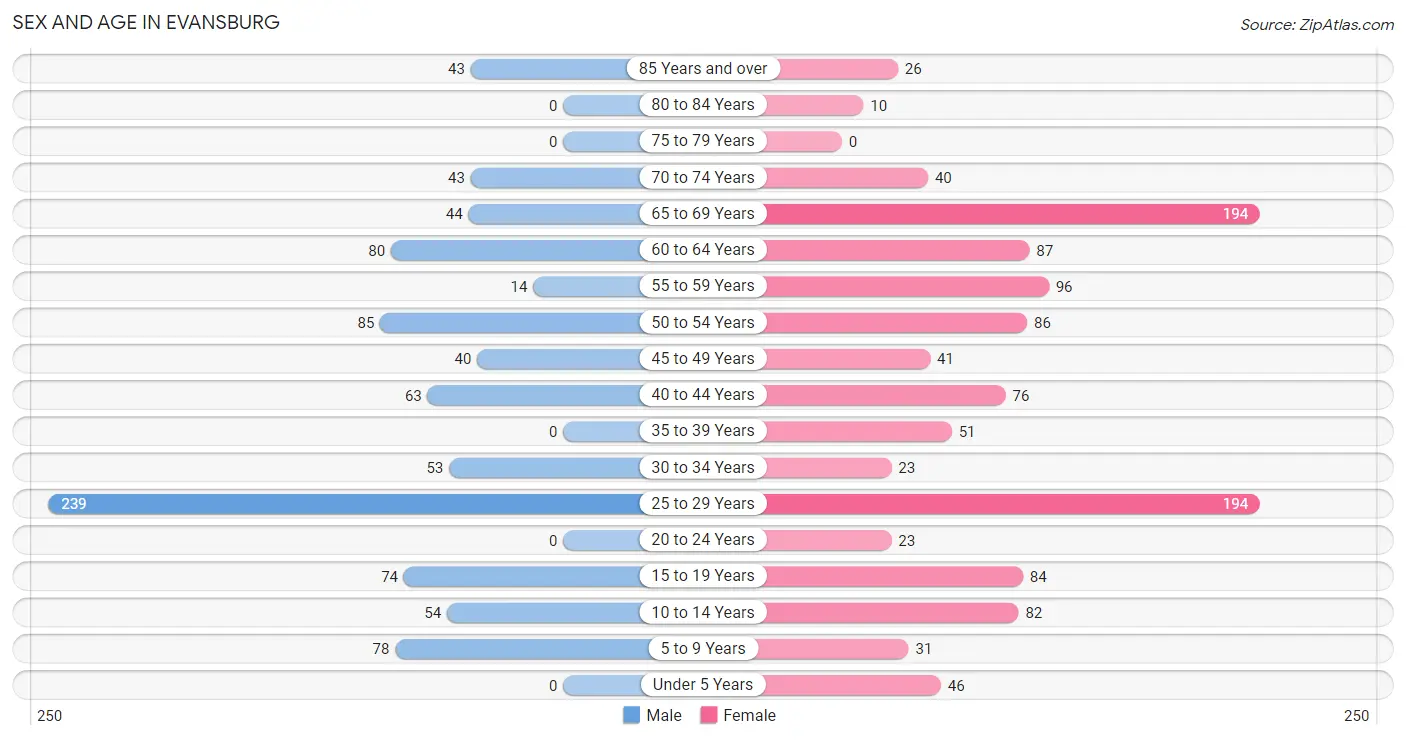
| Age Bracket | Male | Female |
| Under 5 Years | 0 (0.0%) | 46 (3.9%) |
| 5 to 9 Years | 78 (8.6%) | 31 (2.6%) |
| 10 to 14 Years | 54 (5.9%) | 82 (6.9%) |
| 15 to 19 Years | 74 (8.1%) | 84 (7.1%) |
| 20 to 24 Years | 0 (0.0%) | 23 (1.9%) |
| 25 to 29 Years | 239 (26.3%) | 194 (16.3%) |
| 30 to 34 Years | 53 (5.8%) | 23 (1.9%) |
| 35 to 39 Years | 0 (0.0%) | 51 (4.3%) |
| 40 to 44 Years | 63 (6.9%) | 76 (6.4%) |
| 45 to 49 Years | 40 (4.4%) | 41 (3.5%) |
| 50 to 54 Years | 85 (9.3%) | 86 (7.2%) |
| 55 to 59 Years | 14 (1.5%) | 96 (8.1%) |
| 60 to 64 Years | 80 (8.8%) | 87 (7.3%) |
| 65 to 69 Years | 44 (4.8%) | 194 (16.3%) |
| 70 to 74 Years | 43 (4.7%) | 40 (3.4%) |
| 75 to 79 Years | 0 (0.0%) | 0 (0.0%) |
| 80 to 84 Years | 0 (0.0%) | 10 (0.8%) |
| 85 Years and over | 43 (4.7%) | 26 (2.2%) |
| Total | 910 (100.0%) | 1,190 (100.0%) |
Families and Households in Evansburg
Median Family Size in Evansburg
The median family size in Evansburg is 3.09 persons per family, with single male/father families (13 | 2.4%) accounting for the largest median family size of 7.62 persons per family. On the other hand, single female/mother families (119 | 22.1%) represent the smallest median family size with 2.35 persons per family.
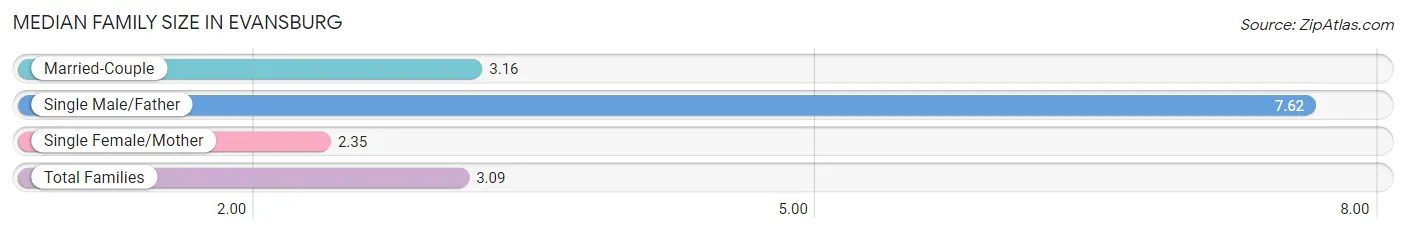
| Family Type | # Families | Family Size |
| Married-Couple | 407 (75.5%) | 3.16 |
| Single Male/Father | 13 (2.4%) | 7.62 |
| Single Female/Mother | 119 (22.1%) | 2.35 |
| Total Families | 539 (100.0%) | 3.09 |
Median Household Size in Evansburg
The median household size in Evansburg is 2.44 persons per household, with single male/father households (13 | 1.5%) accounting for the largest median household size of 7.62 persons per household. non-family households (320 | 37.2%) represent the smallest median household size with 1.28 persons per household.
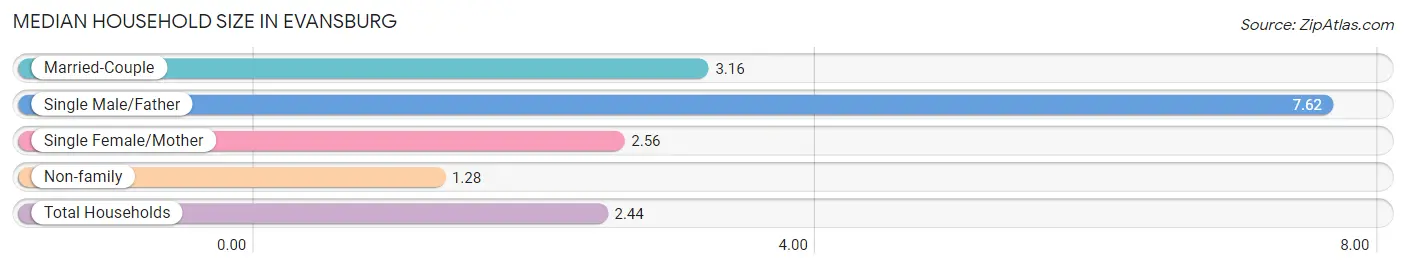
| Household Type | # Households | Household Size |
| Married-Couple | 407 (47.4%) | 3.16 |
| Single Male/Father | 13 (1.5%) | 7.62 |
| Single Female/Mother | 119 (13.9%) | 2.56 |
| Non-family | 320 (37.2%) | 1.28 |
| Total Households | 859 (100.0%) | 2.44 |
Household Size by Marriage Status in Evansburg
Out of a total of 859 households in Evansburg, 539 (62.7%) are family households, while 320 (37.2%) are nonfamily households. The most numerous type of family households are 3-person households, comprising 244, and the most common type of nonfamily households are 1-person households, comprising 238.
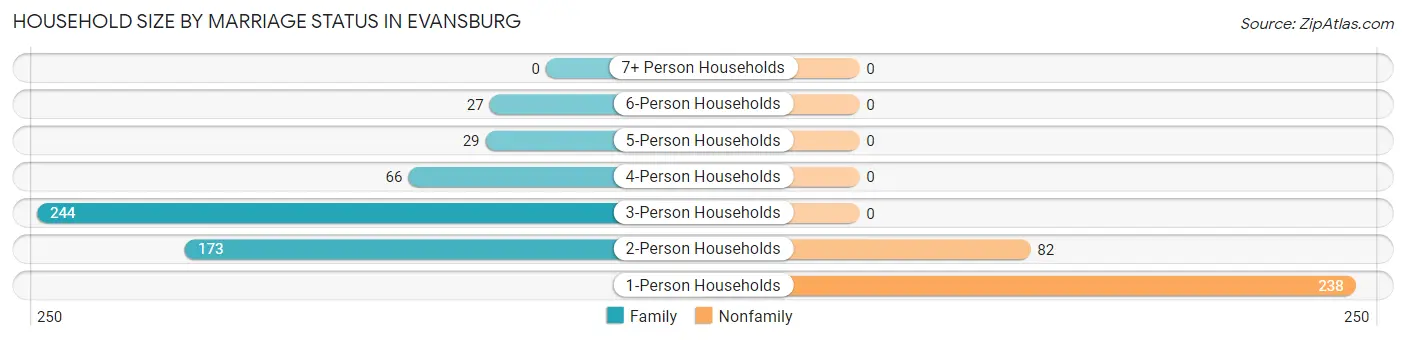
| Household Size | Family Households | Nonfamily Households |
| 1-Person Households | - | 238 (27.7%) |
| 2-Person Households | 173 (20.1%) | 82 (9.6%) |
| 3-Person Households | 244 (28.4%) | 0 (0.0%) |
| 4-Person Households | 66 (7.7%) | 0 (0.0%) |
| 5-Person Households | 29 (3.4%) | 0 (0.0%) |
| 6-Person Households | 27 (3.1%) | 0 (0.0%) |
| 7+ Person Households | 0 (0.0%) | 0 (0.0%) |
| Total | 539 (62.7%) | 320 (37.2%) |
Female Fertility in Evansburg
Fertility by Age in Evansburg
Average fertility rate in Evansburg is 132.0 births per 1,000 women. Women in the age bracket of 20 to 34 years have the highest fertility rate with 279.0 births per 1,000 women. Women in the age bracket of 20 to 34 years acount for 100.0% of all women with births.
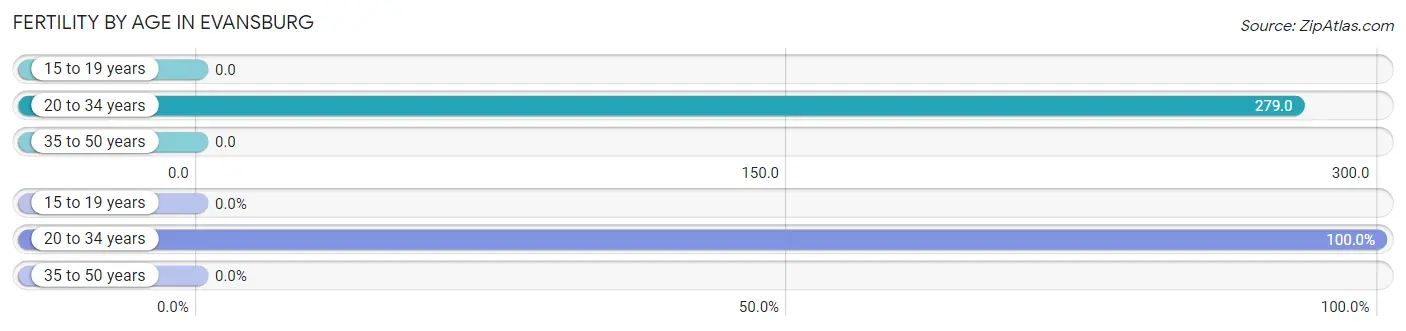
| Age Bracket | Women with Births | Births / 1,000 Women |
| 15 to 19 years | 0 (0.0%) | 0.0 |
| 20 to 34 years | 67 (100.0%) | 279.0 |
| 35 to 50 years | 0 (0.0%) | 0.0 |
| Total | 67 (100.0%) | 132.0 |
Fertility by Age by Marriage Status in Evansburg
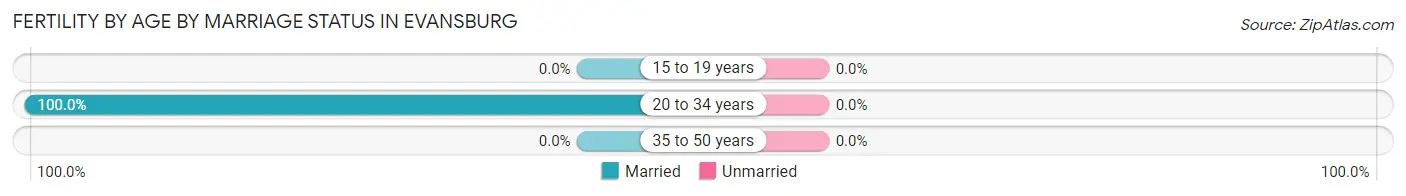
| Age Bracket | Married | Unmarried |
| 15 to 19 years | 0 (0.0%) | 0 (0.0%) |
| 20 to 34 years | 67 (100.0%) | 0 (0.0%) |
| 35 to 50 years | 0 (0.0%) | 0 (0.0%) |
| Total | 67 (100.0%) | 0 (0.0%) |
Fertility by Education in Evansburg
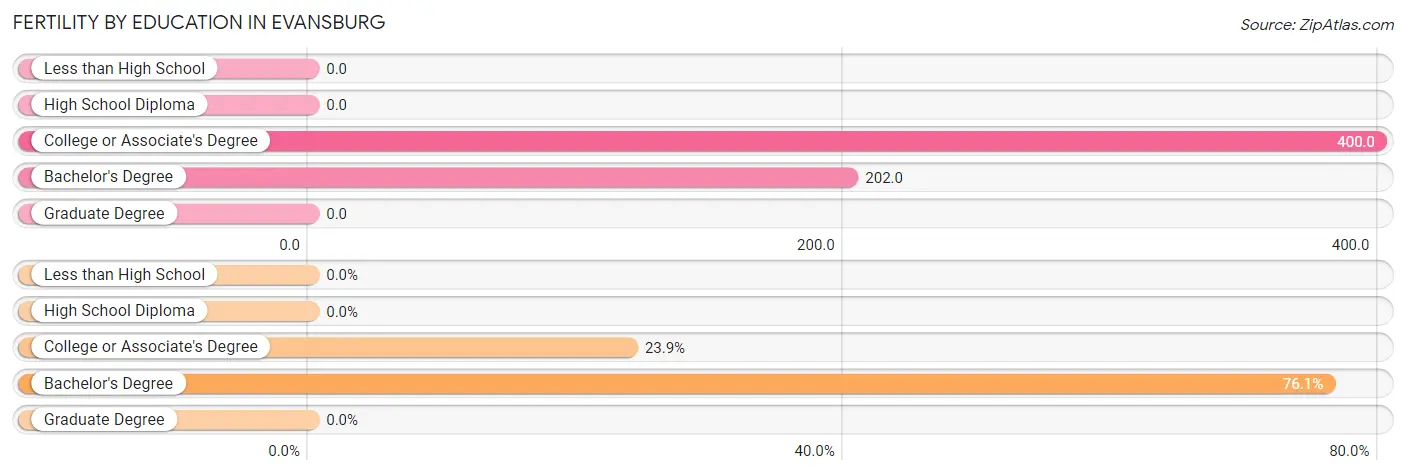
| Educational Attainment | Women with Births | Births / 1,000 Women |
| Less than High School | 0 (0.0%) | 0.0 |
| High School Diploma | 0 (0.0%) | 0.0 |
| College or Associate's Degree | 16 (23.9%) | 400.0 |
| Bachelor's Degree | 51 (76.1%) | 202.0 |
| Graduate Degree | 0 (0.0%) | 0.0 |
| Total | 67 (100.0%) | 132.0 |
Fertility by Education by Marriage Status in Evansburg
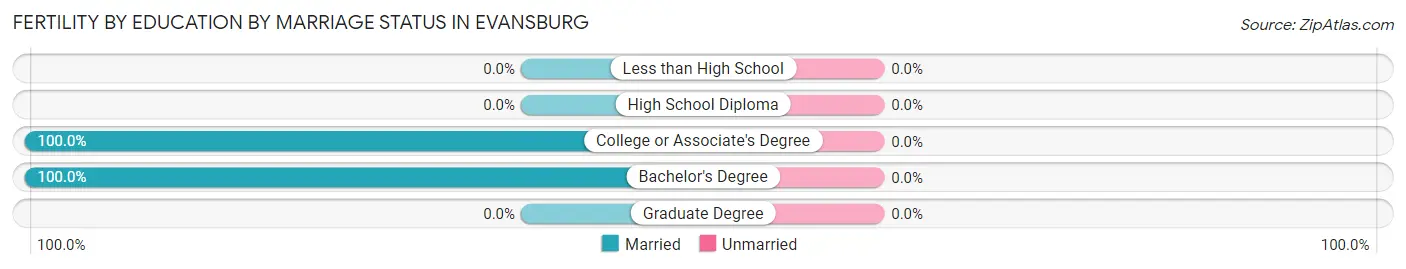
| Educational Attainment | Married | Unmarried |
| Less than High School | 0 (0.0%) | 0 (0.0%) |
| High School Diploma | 0 (0.0%) | 0 (0.0%) |
| College or Associate's Degree | 16 (100.0%) | 0 (0.0%) |
| Bachelor's Degree | 51 (100.0%) | 0 (0.0%) |
| Graduate Degree | 0 (0.0%) | 0 (0.0%) |
| Total | 67 (100.0%) | 0 (0.0%) |
Income in Evansburg
Income Overview in Evansburg
Per Capita Income in Evansburg is $55,924, while median incomes of families and households are $144,563 and $115,386 respectively.
| Characteristic | Number | Measure |
| Per Capita Income | 2,100 | $55,924 |
| Median Family Income | 539 | $144,563 |
| Mean Family Income | 539 | $174,671 |
| Median Household Income | 859 | $115,386 |
| Mean Household Income | 859 | $134,934 |
| Income Deficit | 539 | $0 |
| Wage / Income Gap (%) | 2,100 | 20.02% |
| Wage / Income Gap ($) | 2,100 | 79.98¢ per $1 |
| Gini / Inequality Index | 2,100 | 0.45 |
Earnings by Sex in Evansburg
Average Earnings in Evansburg are $57,075, $58,598 for men and $46,865 for women, a difference of 20.0%.
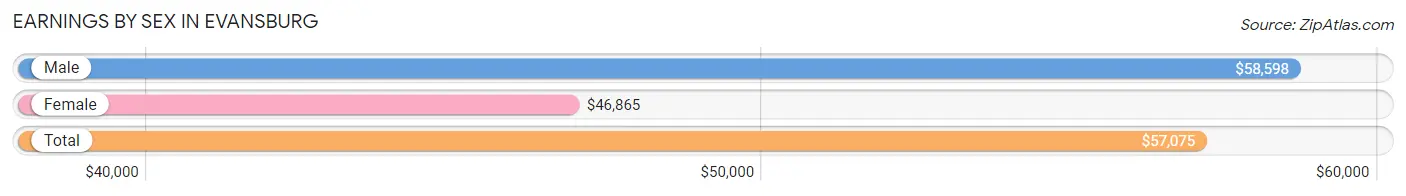
| Sex | Number | Average Earnings |
| Male | 586 (48.6%) | $58,598 |
| Female | 620 (51.4%) | $46,865 |
| Total | 1,206 (100.0%) | $57,075 |
Earnings by Sex by Income Bracket in Evansburg
The most common earnings brackets in Evansburg are $100,000+ for men (198 | 33.8%) and $100,000+ for women (211 | 34.0%).
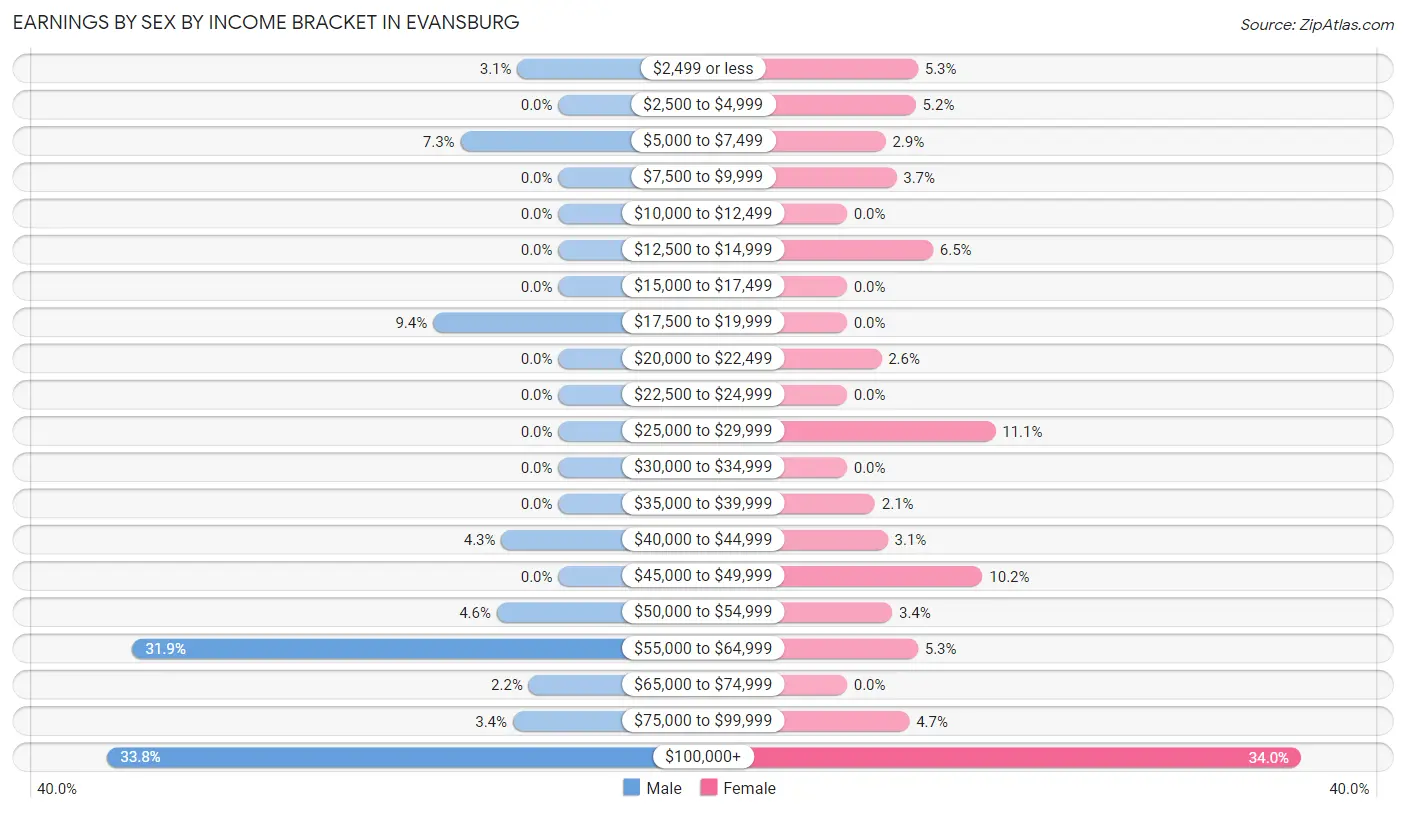
| Income | Male | Female |
| $2,499 or less | 18 (3.1%) | 33 (5.3%) |
| $2,500 to $4,999 | 0 (0.0%) | 32 (5.2%) |
| $5,000 to $7,499 | 43 (7.3%) | 18 (2.9%) |
| $7,500 to $9,999 | 0 (0.0%) | 23 (3.7%) |
| $10,000 to $12,499 | 0 (0.0%) | 0 (0.0%) |
| $12,500 to $14,999 | 0 (0.0%) | 40 (6.5%) |
| $15,000 to $17,499 | 0 (0.0%) | 0 (0.0%) |
| $17,500 to $19,999 | 55 (9.4%) | 0 (0.0%) |
| $20,000 to $22,499 | 0 (0.0%) | 16 (2.6%) |
| $22,500 to $24,999 | 0 (0.0%) | 0 (0.0%) |
| $25,000 to $29,999 | 0 (0.0%) | 69 (11.1%) |
| $30,000 to $34,999 | 0 (0.0%) | 0 (0.0%) |
| $35,000 to $39,999 | 0 (0.0%) | 13 (2.1%) |
| $40,000 to $44,999 | 25 (4.3%) | 19 (3.1%) |
| $45,000 to $49,999 | 0 (0.0%) | 63 (10.2%) |
| $50,000 to $54,999 | 27 (4.6%) | 21 (3.4%) |
| $55,000 to $64,999 | 187 (31.9%) | 33 (5.3%) |
| $65,000 to $74,999 | 13 (2.2%) | 0 (0.0%) |
| $75,000 to $99,999 | 20 (3.4%) | 29 (4.7%) |
| $100,000+ | 198 (33.8%) | 211 (34.0%) |
| Total | 586 (100.0%) | 620 (100.0%) |
Earnings by Sex by Educational Attainment in Evansburg
Average earnings in Evansburg are $58,872 for men and $51,429 for women, a difference of 12.6%. Men with an educational attainment of graduate degree enjoy the highest average annual earnings of $143,688, while those with college or associate's degree education earn the least with $56,952. Women with an educational attainment of graduate degree earn the most with the average annual earnings of $108,933, while those with bachelor's degree education have the smallest earnings of $62,656.
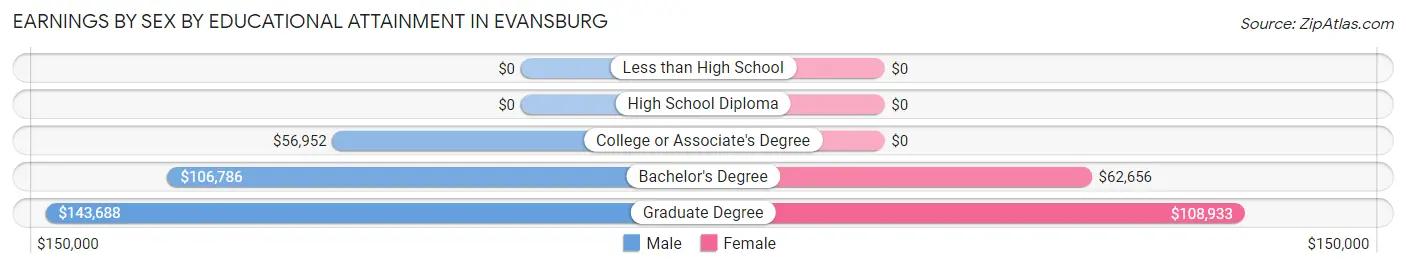
| Educational Attainment | Male Income | Female Income |
| Less than High School | - | - |
| High School Diploma | - | - |
| College or Associate's Degree | $56,952 | $0 |
| Bachelor's Degree | $106,786 | $62,656 |
| Graduate Degree | $143,688 | $108,933 |
| Total | $58,872 | $51,429 |
Family Income in Evansburg
Family Income Brackets in Evansburg
According to the Evansburg family income data, there are 172 families falling into the $200,000+ income range, which is the most common income bracket and makes up 31.9% of all families.
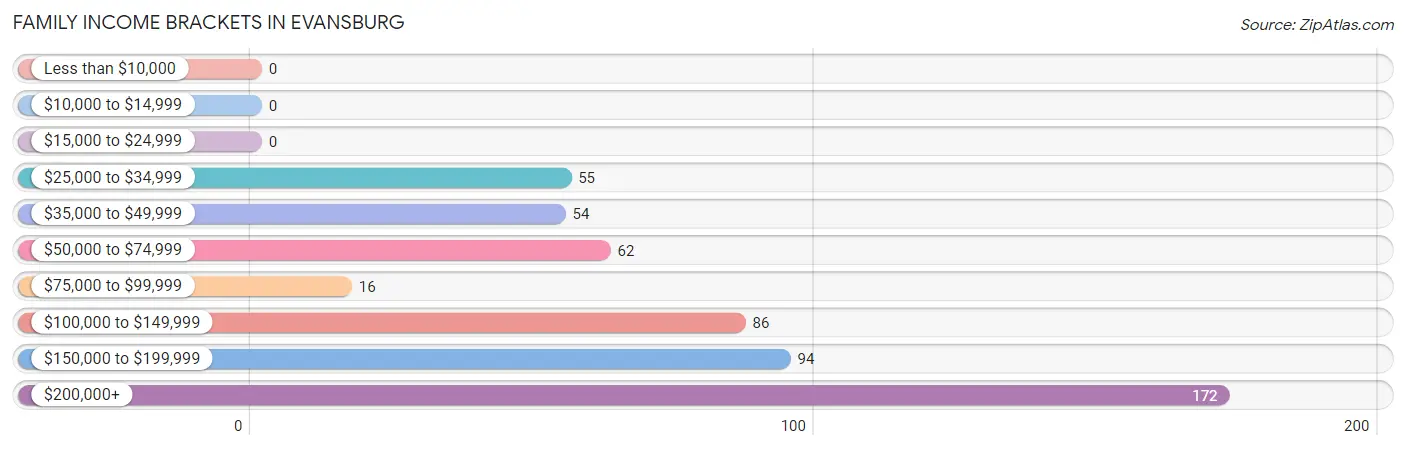
| Income Bracket | # Families | % Families |
| Less than $10,000 | 0 | 0.0% |
| $10,000 to $14,999 | 0 | 0.0% |
| $15,000 to $24,999 | 0 | 0.0% |
| $25,000 to $34,999 | 55 | 10.2% |
| $35,000 to $49,999 | 54 | 10.0% |
| $50,000 to $74,999 | 62 | 11.5% |
| $75,000 to $99,999 | 16 | 3.0% |
| $100,000 to $149,999 | 86 | 16.0% |
| $150,000 to $199,999 | 94 | 17.4% |
| $200,000+ | 172 | 31.9% |
Family Income by Famaliy Size in Evansburg
4-person families (66 | 12.2%) account for the highest median family income in Evansburg with $216,900 per family, while 4-person families (66 | 12.2%) have the highest median income of $54,225 per family member.
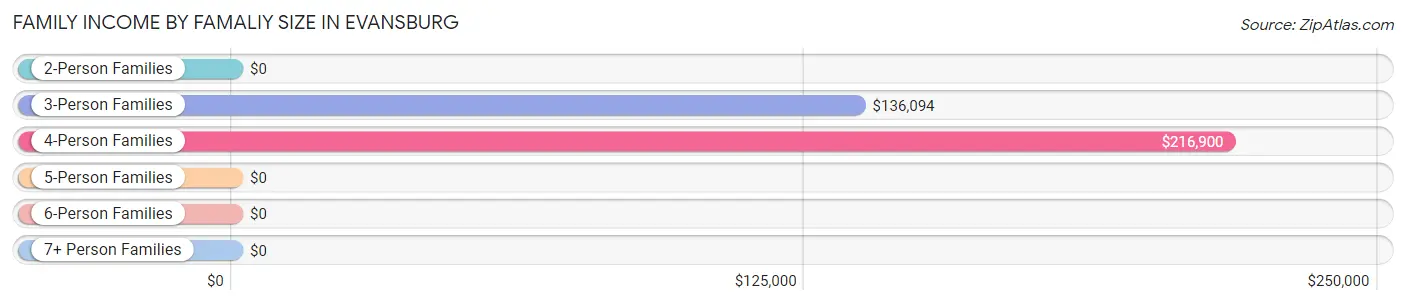
| Income Bracket | # Families | Median Income |
| 2-Person Families | 194 (36.0%) | $0 |
| 3-Person Families | 223 (41.4%) | $136,094 |
| 4-Person Families | 66 (12.2%) | $216,900 |
| 5-Person Families | 29 (5.4%) | $0 |
| 6-Person Families | 27 (5.0%) | $0 |
| 7+ Person Families | 0 (0.0%) | $0 |
| Total | 539 (100.0%) | $144,563 |
Family Income by Number of Earners in Evansburg
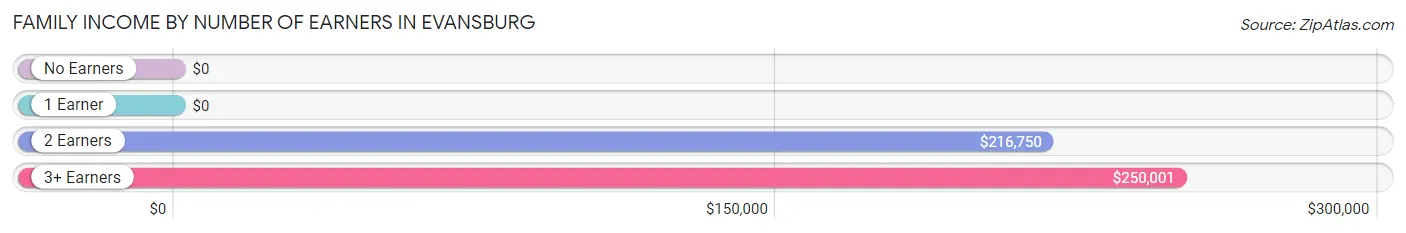
| Number of Earners | # Families | Median Income |
| No Earners | 29 (5.4%) | $0 |
| 1 Earner | 214 (39.7%) | $0 |
| 2 Earners | 225 (41.7%) | $216,750 |
| 3+ Earners | 71 (13.2%) | $250,001 |
| Total | 539 (100.0%) | $144,563 |
Household Income in Evansburg
Household Income Brackets in Evansburg
With 244 households falling in the category, the $35,000 to $49,999 income range is the most frequent in Evansburg, accounting for 28.4% of all households.
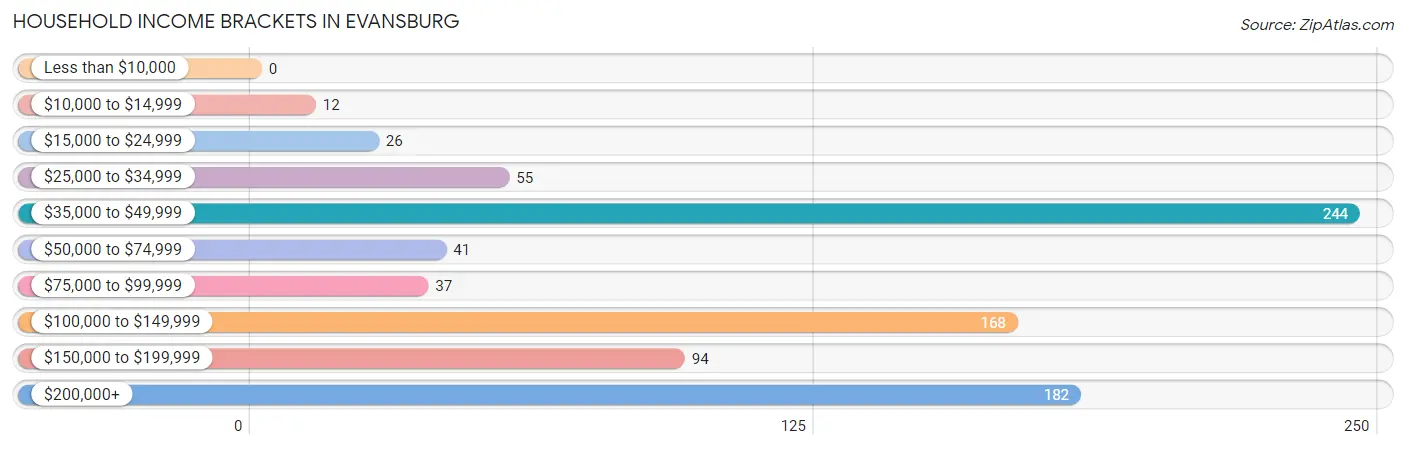
| Income Bracket | # Households | % Households |
| Less than $10,000 | 0 | 0.0% |
| $10,000 to $14,999 | 12 | 1.4% |
| $15,000 to $24,999 | 26 | 3.0% |
| $25,000 to $34,999 | 55 | 6.4% |
| $35,000 to $49,999 | 244 | 28.4% |
| $50,000 to $74,999 | 41 | 4.8% |
| $75,000 to $99,999 | 37 | 4.3% |
| $100,000 to $149,999 | 168 | 19.6% |
| $150,000 to $199,999 | 94 | 10.9% |
| $200,000+ | 182 | 21.2% |
Household Income by Householder Age in Evansburg
The median household income in Evansburg is $115,386, with the highest median household income of $169,135 found in the 45 to 64 years age bracket for the primary householder. A total of 316 households (36.8%) fall into this category.
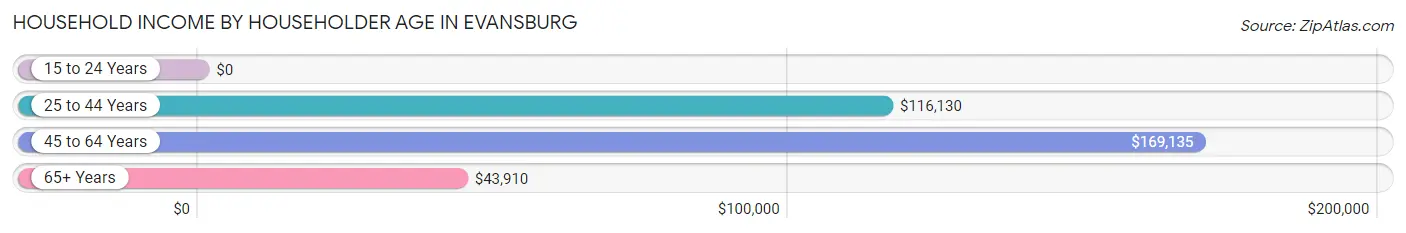
| Income Bracket | # Households | Median Income |
| 15 to 24 Years | 0 (0.0%) | $0 |
| 25 to 44 Years | 265 (30.8%) | $116,130 |
| 45 to 64 Years | 316 (36.8%) | $169,135 |
| 65+ Years | 278 (32.4%) | $43,910 |
| Total | 859 (100.0%) | $115,386 |
Poverty in Evansburg
Income Below Poverty by Sex and Age in Evansburg
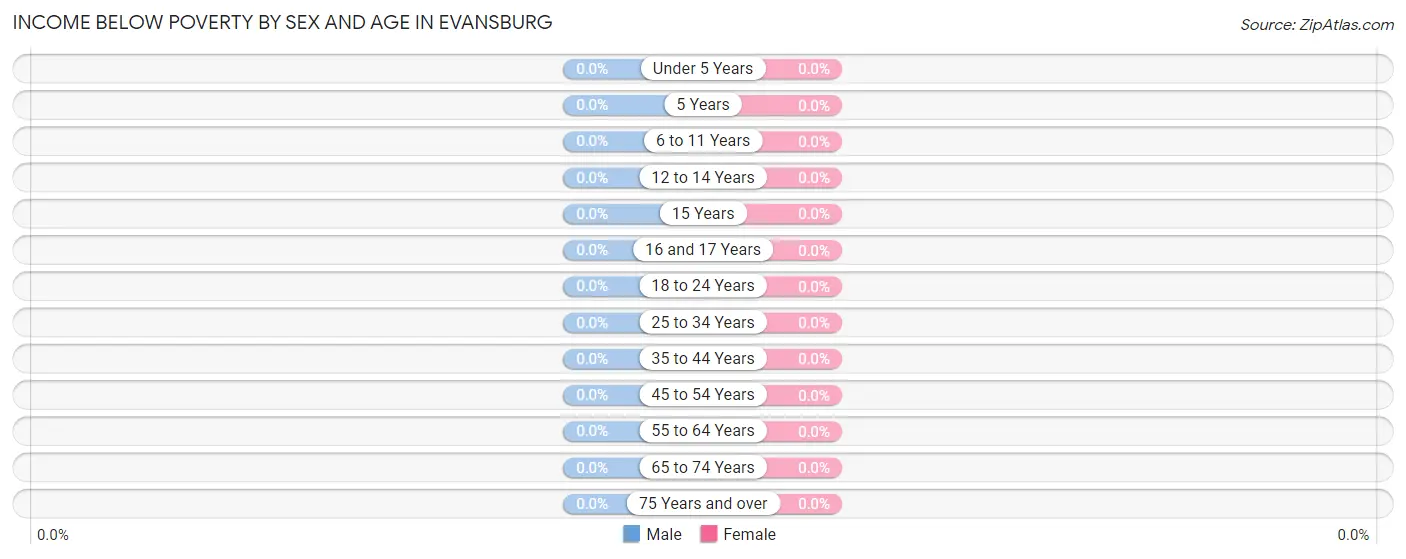
| Age Bracket | Male | Female |
| Under 5 Years | 0 (0.0%) | 0 (0.0%) |
| 5 Years | 0 (0.0%) | 0 (0.0%) |
| 6 to 11 Years | 0 (0.0%) | 0 (0.0%) |
| 12 to 14 Years | 0 (0.0%) | 0 (0.0%) |
| 15 Years | 0 (0.0%) | 0 (0.0%) |
| 16 and 17 Years | 0 (0.0%) | 0 (0.0%) |
| 18 to 24 Years | 0 (0.0%) | 0 (0.0%) |
| 25 to 34 Years | 0 (0.0%) | 0 (0.0%) |
| 35 to 44 Years | 0 (0.0%) | 0 (0.0%) |
| 45 to 54 Years | 0 (0.0%) | 0 (0.0%) |
| 55 to 64 Years | 0 (0.0%) | 0 (0.0%) |
| 65 to 74 Years | 0 (0.0%) | 0 (0.0%) |
| 75 Years and over | 0 (0.0%) | 0 (0.0%) |
| Total | 0 (0.0%) | 0 (0.0%) |
Income Above Poverty by Sex and Age in Evansburg
According to the poverty statistics in Evansburg, males aged 6 to 11 years and females aged under 5 years are the age groups that are most secure financially, with 100.0% of males and 100.0% of females in these age groups living above the poverty line.
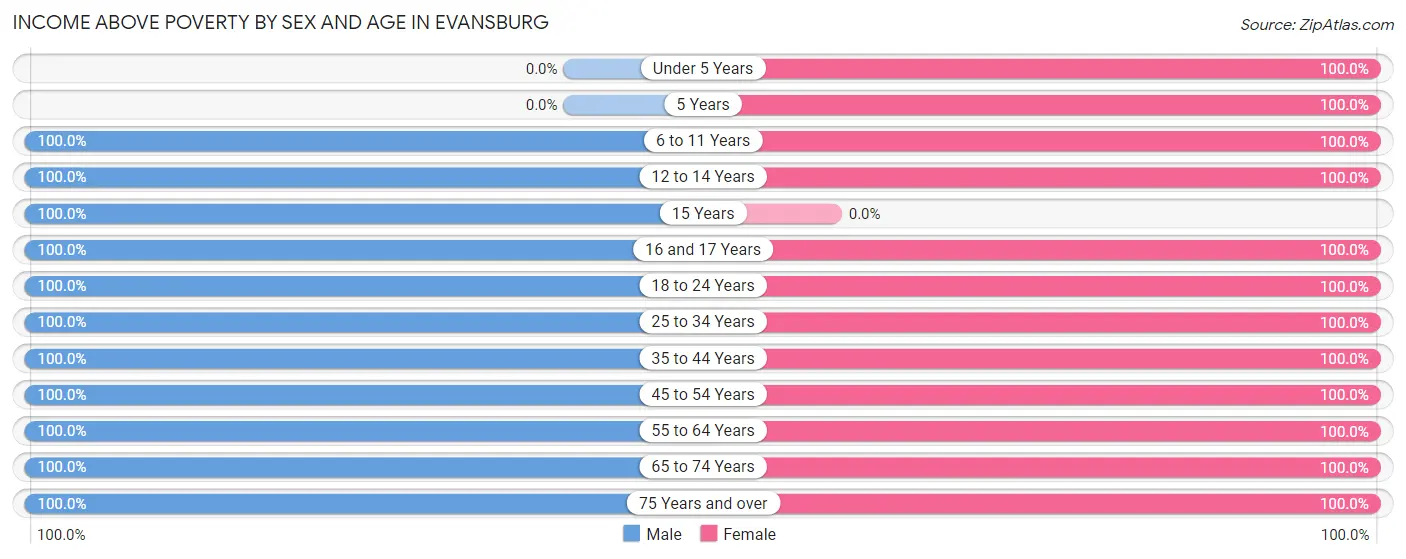
| Age Bracket | Male | Female |
| Under 5 Years | 0 (0.0%) | 46 (100.0%) |
| 5 Years | 0 (0.0%) | 11 (100.0%) |
| 6 to 11 Years | 101 (100.0%) | 71 (100.0%) |
| 12 to 14 Years | 31 (100.0%) | 31 (100.0%) |
| 15 Years | 23 (100.0%) | 0 (0.0%) |
| 16 and 17 Years | 33 (100.0%) | 54 (100.0%) |
| 18 to 24 Years | 18 (100.0%) | 53 (100.0%) |
| 25 to 34 Years | 292 (100.0%) | 217 (100.0%) |
| 35 to 44 Years | 63 (100.0%) | 127 (100.0%) |
| 45 to 54 Years | 125 (100.0%) | 127 (100.0%) |
| 55 to 64 Years | 94 (100.0%) | 183 (100.0%) |
| 65 to 74 Years | 87 (100.0%) | 234 (100.0%) |
| 75 Years and over | 43 (100.0%) | 36 (100.0%) |
| Total | 910 (100.0%) | 1,190 (100.0%) |
Income Below Poverty Among Married-Couple Families in Evansburg
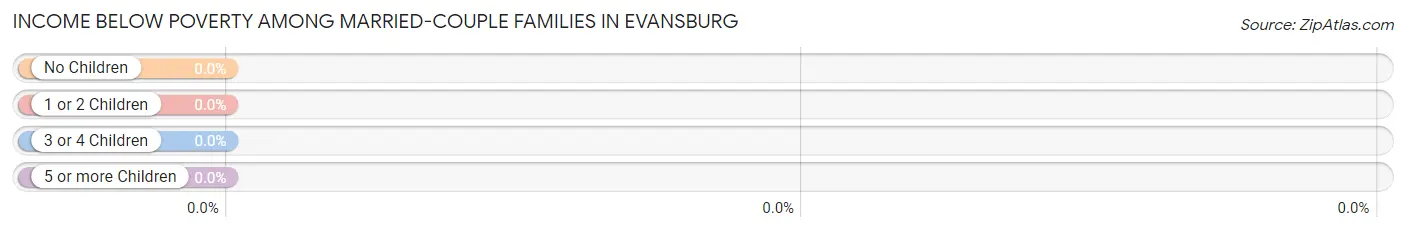
| Children | Above Poverty | Below Poverty |
| No Children | 174 (100.0%) | 0 (0.0%) |
| 1 or 2 Children | 204 (100.0%) | 0 (0.0%) |
| 3 or 4 Children | 29 (100.0%) | 0 (0.0%) |
| 5 or more Children | 0 (0.0%) | 0 (0.0%) |
| Total | 407 (100.0%) | 0 (0.0%) |
Income Below Poverty Among Single-Parent Households in Evansburg
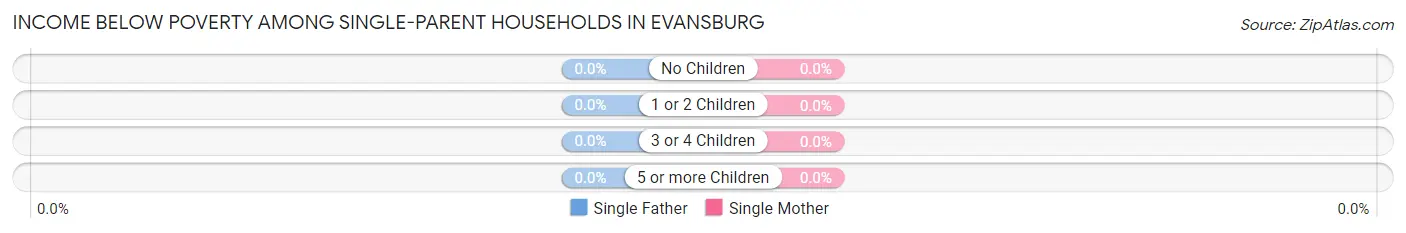
| Children | Single Father | Single Mother |
| No Children | 0 (0.0%) | 0 (0.0%) |
| 1 or 2 Children | 0 (0.0%) | 0 (0.0%) |
| 3 or 4 Children | 0 (0.0%) | 0 (0.0%) |
| 5 or more Children | 0 (0.0%) | 0 (0.0%) |
| Total | 0 (0.0%) | 0 (0.0%) |
Income Below Poverty Among Married-Couple vs Single-Parent Households in Evansburg
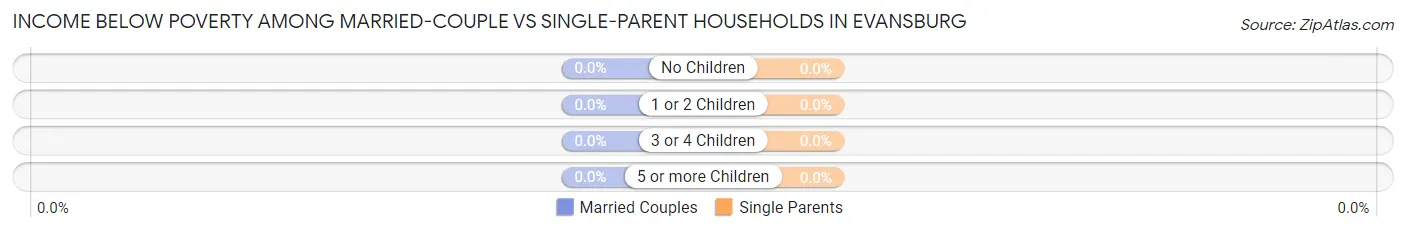
| Children | Married-Couple Families | Single-Parent Households |
| No Children | 0 (0.0%) | 0 (0.0%) |
| 1 or 2 Children | 0 (0.0%) | 0 (0.0%) |
| 3 or 4 Children | 0 (0.0%) | 0 (0.0%) |
| 5 or more Children | 0 (0.0%) | 0 (0.0%) |
| Total | 0 (0.0%) | 0 (0.0%) |
Employment Characteristics in Evansburg
Employment by Class of Employer in Evansburg
Among the 1,071 employed individuals in Evansburg, private company employees (829 | 77.4%), local government employees (68 | 6.4%), and not-for-profit organizations (67 | 6.3%) make up the most common classes of employment.
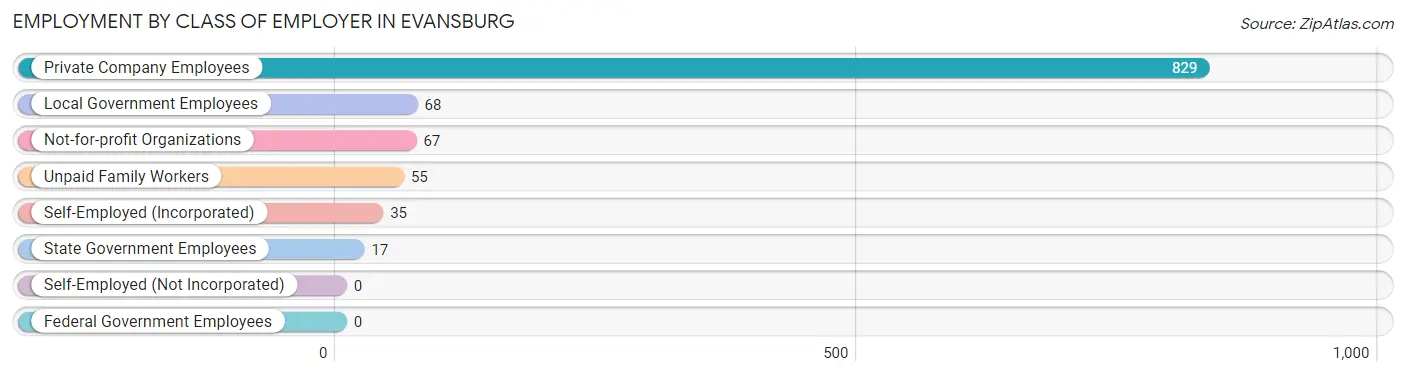
| Employer Class | # Employees | % Employees |
| Private Company Employees | 829 | 77.4% |
| Self-Employed (Incorporated) | 35 | 3.3% |
| Self-Employed (Not Incorporated) | 0 | 0.0% |
| Not-for-profit Organizations | 67 | 6.3% |
| Local Government Employees | 68 | 6.4% |
| State Government Employees | 17 | 1.6% |
| Federal Government Employees | 0 | 0.0% |
| Unpaid Family Workers | 55 | 5.1% |
| Total | 1,071 | 100.0% |
Employment Status by Age in Evansburg
According to the labor force statistics for Evansburg, out of the total population over 16 years of age (1,786), 64.9% or 1,159 individuals are in the labor force, with 7.6% or 88 of them unemployed. The age group with the highest labor force participation rate is 20 to 24 years, with 100.0% or 23 individuals in the labor force. Within the labor force, the 16 to 19 years age range has the highest percentage of unemployed individuals, with 63.3% or 31 of them being unemployed.
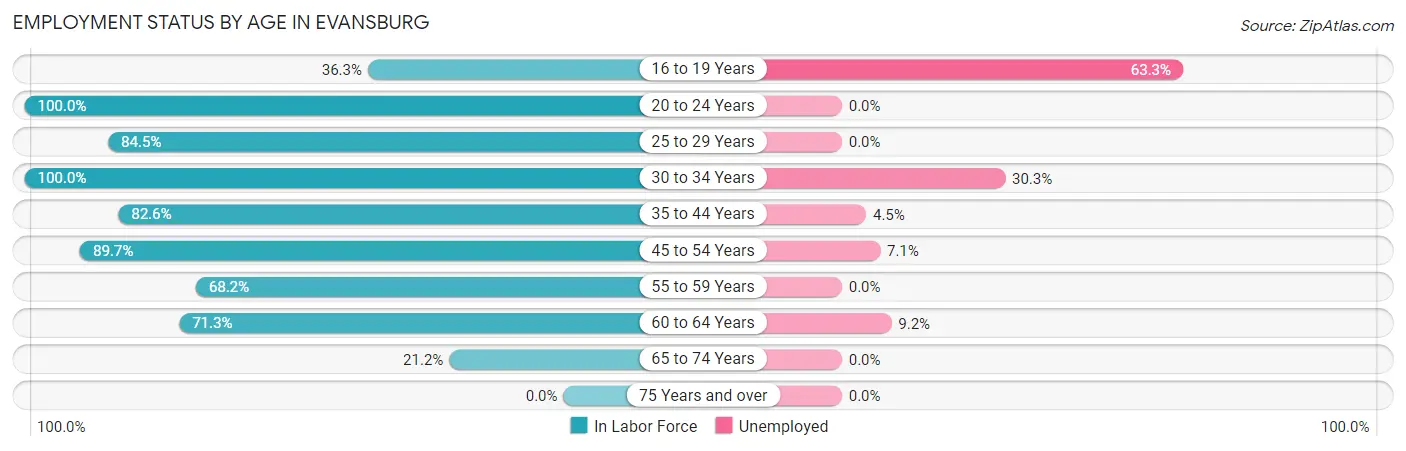
| Age Bracket | In Labor Force | Unemployed |
| 16 to 19 Years | 49 (36.3%) | 31 (63.3%) |
| 20 to 24 Years | 23 (100.0%) | 0 (0.0%) |
| 25 to 29 Years | 366 (84.5%) | 0 (0.0%) |
| 30 to 34 Years | 76 (100.0%) | 23 (30.3%) |
| 35 to 44 Years | 157 (82.6%) | 7 (4.5%) |
| 45 to 54 Years | 226 (89.7%) | 16 (7.1%) |
| 55 to 59 Years | 75 (68.2%) | 0 (0.0%) |
| 60 to 64 Years | 119 (71.3%) | 11 (9.2%) |
| 65 to 74 Years | 68 (21.2%) | 0 (0.0%) |
| 75 Years and over | 0 (0.0%) | 0 (0.0%) |
| Total | 1,159 (64.9%) | 88 (7.6%) |
Employment Status by Educational Attainment in Evansburg
According to labor force statistics for Evansburg, 83.0% of individuals (1,019) out of the total population between 25 and 64 years of age (1,228) are in the labor force, with 5.6% or 57 of them being unemployed. The group with the highest labor force participation rate are those with the educational attainment of college / associate degree, with 95.8% or 362 individuals in the labor force. Within the labor force, individuals with college / associate degree education have the highest percentage of unemployment, with 6.4% or 23 of them being unemployed.
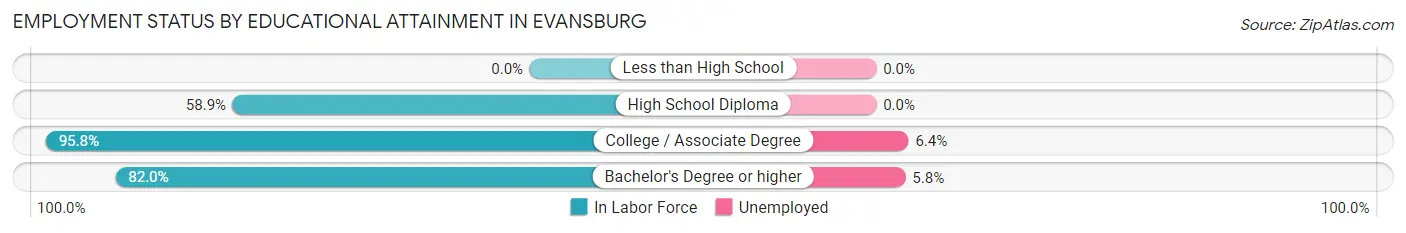
| Educational Attainment | In Labor Force | Unemployed |
| Less than High School | 0 (0.0%) | 0 (0.0%) |
| High School Diploma | 73 (58.9%) | 0 (0.0%) |
| College / Associate Degree | 362 (95.8%) | 24 (6.4%) |
| Bachelor's Degree or higher | 584 (82.0%) | 41 (5.8%) |
| Total | 1,019 (83.0%) | 69 (5.6%) |
Employment Occupations by Sex in Evansburg
Management, Business, Science and Arts Occupations
The most common Management, Business, Science and Arts occupations in Evansburg are Business & Financial (149 | 13.9%), Community & Social Service (146 | 13.6%), Management (142 | 13.3%), Computers, Engineering & Science (105 | 9.8%), and Education Instruction & Library (72 | 6.7%).
Management, Business, Science and Arts Occupations by Sex
Within the Management, Business, Science and Arts occupations in Evansburg, the most male-oriented occupations are Computers & Mathematics (100.0%), Architecture & Engineering (100.0%), and Computers, Engineering & Science (68.6%), while the most female-oriented occupations are Arts, Media & Entertainment (100.0%), Education Instruction & Library (86.1%), and Health Diagnosing & Treating (70.6%).
| Occupation | Male | Female |
| Management | 49 (34.5%) | 93 (65.5%) |
| Business & Financial | 75 (50.3%) | 74 (49.7%) |
| Computers, Engineering & Science | 72 (68.6%) | 33 (31.4%) |
| Computers & Mathematics | 20 (100.0%) | 0 (0.0%) |
| Architecture & Engineering | 32 (100.0%) | 0 (0.0%) |
| Life, Physical & Social Science | 20 (37.7%) | 33 (62.3%) |
| Community & Social Service | 48 (32.9%) | 98 (67.1%) |
| Education, Arts & Media | 0 (0.0%) | 0 (0.0%) |
| Legal Services & Support | 38 (67.9%) | 18 (32.1%) |
| Education Instruction & Library | 10 (13.9%) | 62 (86.1%) |
| Arts, Media & Entertainment | 0 (0.0%) | 18 (100.0%) |
| Health Diagnosing & Treating | 15 (29.4%) | 36 (70.6%) |
| Health Technologists | 15 (50.0%) | 15 (50.0%) |
| Total (Category) | 259 (43.7%) | 334 (56.3%) |
| Total (Overall) | 516 (48.2%) | 555 (51.8%) |
Services Occupations
The most common Services occupations in Evansburg are Healthcare Support (31 | 2.9%), and Food Preparation & Serving (23 | 2.1%).
Services Occupations by Sex
| Occupation | Male | Female |
| Healthcare Support | 0 (0.0%) | 31 (100.0%) |
| Security & Protection | 0 (0.0%) | 0 (0.0%) |
| Firefighting & Prevention | 0 (0.0%) | 0 (0.0%) |
| Law Enforcement | 0 (0.0%) | 0 (0.0%) |
| Food Preparation & Serving | 0 (0.0%) | 23 (100.0%) |
| Cleaning & Maintenance | 0 (0.0%) | 0 (0.0%) |
| Personal Care & Service | 0 (0.0%) | 0 (0.0%) |
| Total (Category) | 0 (0.0%) | 54 (100.0%) |
| Total (Overall) | 516 (48.2%) | 555 (51.8%) |
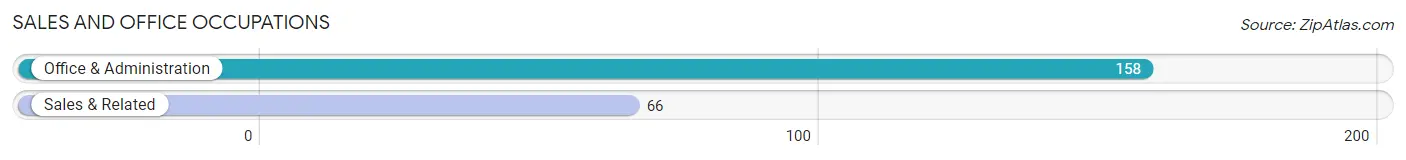
Sales and Office Occupations
The most common Sales and Office occupations in Evansburg are Office & Administration (158 | 14.7%), and Sales & Related (66 | 6.2%).
Sales and Office Occupations by Sex
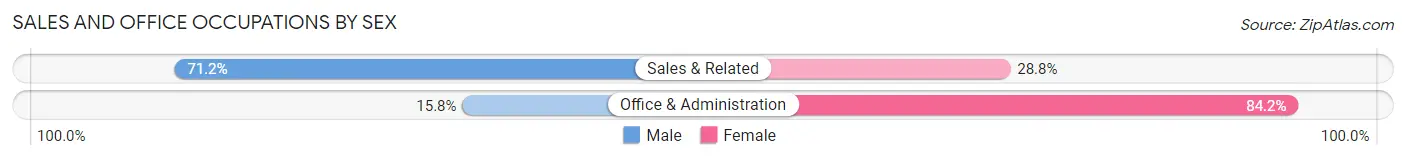
| Occupation | Male | Female |
| Sales & Related | 47 (71.2%) | 19 (28.8%) |
| Office & Administration | 25 (15.8%) | 133 (84.2%) |
| Total (Category) | 72 (32.1%) | 152 (67.9%) |
| Total (Overall) | 516 (48.2%) | 555 (51.8%) |
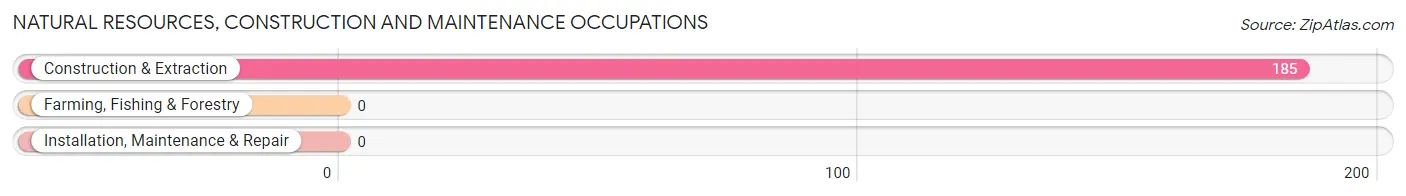
Natural Resources, Construction and Maintenance Occupations
The most common Natural Resources, Construction and Maintenance occupations in Evansburg are , and Construction & Extraction (185 | 17.3%).
Natural Resources, Construction and Maintenance Occupations by Sex
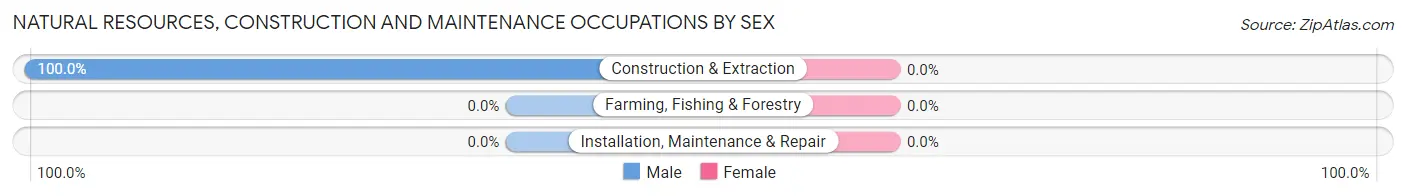
| Occupation | Male | Female |
| Farming, Fishing & Forestry | 0 (0.0%) | 0 (0.0%) |
| Construction & Extraction | 185 (100.0%) | 0 (0.0%) |
| Installation, Maintenance & Repair | 0 (0.0%) | 0 (0.0%) |
| Total (Category) | 185 (100.0%) | 0 (0.0%) |
| Total (Overall) | 516 (48.2%) | 555 (51.8%) |
Production, Transportation and Moving Occupations
The most common Production, Transportation and Moving occupations in Evansburg are , and Material Moving (15 | 1.4%).
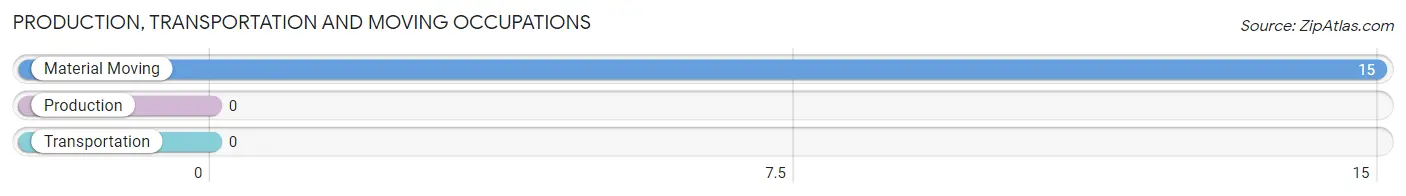
Production, Transportation and Moving Occupations by Sex
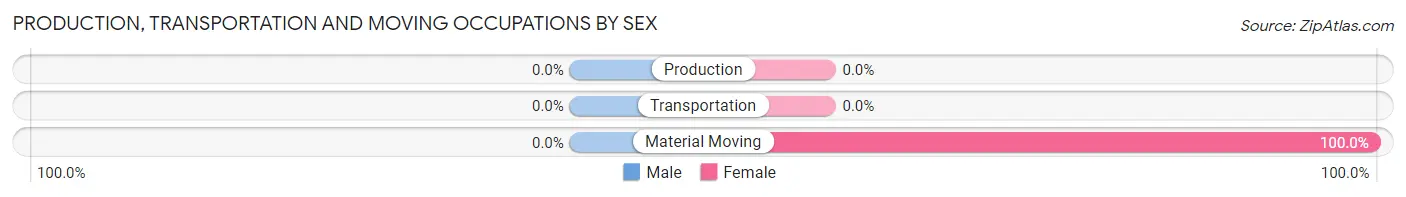
| Occupation | Male | Female |
| Production | 0 (0.0%) | 0 (0.0%) |
| Transportation | 0 (0.0%) | 0 (0.0%) |
| Material Moving | 0 (0.0%) | 15 (100.0%) |
| Total (Category) | 0 (0.0%) | 15 (100.0%) |
| Total (Overall) | 516 (48.2%) | 555 (51.8%) |
Employment Industries by Sex in Evansburg
Employment Industries in Evansburg
The major employment industries in Evansburg include Professional & Scientific (180 | 16.8%), Health Care & Social Assistance (140 | 13.1%), Construction (123 | 11.5%), Finance & Insurance (123 | 11.5%), and Retail Trade (110 | 10.3%).
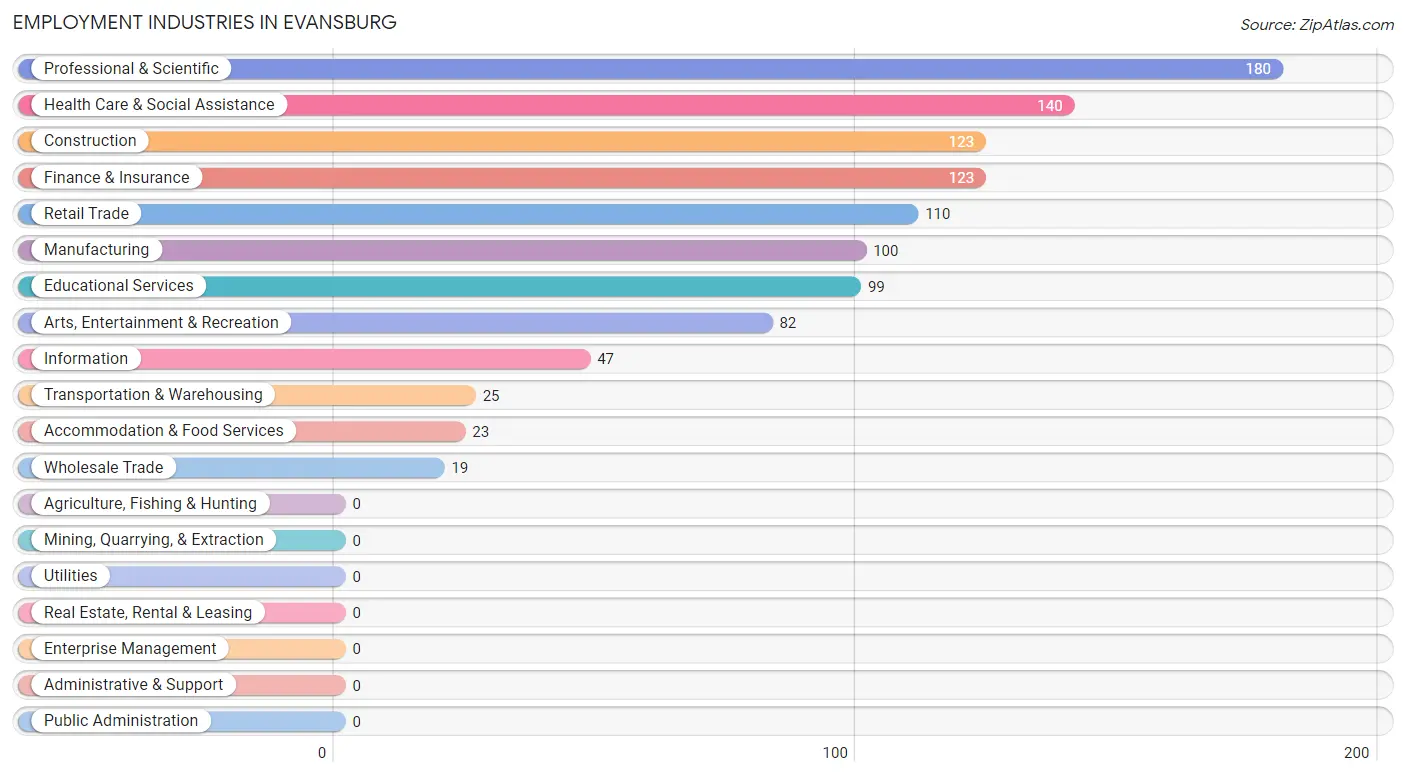
Employment Industries by Sex in Evansburg
The Evansburg industries that see more men than women are Construction (100.0%), Retail Trade (100.0%), and Transportation & Warehousing (100.0%), whereas the industries that tend to have a higher number of women are Wholesale Trade (100.0%), Accommodation & Food Services (100.0%), and Professional & Scientific (90.6%).
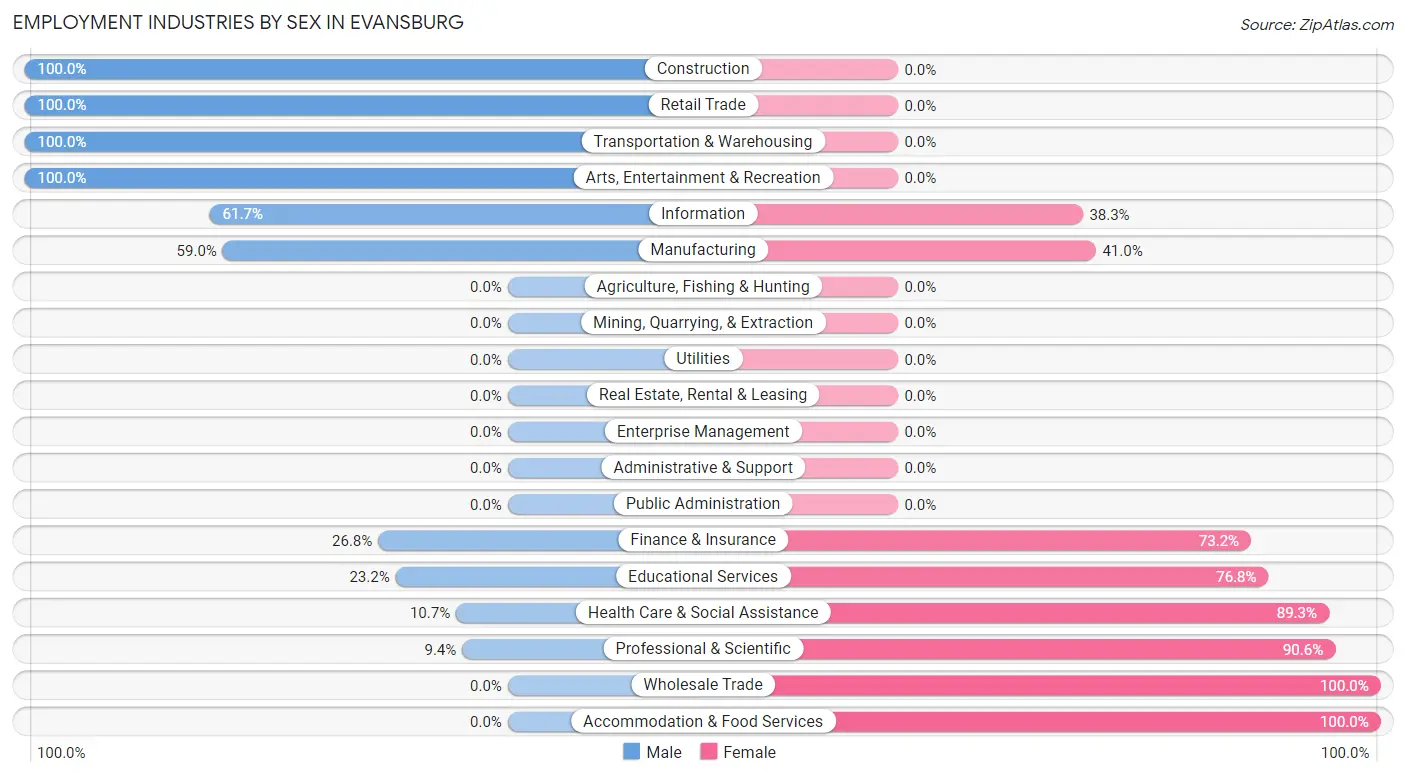
| Industry | Male | Female |
| Agriculture, Fishing & Hunting | 0 (0.0%) | 0 (0.0%) |
| Mining, Quarrying, & Extraction | 0 (0.0%) | 0 (0.0%) |
| Construction | 123 (100.0%) | 0 (0.0%) |
| Manufacturing | 59 (59.0%) | 41 (41.0%) |
| Wholesale Trade | 0 (0.0%) | 19 (100.0%) |
| Retail Trade | 110 (100.0%) | 0 (0.0%) |
| Transportation & Warehousing | 25 (100.0%) | 0 (0.0%) |
| Utilities | 0 (0.0%) | 0 (0.0%) |
| Information | 29 (61.7%) | 18 (38.3%) |
| Finance & Insurance | 33 (26.8%) | 90 (73.2%) |
| Real Estate, Rental & Leasing | 0 (0.0%) | 0 (0.0%) |
| Professional & Scientific | 17 (9.4%) | 163 (90.6%) |
| Enterprise Management | 0 (0.0%) | 0 (0.0%) |
| Administrative & Support | 0 (0.0%) | 0 (0.0%) |
| Educational Services | 23 (23.2%) | 76 (76.8%) |
| Health Care & Social Assistance | 15 (10.7%) | 125 (89.3%) |
| Arts, Entertainment & Recreation | 82 (100.0%) | 0 (0.0%) |
| Accommodation & Food Services | 0 (0.0%) | 23 (100.0%) |
| Public Administration | 0 (0.0%) | 0 (0.0%) |
| Total | 516 (48.2%) | 555 (51.8%) |
Education in Evansburg
School Enrollment in Evansburg
The most common levels of schooling among the 403 students in Evansburg are high school (129 | 32.0%), elementary school (96 | 23.8%), and middle school (83 | 20.6%).
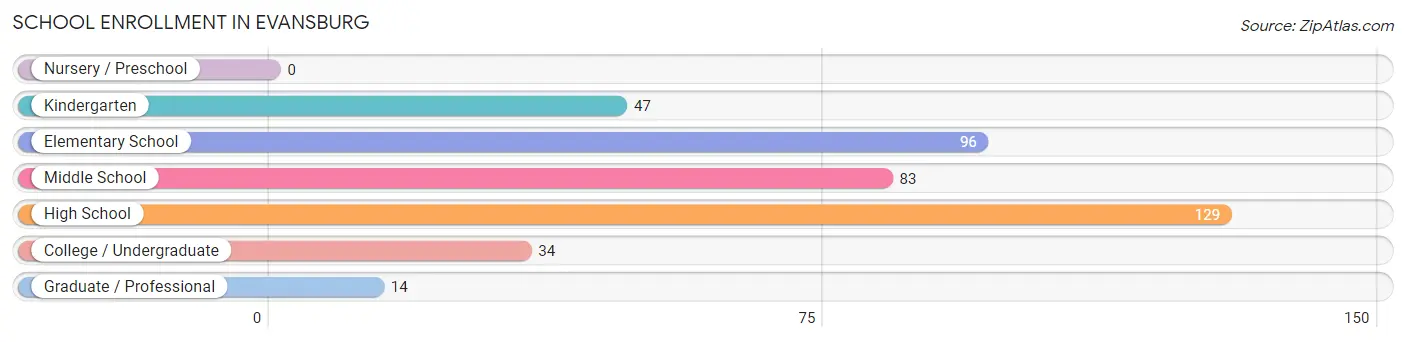
| School Level | # Students | % Students |
| Nursery / Preschool | 0 | 0.0% |
| Kindergarten | 47 | 11.7% |
| Elementary School | 96 | 23.8% |
| Middle School | 83 | 20.6% |
| High School | 129 | 32.0% |
| College / Undergraduate | 34 | 8.4% |
| Graduate / Professional | 14 | 3.5% |
| Total | 403 | 100.0% |
School Enrollment by Age by Funding Source in Evansburg
Out of a total of 403 students who are enrolled in schools in Evansburg, 47 (11.7%) attend a private institution, while the remaining 356 (88.3%) are enrolled in public schools. The age group of 25 to 34 year olds has the highest likelihood of being enrolled in private schools, with 16 (53.3% in the age bracket) enrolled. Conversely, the age group of 5 to 9 year old has the lowest likelihood of being enrolled in a private school, with 109 (100.0% in the age bracket) attending a public institution.
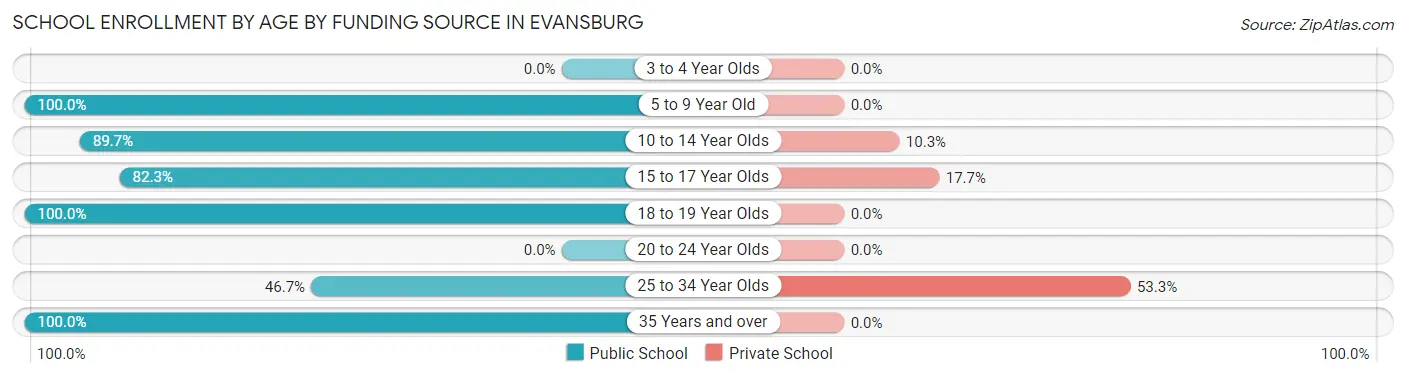
| Age Bracket | Public School | Private School |
| 3 to 4 Year Olds | 0 (0.0%) | 0 (0.0%) |
| 5 to 9 Year Old | 109 (100.0%) | 0 (0.0%) |
| 10 to 14 Year Olds | 122 (89.7%) | 14 (10.3%) |
| 15 to 17 Year Olds | 79 (82.3%) | 17 (17.7%) |
| 18 to 19 Year Olds | 18 (100.0%) | 0 (0.0%) |
| 20 to 24 Year Olds | 0 (0.0%) | 0 (0.0%) |
| 25 to 34 Year Olds | 14 (46.7%) | 16 (53.3%) |
| 35 Years and over | 14 (100.0%) | 0 (0.0%) |
| Total | 356 (88.3%) | 47 (11.7%) |
Educational Attainment by Field of Study in Evansburg
Psychology (175 | 17.4%), business (172 | 17.2%), engineering (97 | 9.7%), science & technology (89 | 8.9%), and computers & mathematics (83 | 8.3%) are the most common fields of study among 1,003 individuals in Evansburg who have obtained a bachelor's degree or higher.
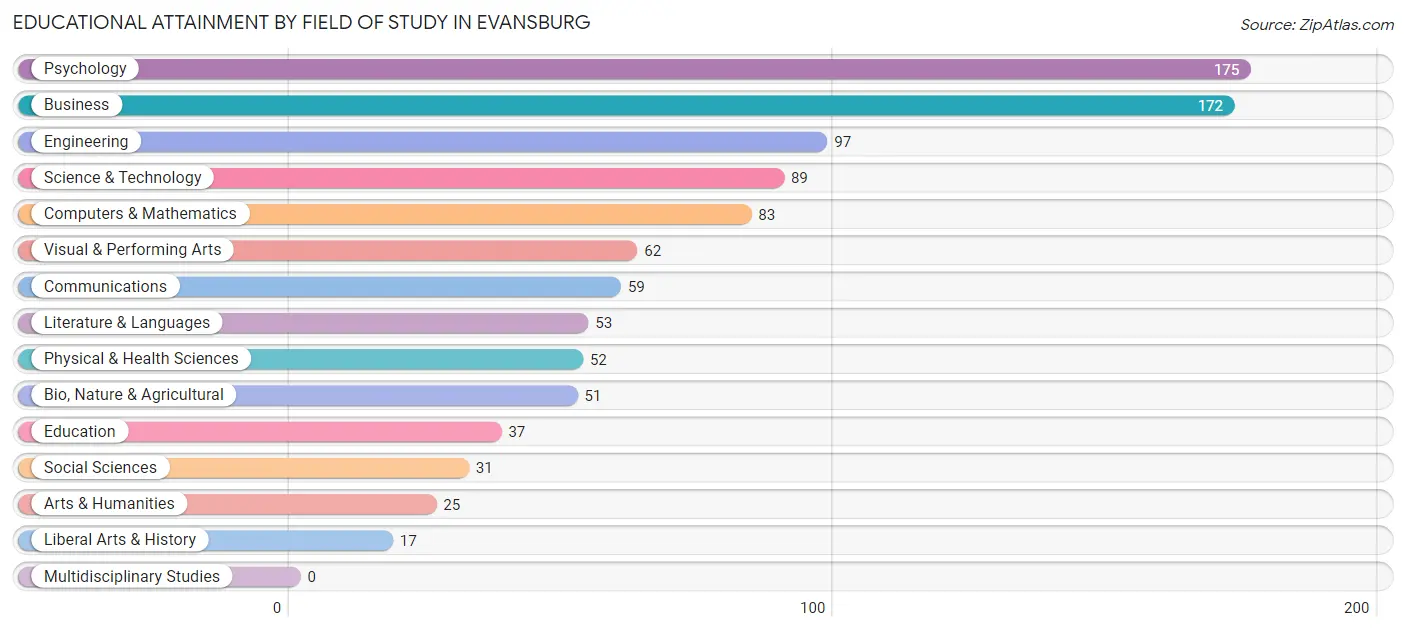
| Field of Study | # Graduates | % Graduates |
| Computers & Mathematics | 83 | 8.3% |
| Bio, Nature & Agricultural | 51 | 5.1% |
| Physical & Health Sciences | 52 | 5.2% |
| Psychology | 175 | 17.4% |
| Social Sciences | 31 | 3.1% |
| Engineering | 97 | 9.7% |
| Multidisciplinary Studies | 0 | 0.0% |
| Science & Technology | 89 | 8.9% |
| Business | 172 | 17.2% |
| Education | 37 | 3.7% |
| Literature & Languages | 53 | 5.3% |
| Liberal Arts & History | 17 | 1.7% |
| Visual & Performing Arts | 62 | 6.2% |
| Communications | 59 | 5.9% |
| Arts & Humanities | 25 | 2.5% |
| Total | 1,003 | 100.0% |
Transportation & Commute in Evansburg
Vehicle Availability by Sex in Evansburg
The most prevalent vehicle ownership categories in Evansburg are males with 2 vehicles (344, accounting for 66.7%) and females with 2 vehicles (198, making up 62.0%).
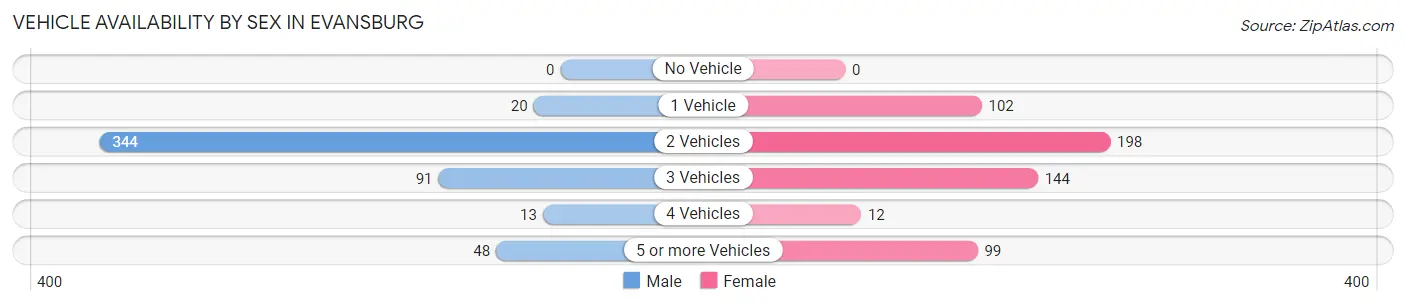
| Vehicles Available | Male | Female |
| No Vehicle | 0 (0.0%) | 0 (0.0%) |
| 1 Vehicle | 20 (3.9%) | 102 (18.4%) |
| 2 Vehicles | 344 (66.7%) | 198 (35.7%) |
| 3 Vehicles | 91 (17.6%) | 144 (26.0%) |
| 4 Vehicles | 13 (2.5%) | 12 (2.2%) |
| 5 or more Vehicles | 48 (9.3%) | 99 (17.8%) |
| Total | 516 (100.0%) | 555 (100.0%) |
Commute Time in Evansburg
The most frequently occuring commute durations in Evansburg are 30 to 34 minutes (185 commuters, 24.1%), 45 to 59 minutes (152 commuters, 19.8%), and 20 to 24 minutes (84 commuters, 11.0%).
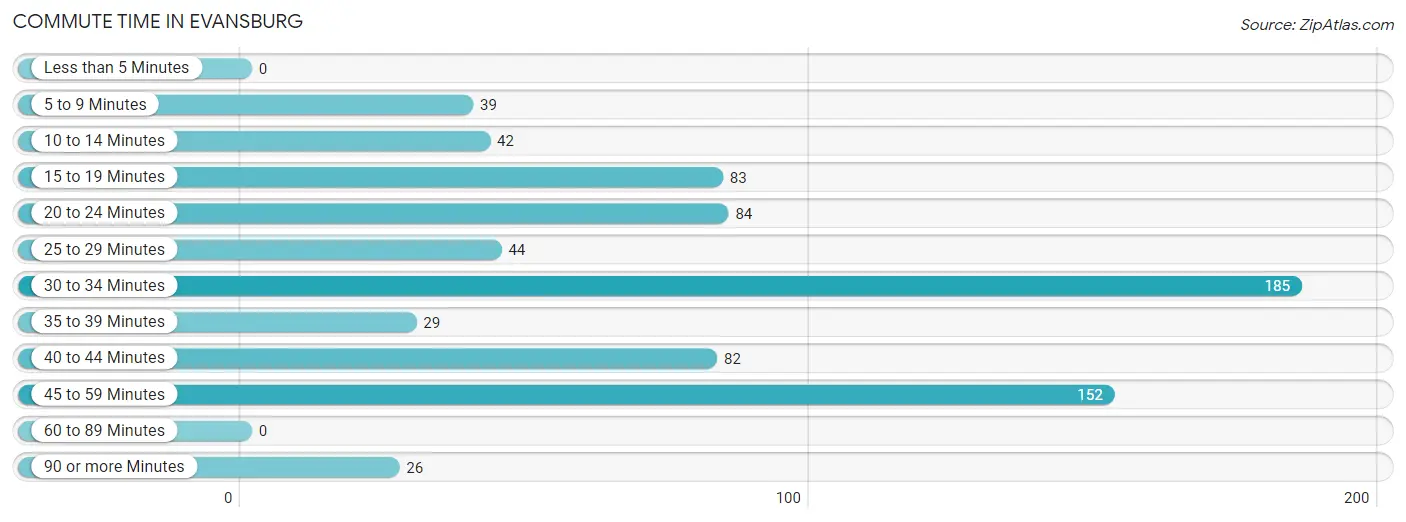
| Commute Time | # Commuters | % Commuters |
| Less than 5 Minutes | 0 | 0.0% |
| 5 to 9 Minutes | 39 | 5.1% |
| 10 to 14 Minutes | 42 | 5.5% |
| 15 to 19 Minutes | 83 | 10.8% |
| 20 to 24 Minutes | 84 | 11.0% |
| 25 to 29 Minutes | 44 | 5.7% |
| 30 to 34 Minutes | 185 | 24.1% |
| 35 to 39 Minutes | 29 | 3.8% |
| 40 to 44 Minutes | 82 | 10.7% |
| 45 to 59 Minutes | 152 | 19.8% |
| 60 to 89 Minutes | 0 | 0.0% |
| 90 or more Minutes | 26 | 3.4% |
Commute Time by Sex in Evansburg
The most common commute times in Evansburg are 30 to 34 minutes (121 commuters, 31.8%) for males and 40 to 44 minutes (82 commuters, 21.2%) for females.
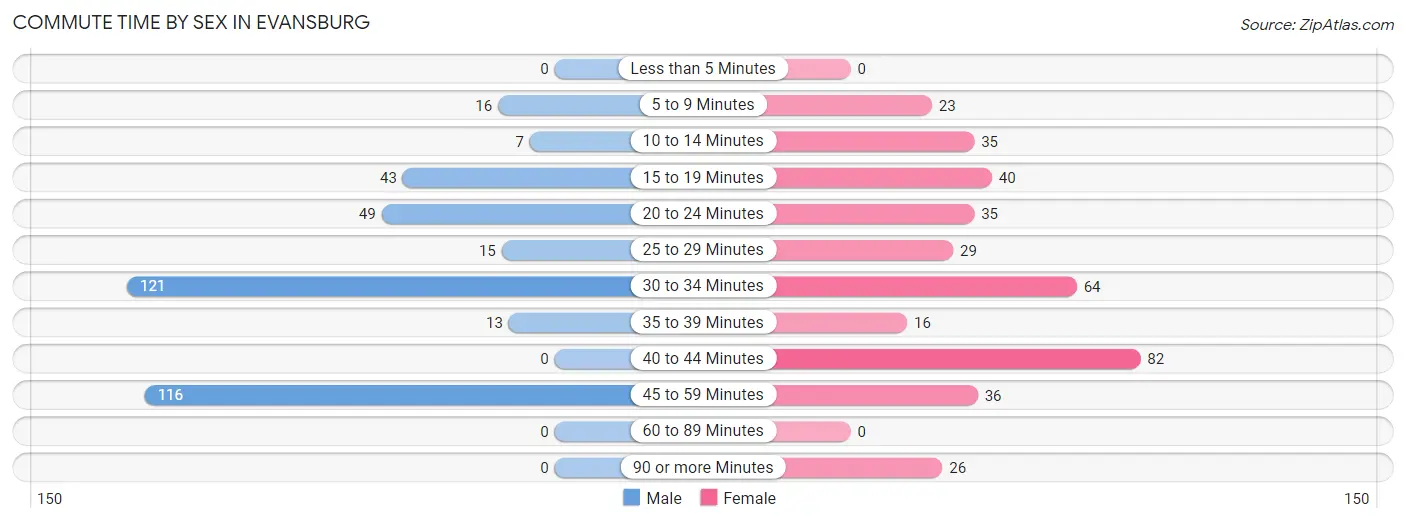
| Commute Time | Male | Female |
| Less than 5 Minutes | 0 (0.0%) | 0 (0.0%) |
| 5 to 9 Minutes | 16 (4.2%) | 23 (6.0%) |
| 10 to 14 Minutes | 7 (1.8%) | 35 (9.1%) |
| 15 to 19 Minutes | 43 (11.3%) | 40 (10.4%) |
| 20 to 24 Minutes | 49 (12.9%) | 35 (9.1%) |
| 25 to 29 Minutes | 15 (4.0%) | 29 (7.5%) |
| 30 to 34 Minutes | 121 (31.8%) | 64 (16.6%) |
| 35 to 39 Minutes | 13 (3.4%) | 16 (4.2%) |
| 40 to 44 Minutes | 0 (0.0%) | 82 (21.2%) |
| 45 to 59 Minutes | 116 (30.5%) | 36 (9.3%) |
| 60 to 89 Minutes | 0 (0.0%) | 0 (0.0%) |
| 90 or more Minutes | 0 (0.0%) | 26 (6.7%) |
Time of Departure to Work by Sex in Evansburg
The most frequent times of departure to work in Evansburg are 7:30 AM to 7:59 AM (145, 38.2%) for males and 7:00 AM to 7:29 AM (105, 27.2%) for females.
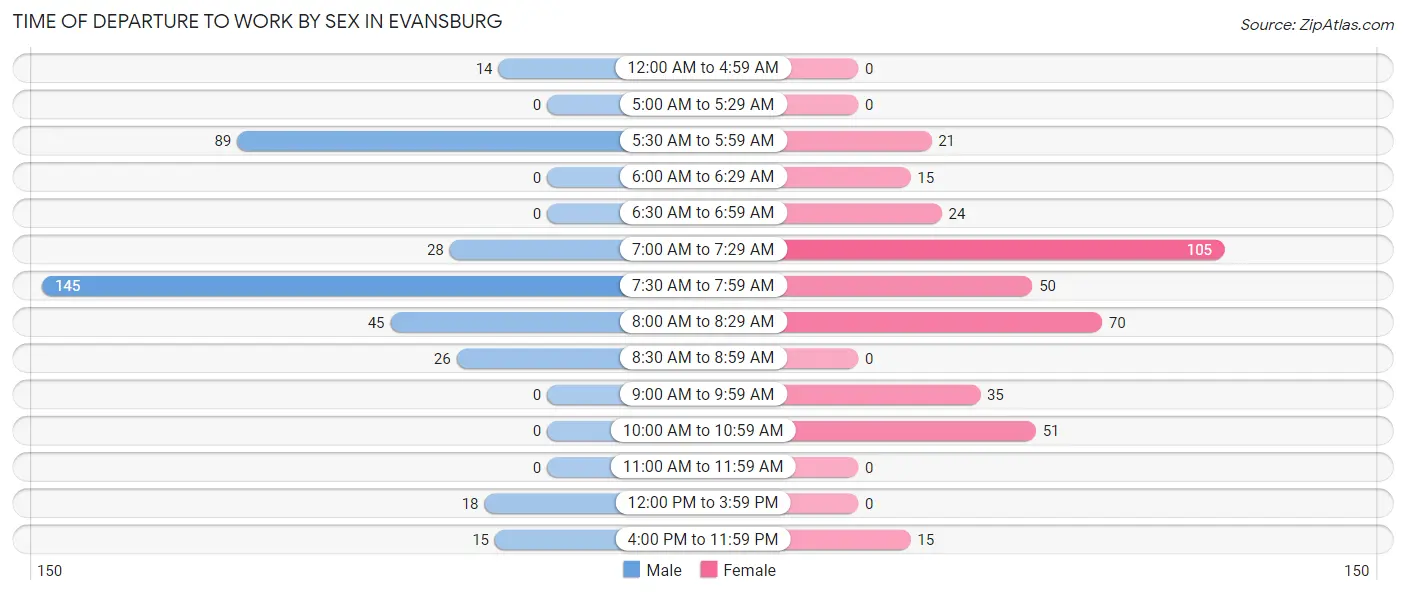
| Time of Departure | Male | Female |
| 12:00 AM to 4:59 AM | 14 (3.7%) | 0 (0.0%) |
| 5:00 AM to 5:29 AM | 0 (0.0%) | 0 (0.0%) |
| 5:30 AM to 5:59 AM | 89 (23.4%) | 21 (5.4%) |
| 6:00 AM to 6:29 AM | 0 (0.0%) | 15 (3.9%) |
| 6:30 AM to 6:59 AM | 0 (0.0%) | 24 (6.2%) |
| 7:00 AM to 7:29 AM | 28 (7.4%) | 105 (27.2%) |
| 7:30 AM to 7:59 AM | 145 (38.2%) | 50 (13.0%) |
| 8:00 AM to 8:29 AM | 45 (11.8%) | 70 (18.1%) |
| 8:30 AM to 8:59 AM | 26 (6.8%) | 0 (0.0%) |
| 9:00 AM to 9:59 AM | 0 (0.0%) | 35 (9.1%) |
| 10:00 AM to 10:59 AM | 0 (0.0%) | 51 (13.2%) |
| 11:00 AM to 11:59 AM | 0 (0.0%) | 0 (0.0%) |
| 12:00 PM to 3:59 PM | 18 (4.7%) | 0 (0.0%) |
| 4:00 PM to 11:59 PM | 15 (4.0%) | 15 (3.9%) |
| Total | 380 (100.0%) | 386 (100.0%) |
Housing Occupancy in Evansburg
Occupancy by Ownership in Evansburg
Of the total 859 dwellings in Evansburg, owner-occupied units account for 773 (90.0%), while renter-occupied units make up 86 (10.0%).
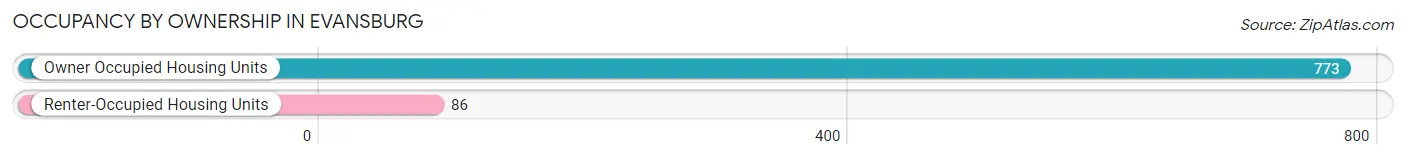
| Occupancy | # Housing Units | % Housing Units |
| Owner Occupied Housing Units | 773 | 90.0% |
| Renter-Occupied Housing Units | 86 | 10.0% |
| Total Occupied Housing Units | 859 | 100.0% |
Occupancy by Household Size in Evansburg
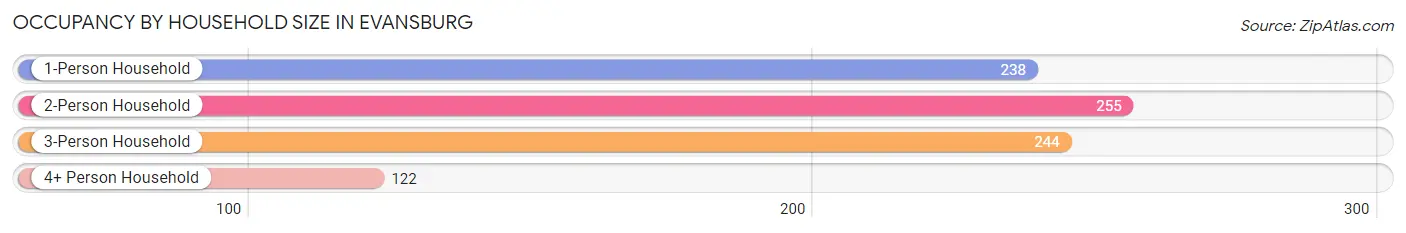
| Household Size | # Housing Units | % Housing Units |
| 1-Person Household | 238 | 27.7% |
| 2-Person Household | 255 | 29.7% |
| 3-Person Household | 244 | 28.4% |
| 4+ Person Household | 122 | 14.2% |
| Total Housing Units | 859 | 100.0% |
Occupancy by Ownership by Household Size in Evansburg
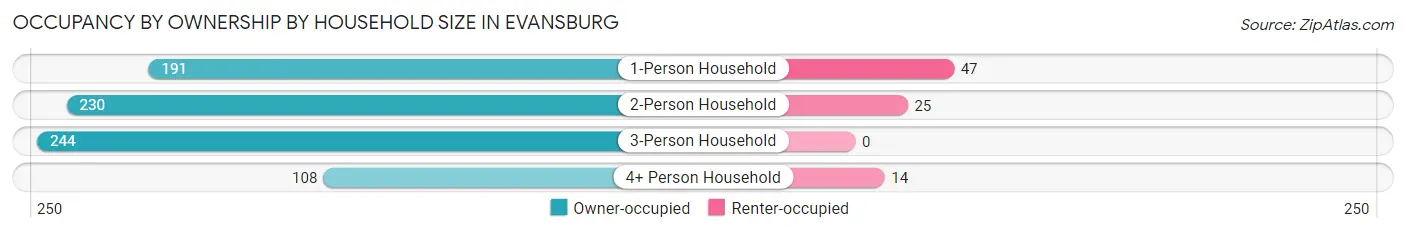
| Household Size | Owner-occupied | Renter-occupied |
| 1-Person Household | 191 (80.2%) | 47 (19.8%) |
| 2-Person Household | 230 (90.2%) | 25 (9.8%) |
| 3-Person Household | 244 (100.0%) | 0 (0.0%) |
| 4+ Person Household | 108 (88.5%) | 14 (11.5%) |
| Total Housing Units | 773 (90.0%) | 86 (10.0%) |
Occupancy by Educational Attainment in Evansburg
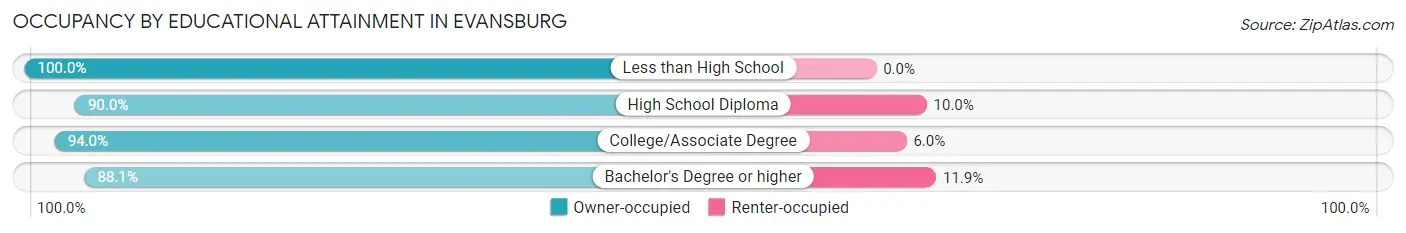
| Household Size | Owner-occupied | Renter-occupied |
| Less than High School | 14 (100.0%) | 0 (0.0%) |
| High School Diploma | 126 (90.0%) | 14 (10.0%) |
| College/Associate Degree | 188 (94.0%) | 12 (6.0%) |
| Bachelor's Degree or higher | 445 (88.1%) | 60 (11.9%) |
Occupancy by Age of Householder in Evansburg
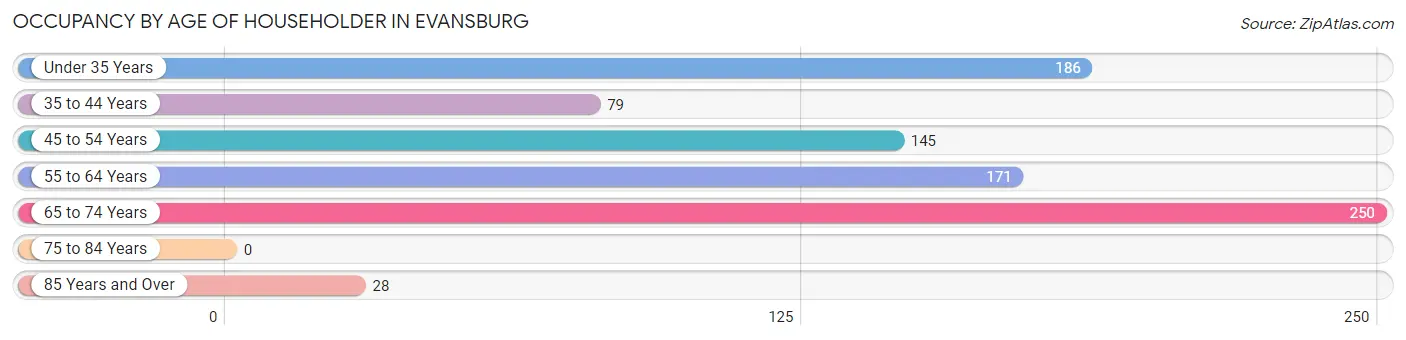
| Age Bracket | # Households | % Households |
| Under 35 Years | 186 | 21.6% |
| 35 to 44 Years | 79 | 9.2% |
| 45 to 54 Years | 145 | 16.9% |
| 55 to 64 Years | 171 | 19.9% |
| 65 to 74 Years | 250 | 29.1% |
| 75 to 84 Years | 0 | 0.0% |
| 85 Years and Over | 28 | 3.3% |
| Total | 859 | 100.0% |
Housing Finances in Evansburg
Median Income by Occupancy in Evansburg
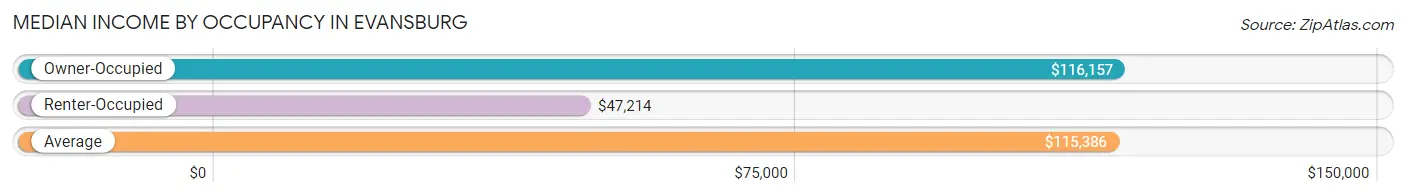
| Occupancy Type | # Households | Median Income |
| Owner-Occupied | 773 (90.0%) | $116,157 |
| Renter-Occupied | 86 (10.0%) | $47,214 |
| Average | 859 (100.0%) | $115,386 |
Occupancy by Householder Income Bracket in Evansburg
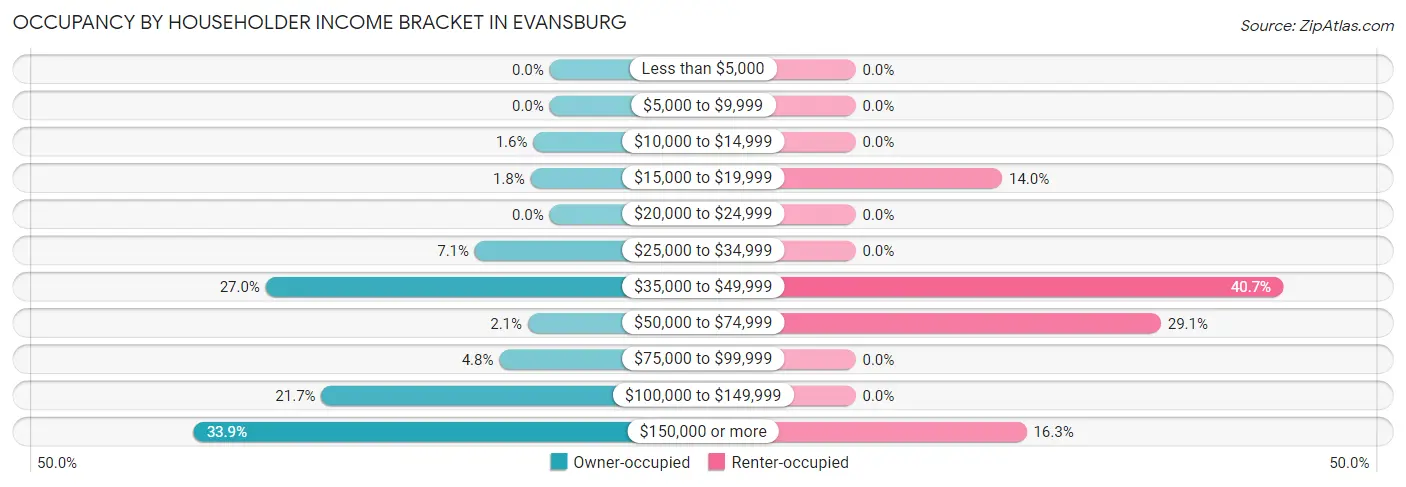
| Income Bracket | Owner-occupied | Renter-occupied |
| Less than $5,000 | 0 (0.0%) | 0 (0.0%) |
| $5,000 to $9,999 | 0 (0.0%) | 0 (0.0%) |
| $10,000 to $14,999 | 12 (1.5%) | 0 (0.0%) |
| $15,000 to $19,999 | 14 (1.8%) | 12 (14.0%) |
| $20,000 to $24,999 | 0 (0.0%) | 0 (0.0%) |
| $25,000 to $34,999 | 55 (7.1%) | 0 (0.0%) |
| $35,000 to $49,999 | 209 (27.0%) | 35 (40.7%) |
| $50,000 to $74,999 | 16 (2.1%) | 25 (29.1%) |
| $75,000 to $99,999 | 37 (4.8%) | 0 (0.0%) |
| $100,000 to $149,999 | 168 (21.7%) | 0 (0.0%) |
| $150,000 or more | 262 (33.9%) | 14 (16.3%) |
| Total | 773 (100.0%) | 86 (100.0%) |
Monthly Housing Cost Tiers in Evansburg
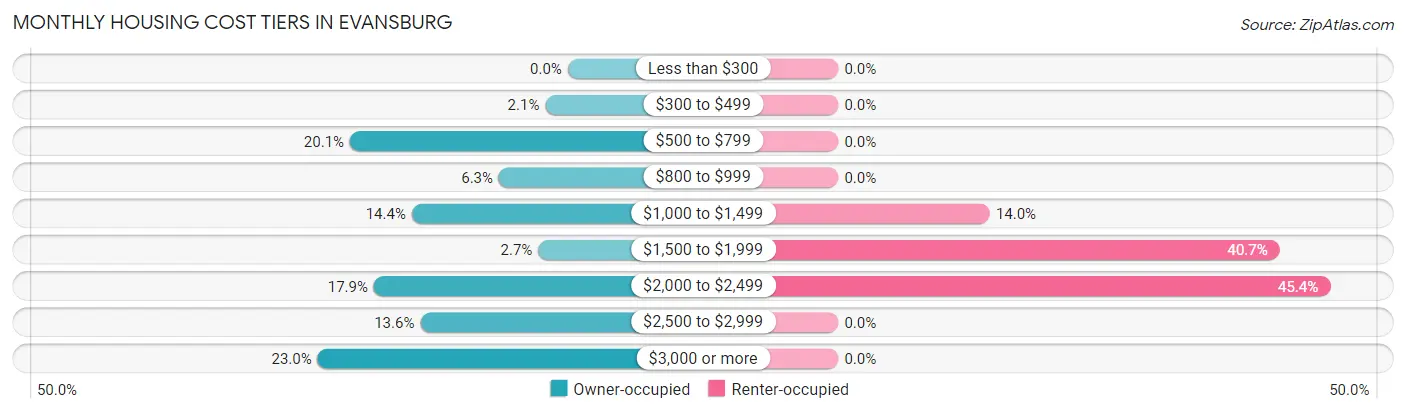
| Monthly Cost | Owner-occupied | Renter-occupied |
| Less than $300 | 0 (0.0%) | 0 (0.0%) |
| $300 to $499 | 16 (2.1%) | 0 (0.0%) |
| $500 to $799 | 155 (20.1%) | 0 (0.0%) |
| $800 to $999 | 49 (6.3%) | 0 (0.0%) |
| $1,000 to $1,499 | 111 (14.4%) | 12 (14.0%) |
| $1,500 to $1,999 | 21 (2.7%) | 35 (40.7%) |
| $2,000 to $2,499 | 138 (17.8%) | 39 (45.4%) |
| $2,500 to $2,999 | 105 (13.6%) | 0 (0.0%) |
| $3,000 or more | 178 (23.0%) | 0 (0.0%) |
| Total | 773 (100.0%) | 86 (100.0%) |
Physical Housing Characteristics in Evansburg
Housing Structures in Evansburg
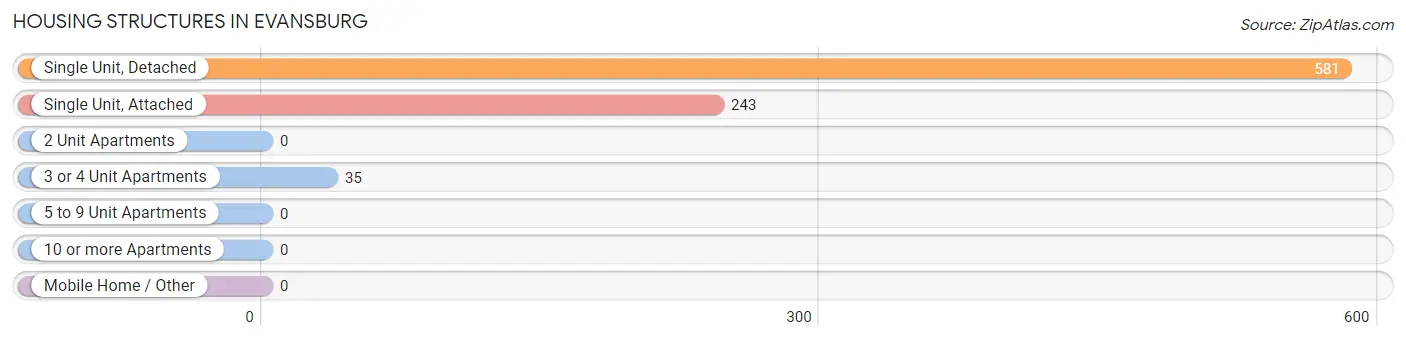
| Structure Type | # Housing Units | % Housing Units |
| Single Unit, Detached | 581 | 67.6% |
| Single Unit, Attached | 243 | 28.3% |
| 2 Unit Apartments | 0 | 0.0% |
| 3 or 4 Unit Apartments | 35 | 4.1% |
| 5 to 9 Unit Apartments | 0 | 0.0% |
| 10 or more Apartments | 0 | 0.0% |
| Mobile Home / Other | 0 | 0.0% |
| Total | 859 | 100.0% |
Housing Structures by Occupancy in Evansburg
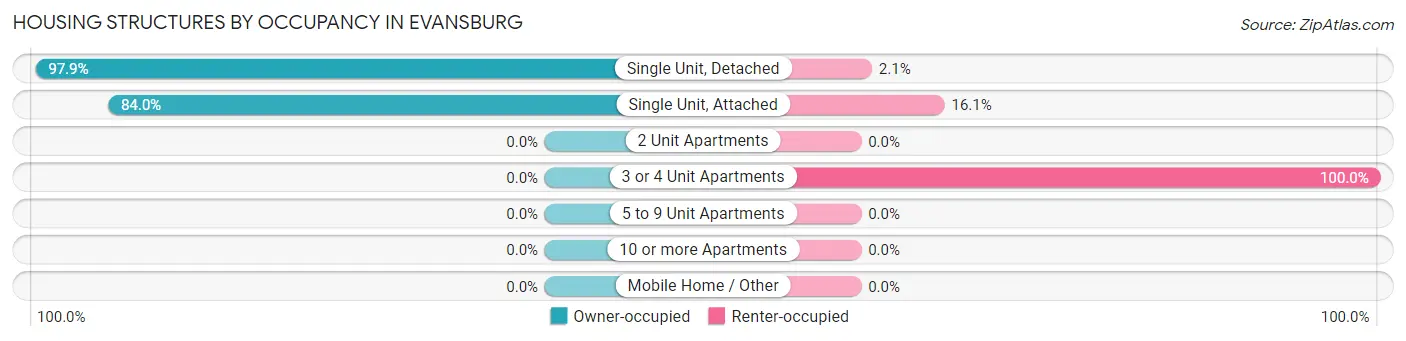
| Structure Type | Owner-occupied | Renter-occupied |
| Single Unit, Detached | 569 (97.9%) | 12 (2.1%) |
| Single Unit, Attached | 204 (84.0%) | 39 (16.1%) |
| 2 Unit Apartments | 0 (0.0%) | 0 (0.0%) |
| 3 or 4 Unit Apartments | 0 (0.0%) | 35 (100.0%) |
| 5 to 9 Unit Apartments | 0 (0.0%) | 0 (0.0%) |
| 10 or more Apartments | 0 (0.0%) | 0 (0.0%) |
| Mobile Home / Other | 0 (0.0%) | 0 (0.0%) |
| Total | 773 (90.0%) | 86 (10.0%) |
Housing Structures by Number of Rooms in Evansburg
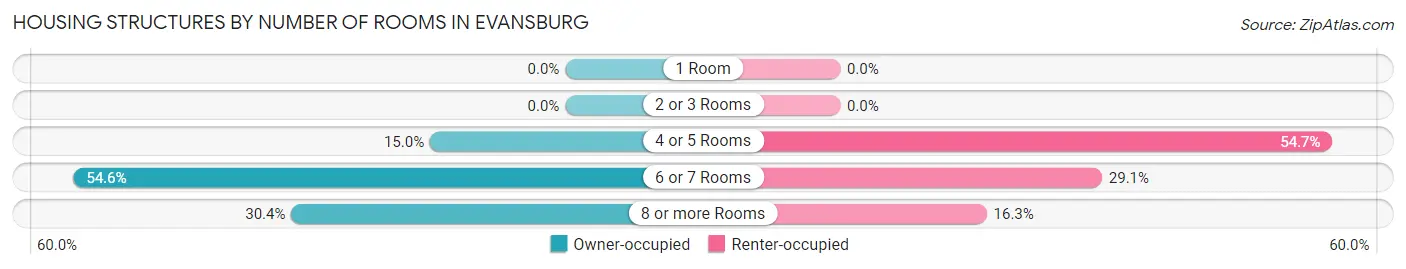
| Number of Rooms | Owner-occupied | Renter-occupied |
| 1 Room | 0 (0.0%) | 0 (0.0%) |
| 2 or 3 Rooms | 0 (0.0%) | 0 (0.0%) |
| 4 or 5 Rooms | 116 (15.0%) | 47 (54.6%) |
| 6 or 7 Rooms | 422 (54.6%) | 25 (29.1%) |
| 8 or more Rooms | 235 (30.4%) | 14 (16.3%) |
| Total | 773 (100.0%) | 86 (100.0%) |
Housing Structure by Heating Type in Evansburg
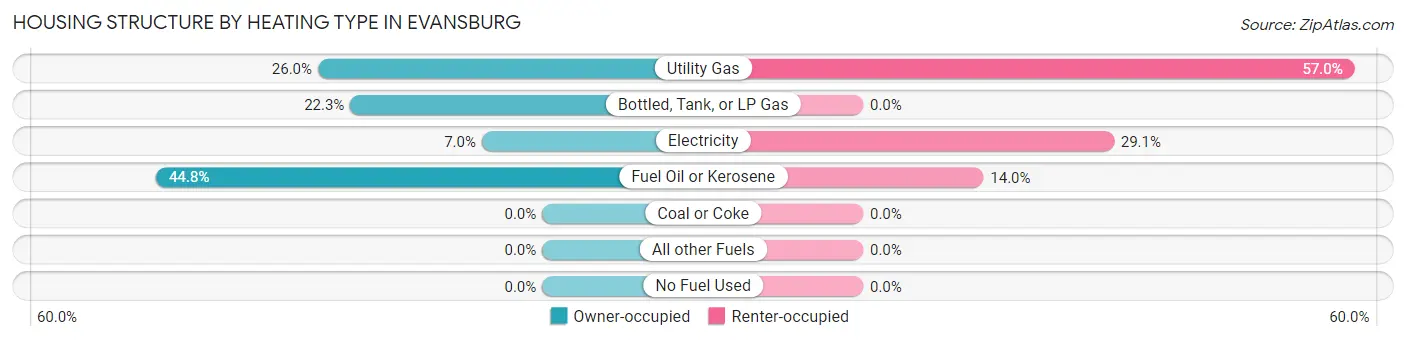
| Heating Type | Owner-occupied | Renter-occupied |
| Utility Gas | 201 (26.0%) | 49 (57.0%) |
| Bottled, Tank, or LP Gas | 172 (22.3%) | 0 (0.0%) |
| Electricity | 54 (7.0%) | 25 (29.1%) |
| Fuel Oil or Kerosene | 346 (44.8%) | 12 (14.0%) |
| Coal or Coke | 0 (0.0%) | 0 (0.0%) |
| All other Fuels | 0 (0.0%) | 0 (0.0%) |
| No Fuel Used | 0 (0.0%) | 0 (0.0%) |
| Total | 773 (100.0%) | 86 (100.0%) |
Household Vehicle Usage in Evansburg
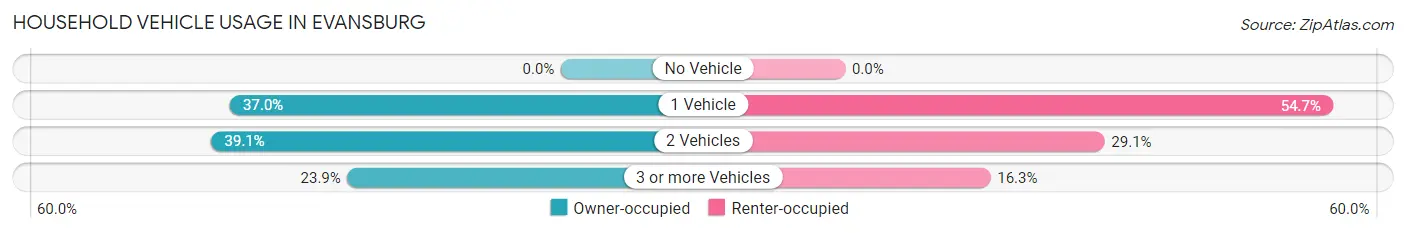
| Vehicles per Household | Owner-occupied | Renter-occupied |
| No Vehicle | 0 (0.0%) | 0 (0.0%) |
| 1 Vehicle | 286 (37.0%) | 47 (54.6%) |
| 2 Vehicles | 302 (39.1%) | 25 (29.1%) |
| 3 or more Vehicles | 185 (23.9%) | 14 (16.3%) |
| Total | 773 (100.0%) | 86 (100.0%) |
Real Estate & Mortgages in Evansburg
Real Estate and Mortgage Overview in Evansburg
| Characteristic | Without Mortgage | With Mortgage |
| Housing Units | 313 | 460 |
| Median Property Value | - | - |
| Median Household Income | - | - |
| Monthly Housing Costs | $691 | $178 |
| Real Estate Taxes | $4,867 | $82 |
Property Value by Mortgage Status in Evansburg
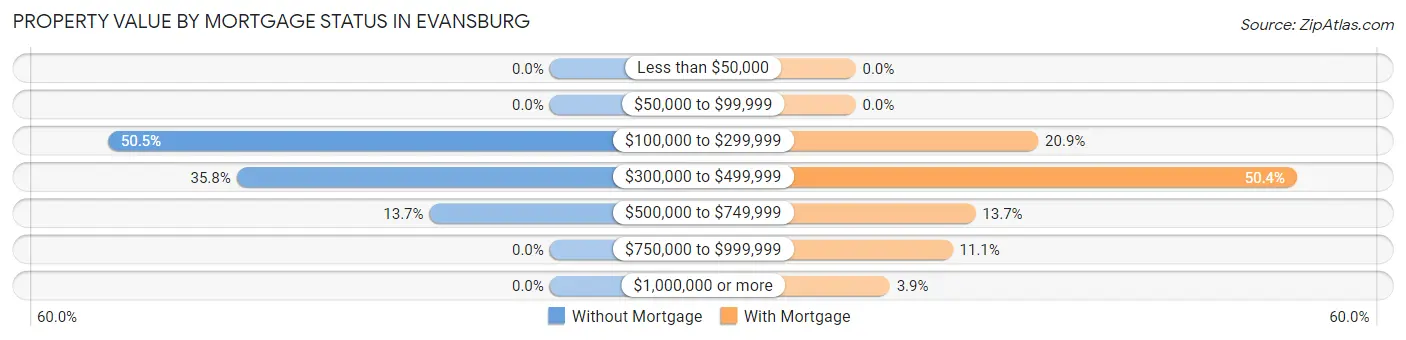
| Property Value | Without Mortgage | With Mortgage |
| Less than $50,000 | 0 (0.0%) | 0 (0.0%) |
| $50,000 to $99,999 | 0 (0.0%) | 0 (0.0%) |
| $100,000 to $299,999 | 158 (50.5%) | 96 (20.9%) |
| $300,000 to $499,999 | 112 (35.8%) | 232 (50.4%) |
| $500,000 to $749,999 | 43 (13.7%) | 63 (13.7%) |
| $750,000 to $999,999 | 0 (0.0%) | 51 (11.1%) |
| $1,000,000 or more | 0 (0.0%) | 18 (3.9%) |
| Total | 313 (100.0%) | 460 (100.0%) |
Household Income by Mortgage Status in Evansburg
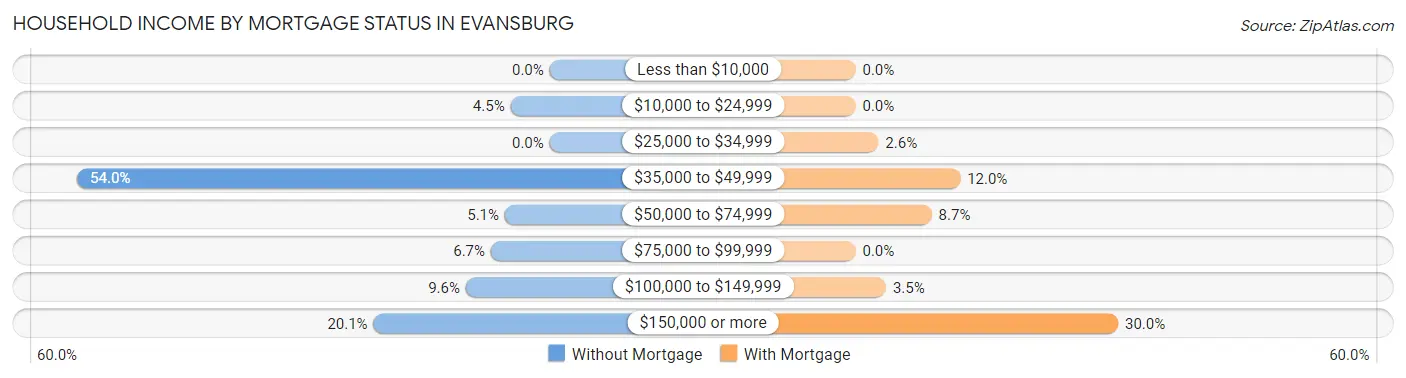
| Household Income | Without Mortgage | With Mortgage |
| Less than $10,000 | 0 (0.0%) | 0 (0.0%) |
| $10,000 to $24,999 | 14 (4.5%) | 0 (0.0%) |
| $25,000 to $34,999 | 0 (0.0%) | 12 (2.6%) |
| $35,000 to $49,999 | 169 (54.0%) | 55 (12.0%) |
| $50,000 to $74,999 | 16 (5.1%) | 40 (8.7%) |
| $75,000 to $99,999 | 21 (6.7%) | 0 (0.0%) |
| $100,000 to $149,999 | 30 (9.6%) | 16 (3.5%) |
| $150,000 or more | 63 (20.1%) | 138 (30.0%) |
| Total | 313 (100.0%) | 460 (100.0%) |
Property Value to Household Income Ratio in Evansburg
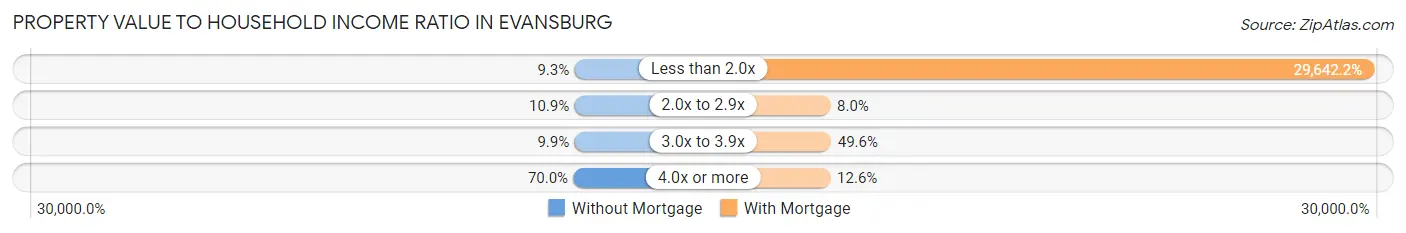
| Value-to-Income Ratio | Without Mortgage | With Mortgage |
| Less than 2.0x | 29 (9.3%) | 136,354 (29,642.2%) |
| 2.0x to 2.9x | 34 (10.9%) | 37 (8.0%) |
| 3.0x to 3.9x | 31 (9.9%) | 228 (49.6%) |
| 4.0x or more | 219 (70.0%) | 58 (12.6%) |
| Total | 313 (100.0%) | 460 (100.0%) |
Real Estate Taxes by Mortgage Status in Evansburg
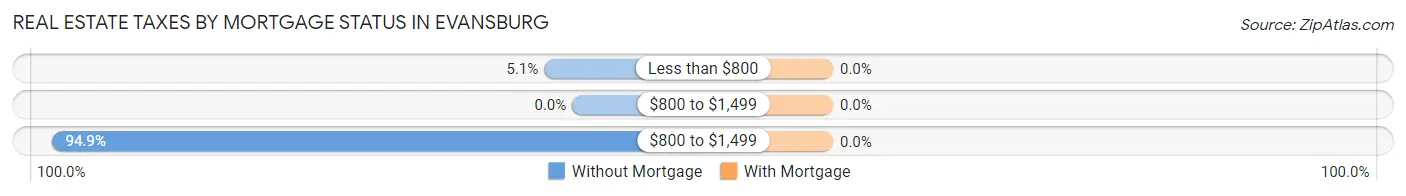
| Property Taxes | Without Mortgage | With Mortgage |
| Less than $800 | 16 (5.1%) | 0 (0.0%) |
| $800 to $1,499 | 0 (0.0%) | 0 (0.0%) |
| $800 to $1,499 | 297 (94.9%) | 0 (0.0%) |
| Total | 313 (100.0%) | 460 (100.0%) |
Health & Disability in Evansburg
Health Insurance Coverage by Age in Evansburg
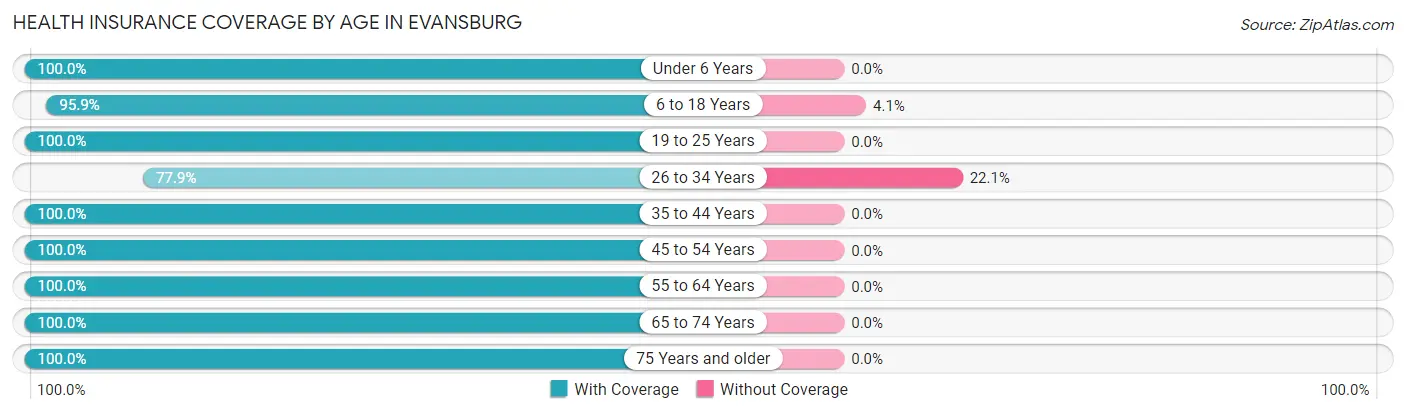
| Age Bracket | With Coverage | Without Coverage |
| Under 6 Years | 57 (100.0%) | 0 (0.0%) |
| 6 to 18 Years | 330 (95.9%) | 14 (4.1%) |
| 19 to 25 Years | 177 (100.0%) | 0 (0.0%) |
| 26 to 34 Years | 314 (77.9%) | 89 (22.1%) |
| 35 to 44 Years | 190 (100.0%) | 0 (0.0%) |
| 45 to 54 Years | 252 (100.0%) | 0 (0.0%) |
| 55 to 64 Years | 277 (100.0%) | 0 (0.0%) |
| 65 to 74 Years | 321 (100.0%) | 0 (0.0%) |
| 75 Years and older | 79 (100.0%) | 0 (0.0%) |
| Total | 1,997 (95.1%) | 103 (4.9%) |
Health Insurance Coverage by Citizenship Status in Evansburg
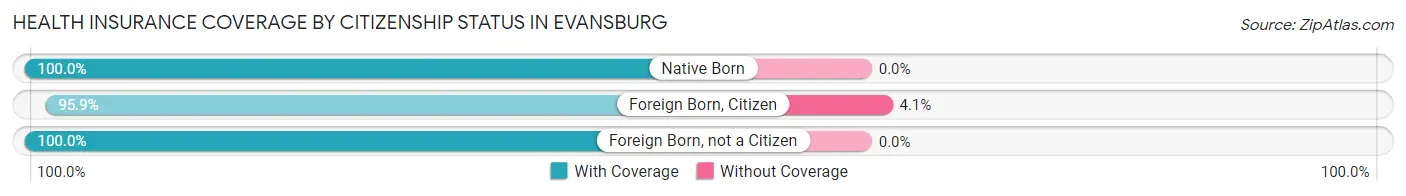
| Citizenship Status | With Coverage | Without Coverage |
| Native Born | 57 (100.0%) | 0 (0.0%) |
| Foreign Born, Citizen | 330 (95.9%) | 14 (4.1%) |
| Foreign Born, not a Citizen | 177 (100.0%) | 0 (0.0%) |
Health Insurance Coverage by Household Income in Evansburg
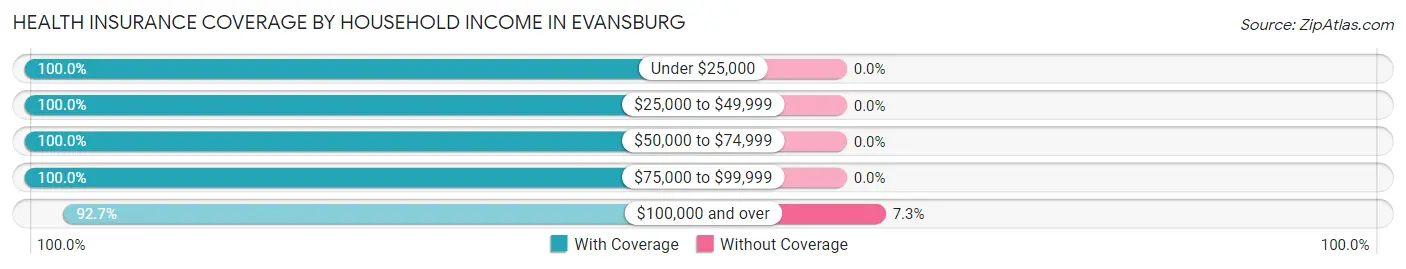
| Household Income | With Coverage | Without Coverage |
| Under $25,000 | 38 (100.0%) | 0 (0.0%) |
| $25,000 to $49,999 | 449 (100.0%) | 0 (0.0%) |
| $50,000 to $74,999 | 82 (100.0%) | 0 (0.0%) |
| $75,000 to $99,999 | 119 (100.0%) | 0 (0.0%) |
| $100,000 and over | 1,309 (92.7%) | 103 (7.3%) |
Public vs Private Health Insurance Coverage by Age in Evansburg
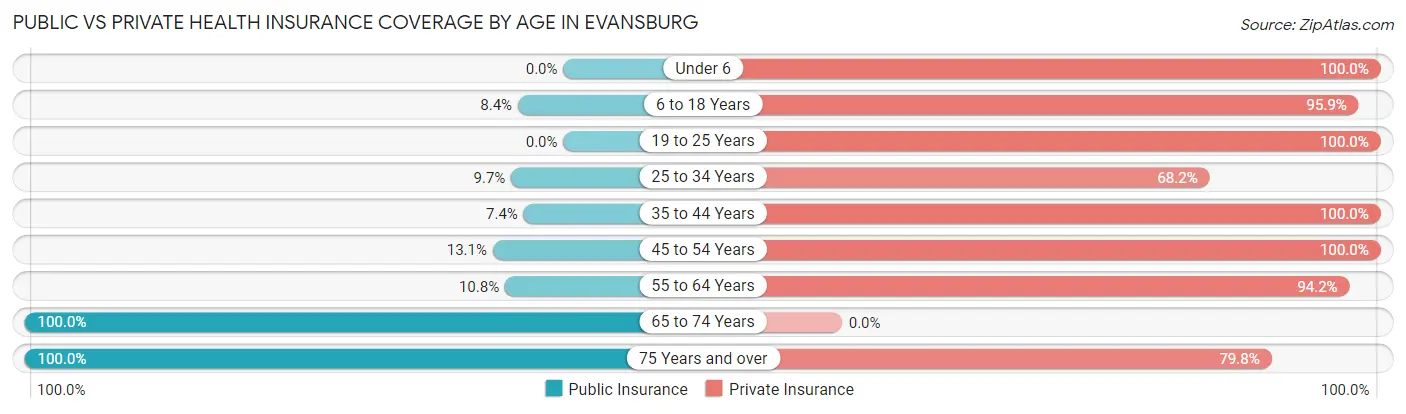
| Age Bracket | Public Insurance | Private Insurance |
| Under 6 | 0 (0.0%) | 57 (100.0%) |
| 6 to 18 Years | 29 (8.4%) | 330 (95.9%) |
| 19 to 25 Years | 0 (0.0%) | 177 (100.0%) |
| 25 to 34 Years | 39 (9.7%) | 275 (68.2%) |
| 35 to 44 Years | 14 (7.4%) | 190 (100.0%) |
| 45 to 54 Years | 33 (13.1%) | 252 (100.0%) |
| 55 to 64 Years | 30 (10.8%) | 261 (94.2%) |
| 65 to 74 Years | 321 (100.0%) | 0 (0.0%) |
| 75 Years and over | 79 (100.0%) | 63 (79.7%) |
| Total | 545 (26.0%) | 1,605 (76.4%) |
Disability Status by Sex by Age in Evansburg
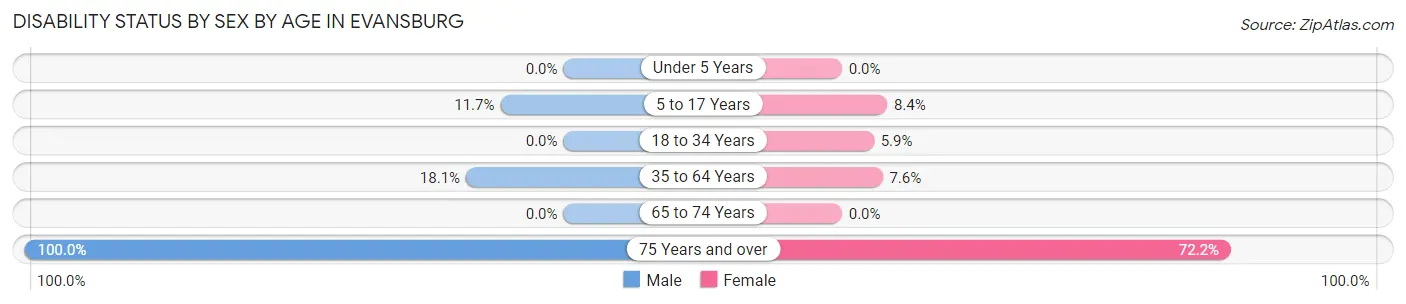
| Age Bracket | Male | Female |
| Under 5 Years | 0 (0.0%) | 0 (0.0%) |
| 5 to 17 Years | 22 (11.7%) | 14 (8.4%) |
| 18 to 34 Years | 0 (0.0%) | 16 (5.9%) |
| 35 to 64 Years | 51 (18.1%) | 33 (7.5%) |
| 65 to 74 Years | 0 (0.0%) | 0 (0.0%) |
| 75 Years and over | 43 (100.0%) | 26 (72.2%) |
Disability Class by Sex by Age in Evansburg
Disability Class: Hearing Difficulty
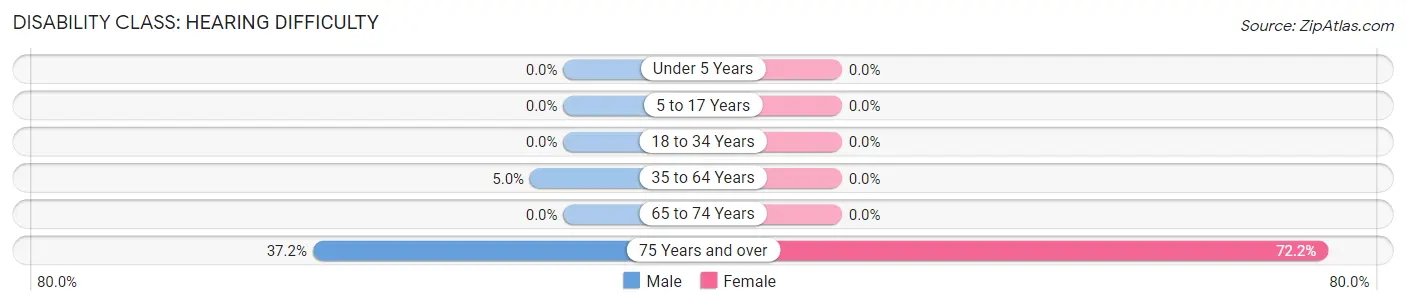
| Age Bracket | Male | Female |
| Under 5 Years | 0 (0.0%) | 0 (0.0%) |
| 5 to 17 Years | 0 (0.0%) | 0 (0.0%) |
| 18 to 34 Years | 0 (0.0%) | 0 (0.0%) |
| 35 to 64 Years | 14 (5.0%) | 0 (0.0%) |
| 65 to 74 Years | 0 (0.0%) | 0 (0.0%) |
| 75 Years and over | 16 (37.2%) | 26 (72.2%) |
Disability Class: Vision Difficulty
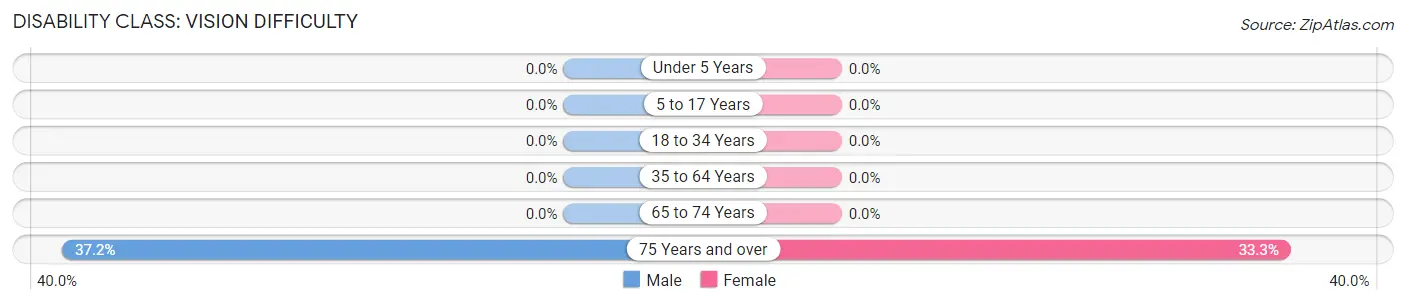
| Age Bracket | Male | Female |
| Under 5 Years | 0 (0.0%) | 0 (0.0%) |
| 5 to 17 Years | 0 (0.0%) | 0 (0.0%) |
| 18 to 34 Years | 0 (0.0%) | 0 (0.0%) |
| 35 to 64 Years | 0 (0.0%) | 0 (0.0%) |
| 65 to 74 Years | 0 (0.0%) | 0 (0.0%) |
| 75 Years and over | 16 (37.2%) | 12 (33.3%) |
Disability Class: Cognitive Difficulty
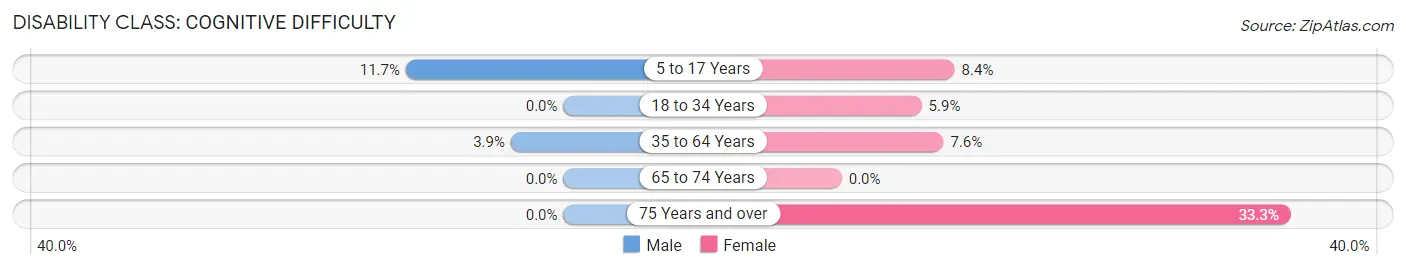
| Age Bracket | Male | Female |
| 5 to 17 Years | 22 (11.7%) | 14 (8.4%) |
| 18 to 34 Years | 0 (0.0%) | 16 (5.9%) |
| 35 to 64 Years | 11 (3.9%) | 33 (7.5%) |
| 65 to 74 Years | 0 (0.0%) | 0 (0.0%) |
| 75 Years and over | 0 (0.0%) | 12 (33.3%) |
Disability Class: Ambulatory Difficulty
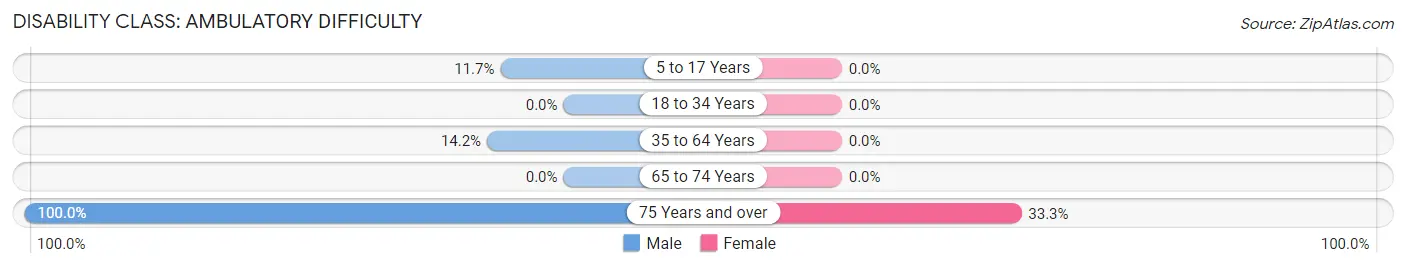
| Age Bracket | Male | Female |
| 5 to 17 Years | 22 (11.7%) | 0 (0.0%) |
| 18 to 34 Years | 0 (0.0%) | 0 (0.0%) |
| 35 to 64 Years | 40 (14.2%) | 0 (0.0%) |
| 65 to 74 Years | 0 (0.0%) | 0 (0.0%) |
| 75 Years and over | 43 (100.0%) | 12 (33.3%) |
Disability Class: Self-Care Difficulty
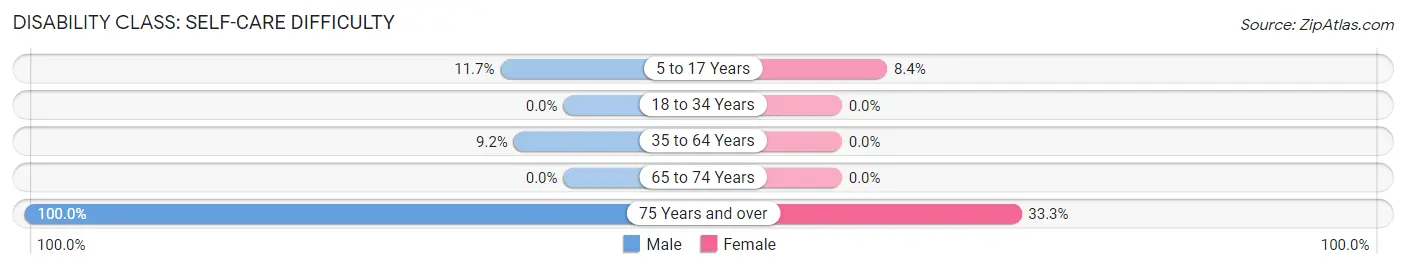
| Age Bracket | Male | Female |
| 5 to 17 Years | 22 (11.7%) | 14 (8.4%) |
| 18 to 34 Years | 0 (0.0%) | 0 (0.0%) |
| 35 to 64 Years | 26 (9.2%) | 0 (0.0%) |
| 65 to 74 Years | 0 (0.0%) | 0 (0.0%) |
| 75 Years and over | 43 (100.0%) | 12 (33.3%) |
Technology Access in Evansburg
Computing Device Access in Evansburg
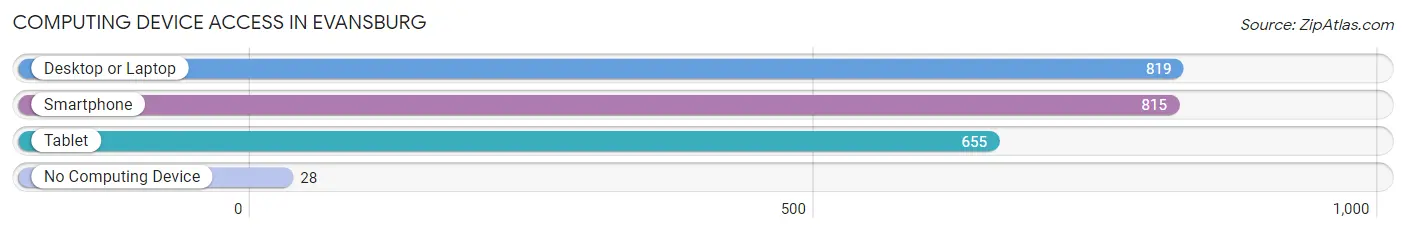
| Device Type | # Households | % Households |
| Desktop or Laptop | 819 | 95.3% |
| Smartphone | 815 | 94.9% |
| Tablet | 655 | 76.2% |
| No Computing Device | 28 | 3.3% |
| Total | 859 | 100.0% |
Internet Access in Evansburg
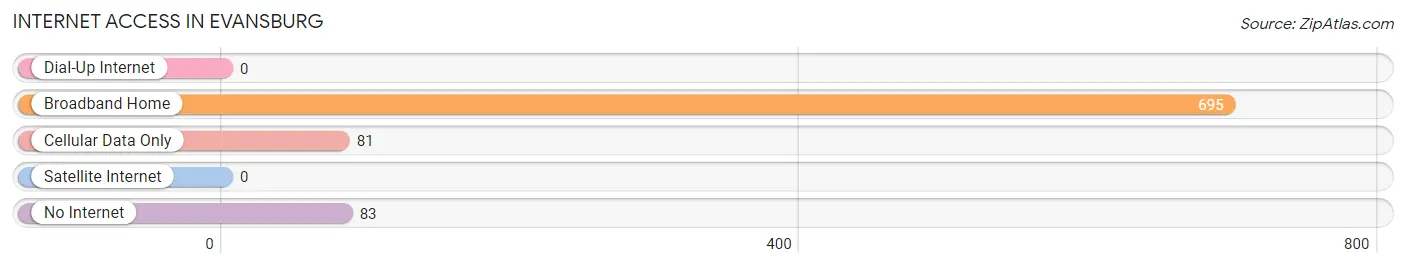
| Internet Type | # Households | % Households |
| Dial-Up Internet | 0 | 0.0% |
| Broadband Home | 695 | 80.9% |
| Cellular Data Only | 81 | 9.4% |
| Satellite Internet | 0 | 0.0% |
| No Internet | 83 | 9.7% |
| Total | 859 | 100.0% |
Evansburg Summary
Evansburg, Pennsylvania is a small borough located in Montgomery County, Pennsylvania. It is situated in the southeastern part of the state, about 20 miles northwest of Philadelphia. The borough is bordered by Lower Providence Township to the north, Upper Providence Township to the east, Worcester Township to the south, and Skippack Township to the west. As of the 2010 census, the population of Evansburg was 1,845.
History
The area that is now Evansburg was first settled in the early 1700s by German immigrants. The first settler was Johannes Eberhart, who purchased land in the area in 1717. The area was originally known as Eberhart’s Mill, and the first mill was built in 1720. The area was later renamed Evansburg in 1820, after the Evans family, who had purchased the land in 1790.
The borough was officially incorporated in 1876. At the time, the population was around 500 people. The borough was primarily an agricultural community, with the main crops being wheat, corn, and oats. The borough also had several small businesses, including a blacksmith shop, a general store, and a post office.
Geography
Evansburg is located at 40°10'17" North, 75°25'45" West (40.1714, -75.4292). It has a total area of 0.9 square miles, all of which is land. The borough is situated in the southeastern part of Montgomery County, about 20 miles northwest of Philadelphia. It is bordered by Lower Providence Township to the north, Upper Providence Township to the east, Worcester Township to the south, and Skippack Township to the west.
The borough is located in the Perkiomen Creek watershed. The creek runs through the borough, and is a popular spot for fishing and canoeing. The borough is also home to Evansburg State Park, which is a popular destination for hiking, biking, and camping.
Economy
The economy of Evansburg is primarily based on agriculture and small businesses. The main crops grown in the area are wheat, corn, and oats. The borough also has several small businesses, including a general store, a post office, and a few restaurants.
The borough is also home to several manufacturing companies, including a plastics manufacturer, a metal fabricator, and a printing company. The borough is also home to a few small technology companies, including a software development firm and a web design firm.
Demographics
As of the 2010 census, the population of Evansburg was 1,845. The racial makeup of the borough was 94.3% White, 2.2% African American, 0.3% Native American, 0.7% Asian, 0.1% Pacific Islander, 0.9% from other races, and 1.5% from two or more races. Hispanic or Latino of any race were 2.2% of the population.
The median household income in Evansburg was $60,938, and the median family income was $68,750. The per capita income was $27,945. About 4.2% of families and 5.3% of the population were below the poverty line, including 6.2% of those under age 18 and 4.2% of those age 65 or over.
Common Questions
What is the Total Population of Evansburg?
Total Population of Evansburg is 2,100.
What is the Total Male Population of Evansburg?
Total Male Population of Evansburg is 910.
What is the Total Female Population of Evansburg?
Total Female Population of Evansburg is 1,190.
What is the Ratio of Males per 100 Females in Evansburg?
There are 76.47 Males per 100 Females in Evansburg.
What is the Ratio of Females per 100 Males in Evansburg?
There are 130.77 Females per 100 Males in Evansburg.
What is the Median Population Age in Evansburg?
Median Population Age in Evansburg is 41.3 Years.
What is the Average Family Size in Evansburg
Average Family Size in Evansburg is 3.1 People.
What is the Average Household Size in Evansburg
Average Household Size in Evansburg is 2.4 People.
What is Per Capita Income in Evansburg?
Per Capita income in Evansburg is $55,924.
What is the Median Family Income in Evansburg?
Median Family Income in Evansburg is $144,563.
What is the Median Household income in Evansburg?
Median Household Income in Evansburg is $115,386.
What is Income or Wage Gap in Evansburg?
Income or Wage Gap in Evansburg is 20.0%.
Women in Evansburg earn 80.0 cents for every dollar earned by a man.
What is Inequality or Gini Index in Evansburg?
Inequality or Gini Index in Evansburg is 0.45.
How Large is the Labor Force in Evansburg?
There are 1,159 People in the Labor Forcein in Evansburg.
What is the Percentage of People in the Labor Force in Evansburg?
64.9% of People are in the Labor Force in Evansburg.
What is the Unemployment Rate in Evansburg?
Unemployment Rate in Evansburg is 7.6%.