Linntown, PA
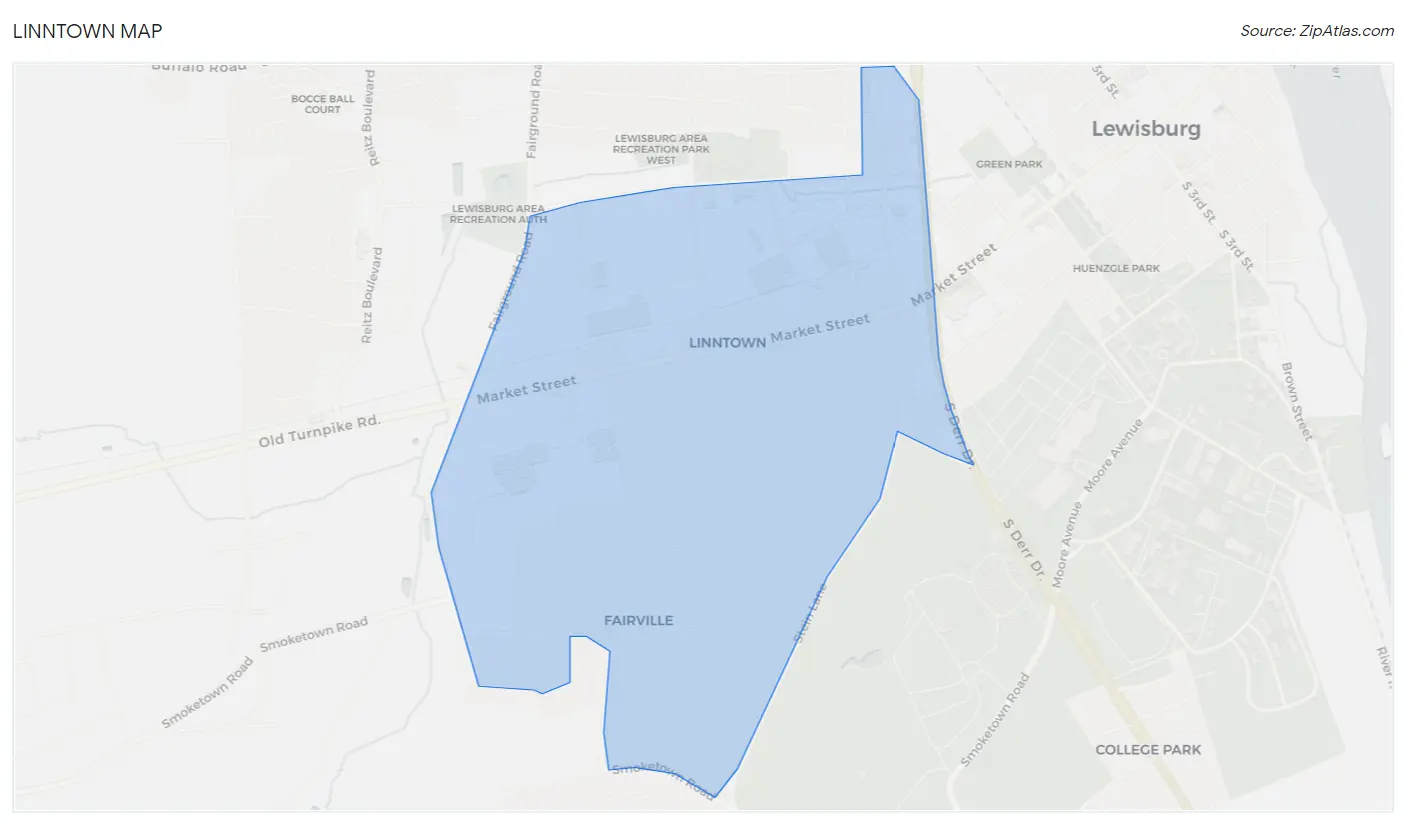
Linntown Map
Linntown Overview
1,687
TOTAL POPULATION
828
MALE POPULATION
859
FEMALE POPULATION
96.39
MALES / 100 FEMALES
103.74
FEMALES / 100 MALES
38.9
MEDIAN AGE
3.2
AVG FAMILY SIZE
2.9
AVG HOUSEHOLD SIZE
$58,274
PER CAPITA INCOME
$120,673
AVG FAMILY INCOME
$101,250
AVG HOUSEHOLD INCOME
10.1%
WAGE / INCOME GAP [ % ]
89.9¢/ $1
WAGE / INCOME GAP [ $ ]
0.52
INEQUALITY / GINI INDEX
938
LABOR FORCE [ PEOPLE ]
72.4%
PERCENT IN LABOR FORCE
9.4%
UNEMPLOYMENT RATE
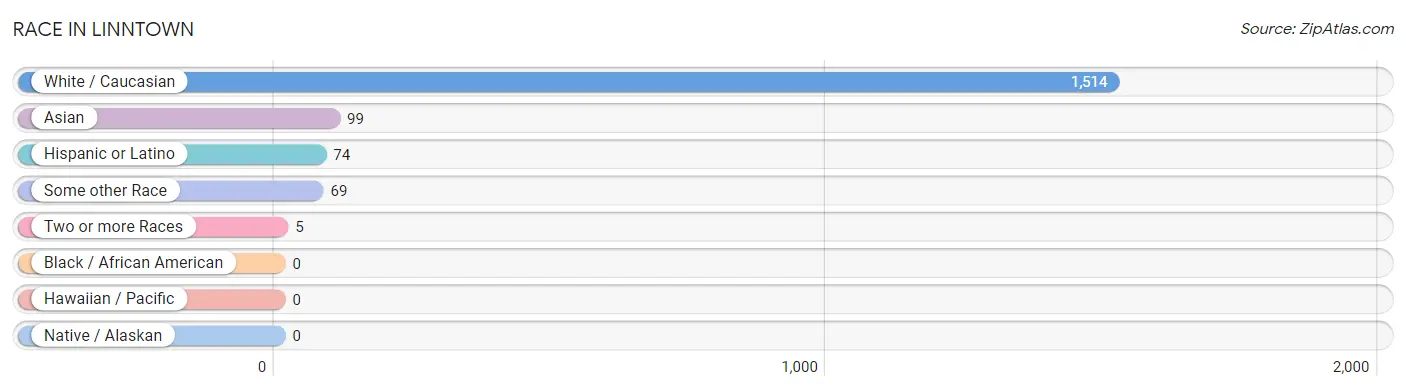
Race in Linntown
The most populous races in Linntown are White / Caucasian (1,514 | 89.7%), Asian (99 | 5.9%), and Hispanic or Latino (74 | 4.4%).
| Race | # Population | % Population |
| Asian | 99 | 5.9% |
| Black / African American | 0 | 0.0% |
| Hawaiian / Pacific | 0 | 0.0% |
| Hispanic or Latino | 74 | 4.4% |
| Native / Alaskan | 0 | 0.0% |
| White / Caucasian | 1,514 | 89.7% |
| Two or more Races | 5 | 0.3% |
| Some other Race | 69 | 4.1% |
| Total | 1,687 | 100.0% |
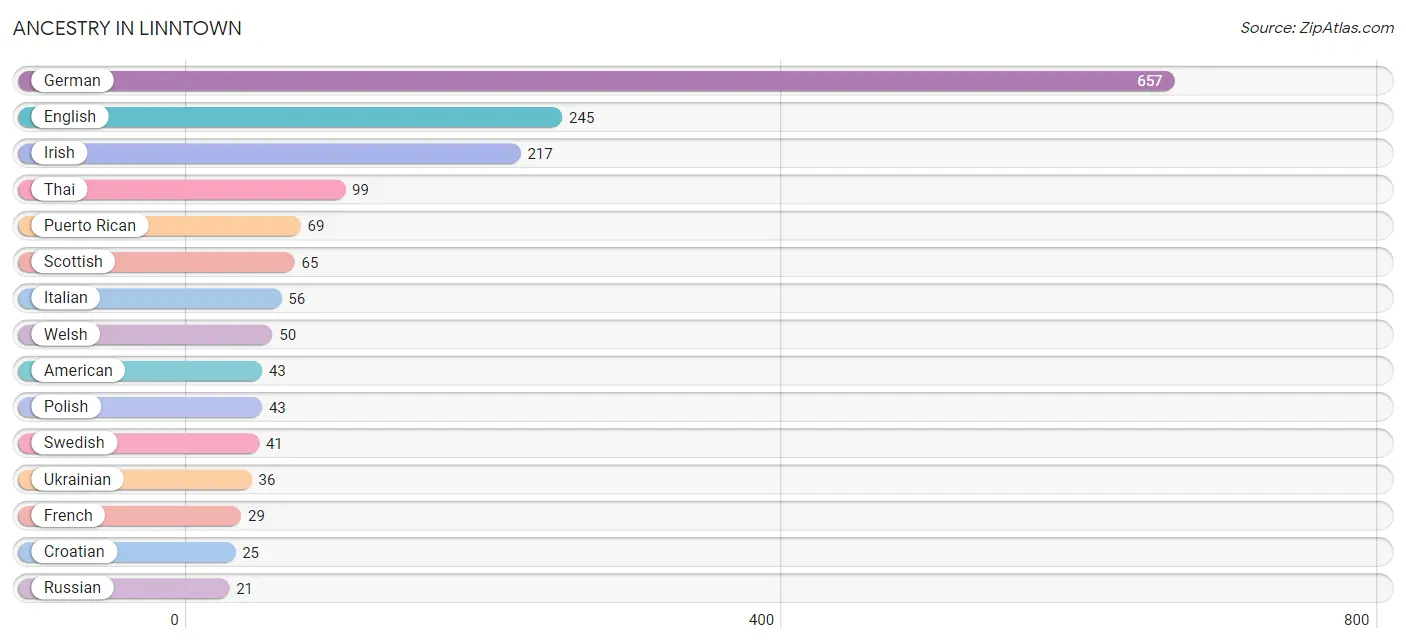
Ancestry in Linntown
The most populous ancestries reported in Linntown are German (657 | 38.9%), English (245 | 14.5%), Irish (217 | 12.9%), Thai (99 | 5.9%), and Puerto Rican (69 | 4.1%), together accounting for 76.3% of all Linntown residents.
| Ancestry | # Population | % Population |
| American | 43 | 2.5% |
| Croatian | 25 | 1.5% |
| Dutch | 16 | 0.9% |
| English | 245 | 14.5% |
| French | 29 | 1.7% |
| German | 657 | 38.9% |
| Greek | 20 | 1.2% |
| Irish | 217 | 12.9% |
| Italian | 56 | 3.3% |
| Polish | 43 | 2.5% |
| Puerto Rican | 69 | 4.1% |
| Russian | 21 | 1.2% |
| Scotch-Irish | 13 | 0.8% |
| Scottish | 65 | 3.8% |
| South American | 5 | 0.3% |
| Swedish | 41 | 2.4% |
| Swiss | 14 | 0.8% |
| Thai | 99 | 5.9% |
| Ukrainian | 36 | 2.1% |
| Venezuelan | 5 | 0.3% |
| Welsh | 50 | 3.0% | View All 21 Rows |
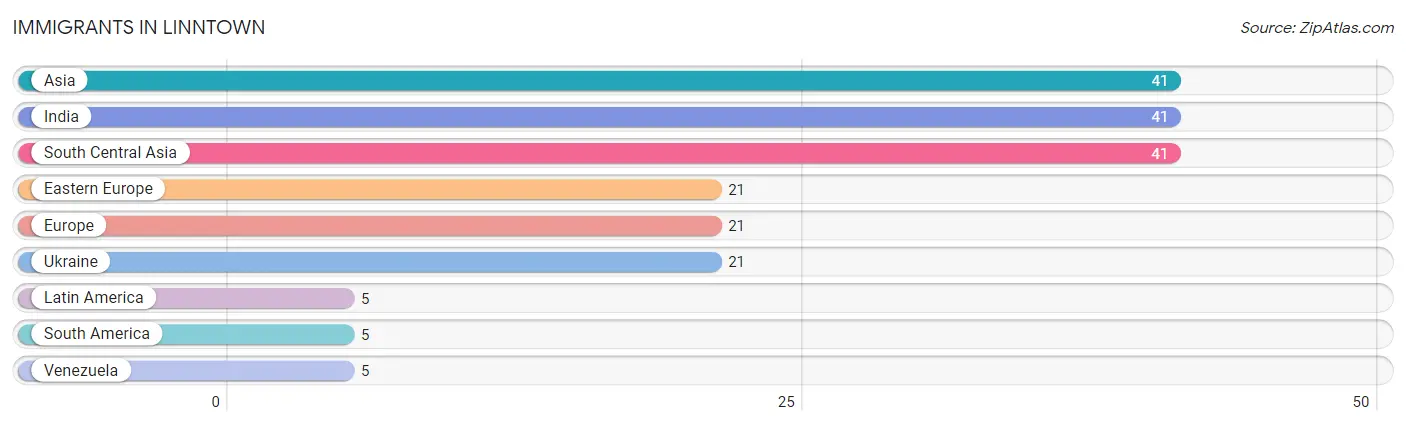
Immigrants in Linntown
The most numerous immigrant groups reported in Linntown came from Asia (41 | 2.4%), India (41 | 2.4%), South Central Asia (41 | 2.4%), Eastern Europe (21 | 1.2%), and Europe (21 | 1.2%), together accounting for 9.8% of all Linntown residents.
| Immigration Origin | # Population | % Population |
| Asia | 41 | 2.4% |
| Eastern Europe | 21 | 1.2% |
| Europe | 21 | 1.2% |
| India | 41 | 2.4% |
| Latin America | 5 | 0.3% |
| South America | 5 | 0.3% |
| South Central Asia | 41 | 2.4% |
| Ukraine | 21 | 1.2% |
| Venezuela | 5 | 0.3% | View All 9 Rows |
Sex and Age in Linntown
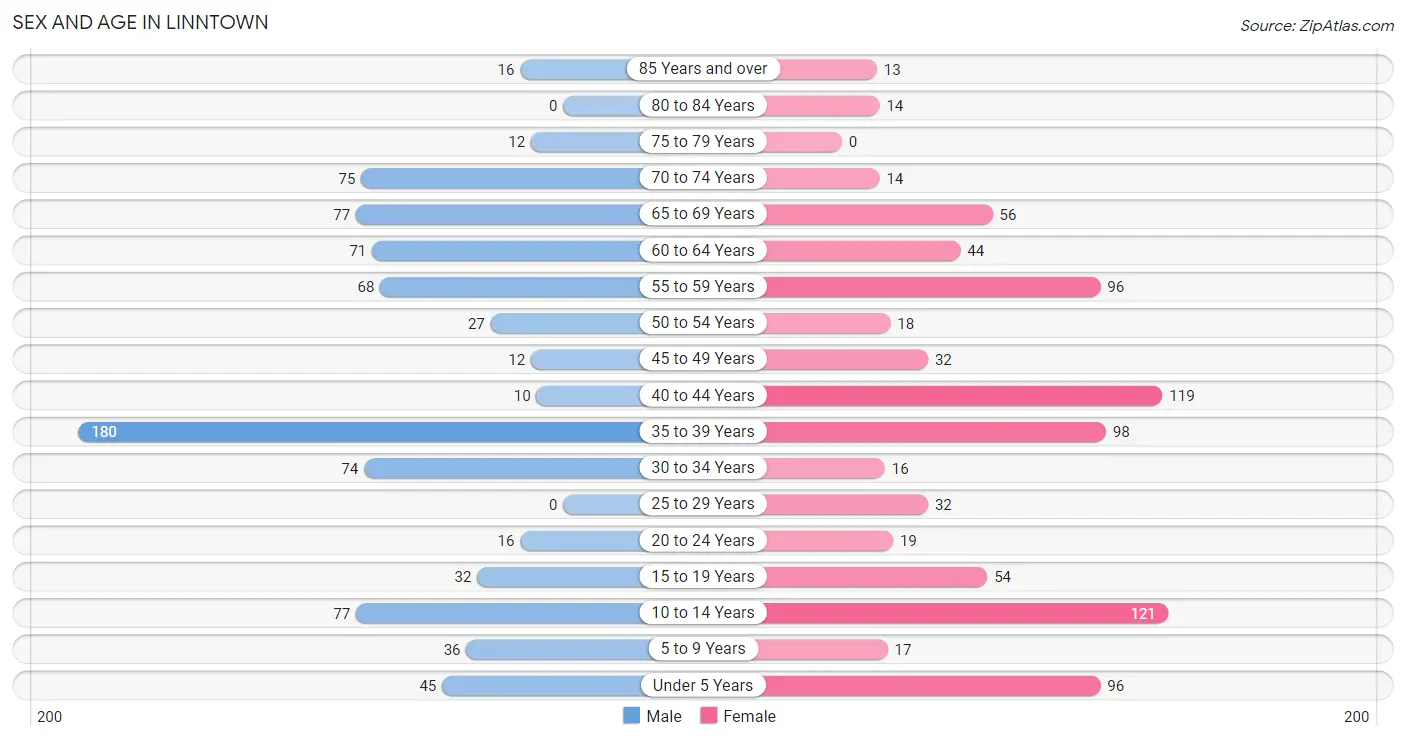
Sex and Age in Linntown
The most populous age groups in Linntown are 35 to 39 Years (180 | 21.7%) for men and 10 to 14 Years (121 | 14.1%) for women.
| Age Bracket | Male | Female |
| Under 5 Years | 45 (5.4%) | 96 (11.2%) |
| 5 to 9 Years | 36 (4.3%) | 17 (2.0%) |
| 10 to 14 Years | 77 (9.3%) | 121 (14.1%) |
| 15 to 19 Years | 32 (3.9%) | 54 (6.3%) |
| 20 to 24 Years | 16 (1.9%) | 19 (2.2%) |
| 25 to 29 Years | 0 (0.0%) | 32 (3.7%) |
| 30 to 34 Years | 74 (8.9%) | 16 (1.9%) |
| 35 to 39 Years | 180 (21.7%) | 98 (11.4%) |
| 40 to 44 Years | 10 (1.2%) | 119 (13.9%) |
| 45 to 49 Years | 12 (1.5%) | 32 (3.7%) |
| 50 to 54 Years | 27 (3.3%) | 18 (2.1%) |
| 55 to 59 Years | 68 (8.2%) | 96 (11.2%) |
| 60 to 64 Years | 71 (8.6%) | 44 (5.1%) |
| 65 to 69 Years | 77 (9.3%) | 56 (6.5%) |
| 70 to 74 Years | 75 (9.1%) | 14 (1.6%) |
| 75 to 79 Years | 12 (1.5%) | 0 (0.0%) |
| 80 to 84 Years | 0 (0.0%) | 14 (1.6%) |
| 85 Years and over | 16 (1.9%) | 13 (1.5%) |
| Total | 828 (100.0%) | 859 (100.0%) |
Families and Households in Linntown
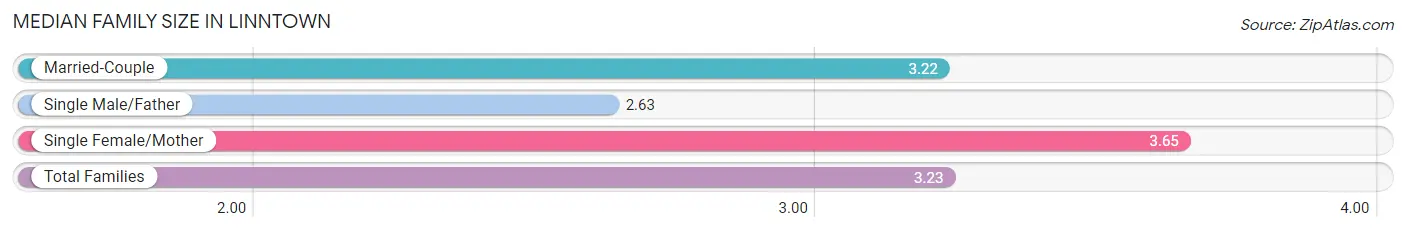
Median Family Size in Linntown
The median family size in Linntown is 3.23 persons per family, with single female/mother families (34 | 7.2%) accounting for the largest median family size of 3.65 persons per family. On the other hand, single male/father families (19 | 4.0%) represent the smallest median family size with 2.63 persons per family.
| Family Type | # Families | Family Size |
| Married-Couple | 418 (88.7%) | 3.22 |
| Single Male/Father | 19 (4.0%) | 2.63 |
| Single Female/Mother | 34 (7.2%) | 3.65 |
| Total Families | 471 (100.0%) | 3.23 |
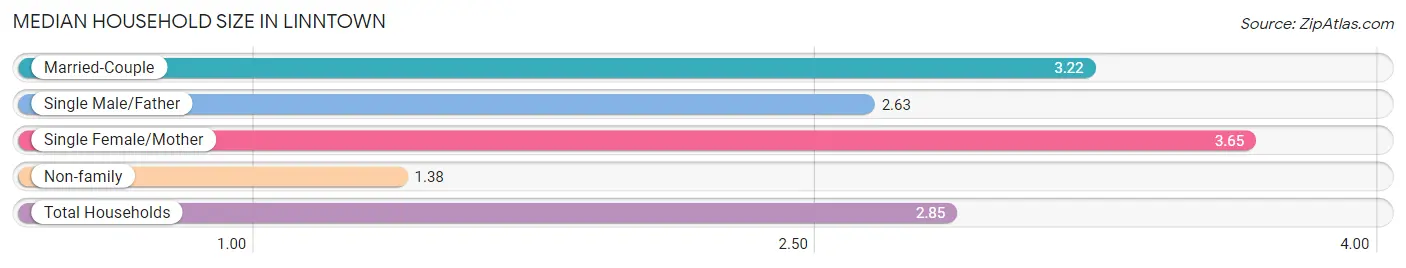
Median Household Size in Linntown
The median household size in Linntown is 2.85 persons per household, with single female/mother households (34 | 5.7%) accounting for the largest median household size of 3.65 persons per household. non-family households (121 | 20.4%) represent the smallest median household size with 1.38 persons per household.
| Household Type | # Households | Household Size |
| Married-Couple | 418 (70.6%) | 3.22 |
| Single Male/Father | 19 (3.2%) | 2.63 |
| Single Female/Mother | 34 (5.7%) | 3.65 |
| Non-family | 121 (20.4%) | 1.38 |
| Total Households | 592 (100.0%) | 2.85 |
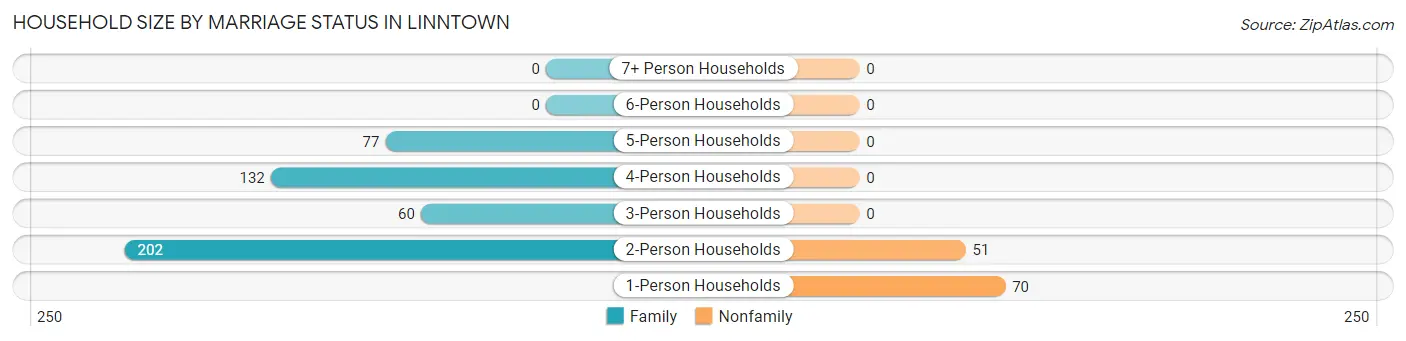
Household Size by Marriage Status in Linntown
Out of a total of 592 households in Linntown, 471 (79.6%) are family households, while 121 (20.4%) are nonfamily households. The most numerous type of family households are 2-person households, comprising 202, and the most common type of nonfamily households are 1-person households, comprising 70.
| Household Size | Family Households | Nonfamily Households |
| 1-Person Households | - | 70 (11.8%) |
| 2-Person Households | 202 (34.1%) | 51 (8.6%) |
| 3-Person Households | 60 (10.1%) | 0 (0.0%) |
| 4-Person Households | 132 (22.3%) | 0 (0.0%) |
| 5-Person Households | 77 (13.0%) | 0 (0.0%) |
| 6-Person Households | 0 (0.0%) | 0 (0.0%) |
| 7+ Person Households | 0 (0.0%) | 0 (0.0%) |
| Total | 471 (79.6%) | 121 (20.4%) |
Female Fertility in Linntown
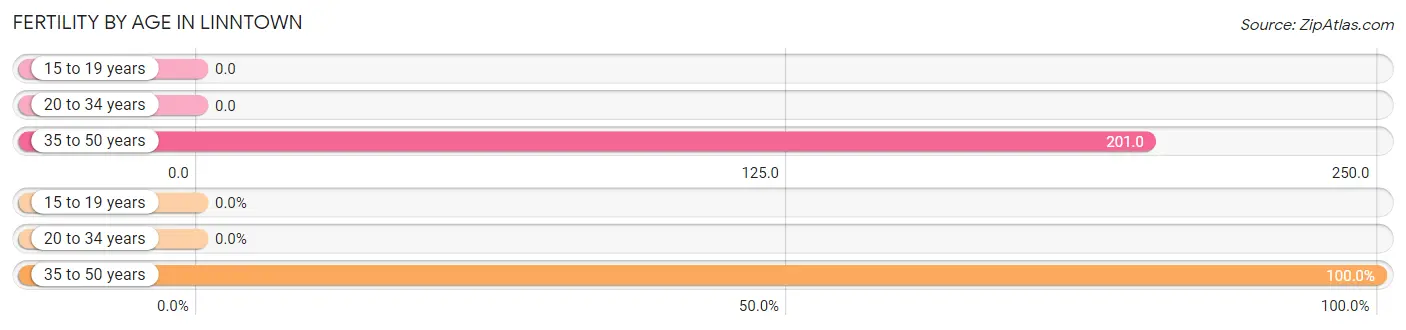
Fertility by Age in Linntown
Average fertility rate in Linntown is 135.0 births per 1,000 women. Women in the age bracket of 35 to 50 years have the highest fertility rate with 201.0 births per 1,000 women. Women in the age bracket of 35 to 50 years acount for 100.0% of all women with births.
| Age Bracket | Women with Births | Births / 1,000 Women |
| 15 to 19 years | 0 (0.0%) | 0.0 |
| 20 to 34 years | 0 (0.0%) | 0.0 |
| 35 to 50 years | 50 (100.0%) | 201.0 |
| Total | 50 (100.0%) | 135.0 |
Fertility by Age by Marriage Status in Linntown
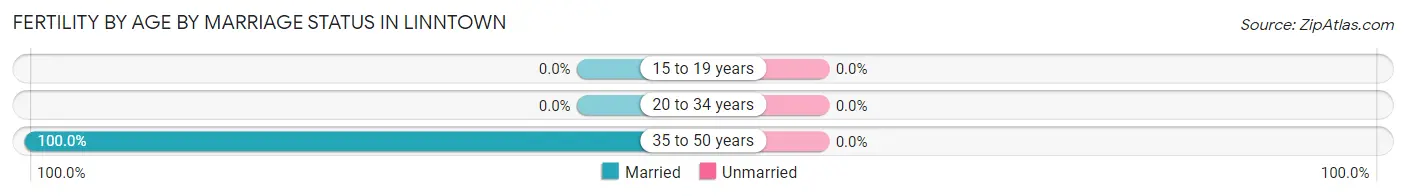
| Age Bracket | Married | Unmarried |
| 15 to 19 years | 0 (0.0%) | 0 (0.0%) |
| 20 to 34 years | 0 (0.0%) | 0 (0.0%) |
| 35 to 50 years | 50 (100.0%) | 0 (0.0%) |
| Total | 50 (100.0%) | 0 (0.0%) |
Fertility by Education in Linntown
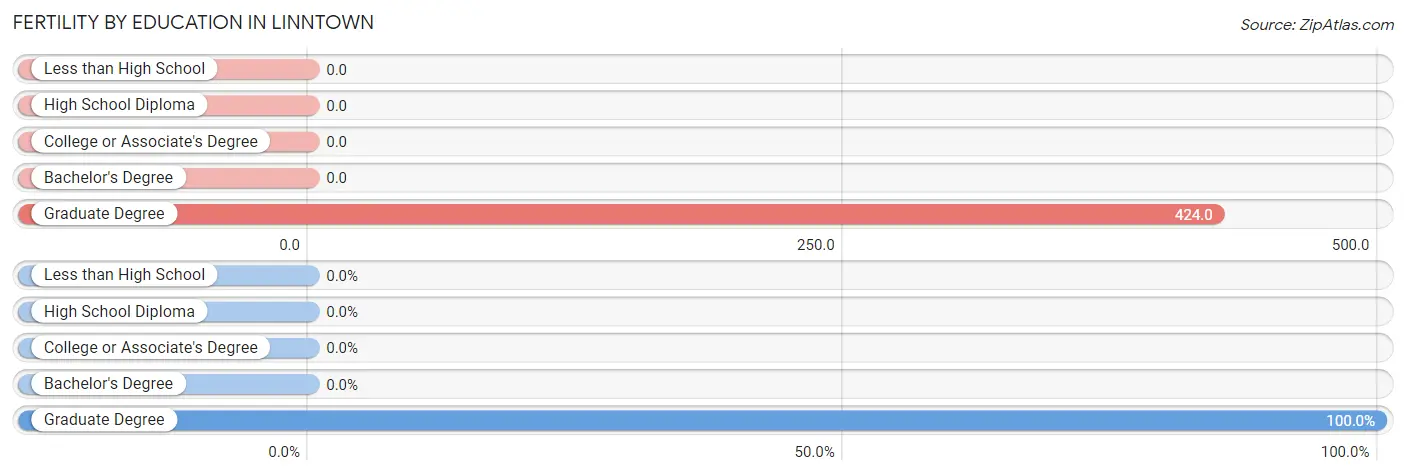
| Educational Attainment | Women with Births | Births / 1,000 Women |
| Less than High School | 0 (0.0%) | 0.0 |
| High School Diploma | 0 (0.0%) | 0.0 |
| College or Associate's Degree | 0 (0.0%) | 0.0 |
| Bachelor's Degree | 0 (0.0%) | 0.0 |
| Graduate Degree | 50 (100.0%) | 424.0 |
| Total | 50 (100.0%) | 135.0 |
Fertility by Education by Marriage Status in Linntown
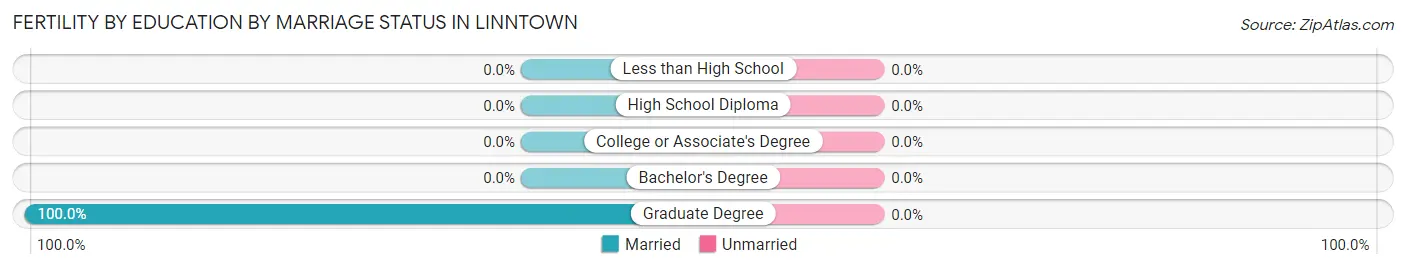
| Educational Attainment | Married | Unmarried |
| Less than High School | 0 (0.0%) | 0 (0.0%) |
| High School Diploma | 0 (0.0%) | 0 (0.0%) |
| College or Associate's Degree | 0 (0.0%) | 0 (0.0%) |
| Bachelor's Degree | 0 (0.0%) | 0 (0.0%) |
| Graduate Degree | 50 (100.0%) | 0 (0.0%) |
| Total | 50 (100.0%) | 0 (0.0%) |
Income in Linntown
Income Overview in Linntown
Per Capita Income in Linntown is $58,274, while median incomes of families and households are $120,673 and $101,250 respectively.
| Characteristic | Number | Measure |
| Per Capita Income | 1,687 | $58,274 |
| Median Family Income | 471 | $120,673 |
| Mean Family Income | 471 | $194,233 |
| Median Household Income | 592 | $101,250 |
| Mean Household Income | 592 | $169,758 |
| Income Deficit | 471 | $0 |
| Wage / Income Gap (%) | 1,687 | 10.11% |
| Wage / Income Gap ($) | 1,687 | 89.89¢ per $1 |
| Gini / Inequality Index | 1,687 | 0.52 |
Earnings by Sex in Linntown
Average Earnings in Linntown are $50,668, $56,161 for men and $50,483 for women, a difference of 10.1%.
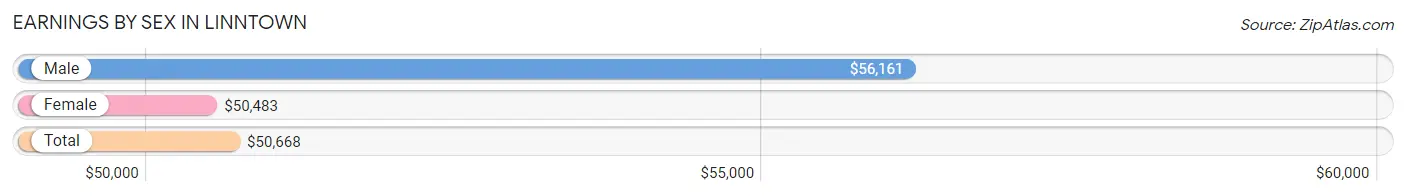
| Sex | Number | Average Earnings |
| Male | 515 (54.1%) | $56,161 |
| Female | 436 (45.9%) | $50,483 |
| Total | 951 (100.0%) | $50,668 |
Earnings by Sex by Income Bracket in Linntown
The most common earnings brackets in Linntown are $100,000+ for men (108 | 21.0%) and $50,000 to $54,999 for women (88 | 20.2%).
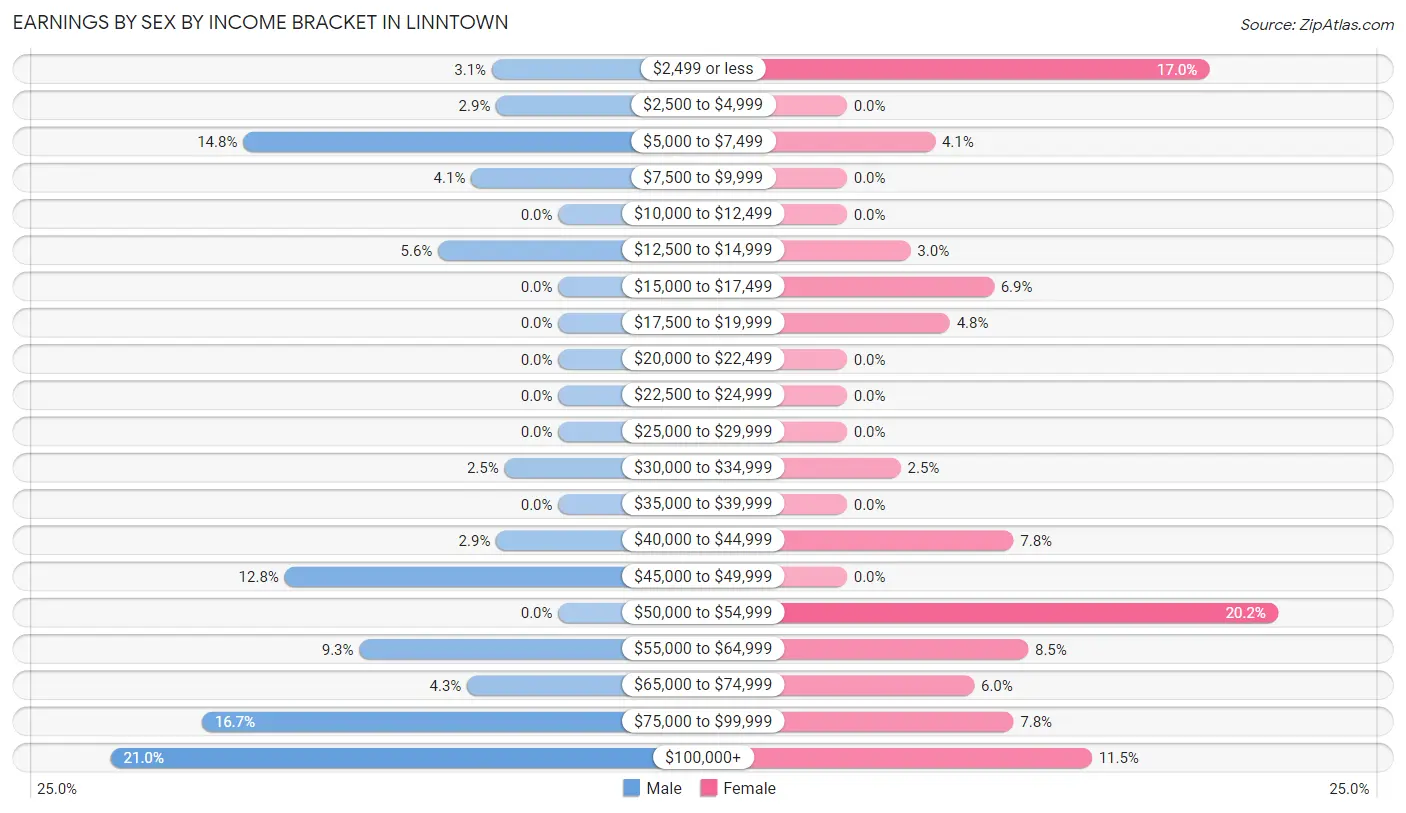
| Income | Male | Female |
| $2,499 or less | 16 (3.1%) | 74 (17.0%) |
| $2,500 to $4,999 | 15 (2.9%) | 0 (0.0%) |
| $5,000 to $7,499 | 76 (14.8%) | 18 (4.1%) |
| $7,500 to $9,999 | 21 (4.1%) | 0 (0.0%) |
| $10,000 to $12,499 | 0 (0.0%) | 0 (0.0%) |
| $12,500 to $14,999 | 29 (5.6%) | 13 (3.0%) |
| $15,000 to $17,499 | 0 (0.0%) | 30 (6.9%) |
| $17,500 to $19,999 | 0 (0.0%) | 21 (4.8%) |
| $20,000 to $22,499 | 0 (0.0%) | 0 (0.0%) |
| $22,500 to $24,999 | 0 (0.0%) | 0 (0.0%) |
| $25,000 to $29,999 | 0 (0.0%) | 0 (0.0%) |
| $30,000 to $34,999 | 13 (2.5%) | 11 (2.5%) |
| $35,000 to $39,999 | 0 (0.0%) | 0 (0.0%) |
| $40,000 to $44,999 | 15 (2.9%) | 34 (7.8%) |
| $45,000 to $49,999 | 66 (12.8%) | 0 (0.0%) |
| $50,000 to $54,999 | 0 (0.0%) | 88 (20.2%) |
| $55,000 to $64,999 | 48 (9.3%) | 37 (8.5%) |
| $65,000 to $74,999 | 22 (4.3%) | 26 (6.0%) |
| $75,000 to $99,999 | 86 (16.7%) | 34 (7.8%) |
| $100,000+ | 108 (21.0%) | 50 (11.5%) |
| Total | 515 (100.0%) | 436 (100.0%) |
Earnings by Sex by Educational Attainment in Linntown
Average earnings in Linntown are $59,671 for men and $51,264 for women, a difference of 14.1%. Men with an educational attainment of high school diploma enjoy the highest average annual earnings of $85,754, while those with bachelor's degree education earn the least with $48,421. Women with an educational attainment of graduate degree earn the most with the average annual earnings of $81,691, while those with bachelor's degree education have the smallest earnings of $41,087.
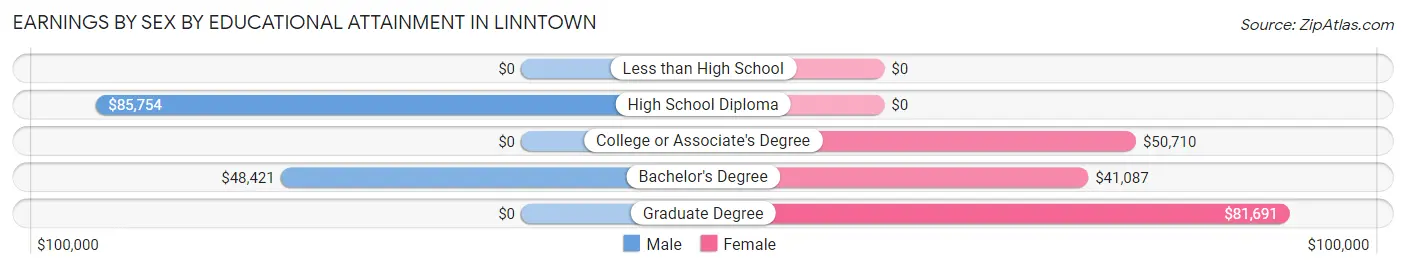
| Educational Attainment | Male Income | Female Income |
| Less than High School | - | - |
| High School Diploma | $85,754 | $0 |
| College or Associate's Degree | - | - |
| Bachelor's Degree | $48,421 | $41,087 |
| Graduate Degree | - | - |
| Total | $59,671 | $51,264 |
Family Income in Linntown
Family Income Brackets in Linntown
According to the Linntown family income data, there are 112 families falling into the $100,000 to $149,999 income range, which is the most common income bracket and makes up 23.8% of all families.
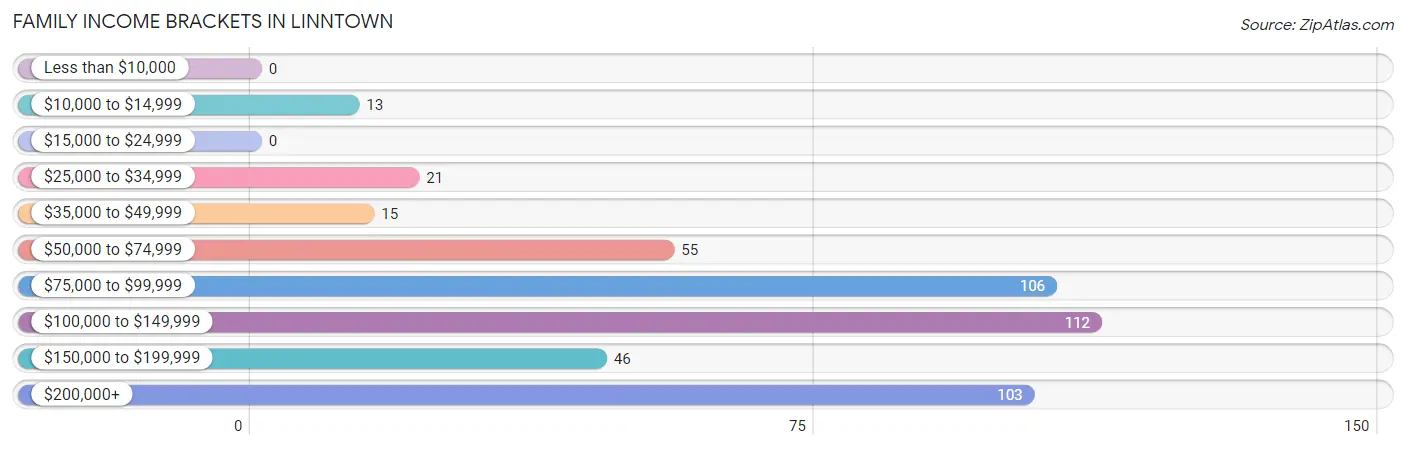
| Income Bracket | # Families | % Families |
| Less than $10,000 | 0 | 0.0% |
| $10,000 to $14,999 | 13 | 2.8% |
| $15,000 to $24,999 | 0 | 0.0% |
| $25,000 to $34,999 | 21 | 4.5% |
| $35,000 to $49,999 | 15 | 3.2% |
| $50,000 to $74,999 | 55 | 11.7% |
| $75,000 to $99,999 | 106 | 22.5% |
| $100,000 to $149,999 | 112 | 23.8% |
| $150,000 to $199,999 | 46 | 9.8% |
| $200,000+ | 103 | 21.9% |
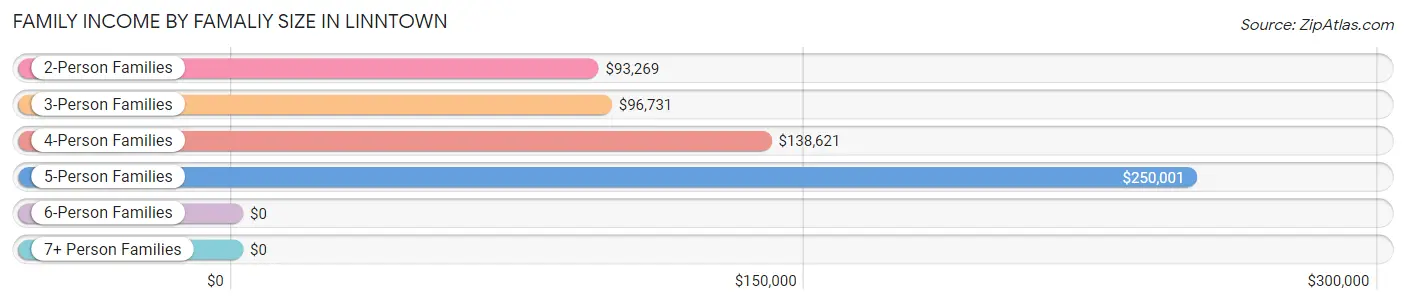
Family Income by Famaliy Size in Linntown
5-person families (77 | 16.4%) account for the highest median family income in Linntown with $250,001 per family, while 5-person families (77 | 16.4%) have the highest median income of $50,000 per family member.
| Income Bracket | # Families | Median Income |
| 2-Person Families | 202 (42.9%) | $93,269 |
| 3-Person Families | 60 (12.7%) | $96,731 |
| 4-Person Families | 132 (28.0%) | $138,621 |
| 5-Person Families | 77 (16.4%) | $250,001 |
| 6-Person Families | 0 (0.0%) | $0 |
| 7+ Person Families | 0 (0.0%) | $0 |
| Total | 471 (100.0%) | $120,673 |
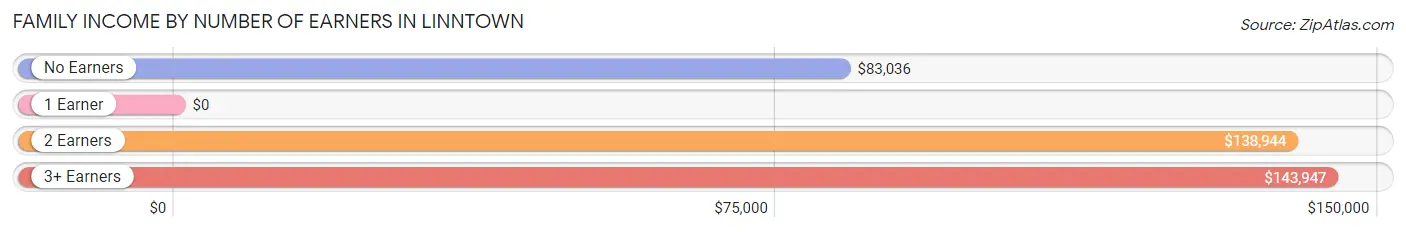
Family Income by Number of Earners in Linntown
| Number of Earners | # Families | Median Income |
| No Earners | 74 (15.7%) | $83,036 |
| 1 Earner | 68 (14.4%) | $0 |
| 2 Earners | 229 (48.6%) | $138,944 |
| 3+ Earners | 100 (21.2%) | $143,947 |
| Total | 471 (100.0%) | $120,673 |
Household Income in Linntown
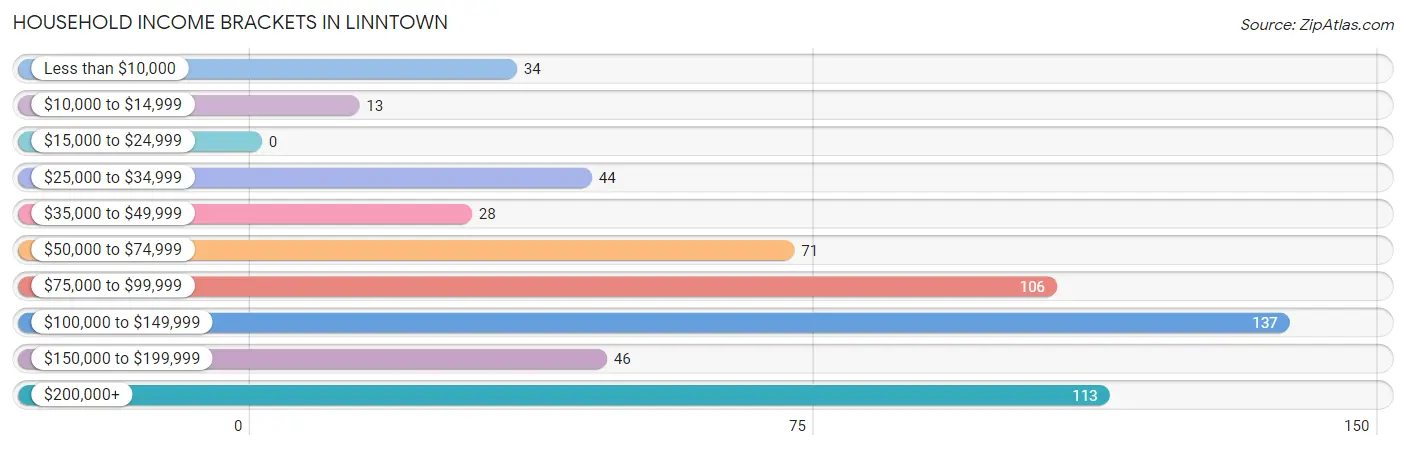
Household Income Brackets in Linntown
With 137 households falling in the category, the $100,000 to $149,999 income range is the most frequent in Linntown, accounting for 23.1% of all households.
| Income Bracket | # Households | % Households |
| Less than $10,000 | 34 | 5.7% |
| $10,000 to $14,999 | 13 | 2.2% |
| $15,000 to $24,999 | 0 | 0.0% |
| $25,000 to $34,999 | 44 | 7.4% |
| $35,000 to $49,999 | 28 | 4.7% |
| $50,000 to $74,999 | 71 | 12.0% |
| $75,000 to $99,999 | 106 | 17.9% |
| $100,000 to $149,999 | 137 | 23.1% |
| $150,000 to $199,999 | 46 | 7.8% |
| $200,000+ | 113 | 19.1% |
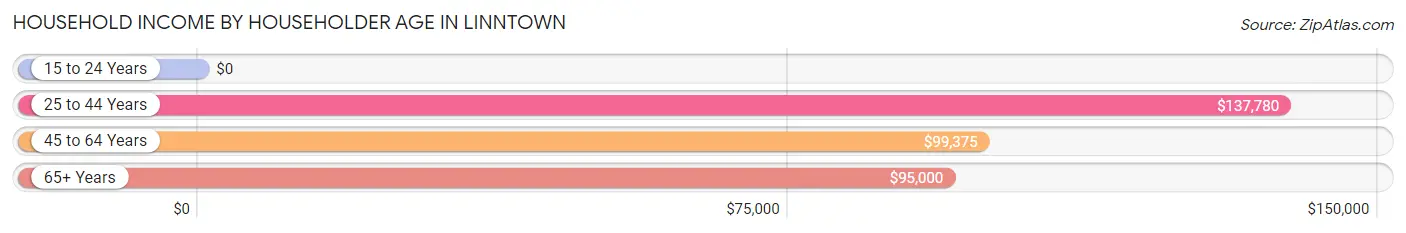
Household Income by Householder Age in Linntown
The median household income in Linntown is $101,250, with the highest median household income of $137,780 found in the 25 to 44 years age bracket for the primary householder. A total of 223 households (37.7%) fall into this category.
| Income Bracket | # Households | Median Income |
| 15 to 24 Years | 0 (0.0%) | $0 |
| 25 to 44 Years | 223 (37.7%) | $137,780 |
| 45 to 64 Years | 217 (36.7%) | $99,375 |
| 65+ Years | 152 (25.7%) | $95,000 |
| Total | 592 (100.0%) | $101,250 |
Poverty in Linntown
Income Below Poverty by Sex and Age in Linntown
With 9.3% poverty level for males and 6.0% for females among the residents of Linntown, 35 to 44 year old males and 25 to 34 year old females are the most vulnerable to poverty, with 56 males (29.5%) and 16 females (33.3%) in their respective age groups living below the poverty level.
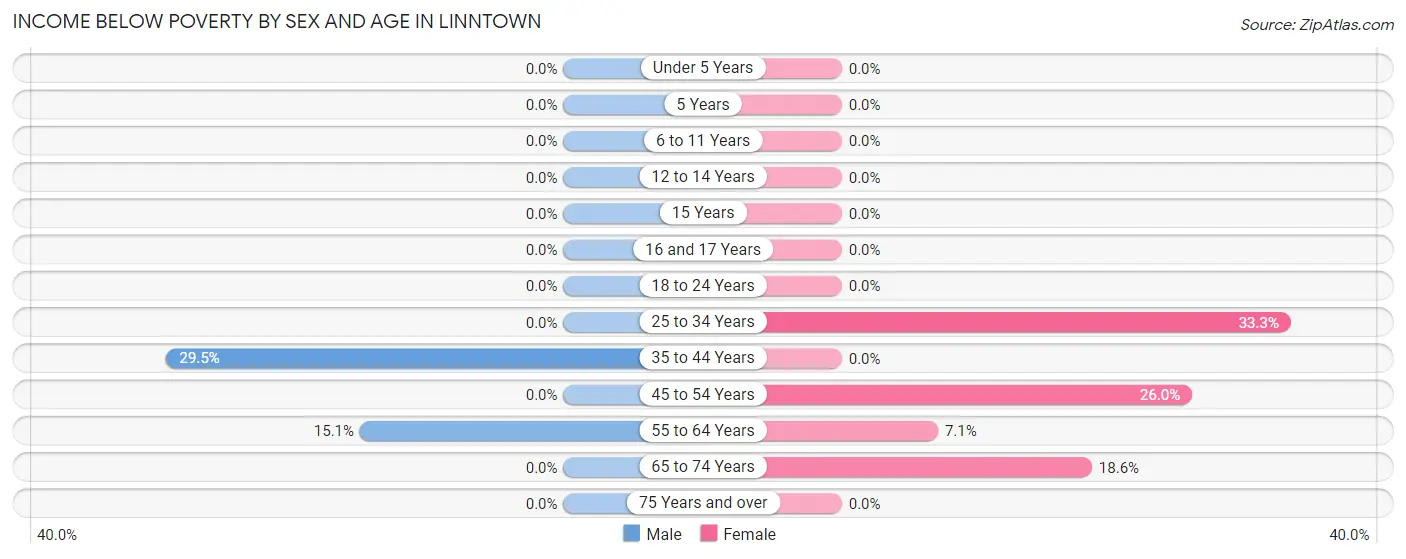
| Age Bracket | Male | Female |
| Under 5 Years | 0 (0.0%) | 0 (0.0%) |
| 5 Years | 0 (0.0%) | 0 (0.0%) |
| 6 to 11 Years | 0 (0.0%) | 0 (0.0%) |
| 12 to 14 Years | 0 (0.0%) | 0 (0.0%) |
| 15 Years | 0 (0.0%) | 0 (0.0%) |
| 16 and 17 Years | 0 (0.0%) | 0 (0.0%) |
| 18 to 24 Years | 0 (0.0%) | 0 (0.0%) |
| 25 to 34 Years | 0 (0.0%) | 16 (33.3%) |
| 35 to 44 Years | 56 (29.5%) | 0 (0.0%) |
| 45 to 54 Years | 0 (0.0%) | 13 (26.0%) |
| 55 to 64 Years | 21 (15.1%) | 10 (7.1%) |
| 65 to 74 Years | 0 (0.0%) | 13 (18.6%) |
| 75 Years and over | 0 (0.0%) | 0 (0.0%) |
| Total | 77 (9.3%) | 52 (6.0%) |
Income Above Poverty by Sex and Age in Linntown
According to the poverty statistics in Linntown, males aged under 5 years and females aged under 5 years are the age groups that are most secure financially, with 100.0% of males and 100.0% of females in these age groups living above the poverty line.
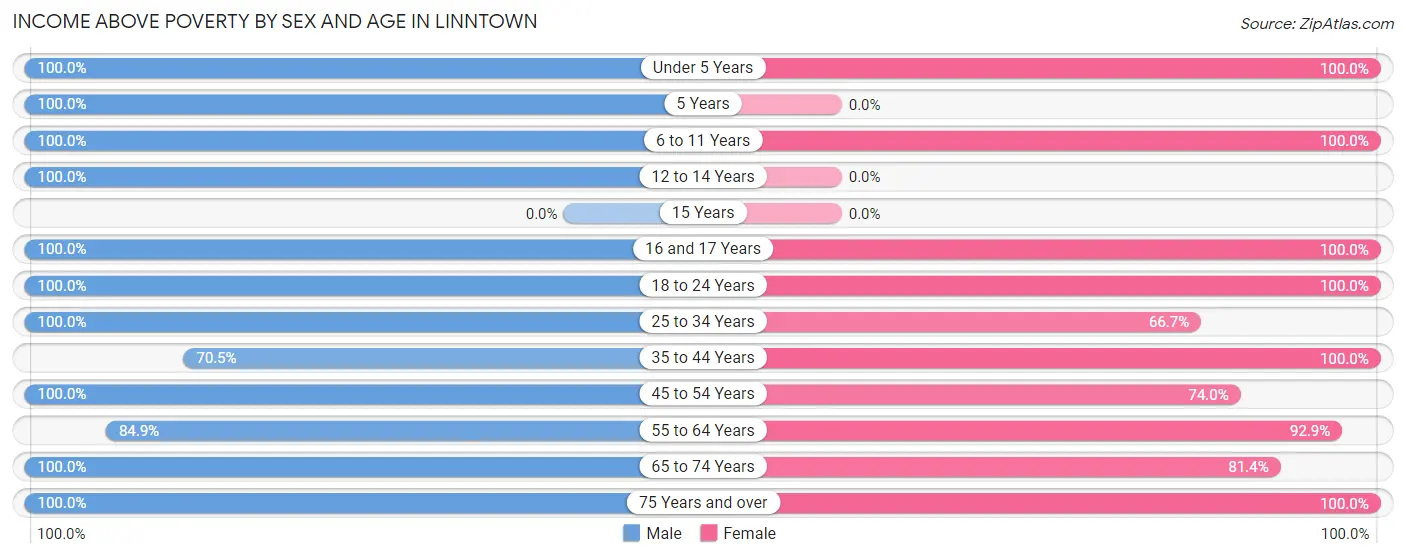
| Age Bracket | Male | Female |
| Under 5 Years | 45 (100.0%) | 96 (100.0%) |
| 5 Years | 19 (100.0%) | 0 (0.0%) |
| 6 to 11 Years | 32 (100.0%) | 138 (100.0%) |
| 12 to 14 Years | 62 (100.0%) | 0 (0.0%) |
| 15 Years | 0 (0.0%) | 0 (0.0%) |
| 16 and 17 Years | 32 (100.0%) | 36 (100.0%) |
| 18 to 24 Years | 16 (100.0%) | 37 (100.0%) |
| 25 to 34 Years | 74 (100.0%) | 32 (66.7%) |
| 35 to 44 Years | 134 (70.5%) | 217 (100.0%) |
| 45 to 54 Years | 39 (100.0%) | 37 (74.0%) |
| 55 to 64 Years | 118 (84.9%) | 130 (92.9%) |
| 65 to 74 Years | 152 (100.0%) | 57 (81.4%) |
| 75 Years and over | 28 (100.0%) | 27 (100.0%) |
| Total | 751 (90.7%) | 807 (94.0%) |
Income Below Poverty Among Married-Couple Families in Linntown
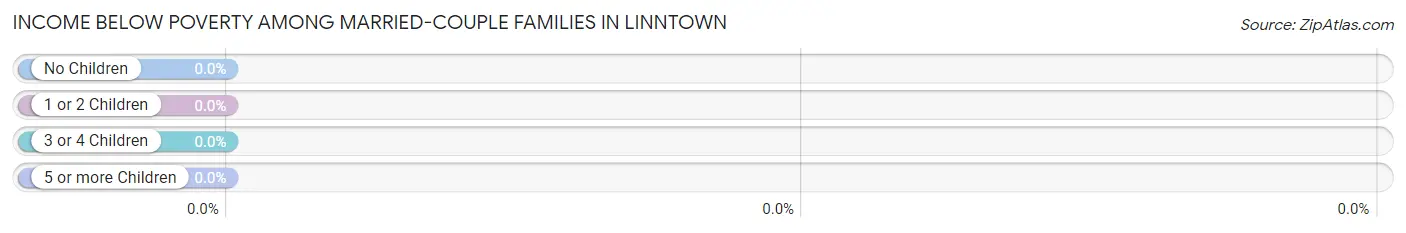
| Children | Above Poverty | Below Poverty |
| No Children | 215 (100.0%) | 0 (0.0%) |
| 1 or 2 Children | 136 (100.0%) | 0 (0.0%) |
| 3 or 4 Children | 67 (100.0%) | 0 (0.0%) |
| 5 or more Children | 0 (0.0%) | 0 (0.0%) |
| Total | 418 (100.0%) | 0 (0.0%) |
Income Below Poverty Among Single-Parent Households in Linntown
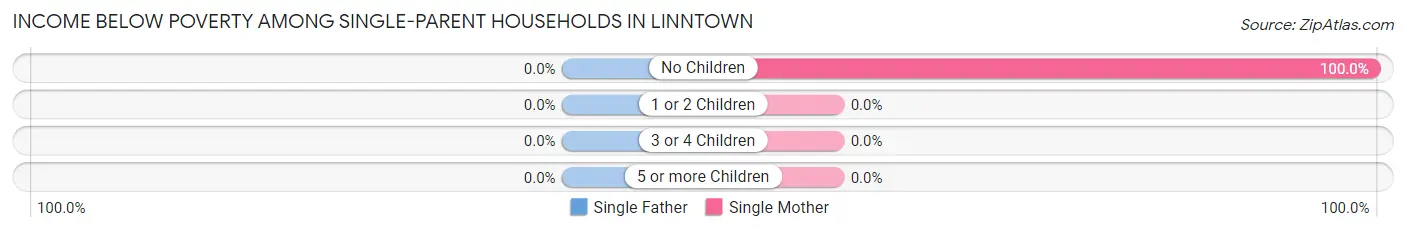
| Children | Single Father | Single Mother |
| No Children | 0 (0.0%) | 13 (100.0%) |
| 1 or 2 Children | 0 (0.0%) | 0 (0.0%) |
| 3 or 4 Children | 0 (0.0%) | 0 (0.0%) |
| 5 or more Children | 0 (0.0%) | 0 (0.0%) |
| Total | 0 (0.0%) | 13 (38.2%) |
Income Below Poverty Among Married-Couple vs Single-Parent Households in Linntown
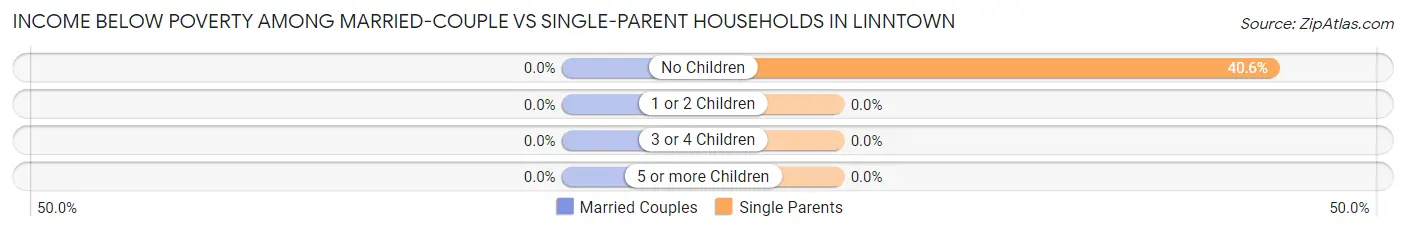
| Children | Married-Couple Families | Single-Parent Households |
| No Children | 0 (0.0%) | 13 (40.6%) |
| 1 or 2 Children | 0 (0.0%) | 0 (0.0%) |
| 3 or 4 Children | 0 (0.0%) | 0 (0.0%) |
| 5 or more Children | 0 (0.0%) | 0 (0.0%) |
| Total | 0 (0.0%) | 13 (24.5%) |
Employment Characteristics in Linntown
Employment by Class of Employer in Linntown
Among the 838 employed individuals in Linntown, private company employees (460 | 54.9%), not-for-profit organizations (278 | 33.2%), and self-employed (not incorporated) (32 | 3.8%) make up the most common classes of employment.
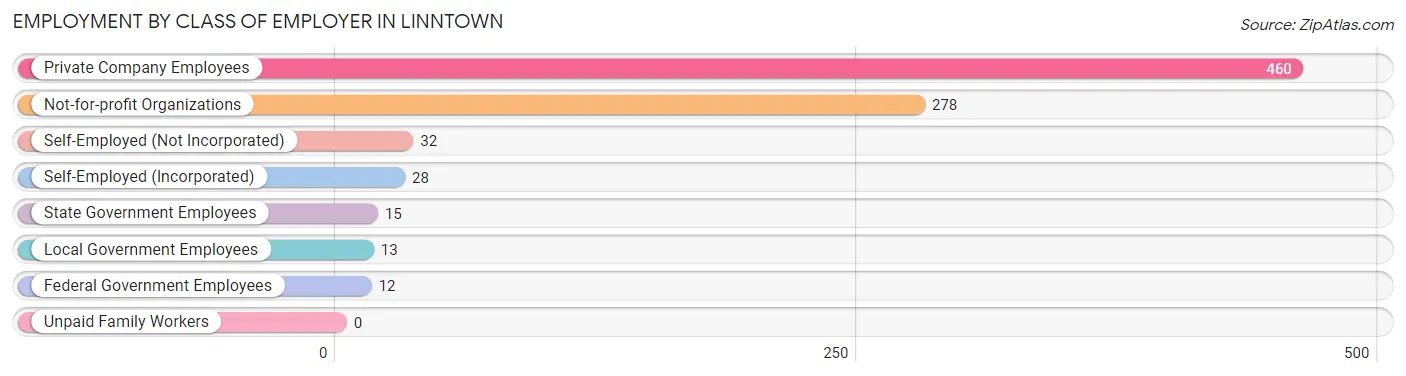
| Employer Class | # Employees | % Employees |
| Private Company Employees | 460 | 54.9% |
| Self-Employed (Incorporated) | 28 | 3.3% |
| Self-Employed (Not Incorporated) | 32 | 3.8% |
| Not-for-profit Organizations | 278 | 33.2% |
| Local Government Employees | 13 | 1.5% |
| State Government Employees | 15 | 1.8% |
| Federal Government Employees | 12 | 1.4% |
| Unpaid Family Workers | 0 | 0.0% |
| Total | 838 | 100.0% |
Employment Status by Age in Linntown
According to the labor force statistics for Linntown, out of the total population over 16 years of age (1,295), 72.4% or 938 individuals are in the labor force, with 9.4% or 88 of them unemployed. The age group with the highest labor force participation rate is 25 to 29 years, with 100.0% or 32 individuals in the labor force. Within the labor force, the 25 to 29 years age range has the highest percentage of unemployed individuals, with 50.0% or 16 of them being unemployed.
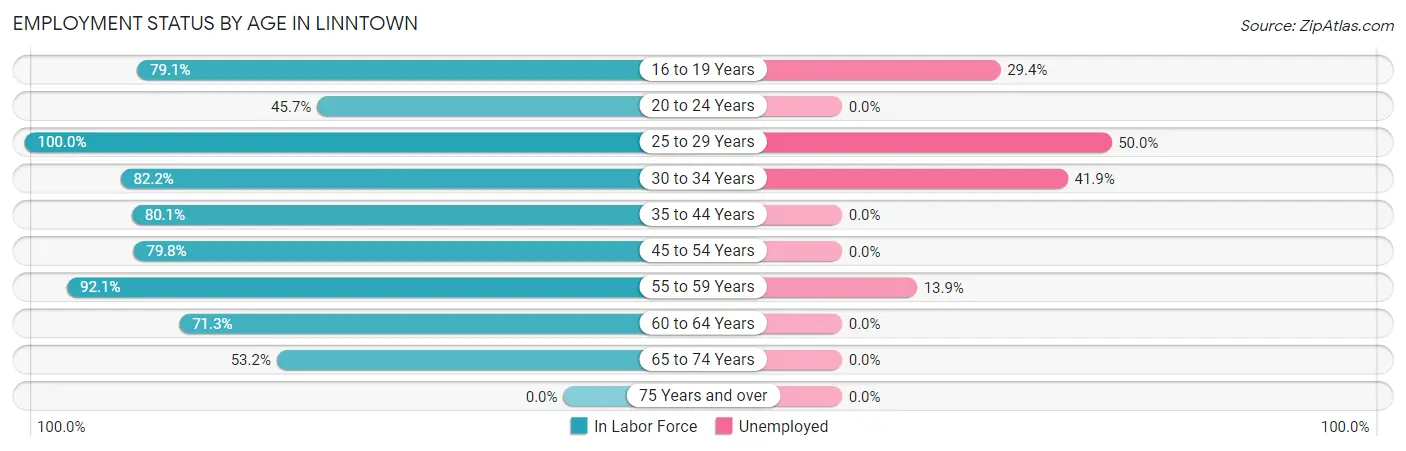
| Age Bracket | In Labor Force | Unemployed |
| 16 to 19 Years | 68 (79.1%) | 20 (29.4%) |
| 20 to 24 Years | 16 (45.7%) | 0 (0.0%) |
| 25 to 29 Years | 32 (100.0%) | 16 (50.0%) |
| 30 to 34 Years | 74 (82.2%) | 31 (41.9%) |
| 35 to 44 Years | 326 (80.1%) | 0 (0.0%) |
| 45 to 54 Years | 71 (79.8%) | 0 (0.0%) |
| 55 to 59 Years | 151 (92.1%) | 21 (13.9%) |
| 60 to 64 Years | 82 (71.3%) | 0 (0.0%) |
| 65 to 74 Years | 118 (53.2%) | 0 (0.0%) |
| 75 Years and over | 0 (0.0%) | 0 (0.0%) |
| Total | 938 (72.4%) | 88 (9.4%) |
Employment Status by Educational Attainment in Linntown
According to labor force statistics for Linntown, 82.1% of individuals (736) out of the total population between 25 and 64 years of age (897) are in the labor force, with 9.2% or 68 of them being unemployed. The group with the highest labor force participation rate are those with the educational attainment of college / associate degree, with 100.0% or 195 individuals in the labor force. Within the labor force, individuals with less than high school education have the highest percentage of unemployment, with 55.2% or 16 of them being unemployed.
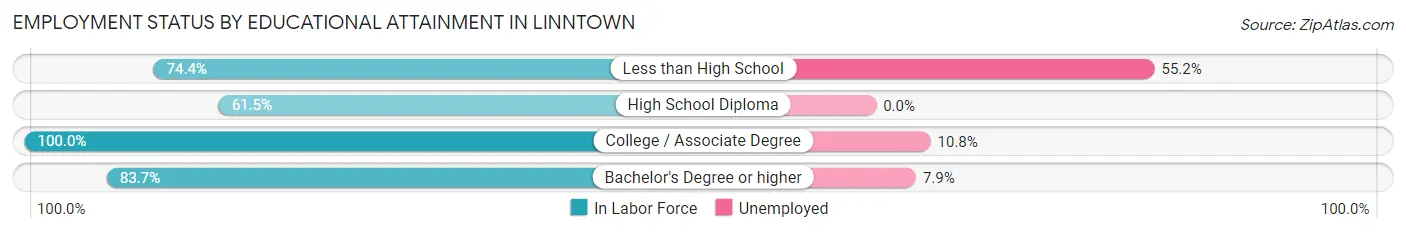
| Educational Attainment | In Labor Force | Unemployed |
| Less than High School | 29 (74.4%) | 22 (55.2%) |
| High School Diploma | 118 (61.5%) | 0 (0.0%) |
| College / Associate Degree | 195 (100.0%) | 21 (10.8%) |
| Bachelor's Degree or higher | 394 (83.7%) | 37 (7.9%) |
| Total | 736 (82.1%) | 83 (9.2%) |
Employment Occupations by Sex in Linntown
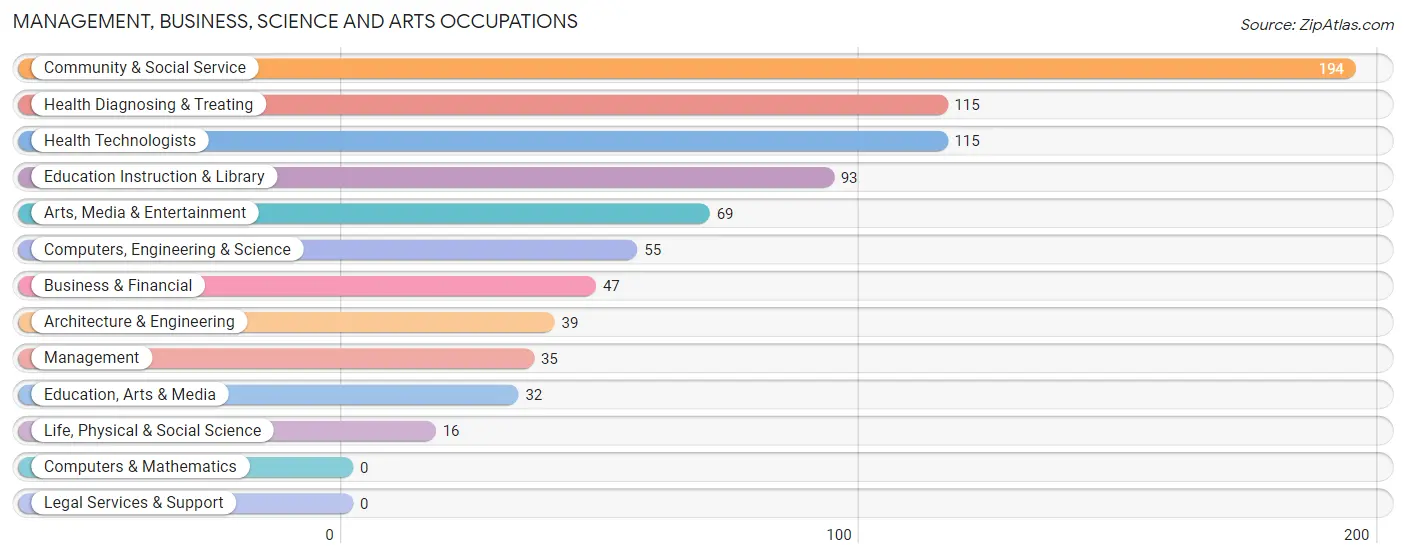
Management, Business, Science and Arts Occupations
The most common Management, Business, Science and Arts occupations in Linntown are Community & Social Service (194 | 22.8%), Health Diagnosing & Treating (115 | 13.5%), Health Technologists (115 | 13.5%), Education Instruction & Library (93 | 10.9%), and Arts, Media & Entertainment (69 | 8.1%).
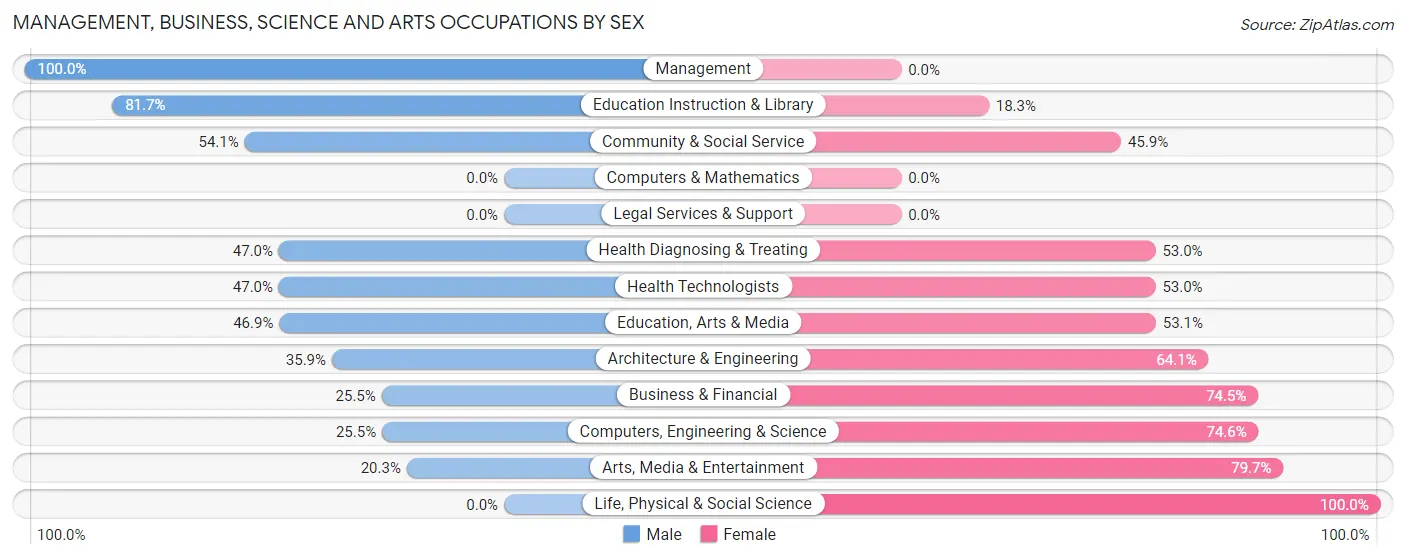
Management, Business, Science and Arts Occupations by Sex
Within the Management, Business, Science and Arts occupations in Linntown, the most male-oriented occupations are Management (100.0%), Education Instruction & Library (81.7%), and Community & Social Service (54.1%), while the most female-oriented occupations are Life, Physical & Social Science (100.0%), Arts, Media & Entertainment (79.7%), and Computers, Engineering & Science (74.6%).
| Occupation | Male | Female |
| Management | 35 (100.0%) | 0 (0.0%) |
| Business & Financial | 12 (25.5%) | 35 (74.5%) |
| Computers, Engineering & Science | 14 (25.5%) | 41 (74.6%) |
| Computers & Mathematics | 0 (0.0%) | 0 (0.0%) |
| Architecture & Engineering | 14 (35.9%) | 25 (64.1%) |
| Life, Physical & Social Science | 0 (0.0%) | 16 (100.0%) |
| Community & Social Service | 105 (54.1%) | 89 (45.9%) |
| Education, Arts & Media | 15 (46.9%) | 17 (53.1%) |
| Legal Services & Support | 0 (0.0%) | 0 (0.0%) |
| Education Instruction & Library | 76 (81.7%) | 17 (18.3%) |
| Arts, Media & Entertainment | 14 (20.3%) | 55 (79.7%) |
| Health Diagnosing & Treating | 54 (47.0%) | 61 (53.0%) |
| Health Technologists | 54 (47.0%) | 61 (53.0%) |
| Total (Category) | 220 (49.3%) | 226 (50.7%) |
| Total (Overall) | 443 (52.1%) | 407 (47.9%) |
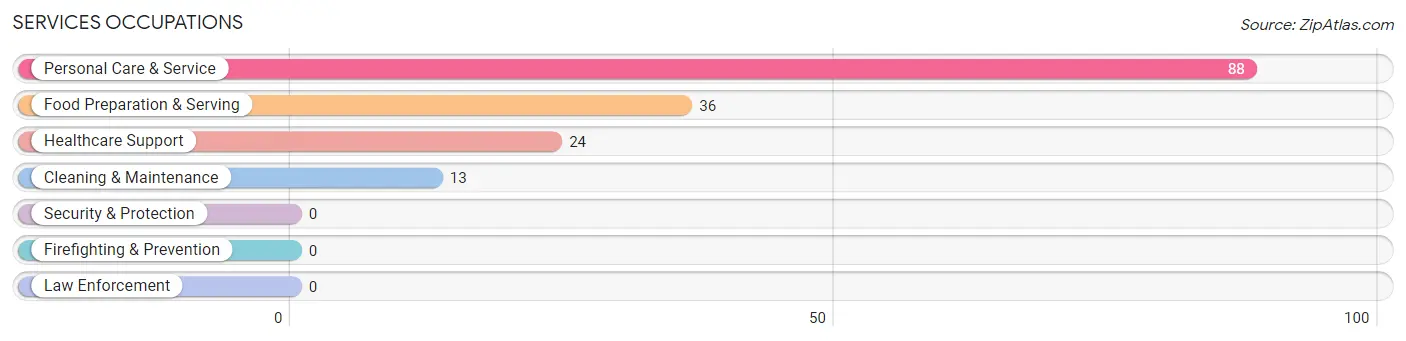
Services Occupations
The most common Services occupations in Linntown are Personal Care & Service (88 | 10.3%), Food Preparation & Serving (36 | 4.2%), Healthcare Support (24 | 2.8%), and Cleaning & Maintenance (13 | 1.5%).
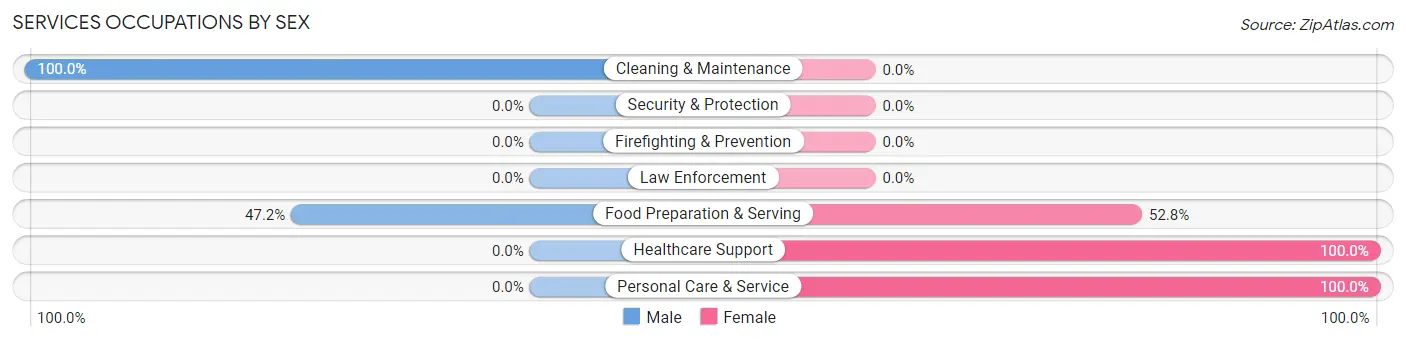
Services Occupations by Sex
Within the Services occupations in Linntown, the most male-oriented occupations are Cleaning & Maintenance (100.0%), and Food Preparation & Serving (47.2%), while the most female-oriented occupations are Healthcare Support (100.0%), Personal Care & Service (100.0%), and Food Preparation & Serving (52.8%).
| Occupation | Male | Female |
| Healthcare Support | 0 (0.0%) | 24 (100.0%) |
| Security & Protection | 0 (0.0%) | 0 (0.0%) |
| Firefighting & Prevention | 0 (0.0%) | 0 (0.0%) |
| Law Enforcement | 0 (0.0%) | 0 (0.0%) |
| Food Preparation & Serving | 17 (47.2%) | 19 (52.8%) |
| Cleaning & Maintenance | 13 (100.0%) | 0 (0.0%) |
| Personal Care & Service | 0 (0.0%) | 88 (100.0%) |
| Total (Category) | 30 (18.6%) | 131 (81.4%) |
| Total (Overall) | 443 (52.1%) | 407 (47.9%) |
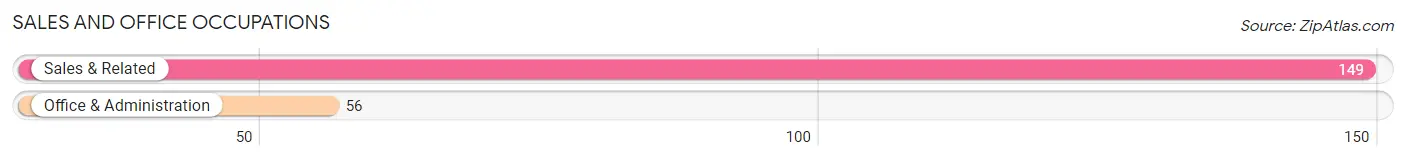
Sales and Office Occupations
The most common Sales and Office occupations in Linntown are Sales & Related (149 | 17.5%), and Office & Administration (56 | 6.6%).
Sales and Office Occupations by Sex
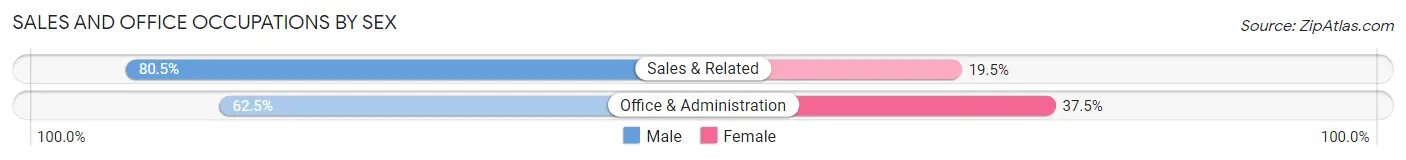
| Occupation | Male | Female |
| Sales & Related | 120 (80.5%) | 29 (19.5%) |
| Office & Administration | 35 (62.5%) | 21 (37.5%) |
| Total (Category) | 155 (75.6%) | 50 (24.4%) |
| Total (Overall) | 443 (52.1%) | 407 (47.9%) |
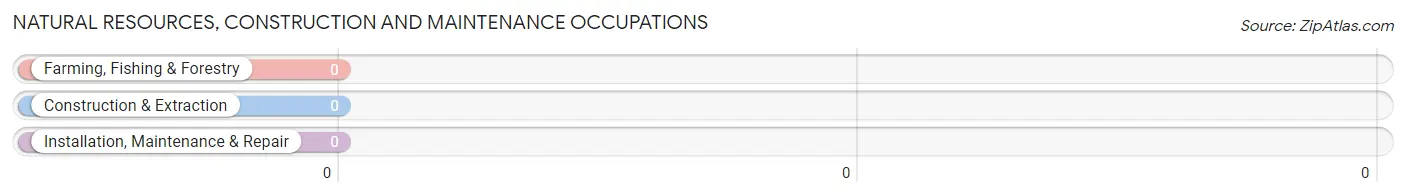
Natural Resources, Construction and Maintenance Occupations
Natural Resources, Construction and Maintenance Occupations by Sex
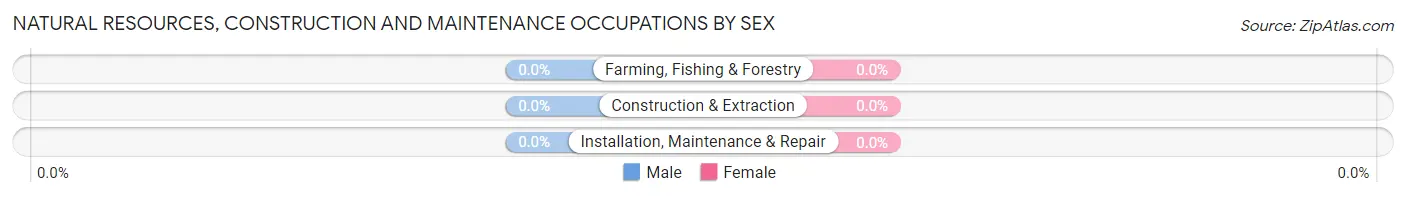
| Occupation | Male | Female |
| Farming, Fishing & Forestry | 0 (0.0%) | 0 (0.0%) |
| Construction & Extraction | 0 (0.0%) | 0 (0.0%) |
| Installation, Maintenance & Repair | 0 (0.0%) | 0 (0.0%) |
| Total (Category) | 0 (0.0%) | 0 (0.0%) |
| Total (Overall) | 443 (52.1%) | 407 (47.9%) |
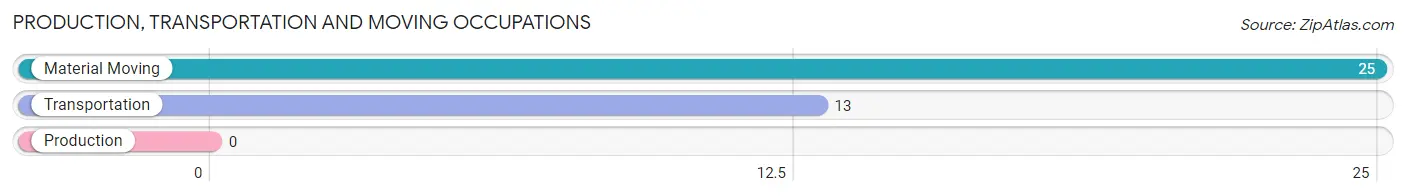
Production, Transportation and Moving Occupations
The most common Production, Transportation and Moving occupations in Linntown are Material Moving (25 | 2.9%), and Transportation (13 | 1.5%).
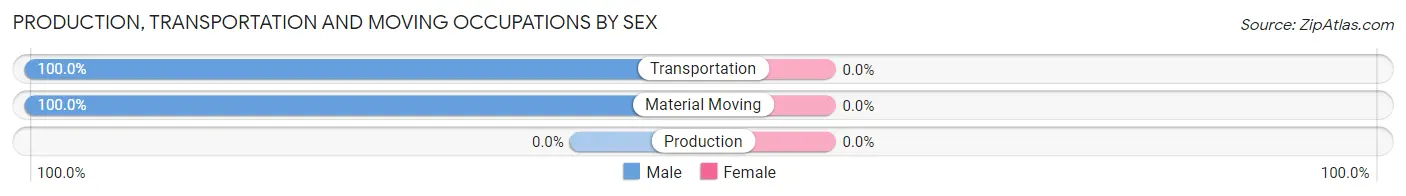
Production, Transportation and Moving Occupations by Sex
| Occupation | Male | Female |
| Production | 0 (0.0%) | 0 (0.0%) |
| Transportation | 13 (100.0%) | 0 (0.0%) |
| Material Moving | 25 (100.0%) | 0 (0.0%) |
| Total (Category) | 38 (100.0%) | 0 (0.0%) |
| Total (Overall) | 443 (52.1%) | 407 (47.9%) |
Employment Industries by Sex in Linntown
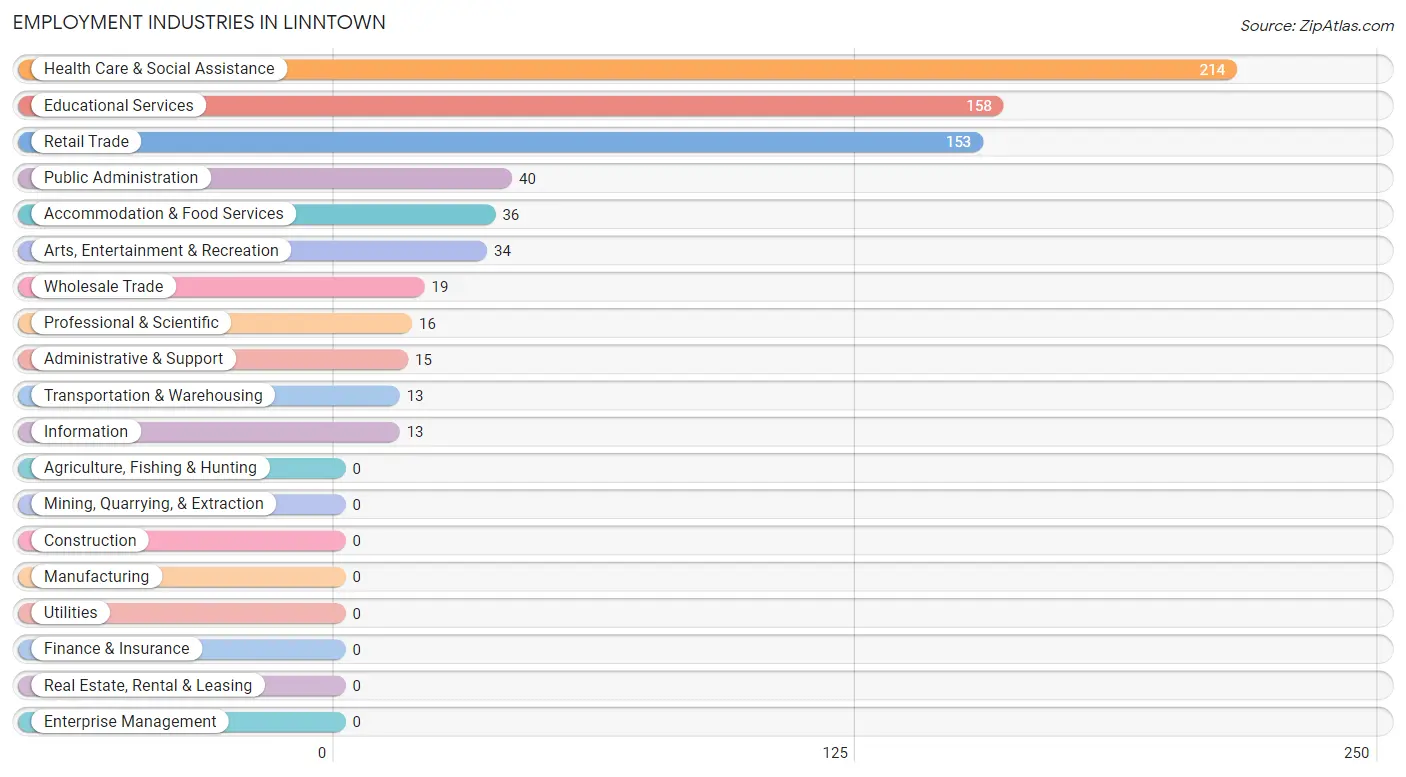
Employment Industries in Linntown
The major employment industries in Linntown include Health Care & Social Assistance (214 | 25.2%), Educational Services (158 | 18.6%), Retail Trade (153 | 18.0%), Public Administration (40 | 4.7%), and Accommodation & Food Services (36 | 4.2%).
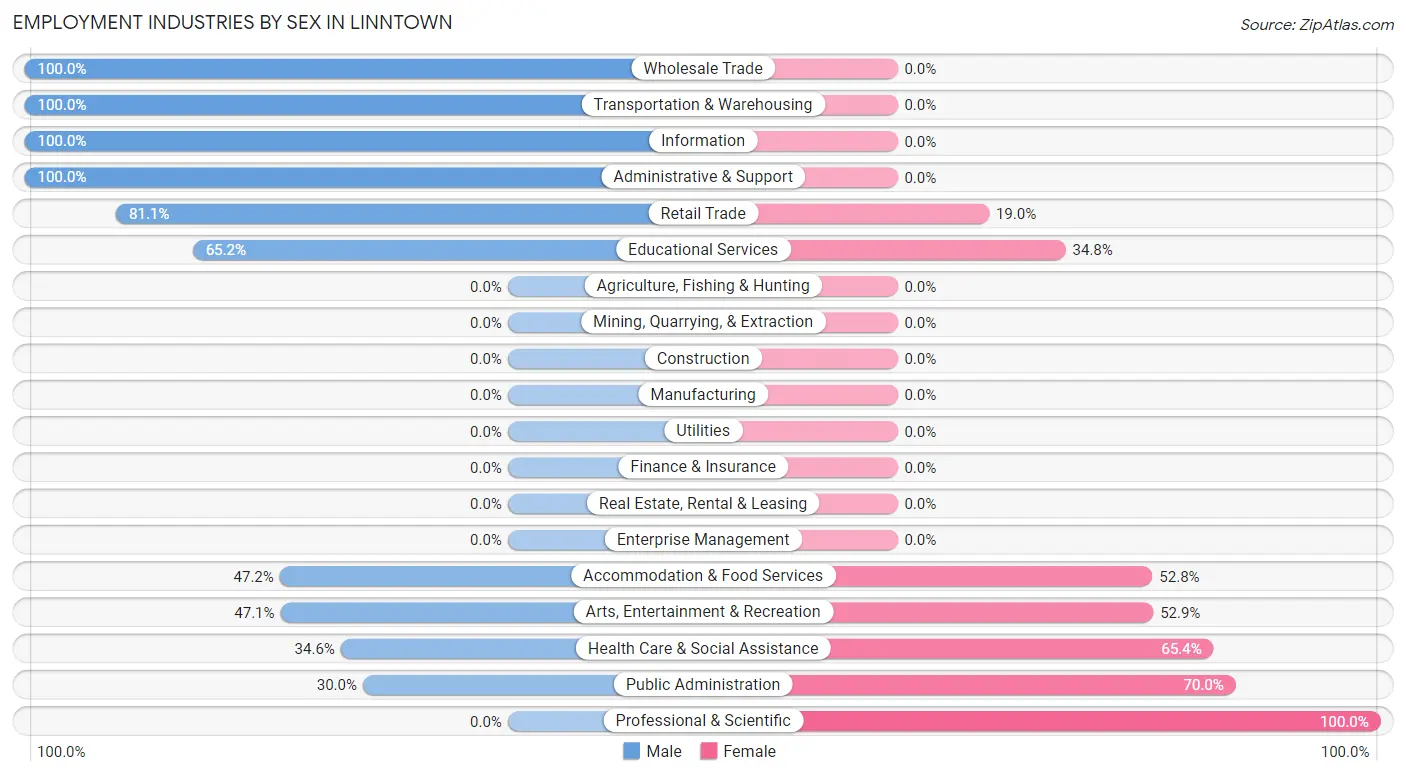
Employment Industries by Sex in Linntown
The Linntown industries that see more men than women are Wholesale Trade (100.0%), Transportation & Warehousing (100.0%), and Information (100.0%), whereas the industries that tend to have a higher number of women are Professional & Scientific (100.0%), Public Administration (70.0%), and Health Care & Social Assistance (65.4%).
| Industry | Male | Female |
| Agriculture, Fishing & Hunting | 0 (0.0%) | 0 (0.0%) |
| Mining, Quarrying, & Extraction | 0 (0.0%) | 0 (0.0%) |
| Construction | 0 (0.0%) | 0 (0.0%) |
| Manufacturing | 0 (0.0%) | 0 (0.0%) |
| Wholesale Trade | 19 (100.0%) | 0 (0.0%) |
| Retail Trade | 124 (81.0%) | 29 (19.0%) |
| Transportation & Warehousing | 13 (100.0%) | 0 (0.0%) |
| Utilities | 0 (0.0%) | 0 (0.0%) |
| Information | 13 (100.0%) | 0 (0.0%) |
| Finance & Insurance | 0 (0.0%) | 0 (0.0%) |
| Real Estate, Rental & Leasing | 0 (0.0%) | 0 (0.0%) |
| Professional & Scientific | 0 (0.0%) | 16 (100.0%) |
| Enterprise Management | 0 (0.0%) | 0 (0.0%) |
| Administrative & Support | 15 (100.0%) | 0 (0.0%) |
| Educational Services | 103 (65.2%) | 55 (34.8%) |
| Health Care & Social Assistance | 74 (34.6%) | 140 (65.4%) |
| Arts, Entertainment & Recreation | 16 (47.1%) | 18 (52.9%) |
| Accommodation & Food Services | 17 (47.2%) | 19 (52.8%) |
| Public Administration | 12 (30.0%) | 28 (70.0%) |
| Total | 443 (52.1%) | 407 (47.9%) |
Education in Linntown
School Enrollment in Linntown
The most common levels of schooling among the 407 students in Linntown are middle school (110 | 27.0%), elementary school (107 | 26.3%), and high school (83 | 20.4%).
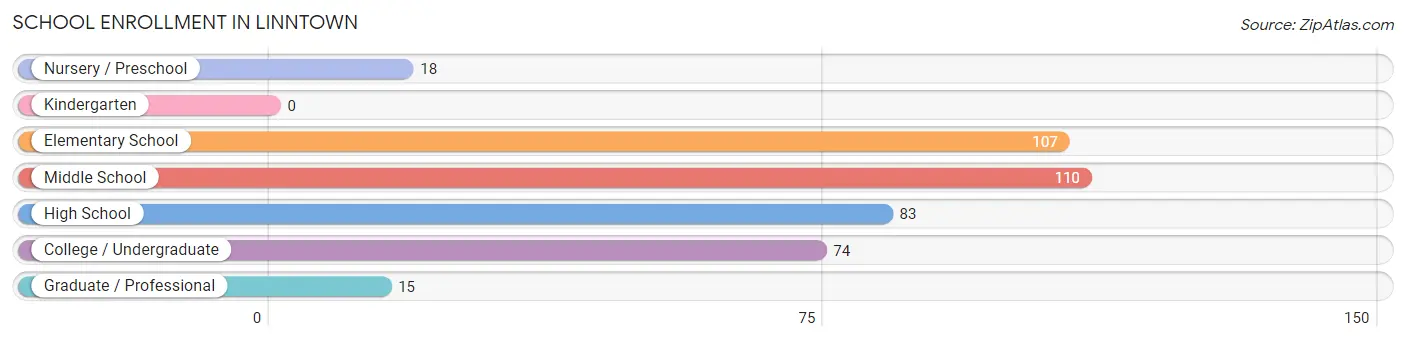
| School Level | # Students | % Students |
| Nursery / Preschool | 18 | 4.4% |
| Kindergarten | 0 | 0.0% |
| Elementary School | 107 | 26.3% |
| Middle School | 110 | 27.0% |
| High School | 83 | 20.4% |
| College / Undergraduate | 74 | 18.2% |
| Graduate / Professional | 15 | 3.7% |
| Total | 407 | 100.0% |
School Enrollment by Age by Funding Source in Linntown
Out of a total of 407 students who are enrolled in schools in Linntown, 70 (17.2%) attend a private institution, while the remaining 337 (82.8%) are enrolled in public schools. The age group of 3 to 4 year olds has the highest likelihood of being enrolled in private schools, with 18 (100.0% in the age bracket) enrolled. Conversely, the age group of 5 to 9 year old has the lowest likelihood of being enrolled in a private school, with 34 (100.0% in the age bracket) attending a public institution.
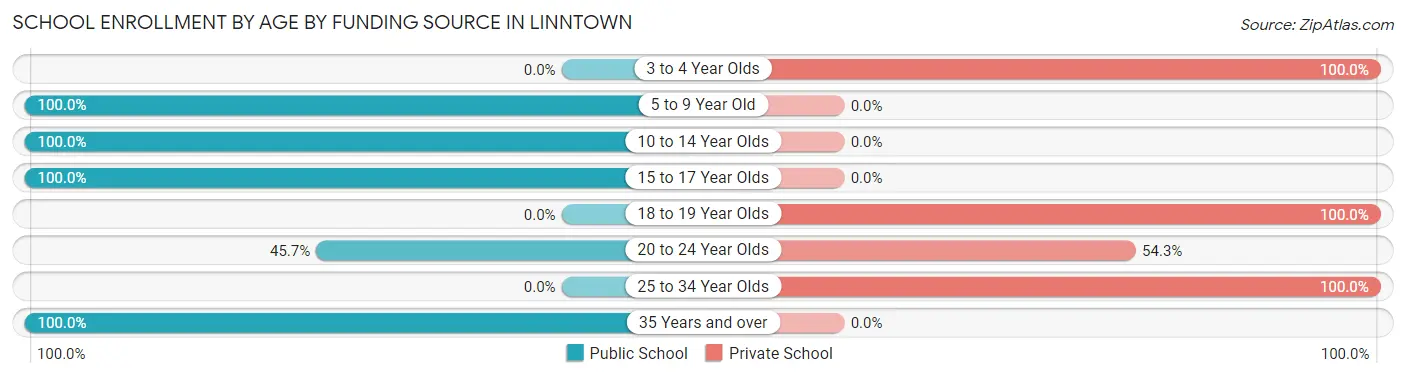
| Age Bracket | Public School | Private School |
| 3 to 4 Year Olds | 0 (0.0%) | 18 (100.0%) |
| 5 to 9 Year Old | 34 (100.0%) | 0 (0.0%) |
| 10 to 14 Year Olds | 198 (100.0%) | 0 (0.0%) |
| 15 to 17 Year Olds | 68 (100.0%) | 0 (0.0%) |
| 18 to 19 Year Olds | 0 (0.0%) | 18 (100.0%) |
| 20 to 24 Year Olds | 16 (45.7%) | 19 (54.3%) |
| 25 to 34 Year Olds | 0 (0.0%) | 15 (100.0%) |
| 35 Years and over | 21 (100.0%) | 0 (0.0%) |
| Total | 337 (82.8%) | 70 (17.2%) |
Educational Attainment by Field of Study in Linntown
Physical & health sciences (109 | 15.3%), social sciences (94 | 13.2%), business (92 | 12.9%), science & technology (80 | 11.2%), and visual & performing arts (80 | 11.2%) are the most common fields of study among 713 individuals in Linntown who have obtained a bachelor's degree or higher.
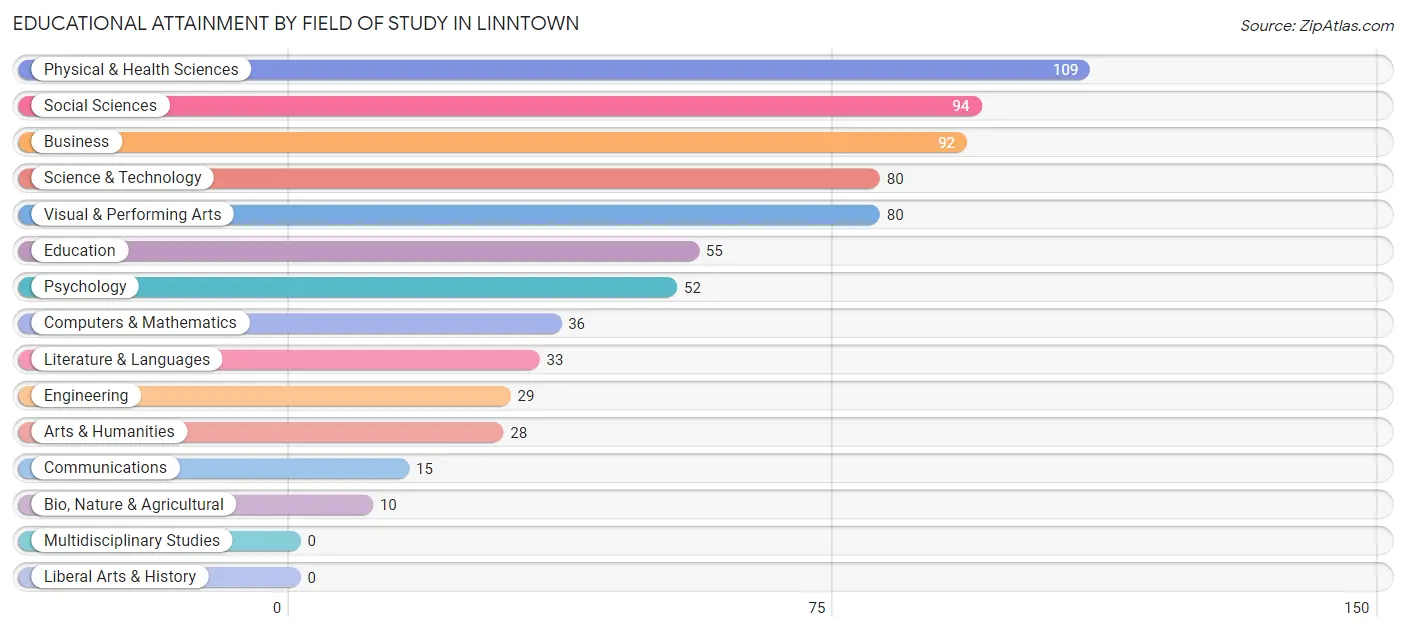
| Field of Study | # Graduates | % Graduates |
| Computers & Mathematics | 36 | 5.1% |
| Bio, Nature & Agricultural | 10 | 1.4% |
| Physical & Health Sciences | 109 | 15.3% |
| Psychology | 52 | 7.3% |
| Social Sciences | 94 | 13.2% |
| Engineering | 29 | 4.1% |
| Multidisciplinary Studies | 0 | 0.0% |
| Science & Technology | 80 | 11.2% |
| Business | 92 | 12.9% |
| Education | 55 | 7.7% |
| Literature & Languages | 33 | 4.6% |
| Liberal Arts & History | 0 | 0.0% |
| Visual & Performing Arts | 80 | 11.2% |
| Communications | 15 | 2.1% |
| Arts & Humanities | 28 | 3.9% |
| Total | 713 | 100.0% |
Transportation & Commute in Linntown
Vehicle Availability by Sex in Linntown
The most prevalent vehicle ownership categories in Linntown are males with 2 vehicles (239, accounting for 55.4%) and females with 2 vehicles (212, making up 58.7%).
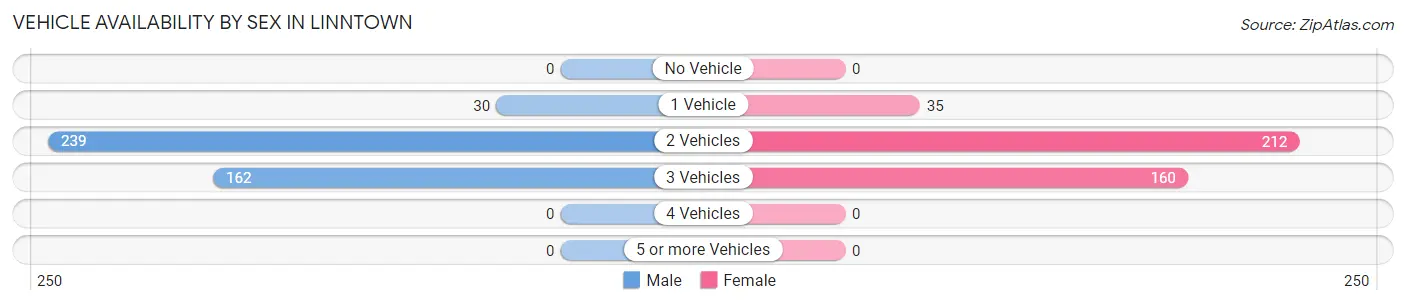
| Vehicles Available | Male | Female |
| No Vehicle | 0 (0.0%) | 0 (0.0%) |
| 1 Vehicle | 30 (7.0%) | 35 (8.6%) |
| 2 Vehicles | 239 (55.4%) | 212 (52.1%) |
| 3 Vehicles | 162 (37.6%) | 160 (39.3%) |
| 4 Vehicles | 0 (0.0%) | 0 (0.0%) |
| 5 or more Vehicles | 0 (0.0%) | 0 (0.0%) |
| Total | 431 (100.0%) | 407 (100.0%) |
Commute Time in Linntown
The most frequently occuring commute durations in Linntown are 5 to 9 minutes (262 commuters, 34.8%), 20 to 24 minutes (121 commuters, 16.1%), and 15 to 19 minutes (111 commuters, 14.7%).
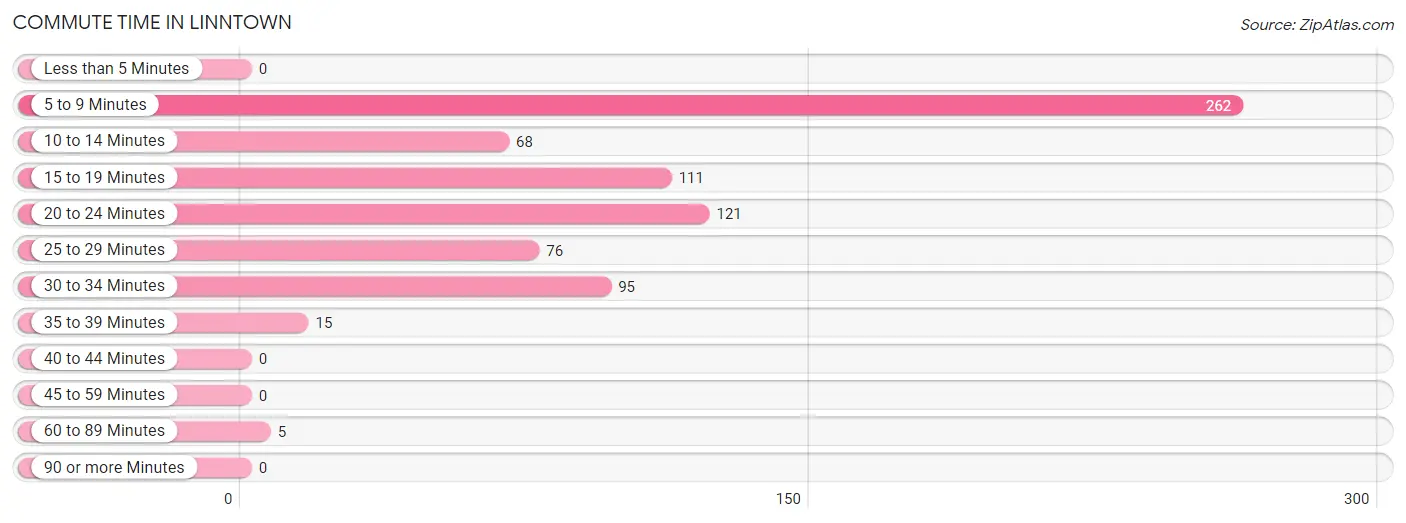
| Commute Time | # Commuters | % Commuters |
| Less than 5 Minutes | 0 | 0.0% |
| 5 to 9 Minutes | 262 | 34.8% |
| 10 to 14 Minutes | 68 | 9.0% |
| 15 to 19 Minutes | 111 | 14.7% |
| 20 to 24 Minutes | 121 | 16.1% |
| 25 to 29 Minutes | 76 | 10.1% |
| 30 to 34 Minutes | 95 | 12.6% |
| 35 to 39 Minutes | 15 | 2.0% |
| 40 to 44 Minutes | 0 | 0.0% |
| 45 to 59 Minutes | 0 | 0.0% |
| 60 to 89 Minutes | 5 | 0.7% |
| 90 or more Minutes | 0 | 0.0% |
Commute Time by Sex in Linntown
The most common commute times in Linntown are 5 to 9 minutes (135 commuters, 33.9%) for males and 5 to 9 minutes (127 commuters, 35.8%) for females.
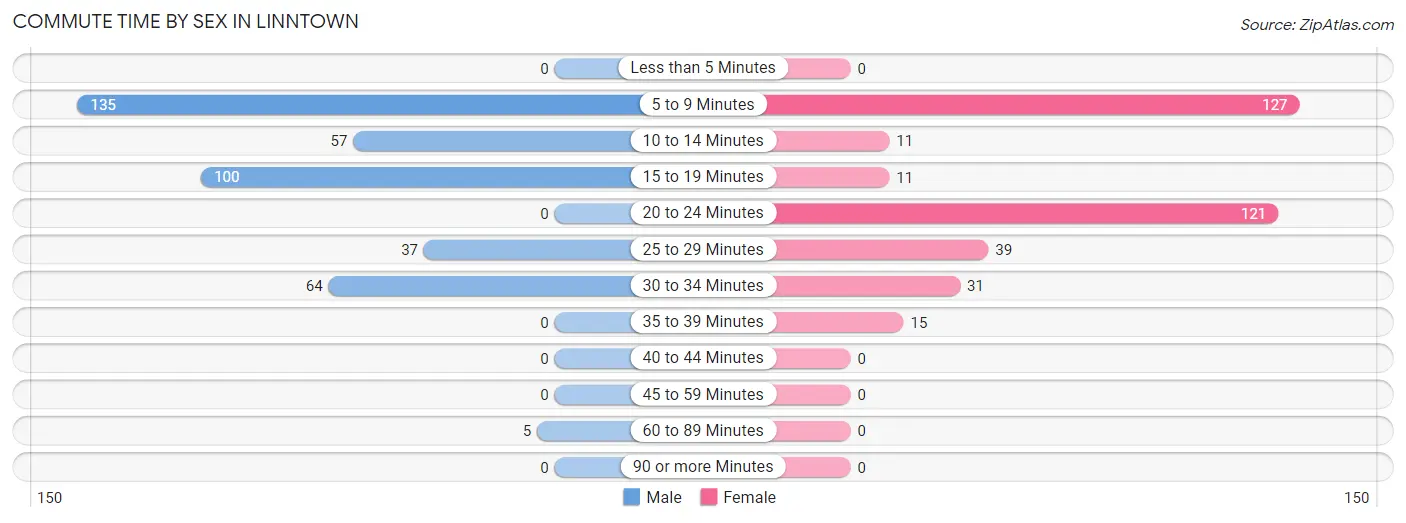
| Commute Time | Male | Female |
| Less than 5 Minutes | 0 (0.0%) | 0 (0.0%) |
| 5 to 9 Minutes | 135 (33.9%) | 127 (35.8%) |
| 10 to 14 Minutes | 57 (14.3%) | 11 (3.1%) |
| 15 to 19 Minutes | 100 (25.1%) | 11 (3.1%) |
| 20 to 24 Minutes | 0 (0.0%) | 121 (34.1%) |
| 25 to 29 Minutes | 37 (9.3%) | 39 (11.0%) |
| 30 to 34 Minutes | 64 (16.1%) | 31 (8.7%) |
| 35 to 39 Minutes | 0 (0.0%) | 15 (4.2%) |
| 40 to 44 Minutes | 0 (0.0%) | 0 (0.0%) |
| 45 to 59 Minutes | 0 (0.0%) | 0 (0.0%) |
| 60 to 89 Minutes | 5 (1.3%) | 0 (0.0%) |
| 90 or more Minutes | 0 (0.0%) | 0 (0.0%) |
Time of Departure to Work by Sex in Linntown
The most frequent times of departure to work in Linntown are 7:30 AM to 7:59 AM (106, 26.6%) for males and 8:00 AM to 8:29 AM (200, 56.3%) for females.
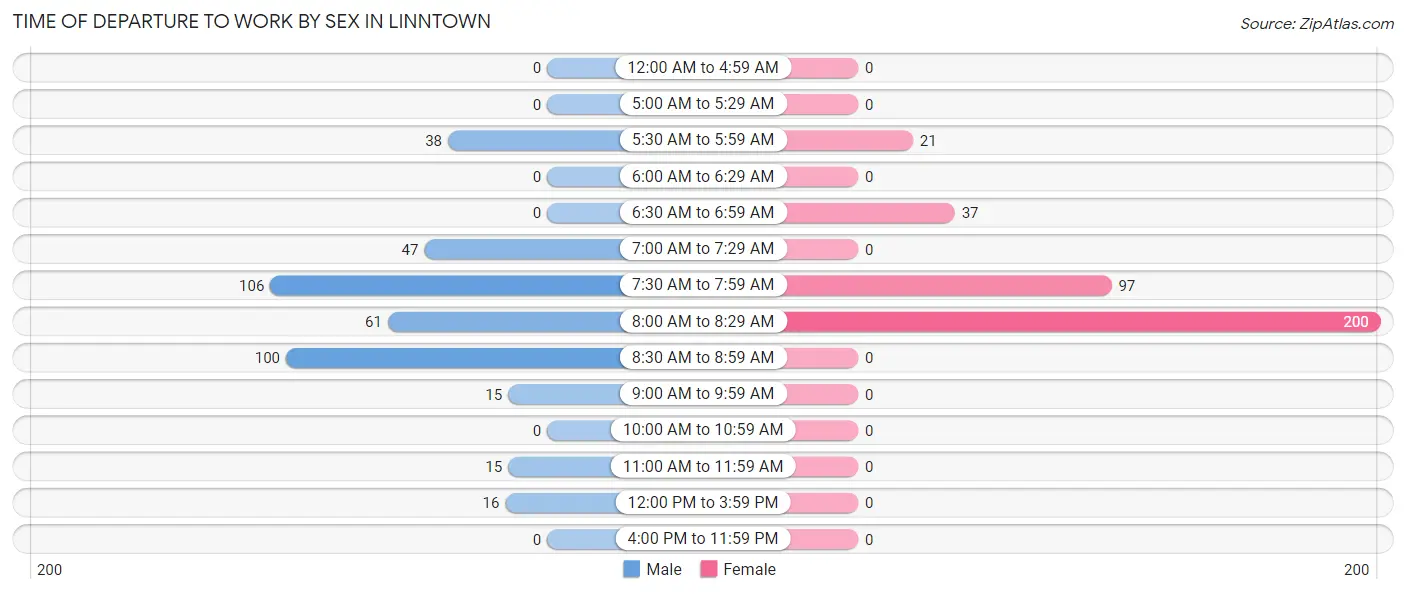
| Time of Departure | Male | Female |
| 12:00 AM to 4:59 AM | 0 (0.0%) | 0 (0.0%) |
| 5:00 AM to 5:29 AM | 0 (0.0%) | 0 (0.0%) |
| 5:30 AM to 5:59 AM | 38 (9.6%) | 21 (5.9%) |
| 6:00 AM to 6:29 AM | 0 (0.0%) | 0 (0.0%) |
| 6:30 AM to 6:59 AM | 0 (0.0%) | 37 (10.4%) |
| 7:00 AM to 7:29 AM | 47 (11.8%) | 0 (0.0%) |
| 7:30 AM to 7:59 AM | 106 (26.6%) | 97 (27.3%) |
| 8:00 AM to 8:29 AM | 61 (15.3%) | 200 (56.3%) |
| 8:30 AM to 8:59 AM | 100 (25.1%) | 0 (0.0%) |
| 9:00 AM to 9:59 AM | 15 (3.8%) | 0 (0.0%) |
| 10:00 AM to 10:59 AM | 0 (0.0%) | 0 (0.0%) |
| 11:00 AM to 11:59 AM | 15 (3.8%) | 0 (0.0%) |
| 12:00 PM to 3:59 PM | 16 (4.0%) | 0 (0.0%) |
| 4:00 PM to 11:59 PM | 0 (0.0%) | 0 (0.0%) |
| Total | 398 (100.0%) | 355 (100.0%) |
Housing Occupancy in Linntown
Occupancy by Ownership in Linntown
Of the total 592 dwellings in Linntown, owner-occupied units account for 423 (71.5%), while renter-occupied units make up 169 (28.5%).
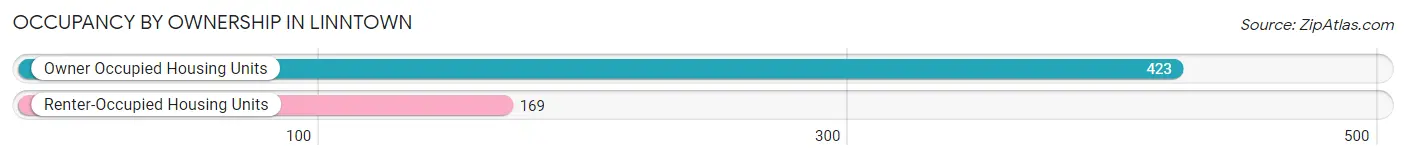
| Occupancy | # Housing Units | % Housing Units |
| Owner Occupied Housing Units | 423 | 71.5% |
| Renter-Occupied Housing Units | 169 | 28.5% |
| Total Occupied Housing Units | 592 | 100.0% |
Occupancy by Household Size in Linntown
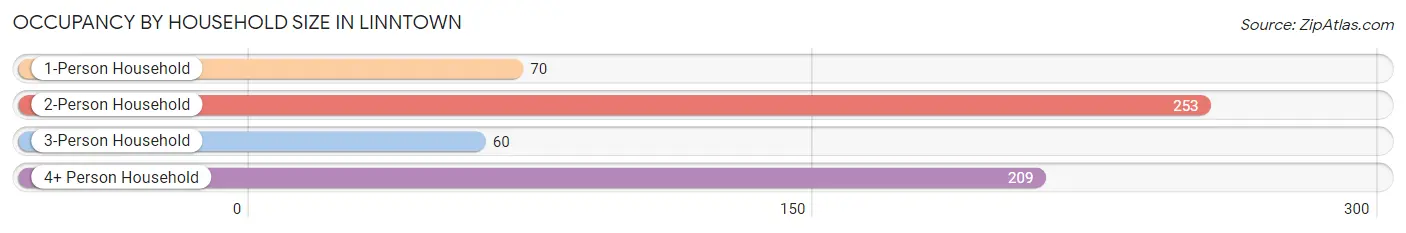
| Household Size | # Housing Units | % Housing Units |
| 1-Person Household | 70 | 11.8% |
| 2-Person Household | 253 | 42.7% |
| 3-Person Household | 60 | 10.1% |
| 4+ Person Household | 209 | 35.3% |
| Total Housing Units | 592 | 100.0% |
Occupancy by Ownership by Household Size in Linntown
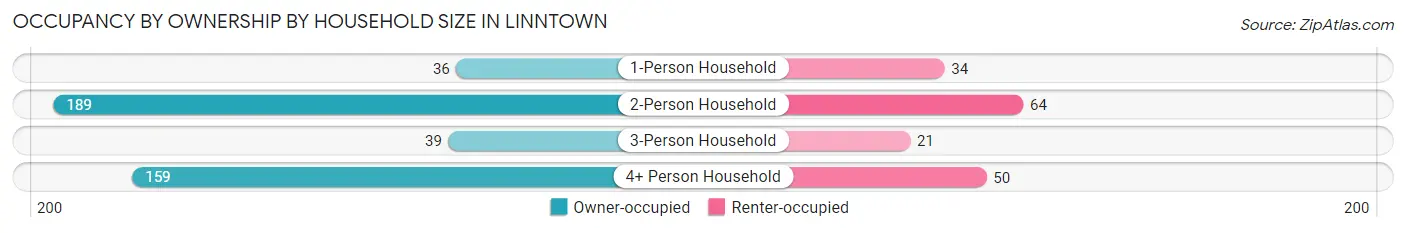
| Household Size | Owner-occupied | Renter-occupied |
| 1-Person Household | 36 (51.4%) | 34 (48.6%) |
| 2-Person Household | 189 (74.7%) | 64 (25.3%) |
| 3-Person Household | 39 (65.0%) | 21 (35.0%) |
| 4+ Person Household | 159 (76.1%) | 50 (23.9%) |
| Total Housing Units | 423 (71.5%) | 169 (28.5%) |
Occupancy by Educational Attainment in Linntown
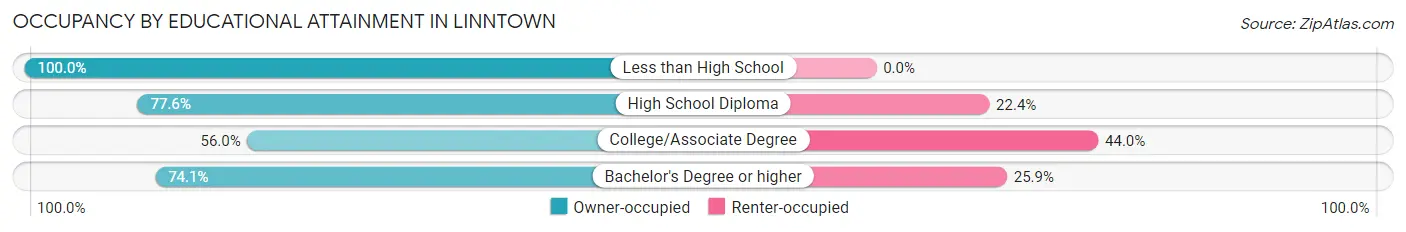
| Household Size | Owner-occupied | Renter-occupied |
| Less than High School | 10 (100.0%) | 0 (0.0%) |
| High School Diploma | 97 (77.6%) | 28 (22.4%) |
| College/Associate Degree | 70 (56.0%) | 55 (44.0%) |
| Bachelor's Degree or higher | 246 (74.1%) | 86 (25.9%) |
Occupancy by Age of Householder in Linntown
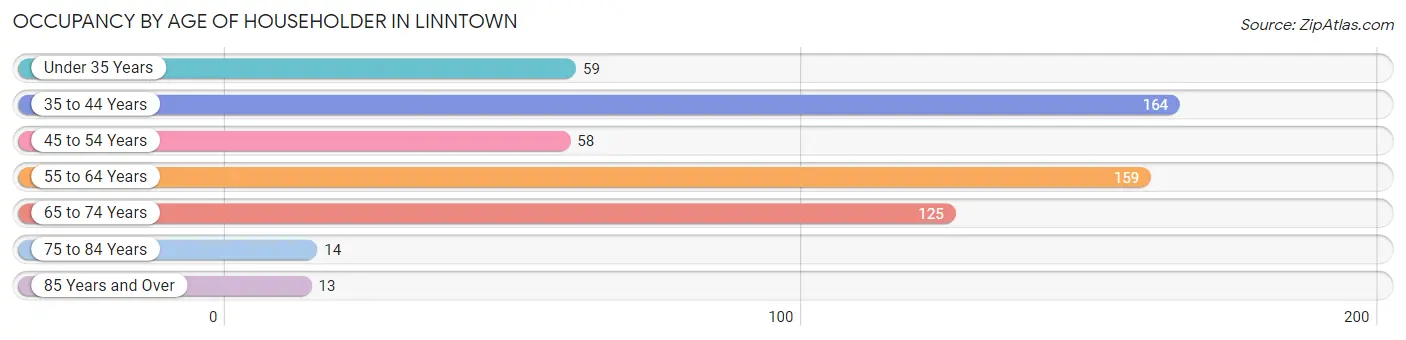
| Age Bracket | # Households | % Households |
| Under 35 Years | 59 | 10.0% |
| 35 to 44 Years | 164 | 27.7% |
| 45 to 54 Years | 58 | 9.8% |
| 55 to 64 Years | 159 | 26.9% |
| 65 to 74 Years | 125 | 21.1% |
| 75 to 84 Years | 14 | 2.4% |
| 85 Years and Over | 13 | 2.2% |
| Total | 592 | 100.0% |
Housing Finances in Linntown
Median Income by Occupancy in Linntown
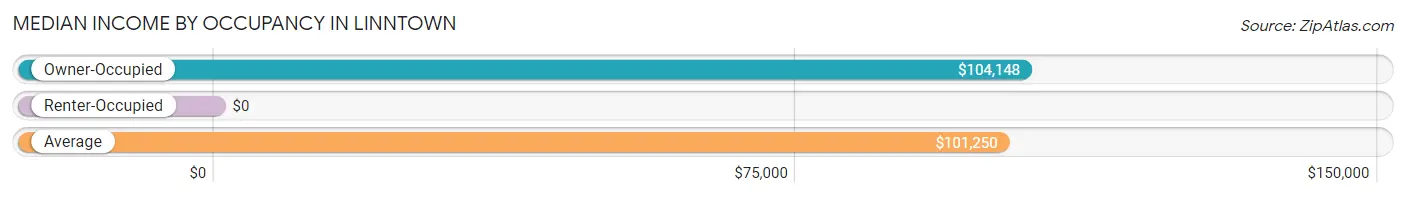
| Occupancy Type | # Households | Median Income |
| Owner-Occupied | 423 (71.5%) | $104,148 |
| Renter-Occupied | 169 (28.5%) | $0 |
| Average | 592 (100.0%) | $101,250 |
Occupancy by Householder Income Bracket in Linntown
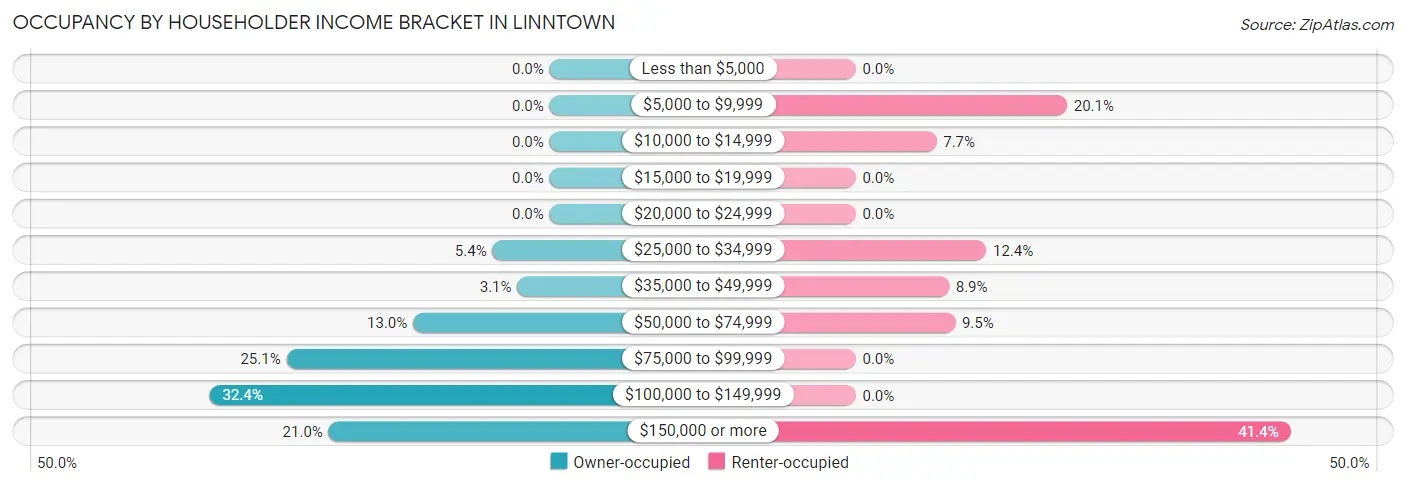
| Income Bracket | Owner-occupied | Renter-occupied |
| Less than $5,000 | 0 (0.0%) | 0 (0.0%) |
| $5,000 to $9,999 | 0 (0.0%) | 34 (20.1%) |
| $10,000 to $14,999 | 0 (0.0%) | 13 (7.7%) |
| $15,000 to $19,999 | 0 (0.0%) | 0 (0.0%) |
| $20,000 to $24,999 | 0 (0.0%) | 0 (0.0%) |
| $25,000 to $34,999 | 23 (5.4%) | 21 (12.4%) |
| $35,000 to $49,999 | 13 (3.1%) | 15 (8.9%) |
| $50,000 to $74,999 | 55 (13.0%) | 16 (9.5%) |
| $75,000 to $99,999 | 106 (25.1%) | 0 (0.0%) |
| $100,000 to $149,999 | 137 (32.4%) | 0 (0.0%) |
| $150,000 or more | 89 (21.0%) | 70 (41.4%) |
| Total | 423 (100.0%) | 169 (100.0%) |
Monthly Housing Cost Tiers in Linntown
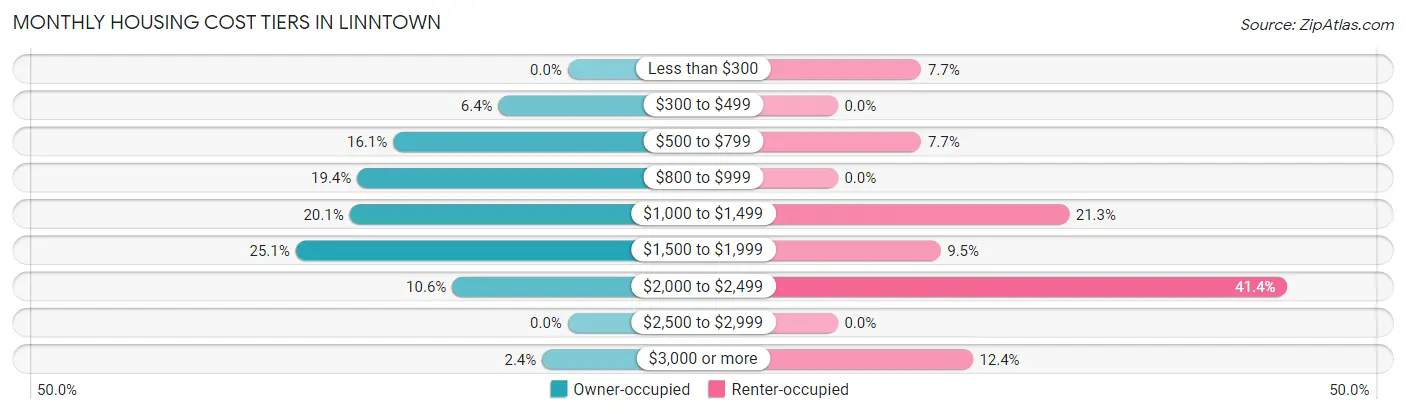
| Monthly Cost | Owner-occupied | Renter-occupied |
| Less than $300 | 0 (0.0%) | 13 (7.7%) |
| $300 to $499 | 27 (6.4%) | 0 (0.0%) |
| $500 to $799 | 68 (16.1%) | 13 (7.7%) |
| $800 to $999 | 82 (19.4%) | 0 (0.0%) |
| $1,000 to $1,499 | 85 (20.1%) | 36 (21.3%) |
| $1,500 to $1,999 | 106 (25.1%) | 16 (9.5%) |
| $2,000 to $2,499 | 45 (10.6%) | 70 (41.4%) |
| $2,500 to $2,999 | 0 (0.0%) | 0 (0.0%) |
| $3,000 or more | 10 (2.4%) | 21 (12.4%) |
| Total | 423 (100.0%) | 169 (100.0%) |
Physical Housing Characteristics in Linntown
Housing Structures in Linntown
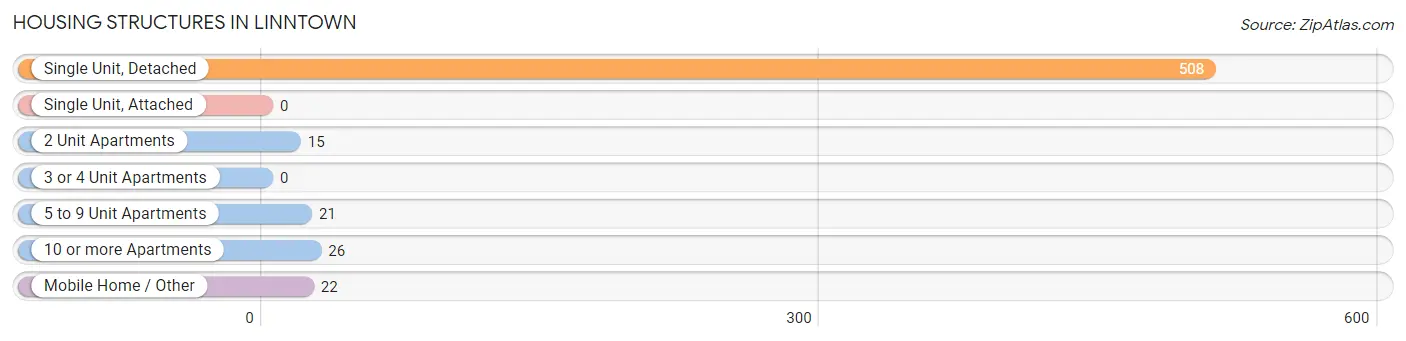
| Structure Type | # Housing Units | % Housing Units |
| Single Unit, Detached | 508 | 85.8% |
| Single Unit, Attached | 0 | 0.0% |
| 2 Unit Apartments | 15 | 2.5% |
| 3 or 4 Unit Apartments | 0 | 0.0% |
| 5 to 9 Unit Apartments | 21 | 3.5% |
| 10 or more Apartments | 26 | 4.4% |
| Mobile Home / Other | 22 | 3.7% |
| Total | 592 | 100.0% |
Housing Structures by Occupancy in Linntown
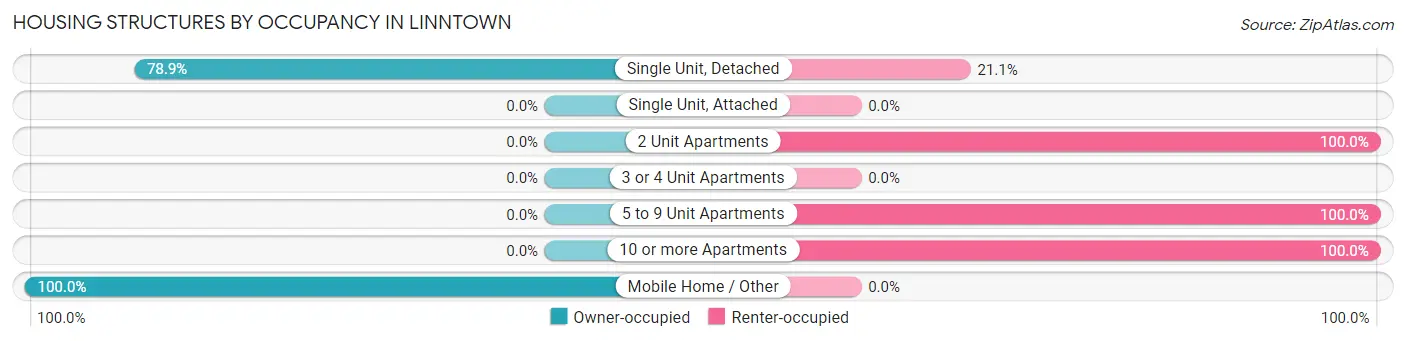
| Structure Type | Owner-occupied | Renter-occupied |
| Single Unit, Detached | 401 (78.9%) | 107 (21.1%) |
| Single Unit, Attached | 0 (0.0%) | 0 (0.0%) |
| 2 Unit Apartments | 0 (0.0%) | 15 (100.0%) |
| 3 or 4 Unit Apartments | 0 (0.0%) | 0 (0.0%) |
| 5 to 9 Unit Apartments | 0 (0.0%) | 21 (100.0%) |
| 10 or more Apartments | 0 (0.0%) | 26 (100.0%) |
| Mobile Home / Other | 22 (100.0%) | 0 (0.0%) |
| Total | 423 (71.5%) | 169 (28.5%) |
Housing Structures by Number of Rooms in Linntown
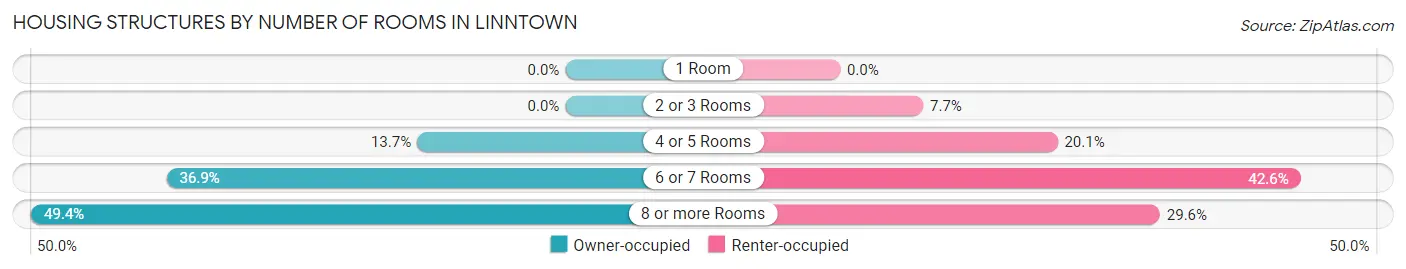
| Number of Rooms | Owner-occupied | Renter-occupied |
| 1 Room | 0 (0.0%) | 0 (0.0%) |
| 2 or 3 Rooms | 0 (0.0%) | 13 (7.7%) |
| 4 or 5 Rooms | 58 (13.7%) | 34 (20.1%) |
| 6 or 7 Rooms | 156 (36.9%) | 72 (42.6%) |
| 8 or more Rooms | 209 (49.4%) | 50 (29.6%) |
| Total | 423 (100.0%) | 169 (100.0%) |
Housing Structure by Heating Type in Linntown
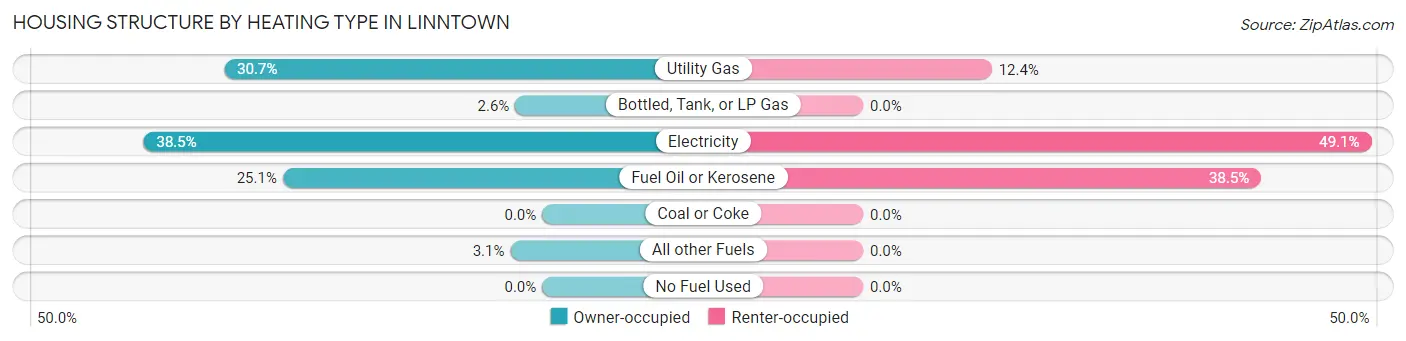
| Heating Type | Owner-occupied | Renter-occupied |
| Utility Gas | 130 (30.7%) | 21 (12.4%) |
| Bottled, Tank, or LP Gas | 11 (2.6%) | 0 (0.0%) |
| Electricity | 163 (38.5%) | 83 (49.1%) |
| Fuel Oil or Kerosene | 106 (25.1%) | 65 (38.5%) |
| Coal or Coke | 0 (0.0%) | 0 (0.0%) |
| All other Fuels | 13 (3.1%) | 0 (0.0%) |
| No Fuel Used | 0 (0.0%) | 0 (0.0%) |
| Total | 423 (100.0%) | 169 (100.0%) |
Household Vehicle Usage in Linntown
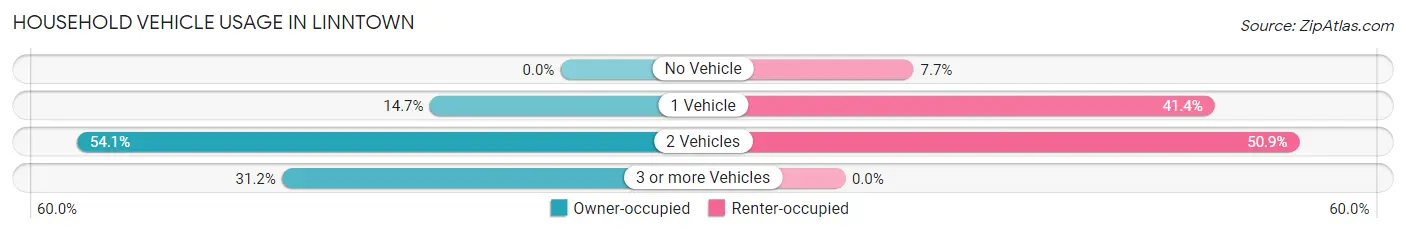
| Vehicles per Household | Owner-occupied | Renter-occupied |
| No Vehicle | 0 (0.0%) | 13 (7.7%) |
| 1 Vehicle | 62 (14.7%) | 70 (41.4%) |
| 2 Vehicles | 229 (54.1%) | 86 (50.9%) |
| 3 or more Vehicles | 132 (31.2%) | 0 (0.0%) |
| Total | 423 (100.0%) | 169 (100.0%) |
Real Estate & Mortgages in Linntown
Real Estate and Mortgage Overview in Linntown
| Characteristic | Without Mortgage | With Mortgage |
| Housing Units | 109 | 314 |
| Median Property Value | $221,900 | $239,600 |
| Median Household Income | $121,635 | $58 |
| Monthly Housing Costs | $576 | $10 |
| Real Estate Taxes | $3,236 | $0 |
Property Value by Mortgage Status in Linntown
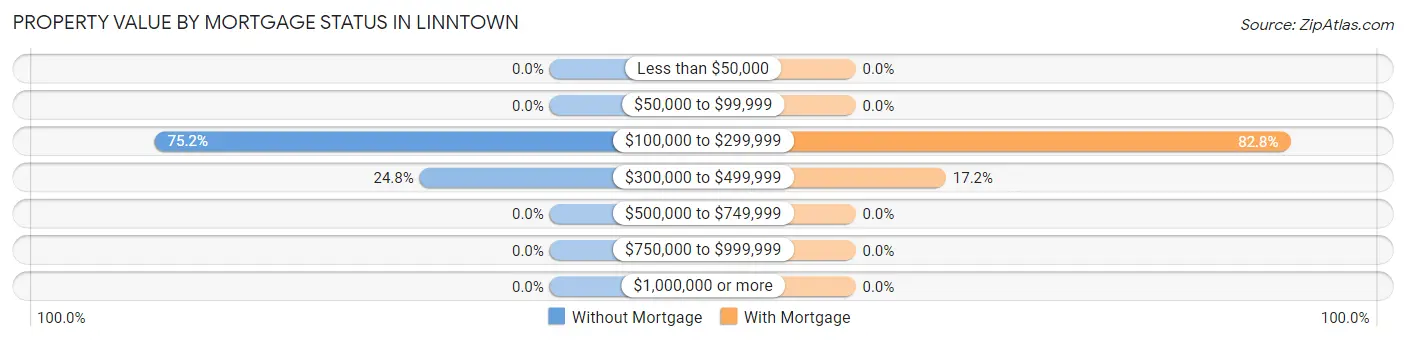
| Property Value | Without Mortgage | With Mortgage |
| Less than $50,000 | 0 (0.0%) | 0 (0.0%) |
| $50,000 to $99,999 | 0 (0.0%) | 0 (0.0%) |
| $100,000 to $299,999 | 82 (75.2%) | 260 (82.8%) |
| $300,000 to $499,999 | 27 (24.8%) | 54 (17.2%) |
| $500,000 to $749,999 | 0 (0.0%) | 0 (0.0%) |
| $750,000 to $999,999 | 0 (0.0%) | 0 (0.0%) |
| $1,000,000 or more | 0 (0.0%) | 0 (0.0%) |
| Total | 109 (100.0%) | 314 (100.0%) |
Household Income by Mortgage Status in Linntown
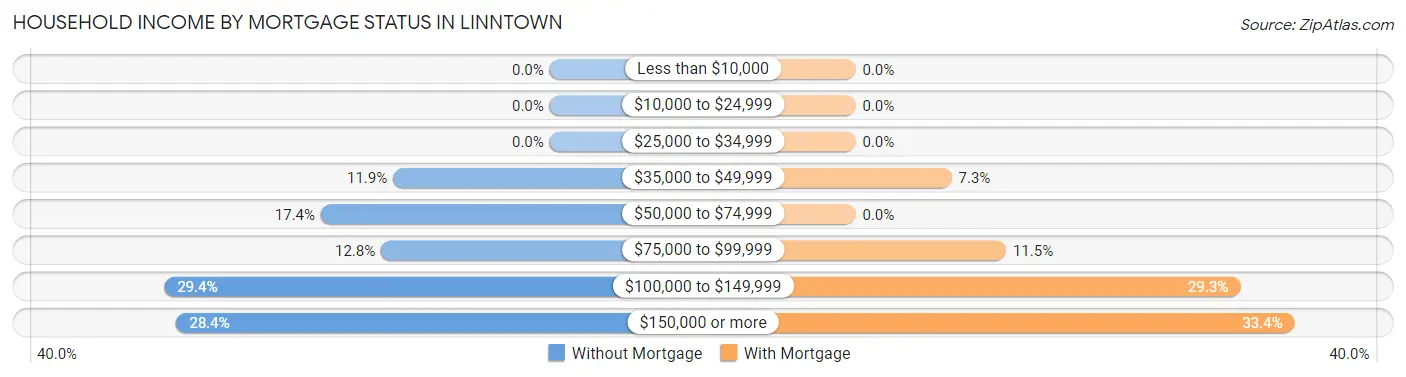
| Household Income | Without Mortgage | With Mortgage |
| Less than $10,000 | 0 (0.0%) | 0 (0.0%) |
| $10,000 to $24,999 | 0 (0.0%) | 0 (0.0%) |
| $25,000 to $34,999 | 0 (0.0%) | 0 (0.0%) |
| $35,000 to $49,999 | 13 (11.9%) | 23 (7.3%) |
| $50,000 to $74,999 | 19 (17.4%) | 0 (0.0%) |
| $75,000 to $99,999 | 14 (12.8%) | 36 (11.5%) |
| $100,000 to $149,999 | 32 (29.4%) | 92 (29.3%) |
| $150,000 or more | 31 (28.4%) | 105 (33.4%) |
| Total | 109 (100.0%) | 314 (100.0%) |
Property Value to Household Income Ratio in Linntown
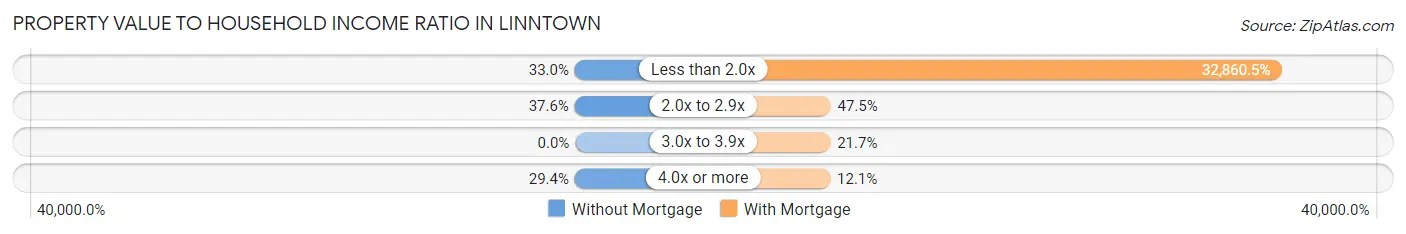
| Value-to-Income Ratio | Without Mortgage | With Mortgage |
| Less than 2.0x | 36 (33.0%) | 103,182 (32,860.5%) |
| 2.0x to 2.9x | 41 (37.6%) | 149 (47.4%) |
| 3.0x to 3.9x | 0 (0.0%) | 68 (21.7%) |
| 4.0x or more | 32 (29.4%) | 38 (12.1%) |
| Total | 109 (100.0%) | 314 (100.0%) |
Real Estate Taxes by Mortgage Status in Linntown
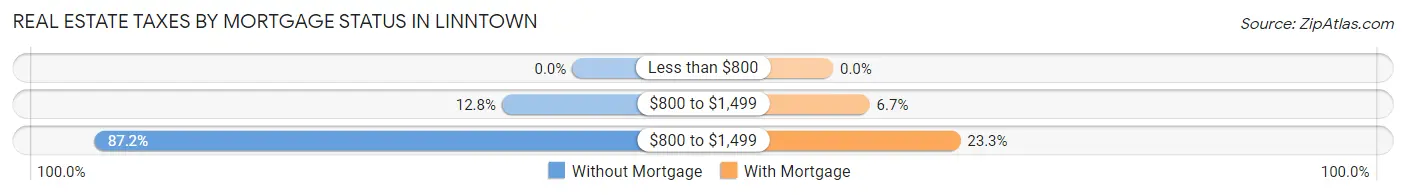
| Property Taxes | Without Mortgage | With Mortgage |
| Less than $800 | 0 (0.0%) | 0 (0.0%) |
| $800 to $1,499 | 14 (12.8%) | 21 (6.7%) |
| $800 to $1,499 | 95 (87.2%) | 73 (23.3%) |
| Total | 109 (100.0%) | 314 (100.0%) |
Health & Disability in Linntown
Health Insurance Coverage by Age in Linntown
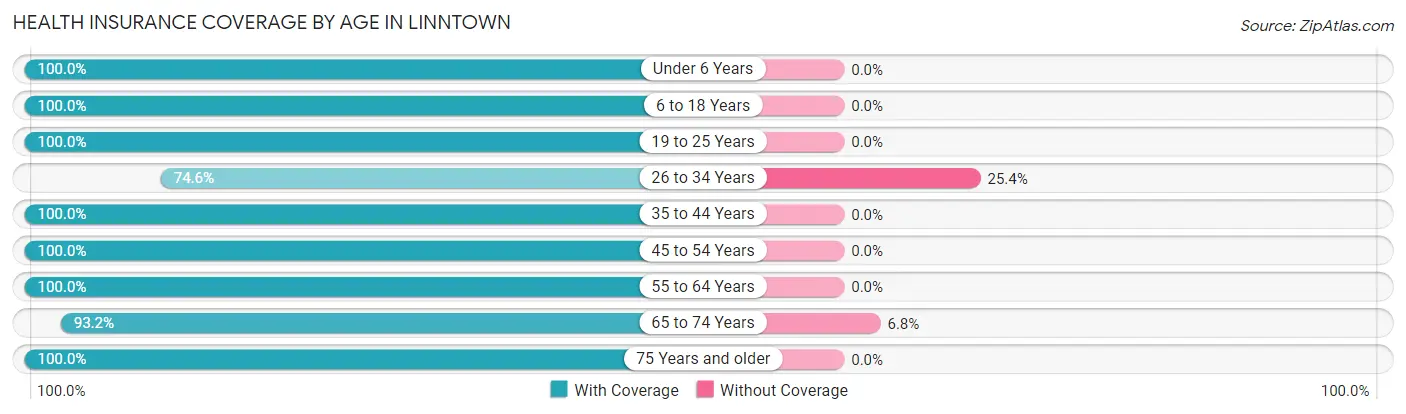
| Age Bracket | With Coverage | Without Coverage |
| Under 6 Years | 160 (100.0%) | 0 (0.0%) |
| 6 to 18 Years | 300 (100.0%) | 0 (0.0%) |
| 19 to 25 Years | 53 (100.0%) | 0 (0.0%) |
| 26 to 34 Years | 91 (74.6%) | 31 (25.4%) |
| 35 to 44 Years | 407 (100.0%) | 0 (0.0%) |
| 45 to 54 Years | 89 (100.0%) | 0 (0.0%) |
| 55 to 64 Years | 279 (100.0%) | 0 (0.0%) |
| 65 to 74 Years | 207 (93.2%) | 15 (6.8%) |
| 75 Years and older | 55 (100.0%) | 0 (0.0%) |
| Total | 1,641 (97.3%) | 46 (2.7%) |
Health Insurance Coverage by Citizenship Status in Linntown
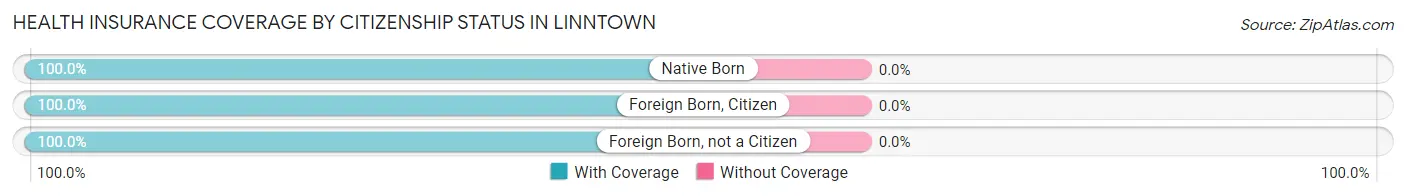
| Citizenship Status | With Coverage | Without Coverage |
| Native Born | 160 (100.0%) | 0 (0.0%) |
| Foreign Born, Citizen | 300 (100.0%) | 0 (0.0%) |
| Foreign Born, not a Citizen | 53 (100.0%) | 0 (0.0%) |
Health Insurance Coverage by Household Income in Linntown
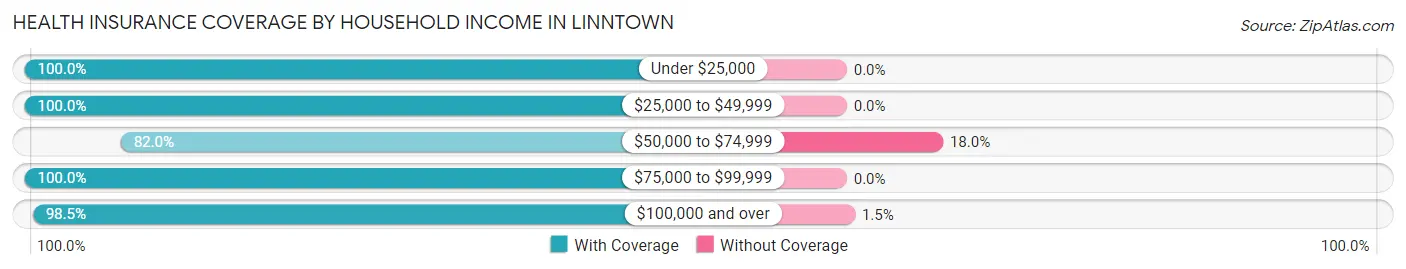
| Household Income | With Coverage | Without Coverage |
| Under $25,000 | 103 (100.0%) | 0 (0.0%) |
| $25,000 to $49,999 | 119 (100.0%) | 0 (0.0%) |
| $50,000 to $74,999 | 141 (82.0%) | 31 (18.0%) |
| $75,000 to $99,999 | 313 (100.0%) | 0 (0.0%) |
| $100,000 and over | 965 (98.5%) | 15 (1.5%) |
Public vs Private Health Insurance Coverage by Age in Linntown
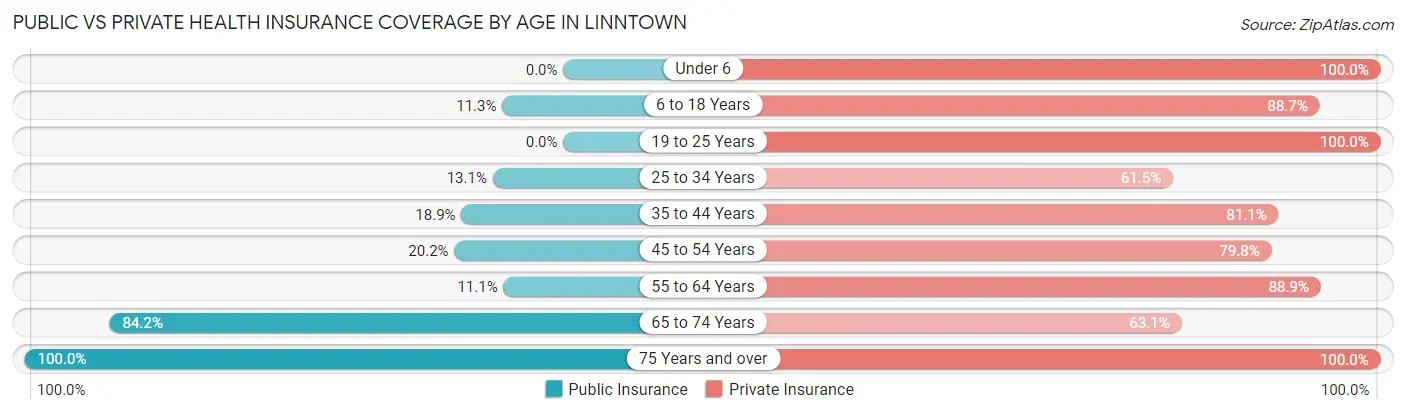
| Age Bracket | Public Insurance | Private Insurance |
| Under 6 | 0 (0.0%) | 160 (100.0%) |
| 6 to 18 Years | 34 (11.3%) | 266 (88.7%) |
| 19 to 25 Years | 0 (0.0%) | 53 (100.0%) |
| 25 to 34 Years | 16 (13.1%) | 75 (61.5%) |
| 35 to 44 Years | 77 (18.9%) | 330 (81.1%) |
| 45 to 54 Years | 18 (20.2%) | 71 (79.8%) |
| 55 to 64 Years | 31 (11.1%) | 248 (88.9%) |
| 65 to 74 Years | 187 (84.2%) | 140 (63.1%) |
| 75 Years and over | 55 (100.0%) | 55 (100.0%) |
| Total | 418 (24.8%) | 1,398 (82.9%) |
Disability Status by Sex by Age in Linntown
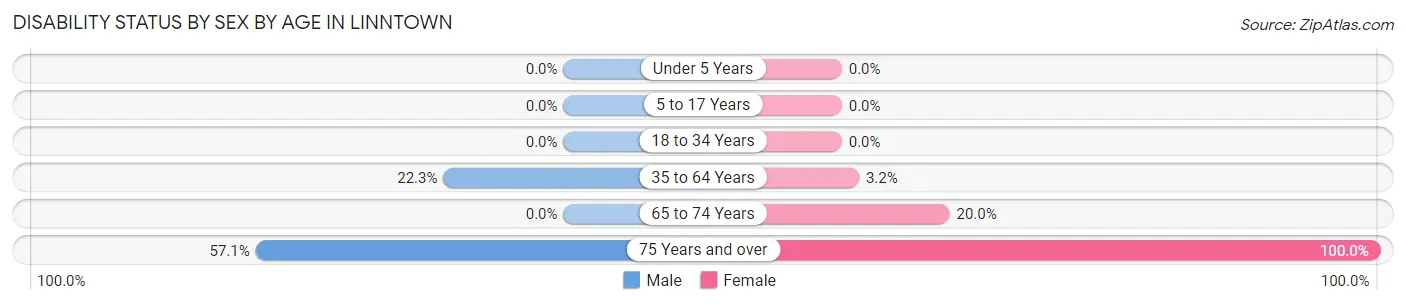
| Age Bracket | Male | Female |
| Under 5 Years | 0 (0.0%) | 0 (0.0%) |
| 5 to 17 Years | 0 (0.0%) | 0 (0.0%) |
| 18 to 34 Years | 0 (0.0%) | 0 (0.0%) |
| 35 to 64 Years | 82 (22.3%) | 13 (3.2%) |
| 65 to 74 Years | 0 (0.0%) | 14 (20.0%) |
| 75 Years and over | 16 (57.1%) | 27 (100.0%) |
Disability Class by Sex by Age in Linntown
Disability Class: Hearing Difficulty
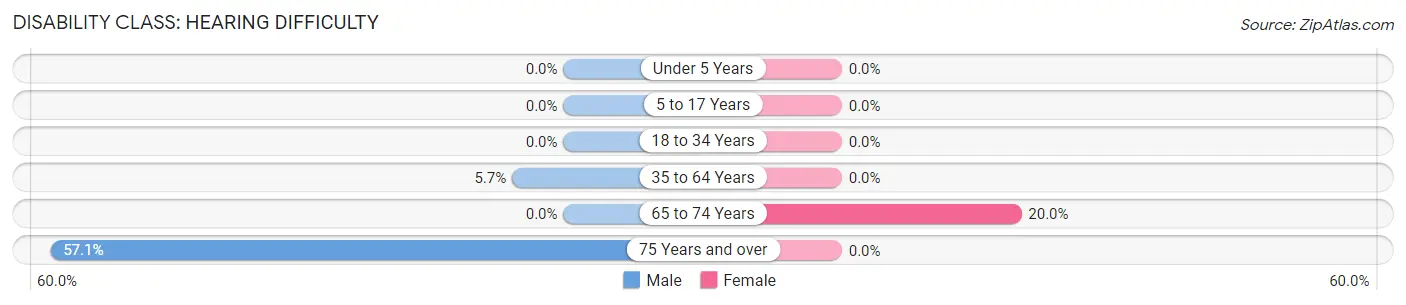
| Age Bracket | Male | Female |
| Under 5 Years | 0 (0.0%) | 0 (0.0%) |
| 5 to 17 Years | 0 (0.0%) | 0 (0.0%) |
| 18 to 34 Years | 0 (0.0%) | 0 (0.0%) |
| 35 to 64 Years | 21 (5.7%) | 0 (0.0%) |
| 65 to 74 Years | 0 (0.0%) | 14 (20.0%) |
| 75 Years and over | 16 (57.1%) | 0 (0.0%) |
Disability Class: Vision Difficulty
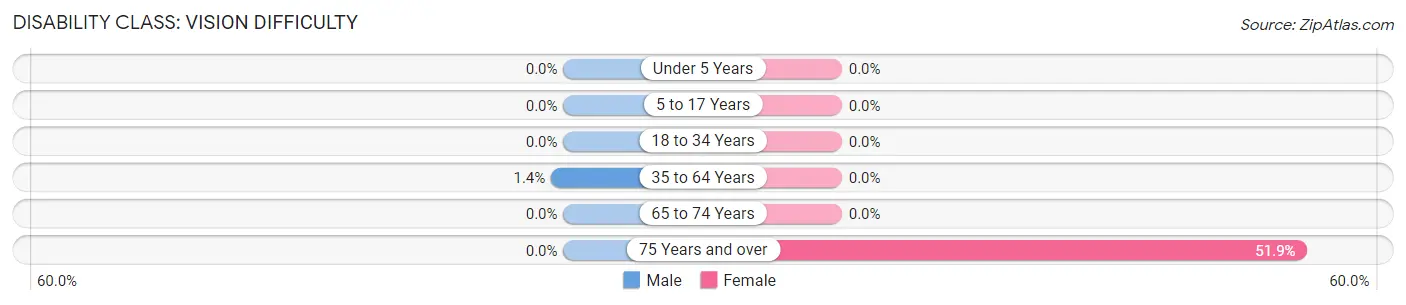
| Age Bracket | Male | Female |
| Under 5 Years | 0 (0.0%) | 0 (0.0%) |
| 5 to 17 Years | 0 (0.0%) | 0 (0.0%) |
| 18 to 34 Years | 0 (0.0%) | 0 (0.0%) |
| 35 to 64 Years | 5 (1.4%) | 0 (0.0%) |
| 65 to 74 Years | 0 (0.0%) | 0 (0.0%) |
| 75 Years and over | 0 (0.0%) | 14 (51.8%) |
Disability Class: Cognitive Difficulty
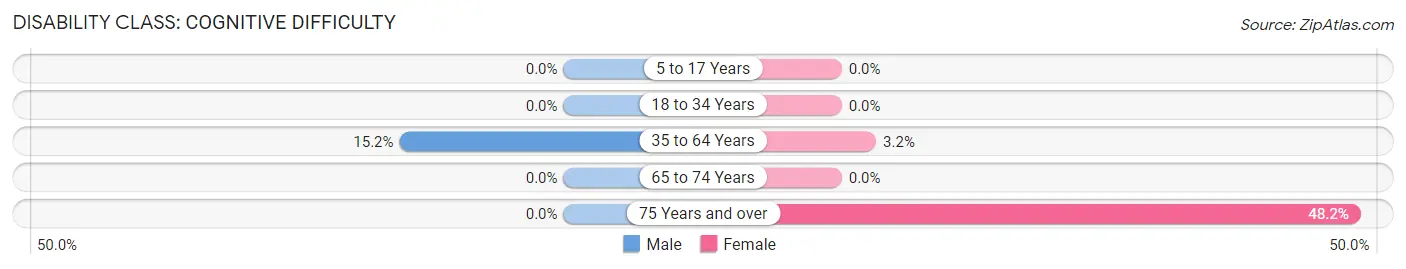
| Age Bracket | Male | Female |
| 5 to 17 Years | 0 (0.0%) | 0 (0.0%) |
| 18 to 34 Years | 0 (0.0%) | 0 (0.0%) |
| 35 to 64 Years | 56 (15.2%) | 13 (3.2%) |
| 65 to 74 Years | 0 (0.0%) | 0 (0.0%) |
| 75 Years and over | 0 (0.0%) | 13 (48.1%) |
Disability Class: Ambulatory Difficulty
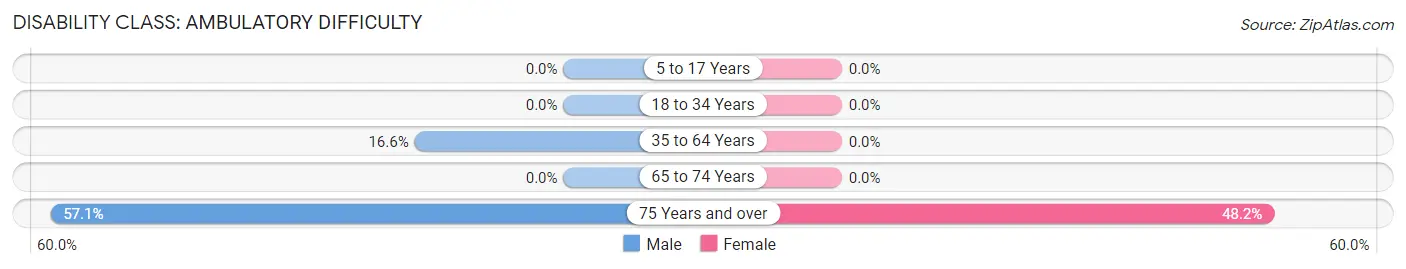
| Age Bracket | Male | Female |
| 5 to 17 Years | 0 (0.0%) | 0 (0.0%) |
| 18 to 34 Years | 0 (0.0%) | 0 (0.0%) |
| 35 to 64 Years | 61 (16.6%) | 0 (0.0%) |
| 65 to 74 Years | 0 (0.0%) | 0 (0.0%) |
| 75 Years and over | 16 (57.1%) | 13 (48.1%) |
Disability Class: Self-Care Difficulty
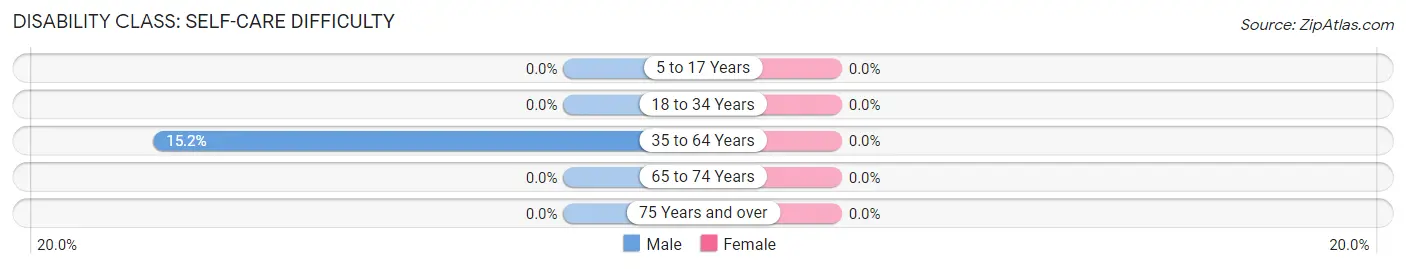
| Age Bracket | Male | Female |
| 5 to 17 Years | 0 (0.0%) | 0 (0.0%) |
| 18 to 34 Years | 0 (0.0%) | 0 (0.0%) |
| 35 to 64 Years | 56 (15.2%) | 0 (0.0%) |
| 65 to 74 Years | 0 (0.0%) | 0 (0.0%) |
| 75 Years and over | 0 (0.0%) | 0 (0.0%) |
Technology Access in Linntown
Computing Device Access in Linntown
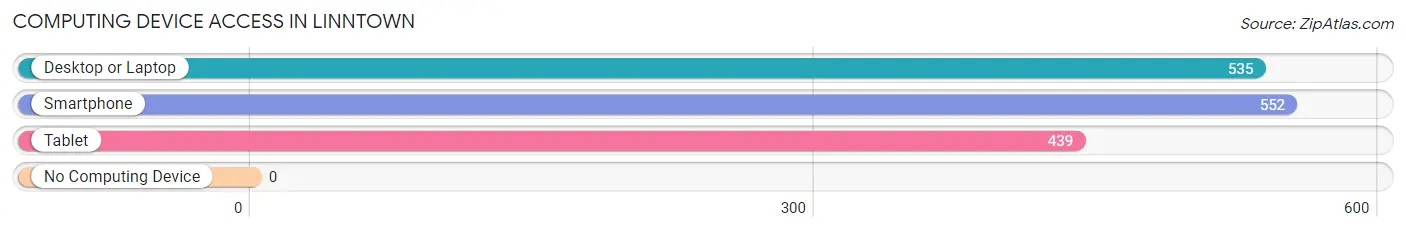
| Device Type | # Households | % Households |
| Desktop or Laptop | 535 | 90.4% |
| Smartphone | 552 | 93.2% |
| Tablet | 439 | 74.2% |
| No Computing Device | 0 | 0.0% |
| Total | 592 | 100.0% |
Internet Access in Linntown
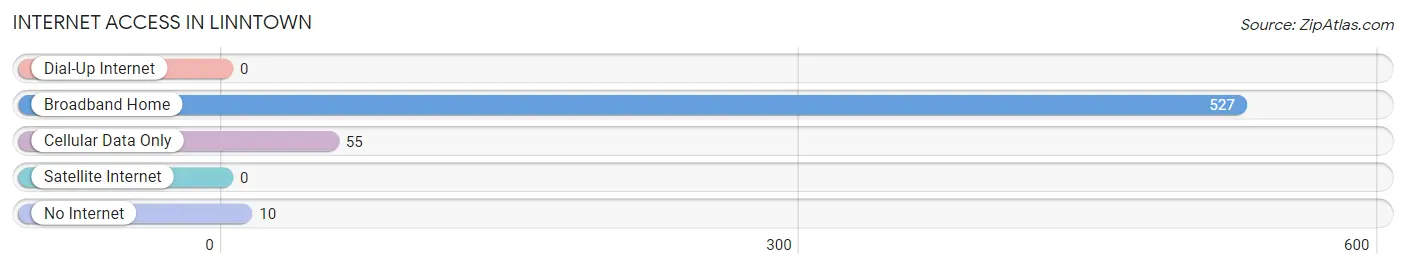
| Internet Type | # Households | % Households |
| Dial-Up Internet | 0 | 0.0% |
| Broadband Home | 527 | 89.0% |
| Cellular Data Only | 55 | 9.3% |
| Satellite Internet | 0 | 0.0% |
| No Internet | 10 | 1.7% |
| Total | 592 | 100.0% |
Linntown Summary
Linntown is a small borough located in the state of Pennsylvania, United States. It is situated in the Susquehanna Valley, approximately five miles south of the city of Lewisburg. The borough was founded in 1851 and is named after the Linntown Creek, which runs through the area. The population of Linntown was 1,845 as of the 2010 census.
Geography
Linntown is located at 40°59'N 76°59'W (40.983, -76.983). It is situated in the Susquehanna Valley, approximately five miles south of the city of Lewisburg. The borough has a total area of 0.6 square miles, all of which is land.
The borough is bordered by the townships of Kelly and White Deer to the north, East Buffalo to the east, and Buffalo to the south and west. The Linntown Creek runs through the borough, and the Susquehanna River is located just to the east.
History
Linntown was founded in 1851 and is named after the Linntown Creek, which runs through the area. The creek was named after the Linntown family, who were among the first settlers in the area.
The borough was originally part of the larger Buffalo Township, but was incorporated as a separate borough in 1851. The first mayor of Linntown was John Linn, who served from 1851 to 1853.
Economy
The economy of Linntown is largely based on agriculture and light industry. The borough is home to several small businesses, including a grocery store, a hardware store, and a restaurant.
The borough is also home to several farms, which produce a variety of crops, including corn, soybeans, wheat, and hay. The farms also raise livestock, including cattle, sheep, and pigs.
Demographics
As of the 2010 census, the population of Linntown was 1,845. The racial makeup of the borough was 97.3% White, 0.7% African American, 0.2% Native American, 0.3% Asian, 0.1% from other races, and 1.4% from two or more races. Hispanic or Latino of any race were 0.7% of the population.
The median household income in Linntown was $45,938, and the median family income was $51,250. The per capita income was $20,945. About 8.3% of families and 10.2% of the population were below the poverty line, including 14.2% of those under age 18 and 8.2% of those age 65 or over.
Education
Linntown is served by the Lewisburg Area School District. The borough is home to one elementary school, Linntown Elementary School, which serves students in kindergarten through fifth grade. Students in grades six through twelve attend Lewisburg Area Middle School and Lewisburg Area High School.
The borough is also home to several private schools, including the Linntown Christian Academy and the Linntown Montessori School.
Conclusion
Linntown is a small borough located in the state of Pennsylvania, United States. It is situated in the Susquehanna Valley, approximately five miles south of the city of Lewisburg. The borough was founded in 1851 and is named after the Linntown Creek, which runs through the area. The population of Linntown was 1,845 as of the 2010 census.
The economy of Linntown is largely based on agriculture and light industry. The borough is home to several small businesses, including a grocery store, a hardware store, and a restaurant. The borough is also home to several farms, which produce a variety of crops, including corn, soybeans, wheat, and hay.
The racial makeup of the borough was 97.3% White, 0.7% African American, 0.2% Native American, 0.3% Asian, 0.1% from other races, and 1.4% from two or more races. The median household income in Linntown was $45,938, and the median family income was $51,250. The per capita income was $20,945.
Linntown is served by the Lewisburg Area School District. The borough is home to one elementary school, Linntown Elementary School, which serves students in kindergarten through fifth grade. Students in grades six through twelve attend Lewisburg Area Middle School and Lewisburg Area High School. The borough is also home to several private schools, including the Linntown Christian Academy and the Linntown Montessori School.
Common Questions
What is the Total Population of Linntown?
Total Population of Linntown is 1,687.
What is the Total Male Population of Linntown?
Total Male Population of Linntown is 828.
What is the Total Female Population of Linntown?
Total Female Population of Linntown is 859.
What is the Ratio of Males per 100 Females in Linntown?
There are 96.39 Males per 100 Females in Linntown.
What is the Ratio of Females per 100 Males in Linntown?
There are 103.74 Females per 100 Males in Linntown.
What is the Median Population Age in Linntown?
Median Population Age in Linntown is 38.9 Years.
What is the Average Family Size in Linntown
Average Family Size in Linntown is 3.2 People.
What is the Average Household Size in Linntown
Average Household Size in Linntown is 2.9 People.
What is Per Capita Income in Linntown?
Per Capita income in Linntown is $58,274.
What is the Median Family Income in Linntown?
Median Family Income in Linntown is $120,673.
What is the Median Household income in Linntown?
Median Household Income in Linntown is $101,250.
What is Income or Wage Gap in Linntown?
Income or Wage Gap in Linntown is 10.1%.
Women in Linntown earn 89.9 cents for every dollar earned by a man.
What is Inequality or Gini Index in Linntown?
Inequality or Gini Index in Linntown is 0.52.
How Large is the Labor Force in Linntown?
There are 938 People in the Labor Forcein in Linntown.
What is the Percentage of People in the Labor Force in Linntown?
72.4% of People are in the Labor Force in Linntown.
What is the Unemployment Rate in Linntown?
Unemployment Rate in Linntown is 9.4%.