Cities with the Highest Percentage of Population with a Degree in Liberal Arts and History in Oregon
RELATED REPORTS & OPTIONS
Liberal Arts and History
Oregon
Compare Cities
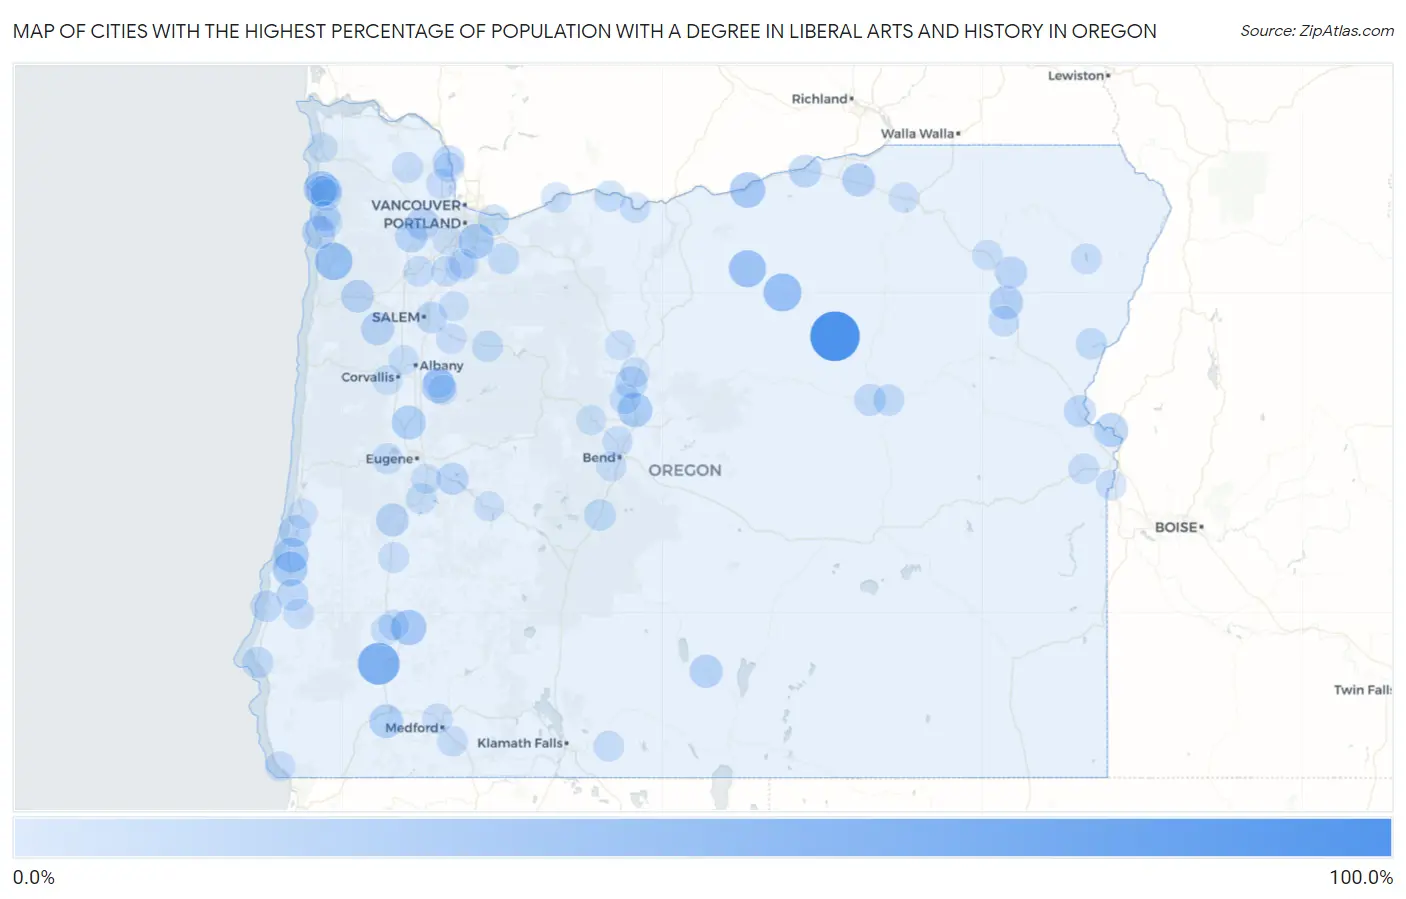
Map of Cities with the Highest Percentage of Population with a Degree in Liberal Arts and History in Oregon
0.0%
100.0%
Cities with the Highest Percentage of Population with a Degree in Liberal Arts and History in Oregon
| City | % Graduates | vs State | vs National | |
| 1. | Monument | 100.0% | 6.1%(+93.9)#1 | 4.9%(+95.1)#42 |
| 2. | Glendale | 62.8% | 6.1%(+56.7)#2 | 4.9%(+57.9)#157 |
| 3. | Lonerock | 44.4% | 6.1%(+38.4)#3 | 4.9%(+39.6)#318 |
| 4. | Beaver | 42.4% | 6.1%(+36.3)#4 | 4.9%(+37.6)#349 |
| 5. | Mapleton | 40.9% | 6.1%(+34.8)#5 | 4.9%(+36.0)#368 |
| 6. | Condon | 40.3% | 6.1%(+34.2)#6 | 4.9%(+35.5)#373 |
| 7. | Pleasant Valley | 33.3% | 6.1%(+27.3)#7 | 4.9%(+28.5)#522 |
| 8. | Arlington | 32.7% | 6.1%(+26.6)#8 | 4.9%(+27.8)#576 |
| 9. | Neahkahnie | 32.6% | 6.1%(+26.5)#9 | 4.9%(+27.7)#577 |
| 10. | Days Creek | 32.5% | 6.1%(+26.4)#10 | 4.9%(+27.6)#579 |
| 11. | Johnson City | 31.8% | 6.1%(+25.7)#11 | 4.9%(+26.9)#600 |
| 12. | Glasgow | 29.7% | 6.1%(+23.7)#12 | 4.9%(+24.9)#668 |
| 13. | Bunker Hill | 29.6% | 6.1%(+23.5)#13 | 4.9%(+24.7)#673 |
| 14. | Terrebonne | 29.3% | 6.1%(+23.2)#14 | 4.9%(+24.4)#684 |
| 15. | Cheshire | 28.6% | 6.1%(+22.5)#15 | 4.9%(+23.7)#712 |
| 16. | South Lebanon | 27.2% | 6.1%(+21.1)#16 | 4.9%(+22.3)#785 |
| 17. | Annex | 26.3% | 6.1%(+20.2)#17 | 4.9%(+21.4)#826 |
| 18. | Harrisburg | 26.2% | 6.1%(+20.1)#18 | 4.9%(+21.3)#833 |
| 19. | New Hope | 25.0% | 6.1%(+18.9)#19 | 4.9%(+20.1)#885 |
| 20. | North Powder | 24.6% | 6.1%(+18.5)#20 | 4.9%(+19.7)#934 |
| 21. | Jasper | 24.5% | 6.1%(+18.4)#21 | 4.9%(+19.7)#937 |
| 22. | Oceanside | 23.2% | 6.1%(+17.2)#22 | 4.9%(+18.4)#1,019 |
| 23. | Stanfield | 22.1% | 6.1%(+16.1)#23 | 4.9%(+17.3)#1,103 |
| 24. | Paisley | 22.0% | 6.1%(+15.9)#24 | 4.9%(+17.1)#1,111 |
| 25. | Cornelius | 21.5% | 6.1%(+15.5)#25 | 4.9%(+16.7)#1,139 |
| 26. | Drain | 21.5% | 6.1%(+15.4)#26 | 4.9%(+16.6)#1,145 |
| 27. | Falls City | 21.4% | 6.1%(+15.3)#27 | 4.9%(+16.5)#1,166 |
| 28. | Grand Ronde | 21.3% | 6.1%(+15.3)#28 | 4.9%(+16.5)#1,167 |
| 29. | Boardman | 19.9% | 6.1%(+13.8)#29 | 4.9%(+15.0)#1,311 |
| 30. | Gaston | 19.4% | 6.1%(+13.3)#30 | 4.9%(+14.5)#1,350 |
| 31. | Culver | 18.2% | 6.1%(+12.2)#31 | 4.9%(+13.4)#1,471 |
| 32. | Union | 18.1% | 6.1%(+12.1)#32 | 4.9%(+13.3)#1,506 |
| 33. | Huntington | 18.0% | 6.1%(+12.0)#33 | 4.9%(+13.2)#1,512 |
| 34. | Lakeside | 17.8% | 6.1%(+11.7)#34 | 4.9%(+12.9)#1,541 |
| 35. | Lowell | 17.4% | 6.1%(+11.3)#35 | 4.9%(+12.5)#1,608 |
| 36. | Green Meadows | 16.4% | 6.1%(+10.4)#36 | 4.9%(+11.6)#1,780 |
| 37. | Coquille | 16.3% | 6.1%(+10.2)#37 | 4.9%(+11.4)#1,805 |
| 38. | Four Corners | 16.1% | 6.1%(+9.98)#38 | 4.9%(+11.2)#1,842 |
| 39. | Columbia City | 16.0% | 6.1%(+9.97)#39 | 4.9%(+11.2)#1,844 |
| 40. | Mount Vernon | 15.8% | 6.1%(+9.71)#40 | 4.9%(+10.9)#1,893 |
| 41. | La Pine | 15.6% | 6.1%(+9.53)#41 | 4.9%(+10.7)#1,924 |
| 42. | Bandon | 15.6% | 6.1%(+9.51)#42 | 4.9%(+10.7)#1,930 |
| 43. | Wheeler | 15.0% | 6.1%(+8.89)#43 | 4.9%(+10.1)#2,054 |
| 44. | Port Orford | 14.7% | 6.1%(+8.63)#44 | 4.9%(+9.83)#2,105 |
| 45. | John Day | 14.6% | 6.1%(+8.50)#45 | 4.9%(+9.70)#2,139 |
| 46. | Nehalem | 14.3% | 6.1%(+8.21)#46 | 4.9%(+9.41)#2,222 |
| 47. | Richland | 14.3% | 6.1%(+8.21)#47 | 4.9%(+9.41)#2,233 |
| 48. | Mill City | 14.1% | 6.1%(+8.01)#48 | 4.9%(+9.21)#2,284 |
| 49. | River Point | 14.0% | 6.1%(+7.92)#49 | 4.9%(+9.13)#2,303 |
| 50. | Mosier | 13.5% | 6.1%(+7.45)#50 | 4.9%(+8.66)#2,446 |
| 51. | Neotsu | 13.5% | 6.1%(+7.39)#51 | 4.9%(+8.60)#2,460 |
| 52. | Dexter | 13.4% | 6.1%(+7.35)#52 | 4.9%(+8.56)#2,472 |
| 53. | Estacada | 13.3% | 6.1%(+7.24)#53 | 4.9%(+8.45)#2,534 |
| 54. | Wood Village | 13.0% | 6.1%(+6.92)#54 | 4.9%(+8.12)#2,613 |
| 55. | Crooked River Ranch | 12.9% | 6.1%(+6.83)#55 | 4.9%(+8.04)#2,639 |
| 56. | Cottage Grove | 12.6% | 6.1%(+6.54)#56 | 4.9%(+7.75)#2,724 |
| 57. | Vernonia | 12.5% | 6.1%(+6.42)#57 | 4.9%(+7.63)#2,750 |
| 58. | Lebanon | 12.3% | 6.1%(+6.21)#58 | 4.9%(+7.41)#2,856 |
| 59. | Veneta | 12.2% | 6.1%(+6.10)#59 | 4.9%(+7.30)#2,899 |
| 60. | Haines | 12.0% | 6.1%(+5.92)#60 | 4.9%(+7.13)#2,982 |
| 61. | Manzanita | 12.0% | 6.1%(+5.90)#61 | 4.9%(+7.10)#2,988 |
| 62. | Oakland | 11.9% | 6.1%(+5.85)#62 | 4.9%(+7.06)#3,001 |
| 63. | Riddle | 11.9% | 6.1%(+5.80)#63 | 4.9%(+7.01)#3,022 |
| 64. | Dayton | 11.8% | 6.1%(+5.69)#64 | 4.9%(+6.89)#3,063 |
| 65. | Bonanza | 11.8% | 6.1%(+5.69)#65 | 4.9%(+6.89)#3,070 |
| 66. | Vale | 11.6% | 6.1%(+5.55)#66 | 4.9%(+6.76)#3,138 |
| 67. | Wallowa Lake | 11.6% | 6.1%(+5.52)#67 | 4.9%(+6.72)#3,152 |
| 68. | Tri City | 11.6% | 6.1%(+5.50)#68 | 4.9%(+6.70)#3,155 |
| 69. | The Dalles | 11.5% | 6.1%(+5.45)#69 | 4.9%(+6.65)#3,179 |
| 70. | Nyssa | 11.4% | 6.1%(+5.30)#70 | 4.9%(+6.51)#3,231 |
| 71. | Talent | 11.4% | 6.1%(+5.28)#71 | 4.9%(+6.48)#3,246 |
| 72. | Stayton | 11.0% | 6.1%(+4.96)#72 | 4.9%(+6.16)#3,408 |
| 73. | Central Point | 11.0% | 6.1%(+4.91)#73 | 4.9%(+6.12)#3,433 |
| 74. | Cascade Locks | 10.7% | 6.1%(+4.65)#74 | 4.9%(+5.86)#3,567 |
| 75. | La Grande | 10.6% | 6.1%(+4.49)#75 | 4.9%(+5.69)#3,657 |
| 76. | Scappoose | 10.6% | 6.1%(+4.48)#76 | 4.9%(+5.69)#3,659 |
| 77. | Barlow | 10.5% | 6.1%(+4.45)#77 | 4.9%(+5.65)#3,703 |
| 78. | Myrtle Point | 10.5% | 6.1%(+4.43)#78 | 4.9%(+5.64)#3,707 |
| 79. | Tumalo | 10.5% | 6.1%(+4.39)#79 | 4.9%(+5.60)#3,725 |
| 80. | Donald | 10.3% | 6.1%(+4.27)#80 | 4.9%(+5.47)#3,784 |
| 81. | Brookings | 10.3% | 6.1%(+4.19)#81 | 4.9%(+5.39)#3,822 |
| 82. | Garibaldi | 10.2% | 6.1%(+4.11)#82 | 4.9%(+5.31)#3,871 |
| 83. | Knappa | 10.0% | 6.1%(+3.92)#83 | 4.9%(+5.13)#3,971 |
| 84. | St Helens | 9.9% | 6.1%(+3.84)#84 | 4.9%(+5.05)#4,041 |
| 85. | Philomath | 9.9% | 6.1%(+3.82)#85 | 4.9%(+5.03)#4,052 |
| 86. | Creswell | 9.9% | 6.1%(+3.79)#86 | 4.9%(+5.00)#4,065 |
| 87. | Adair Village | 9.8% | 6.1%(+3.69)#87 | 4.9%(+4.90)#4,125 |
| 88. | Sodaville | 9.7% | 6.1%(+3.60)#88 | 4.9%(+4.81)#4,196 |
| 89. | Sisters | 9.6% | 6.1%(+3.54)#89 | 4.9%(+4.75)#4,237 |
| 90. | Metolius | 9.6% | 6.1%(+3.51)#90 | 4.9%(+4.72)#4,262 |
| 91. | Canby | 9.4% | 6.1%(+3.36)#91 | 4.9%(+4.57)#4,373 |
| 92. | Reedsport | 9.4% | 6.1%(+3.35)#92 | 4.9%(+4.56)#4,382 |
| 93. | Bull Mountain | 9.4% | 6.1%(+3.29)#93 | 4.9%(+4.50)#4,424 |
| 94. | Pendleton | 9.4% | 6.1%(+3.29)#94 | 4.9%(+4.49)#4,430 |
| 95. | Oakridge | 9.3% | 6.1%(+3.24)#95 | 4.9%(+4.44)#4,464 |
| 96. | Silverton | 9.2% | 6.1%(+3.11)#96 | 4.9%(+4.32)#4,565 |
| 97. | Bay City | 9.1% | 6.1%(+3.03)#97 | 4.9%(+4.24)#4,616 |
| 98. | Seaside | 9.0% | 6.1%(+2.96)#98 | 4.9%(+4.17)#4,709 |
| 99. | Seventh Mountain | 8.9% | 6.1%(+2.86)#99 | 4.9%(+4.07)#4,782 |
| 100. | Warm Springs | 8.9% | 6.1%(+2.85)#100 | 4.9%(+4.06)#4,789 |
Common Questions
What are the Top 10 Cities with the Highest Percentage of Population with a Degree in Liberal Arts and History in Oregon?
Top 10 Cities with the Highest Percentage of Population with a Degree in Liberal Arts and History in Oregon are:
#1
100.0%
#2
62.8%
#3
44.4%
#4
42.4%
#5
40.3%
#6
32.7%
#7
32.6%
#8
32.5%
#9
31.8%
#10
29.7%
What city has the Highest Percentage of Population with a Degree in Liberal Arts and History in Oregon?
Monument has the Highest Percentage of Population with a Degree in Liberal Arts and History in Oregon with 100.0%.
What is the Percentage of Population with a Degree in Liberal Arts and History in the State of Oregon?
Percentage of Population with a Degree in Liberal Arts and History in Oregon is 6.1%.
What is the Percentage of Population with a Degree in Liberal Arts and History in the United States?
Percentage of Population with a Degree in Liberal Arts and History in the United States is 4.9%.