Cities with the Highest Percentage of Population with a Degree in Liberal Arts and History in South Dakota
RELATED REPORTS & OPTIONS
Liberal Arts and History
South Dakota
Compare Cities
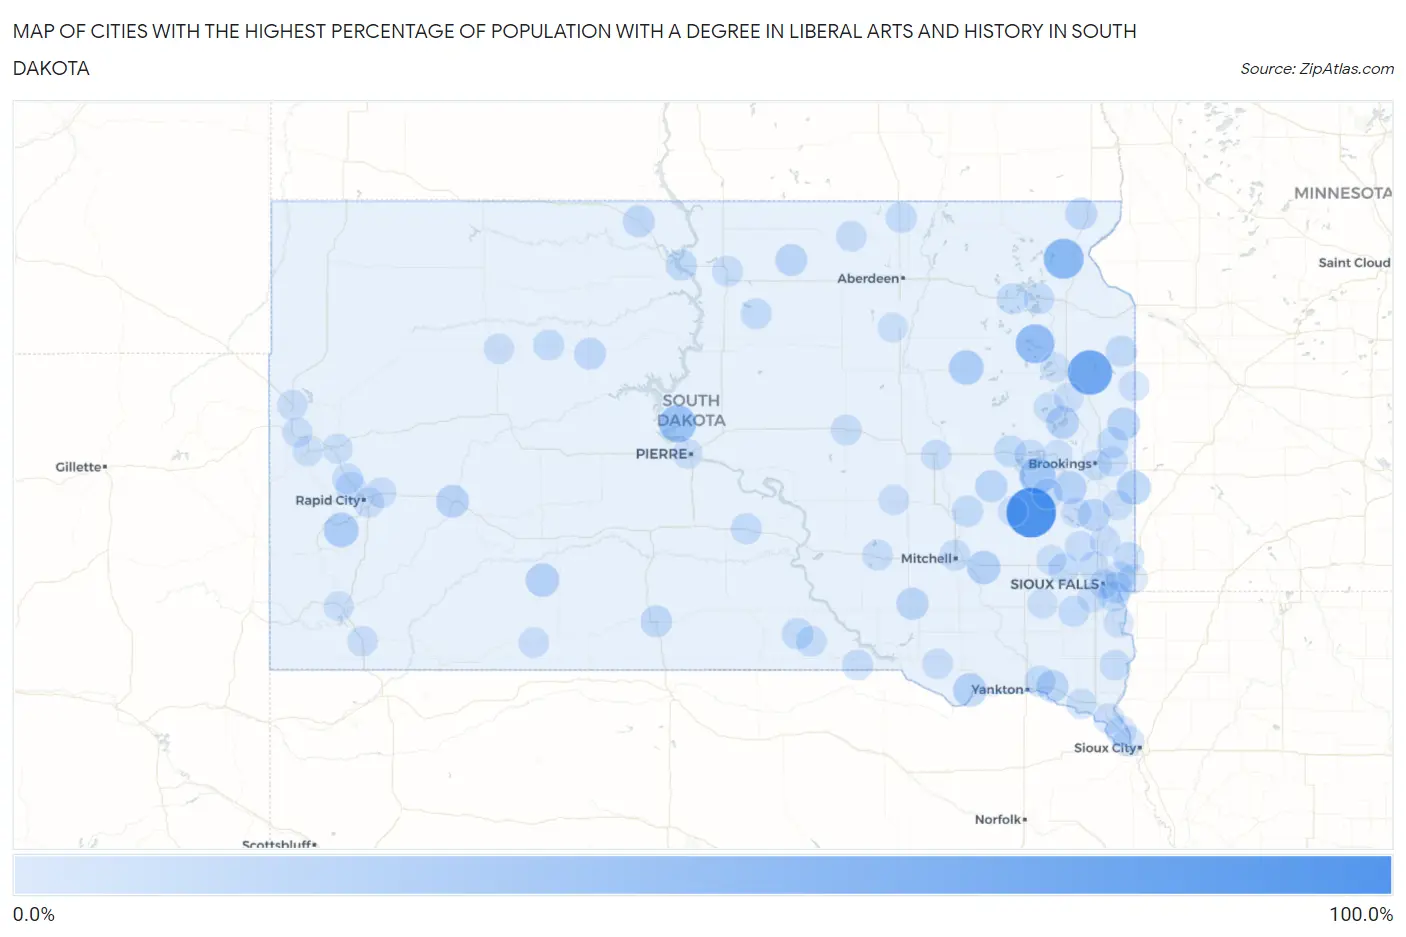
Map of Cities with the Highest Percentage of Population with a Degree in Liberal Arts and History in South Dakota
0.0%
100.0%
Cities with the Highest Percentage of Population with a Degree in Liberal Arts and History in South Dakota
| City | % Graduates | vs State | vs National | |
| 1. | Winfred | 100.0% | 4.1%(+95.9)#1 | 4.9%(+95.1)#80 |
| 2. | Goodwin | 73.3% | 4.1%(+69.3)#2 | 4.9%(+68.5)#123 |
| 3. | Glendale Colony | 61.5% | 4.1%(+57.5)#3 | 4.9%(+56.7)#163 |
| 4. | Agency Village | 51.9% | 4.1%(+47.8)#4 | 4.9%(+47.0)#216 |
| 5. | Florence | 45.5% | 4.1%(+41.4)#5 | 4.9%(+40.6)#305 |
| 6. | Cow Creek | 38.5% | 4.1%(+34.4)#6 | 4.9%(+33.6)#408 |
| 7. | Oldham | 33.3% | 4.1%(+29.3)#7 | 4.9%(+28.5)#545 |
| 8. | New Elm Spring Colony | 32.8% | 4.1%(+28.7)#8 | 4.9%(+27.9)#571 |
| 9. | Lyons | 32.3% | 4.1%(+28.2)#9 | 4.9%(+27.4)#589 |
| 10. | Keystone | 25.5% | 4.1%(+21.5)#10 | 4.9%(+20.7)#868 |
| 11. | Raymond | 25.0% | 4.1%(+20.9)#11 | 4.9%(+20.1)#923 |
| 12. | Wonderland Homes | 22.6% | 4.1%(+18.5)#12 | 4.9%(+17.7)#1,057 |
| 13. | Ward | 22.2% | 4.1%(+18.1)#13 | 4.9%(+17.4)#1,101 |
| 14. | Wanblee | 20.5% | 4.1%(+16.4)#14 | 4.9%(+15.6)#1,230 |
| 15. | Springfield | 20.0% | 4.1%(+15.9)#15 | 4.9%(+15.1)#1,260 |
| 16. | Alexandria | 19.6% | 4.1%(+15.5)#16 | 4.9%(+14.7)#1,332 |
| 17. | Nunda | 18.2% | 4.1%(+14.1)#17 | 4.9%(+13.3)#1,505 |
| 18. | Golden View Colony | 17.6% | 4.1%(+13.6)#18 | 4.9%(+12.8)#1,563 |
| 19. | Lake Poinsett | 17.0% | 4.1%(+12.9)#19 | 4.9%(+12.1)#1,662 |
| 20. | Wasta | 16.7% | 4.1%(+12.6)#20 | 4.9%(+11.8)#1,754 |
| 21. | Astoria | 15.4% | 4.1%(+11.3)#21 | 4.9%(+10.5)#1,985 |
| 22. | Corsica | 14.3% | 4.1%(+10.2)#22 | 4.9%(+9.41)#2,196 |
| 23. | Gayville | 14.0% | 4.1%(+9.96)#23 | 4.9%(+9.16)#2,295 |
| 24. | Colman | 13.9% | 4.1%(+9.83)#24 | 4.9%(+9.04)#2,328 |
| 25. | Carthage | 13.6% | 4.1%(+9.56)#25 | 4.9%(+8.76)#2,423 |
| 26. | Hosmer | 13.6% | 4.1%(+9.51)#26 | 4.9%(+8.71)#2,438 |
| 27. | Mclaughlin | 12.6% | 4.1%(+8.56)#27 | 4.9%(+7.76)#2,720 |
| 28. | New Effington | 12.5% | 4.1%(+8.43)#28 | 4.9%(+7.63)#2,784 |
| 29. | Mission | 12.3% | 4.1%(+8.27)#29 | 4.9%(+7.47)#2,837 |
| 30. | Eagle Butte | 12.0% | 4.1%(+7.96)#30 | 4.9%(+7.16)#2,956 |
| 31. | Anderson | 11.7% | 4.1%(+7.60)#31 | 4.9%(+6.81)#3,117 |
| 32. | De Smet | 10.9% | 4.1%(+6.82)#32 | 4.9%(+6.03)#3,483 |
| 33. | Artesian | 10.0% | 4.1%(+5.93)#33 | 4.9%(+5.13)#4,009 |
| 34. | Revillo | 10.0% | 4.1%(+5.93)#34 | 4.9%(+5.13)#4,018 |
| 35. | Mobridge | 9.9% | 4.1%(+5.84)#35 | 4.9%(+5.04)#4,046 |
| 36. | Gregory | 9.7% | 4.1%(+5.59)#36 | 4.9%(+4.79)#4,209 |
| 37. | White | 9.5% | 4.1%(+5.45)#37 | 4.9%(+4.65)#4,307 |
| 38. | Mission Hill | 9.5% | 4.1%(+5.45)#38 | 4.9%(+4.65)#4,323 |
| 39. | Webster | 9.5% | 4.1%(+5.43)#39 | 4.9%(+4.63)#4,335 |
| 40. | Kennebec | 9.0% | 4.1%(+4.88)#40 | 4.9%(+4.08)#4,772 |
| 41. | Dupree | 8.5% | 4.1%(+4.44)#41 | 4.9%(+3.64)#5,137 |
| 42. | Frederick | 8.3% | 4.1%(+4.26)#42 | 4.9%(+3.46)#5,323 |
| 43. | Shindler | 8.3% | 4.1%(+4.19)#43 | 4.9%(+3.39)#5,397 |
| 44. | Chancellor | 8.1% | 4.1%(+4.03)#44 | 4.9%(+3.24)#5,559 |
| 45. | Hoven | 8.1% | 4.1%(+4.03)#45 | 4.9%(+3.24)#5,560 |
| 46. | Garretson | 8.1% | 4.1%(+4.02)#46 | 4.9%(+3.23)#5,573 |
| 47. | Humboldt | 8.0% | 4.1%(+3.95)#47 | 4.9%(+3.16)#5,627 |
| 48. | Mitchell | 7.9% | 4.1%(+3.80)#48 | 4.9%(+3.01)#5,785 |
| 49. | Fairfax | 7.7% | 4.1%(+3.62)#49 | 4.9%(+2.82)#6,019 |
| 50. | Miller | 7.7% | 4.1%(+3.59)#50 | 4.9%(+2.79)#6,042 |
| 51. | Blackhawk | 7.6% | 4.1%(+3.56)#51 | 4.9%(+2.77)#6,062 |
| 52. | Piedmont | 7.6% | 4.1%(+3.53)#52 | 4.9%(+2.73)#6,102 |
| 53. | Burke | 7.6% | 4.1%(+3.52)#53 | 4.9%(+2.72)#6,115 |
| 54. | Lake Preston | 7.6% | 4.1%(+3.50)#54 | 4.9%(+2.70)#6,137 |
| 55. | Waubay | 7.3% | 4.1%(+3.22)#55 | 4.9%(+2.42)#6,474 |
| 56. | Selby | 7.2% | 4.1%(+3.15)#56 | 4.9%(+2.36)#6,541 |
| 57. | White Lake | 7.1% | 4.1%(+3.07)#57 | 4.9%(+2.27)#6,652 |
| 58. | North Sioux City | 6.8% | 4.1%(+2.77)#58 | 4.9%(+1.97)#7,095 |
| 59. | Alcester | 6.8% | 4.1%(+2.69)#59 | 4.9%(+1.89)#7,203 |
| 60. | Ramona | 6.7% | 4.1%(+2.59)#60 | 4.9%(+1.79)#7,354 |
| 61. | Leola | 6.6% | 4.1%(+2.48)#61 | 4.9%(+1.69)#7,511 |
| 62. | Huron | 6.5% | 4.1%(+2.39)#62 | 4.9%(+1.59)#7,644 |
| 63. | Jefferson | 6.3% | 4.1%(+2.23)#63 | 4.9%(+1.43)#7,882 |
| 64. | Colton | 6.2% | 4.1%(+2.18)#64 | 4.9%(+1.38)#7,964 |
| 65. | Dante | 6.2% | 4.1%(+2.18)#65 | 4.9%(+1.38)#8,006 |
| 66. | Dell Rapids | 6.2% | 4.1%(+2.13)#66 | 4.9%(+1.33)#8,064 |
| 67. | Belle Fourche | 6.1% | 4.1%(+2.02)#67 | 4.9%(+1.23)#8,218 |
| 68. | Wessington Springs | 5.9% | 4.1%(+1.81)#68 | 4.9%(+1.01)#8,607 |
| 69. | Brookings | 5.8% | 4.1%(+1.69)#69 | 4.9%(+0.895)#8,843 |
| 70. | Rapid City | 5.7% | 4.1%(+1.67)#70 | 4.9%(+0.871)#8,881 |
| 71. | Martin | 5.6% | 4.1%(+1.55)#71 | 4.9%(+0.756)#9,108 |
| 72. | Gary | 5.6% | 4.1%(+1.48)#72 | 4.9%(+0.683)#9,267 |
| 73. | Oelrichs | 5.6% | 4.1%(+1.48)#73 | 4.9%(+0.683)#9,269 |
| 74. | Wentworth | 5.6% | 4.1%(+1.48)#74 | 4.9%(+0.683)#9,273 |
| 75. | Box Elder | 5.5% | 4.1%(+1.45)#75 | 4.9%(+0.650)#9,327 |
| 76. | Elk Point | 5.5% | 4.1%(+1.41)#76 | 4.9%(+0.607)#9,403 |
| 77. | Crooks | 5.3% | 4.1%(+1.22)#77 | 4.9%(+0.424)#9,767 |
| 78. | Hayti | 5.3% | 4.1%(+1.19)#78 | 4.9%(+0.391)#9,842 |
| 79. | Faith | 5.3% | 4.1%(+1.19)#79 | 4.9%(+0.391)#9,846 |
| 80. | Bushnell | 5.3% | 4.1%(+1.19)#80 | 4.9%(+0.391)#9,869 |
| 81. | Vermillion | 5.1% | 4.1%(+1.06)#81 | 4.9%(+0.258)#10,120 |
| 82. | Sturgis | 5.1% | 4.1%(+0.992)#82 | 4.9%(+0.194)#10,261 |
| 83. | Brandon | 4.8% | 4.1%(+0.746)#83 | 4.9%(-0.052)#10,823 |
| 84. | Marion | 4.7% | 4.1%(+0.643)#84 | 4.9%(-0.155)#11,084 |
| 85. | Montrose | 4.7% | 4.1%(+0.632)#85 | 4.9%(-0.166)#11,101 |
| 86. | Fort Pierre | 4.7% | 4.1%(+0.610)#86 | 4.9%(-0.187)#11,157 |
| 87. | Flandreau | 4.6% | 4.1%(+0.510)#87 | 4.9%(-0.288)#11,390 |
| 88. | Hot Springs | 4.6% | 4.1%(+0.496)#88 | 4.9%(-0.302)#11,414 |
| 89. | Watertown | 4.6% | 4.1%(+0.479)#89 | 4.9%(-0.319)#11,436 |
| 90. | Deadwood | 4.5% | 4.1%(+0.420)#90 | 4.9%(-0.378)#11,565 |
| 91. | Howard | 4.4% | 4.1%(+0.338)#91 | 4.9%(-0.460)#11,763 |
| 92. | Castlewood | 4.4% | 4.1%(+0.338)#92 | 4.9%(-0.460)#11,768 |
| 93. | Arlington | 4.4% | 4.1%(+0.328)#93 | 4.9%(-0.470)#11,784 |
| 94. | Valley Springs | 4.2% | 4.1%(+0.092)#94 | 4.9%(-0.705)#12,347 |
| 95. | Northville | 4.2% | 4.1%(+0.092)#95 | 4.9%(-0.705)#12,375 |
| 96. | Canton | 4.1% | 4.1%(+0.053)#96 | 4.9%(-0.745)#12,463 |
| 97. | Sioux Falls | 4.1% | 4.1%(+0.031)#97 | 4.9%(-0.767)#12,510 |
| 98. | Spearfish | 4.0% | 4.1%(-0.025)#98 | 4.9%(-0.823)#12,615 |
| 99. | Tea | 4.0% | 4.1%(-0.045)#99 | 4.9%(-0.843)#12,664 |
| 100. | Oahe Acres | 4.0% | 4.1%(-0.114)#100 | 4.9%(-0.912)#12,819 |
Common Questions
What are the Top 10 Cities with the Highest Percentage of Population with a Degree in Liberal Arts and History in South Dakota?
Top 10 Cities with the Highest Percentage of Population with a Degree in Liberal Arts and History in South Dakota are:
What city has the Highest Percentage of Population with a Degree in Liberal Arts and History in South Dakota?
Winfred has the Highest Percentage of Population with a Degree in Liberal Arts and History in South Dakota with 100.0%.
What is the Percentage of Population with a Degree in Liberal Arts and History in the State of South Dakota?
Percentage of Population with a Degree in Liberal Arts and History in South Dakota is 4.1%.
What is the Percentage of Population with a Degree in Liberal Arts and History in the United States?
Percentage of Population with a Degree in Liberal Arts and History in the United States is 4.9%.