Arlington, OR
Arlington Map
Arlington Overview
658
TOTAL POPULATION
321
MALE POPULATION
337
FEMALE POPULATION
95.25
MALES / 100 FEMALES
104.98
FEMALES / 100 MALES
39.8
MEDIAN AGE
3.6
AVG FAMILY SIZE
2.9
AVG HOUSEHOLD SIZE
$29,098
PER CAPITA INCOME
$85,625
AVG FAMILY INCOME
$70,577
AVG HOUSEHOLD INCOME
42.8%
WAGE / INCOME GAP [ % ]
57.2¢/ $1
WAGE / INCOME GAP [ $ ]
0.41
INEQUALITY / GINI INDEX
310
LABOR FORCE [ PEOPLE ]
59.8%
PERCENT IN LABOR FORCE
6.8%
UNEMPLOYMENT RATE
Arlington Zip Codes
Arlington Area Codes
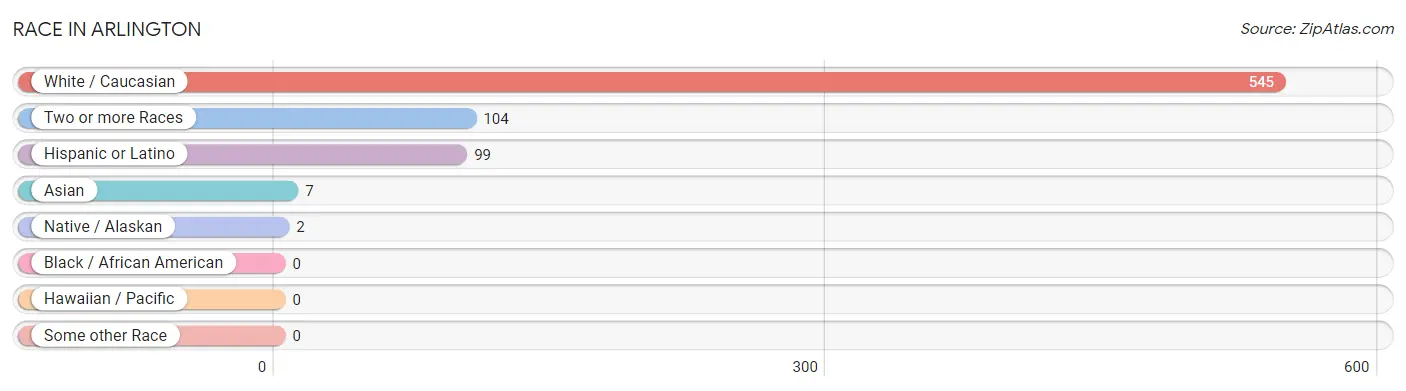
Race in Arlington
The most populous races in Arlington are White / Caucasian (545 | 82.8%), Two or more Races (104 | 15.8%), and Hispanic or Latino (99 | 15.0%).
| Race | # Population | % Population |
| Asian | 7 | 1.1% |
| Black / African American | 0 | 0.0% |
| Hawaiian / Pacific | 0 | 0.0% |
| Hispanic or Latino | 99 | 15.0% |
| Native / Alaskan | 2 | 0.3% |
| White / Caucasian | 545 | 82.8% |
| Two or more Races | 104 | 15.8% |
| Some other Race | 0 | 0.0% |
| Total | 658 | 100.0% |
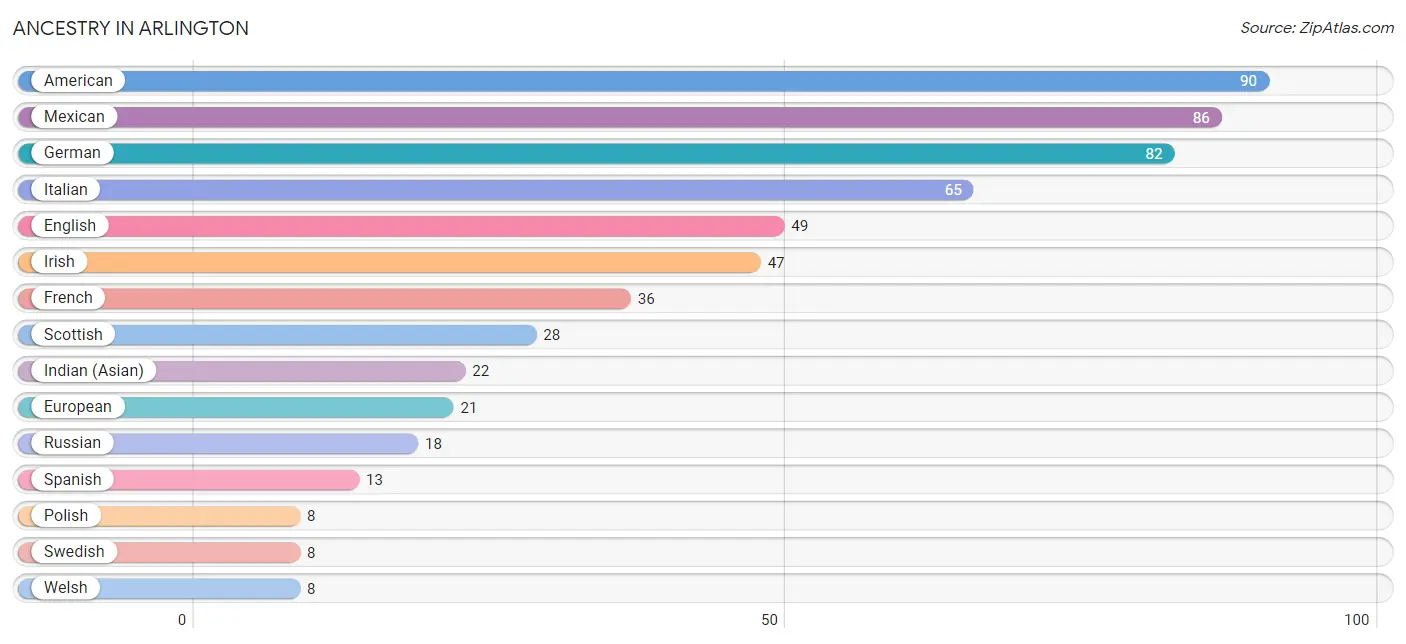
Ancestry in Arlington
The most populous ancestries reported in Arlington are American (90 | 13.7%), Mexican (86 | 13.1%), German (82 | 12.5%), Italian (65 | 9.9%), and English (49 | 7.4%), together accounting for 56.5% of all Arlington residents.
| Ancestry | # Population | % Population |
| American | 90 | 13.7% |
| Austrian | 7 | 1.1% |
| Cherokee | 3 | 0.5% |
| English | 49 | 7.4% |
| European | 21 | 3.2% |
| French | 36 | 5.5% |
| German | 82 | 12.5% |
| Indian (Asian) | 22 | 3.3% |
| Irish | 47 | 7.1% |
| Italian | 65 | 9.9% |
| Mexican | 86 | 13.1% |
| Norwegian | 6 | 0.9% |
| Polish | 8 | 1.2% |
| Russian | 18 | 2.7% |
| Scandinavian | 5 | 0.8% |
| Scottish | 28 | 4.3% |
| Spanish | 13 | 2.0% |
| Swedish | 8 | 1.2% |
| Welsh | 8 | 1.2% | View All 19 Rows |
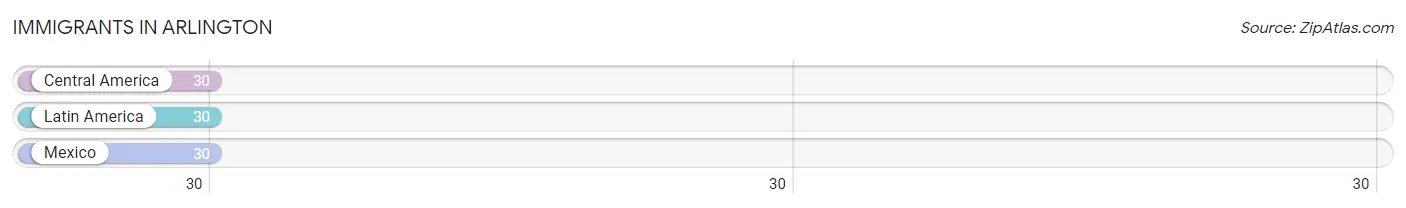
Immigrants in Arlington
The most numerous immigrant groups reported in Arlington came from Central America (30 | 4.6%), Latin America (30 | 4.6%), and Mexico (30 | 4.6%), together accounting for 13.7% of all Arlington residents.
| Immigration Origin | # Population | % Population |
| Central America | 30 | 4.6% |
| Latin America | 30 | 4.6% |
| Mexico | 30 | 4.6% | View All 3 Rows |
Sex and Age in Arlington
Sex and Age in Arlington
The most populous age groups in Arlington are 25 to 29 Years (44 | 13.7%) for men and 50 to 54 Years (43 | 12.8%) for women.
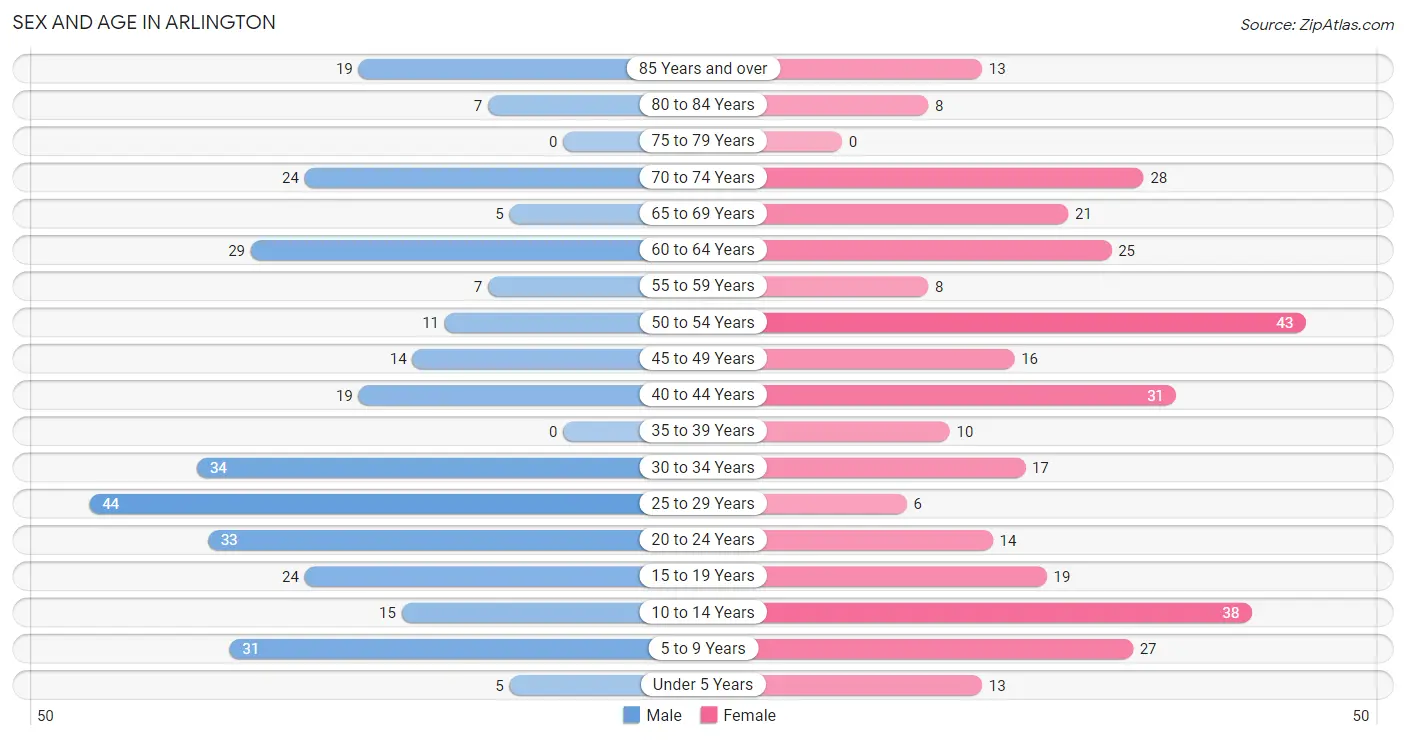
| Age Bracket | Male | Female |
| Under 5 Years | 5 (1.6%) | 13 (3.9%) |
| 5 to 9 Years | 31 (9.7%) | 27 (8.0%) |
| 10 to 14 Years | 15 (4.7%) | 38 (11.3%) |
| 15 to 19 Years | 24 (7.5%) | 19 (5.6%) |
| 20 to 24 Years | 33 (10.3%) | 14 (4.2%) |
| 25 to 29 Years | 44 (13.7%) | 6 (1.8%) |
| 30 to 34 Years | 34 (10.6%) | 17 (5.0%) |
| 35 to 39 Years | 0 (0.0%) | 10 (3.0%) |
| 40 to 44 Years | 19 (5.9%) | 31 (9.2%) |
| 45 to 49 Years | 14 (4.4%) | 16 (4.8%) |
| 50 to 54 Years | 11 (3.4%) | 43 (12.8%) |
| 55 to 59 Years | 7 (2.2%) | 8 (2.4%) |
| 60 to 64 Years | 29 (9.0%) | 25 (7.4%) |
| 65 to 69 Years | 5 (1.6%) | 21 (6.2%) |
| 70 to 74 Years | 24 (7.5%) | 28 (8.3%) |
| 75 to 79 Years | 0 (0.0%) | 0 (0.0%) |
| 80 to 84 Years | 7 (2.2%) | 8 (2.4%) |
| 85 Years and over | 19 (5.9%) | 13 (3.9%) |
| Total | 321 (100.0%) | 337 (100.0%) |
Families and Households in Arlington
Median Family Size in Arlington
The median family size in Arlington is 3.58 persons per family, with single male/father families (8 | 5.7%) accounting for the largest median family size of 5.63 persons per family. On the other hand, married-couple families (82 | 58.6%) represent the smallest median family size with 3.04 persons per family.
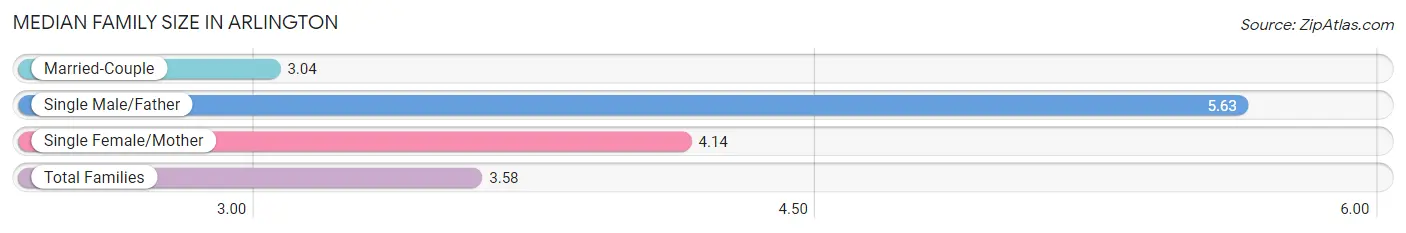
| Family Type | # Families | Family Size |
| Married-Couple | 82 (58.6%) | 3.04 |
| Single Male/Father | 8 (5.7%) | 5.63 |
| Single Female/Mother | 50 (35.7%) | 4.14 |
| Total Families | 140 (100.0%) | 3.58 |
Median Household Size in Arlington
The median household size in Arlington is 2.86 persons per household, with single male/father households (8 | 3.5%) accounting for the largest median household size of 6.75 persons per household. non-family households (90 | 39.1%) represent the smallest median household size with 1.09 persons per household.
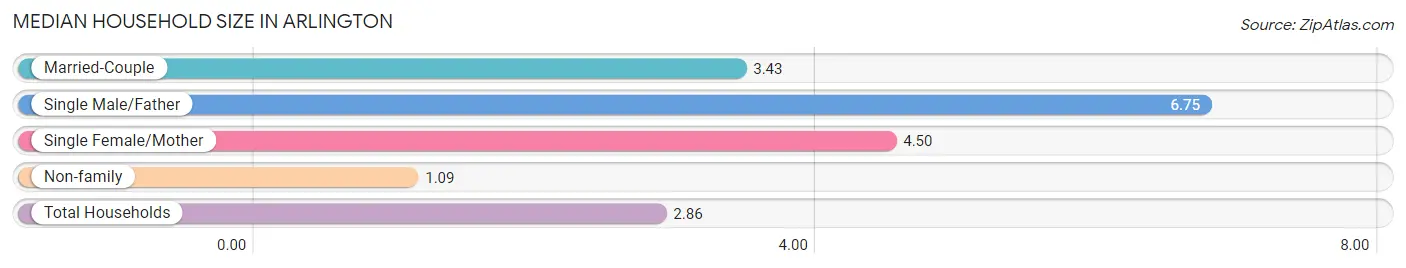
| Household Type | # Households | Household Size |
| Married-Couple | 82 (35.6%) | 3.43 |
| Single Male/Father | 8 (3.5%) | 6.75 |
| Single Female/Mother | 50 (21.7%) | 4.50 |
| Non-family | 90 (39.1%) | 1.09 |
| Total Households | 230 (100.0%) | 2.86 |
Household Size by Marriage Status in Arlington
Out of a total of 230 households in Arlington, 140 (60.9%) are family households, while 90 (39.1%) are nonfamily households. The most numerous type of family households are 2-person households, comprising 54, and the most common type of nonfamily households are 1-person households, comprising 85.
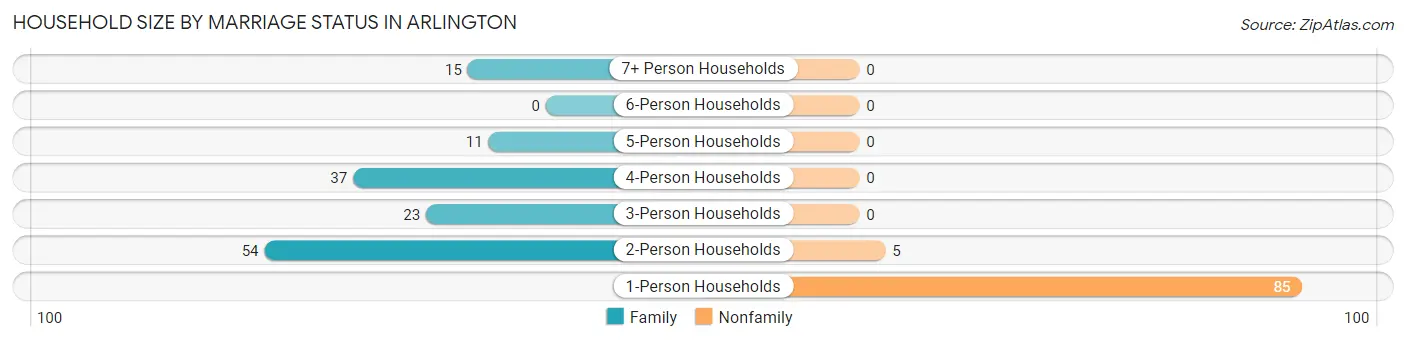
| Household Size | Family Households | Nonfamily Households |
| 1-Person Households | - | 85 (37.0%) |
| 2-Person Households | 54 (23.5%) | 5 (2.2%) |
| 3-Person Households | 23 (10.0%) | 0 (0.0%) |
| 4-Person Households | 37 (16.1%) | 0 (0.0%) |
| 5-Person Households | 11 (4.8%) | 0 (0.0%) |
| 6-Person Households | 0 (0.0%) | 0 (0.0%) |
| 7+ Person Households | 15 (6.5%) | 0 (0.0%) |
| Total | 140 (60.9%) | 90 (39.1%) |
Female Fertility in Arlington
Fertility by Age in Arlington
Average fertility rate in Arlington is 44.0 births per 1,000 women. Women in the age bracket of 20 to 34 years have the highest fertility rate with 162.0 births per 1,000 women. Women in the age bracket of 20 to 34 years acount for 100.0% of all women with births.
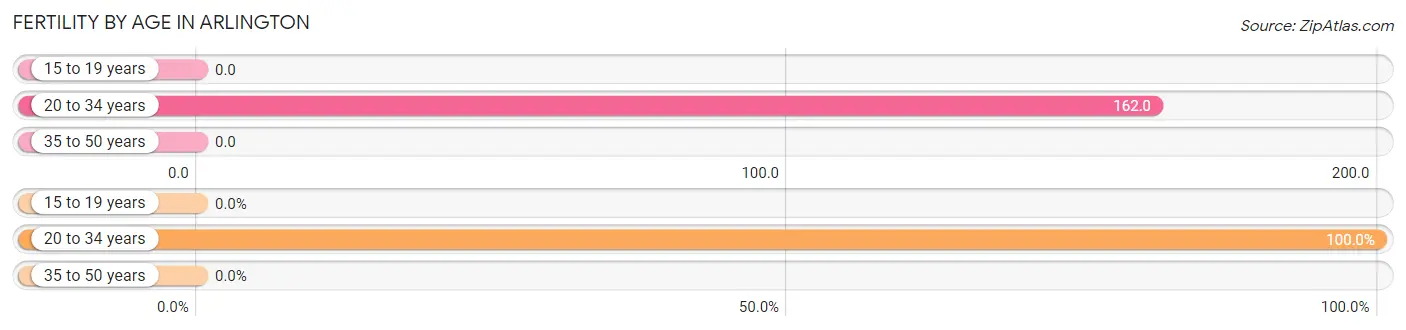
| Age Bracket | Women with Births | Births / 1,000 Women |
| 15 to 19 years | 0 (0.0%) | 0.0 |
| 20 to 34 years | 6 (100.0%) | 162.0 |
| 35 to 50 years | 0 (0.0%) | 0.0 |
| Total | 6 (100.0%) | 44.0 |
Fertility by Age by Marriage Status in Arlington
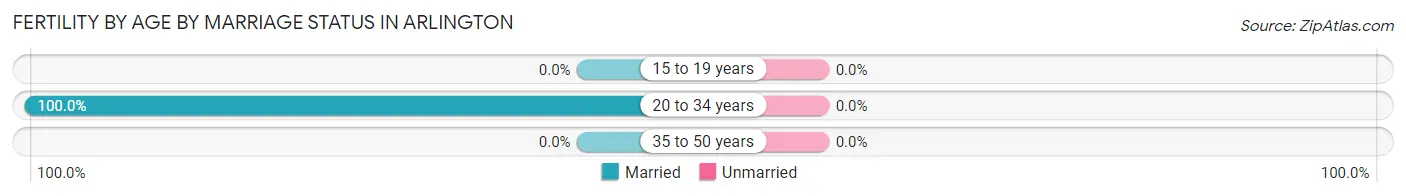
| Age Bracket | Married | Unmarried |
| 15 to 19 years | 0 (0.0%) | 0 (0.0%) |
| 20 to 34 years | 6 (100.0%) | 0 (0.0%) |
| 35 to 50 years | 0 (0.0%) | 0 (0.0%) |
| Total | 6 (100.0%) | 0 (0.0%) |
Fertility by Education in Arlington
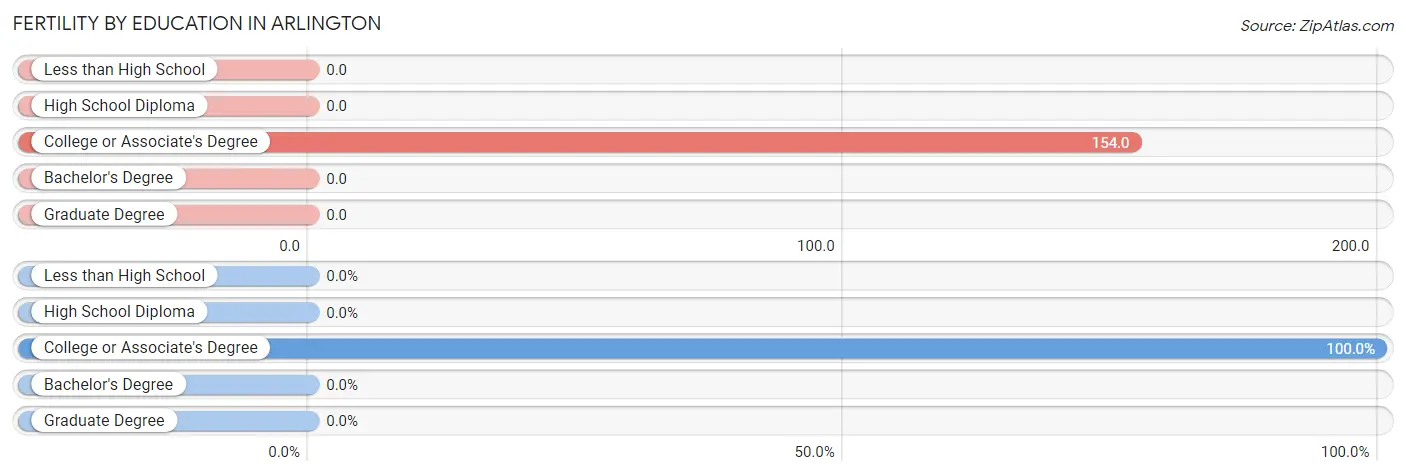
| Educational Attainment | Women with Births | Births / 1,000 Women |
| Less than High School | 0 (0.0%) | 0.0 |
| High School Diploma | 0 (0.0%) | 0.0 |
| College or Associate's Degree | 6 (100.0%) | 154.0 |
| Bachelor's Degree | 0 (0.0%) | 0.0 |
| Graduate Degree | 0 (0.0%) | 0.0 |
| Total | 6 (100.0%) | 44.0 |
Fertility by Education by Marriage Status in Arlington
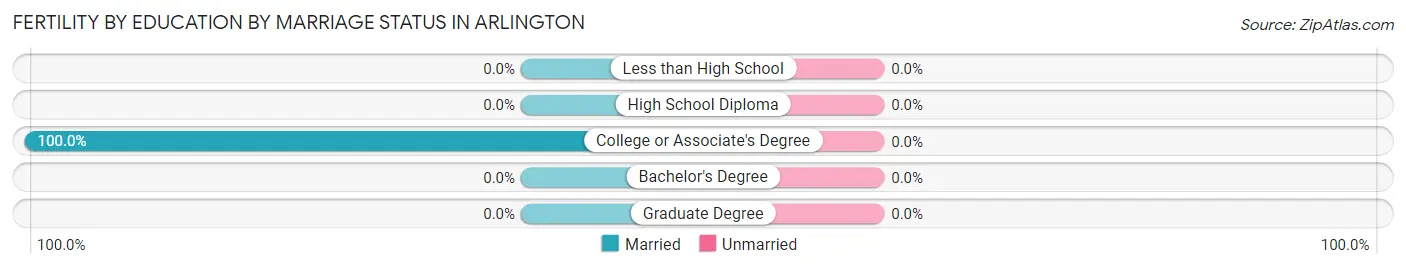
| Educational Attainment | Married | Unmarried |
| Less than High School | 0 (0.0%) | 0 (0.0%) |
| High School Diploma | 0 (0.0%) | 0 (0.0%) |
| College or Associate's Degree | 6 (100.0%) | 0 (0.0%) |
| Bachelor's Degree | 0 (0.0%) | 0 (0.0%) |
| Graduate Degree | 0 (0.0%) | 0 (0.0%) |
| Total | 6 (100.0%) | 0 (0.0%) |
Income in Arlington
Income Overview in Arlington
Per Capita Income in Arlington is $29,098, while median incomes of families and households are $85,625 and $70,577 respectively.
| Characteristic | Number | Measure |
| Per Capita Income | 658 | $29,098 |
| Median Family Income | 140 | $85,625 |
| Mean Family Income | 140 | $81,700 |
| Median Household Income | 230 | $70,577 |
| Mean Household Income | 230 | $75,672 |
| Income Deficit | 140 | $0 |
| Wage / Income Gap (%) | 658 | 42.77% |
| Wage / Income Gap ($) | 658 | 57.23¢ per $1 |
| Gini / Inequality Index | 658 | 0.41 |
Earnings by Sex in Arlington
Average Earnings in Arlington are $36,071, $40,625 for men and $23,250 for women, a difference of 42.8%.
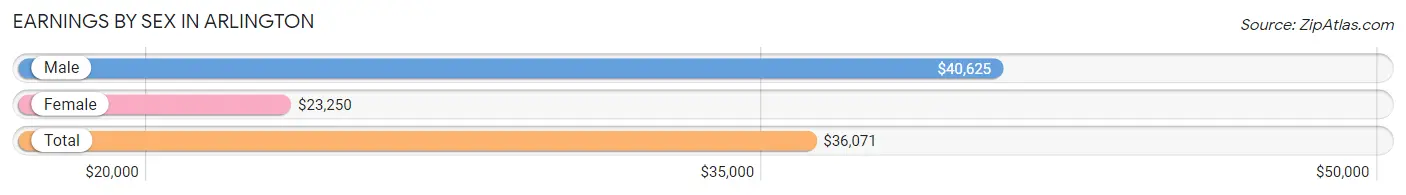
| Sex | Number | Average Earnings |
| Male | 192 (57.8%) | $40,625 |
| Female | 140 (42.2%) | $23,250 |
| Total | 332 (100.0%) | $36,071 |
Earnings by Sex by Income Bracket in Arlington
The most common earnings brackets in Arlington are $100,000+ for men (32 | 16.7%) and $2,499 or less for women (30 | 21.4%).
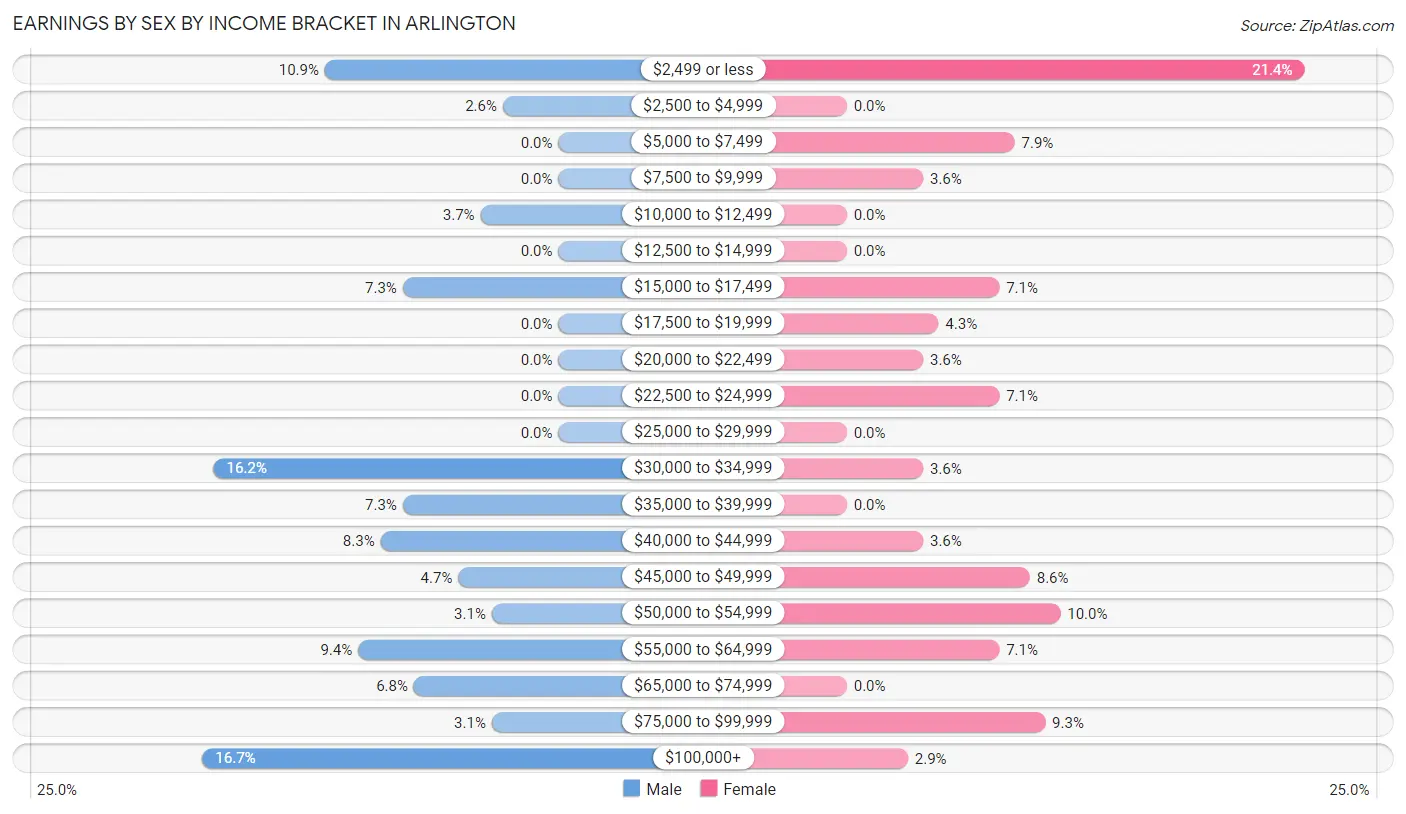
| Income | Male | Female |
| $2,499 or less | 21 (10.9%) | 30 (21.4%) |
| $2,500 to $4,999 | 5 (2.6%) | 0 (0.0%) |
| $5,000 to $7,499 | 0 (0.0%) | 11 (7.9%) |
| $7,500 to $9,999 | 0 (0.0%) | 5 (3.6%) |
| $10,000 to $12,499 | 7 (3.6%) | 0 (0.0%) |
| $12,500 to $14,999 | 0 (0.0%) | 0 (0.0%) |
| $15,000 to $17,499 | 14 (7.3%) | 10 (7.1%) |
| $17,500 to $19,999 | 0 (0.0%) | 6 (4.3%) |
| $20,000 to $22,499 | 0 (0.0%) | 5 (3.6%) |
| $22,500 to $24,999 | 0 (0.0%) | 10 (7.1%) |
| $25,000 to $29,999 | 0 (0.0%) | 0 (0.0%) |
| $30,000 to $34,999 | 31 (16.2%) | 5 (3.6%) |
| $35,000 to $39,999 | 14 (7.3%) | 0 (0.0%) |
| $40,000 to $44,999 | 16 (8.3%) | 5 (3.6%) |
| $45,000 to $49,999 | 9 (4.7%) | 12 (8.6%) |
| $50,000 to $54,999 | 6 (3.1%) | 14 (10.0%) |
| $55,000 to $64,999 | 18 (9.4%) | 10 (7.1%) |
| $65,000 to $74,999 | 13 (6.8%) | 0 (0.0%) |
| $75,000 to $99,999 | 6 (3.1%) | 13 (9.3%) |
| $100,000+ | 32 (16.7%) | 4 (2.9%) |
| Total | 192 (100.0%) | 140 (100.0%) |
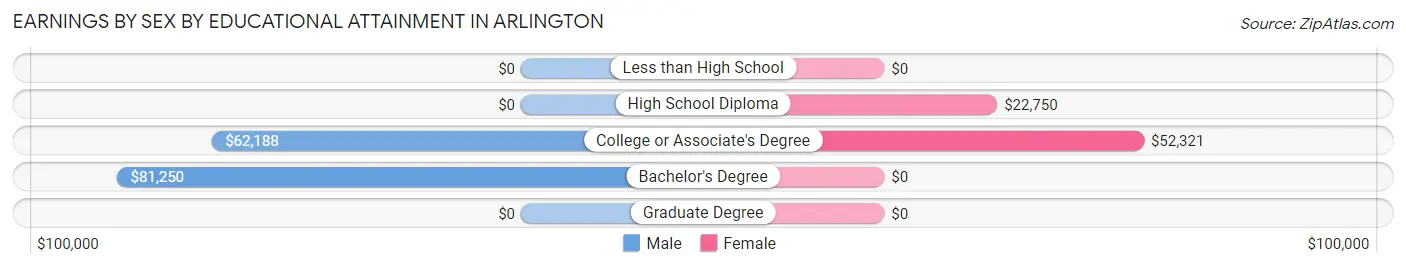
Earnings by Sex by Educational Attainment in Arlington
Average earnings in Arlington are $52,917 for men and $41,000 for women, a difference of 22.5%. Men with an educational attainment of bachelor's degree enjoy the highest average annual earnings of $81,250, while those with college or associate's degree education earn the least with $62,188. Women with an educational attainment of college or associate's degree earn the most with the average annual earnings of $52,321, while those with high school diploma education have the smallest earnings of $22,750.
| Educational Attainment | Male Income | Female Income |
| Less than High School | - | - |
| High School Diploma | - | - |
| College or Associate's Degree | $62,188 | $52,321 |
| Bachelor's Degree | $81,250 | $0 |
| Graduate Degree | - | - |
| Total | $52,917 | $41,000 |
Family Income in Arlington
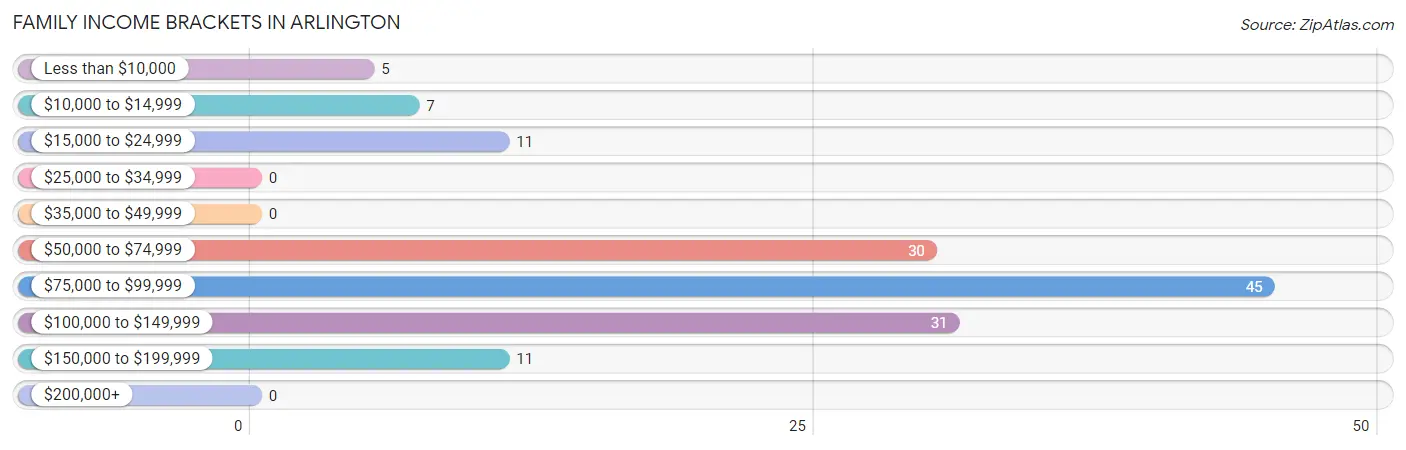
Family Income Brackets in Arlington
According to the Arlington family income data, there are 45 families falling into the $75,000 to $99,999 income range, which is the most common income bracket and makes up 32.1% of all families.
| Income Bracket | # Families | % Families |
| Less than $10,000 | 5 | 3.6% |
| $10,000 to $14,999 | 7 | 5.0% |
| $15,000 to $24,999 | 11 | 7.9% |
| $25,000 to $34,999 | 0 | 0.0% |
| $35,000 to $49,999 | 0 | 0.0% |
| $50,000 to $74,999 | 30 | 21.4% |
| $75,000 to $99,999 | 45 | 32.1% |
| $100,000 to $149,999 | 31 | 22.1% |
| $150,000 to $199,999 | 11 | 7.9% |
| $200,000+ | 0 | 0.0% |
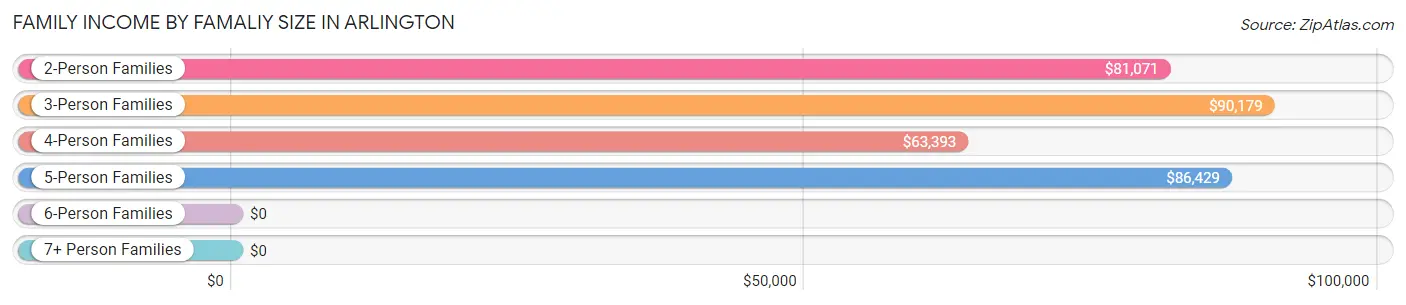
Family Income by Famaliy Size in Arlington
3-person families (35 | 25.0%) account for the highest median family income in Arlington with $90,179 per family, while 2-person families (54 | 38.6%) have the highest median income of $40,536 per family member.
| Income Bracket | # Families | Median Income |
| 2-Person Families | 54 (38.6%) | $81,071 |
| 3-Person Families | 35 (25.0%) | $90,179 |
| 4-Person Families | 25 (17.9%) | $63,393 |
| 5-Person Families | 18 (12.9%) | $86,429 |
| 6-Person Families | 0 (0.0%) | $0 |
| 7+ Person Families | 8 (5.7%) | $0 |
| Total | 140 (100.0%) | $85,625 |
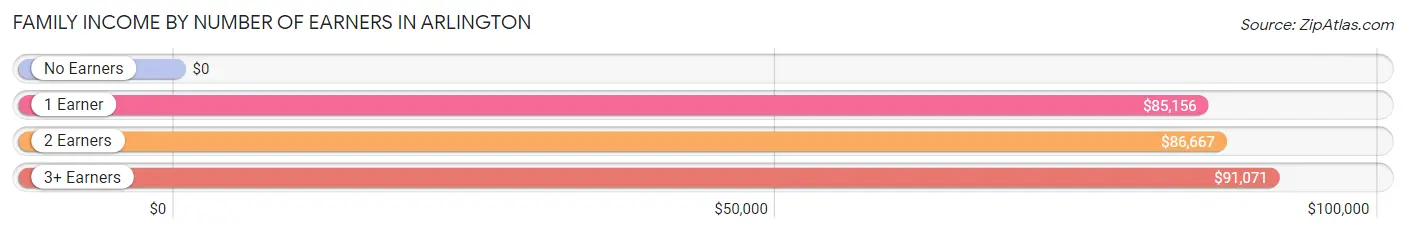
Family Income by Number of Earners in Arlington
| Number of Earners | # Families | Median Income |
| No Earners | 13 (9.3%) | $0 |
| 1 Earner | 41 (29.3%) | $85,156 |
| 2 Earners | 70 (50.0%) | $86,667 |
| 3+ Earners | 16 (11.4%) | $91,071 |
| Total | 140 (100.0%) | $85,625 |
Household Income in Arlington
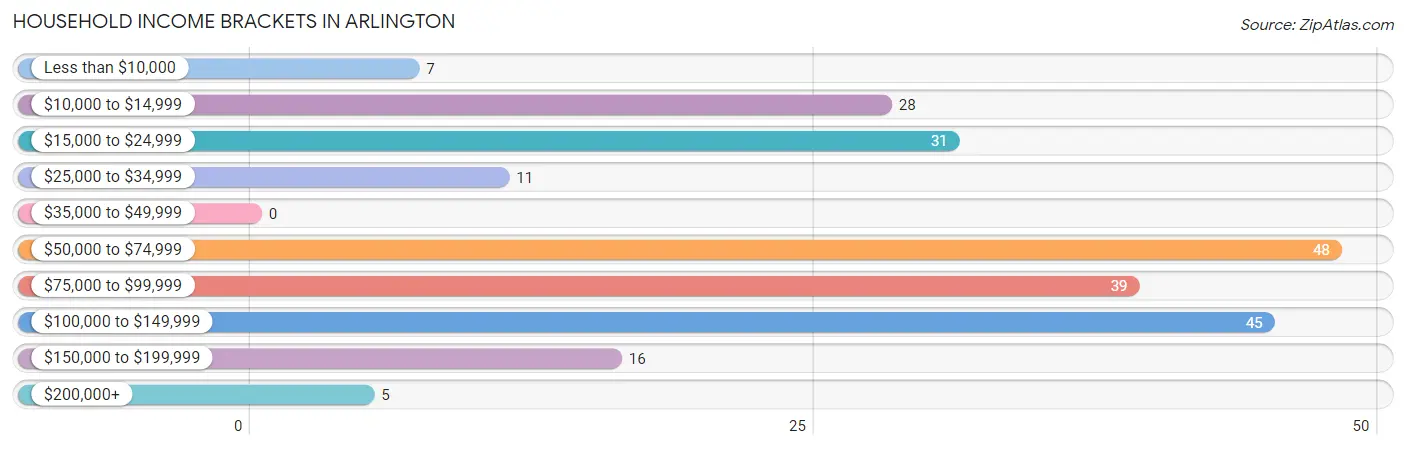
Household Income Brackets in Arlington
With 48 households falling in the category, the $50,000 to $74,999 income range is the most frequent in Arlington, accounting for 20.9% of all households.
| Income Bracket | # Households | % Households |
| Less than $10,000 | 7 | 3.0% |
| $10,000 to $14,999 | 28 | 12.2% |
| $15,000 to $24,999 | 31 | 13.5% |
| $25,000 to $34,999 | 11 | 4.8% |
| $35,000 to $49,999 | 0 | 0.0% |
| $50,000 to $74,999 | 48 | 20.9% |
| $75,000 to $99,999 | 39 | 17.0% |
| $100,000 to $149,999 | 45 | 19.6% |
| $150,000 to $199,999 | 16 | 7.0% |
| $200,000+ | 5 | 2.2% |
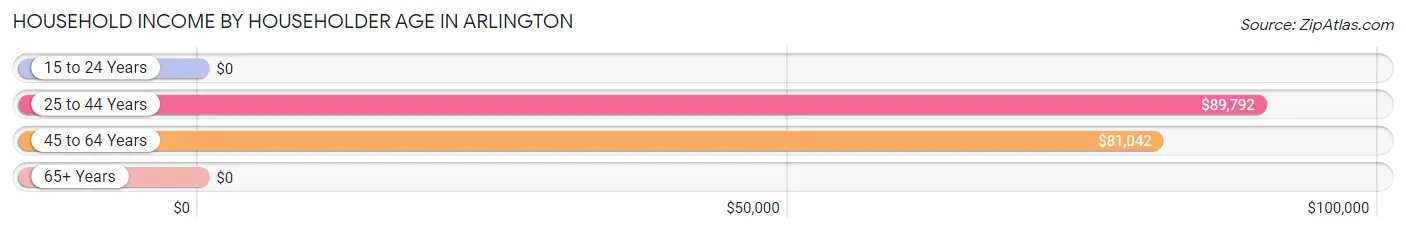
Household Income by Householder Age in Arlington
The median household income in Arlington is $70,577, with the highest median household income of $89,792 found in the 25 to 44 years age bracket for the primary householder. A total of 57 households (24.8%) fall into this category. Meanwhile, the 15 to 24 years age bracket for the primary householder has the lowest median household income of $0, with 4 households (1.7%) in this group.
| Income Bracket | # Households | Median Income |
| 15 to 24 Years | 4 (1.7%) | $0 |
| 25 to 44 Years | 57 (24.8%) | $89,792 |
| 45 to 64 Years | 97 (42.2%) | $81,042 |
| 65+ Years | 72 (31.3%) | $0 |
| Total | 230 (100.0%) | $70,577 |
Poverty in Arlington
Income Below Poverty by Sex and Age in Arlington
With 3.7% poverty level for males and 22.3% for females among the residents of Arlington, 55 to 64 year old males and 12 to 14 year old females are the most vulnerable to poverty, with 7 males (19.4%) and 15 females (50.0%) in their respective age groups living below the poverty level.
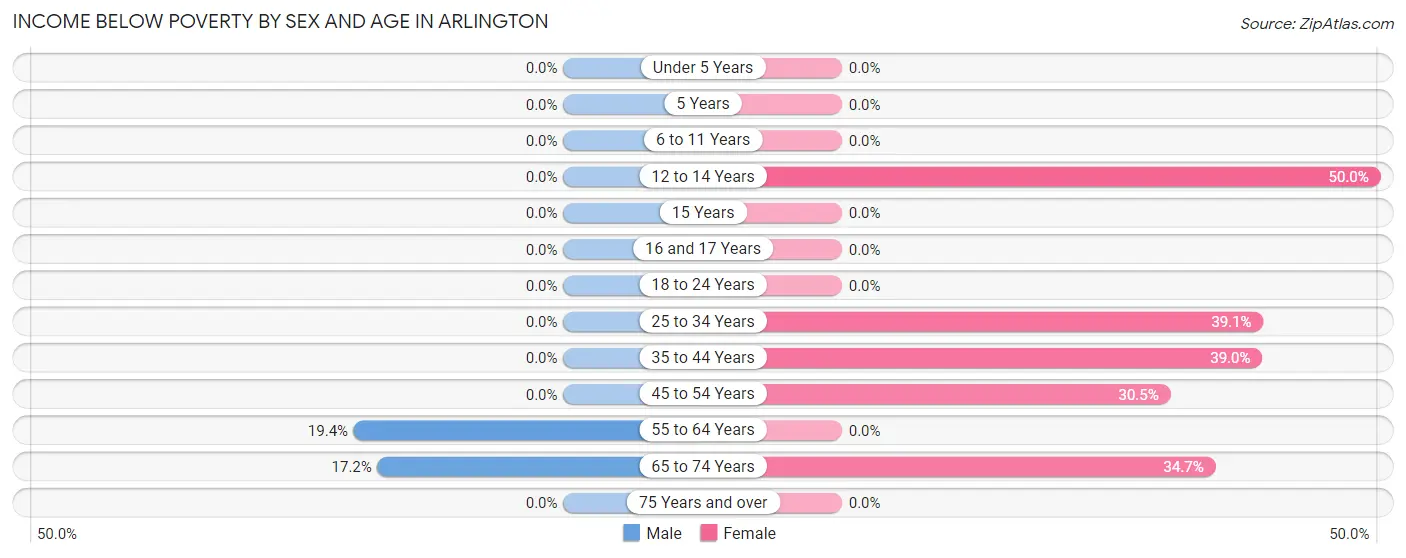
| Age Bracket | Male | Female |
| Under 5 Years | 0 (0.0%) | 0 (0.0%) |
| 5 Years | 0 (0.0%) | 0 (0.0%) |
| 6 to 11 Years | 0 (0.0%) | 0 (0.0%) |
| 12 to 14 Years | 0 (0.0%) | 15 (50.0%) |
| 15 Years | 0 (0.0%) | 0 (0.0%) |
| 16 and 17 Years | 0 (0.0%) | 0 (0.0%) |
| 18 to 24 Years | 0 (0.0%) | 0 (0.0%) |
| 25 to 34 Years | 0 (0.0%) | 9 (39.1%) |
| 35 to 44 Years | 0 (0.0%) | 16 (39.0%) |
| 45 to 54 Years | 0 (0.0%) | 18 (30.5%) |
| 55 to 64 Years | 7 (19.4%) | 0 (0.0%) |
| 65 to 74 Years | 5 (17.2%) | 17 (34.7%) |
| 75 Years and over | 0 (0.0%) | 0 (0.0%) |
| Total | 12 (3.7%) | 75 (22.3%) |
Income Above Poverty by Sex and Age in Arlington
According to the poverty statistics in Arlington, males aged under 5 years and females aged under 5 years are the age groups that are most secure financially, with 100.0% of males and 100.0% of females in these age groups living above the poverty line.
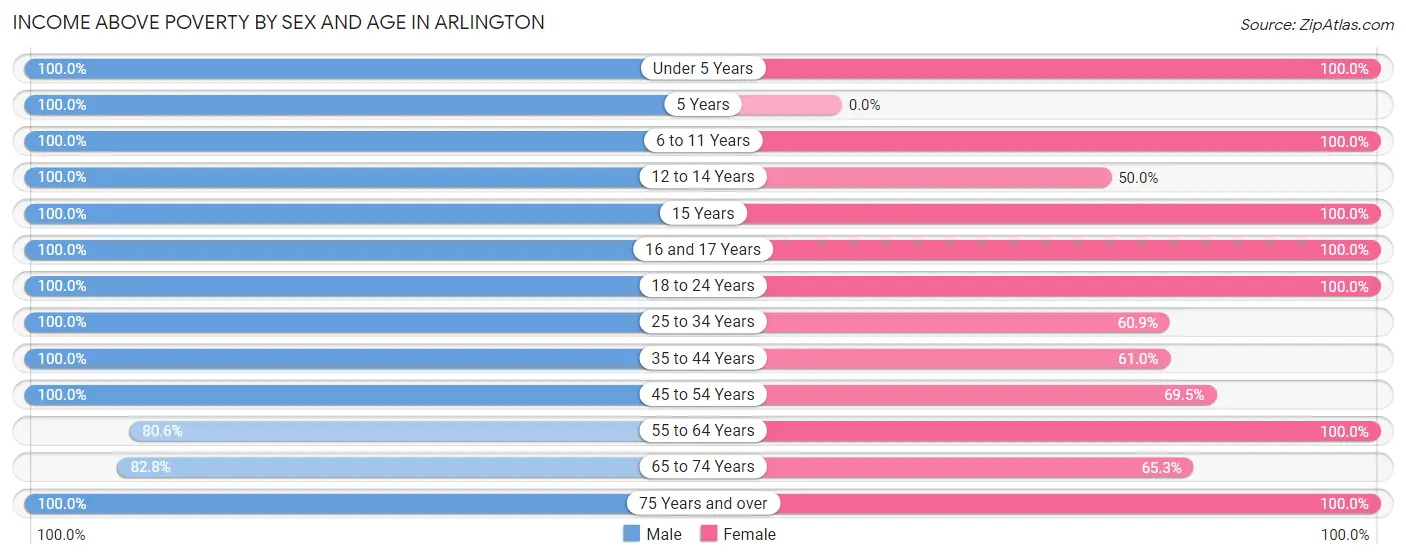
| Age Bracket | Male | Female |
| Under 5 Years | 5 (100.0%) | 13 (100.0%) |
| 5 Years | 11 (100.0%) | 0 (0.0%) |
| 6 to 11 Years | 20 (100.0%) | 35 (100.0%) |
| 12 to 14 Years | 15 (100.0%) | 15 (50.0%) |
| 15 Years | 6 (100.0%) | 5 (100.0%) |
| 16 and 17 Years | 18 (100.0%) | 14 (100.0%) |
| 18 to 24 Years | 33 (100.0%) | 14 (100.0%) |
| 25 to 34 Years | 78 (100.0%) | 14 (60.9%) |
| 35 to 44 Years | 19 (100.0%) | 25 (61.0%) |
| 45 to 54 Years | 25 (100.0%) | 41 (69.5%) |
| 55 to 64 Years | 29 (80.6%) | 33 (100.0%) |
| 65 to 74 Years | 24 (82.8%) | 32 (65.3%) |
| 75 Years and over | 26 (100.0%) | 21 (100.0%) |
| Total | 309 (96.3%) | 262 (77.7%) |
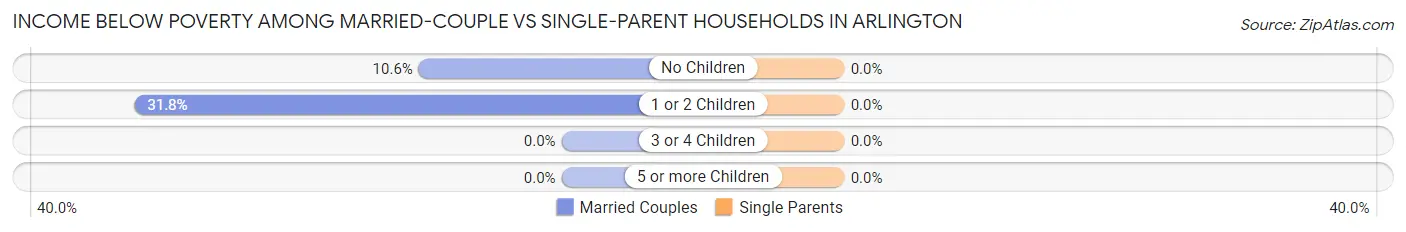
Income Below Poverty Among Married-Couple Families in Arlington
The poverty statistics for married-couple families in Arlington show that 14.6% or 12 of the total 82 families live below the poverty line. Families with 1 or 2 children have the highest poverty rate of 31.8%, comprising of 7 families. On the other hand, families with 3 or 4 children have the lowest poverty rate of 0.0%, which includes 0 families.
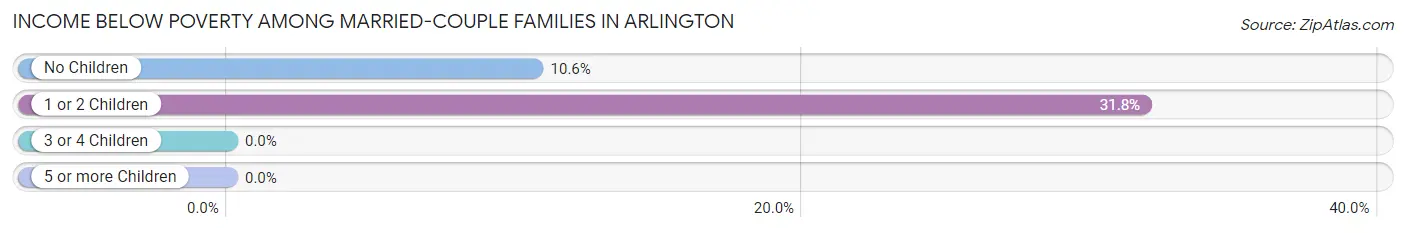
| Children | Above Poverty | Below Poverty |
| No Children | 42 (89.4%) | 5 (10.6%) |
| 1 or 2 Children | 15 (68.2%) | 7 (31.8%) |
| 3 or 4 Children | 13 (100.0%) | 0 (0.0%) |
| 5 or more Children | 0 (0.0%) | 0 (0.0%) |
| Total | 70 (85.4%) | 12 (14.6%) |
Income Below Poverty Among Single-Parent Households in Arlington
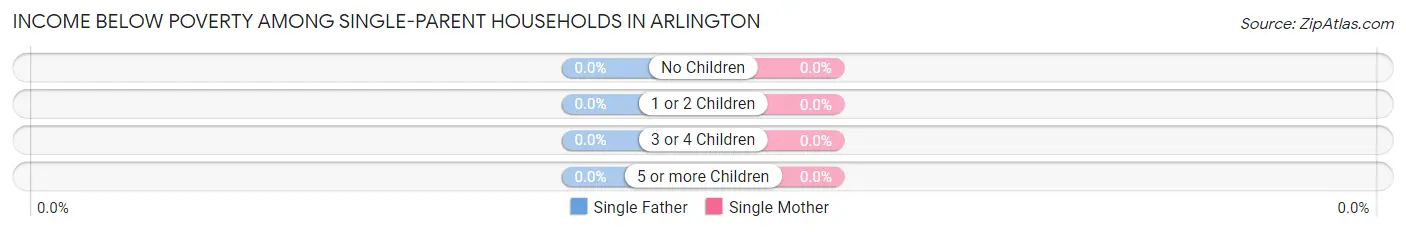
| Children | Single Father | Single Mother |
| No Children | 0 (0.0%) | 0 (0.0%) |
| 1 or 2 Children | 0 (0.0%) | 0 (0.0%) |
| 3 or 4 Children | 0 (0.0%) | 0 (0.0%) |
| 5 or more Children | 0 (0.0%) | 0 (0.0%) |
| Total | 0 (0.0%) | 0 (0.0%) |
Income Below Poverty Among Married-Couple vs Single-Parent Households in Arlington
| Children | Married-Couple Families | Single-Parent Households |
| No Children | 5 (10.6%) | 0 (0.0%) |
| 1 or 2 Children | 7 (31.8%) | 0 (0.0%) |
| 3 or 4 Children | 0 (0.0%) | 0 (0.0%) |
| 5 or more Children | 0 (0.0%) | 0 (0.0%) |
| Total | 12 (14.6%) | 0 (0.0%) |
Employment Characteristics in Arlington
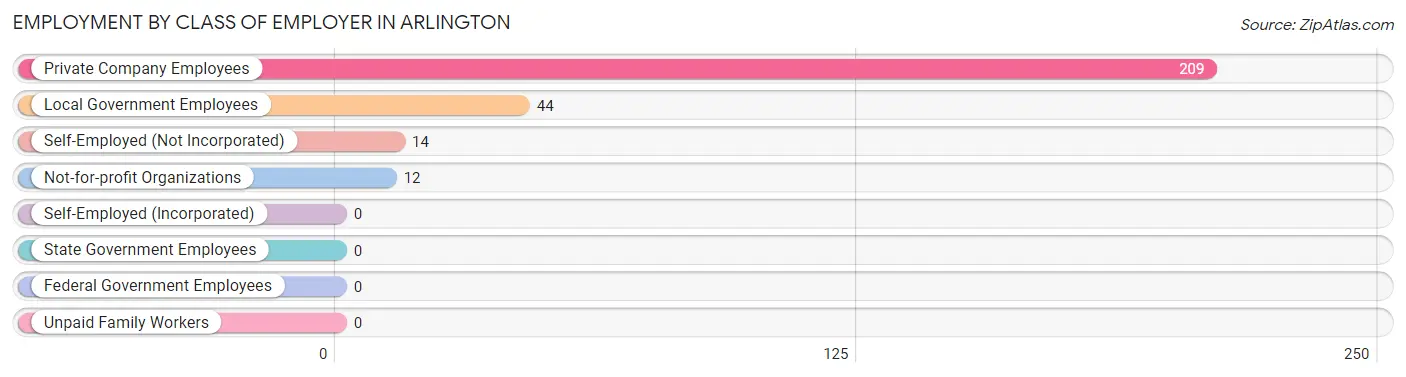
Employment by Class of Employer in Arlington
Among the 279 employed individuals in Arlington, private company employees (209 | 74.9%), local government employees (44 | 15.8%), and self-employed (not incorporated) (14 | 5.0%) make up the most common classes of employment.
| Employer Class | # Employees | % Employees |
| Private Company Employees | 209 | 74.9% |
| Self-Employed (Incorporated) | 0 | 0.0% |
| Self-Employed (Not Incorporated) | 14 | 5.0% |
| Not-for-profit Organizations | 12 | 4.3% |
| Local Government Employees | 44 | 15.8% |
| State Government Employees | 0 | 0.0% |
| Federal Government Employees | 0 | 0.0% |
| Unpaid Family Workers | 0 | 0.0% |
| Total | 279 | 100.0% |
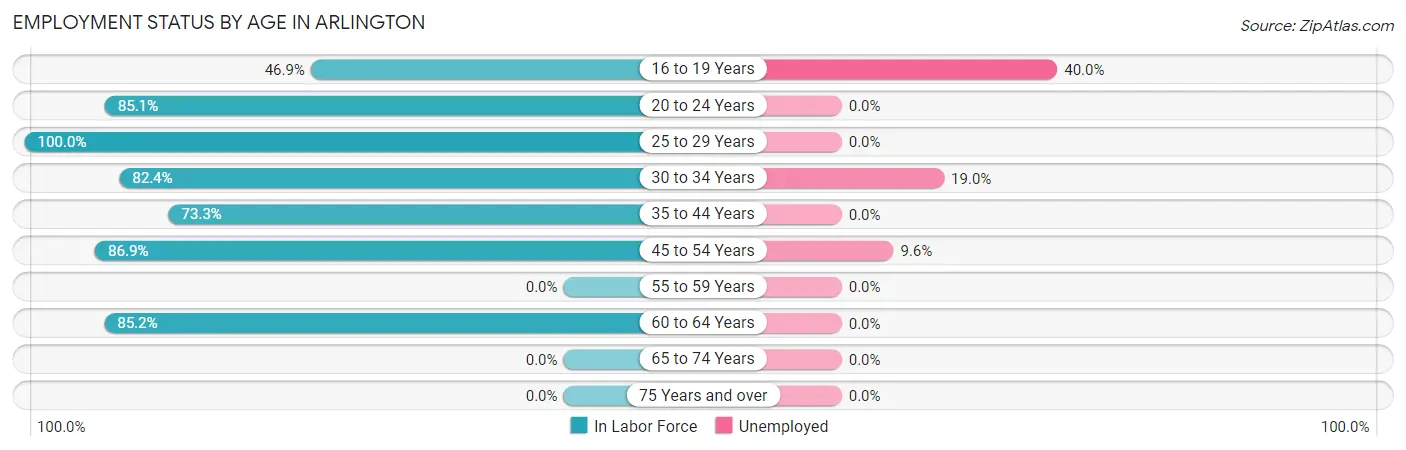
Employment Status by Age in Arlington
According to the labor force statistics for Arlington, out of the total population over 16 years of age (518), 59.8% or 310 individuals are in the labor force, with 6.8% or 21 of them unemployed. The age group with the highest labor force participation rate is 25 to 29 years, with 100.0% or 50 individuals in the labor force. Within the labor force, the 16 to 19 years age range has the highest percentage of unemployed individuals, with 40.0% or 6 of them being unemployed.
| Age Bracket | In Labor Force | Unemployed |
| 16 to 19 Years | 15 (46.9%) | 6 (40.0%) |
| 20 to 24 Years | 40 (85.1%) | 0 (0.0%) |
| 25 to 29 Years | 50 (100.0%) | 0 (0.0%) |
| 30 to 34 Years | 42 (82.4%) | 8 (19.0%) |
| 35 to 44 Years | 44 (73.3%) | 0 (0.0%) |
| 45 to 54 Years | 73 (86.9%) | 7 (9.6%) |
| 55 to 59 Years | 0 (0.0%) | 0 (0.0%) |
| 60 to 64 Years | 46 (85.2%) | 0 (0.0%) |
| 65 to 74 Years | 0 (0.0%) | 0 (0.0%) |
| 75 Years and over | 0 (0.0%) | 0 (0.0%) |
| Total | 310 (59.8%) | 21 (6.8%) |
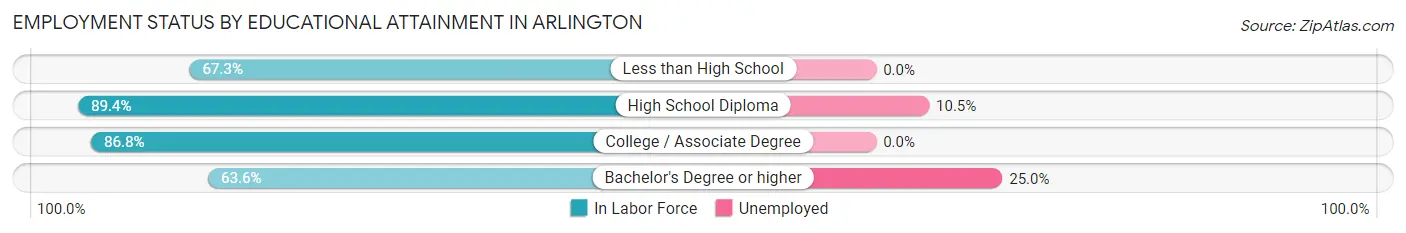
Employment Status by Educational Attainment in Arlington
According to labor force statistics for Arlington, 81.2% of individuals (255) out of the total population between 25 and 64 years of age (314) are in the labor force, with 5.9% or 15 of them being unemployed. The group with the highest labor force participation rate are those with the educational attainment of high school diploma, with 89.4% or 76 individuals in the labor force. Within the labor force, individuals with bachelor's degree or higher education have the highest percentage of unemployment, with 25.0% or 7 of them being unemployed.
| Educational Attainment | In Labor Force | Unemployed |
| Less than High School | 33 (67.3%) | 0 (0.0%) |
| High School Diploma | 76 (89.4%) | 9 (10.5%) |
| College / Associate Degree | 118 (86.8%) | 0 (0.0%) |
| Bachelor's Degree or higher | 28 (63.6%) | 11 (25.0%) |
| Total | 255 (81.2%) | 19 (5.9%) |
Employment Occupations by Sex in Arlington
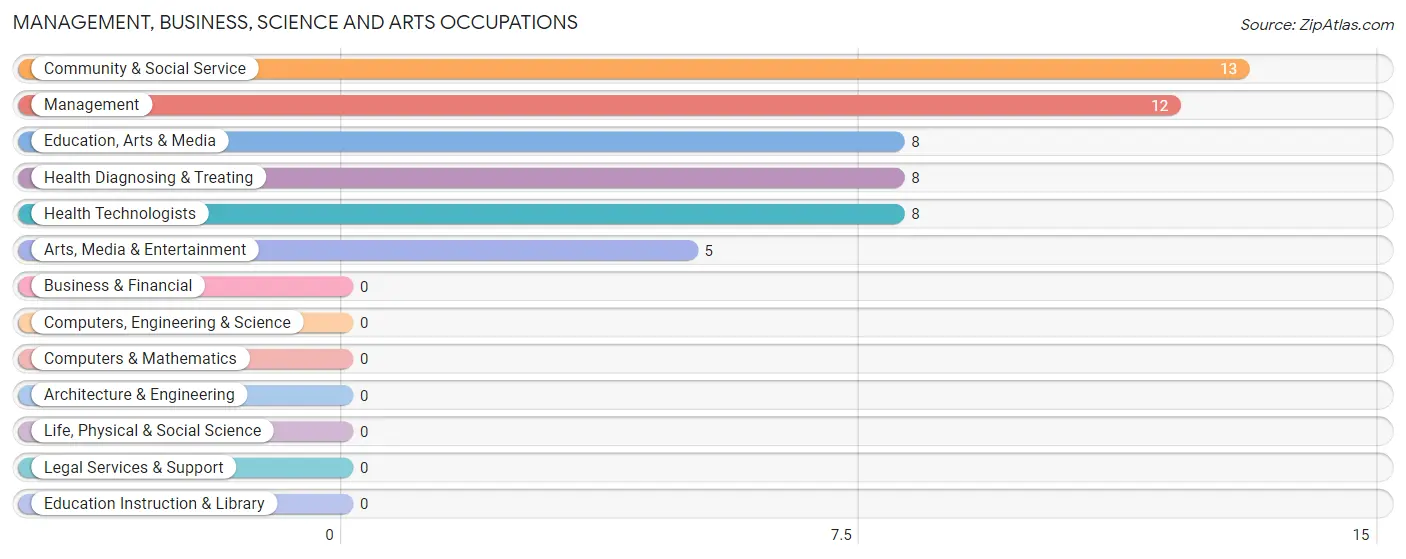
Management, Business, Science and Arts Occupations
The most common Management, Business, Science and Arts occupations in Arlington are Community & Social Service (13 | 4.5%), Management (12 | 4.2%), Education, Arts & Media (8 | 2.8%), Health Diagnosing & Treating (8 | 2.8%), and Health Technologists (8 | 2.8%).
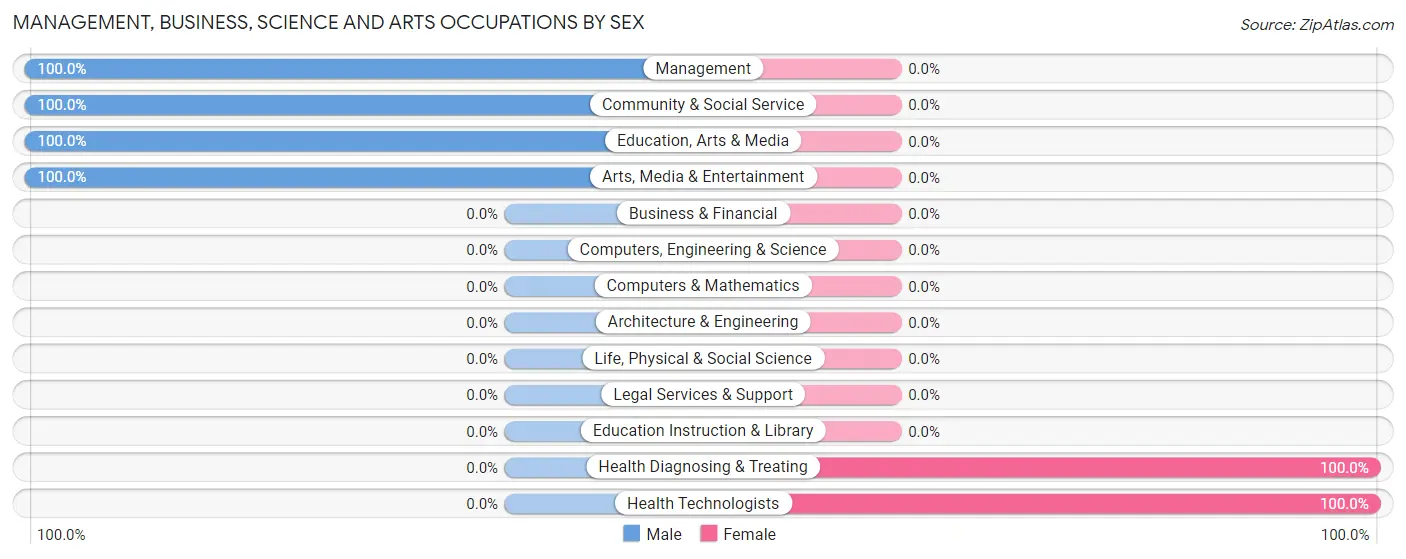
Management, Business, Science and Arts Occupations by Sex
Within the Management, Business, Science and Arts occupations in Arlington, the most male-oriented occupations are Management (100.0%), Community & Social Service (100.0%), and Education, Arts & Media (100.0%), while the most female-oriented occupations are Health Diagnosing & Treating (100.0%), and Health Technologists (100.0%).
| Occupation | Male | Female |
| Management | 12 (100.0%) | 0 (0.0%) |
| Business & Financial | 0 (0.0%) | 0 (0.0%) |
| Computers, Engineering & Science | 0 (0.0%) | 0 (0.0%) |
| Computers & Mathematics | 0 (0.0%) | 0 (0.0%) |
| Architecture & Engineering | 0 (0.0%) | 0 (0.0%) |
| Life, Physical & Social Science | 0 (0.0%) | 0 (0.0%) |
| Community & Social Service | 13 (100.0%) | 0 (0.0%) |
| Education, Arts & Media | 8 (100.0%) | 0 (0.0%) |
| Legal Services & Support | 0 (0.0%) | 0 (0.0%) |
| Education Instruction & Library | 0 (0.0%) | 0 (0.0%) |
| Arts, Media & Entertainment | 5 (100.0%) | 0 (0.0%) |
| Health Diagnosing & Treating | 0 (0.0%) | 8 (100.0%) |
| Health Technologists | 0 (0.0%) | 8 (100.0%) |
| Total (Category) | 25 (75.8%) | 8 (24.2%) |
| Total (Overall) | 169 (58.5%) | 120 (41.5%) |
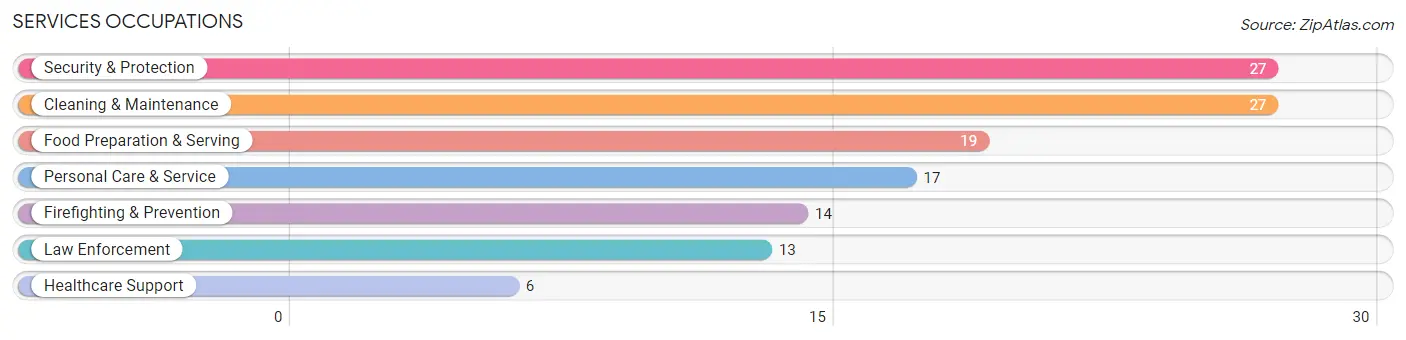
Services Occupations
The most common Services occupations in Arlington are Security & Protection (27 | 9.3%), Cleaning & Maintenance (27 | 9.3%), Food Preparation & Serving (19 | 6.6%), Personal Care & Service (17 | 5.9%), and Firefighting & Prevention (14 | 4.8%).
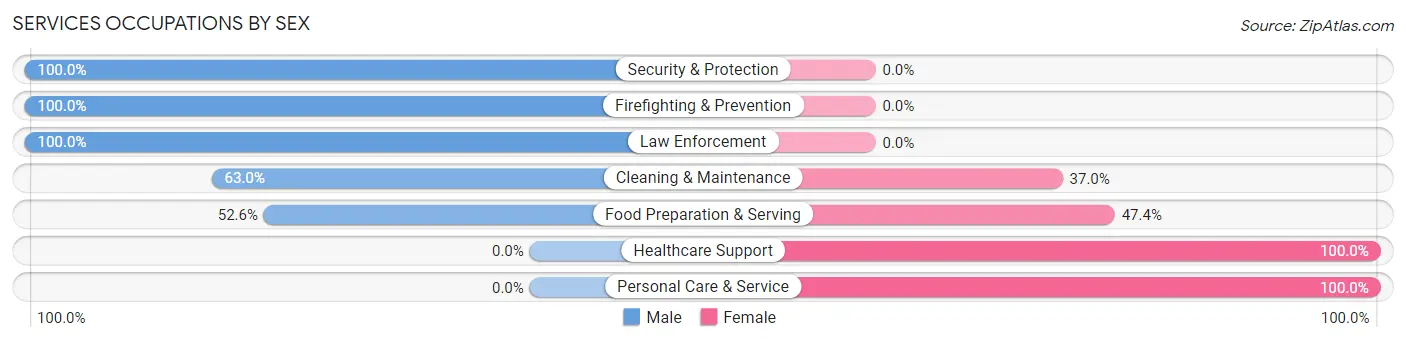
Services Occupations by Sex
Within the Services occupations in Arlington, the most male-oriented occupations are Security & Protection (100.0%), Firefighting & Prevention (100.0%), and Law Enforcement (100.0%), while the most female-oriented occupations are Healthcare Support (100.0%), Personal Care & Service (100.0%), and Food Preparation & Serving (47.4%).
| Occupation | Male | Female |
| Healthcare Support | 0 (0.0%) | 6 (100.0%) |
| Security & Protection | 27 (100.0%) | 0 (0.0%) |
| Firefighting & Prevention | 14 (100.0%) | 0 (0.0%) |
| Law Enforcement | 13 (100.0%) | 0 (0.0%) |
| Food Preparation & Serving | 10 (52.6%) | 9 (47.4%) |
| Cleaning & Maintenance | 17 (63.0%) | 10 (37.0%) |
| Personal Care & Service | 0 (0.0%) | 17 (100.0%) |
| Total (Category) | 54 (56.2%) | 42 (43.8%) |
| Total (Overall) | 169 (58.5%) | 120 (41.5%) |
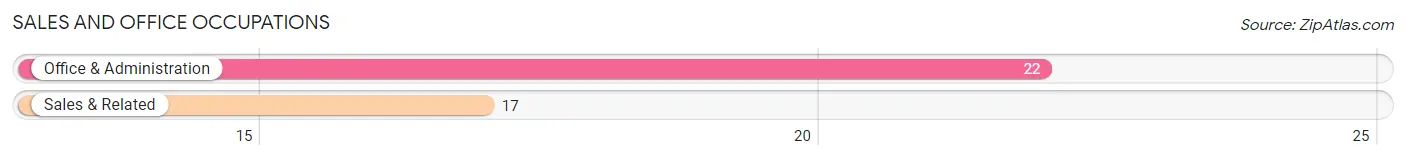
Sales and Office Occupations
The most common Sales and Office occupations in Arlington are Office & Administration (22 | 7.6%), and Sales & Related (17 | 5.9%).
Sales and Office Occupations by Sex
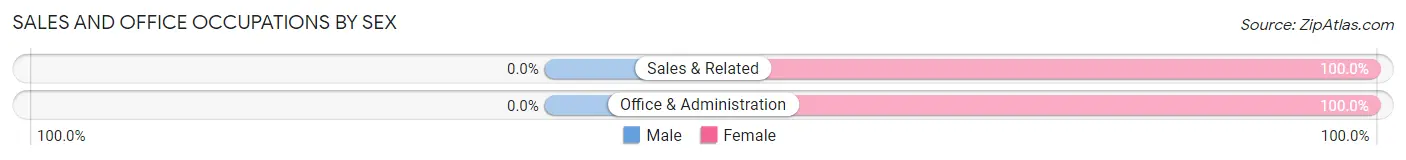
| Occupation | Male | Female |
| Sales & Related | 0 (0.0%) | 17 (100.0%) |
| Office & Administration | 0 (0.0%) | 22 (100.0%) |
| Total (Category) | 0 (0.0%) | 39 (100.0%) |
| Total (Overall) | 169 (58.5%) | 120 (41.5%) |
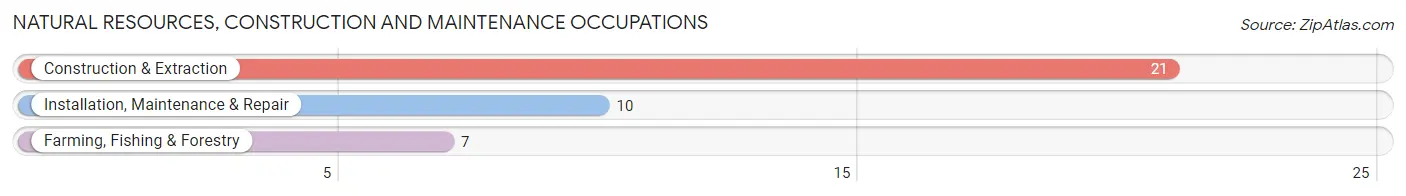
Natural Resources, Construction and Maintenance Occupations
The most common Natural Resources, Construction and Maintenance occupations in Arlington are Construction & Extraction (21 | 7.3%), Installation, Maintenance & Repair (10 | 3.5%), and Farming, Fishing & Forestry (7 | 2.4%).
Natural Resources, Construction and Maintenance Occupations by Sex
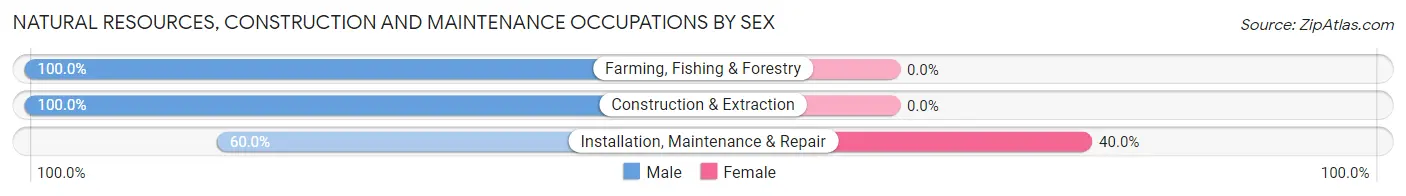
| Occupation | Male | Female |
| Farming, Fishing & Forestry | 7 (100.0%) | 0 (0.0%) |
| Construction & Extraction | 21 (100.0%) | 0 (0.0%) |
| Installation, Maintenance & Repair | 6 (60.0%) | 4 (40.0%) |
| Total (Category) | 34 (89.5%) | 4 (10.5%) |
| Total (Overall) | 169 (58.5%) | 120 (41.5%) |
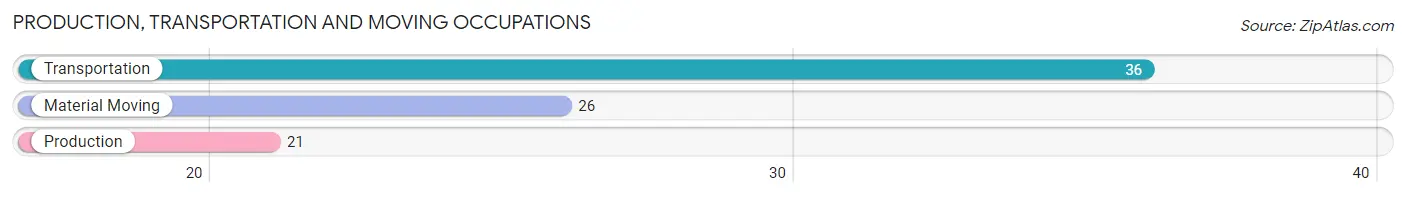
Production, Transportation and Moving Occupations
The most common Production, Transportation and Moving occupations in Arlington are Transportation (36 | 12.5%), Material Moving (26 | 9.0%), and Production (21 | 7.3%).
Production, Transportation and Moving Occupations by Sex
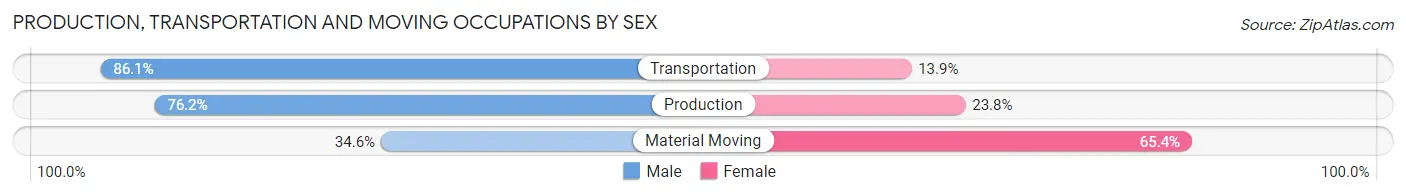
| Occupation | Male | Female |
| Production | 16 (76.2%) | 5 (23.8%) |
| Transportation | 31 (86.1%) | 5 (13.9%) |
| Material Moving | 9 (34.6%) | 17 (65.4%) |
| Total (Category) | 56 (67.5%) | 27 (32.5%) |
| Total (Overall) | 169 (58.5%) | 120 (41.5%) |
Employment Industries by Sex in Arlington
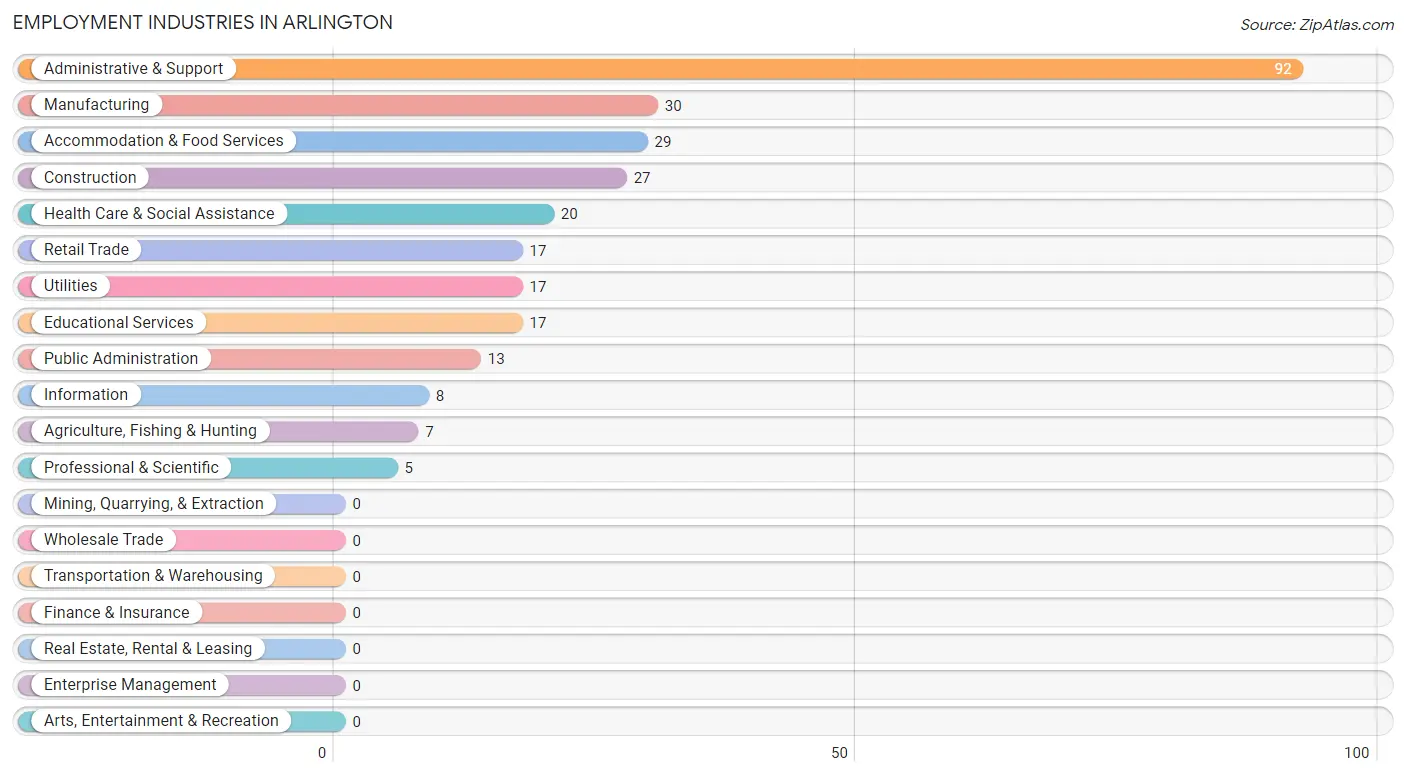
Employment Industries in Arlington
The major employment industries in Arlington include Administrative & Support (92 | 31.8%), Manufacturing (30 | 10.4%), Accommodation & Food Services (29 | 10.0%), Construction (27 | 9.3%), and Health Care & Social Assistance (20 | 6.9%).
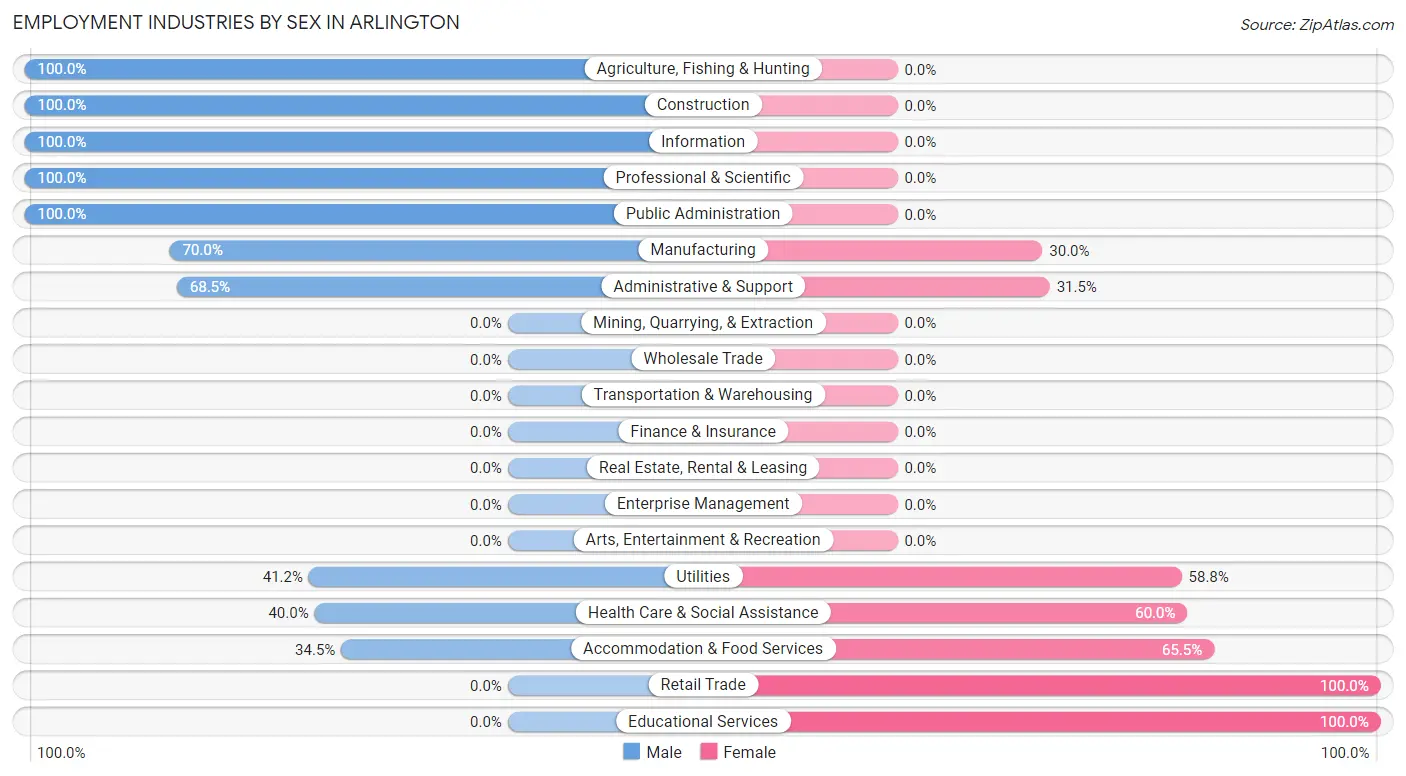
Employment Industries by Sex in Arlington
The Arlington industries that see more men than women are Agriculture, Fishing & Hunting (100.0%), Construction (100.0%), and Information (100.0%), whereas the industries that tend to have a higher number of women are Retail Trade (100.0%), Educational Services (100.0%), and Accommodation & Food Services (65.5%).
| Industry | Male | Female |
| Agriculture, Fishing & Hunting | 7 (100.0%) | 0 (0.0%) |
| Mining, Quarrying, & Extraction | 0 (0.0%) | 0 (0.0%) |
| Construction | 27 (100.0%) | 0 (0.0%) |
| Manufacturing | 21 (70.0%) | 9 (30.0%) |
| Wholesale Trade | 0 (0.0%) | 0 (0.0%) |
| Retail Trade | 0 (0.0%) | 17 (100.0%) |
| Transportation & Warehousing | 0 (0.0%) | 0 (0.0%) |
| Utilities | 7 (41.2%) | 10 (58.8%) |
| Information | 8 (100.0%) | 0 (0.0%) |
| Finance & Insurance | 0 (0.0%) | 0 (0.0%) |
| Real Estate, Rental & Leasing | 0 (0.0%) | 0 (0.0%) |
| Professional & Scientific | 5 (100.0%) | 0 (0.0%) |
| Enterprise Management | 0 (0.0%) | 0 (0.0%) |
| Administrative & Support | 63 (68.5%) | 29 (31.5%) |
| Educational Services | 0 (0.0%) | 17 (100.0%) |
| Health Care & Social Assistance | 8 (40.0%) | 12 (60.0%) |
| Arts, Entertainment & Recreation | 0 (0.0%) | 0 (0.0%) |
| Accommodation & Food Services | 10 (34.5%) | 19 (65.5%) |
| Public Administration | 13 (100.0%) | 0 (0.0%) |
| Total | 169 (58.5%) | 120 (41.5%) |
Education in Arlington
School Enrollment in Arlington
The most common levels of schooling among the 159 students in Arlington are high school (47 | 29.6%), elementary school (43 | 27.0%), and middle school (41 | 25.8%).
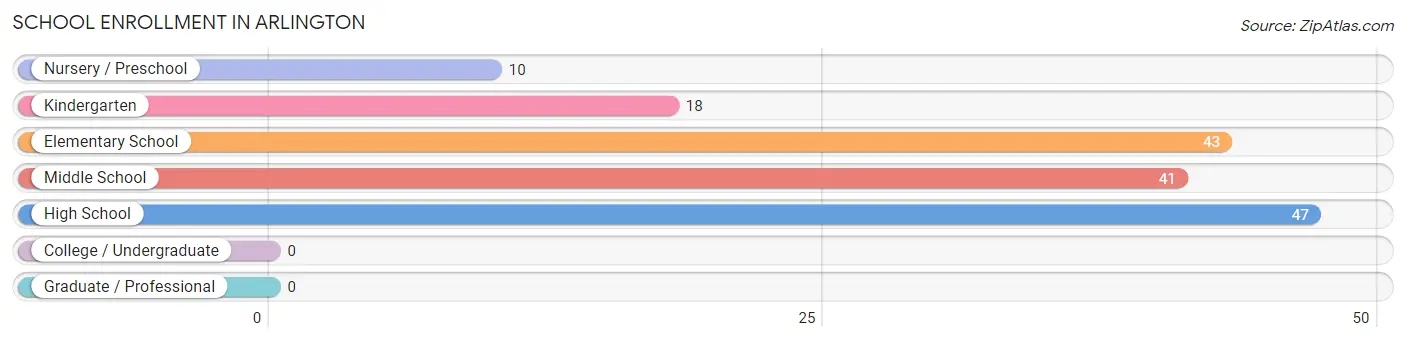
| School Level | # Students | % Students |
| Nursery / Preschool | 10 | 6.3% |
| Kindergarten | 18 | 11.3% |
| Elementary School | 43 | 27.0% |
| Middle School | 41 | 25.8% |
| High School | 47 | 29.6% |
| College / Undergraduate | 0 | 0.0% |
| Graduate / Professional | 0 | 0.0% |
| Total | 159 | 100.0% |
School Enrollment by Age by Funding Source in Arlington
Out of a total of 159 students who are enrolled in schools in Arlington, 15 (9.4%) attend a private institution, while the remaining 144 (90.6%) are enrolled in public schools. The age group of 10 to 14 year olds has the highest likelihood of being enrolled in private schools, with 15 (28.3% in the age bracket) enrolled. Conversely, the age group of 3 to 4 year olds has the lowest likelihood of being enrolled in a private school, with 5 (100.0% in the age bracket) attending a public institution.
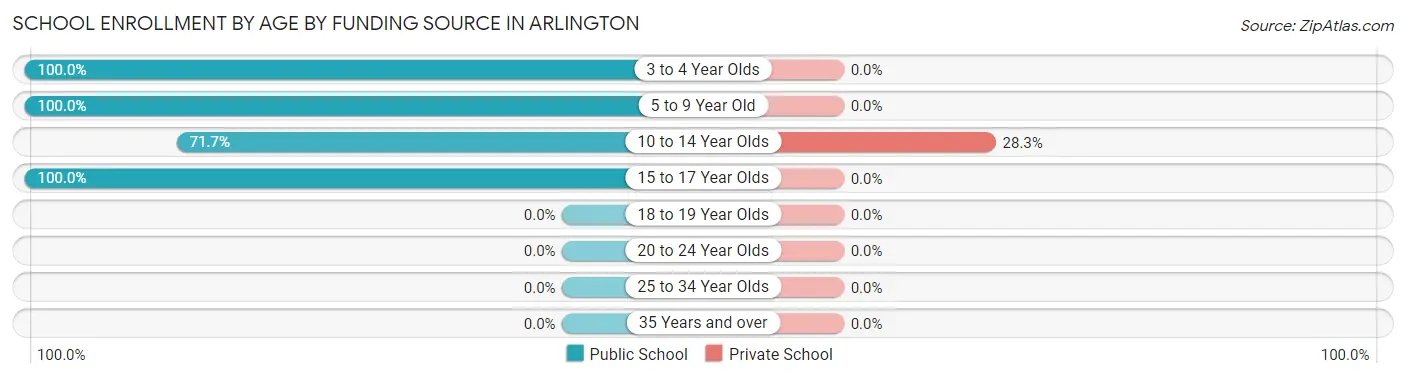
| Age Bracket | Public School | Private School |
| 3 to 4 Year Olds | 5 (100.0%) | 0 (0.0%) |
| 5 to 9 Year Old | 58 (100.0%) | 0 (0.0%) |
| 10 to 14 Year Olds | 38 (71.7%) | 15 (28.3%) |
| 15 to 17 Year Olds | 43 (100.0%) | 0 (0.0%) |
| 18 to 19 Year Olds | 0 (0.0%) | 0 (0.0%) |
| 20 to 24 Year Olds | 0 (0.0%) | 0 (0.0%) |
| 25 to 34 Year Olds | 0 (0.0%) | 0 (0.0%) |
| 35 Years and over | 0 (0.0%) | 0 (0.0%) |
| Total | 144 (90.6%) | 15 (9.4%) |
Educational Attainment by Field of Study in Arlington
Liberal arts & history (16 | 32.7%), psychology (8 | 16.3%), arts & humanities (8 | 16.3%), literature & languages (7 | 14.3%), and computers & mathematics (5 | 10.2%) are the most common fields of study among 49 individuals in Arlington who have obtained a bachelor's degree or higher.
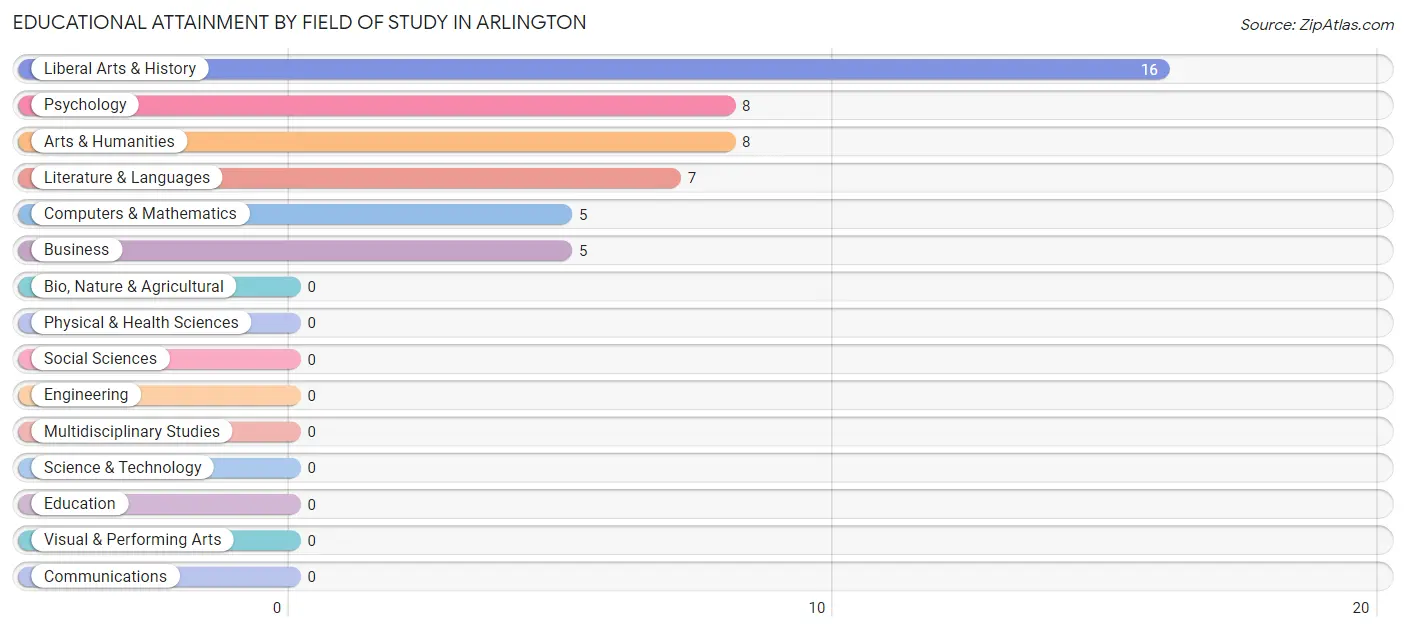
| Field of Study | # Graduates | % Graduates |
| Computers & Mathematics | 5 | 10.2% |
| Bio, Nature & Agricultural | 0 | 0.0% |
| Physical & Health Sciences | 0 | 0.0% |
| Psychology | 8 | 16.3% |
| Social Sciences | 0 | 0.0% |
| Engineering | 0 | 0.0% |
| Multidisciplinary Studies | 0 | 0.0% |
| Science & Technology | 0 | 0.0% |
| Business | 5 | 10.2% |
| Education | 0 | 0.0% |
| Literature & Languages | 7 | 14.3% |
| Liberal Arts & History | 16 | 32.7% |
| Visual & Performing Arts | 0 | 0.0% |
| Communications | 0 | 0.0% |
| Arts & Humanities | 8 | 16.3% |
| Total | 49 | 100.0% |
Transportation & Commute in Arlington
Vehicle Availability by Sex in Arlington
The most prevalent vehicle ownership categories in Arlington are males with 2 vehicles (85, accounting for 50.3%) and females with 2 vehicles (64, making up 77.3%).
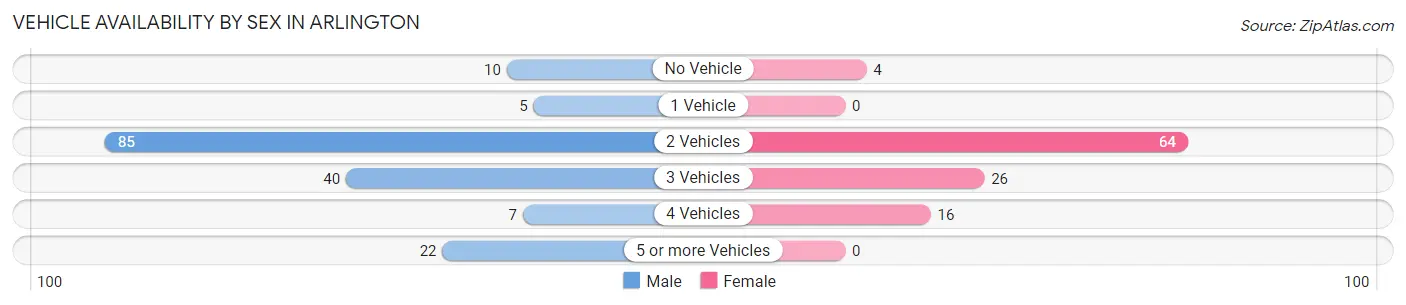
| Vehicles Available | Male | Female |
| No Vehicle | 10 (5.9%) | 4 (3.6%) |
| 1 Vehicle | 5 (3.0%) | 0 (0.0%) |
| 2 Vehicles | 85 (50.3%) | 64 (58.2%) |
| 3 Vehicles | 40 (23.7%) | 26 (23.6%) |
| 4 Vehicles | 7 (4.1%) | 16 (14.5%) |
| 5 or more Vehicles | 22 (13.0%) | 0 (0.0%) |
| Total | 169 (100.0%) | 110 (100.0%) |
Commute Time in Arlington
The most frequently occuring commute durations in Arlington are 15 to 19 minutes (97 commuters, 34.8%), less than 5 minutes (66 commuters, 23.7%), and 5 to 9 minutes (26 commuters, 9.3%).
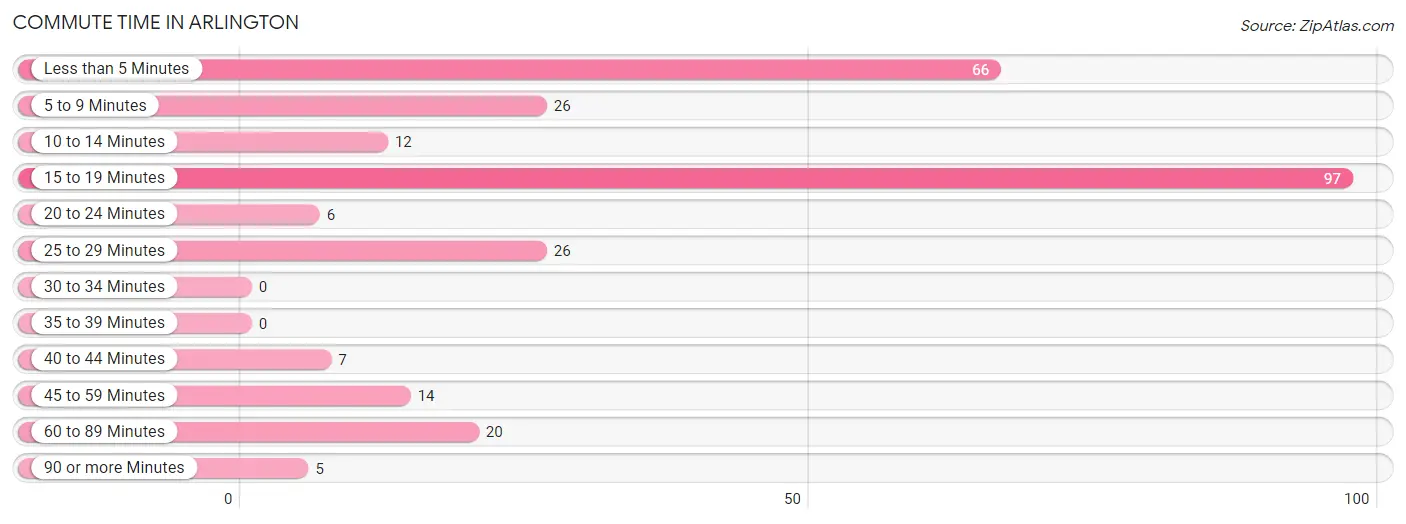
| Commute Time | # Commuters | % Commuters |
| Less than 5 Minutes | 66 | 23.7% |
| 5 to 9 Minutes | 26 | 9.3% |
| 10 to 14 Minutes | 12 | 4.3% |
| 15 to 19 Minutes | 97 | 34.8% |
| 20 to 24 Minutes | 6 | 2.1% |
| 25 to 29 Minutes | 26 | 9.3% |
| 30 to 34 Minutes | 0 | 0.0% |
| 35 to 39 Minutes | 0 | 0.0% |
| 40 to 44 Minutes | 7 | 2.5% |
| 45 to 59 Minutes | 14 | 5.0% |
| 60 to 89 Minutes | 20 | 7.2% |
| 90 or more Minutes | 5 | 1.8% |
Commute Time by Sex in Arlington
The most common commute times in Arlington are 15 to 19 minutes (71 commuters, 42.0%) for males and less than 5 minutes (29 commuters, 26.4%) for females.
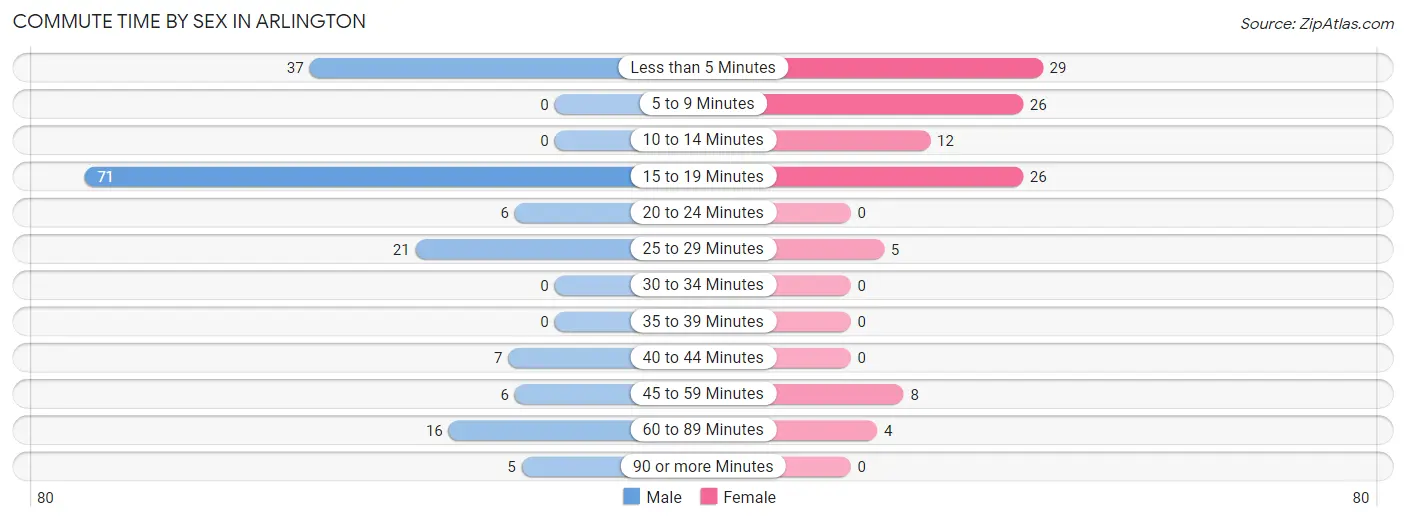
| Commute Time | Male | Female |
| Less than 5 Minutes | 37 (21.9%) | 29 (26.4%) |
| 5 to 9 Minutes | 0 (0.0%) | 26 (23.6%) |
| 10 to 14 Minutes | 0 (0.0%) | 12 (10.9%) |
| 15 to 19 Minutes | 71 (42.0%) | 26 (23.6%) |
| 20 to 24 Minutes | 6 (3.5%) | 0 (0.0%) |
| 25 to 29 Minutes | 21 (12.4%) | 5 (4.5%) |
| 30 to 34 Minutes | 0 (0.0%) | 0 (0.0%) |
| 35 to 39 Minutes | 0 (0.0%) | 0 (0.0%) |
| 40 to 44 Minutes | 7 (4.1%) | 0 (0.0%) |
| 45 to 59 Minutes | 6 (3.5%) | 8 (7.3%) |
| 60 to 89 Minutes | 16 (9.5%) | 4 (3.6%) |
| 90 or more Minutes | 5 (3.0%) | 0 (0.0%) |
Time of Departure to Work by Sex in Arlington
The most frequent times of departure to work in Arlington are 5:30 AM to 5:59 AM (41, 24.3%) for males and 6:30 AM to 6:59 AM (25, 22.7%) for females.
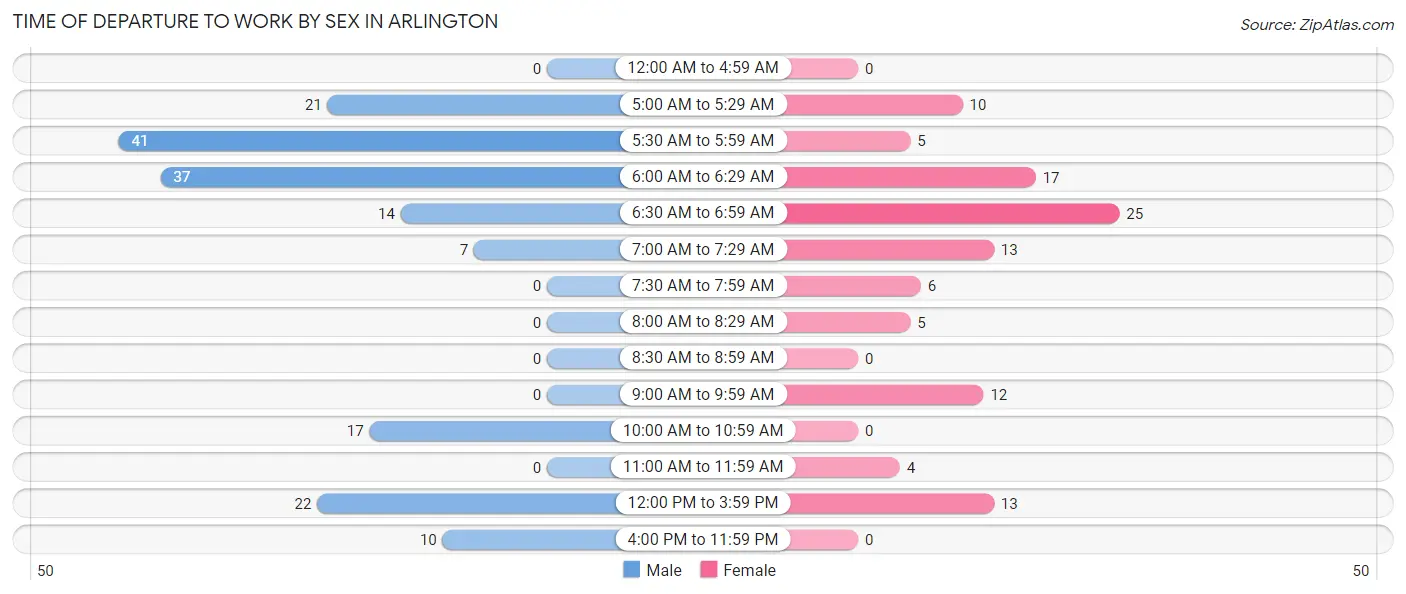
| Time of Departure | Male | Female |
| 12:00 AM to 4:59 AM | 0 (0.0%) | 0 (0.0%) |
| 5:00 AM to 5:29 AM | 21 (12.4%) | 10 (9.1%) |
| 5:30 AM to 5:59 AM | 41 (24.3%) | 5 (4.5%) |
| 6:00 AM to 6:29 AM | 37 (21.9%) | 17 (15.4%) |
| 6:30 AM to 6:59 AM | 14 (8.3%) | 25 (22.7%) |
| 7:00 AM to 7:29 AM | 7 (4.1%) | 13 (11.8%) |
| 7:30 AM to 7:59 AM | 0 (0.0%) | 6 (5.4%) |
| 8:00 AM to 8:29 AM | 0 (0.0%) | 5 (4.5%) |
| 8:30 AM to 8:59 AM | 0 (0.0%) | 0 (0.0%) |
| 9:00 AM to 9:59 AM | 0 (0.0%) | 12 (10.9%) |
| 10:00 AM to 10:59 AM | 17 (10.1%) | 0 (0.0%) |
| 11:00 AM to 11:59 AM | 0 (0.0%) | 4 (3.6%) |
| 12:00 PM to 3:59 PM | 22 (13.0%) | 13 (11.8%) |
| 4:00 PM to 11:59 PM | 10 (5.9%) | 0 (0.0%) |
| Total | 169 (100.0%) | 110 (100.0%) |
Housing Occupancy in Arlington
Occupancy by Ownership in Arlington
Of the total 230 dwellings in Arlington, owner-occupied units account for 152 (66.1%), while renter-occupied units make up 78 (33.9%).
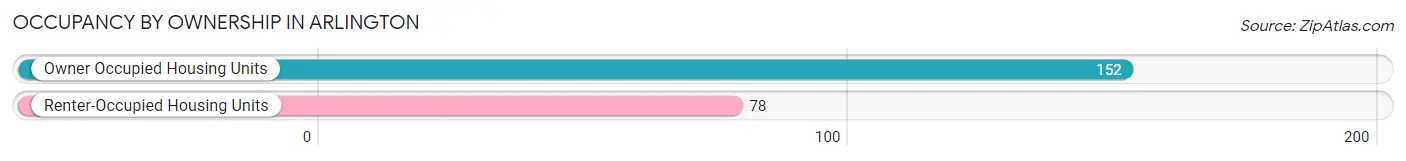
| Occupancy | # Housing Units | % Housing Units |
| Owner Occupied Housing Units | 152 | 66.1% |
| Renter-Occupied Housing Units | 78 | 33.9% |
| Total Occupied Housing Units | 230 | 100.0% |
Occupancy by Household Size in Arlington
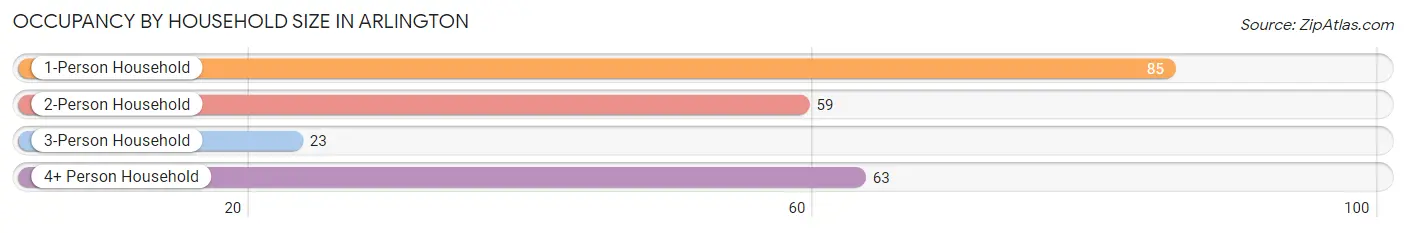
| Household Size | # Housing Units | % Housing Units |
| 1-Person Household | 85 | 37.0% |
| 2-Person Household | 59 | 25.7% |
| 3-Person Household | 23 | 10.0% |
| 4+ Person Household | 63 | 27.4% |
| Total Housing Units | 230 | 100.0% |
Occupancy by Ownership by Household Size in Arlington
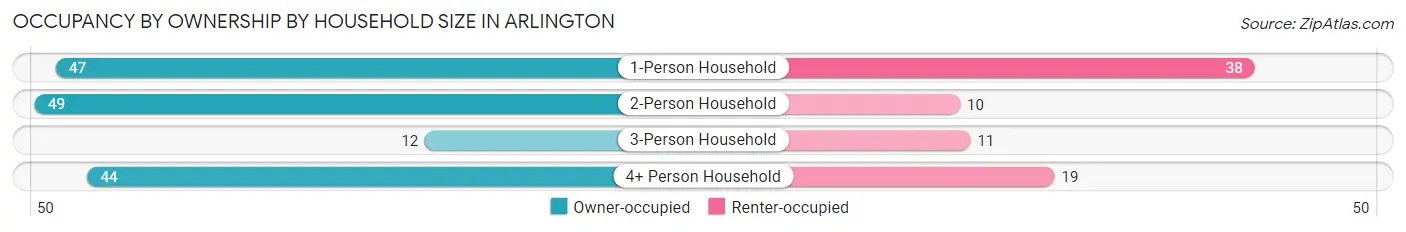
| Household Size | Owner-occupied | Renter-occupied |
| 1-Person Household | 47 (55.3%) | 38 (44.7%) |
| 2-Person Household | 49 (83.1%) | 10 (17.0%) |
| 3-Person Household | 12 (52.2%) | 11 (47.8%) |
| 4+ Person Household | 44 (69.8%) | 19 (30.2%) |
| Total Housing Units | 152 (66.1%) | 78 (33.9%) |
Occupancy by Educational Attainment in Arlington
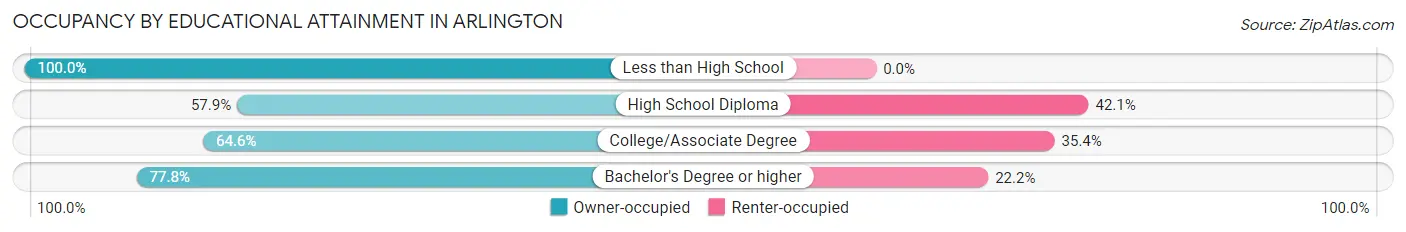
| Household Size | Owner-occupied | Renter-occupied |
| Less than High School | 7 (100.0%) | 0 (0.0%) |
| High School Diploma | 33 (57.9%) | 24 (42.1%) |
| College/Associate Degree | 84 (64.6%) | 46 (35.4%) |
| Bachelor's Degree or higher | 28 (77.8%) | 8 (22.2%) |
Occupancy by Age of Householder in Arlington
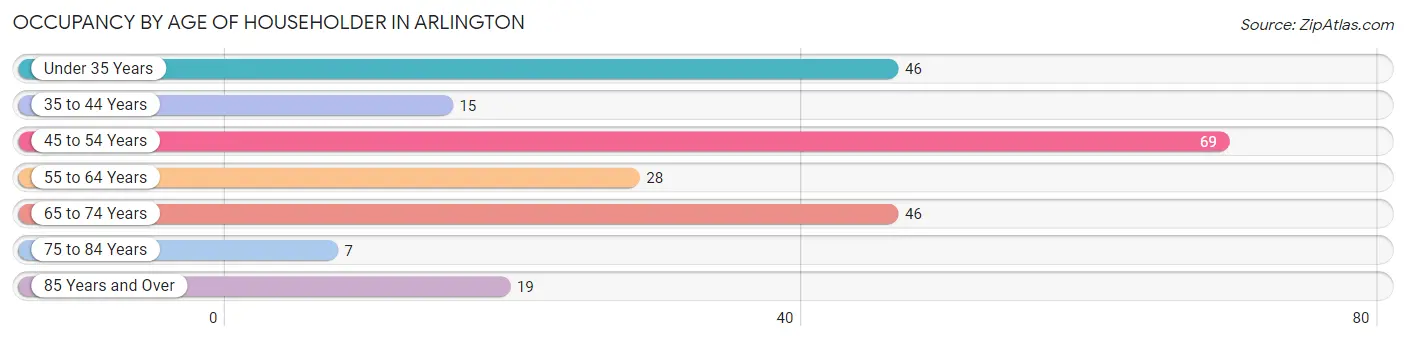
| Age Bracket | # Households | % Households |
| Under 35 Years | 46 | 20.0% |
| 35 to 44 Years | 15 | 6.5% |
| 45 to 54 Years | 69 | 30.0% |
| 55 to 64 Years | 28 | 12.2% |
| 65 to 74 Years | 46 | 20.0% |
| 75 to 84 Years | 7 | 3.0% |
| 85 Years and Over | 19 | 8.3% |
| Total | 230 | 100.0% |
Housing Finances in Arlington
Median Income by Occupancy in Arlington
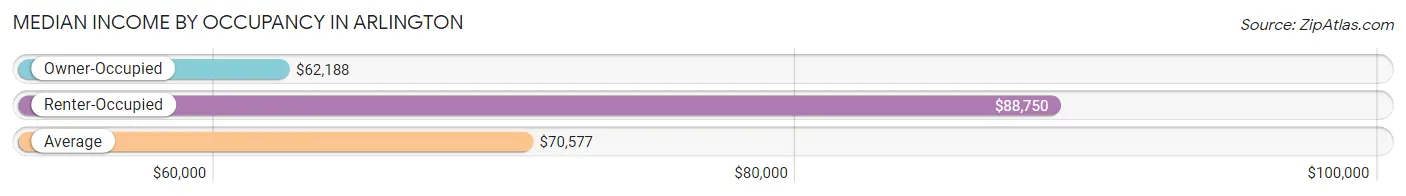
| Occupancy Type | # Households | Median Income |
| Owner-Occupied | 152 (66.1%) | $62,188 |
| Renter-Occupied | 78 (33.9%) | $88,750 |
| Average | 230 (100.0%) | $70,577 |
Occupancy by Householder Income Bracket in Arlington
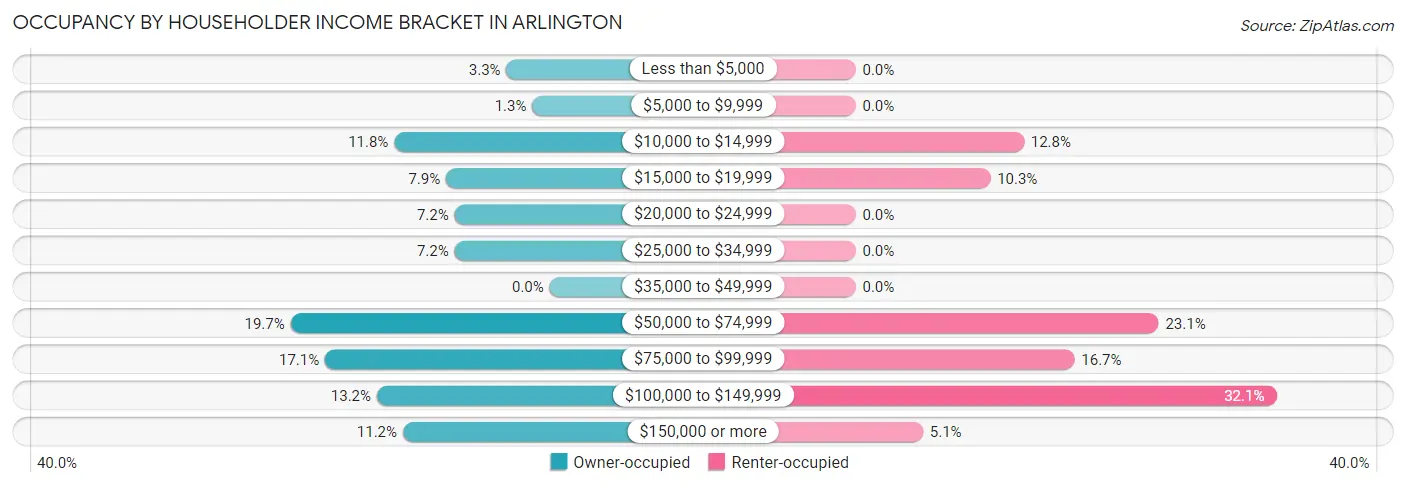
| Income Bracket | Owner-occupied | Renter-occupied |
| Less than $5,000 | 5 (3.3%) | 0 (0.0%) |
| $5,000 to $9,999 | 2 (1.3%) | 0 (0.0%) |
| $10,000 to $14,999 | 18 (11.8%) | 10 (12.8%) |
| $15,000 to $19,999 | 12 (7.9%) | 8 (10.3%) |
| $20,000 to $24,999 | 11 (7.2%) | 0 (0.0%) |
| $25,000 to $34,999 | 11 (7.2%) | 0 (0.0%) |
| $35,000 to $49,999 | 0 (0.0%) | 0 (0.0%) |
| $50,000 to $74,999 | 30 (19.7%) | 18 (23.1%) |
| $75,000 to $99,999 | 26 (17.1%) | 13 (16.7%) |
| $100,000 to $149,999 | 20 (13.2%) | 25 (32.1%) |
| $150,000 or more | 17 (11.2%) | 4 (5.1%) |
| Total | 152 (100.0%) | 78 (100.0%) |
Monthly Housing Cost Tiers in Arlington
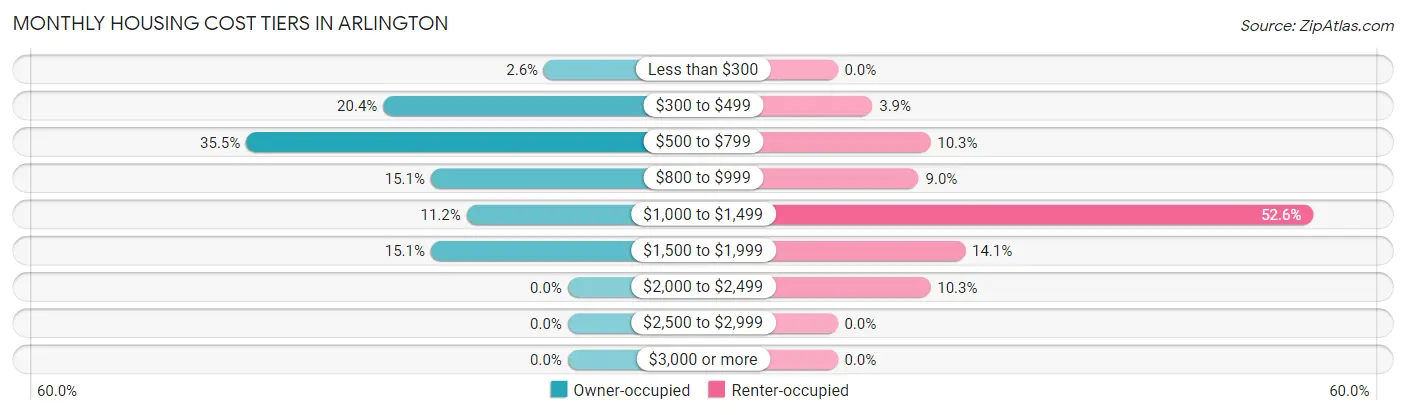
| Monthly Cost | Owner-occupied | Renter-occupied |
| Less than $300 | 4 (2.6%) | 0 (0.0%) |
| $300 to $499 | 31 (20.4%) | 3 (3.8%) |
| $500 to $799 | 54 (35.5%) | 8 (10.3%) |
| $800 to $999 | 23 (15.1%) | 7 (9.0%) |
| $1,000 to $1,499 | 17 (11.2%) | 41 (52.6%) |
| $1,500 to $1,999 | 23 (15.1%) | 11 (14.1%) |
| $2,000 to $2,499 | 0 (0.0%) | 8 (10.3%) |
| $2,500 to $2,999 | 0 (0.0%) | 0 (0.0%) |
| $3,000 or more | 0 (0.0%) | 0 (0.0%) |
| Total | 152 (100.0%) | 78 (100.0%) |
Physical Housing Characteristics in Arlington
Housing Structures in Arlington
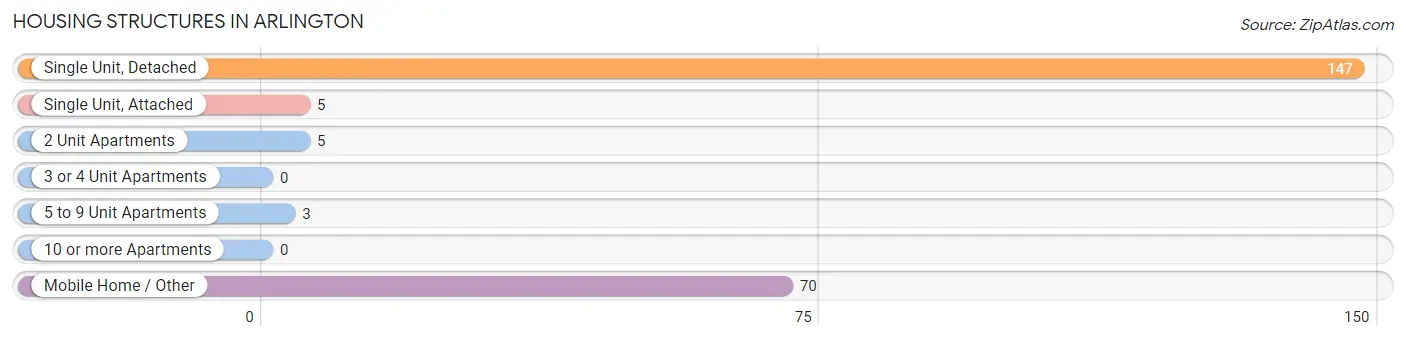
| Structure Type | # Housing Units | % Housing Units |
| Single Unit, Detached | 147 | 63.9% |
| Single Unit, Attached | 5 | 2.2% |
| 2 Unit Apartments | 5 | 2.2% |
| 3 or 4 Unit Apartments | 0 | 0.0% |
| 5 to 9 Unit Apartments | 3 | 1.3% |
| 10 or more Apartments | 0 | 0.0% |
| Mobile Home / Other | 70 | 30.4% |
| Total | 230 | 100.0% |
Housing Structures by Occupancy in Arlington
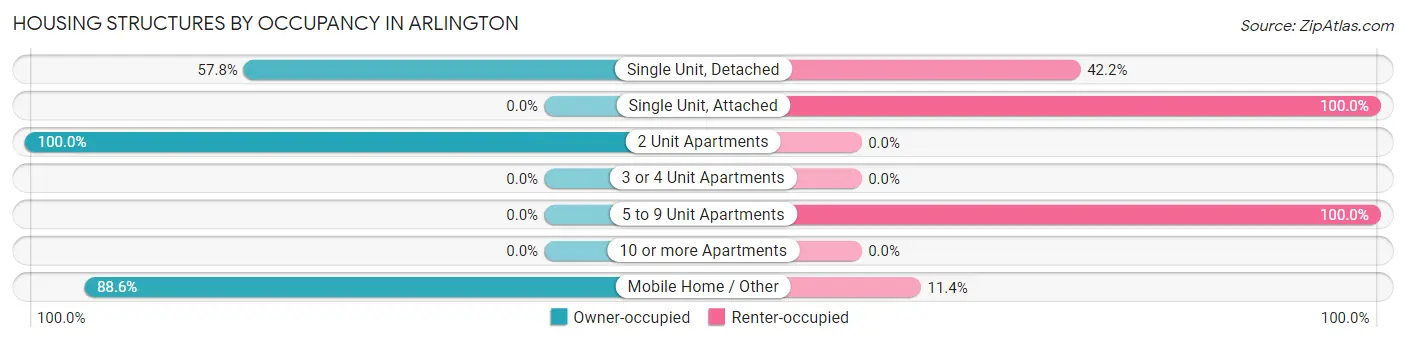
| Structure Type | Owner-occupied | Renter-occupied |
| Single Unit, Detached | 85 (57.8%) | 62 (42.2%) |
| Single Unit, Attached | 0 (0.0%) | 5 (100.0%) |
| 2 Unit Apartments | 5 (100.0%) | 0 (0.0%) |
| 3 or 4 Unit Apartments | 0 (0.0%) | 0 (0.0%) |
| 5 to 9 Unit Apartments | 0 (0.0%) | 3 (100.0%) |
| 10 or more Apartments | 0 (0.0%) | 0 (0.0%) |
| Mobile Home / Other | 62 (88.6%) | 8 (11.4%) |
| Total | 152 (66.1%) | 78 (33.9%) |
Housing Structures by Number of Rooms in Arlington
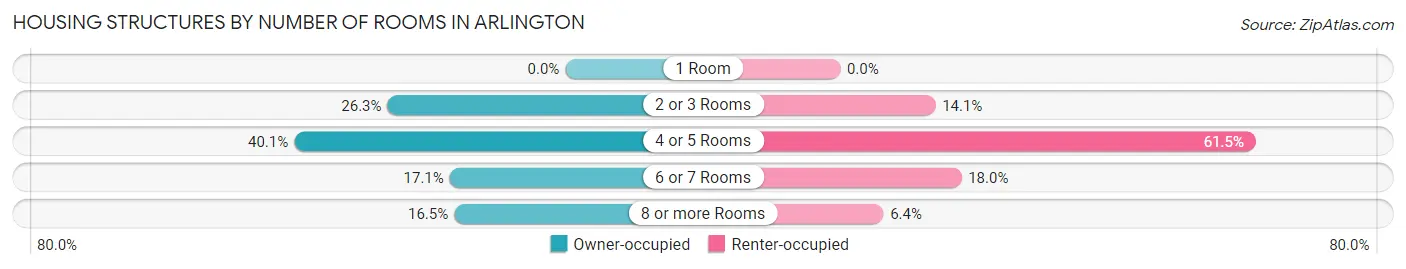
| Number of Rooms | Owner-occupied | Renter-occupied |
| 1 Room | 0 (0.0%) | 0 (0.0%) |
| 2 or 3 Rooms | 40 (26.3%) | 11 (14.1%) |
| 4 or 5 Rooms | 61 (40.1%) | 48 (61.5%) |
| 6 or 7 Rooms | 26 (17.1%) | 14 (17.9%) |
| 8 or more Rooms | 25 (16.5%) | 5 (6.4%) |
| Total | 152 (100.0%) | 78 (100.0%) |
Housing Structure by Heating Type in Arlington
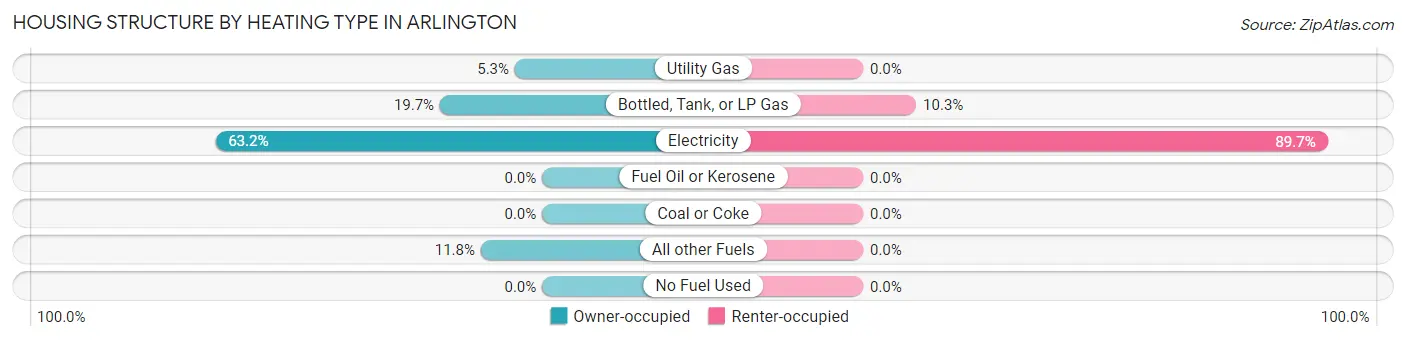
| Heating Type | Owner-occupied | Renter-occupied |
| Utility Gas | 8 (5.3%) | 0 (0.0%) |
| Bottled, Tank, or LP Gas | 30 (19.7%) | 8 (10.3%) |
| Electricity | 96 (63.2%) | 70 (89.7%) |
| Fuel Oil or Kerosene | 0 (0.0%) | 0 (0.0%) |
| Coal or Coke | 0 (0.0%) | 0 (0.0%) |
| All other Fuels | 18 (11.8%) | 0 (0.0%) |
| No Fuel Used | 0 (0.0%) | 0 (0.0%) |
| Total | 152 (100.0%) | 78 (100.0%) |
Household Vehicle Usage in Arlington
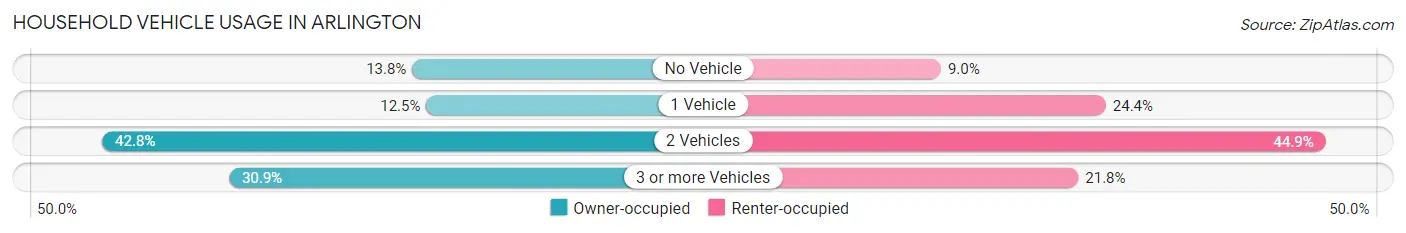
| Vehicles per Household | Owner-occupied | Renter-occupied |
| No Vehicle | 21 (13.8%) | 7 (9.0%) |
| 1 Vehicle | 19 (12.5%) | 19 (24.4%) |
| 2 Vehicles | 65 (42.8%) | 35 (44.9%) |
| 3 or more Vehicles | 47 (30.9%) | 17 (21.8%) |
| Total | 152 (100.0%) | 78 (100.0%) |
Real Estate & Mortgages in Arlington
Real Estate and Mortgage Overview in Arlington
| Characteristic | Without Mortgage | With Mortgage |
| Housing Units | 105 | 47 |
| Median Property Value | $153,300 | $198,200 |
| Median Household Income | - | - |
| Monthly Housing Costs | $567 | $0 |
| Real Estate Taxes | $1,078 | $0 |
Property Value by Mortgage Status in Arlington
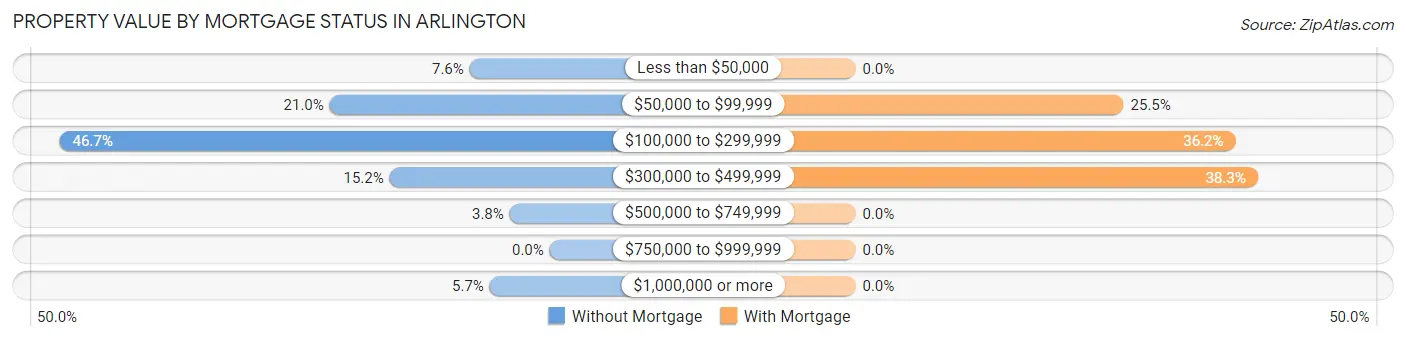
| Property Value | Without Mortgage | With Mortgage |
| Less than $50,000 | 8 (7.6%) | 0 (0.0%) |
| $50,000 to $99,999 | 22 (20.9%) | 12 (25.5%) |
| $100,000 to $299,999 | 49 (46.7%) | 17 (36.2%) |
| $300,000 to $499,999 | 16 (15.2%) | 18 (38.3%) |
| $500,000 to $749,999 | 4 (3.8%) | 0 (0.0%) |
| $750,000 to $999,999 | 0 (0.0%) | 0 (0.0%) |
| $1,000,000 or more | 6 (5.7%) | 0 (0.0%) |
| Total | 105 (100.0%) | 47 (100.0%) |
Household Income by Mortgage Status in Arlington
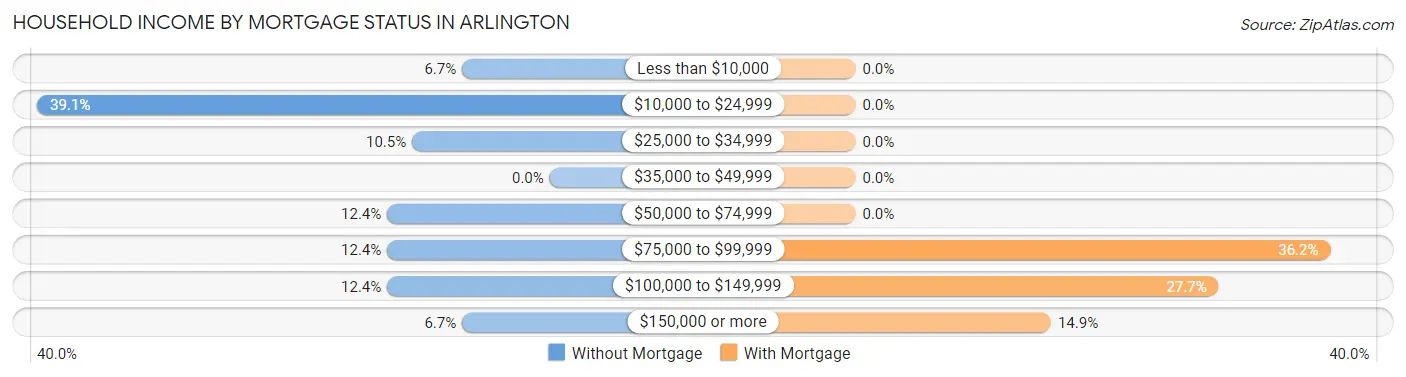
| Household Income | Without Mortgage | With Mortgage |
| Less than $10,000 | 7 (6.7%) | 0 (0.0%) |
| $10,000 to $24,999 | 41 (39.1%) | 0 (0.0%) |
| $25,000 to $34,999 | 11 (10.5%) | 0 (0.0%) |
| $35,000 to $49,999 | 0 (0.0%) | 0 (0.0%) |
| $50,000 to $74,999 | 13 (12.4%) | 0 (0.0%) |
| $75,000 to $99,999 | 13 (12.4%) | 17 (36.2%) |
| $100,000 to $149,999 | 13 (12.4%) | 13 (27.7%) |
| $150,000 or more | 7 (6.7%) | 7 (14.9%) |
| Total | 105 (100.0%) | 47 (100.0%) |
Property Value to Household Income Ratio in Arlington
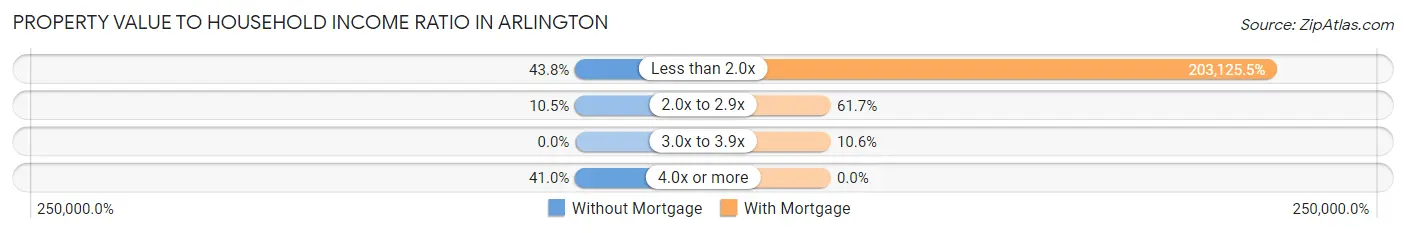
| Value-to-Income Ratio | Without Mortgage | With Mortgage |
| Less than 2.0x | 46 (43.8%) | 95,469 (203,125.5%) |
| 2.0x to 2.9x | 11 (10.5%) | 29 (61.7%) |
| 3.0x to 3.9x | 0 (0.0%) | 5 (10.6%) |
| 4.0x or more | 43 (40.9%) | 0 (0.0%) |
| Total | 105 (100.0%) | 47 (100.0%) |
Real Estate Taxes by Mortgage Status in Arlington
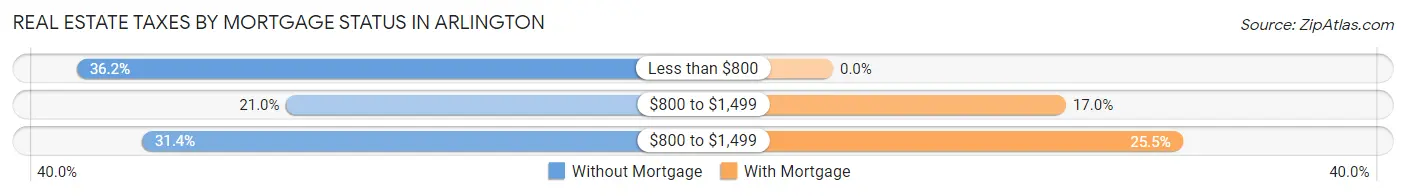
| Property Taxes | Without Mortgage | With Mortgage |
| Less than $800 | 38 (36.2%) | 0 (0.0%) |
| $800 to $1,499 | 22 (20.9%) | 8 (17.0%) |
| $800 to $1,499 | 33 (31.4%) | 12 (25.5%) |
| Total | 105 (100.0%) | 47 (100.0%) |
Health & Disability in Arlington
Health Insurance Coverage by Age in Arlington
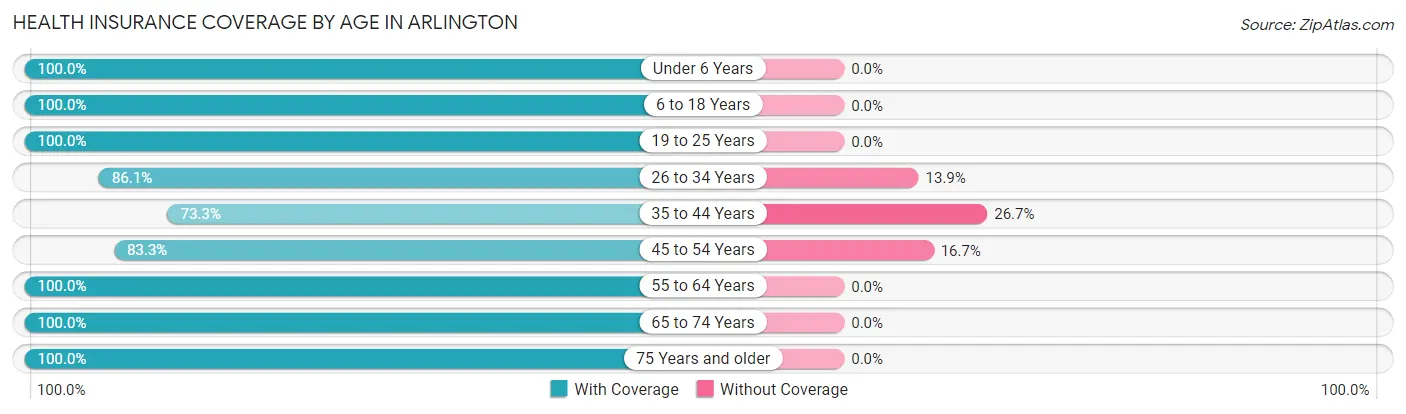
| Age Bracket | With Coverage | Without Coverage |
| Under 6 Years | 29 (100.0%) | 0 (0.0%) |
| 6 to 18 Years | 143 (100.0%) | 0 (0.0%) |
| 19 to 25 Years | 47 (100.0%) | 0 (0.0%) |
| 26 to 34 Years | 87 (86.1%) | 14 (13.9%) |
| 35 to 44 Years | 44 (73.3%) | 16 (26.7%) |
| 45 to 54 Years | 70 (83.3%) | 14 (16.7%) |
| 55 to 64 Years | 69 (100.0%) | 0 (0.0%) |
| 65 to 74 Years | 78 (100.0%) | 0 (0.0%) |
| 75 Years and older | 47 (100.0%) | 0 (0.0%) |
| Total | 614 (93.3%) | 44 (6.7%) |
Health Insurance Coverage by Citizenship Status in Arlington
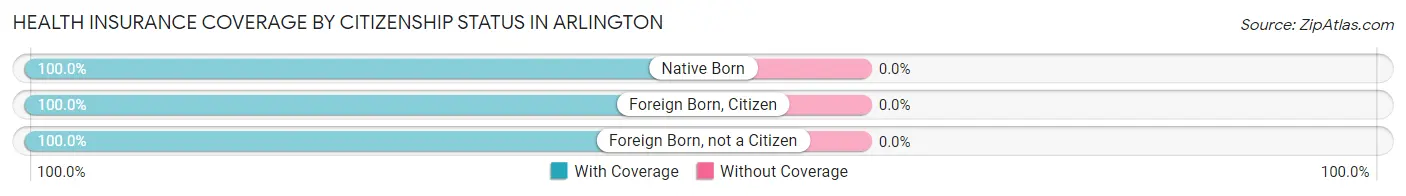
| Citizenship Status | With Coverage | Without Coverage |
| Native Born | 29 (100.0%) | 0 (0.0%) |
| Foreign Born, Citizen | 143 (100.0%) | 0 (0.0%) |
| Foreign Born, not a Citizen | 47 (100.0%) | 0 (0.0%) |
Health Insurance Coverage by Household Income in Arlington
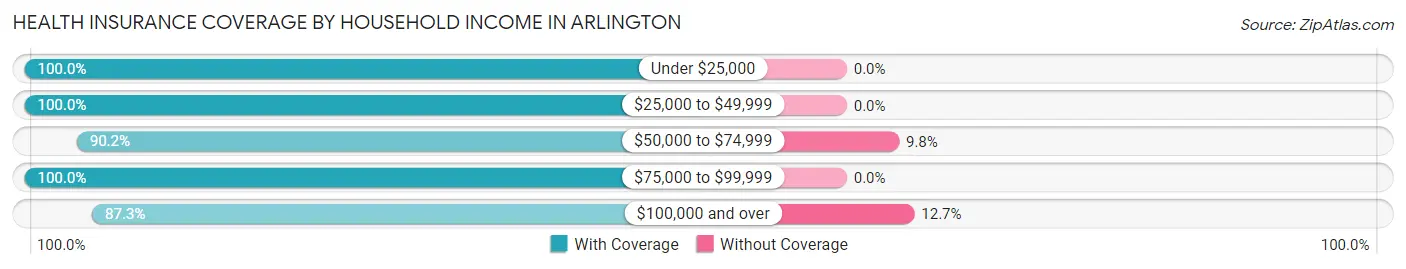
| Household Income | With Coverage | Without Coverage |
| Under $25,000 | 109 (100.0%) | 0 (0.0%) |
| $25,000 to $49,999 | 11 (100.0%) | 0 (0.0%) |
| $50,000 to $74,999 | 129 (90.2%) | 14 (9.8%) |
| $75,000 to $99,999 | 158 (100.0%) | 0 (0.0%) |
| $100,000 and over | 207 (87.3%) | 30 (12.7%) |
Public vs Private Health Insurance Coverage by Age in Arlington
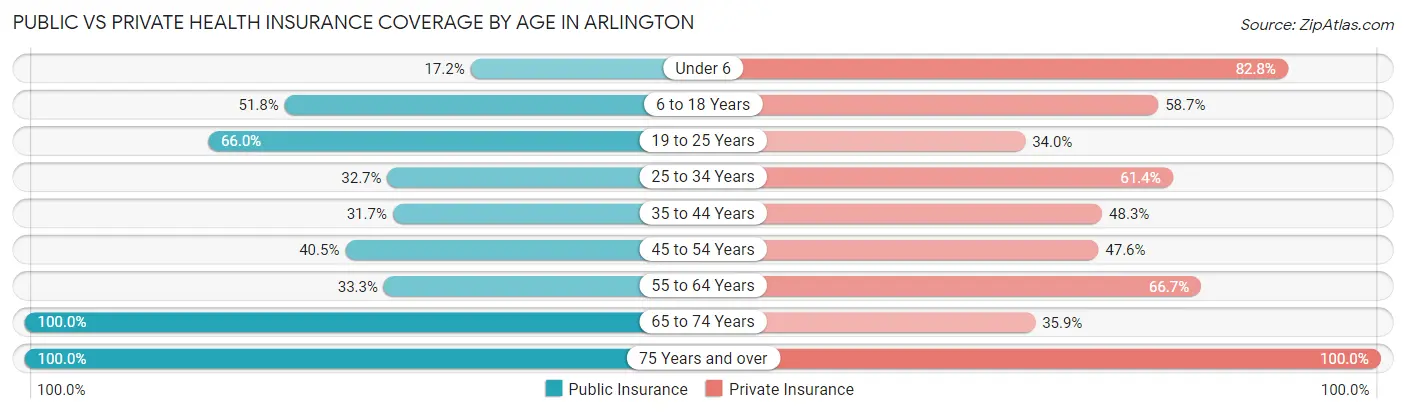
| Age Bracket | Public Insurance | Private Insurance |
| Under 6 | 5 (17.2%) | 24 (82.8%) |
| 6 to 18 Years | 74 (51.7%) | 84 (58.7%) |
| 19 to 25 Years | 31 (66.0%) | 16 (34.0%) |
| 25 to 34 Years | 33 (32.7%) | 62 (61.4%) |
| 35 to 44 Years | 19 (31.7%) | 29 (48.3%) |
| 45 to 54 Years | 34 (40.5%) | 40 (47.6%) |
| 55 to 64 Years | 23 (33.3%) | 46 (66.7%) |
| 65 to 74 Years | 78 (100.0%) | 28 (35.9%) |
| 75 Years and over | 47 (100.0%) | 47 (100.0%) |
| Total | 344 (52.3%) | 376 (57.1%) |
Disability Status by Sex by Age in Arlington
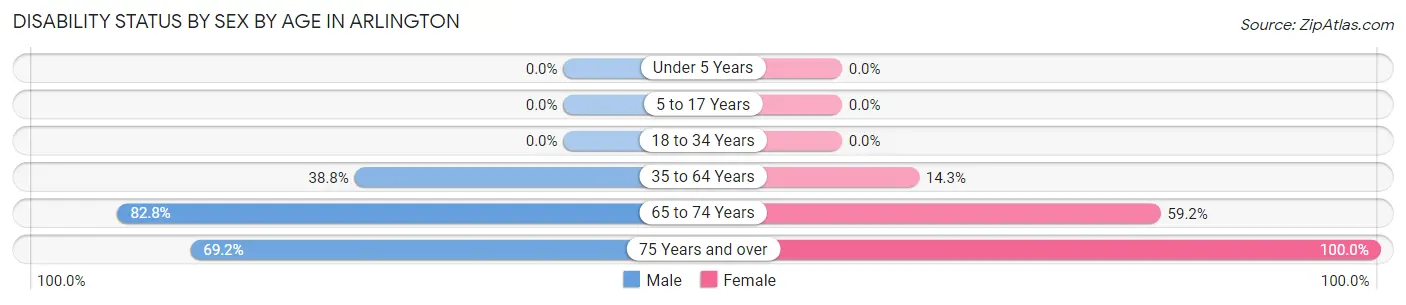
| Age Bracket | Male | Female |
| Under 5 Years | 0 (0.0%) | 0 (0.0%) |
| 5 to 17 Years | 0 (0.0%) | 0 (0.0%) |
| 18 to 34 Years | 0 (0.0%) | 0 (0.0%) |
| 35 to 64 Years | 31 (38.8%) | 19 (14.3%) |
| 65 to 74 Years | 24 (82.8%) | 29 (59.2%) |
| 75 Years and over | 18 (69.2%) | 21 (100.0%) |
Disability Class by Sex by Age in Arlington
Disability Class: Hearing Difficulty
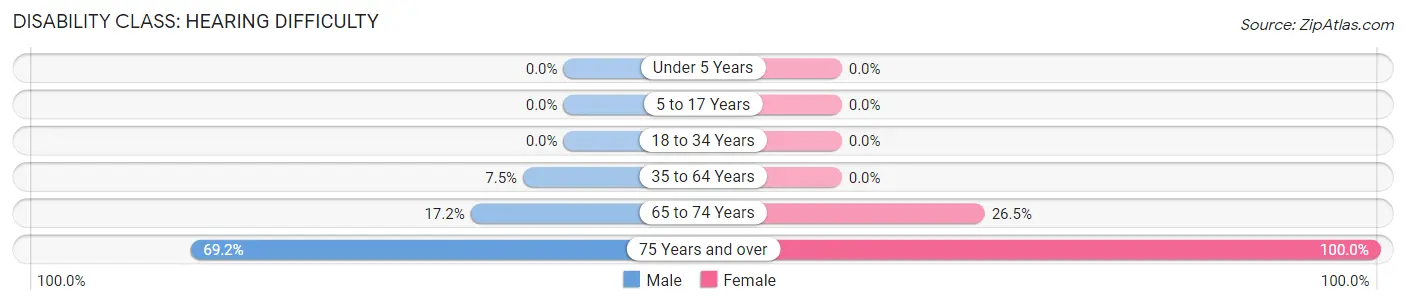
| Age Bracket | Male | Female |
| Under 5 Years | 0 (0.0%) | 0 (0.0%) |
| 5 to 17 Years | 0 (0.0%) | 0 (0.0%) |
| 18 to 34 Years | 0 (0.0%) | 0 (0.0%) |
| 35 to 64 Years | 6 (7.5%) | 0 (0.0%) |
| 65 to 74 Years | 5 (17.2%) | 13 (26.5%) |
| 75 Years and over | 18 (69.2%) | 21 (100.0%) |
Disability Class: Vision Difficulty
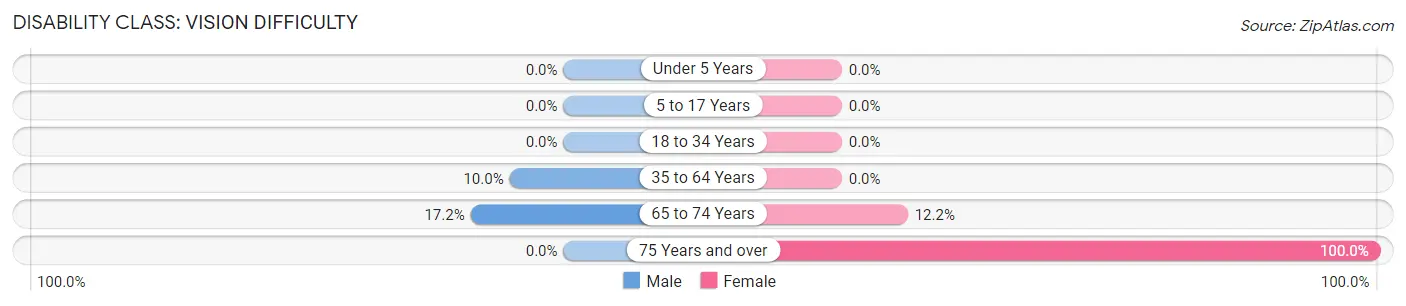
| Age Bracket | Male | Female |
| Under 5 Years | 0 (0.0%) | 0 (0.0%) |
| 5 to 17 Years | 0 (0.0%) | 0 (0.0%) |
| 18 to 34 Years | 0 (0.0%) | 0 (0.0%) |
| 35 to 64 Years | 8 (10.0%) | 0 (0.0%) |
| 65 to 74 Years | 5 (17.2%) | 6 (12.2%) |
| 75 Years and over | 0 (0.0%) | 21 (100.0%) |
Disability Class: Cognitive Difficulty
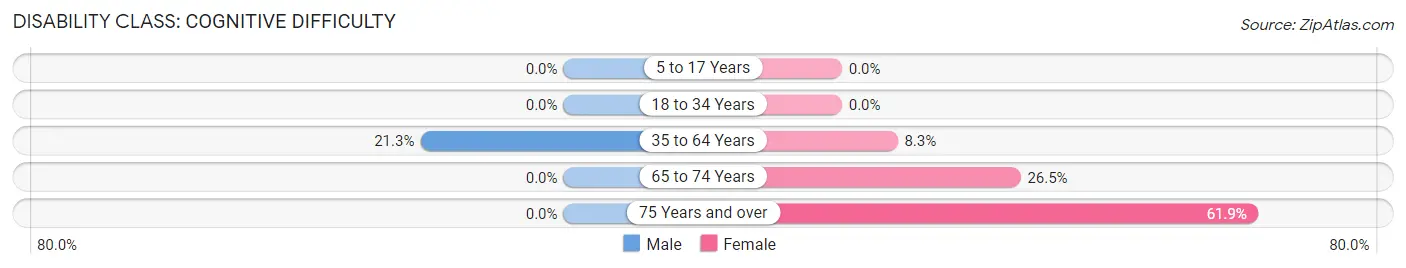
| Age Bracket | Male | Female |
| 5 to 17 Years | 0 (0.0%) | 0 (0.0%) |
| 18 to 34 Years | 0 (0.0%) | 0 (0.0%) |
| 35 to 64 Years | 17 (21.2%) | 11 (8.3%) |
| 65 to 74 Years | 0 (0.0%) | 13 (26.5%) |
| 75 Years and over | 0 (0.0%) | 13 (61.9%) |
Disability Class: Ambulatory Difficulty
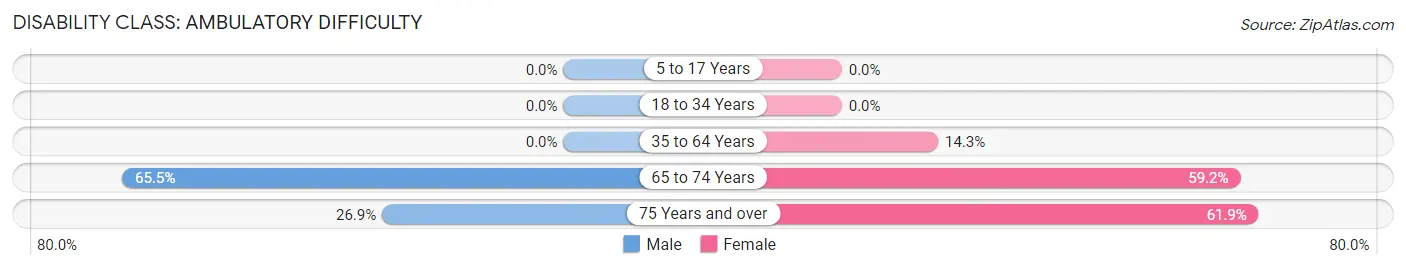
| Age Bracket | Male | Female |
| 5 to 17 Years | 0 (0.0%) | 0 (0.0%) |
| 18 to 34 Years | 0 (0.0%) | 0 (0.0%) |
| 35 to 64 Years | 0 (0.0%) | 19 (14.3%) |
| 65 to 74 Years | 19 (65.5%) | 29 (59.2%) |
| 75 Years and over | 7 (26.9%) | 13 (61.9%) |
Disability Class: Self-Care Difficulty
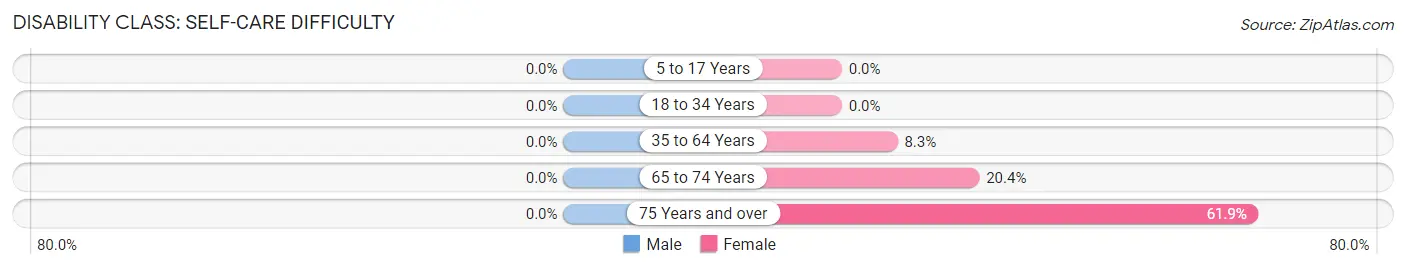
| Age Bracket | Male | Female |
| 5 to 17 Years | 0 (0.0%) | 0 (0.0%) |
| 18 to 34 Years | 0 (0.0%) | 0 (0.0%) |
| 35 to 64 Years | 0 (0.0%) | 11 (8.3%) |
| 65 to 74 Years | 0 (0.0%) | 10 (20.4%) |
| 75 Years and over | 0 (0.0%) | 13 (61.9%) |
Technology Access in Arlington
Computing Device Access in Arlington
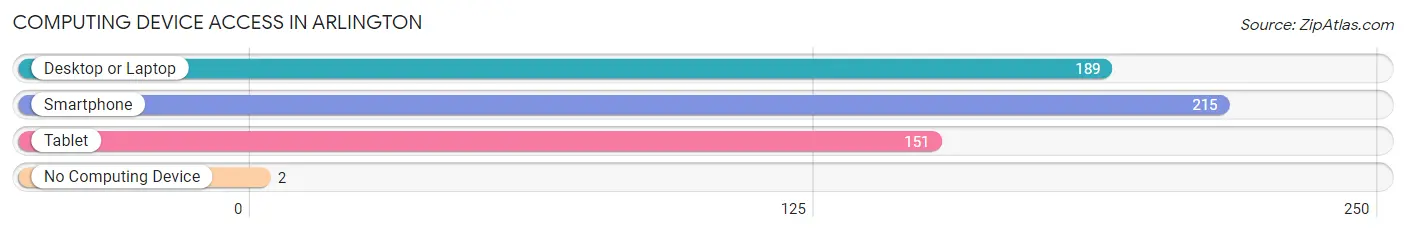
| Device Type | # Households | % Households |
| Desktop or Laptop | 189 | 82.2% |
| Smartphone | 215 | 93.5% |
| Tablet | 151 | 65.6% |
| No Computing Device | 2 | 0.9% |
| Total | 230 | 100.0% |
Internet Access in Arlington
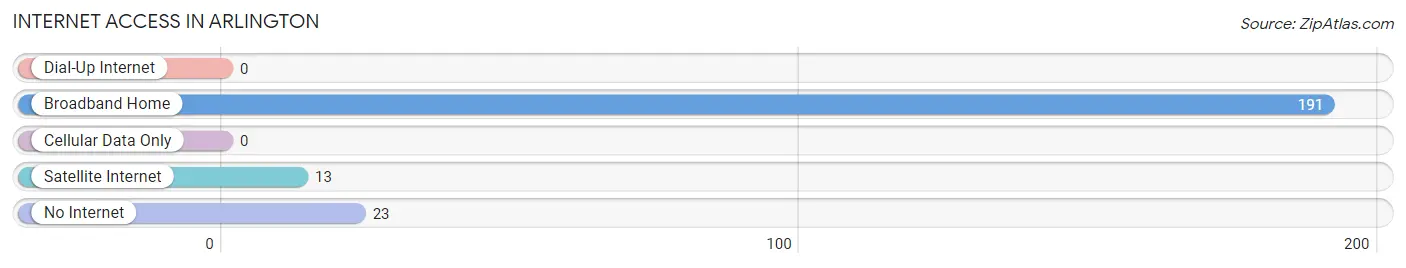
| Internet Type | # Households | % Households |
| Dial-Up Internet | 0 | 0.0% |
| Broadband Home | 191 | 83.0% |
| Cellular Data Only | 0 | 0.0% |
| Satellite Internet | 13 | 5.7% |
| No Internet | 23 | 10.0% |
| Total | 230 | 100.0% |
Arlington Summary
Arlington is a small city located in Gilliam County, Oregon, United States. It is situated on the Columbia River, approximately 20 miles east of the city of The Dalles. The population of Arlington was 545 at the 2010 census.
History
Arlington was founded in 1876 by a group of settlers from the nearby town of Dufur. The town was named after the nearby Arlington House, which was built in 1871 by a local rancher. The house was named after the Arlington family, who had owned the land since the early 1800s.
The town of Arlington was officially incorporated in 1891. During the early years of its existence, the town was primarily a farming and ranching community. In the early 1900s, the town began to grow as a result of the construction of the Columbia River Highway, which connected Arlington to the nearby cities of The Dalles and Portland.
In the 1920s, the town experienced a period of growth as a result of the construction of the Arlington Dam. The dam was built to provide irrigation for the surrounding area and to generate hydroelectric power. The dam was completed in 1927 and the town of Arlington was flooded in the process.
Geography
Arlington is located in the Columbia River Gorge, approximately 20 miles east of The Dalles. The city is situated on the north bank of the Columbia River, at an elevation of 845 feet. The city covers an area of 1.2 square miles, all of which is land.
The climate in Arlington is generally mild, with warm summers and cool winters. The average annual temperature is 54 degrees Fahrenheit, with an average high of 79 degrees in the summer and an average low of 29 degrees in the winter.
Economy
The economy of Arlington is largely based on agriculture and tourism. The city is home to several farms and ranches, which produce a variety of crops, including wheat, hay, and potatoes. The city is also home to several wineries, which produce a variety of wines.
Tourism is an important part of the local economy. The city is home to several attractions, including the Arlington Dam, the Columbia River Gorge, and the nearby Dufur Historic District. The city also hosts several annual events, including the Arlington Days Festival and the Arlington Rodeo.
Demographics
As of the 2010 census, the population of Arlington was 545. The racial makeup of the city was 94.2% White, 0.2% African American, 0.4% Native American, 0.2% Asian, 0.2% Pacific Islander, 0.2% from other races, and 4.6% from two or more races. Hispanic or Latino of any race were 1.3% of the population.
The median household income in Arlington was $37,500, and the median family income was $41,250. The per capita income for the city was $17,857. About 11.2% of families and 14.2% of the population were below the poverty line, including 18.2% of those under age 18 and 8.3% of those age 65 or over.
Common Questions
What is the Total Population of Arlington?
Total Population of Arlington is 658.
What is the Total Male Population of Arlington?
Total Male Population of Arlington is 321.
What is the Total Female Population of Arlington?
Total Female Population of Arlington is 337.
What is the Ratio of Males per 100 Females in Arlington?
There are 95.25 Males per 100 Females in Arlington.
What is the Ratio of Females per 100 Males in Arlington?
There are 104.98 Females per 100 Males in Arlington.
What is the Median Population Age in Arlington?
Median Population Age in Arlington is 39.8 Years.
What is the Average Family Size in Arlington
Average Family Size in Arlington is 3.6 People.
What is the Average Household Size in Arlington
Average Household Size in Arlington is 2.9 People.
What is Per Capita Income in Arlington?
Per Capita income in Arlington is $29,098.
What is the Median Family Income in Arlington?
Median Family Income in Arlington is $85,625.
What is the Median Household income in Arlington?
Median Household Income in Arlington is $70,577.
What is Income or Wage Gap in Arlington?
Income or Wage Gap in Arlington is 42.8%.
Women in Arlington earn 57.2 cents for every dollar earned by a man.
What is Inequality or Gini Index in Arlington?
Inequality or Gini Index in Arlington is 0.41.
How Large is the Labor Force in Arlington?
There are 310 People in the Labor Forcein in Arlington.
What is the Percentage of People in the Labor Force in Arlington?
59.8% of People are in the Labor Force in Arlington.
What is the Unemployment Rate in Arlington?
Unemployment Rate in Arlington is 6.8%.