Condon, OR
Condon Map
Condon Overview
697
TOTAL POPULATION
319
MALE POPULATION
378
FEMALE POPULATION
84.39
MALES / 100 FEMALES
118.50
FEMALES / 100 MALES
64.7
MEDIAN AGE
2.6
AVG FAMILY SIZE
1.7
AVG HOUSEHOLD SIZE
$29,869
PER CAPITA INCOME
$70,139
AVG FAMILY INCOME
$38,594
AVG HOUSEHOLD INCOME
35.1%
WAGE / INCOME GAP [ % ]
64.9¢/ $1
WAGE / INCOME GAP [ $ ]
0.45
INEQUALITY / GINI INDEX
223
LABOR FORCE [ PEOPLE ]
33.9%
PERCENT IN LABOR FORCE
12.6%
UNEMPLOYMENT RATE
Condon Zip Codes
Condon Area Codes
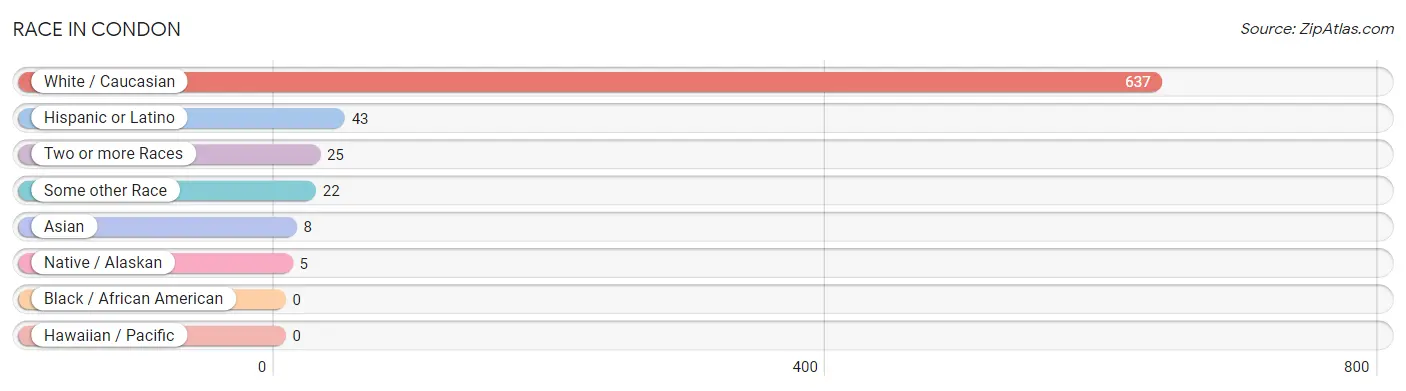
Race in Condon
The most populous races in Condon are White / Caucasian (637 | 91.4%), Hispanic or Latino (43 | 6.2%), and Two or more Races (25 | 3.6%).
| Race | # Population | % Population |
| Asian | 8 | 1.1% |
| Black / African American | 0 | 0.0% |
| Hawaiian / Pacific | 0 | 0.0% |
| Hispanic or Latino | 43 | 6.2% |
| Native / Alaskan | 5 | 0.7% |
| White / Caucasian | 637 | 91.4% |
| Two or more Races | 25 | 3.6% |
| Some other Race | 22 | 3.2% |
| Total | 697 | 100.0% |
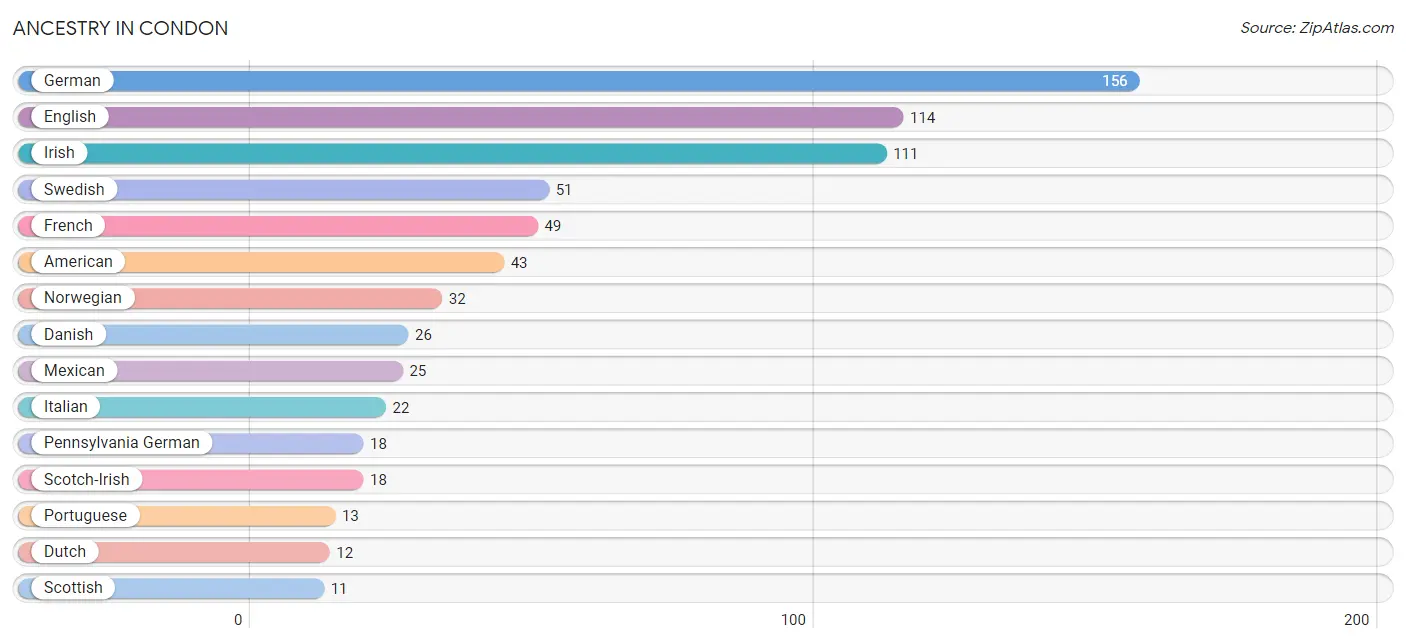
Ancestry in Condon
The most populous ancestries reported in Condon are German (156 | 22.4%), English (114 | 16.4%), Irish (111 | 15.9%), Swedish (51 | 7.3%), and French (49 | 7.0%), together accounting for 69.0% of all Condon residents.
| Ancestry | # Population | % Population |
| American | 43 | 6.2% |
| Armenian | 7 | 1.0% |
| Burmese | 8 | 1.1% |
| Canadian | 6 | 0.9% |
| Central American Indian | 5 | 0.7% |
| Czech | 5 | 0.7% |
| Danish | 26 | 3.7% |
| Dutch | 12 | 1.7% |
| Eastern European | 6 | 0.9% |
| English | 114 | 16.4% |
| European | 6 | 0.9% |
| French | 49 | 7.0% |
| French Canadian | 5 | 0.7% |
| German | 156 | 22.4% |
| Irish | 111 | 15.9% |
| Italian | 22 | 3.2% |
| Mexican | 25 | 3.6% |
| Norwegian | 32 | 4.6% |
| Pennsylvania German | 18 | 2.6% |
| Portuguese | 13 | 1.9% |
| Scotch-Irish | 18 | 2.6% |
| Scottish | 11 | 1.6% |
| Swedish | 51 | 7.3% |
| Welsh | 11 | 1.6% | View All 24 Rows |
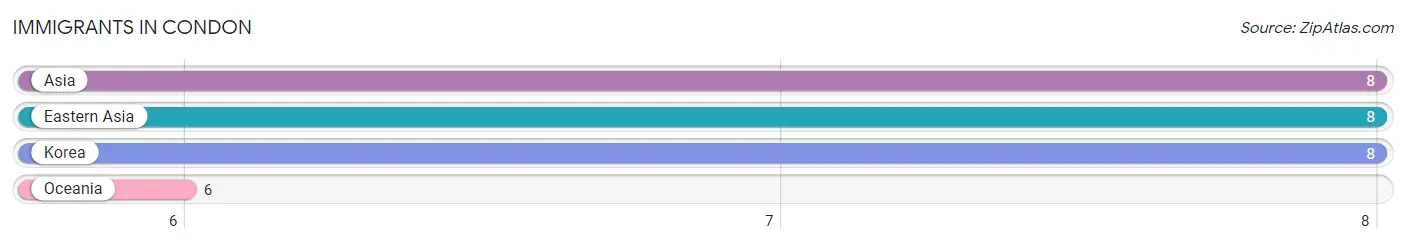
Immigrants in Condon
The most numerous immigrant groups reported in Condon came from Asia (8 | 1.1%), Eastern Asia (8 | 1.1%), Korea (8 | 1.1%), and Oceania (6 | 0.9%), together accounting for 4.3% of all Condon residents.
| Immigration Origin | # Population | % Population |
| Asia | 8 | 1.1% |
| Eastern Asia | 8 | 1.1% |
| Korea | 8 | 1.1% |
| Oceania | 6 | 0.9% | View All 4 Rows |
Sex and Age in Condon
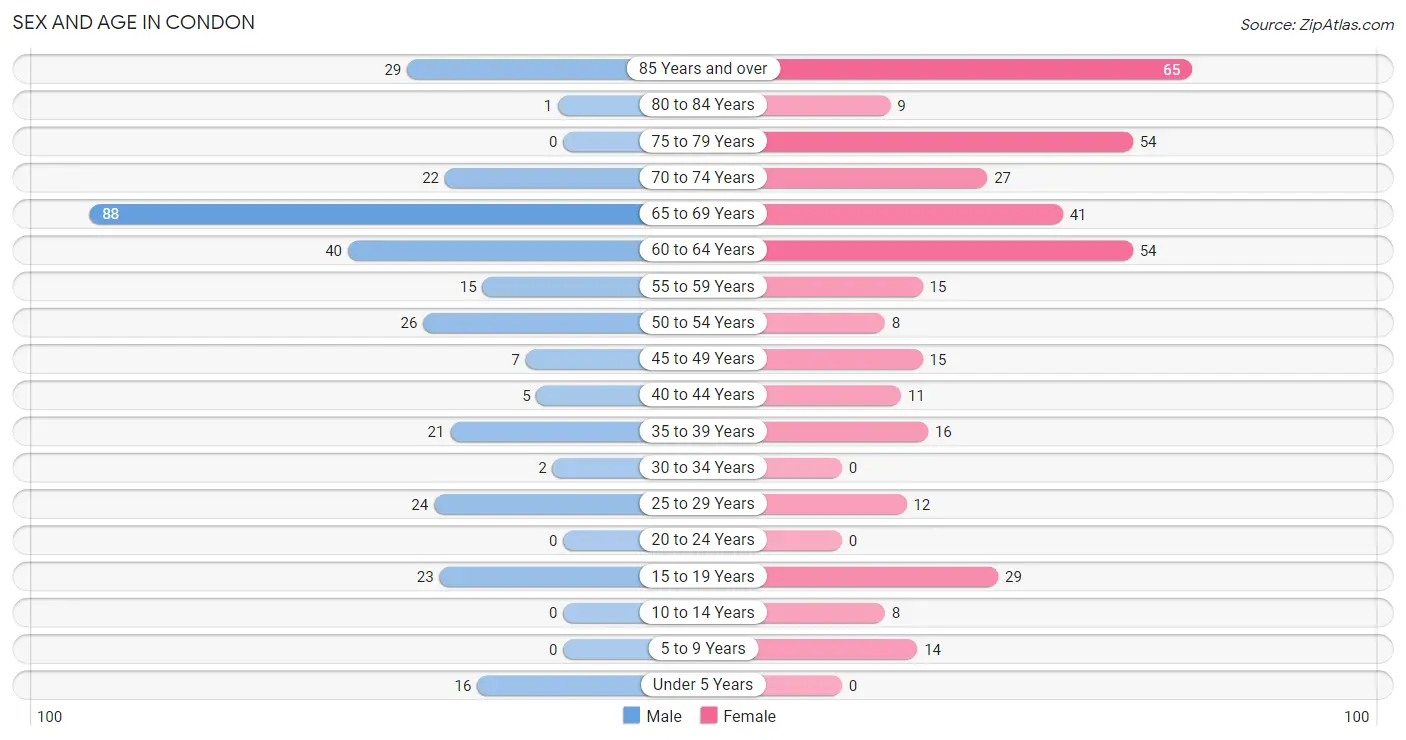
Sex and Age in Condon
The most populous age groups in Condon are 65 to 69 Years (88 | 27.6%) for men and 85 Years and over (65 | 17.2%) for women.
| Age Bracket | Male | Female |
| Under 5 Years | 16 (5.0%) | 0 (0.0%) |
| 5 to 9 Years | 0 (0.0%) | 14 (3.7%) |
| 10 to 14 Years | 0 (0.0%) | 8 (2.1%) |
| 15 to 19 Years | 23 (7.2%) | 29 (7.7%) |
| 20 to 24 Years | 0 (0.0%) | 0 (0.0%) |
| 25 to 29 Years | 24 (7.5%) | 12 (3.2%) |
| 30 to 34 Years | 2 (0.6%) | 0 (0.0%) |
| 35 to 39 Years | 21 (6.6%) | 16 (4.2%) |
| 40 to 44 Years | 5 (1.6%) | 11 (2.9%) |
| 45 to 49 Years | 7 (2.2%) | 15 (4.0%) |
| 50 to 54 Years | 26 (8.2%) | 8 (2.1%) |
| 55 to 59 Years | 15 (4.7%) | 15 (4.0%) |
| 60 to 64 Years | 40 (12.5%) | 54 (14.3%) |
| 65 to 69 Years | 88 (27.6%) | 41 (10.8%) |
| 70 to 74 Years | 22 (6.9%) | 27 (7.1%) |
| 75 to 79 Years | 0 (0.0%) | 54 (14.3%) |
| 80 to 84 Years | 1 (0.3%) | 9 (2.4%) |
| 85 Years and over | 29 (9.1%) | 65 (17.2%) |
| Total | 319 (100.0%) | 378 (100.0%) |
Families and Households in Condon
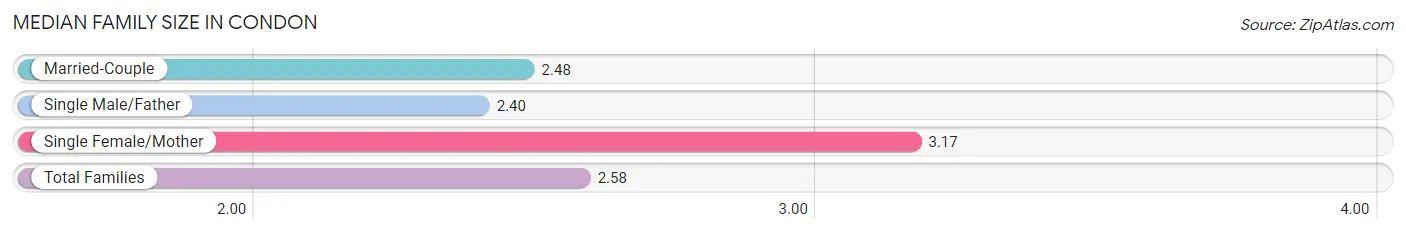
Median Family Size in Condon
The median family size in Condon is 2.58 persons per family, with single female/mother families (23 | 15.1%) accounting for the largest median family size of 3.17 persons per family. On the other hand, single male/father families (5 | 3.3%) represent the smallest median family size with 2.40 persons per family.
| Family Type | # Families | Family Size |
| Married-Couple | 124 (81.6%) | 2.48 |
| Single Male/Father | 5 (3.3%) | 2.40 |
| Single Female/Mother | 23 (15.1%) | 3.17 |
| Total Families | 152 (100.0%) | 2.58 |
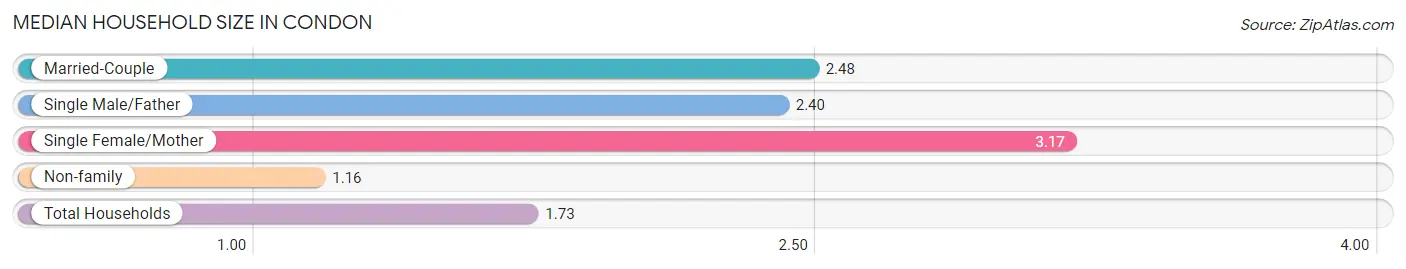
Median Household Size in Condon
The median household size in Condon is 1.73 persons per household, with single female/mother households (23 | 6.1%) accounting for the largest median household size of 3.17 persons per household. non-family households (226 | 59.8%) represent the smallest median household size with 1.16 persons per household.
| Household Type | # Households | Household Size |
| Married-Couple | 124 (32.8%) | 2.48 |
| Single Male/Father | 5 (1.3%) | 2.40 |
| Single Female/Mother | 23 (6.1%) | 3.17 |
| Non-family | 226 (59.8%) | 1.16 |
| Total Households | 378 (100.0%) | 1.73 |
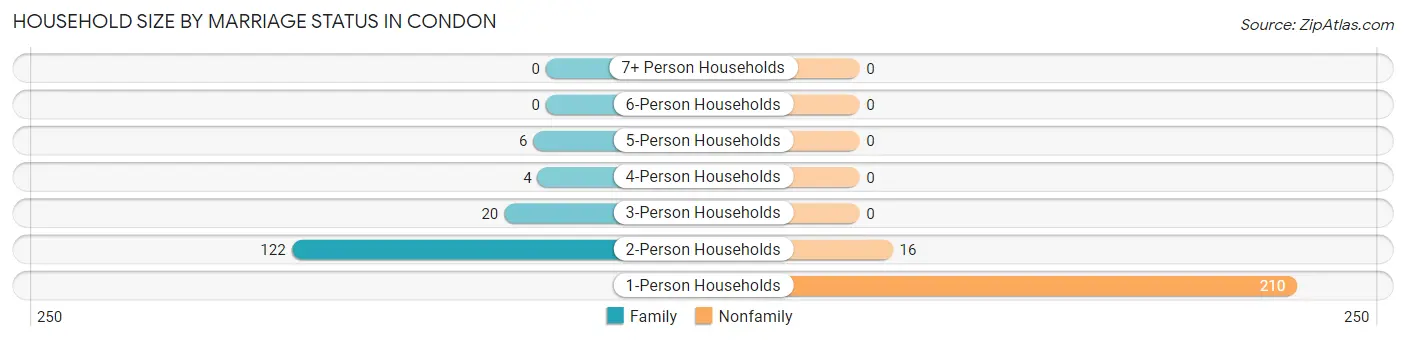
Household Size by Marriage Status in Condon
Out of a total of 378 households in Condon, 152 (40.2%) are family households, while 226 (59.8%) are nonfamily households. The most numerous type of family households are 2-person households, comprising 122, and the most common type of nonfamily households are 1-person households, comprising 210.
| Household Size | Family Households | Nonfamily Households |
| 1-Person Households | - | 210 (55.6%) |
| 2-Person Households | 122 (32.3%) | 16 (4.2%) |
| 3-Person Households | 20 (5.3%) | 0 (0.0%) |
| 4-Person Households | 4 (1.1%) | 0 (0.0%) |
| 5-Person Households | 6 (1.6%) | 0 (0.0%) |
| 6-Person Households | 0 (0.0%) | 0 (0.0%) |
| 7+ Person Households | 0 (0.0%) | 0 (0.0%) |
| Total | 152 (40.2%) | 226 (59.8%) |
Female Fertility in Condon
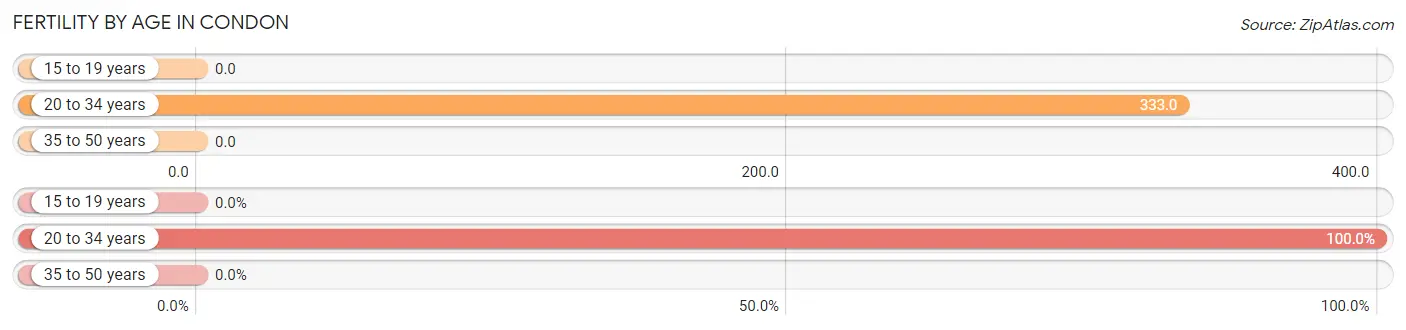
Fertility by Age in Condon
Average fertility rate in Condon is 48.0 births per 1,000 women. Women in the age bracket of 20 to 34 years have the highest fertility rate with 333.0 births per 1,000 women. Women in the age bracket of 20 to 34 years acount for 100.0% of all women with births.
| Age Bracket | Women with Births | Births / 1,000 Women |
| 15 to 19 years | 0 (0.0%) | 0.0 |
| 20 to 34 years | 4 (100.0%) | 333.0 |
| 35 to 50 years | 0 (0.0%) | 0.0 |
| Total | 4 (100.0%) | 48.0 |
Fertility by Age by Marriage Status in Condon
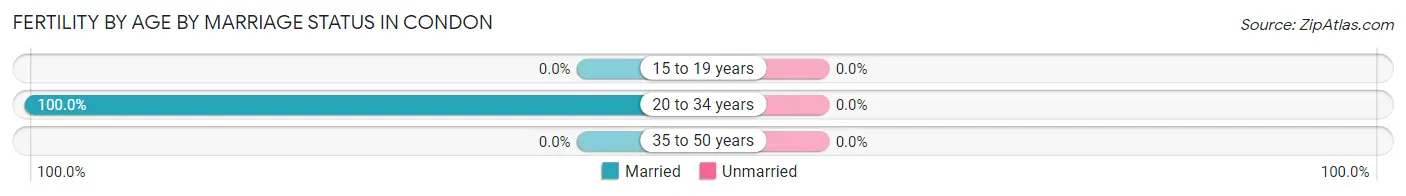
| Age Bracket | Married | Unmarried |
| 15 to 19 years | 0 (0.0%) | 0 (0.0%) |
| 20 to 34 years | 4 (100.0%) | 0 (0.0%) |
| 35 to 50 years | 0 (0.0%) | 0 (0.0%) |
| Total | 4 (100.0%) | 0 (0.0%) |
Fertility by Education in Condon
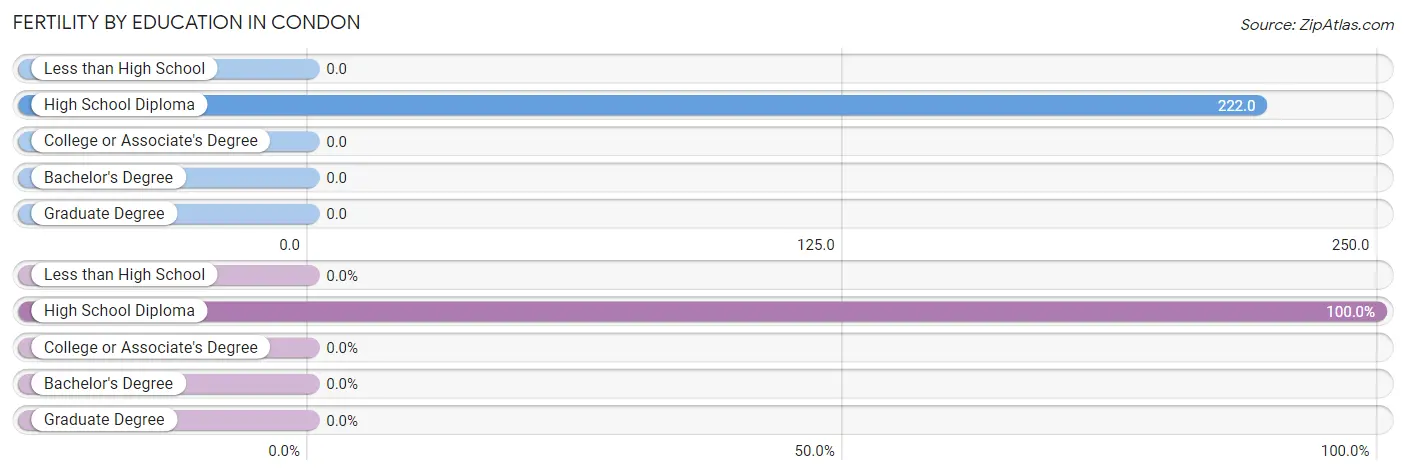
| Educational Attainment | Women with Births | Births / 1,000 Women |
| Less than High School | 0 (0.0%) | 0.0 |
| High School Diploma | 4 (100.0%) | 222.0 |
| College or Associate's Degree | 0 (0.0%) | 0.0 |
| Bachelor's Degree | 0 (0.0%) | 0.0 |
| Graduate Degree | 0 (0.0%) | 0.0 |
| Total | 4 (100.0%) | 48.0 |
Fertility by Education by Marriage Status in Condon
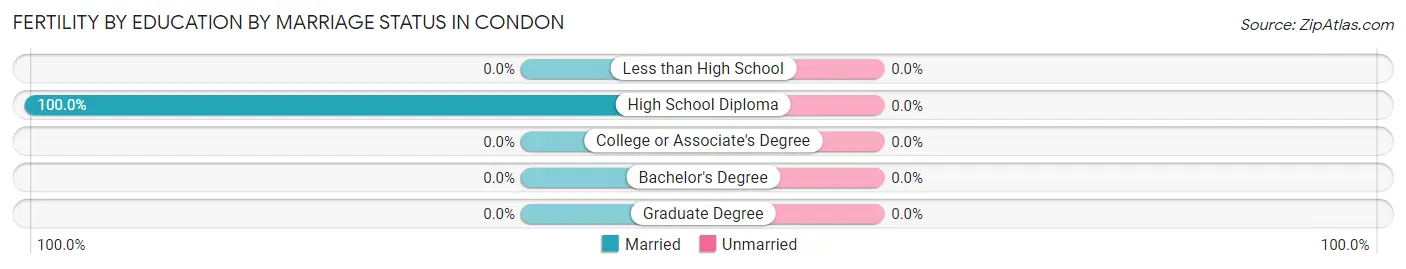
| Educational Attainment | Married | Unmarried |
| Less than High School | 0 (0.0%) | 0 (0.0%) |
| High School Diploma | 4 (100.0%) | 0 (0.0%) |
| College or Associate's Degree | 0 (0.0%) | 0 (0.0%) |
| Bachelor's Degree | 0 (0.0%) | 0 (0.0%) |
| Graduate Degree | 0 (0.0%) | 0 (0.0%) |
| Total | 4 (100.0%) | 0 (0.0%) |
Income in Condon
Income Overview in Condon
Per Capita Income in Condon is $29,869, while median incomes of families and households are $70,139 and $38,594 respectively.
| Characteristic | Number | Measure |
| Per Capita Income | 697 | $29,869 |
| Median Family Income | 152 | $70,139 |
| Mean Family Income | 152 | $76,768 |
| Median Household Income | 378 | $38,594 |
| Mean Household Income | 378 | $49,442 |
| Income Deficit | 152 | $0 |
| Wage / Income Gap (%) | 697 | 35.05% |
| Wage / Income Gap ($) | 697 | 64.95¢ per $1 |
| Gini / Inequality Index | 697 | 0.45 |
Earnings by Sex in Condon
Average Earnings in Condon are $34,750, $47,153 for men and $30,625 for women, a difference of 35.0%.
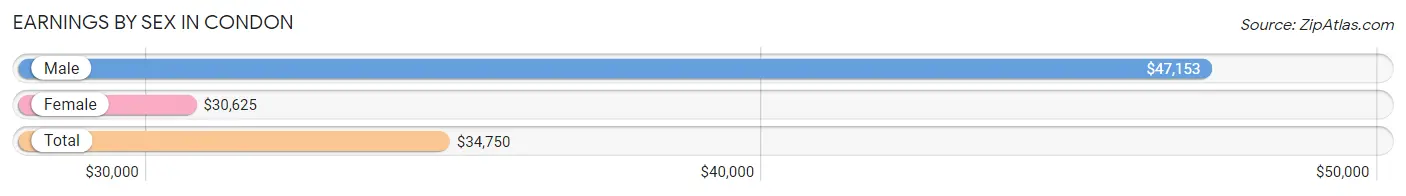
| Sex | Number | Average Earnings |
| Male | 151 (53.5%) | $47,153 |
| Female | 131 (46.5%) | $30,625 |
| Total | 282 (100.0%) | $34,750 |
Earnings by Sex by Income Bracket in Condon
The most common earnings brackets in Condon are $2,500 to $4,999 for men (42 | 27.8%) and $5,000 to $7,499 for women (36 | 27.5%).
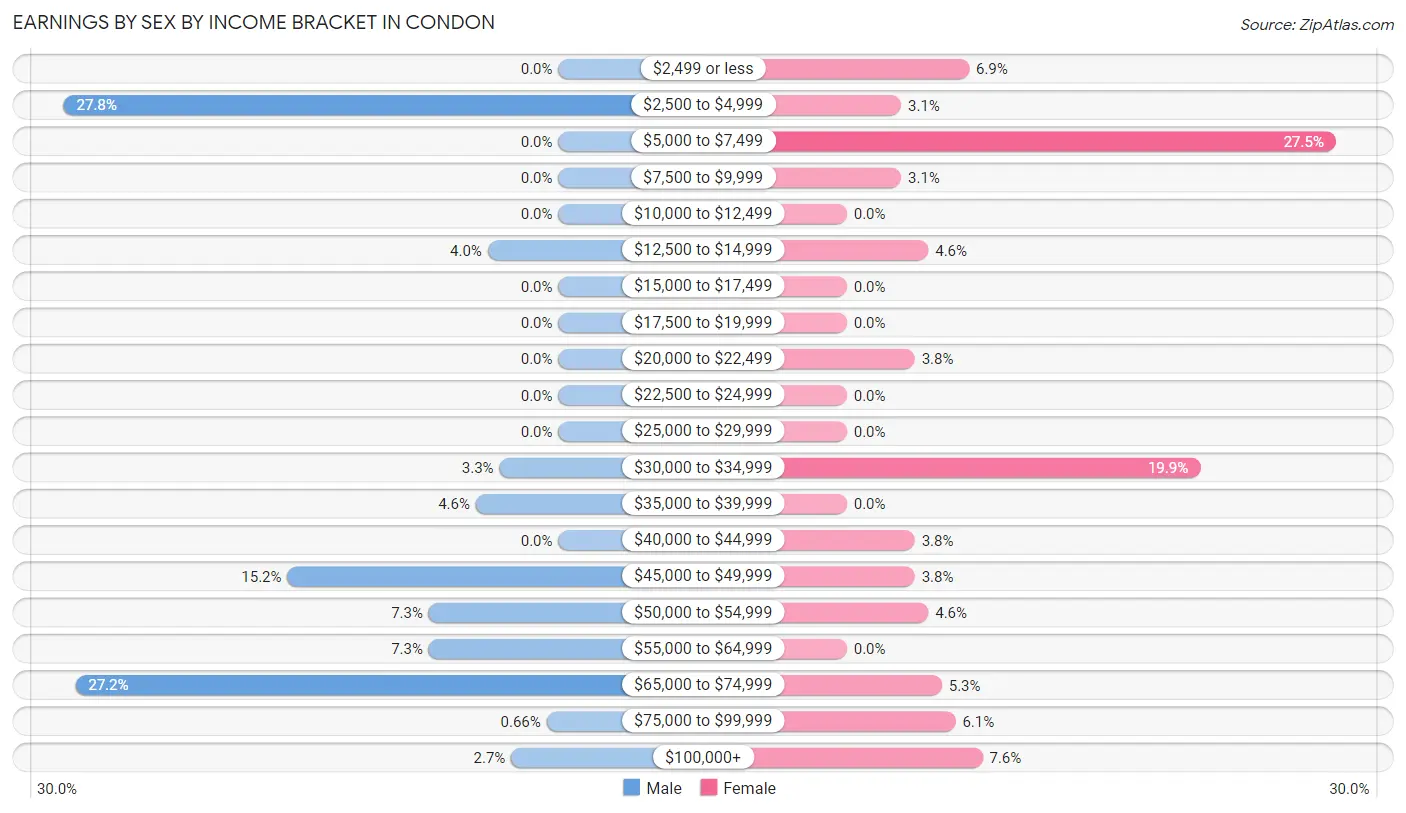
| Income | Male | Female |
| $2,499 or less | 0 (0.0%) | 9 (6.9%) |
| $2,500 to $4,999 | 42 (27.8%) | 4 (3.0%) |
| $5,000 to $7,499 | 0 (0.0%) | 36 (27.5%) |
| $7,500 to $9,999 | 0 (0.0%) | 4 (3.0%) |
| $10,000 to $12,499 | 0 (0.0%) | 0 (0.0%) |
| $12,500 to $14,999 | 6 (4.0%) | 6 (4.6%) |
| $15,000 to $17,499 | 0 (0.0%) | 0 (0.0%) |
| $17,500 to $19,999 | 0 (0.0%) | 0 (0.0%) |
| $20,000 to $22,499 | 0 (0.0%) | 5 (3.8%) |
| $22,500 to $24,999 | 0 (0.0%) | 0 (0.0%) |
| $25,000 to $29,999 | 0 (0.0%) | 0 (0.0%) |
| $30,000 to $34,999 | 5 (3.3%) | 26 (19.9%) |
| $35,000 to $39,999 | 7 (4.6%) | 0 (0.0%) |
| $40,000 to $44,999 | 0 (0.0%) | 5 (3.8%) |
| $45,000 to $49,999 | 23 (15.2%) | 5 (3.8%) |
| $50,000 to $54,999 | 11 (7.3%) | 6 (4.6%) |
| $55,000 to $64,999 | 11 (7.3%) | 0 (0.0%) |
| $65,000 to $74,999 | 41 (27.2%) | 7 (5.3%) |
| $75,000 to $99,999 | 1 (0.7%) | 8 (6.1%) |
| $100,000+ | 4 (2.6%) | 10 (7.6%) |
| Total | 151 (100.0%) | 131 (100.0%) |
Earnings by Sex by Educational Attainment in Condon
Average earnings in Condon are $50,250 for men and $33,750 for women, a difference of 32.8%. Men with an educational attainment of high school diploma enjoy the highest average annual earnings of $46,944, while those with high school diploma education earn the least with $46,944. Women with an educational attainment of high school diploma earn the most with the average annual earnings of $32,917, while those with high school diploma education have the smallest earnings of $32,917.
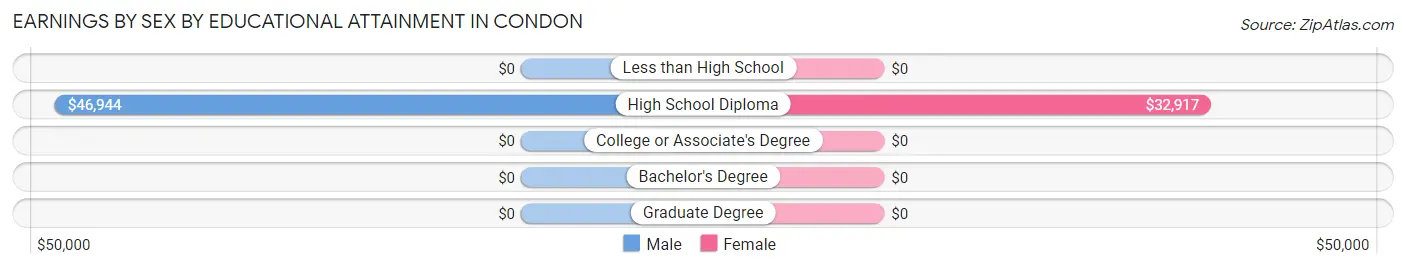
| Educational Attainment | Male Income | Female Income |
| Less than High School | - | - |
| High School Diploma | $46,944 | $32,917 |
| College or Associate's Degree | - | - |
| Bachelor's Degree | - | - |
| Graduate Degree | - | - |
| Total | $50,250 | $33,750 |
Family Income in Condon
Family Income Brackets in Condon
According to the Condon family income data, there are 46 families falling into the $50,000 to $74,999 income range, which is the most common income bracket and makes up 30.3% of all families.
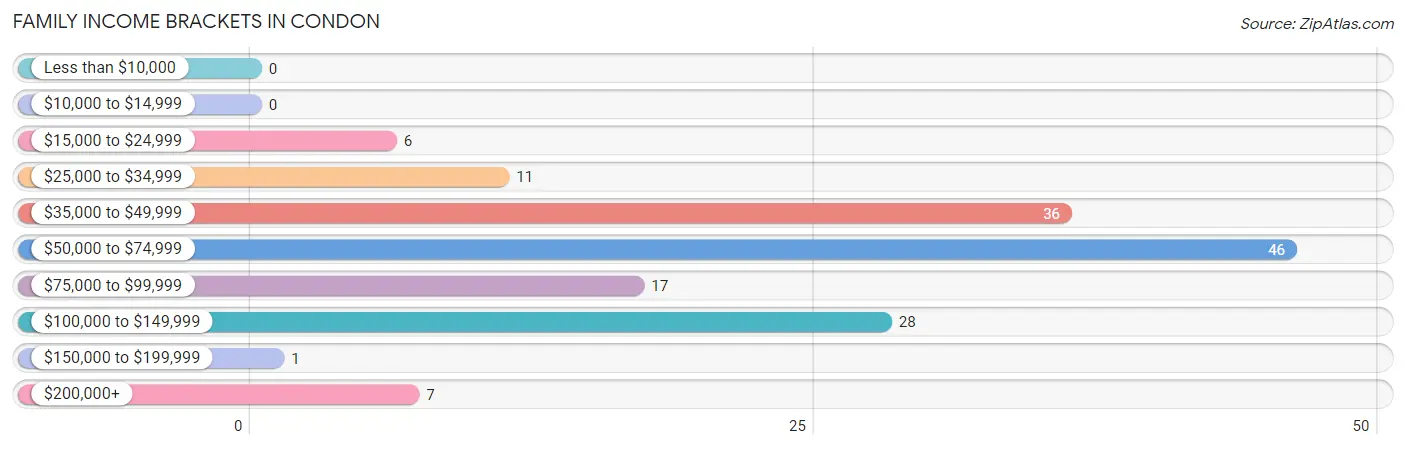
| Income Bracket | # Families | % Families |
| Less than $10,000 | 0 | 0.0% |
| $10,000 to $14,999 | 0 | 0.0% |
| $15,000 to $24,999 | 6 | 3.9% |
| $25,000 to $34,999 | 11 | 7.2% |
| $35,000 to $49,999 | 36 | 23.7% |
| $50,000 to $74,999 | 46 | 30.3% |
| $75,000 to $99,999 | 17 | 11.2% |
| $100,000 to $149,999 | 28 | 18.4% |
| $150,000 to $199,999 | 1 | 0.7% |
| $200,000+ | 7 | 4.6% |
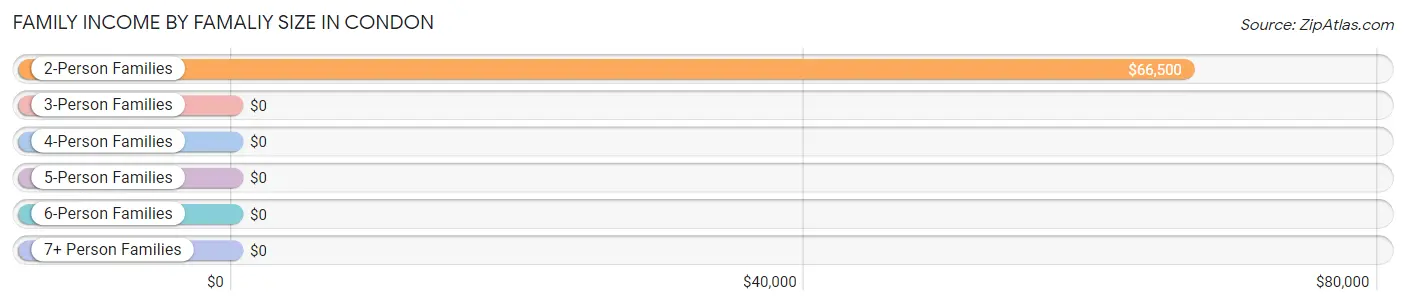
Family Income by Famaliy Size in Condon
2-person families (122 | 80.3%) account for the highest median family income in Condon with $66,500 per family, while 2-person families (122 | 80.3%) have the highest median income of $33,250 per family member.
| Income Bracket | # Families | Median Income |
| 2-Person Families | 122 (80.3%) | $66,500 |
| 3-Person Families | 20 (13.2%) | $0 |
| 4-Person Families | 4 (2.6%) | $0 |
| 5-Person Families | 6 (4.0%) | $0 |
| 6-Person Families | 0 (0.0%) | $0 |
| 7+ Person Families | 0 (0.0%) | $0 |
| Total | 152 (100.0%) | $70,139 |
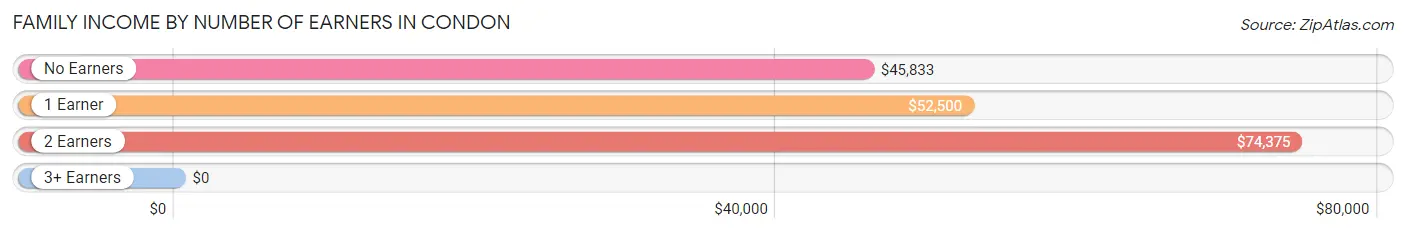
Family Income by Number of Earners in Condon
| Number of Earners | # Families | Median Income |
| No Earners | 64 (42.1%) | $45,833 |
| 1 Earner | 24 (15.8%) | $52,500 |
| 2 Earners | 53 (34.9%) | $74,375 |
| 3+ Earners | 11 (7.2%) | $0 |
| Total | 152 (100.0%) | $70,139 |
Household Income in Condon
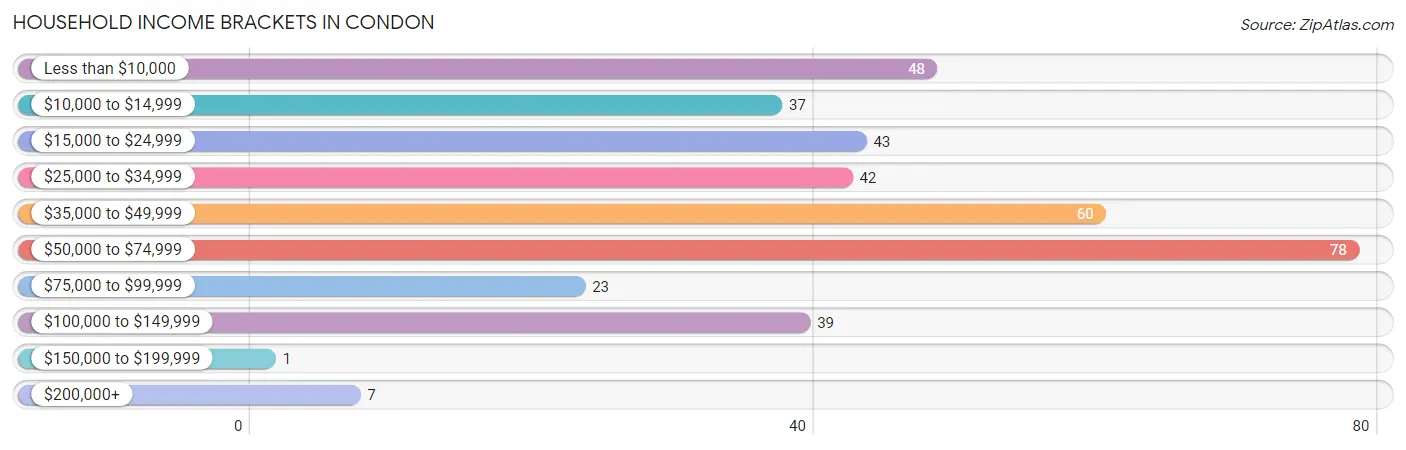
Household Income Brackets in Condon
With 78 households falling in the category, the $50,000 to $74,999 income range is the most frequent in Condon, accounting for 20.6% of all households. In contrast, only 1 households (0.3%) fall into the $150,000 to $199,999 income bracket, making it the least populous group.
| Income Bracket | # Households | % Households |
| Less than $10,000 | 48 | 12.7% |
| $10,000 to $14,999 | 37 | 9.8% |
| $15,000 to $24,999 | 43 | 11.4% |
| $25,000 to $34,999 | 42 | 11.1% |
| $35,000 to $49,999 | 60 | 15.9% |
| $50,000 to $74,999 | 78 | 20.6% |
| $75,000 to $99,999 | 23 | 6.1% |
| $100,000 to $149,999 | 39 | 10.3% |
| $150,000 to $199,999 | 1 | 0.3% |
| $200,000+ | 7 | 1.9% |
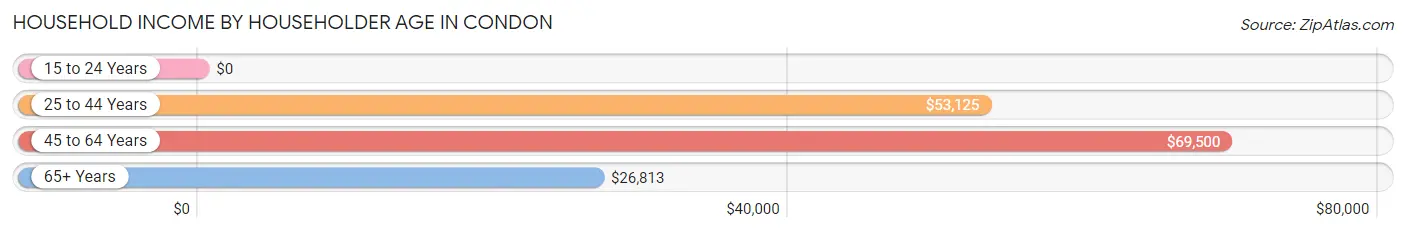
Household Income by Householder Age in Condon
The median household income in Condon is $38,594, with the highest median household income of $69,500 found in the 45 to 64 years age bracket for the primary householder. A total of 108 households (28.6%) fall into this category.
| Income Bracket | # Households | Median Income |
| 15 to 24 Years | 0 (0.0%) | $0 |
| 25 to 44 Years | 43 (11.4%) | $53,125 |
| 45 to 64 Years | 108 (28.6%) | $69,500 |
| 65+ Years | 227 (60.1%) | $26,813 |
| Total | 378 (100.0%) | $38,594 |
Poverty in Condon
Income Below Poverty by Sex and Age in Condon
With 15.7% poverty level for males and 22.2% for females among the residents of Condon, 65 to 74 year old males and 18 to 24 year old females are the most vulnerable to poverty, with 48 males (43.6%) and 25 females (100.0%) in their respective age groups living below the poverty level.
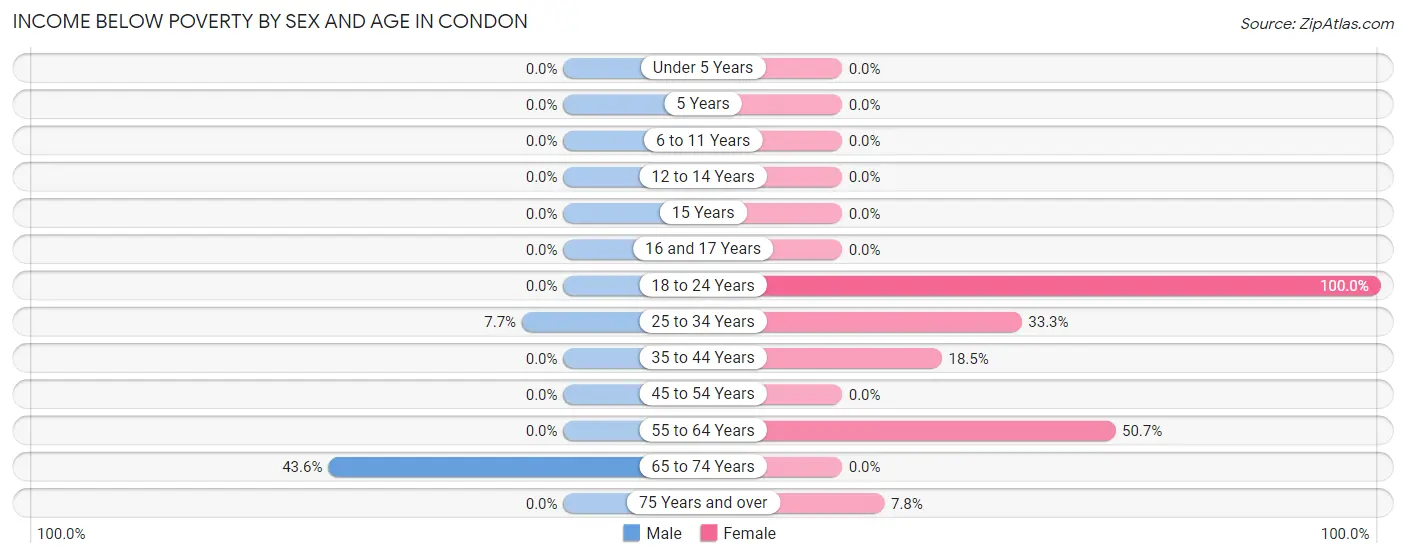
| Age Bracket | Male | Female |
| Under 5 Years | 0 (0.0%) | 0 (0.0%) |
| 5 Years | 0 (0.0%) | 0 (0.0%) |
| 6 to 11 Years | 0 (0.0%) | 0 (0.0%) |
| 12 to 14 Years | 0 (0.0%) | 0 (0.0%) |
| 15 Years | 0 (0.0%) | 0 (0.0%) |
| 16 and 17 Years | 0 (0.0%) | 0 (0.0%) |
| 18 to 24 Years | 0 (0.0%) | 25 (100.0%) |
| 25 to 34 Years | 2 (7.7%) | 4 (33.3%) |
| 35 to 44 Years | 0 (0.0%) | 5 (18.5%) |
| 45 to 54 Years | 0 (0.0%) | 0 (0.0%) |
| 55 to 64 Years | 0 (0.0%) | 35 (50.7%) |
| 65 to 74 Years | 48 (43.6%) | 0 (0.0%) |
| 75 Years and over | 0 (0.0%) | 8 (7.8%) |
| Total | 50 (15.7%) | 77 (22.2%) |
Income Above Poverty by Sex and Age in Condon
According to the poverty statistics in Condon, males aged under 5 years and females aged 6 to 11 years are the age groups that are most secure financially, with 100.0% of males and 100.0% of females in these age groups living above the poverty line.
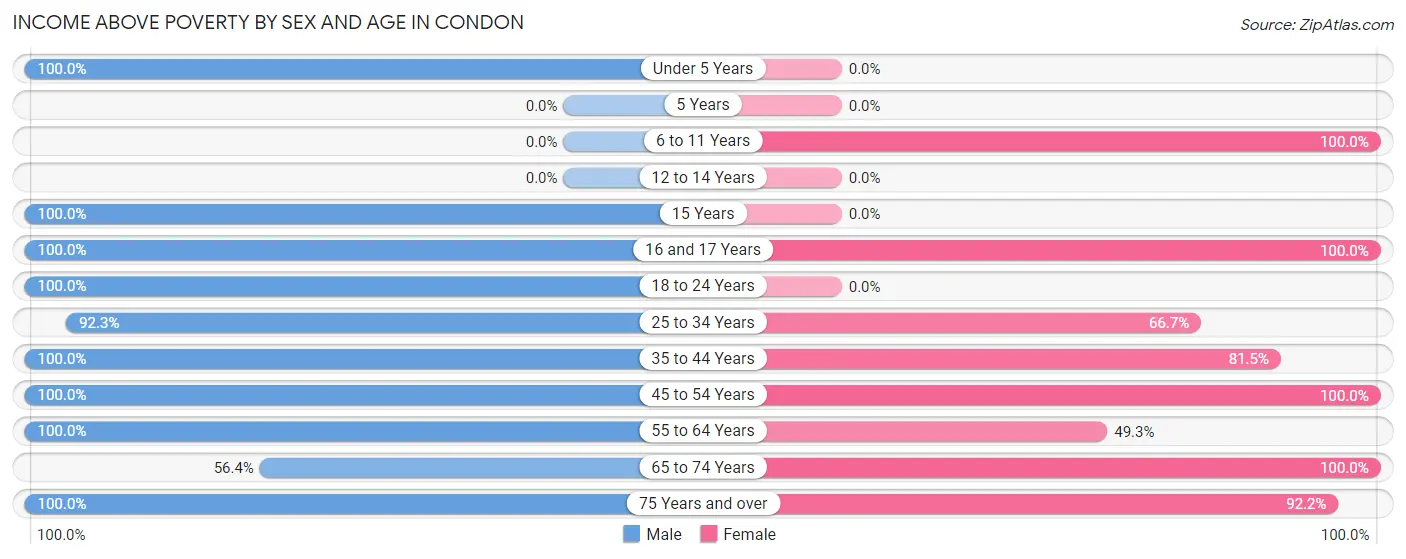
| Age Bracket | Male | Female |
| Under 5 Years | 16 (100.0%) | 0 (0.0%) |
| 5 Years | 0 (0.0%) | 0 (0.0%) |
| 6 to 11 Years | 0 (0.0%) | 22 (100.0%) |
| 12 to 14 Years | 0 (0.0%) | 0 (0.0%) |
| 15 Years | 2 (100.0%) | 0 (0.0%) |
| 16 and 17 Years | 14 (100.0%) | 4 (100.0%) |
| 18 to 24 Years | 7 (100.0%) | 0 (0.0%) |
| 25 to 34 Years | 24 (92.3%) | 8 (66.7%) |
| 35 to 44 Years | 26 (100.0%) | 22 (81.5%) |
| 45 to 54 Years | 33 (100.0%) | 23 (100.0%) |
| 55 to 64 Years | 55 (100.0%) | 34 (49.3%) |
| 65 to 74 Years | 62 (56.4%) | 63 (100.0%) |
| 75 Years and over | 30 (100.0%) | 94 (92.2%) |
| Total | 269 (84.3%) | 270 (77.8%) |
Income Below Poverty Among Married-Couple Families in Condon
| Children | Above Poverty | Below Poverty |
| No Children | 94 (100.0%) | 0 (0.0%) |
| 1 or 2 Children | 24 (100.0%) | 0 (0.0%) |
| 3 or 4 Children | 6 (100.0%) | 0 (0.0%) |
| 5 or more Children | 0 (0.0%) | 0 (0.0%) |
| Total | 124 (100.0%) | 0 (0.0%) |
Income Below Poverty Among Single-Parent Households in Condon
| Children | Single Father | Single Mother |
| No Children | 0 (0.0%) | 0 (0.0%) |
| 1 or 2 Children | 0 (0.0%) | 0 (0.0%) |
| 3 or 4 Children | 0 (0.0%) | 0 (0.0%) |
| 5 or more Children | 0 (0.0%) | 0 (0.0%) |
| Total | 0 (0.0%) | 0 (0.0%) |
Income Below Poverty Among Married-Couple vs Single-Parent Households in Condon
| Children | Married-Couple Families | Single-Parent Households |
| No Children | 0 (0.0%) | 0 (0.0%) |
| 1 or 2 Children | 0 (0.0%) | 0 (0.0%) |
| 3 or 4 Children | 0 (0.0%) | 0 (0.0%) |
| 5 or more Children | 0 (0.0%) | 0 (0.0%) |
| Total | 0 (0.0%) | 0 (0.0%) |
Employment Characteristics in Condon
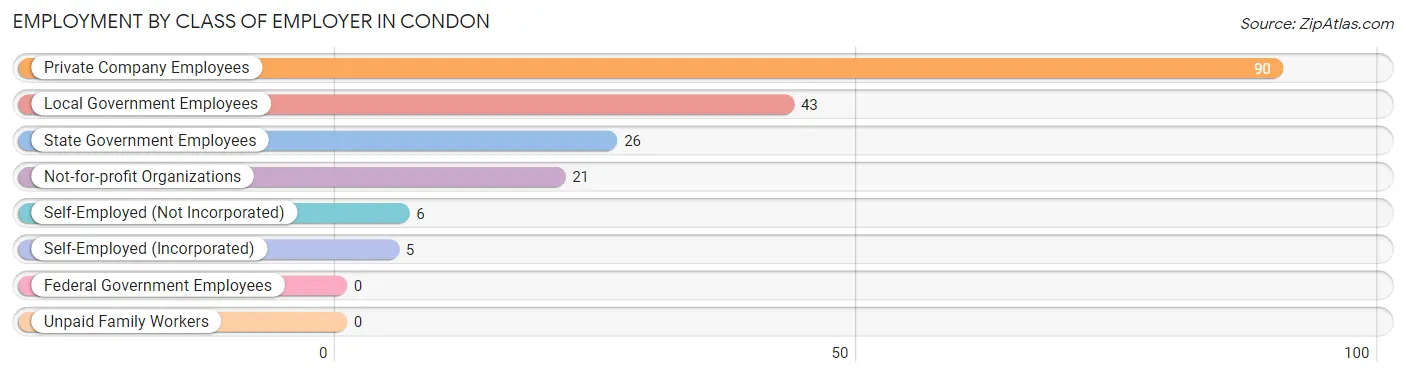
Employment by Class of Employer in Condon
Among the 191 employed individuals in Condon, private company employees (90 | 47.1%), local government employees (43 | 22.5%), and state government employees (26 | 13.6%) make up the most common classes of employment.
| Employer Class | # Employees | % Employees |
| Private Company Employees | 90 | 47.1% |
| Self-Employed (Incorporated) | 5 | 2.6% |
| Self-Employed (Not Incorporated) | 6 | 3.1% |
| Not-for-profit Organizations | 21 | 11.0% |
| Local Government Employees | 43 | 22.5% |
| State Government Employees | 26 | 13.6% |
| Federal Government Employees | 0 | 0.0% |
| Unpaid Family Workers | 0 | 0.0% |
| Total | 191 | 100.0% |
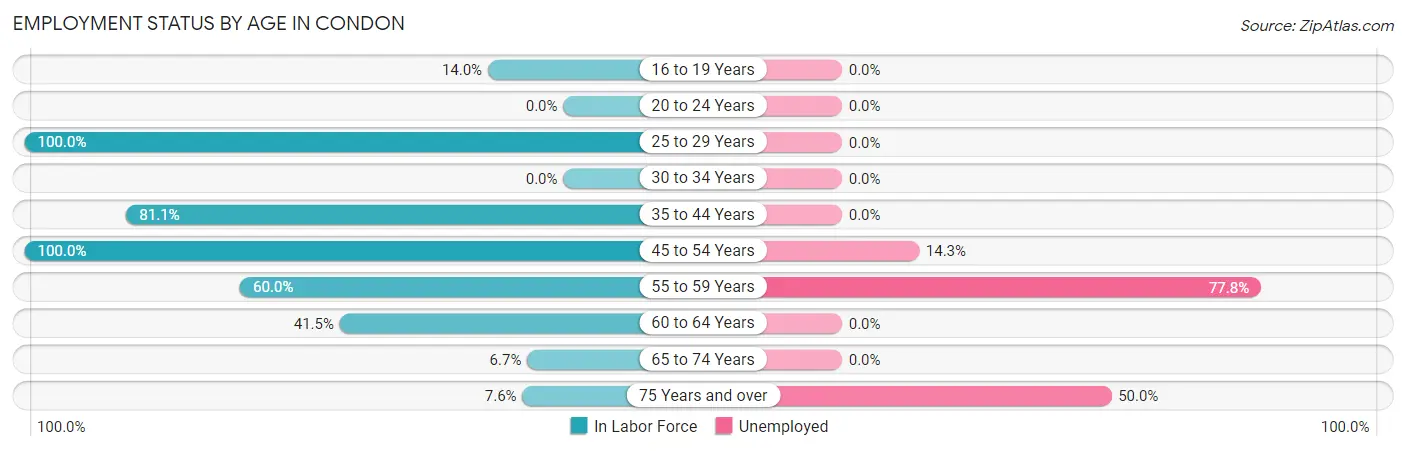
Employment Status by Age in Condon
According to the labor force statistics for Condon, out of the total population over 16 years of age (657), 33.9% or 223 individuals are in the labor force, with 12.6% or 28 of them unemployed. The age group with the highest labor force participation rate is 25 to 29 years, with 100.0% or 36 individuals in the labor force. Within the labor force, the 55 to 59 years age range has the highest percentage of unemployed individuals, with 77.8% or 14 of them being unemployed.
| Age Bracket | In Labor Force | Unemployed |
| 16 to 19 Years | 7 (14.0%) | 0 (0.0%) |
| 20 to 24 Years | 0 (0.0%) | 0 (0.0%) |
| 25 to 29 Years | 36 (100.0%) | 0 (0.0%) |
| 30 to 34 Years | 0 (0.0%) | 0 (0.0%) |
| 35 to 44 Years | 43 (81.1%) | 0 (0.0%) |
| 45 to 54 Years | 56 (100.0%) | 8 (14.3%) |
| 55 to 59 Years | 18 (60.0%) | 14 (77.8%) |
| 60 to 64 Years | 39 (41.5%) | 0 (0.0%) |
| 65 to 74 Years | 12 (6.7%) | 0 (0.0%) |
| 75 Years and over | 12 (7.6%) | 6 (50.0%) |
| Total | 223 (33.9%) | 28 (12.6%) |
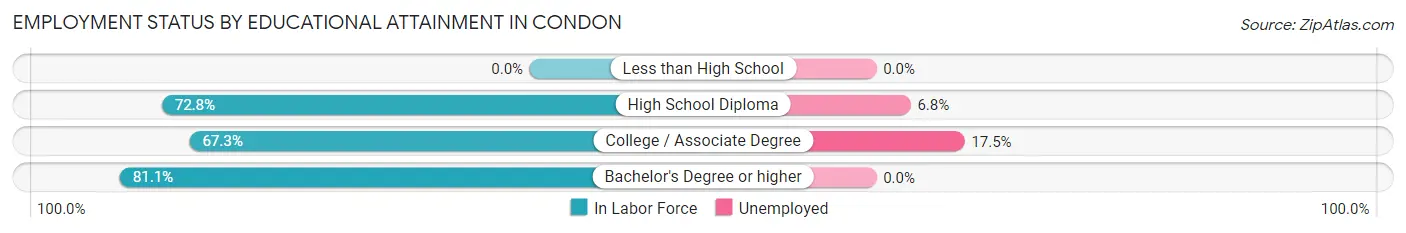
Employment Status by Educational Attainment in Condon
According to labor force statistics for Condon, 70.8% of individuals (192) out of the total population between 25 and 64 years of age (271) are in the labor force, with 11.5% or 22 of them being unemployed. The group with the highest labor force participation rate are those with the educational attainment of bachelor's degree or higher, with 81.1% or 30 individuals in the labor force. Within the labor force, individuals with college / associate degree education have the highest percentage of unemployment, with 17.5% or 18 of them being unemployed.
| Educational Attainment | In Labor Force | Unemployed |
| Less than High School | 0 (0.0%) | 0 (0.0%) |
| High School Diploma | 59 (72.8%) | 6 (6.8%) |
| College / Associate Degree | 103 (67.3%) | 27 (17.5%) |
| Bachelor's Degree or higher | 30 (81.1%) | 0 (0.0%) |
| Total | 192 (70.8%) | 31 (11.5%) |
Employment Occupations by Sex in Condon
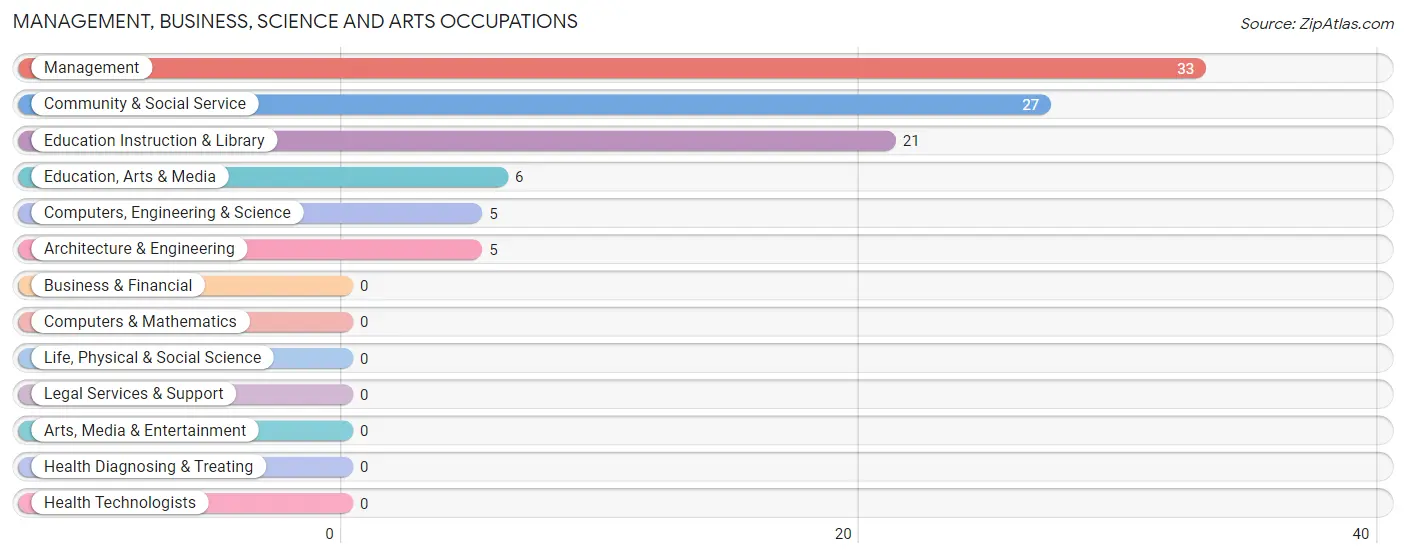
Management, Business, Science and Arts Occupations
The most common Management, Business, Science and Arts occupations in Condon are Management (33 | 16.9%), Community & Social Service (27 | 13.9%), Education Instruction & Library (21 | 10.8%), Education, Arts & Media (6 | 3.1%), and Computers, Engineering & Science (5 | 2.6%).
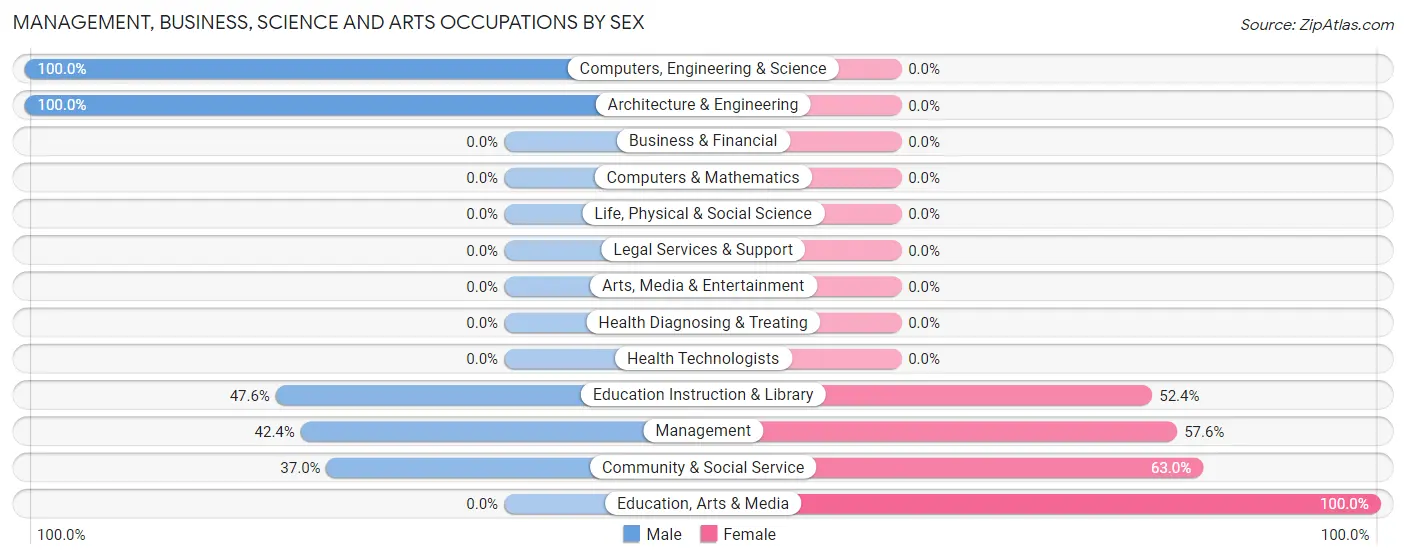
Management, Business, Science and Arts Occupations by Sex
Within the Management, Business, Science and Arts occupations in Condon, the most male-oriented occupations are Computers, Engineering & Science (100.0%), Architecture & Engineering (100.0%), and Education Instruction & Library (47.6%), while the most female-oriented occupations are Education, Arts & Media (100.0%), Community & Social Service (63.0%), and Management (57.6%).
| Occupation | Male | Female |
| Management | 14 (42.4%) | 19 (57.6%) |
| Business & Financial | 0 (0.0%) | 0 (0.0%) |
| Computers, Engineering & Science | 5 (100.0%) | 0 (0.0%) |
| Computers & Mathematics | 0 (0.0%) | 0 (0.0%) |
| Architecture & Engineering | 5 (100.0%) | 0 (0.0%) |
| Life, Physical & Social Science | 0 (0.0%) | 0 (0.0%) |
| Community & Social Service | 10 (37.0%) | 17 (63.0%) |
| Education, Arts & Media | 0 (0.0%) | 6 (100.0%) |
| Legal Services & Support | 0 (0.0%) | 0 (0.0%) |
| Education Instruction & Library | 10 (47.6%) | 11 (52.4%) |
| Arts, Media & Entertainment | 0 (0.0%) | 0 (0.0%) |
| Health Diagnosing & Treating | 0 (0.0%) | 0 (0.0%) |
| Health Technologists | 0 (0.0%) | 0 (0.0%) |
| Total (Category) | 29 (44.6%) | 36 (55.4%) |
| Total (Overall) | 112 (57.4%) | 83 (42.6%) |
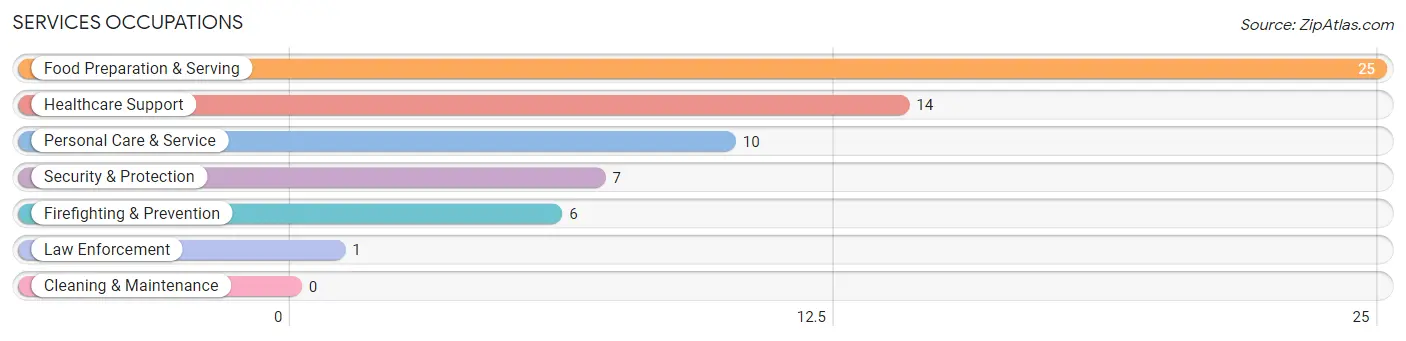
Services Occupations
The most common Services occupations in Condon are Food Preparation & Serving (25 | 12.8%), Healthcare Support (14 | 7.2%), Personal Care & Service (10 | 5.1%), Security & Protection (7 | 3.6%), and Firefighting & Prevention (6 | 3.1%).
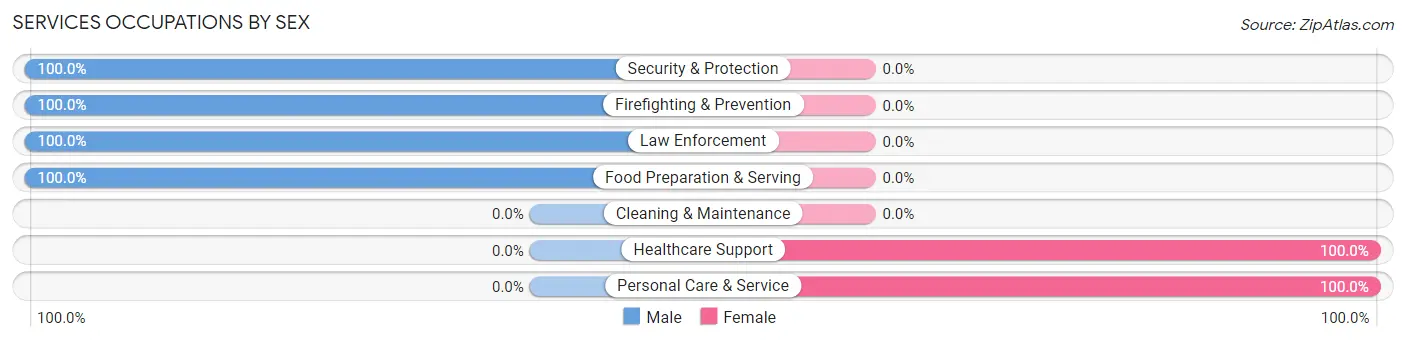
Services Occupations by Sex
Within the Services occupations in Condon, the most male-oriented occupations are Security & Protection (100.0%), Firefighting & Prevention (100.0%), and Law Enforcement (100.0%), while the most female-oriented occupations are Healthcare Support (100.0%), and Personal Care & Service (100.0%).
| Occupation | Male | Female |
| Healthcare Support | 0 (0.0%) | 14 (100.0%) |
| Security & Protection | 7 (100.0%) | 0 (0.0%) |
| Firefighting & Prevention | 6 (100.0%) | 0 (0.0%) |
| Law Enforcement | 1 (100.0%) | 0 (0.0%) |
| Food Preparation & Serving | 25 (100.0%) | 0 (0.0%) |
| Cleaning & Maintenance | 0 (0.0%) | 0 (0.0%) |
| Personal Care & Service | 0 (0.0%) | 10 (100.0%) |
| Total (Category) | 32 (57.1%) | 24 (42.9%) |
| Total (Overall) | 112 (57.4%) | 83 (42.6%) |
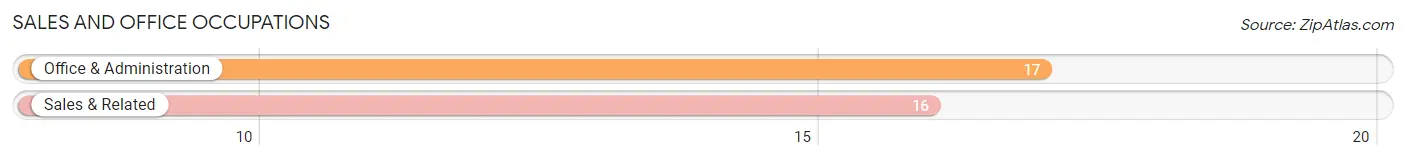
Sales and Office Occupations
The most common Sales and Office occupations in Condon are Office & Administration (17 | 8.7%), and Sales & Related (16 | 8.2%).
Sales and Office Occupations by Sex
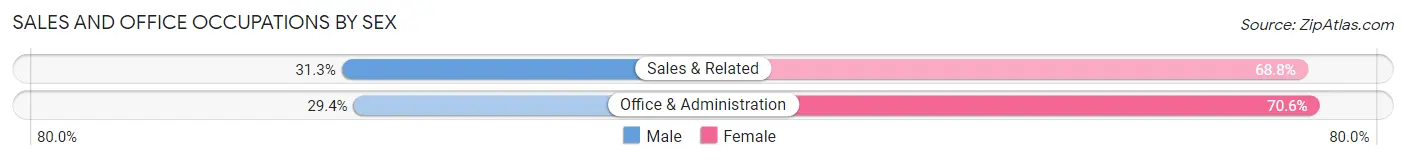
| Occupation | Male | Female |
| Sales & Related | 5 (31.2%) | 11 (68.8%) |
| Office & Administration | 5 (29.4%) | 12 (70.6%) |
| Total (Category) | 10 (30.3%) | 23 (69.7%) |
| Total (Overall) | 112 (57.4%) | 83 (42.6%) |
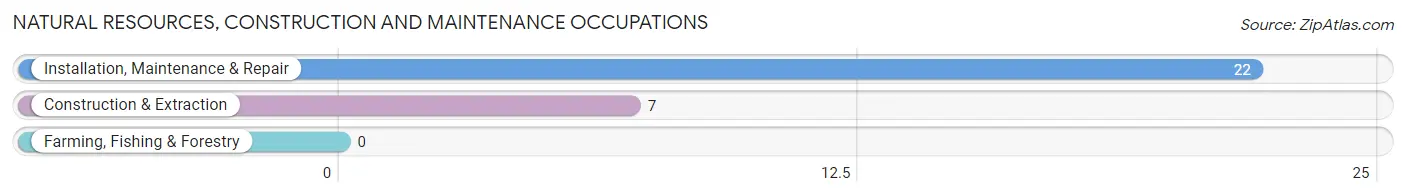
Natural Resources, Construction and Maintenance Occupations
The most common Natural Resources, Construction and Maintenance occupations in Condon are Installation, Maintenance & Repair (22 | 11.3%), and Construction & Extraction (7 | 3.6%).
Natural Resources, Construction and Maintenance Occupations by Sex
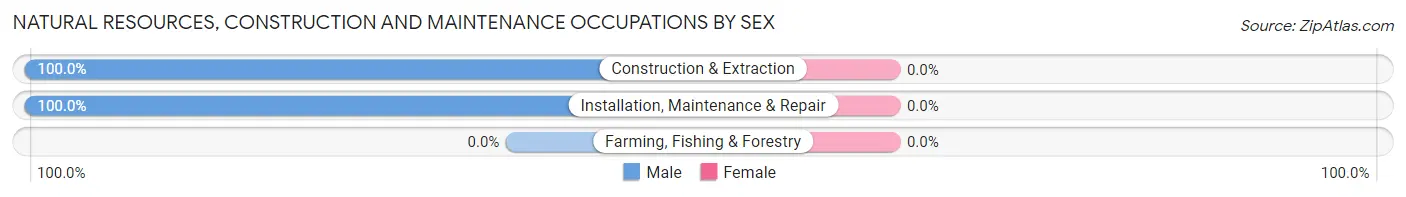
| Occupation | Male | Female |
| Farming, Fishing & Forestry | 0 (0.0%) | 0 (0.0%) |
| Construction & Extraction | 7 (100.0%) | 0 (0.0%) |
| Installation, Maintenance & Repair | 22 (100.0%) | 0 (0.0%) |
| Total (Category) | 29 (100.0%) | 0 (0.0%) |
| Total (Overall) | 112 (57.4%) | 83 (42.6%) |
Production, Transportation and Moving Occupations
The most common Production, Transportation and Moving occupations in Condon are Production (6 | 3.1%), and Material Moving (6 | 3.1%).

Production, Transportation and Moving Occupations by Sex
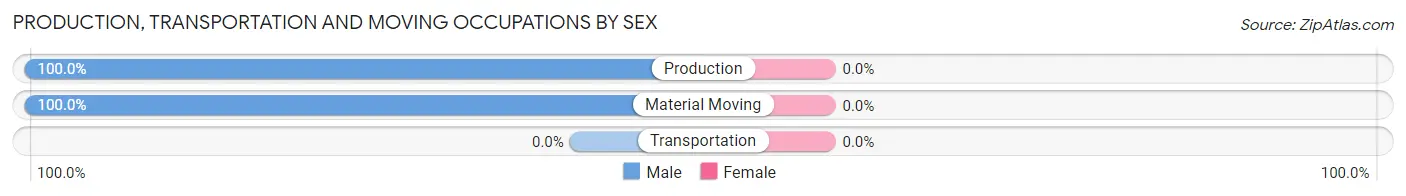
| Occupation | Male | Female |
| Production | 6 (100.0%) | 0 (0.0%) |
| Transportation | 0 (0.0%) | 0 (0.0%) |
| Material Moving | 6 (100.0%) | 0 (0.0%) |
| Total (Category) | 12 (100.0%) | 0 (0.0%) |
| Total (Overall) | 112 (57.4%) | 83 (42.6%) |
Employment Industries by Sex in Condon
Employment Industries in Condon
The major employment industries in Condon include Public Administration (37 | 19.0%), Educational Services (29 | 14.9%), Health Care & Social Assistance (28 | 14.4%), Accommodation & Food Services (25 | 12.8%), and Manufacturing (18 | 9.2%).
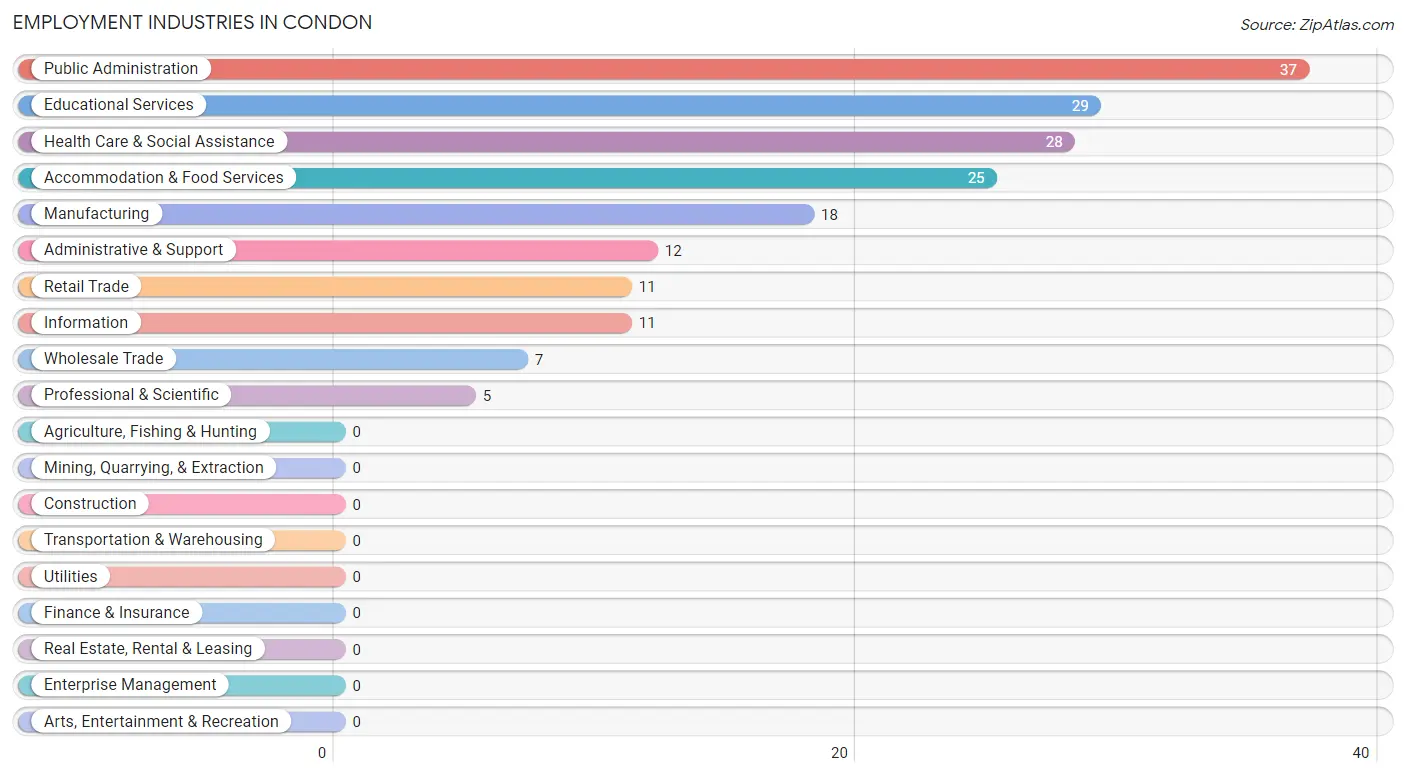
Employment Industries by Sex in Condon
The Condon industries that see more men than women are Manufacturing (100.0%), Wholesale Trade (100.0%), and Professional & Scientific (100.0%), whereas the industries that tend to have a higher number of women are Health Care & Social Assistance (100.0%), Retail Trade (54.5%), and Public Administration (48.6%).

| Industry | Male | Female |
| Agriculture, Fishing & Hunting | 0 (0.0%) | 0 (0.0%) |
| Mining, Quarrying, & Extraction | 0 (0.0%) | 0 (0.0%) |
| Construction | 0 (0.0%) | 0 (0.0%) |
| Manufacturing | 18 (100.0%) | 0 (0.0%) |
| Wholesale Trade | 7 (100.0%) | 0 (0.0%) |
| Retail Trade | 5 (45.5%) | 6 (54.5%) |
| Transportation & Warehousing | 0 (0.0%) | 0 (0.0%) |
| Utilities | 0 (0.0%) | 0 (0.0%) |
| Information | 6 (54.5%) | 5 (45.5%) |
| Finance & Insurance | 0 (0.0%) | 0 (0.0%) |
| Real Estate, Rental & Leasing | 0 (0.0%) | 0 (0.0%) |
| Professional & Scientific | 5 (100.0%) | 0 (0.0%) |
| Enterprise Management | 0 (0.0%) | 0 (0.0%) |
| Administrative & Support | 12 (100.0%) | 0 (0.0%) |
| Educational Services | 15 (51.7%) | 14 (48.3%) |
| Health Care & Social Assistance | 0 (0.0%) | 28 (100.0%) |
| Arts, Entertainment & Recreation | 0 (0.0%) | 0 (0.0%) |
| Accommodation & Food Services | 25 (100.0%) | 0 (0.0%) |
| Public Administration | 19 (51.3%) | 18 (48.6%) |
| Total | 112 (57.4%) | 83 (42.6%) |
Education in Condon
School Enrollment in Condon
The most common levels of schooling among the 86 students in Condon are high school (45 | 52.3%), elementary school (14 | 16.3%), and nursery / preschool (8 | 9.3%).
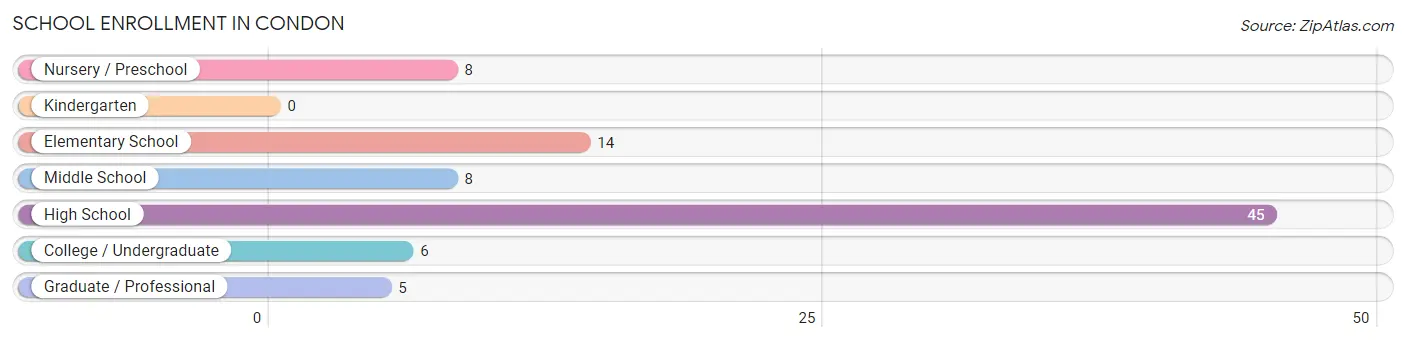
| School Level | # Students | % Students |
| Nursery / Preschool | 8 | 9.3% |
| Kindergarten | 0 | 0.0% |
| Elementary School | 14 | 16.3% |
| Middle School | 8 | 9.3% |
| High School | 45 | 52.3% |
| College / Undergraduate | 6 | 7.0% |
| Graduate / Professional | 5 | 5.8% |
| Total | 86 | 100.0% |
School Enrollment by Age by Funding Source in Condon
Out of a total of 86 students who are enrolled in schools in Condon, 8 (9.3%) attend a private institution, while the remaining 78 (90.7%) are enrolled in public schools. The age group of 3 to 4 year olds has the highest likelihood of being enrolled in private schools, with 8 (100.0% in the age bracket) enrolled. Conversely, the age group of 5 to 9 year old has the lowest likelihood of being enrolled in a private school, with 14 (100.0% in the age bracket) attending a public institution.
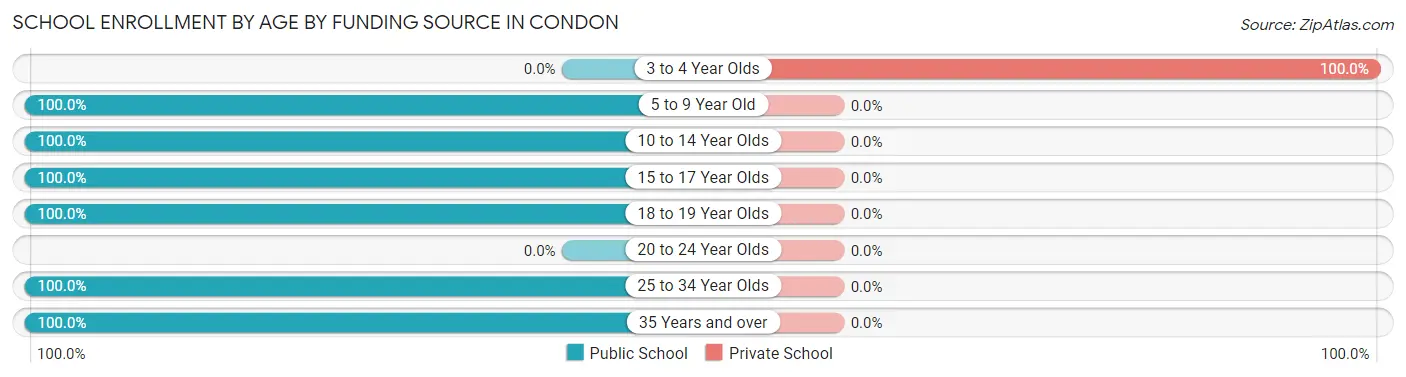
| Age Bracket | Public School | Private School |
| 3 to 4 Year Olds | 0 (0.0%) | 8 (100.0%) |
| 5 to 9 Year Old | 14 (100.0%) | 0 (0.0%) |
| 10 to 14 Year Olds | 8 (100.0%) | 0 (0.0%) |
| 15 to 17 Year Olds | 20 (100.0%) | 0 (0.0%) |
| 18 to 19 Year Olds | 25 (100.0%) | 0 (0.0%) |
| 20 to 24 Year Olds | 0 (0.0%) | 0 (0.0%) |
| 25 to 34 Year Olds | 6 (100.0%) | 0 (0.0%) |
| 35 Years and over | 5 (100.0%) | 0 (0.0%) |
| Total | 78 (90.7%) | 8 (9.3%) |
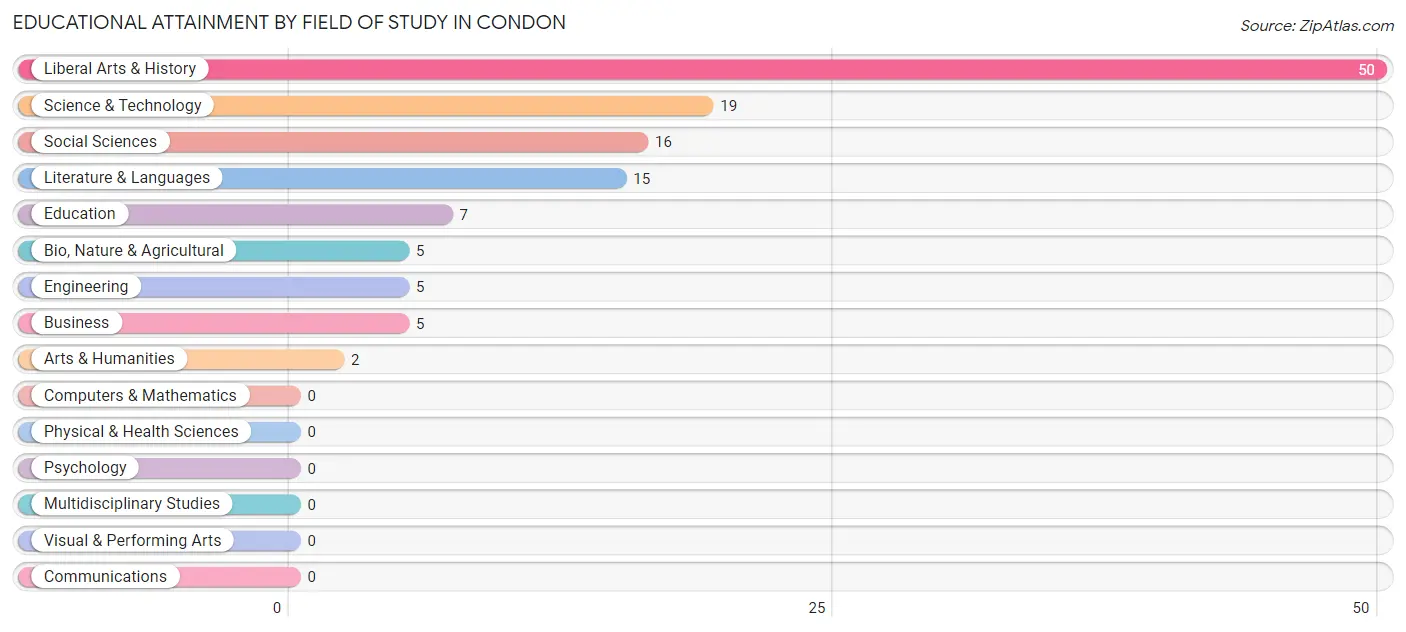
Educational Attainment by Field of Study in Condon
Liberal arts & history (50 | 40.3%), science & technology (19 | 15.3%), social sciences (16 | 12.9%), literature & languages (15 | 12.1%), and education (7 | 5.7%) are the most common fields of study among 124 individuals in Condon who have obtained a bachelor's degree or higher.
| Field of Study | # Graduates | % Graduates |
| Computers & Mathematics | 0 | 0.0% |
| Bio, Nature & Agricultural | 5 | 4.0% |
| Physical & Health Sciences | 0 | 0.0% |
| Psychology | 0 | 0.0% |
| Social Sciences | 16 | 12.9% |
| Engineering | 5 | 4.0% |
| Multidisciplinary Studies | 0 | 0.0% |
| Science & Technology | 19 | 15.3% |
| Business | 5 | 4.0% |
| Education | 7 | 5.7% |
| Literature & Languages | 15 | 12.1% |
| Liberal Arts & History | 50 | 40.3% |
| Visual & Performing Arts | 0 | 0.0% |
| Communications | 0 | 0.0% |
| Arts & Humanities | 2 | 1.6% |
| Total | 124 | 100.0% |
Transportation & Commute in Condon
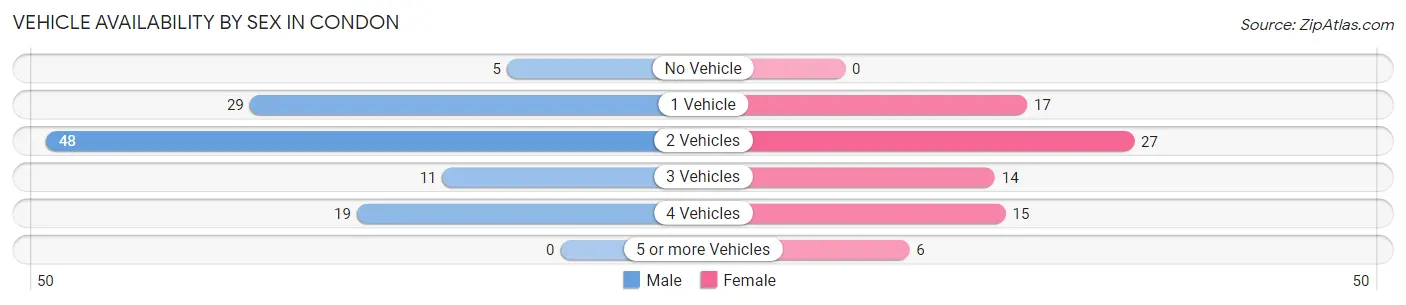
Vehicle Availability by Sex in Condon
The most prevalent vehicle ownership categories in Condon are males with 2 vehicles (48, accounting for 42.9%) and females with 2 vehicles (27, making up 60.8%).
| Vehicles Available | Male | Female |
| No Vehicle | 5 (4.5%) | 0 (0.0%) |
| 1 Vehicle | 29 (25.9%) | 17 (21.5%) |
| 2 Vehicles | 48 (42.9%) | 27 (34.2%) |
| 3 Vehicles | 11 (9.8%) | 14 (17.7%) |
| 4 Vehicles | 19 (17.0%) | 15 (19.0%) |
| 5 or more Vehicles | 0 (0.0%) | 6 (7.6%) |
| Total | 112 (100.0%) | 79 (100.0%) |
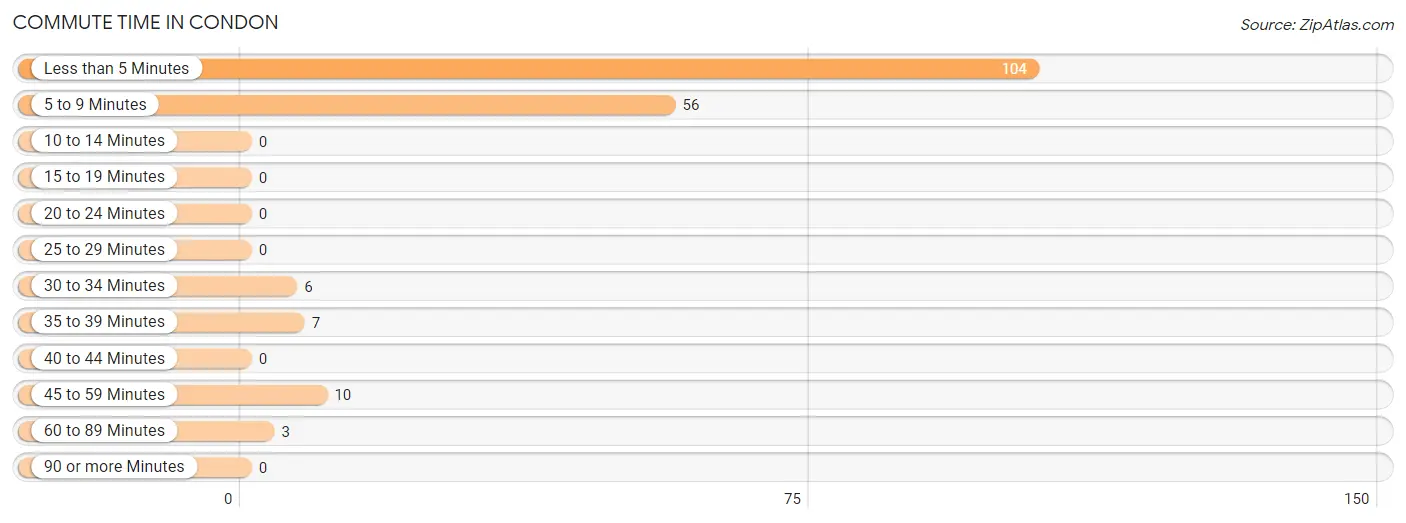
Commute Time in Condon
The most frequently occuring commute durations in Condon are less than 5 minutes (104 commuters, 55.9%), 5 to 9 minutes (56 commuters, 30.1%), and 45 to 59 minutes (10 commuters, 5.4%).
| Commute Time | # Commuters | % Commuters |
| Less than 5 Minutes | 104 | 55.9% |
| 5 to 9 Minutes | 56 | 30.1% |
| 10 to 14 Minutes | 0 | 0.0% |
| 15 to 19 Minutes | 0 | 0.0% |
| 20 to 24 Minutes | 0 | 0.0% |
| 25 to 29 Minutes | 0 | 0.0% |
| 30 to 34 Minutes | 6 | 3.2% |
| 35 to 39 Minutes | 7 | 3.8% |
| 40 to 44 Minutes | 0 | 0.0% |
| 45 to 59 Minutes | 10 | 5.4% |
| 60 to 89 Minutes | 3 | 1.6% |
| 90 or more Minutes | 0 | 0.0% |
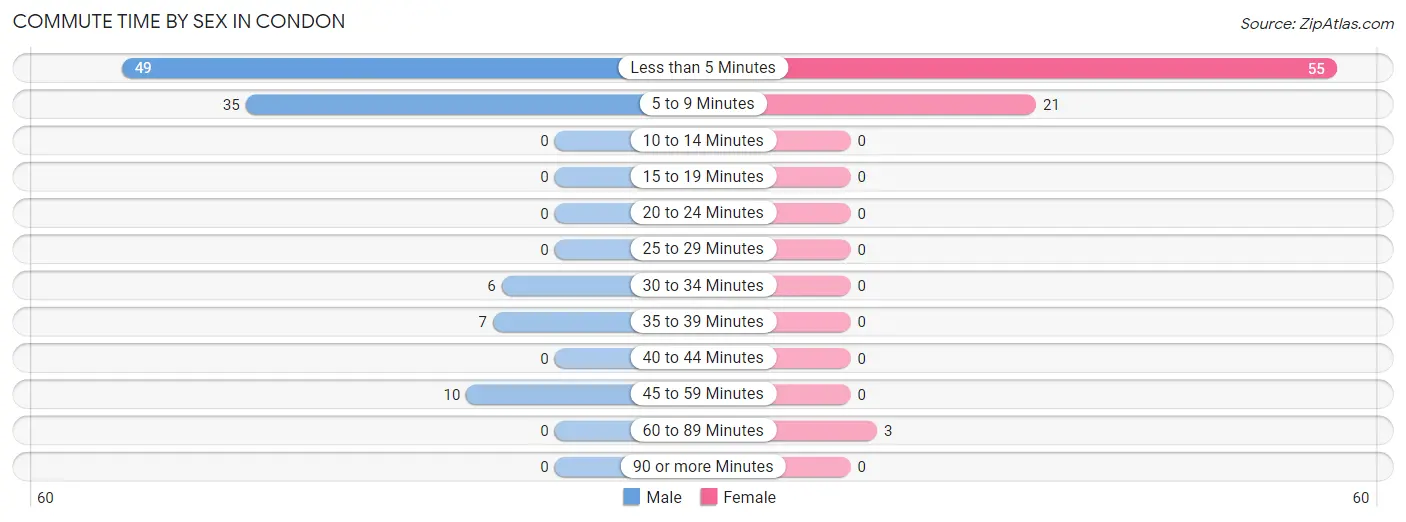
Commute Time by Sex in Condon
The most common commute times in Condon are less than 5 minutes (49 commuters, 45.8%) for males and less than 5 minutes (55 commuters, 69.6%) for females.
| Commute Time | Male | Female |
| Less than 5 Minutes | 49 (45.8%) | 55 (69.6%) |
| 5 to 9 Minutes | 35 (32.7%) | 21 (26.6%) |
| 10 to 14 Minutes | 0 (0.0%) | 0 (0.0%) |
| 15 to 19 Minutes | 0 (0.0%) | 0 (0.0%) |
| 20 to 24 Minutes | 0 (0.0%) | 0 (0.0%) |
| 25 to 29 Minutes | 0 (0.0%) | 0 (0.0%) |
| 30 to 34 Minutes | 6 (5.6%) | 0 (0.0%) |
| 35 to 39 Minutes | 7 (6.5%) | 0 (0.0%) |
| 40 to 44 Minutes | 0 (0.0%) | 0 (0.0%) |
| 45 to 59 Minutes | 10 (9.3%) | 0 (0.0%) |
| 60 to 89 Minutes | 0 (0.0%) | 3 (3.8%) |
| 90 or more Minutes | 0 (0.0%) | 0 (0.0%) |
Time of Departure to Work by Sex in Condon
The most frequent times of departure to work in Condon are 7:00 AM to 7:29 AM (40, 37.4%) for males and 7:30 AM to 7:59 AM (29, 36.7%) for females.
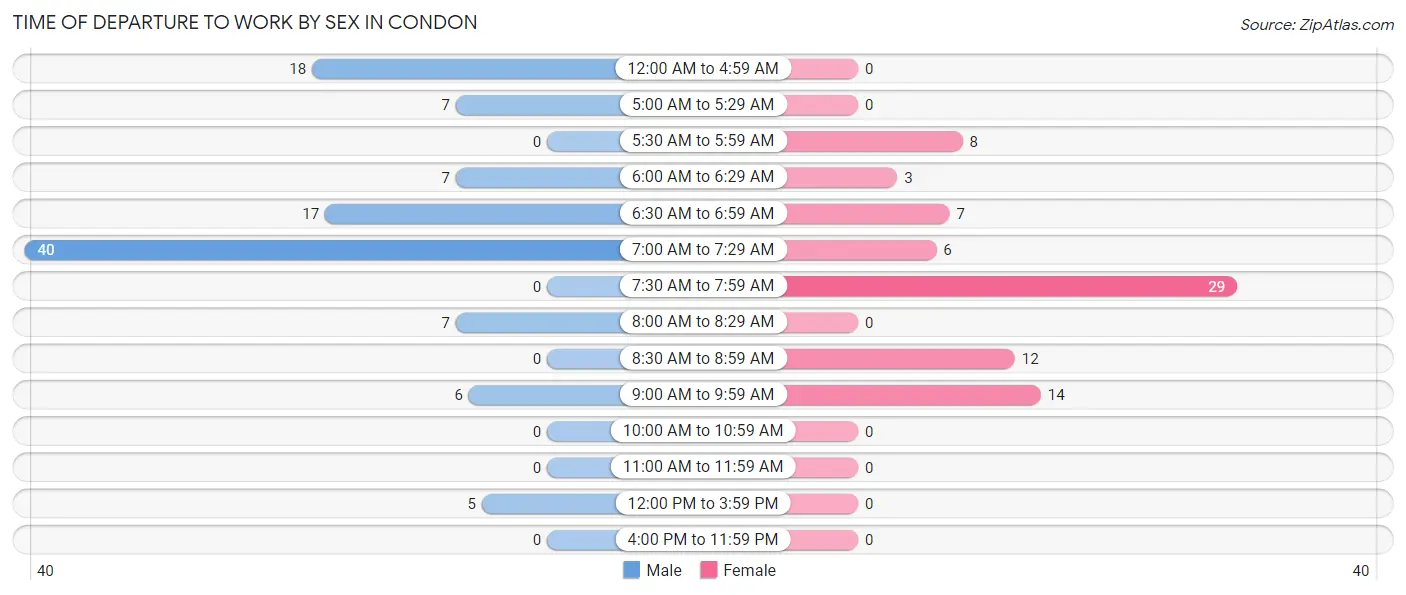
| Time of Departure | Male | Female |
| 12:00 AM to 4:59 AM | 18 (16.8%) | 0 (0.0%) |
| 5:00 AM to 5:29 AM | 7 (6.5%) | 0 (0.0%) |
| 5:30 AM to 5:59 AM | 0 (0.0%) | 8 (10.1%) |
| 6:00 AM to 6:29 AM | 7 (6.5%) | 3 (3.8%) |
| 6:30 AM to 6:59 AM | 17 (15.9%) | 7 (8.9%) |
| 7:00 AM to 7:29 AM | 40 (37.4%) | 6 (7.6%) |
| 7:30 AM to 7:59 AM | 0 (0.0%) | 29 (36.7%) |
| 8:00 AM to 8:29 AM | 7 (6.5%) | 0 (0.0%) |
| 8:30 AM to 8:59 AM | 0 (0.0%) | 12 (15.2%) |
| 9:00 AM to 9:59 AM | 6 (5.6%) | 14 (17.7%) |
| 10:00 AM to 10:59 AM | 0 (0.0%) | 0 (0.0%) |
| 11:00 AM to 11:59 AM | 0 (0.0%) | 0 (0.0%) |
| 12:00 PM to 3:59 PM | 5 (4.7%) | 0 (0.0%) |
| 4:00 PM to 11:59 PM | 0 (0.0%) | 0 (0.0%) |
| Total | 107 (100.0%) | 79 (100.0%) |
Housing Occupancy in Condon
Occupancy by Ownership in Condon
Of the total 378 dwellings in Condon, owner-occupied units account for 304 (80.4%), while renter-occupied units make up 74 (19.6%).
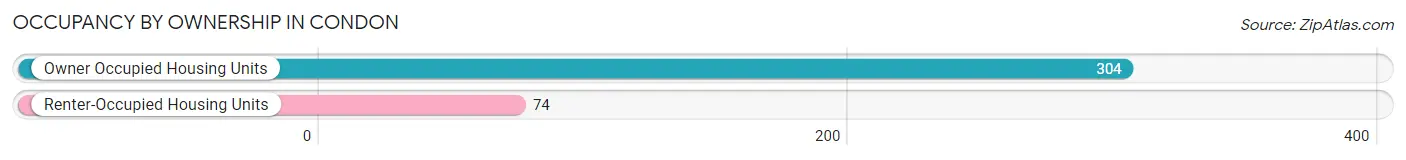
| Occupancy | # Housing Units | % Housing Units |
| Owner Occupied Housing Units | 304 | 80.4% |
| Renter-Occupied Housing Units | 74 | 19.6% |
| Total Occupied Housing Units | 378 | 100.0% |
Occupancy by Household Size in Condon
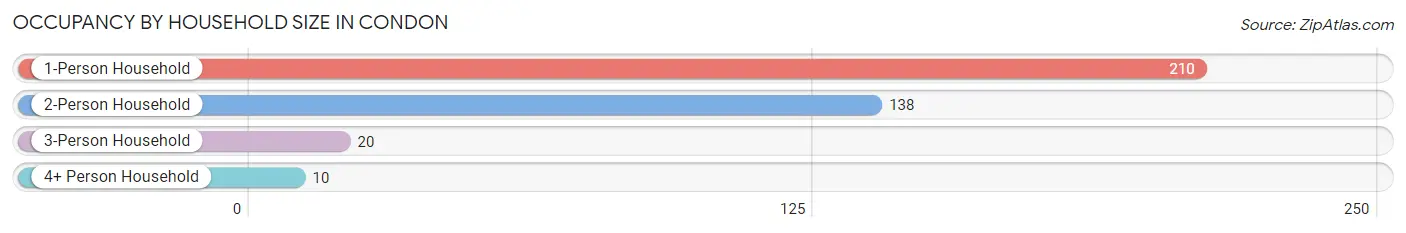
| Household Size | # Housing Units | % Housing Units |
| 1-Person Household | 210 | 55.6% |
| 2-Person Household | 138 | 36.5% |
| 3-Person Household | 20 | 5.3% |
| 4+ Person Household | 10 | 2.6% |
| Total Housing Units | 378 | 100.0% |
Occupancy by Ownership by Household Size in Condon
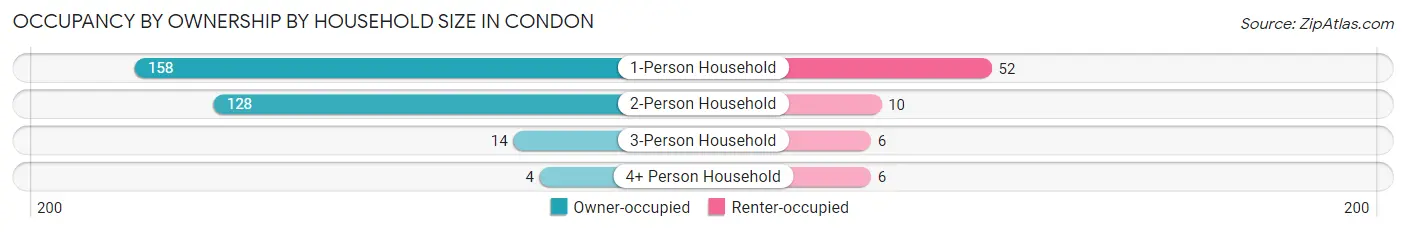
| Household Size | Owner-occupied | Renter-occupied |
| 1-Person Household | 158 (75.2%) | 52 (24.8%) |
| 2-Person Household | 128 (92.7%) | 10 (7.2%) |
| 3-Person Household | 14 (70.0%) | 6 (30.0%) |
| 4+ Person Household | 4 (40.0%) | 6 (60.0%) |
| Total Housing Units | 304 (80.4%) | 74 (19.6%) |
Occupancy by Educational Attainment in Condon
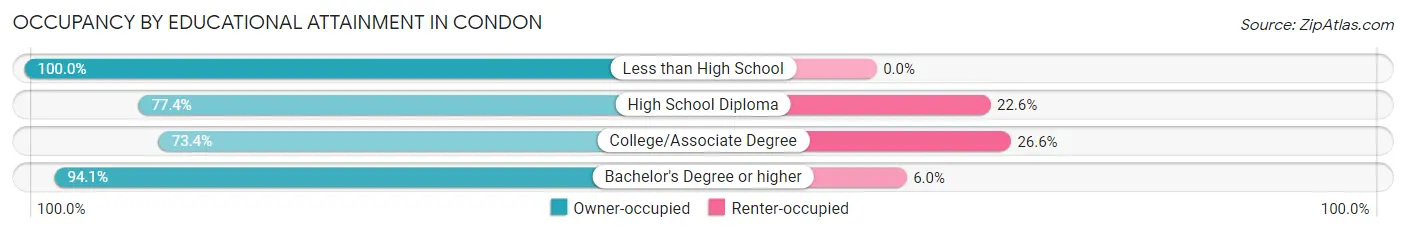
| Household Size | Owner-occupied | Renter-occupied |
| Less than High School | 16 (100.0%) | 0 (0.0%) |
| High School Diploma | 96 (77.4%) | 28 (22.6%) |
| College/Associate Degree | 113 (73.4%) | 41 (26.6%) |
| Bachelor's Degree or higher | 79 (94.1%) | 5 (5.9%) |
Occupancy by Age of Householder in Condon
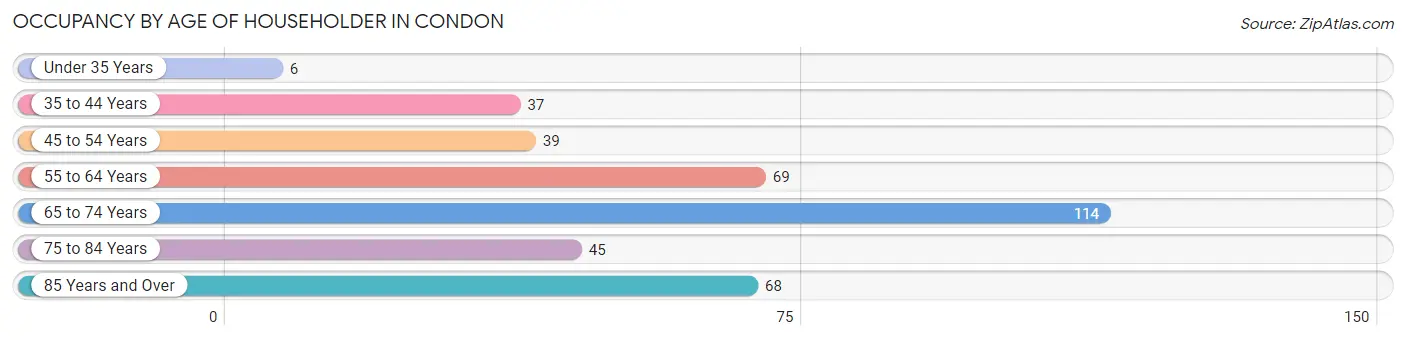
| Age Bracket | # Households | % Households |
| Under 35 Years | 6 | 1.6% |
| 35 to 44 Years | 37 | 9.8% |
| 45 to 54 Years | 39 | 10.3% |
| 55 to 64 Years | 69 | 18.2% |
| 65 to 74 Years | 114 | 30.2% |
| 75 to 84 Years | 45 | 11.9% |
| 85 Years and Over | 68 | 18.0% |
| Total | 378 | 100.0% |
Housing Finances in Condon
Median Income by Occupancy in Condon
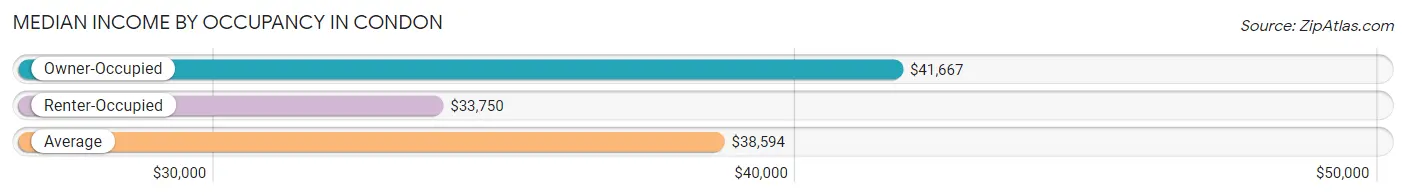
| Occupancy Type | # Households | Median Income |
| Owner-Occupied | 304 (80.4%) | $41,667 |
| Renter-Occupied | 74 (19.6%) | $33,750 |
| Average | 378 (100.0%) | $38,594 |
Occupancy by Householder Income Bracket in Condon
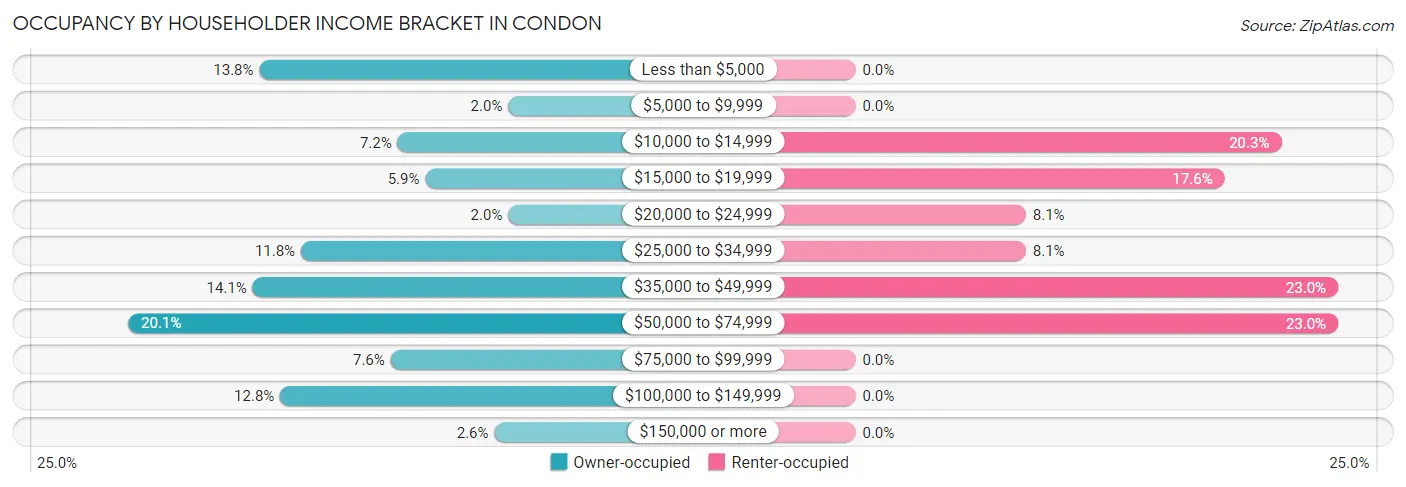
| Income Bracket | Owner-occupied | Renter-occupied |
| Less than $5,000 | 42 (13.8%) | 0 (0.0%) |
| $5,000 to $9,999 | 6 (2.0%) | 0 (0.0%) |
| $10,000 to $14,999 | 22 (7.2%) | 15 (20.3%) |
| $15,000 to $19,999 | 18 (5.9%) | 13 (17.6%) |
| $20,000 to $24,999 | 6 (2.0%) | 6 (8.1%) |
| $25,000 to $34,999 | 36 (11.8%) | 6 (8.1%) |
| $35,000 to $49,999 | 43 (14.1%) | 17 (23.0%) |
| $50,000 to $74,999 | 61 (20.1%) | 17 (23.0%) |
| $75,000 to $99,999 | 23 (7.6%) | 0 (0.0%) |
| $100,000 to $149,999 | 39 (12.8%) | 0 (0.0%) |
| $150,000 or more | 8 (2.6%) | 0 (0.0%) |
| Total | 304 (100.0%) | 74 (100.0%) |
Monthly Housing Cost Tiers in Condon
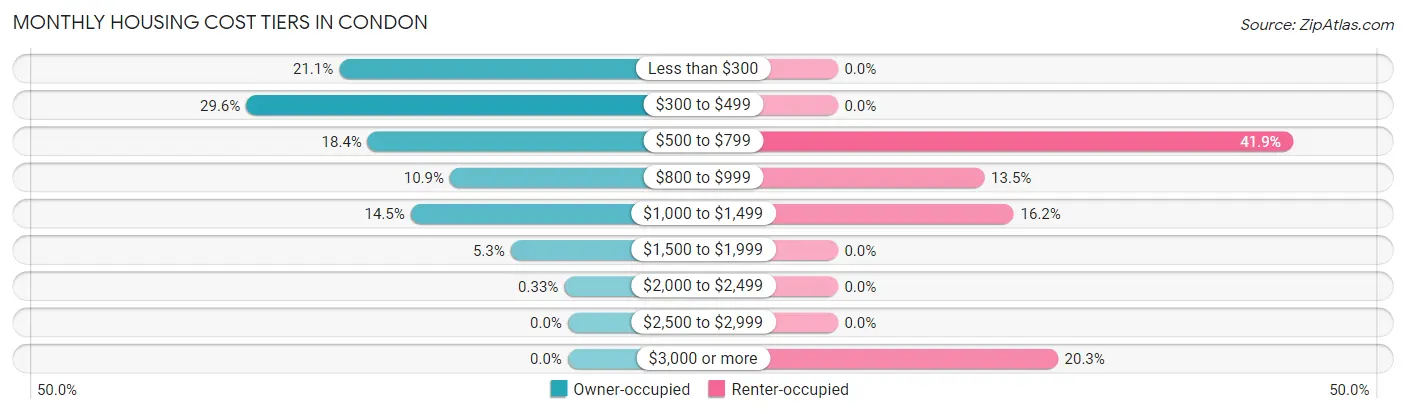
| Monthly Cost | Owner-occupied | Renter-occupied |
| Less than $300 | 64 (21.0%) | 0 (0.0%) |
| $300 to $499 | 90 (29.6%) | 0 (0.0%) |
| $500 to $799 | 56 (18.4%) | 31 (41.9%) |
| $800 to $999 | 33 (10.9%) | 10 (13.5%) |
| $1,000 to $1,499 | 44 (14.5%) | 12 (16.2%) |
| $1,500 to $1,999 | 16 (5.3%) | 0 (0.0%) |
| $2,000 to $2,499 | 1 (0.3%) | 0 (0.0%) |
| $2,500 to $2,999 | 0 (0.0%) | 0 (0.0%) |
| $3,000 or more | 0 (0.0%) | 15 (20.3%) |
| Total | 304 (100.0%) | 74 (100.0%) |
Physical Housing Characteristics in Condon
Housing Structures in Condon
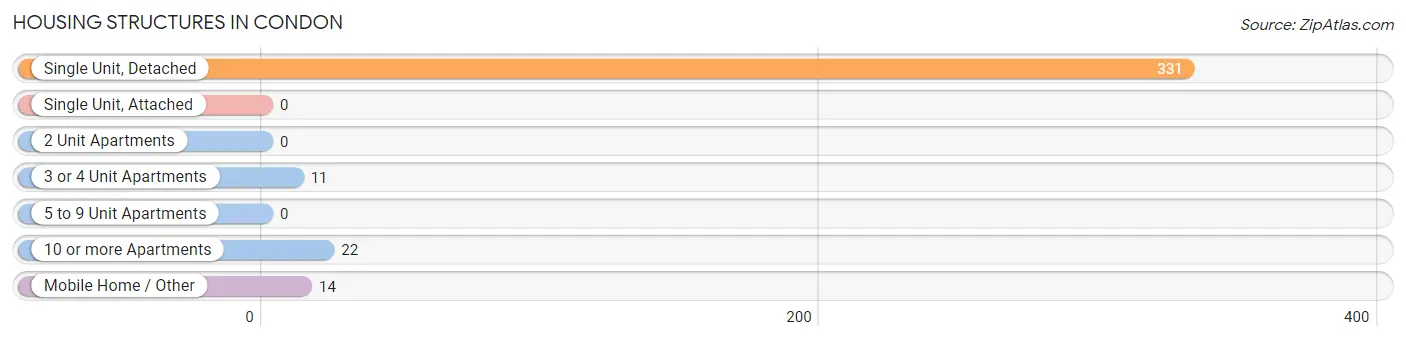
| Structure Type | # Housing Units | % Housing Units |
| Single Unit, Detached | 331 | 87.6% |
| Single Unit, Attached | 0 | 0.0% |
| 2 Unit Apartments | 0 | 0.0% |
| 3 or 4 Unit Apartments | 11 | 2.9% |
| 5 to 9 Unit Apartments | 0 | 0.0% |
| 10 or more Apartments | 22 | 5.8% |
| Mobile Home / Other | 14 | 3.7% |
| Total | 378 | 100.0% |
Housing Structures by Occupancy in Condon
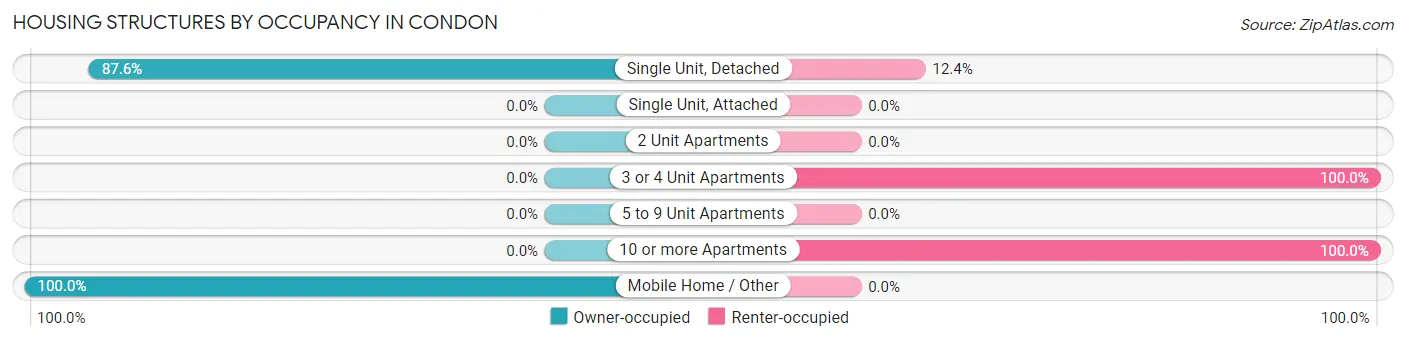
| Structure Type | Owner-occupied | Renter-occupied |
| Single Unit, Detached | 290 (87.6%) | 41 (12.4%) |
| Single Unit, Attached | 0 (0.0%) | 0 (0.0%) |
| 2 Unit Apartments | 0 (0.0%) | 0 (0.0%) |
| 3 or 4 Unit Apartments | 0 (0.0%) | 11 (100.0%) |
| 5 to 9 Unit Apartments | 0 (0.0%) | 0 (0.0%) |
| 10 or more Apartments | 0 (0.0%) | 22 (100.0%) |
| Mobile Home / Other | 14 (100.0%) | 0 (0.0%) |
| Total | 304 (80.4%) | 74 (19.6%) |
Housing Structures by Number of Rooms in Condon
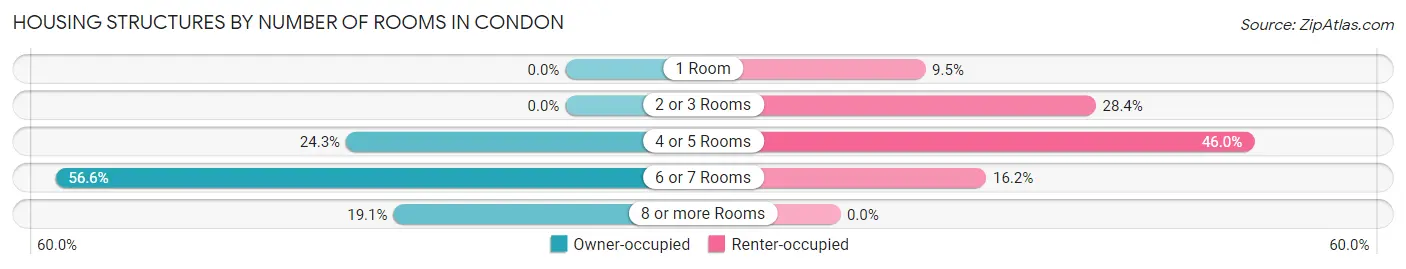
| Number of Rooms | Owner-occupied | Renter-occupied |
| 1 Room | 0 (0.0%) | 7 (9.5%) |
| 2 or 3 Rooms | 0 (0.0%) | 21 (28.4%) |
| 4 or 5 Rooms | 74 (24.3%) | 34 (46.0%) |
| 6 or 7 Rooms | 172 (56.6%) | 12 (16.2%) |
| 8 or more Rooms | 58 (19.1%) | 0 (0.0%) |
| Total | 304 (100.0%) | 74 (100.0%) |
Housing Structure by Heating Type in Condon
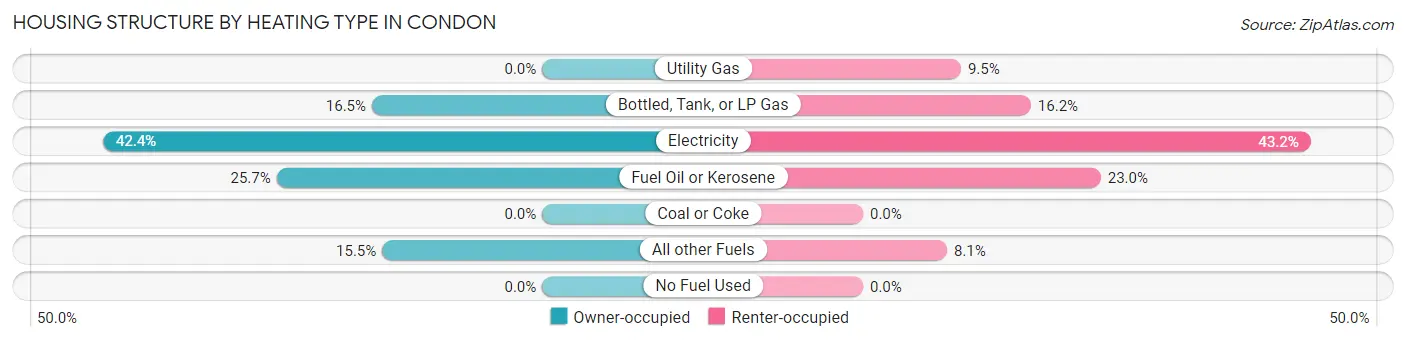
| Heating Type | Owner-occupied | Renter-occupied |
| Utility Gas | 0 (0.0%) | 7 (9.5%) |
| Bottled, Tank, or LP Gas | 50 (16.5%) | 12 (16.2%) |
| Electricity | 129 (42.4%) | 32 (43.2%) |
| Fuel Oil or Kerosene | 78 (25.7%) | 17 (23.0%) |
| Coal or Coke | 0 (0.0%) | 0 (0.0%) |
| All other Fuels | 47 (15.5%) | 6 (8.1%) |
| No Fuel Used | 0 (0.0%) | 0 (0.0%) |
| Total | 304 (100.0%) | 74 (100.0%) |
Household Vehicle Usage in Condon
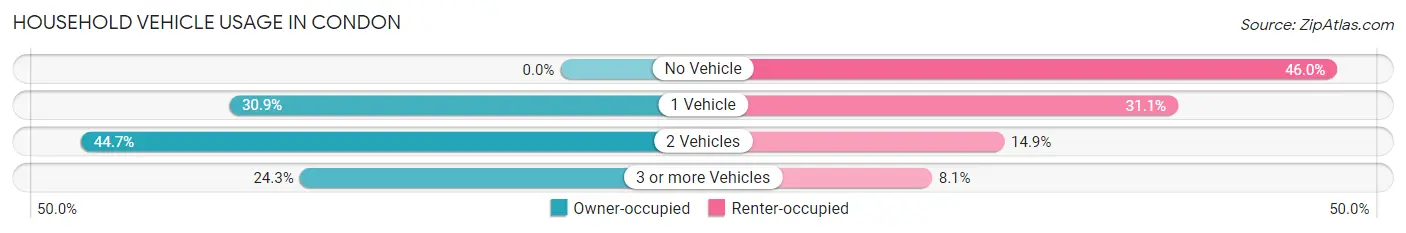
| Vehicles per Household | Owner-occupied | Renter-occupied |
| No Vehicle | 0 (0.0%) | 34 (46.0%) |
| 1 Vehicle | 94 (30.9%) | 23 (31.1%) |
| 2 Vehicles | 136 (44.7%) | 11 (14.9%) |
| 3 or more Vehicles | 74 (24.3%) | 6 (8.1%) |
| Total | 304 (100.0%) | 74 (100.0%) |
Real Estate & Mortgages in Condon
Real Estate and Mortgage Overview in Condon
| Characteristic | Without Mortgage | With Mortgage |
| Housing Units | 216 | 88 |
| Median Property Value | $128,800 | $170,000 |
| Median Household Income | $26,750 | $1 |
| Monthly Housing Costs | $382 | $0 |
| Real Estate Taxes | $1,567 | $0 |
Property Value by Mortgage Status in Condon
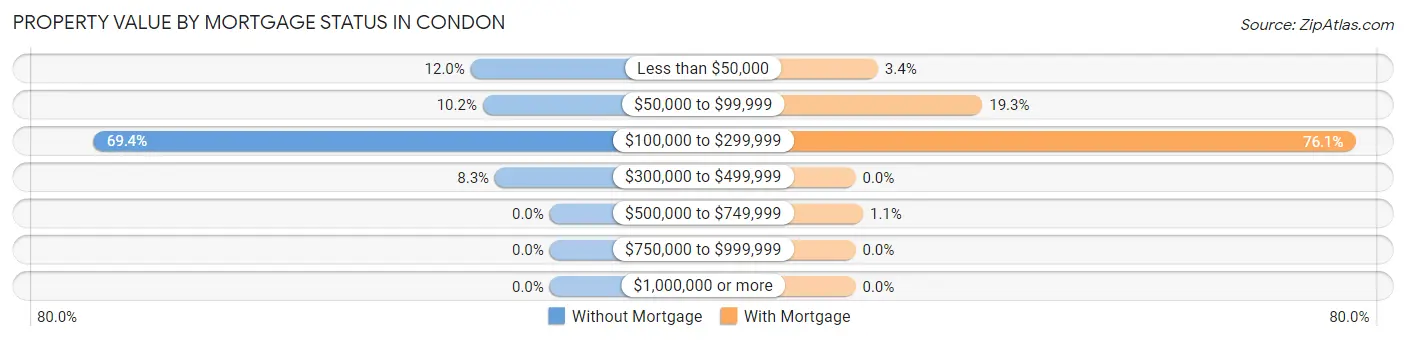
| Property Value | Without Mortgage | With Mortgage |
| Less than $50,000 | 26 (12.0%) | 3 (3.4%) |
| $50,000 to $99,999 | 22 (10.2%) | 17 (19.3%) |
| $100,000 to $299,999 | 150 (69.4%) | 67 (76.1%) |
| $300,000 to $499,999 | 18 (8.3%) | 0 (0.0%) |
| $500,000 to $749,999 | 0 (0.0%) | 1 (1.1%) |
| $750,000 to $999,999 | 0 (0.0%) | 0 (0.0%) |
| $1,000,000 or more | 0 (0.0%) | 0 (0.0%) |
| Total | 216 (100.0%) | 88 (100.0%) |
Household Income by Mortgage Status in Condon
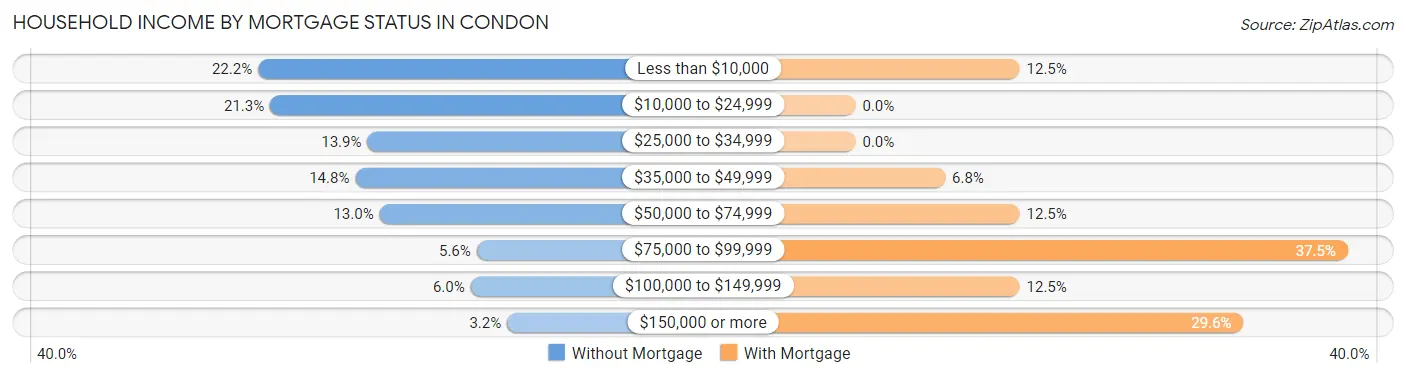
| Household Income | Without Mortgage | With Mortgage |
| Less than $10,000 | 48 (22.2%) | 11 (12.5%) |
| $10,000 to $24,999 | 46 (21.3%) | 0 (0.0%) |
| $25,000 to $34,999 | 30 (13.9%) | 0 (0.0%) |
| $35,000 to $49,999 | 32 (14.8%) | 6 (6.8%) |
| $50,000 to $74,999 | 28 (13.0%) | 11 (12.5%) |
| $75,000 to $99,999 | 12 (5.6%) | 33 (37.5%) |
| $100,000 to $149,999 | 13 (6.0%) | 11 (12.5%) |
| $150,000 or more | 7 (3.2%) | 26 (29.5%) |
| Total | 216 (100.0%) | 88 (100.0%) |
Property Value to Household Income Ratio in Condon
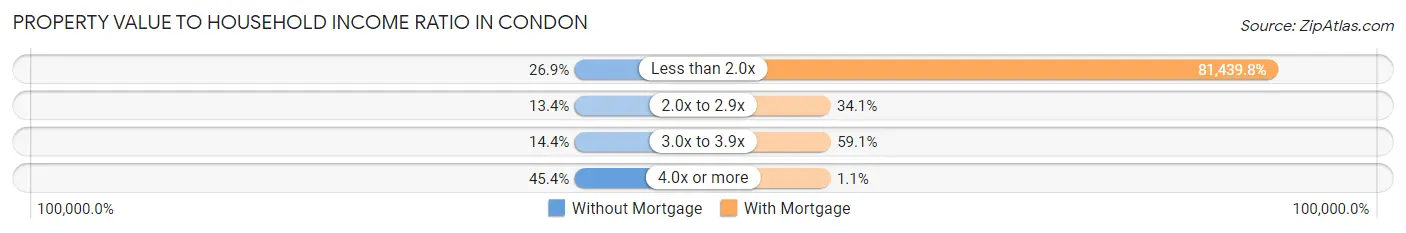
| Value-to-Income Ratio | Without Mortgage | With Mortgage |
| Less than 2.0x | 58 (26.9%) | 71,667 (81,439.8%) |
| 2.0x to 2.9x | 29 (13.4%) | 30 (34.1%) |
| 3.0x to 3.9x | 31 (14.3%) | 52 (59.1%) |
| 4.0x or more | 98 (45.4%) | 1 (1.1%) |
| Total | 216 (100.0%) | 88 (100.0%) |
Real Estate Taxes by Mortgage Status in Condon
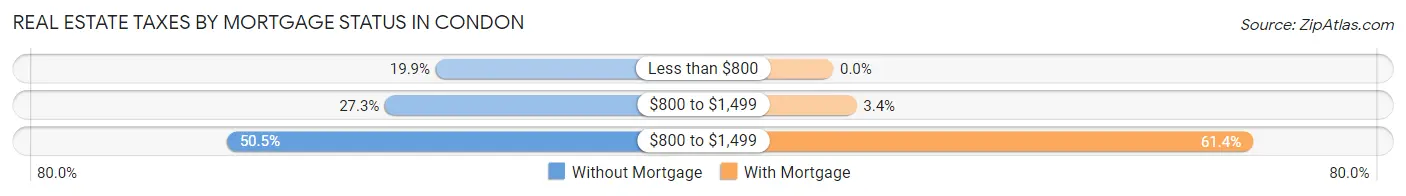
| Property Taxes | Without Mortgage | With Mortgage |
| Less than $800 | 43 (19.9%) | 0 (0.0%) |
| $800 to $1,499 | 59 (27.3%) | 3 (3.4%) |
| $800 to $1,499 | 109 (50.5%) | 54 (61.4%) |
| Total | 216 (100.0%) | 88 (100.0%) |
Health & Disability in Condon
Health Insurance Coverage by Age in Condon
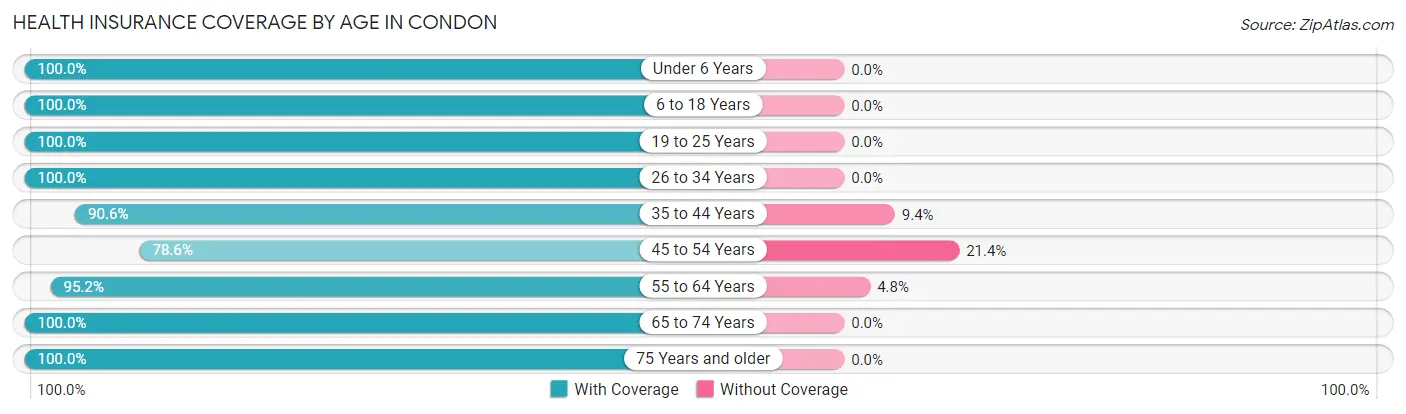
| Age Bracket | With Coverage | Without Coverage |
| Under 6 Years | 16 (100.0%) | 0 (0.0%) |
| 6 to 18 Years | 74 (100.0%) | 0 (0.0%) |
| 19 to 25 Years | 18 (100.0%) | 0 (0.0%) |
| 26 to 34 Years | 20 (100.0%) | 0 (0.0%) |
| 35 to 44 Years | 48 (90.6%) | 5 (9.4%) |
| 45 to 54 Years | 44 (78.6%) | 12 (21.4%) |
| 55 to 64 Years | 118 (95.2%) | 6 (4.8%) |
| 65 to 74 Years | 173 (100.0%) | 0 (0.0%) |
| 75 Years and older | 132 (100.0%) | 0 (0.0%) |
| Total | 643 (96.6%) | 23 (3.5%) |
Health Insurance Coverage by Citizenship Status in Condon
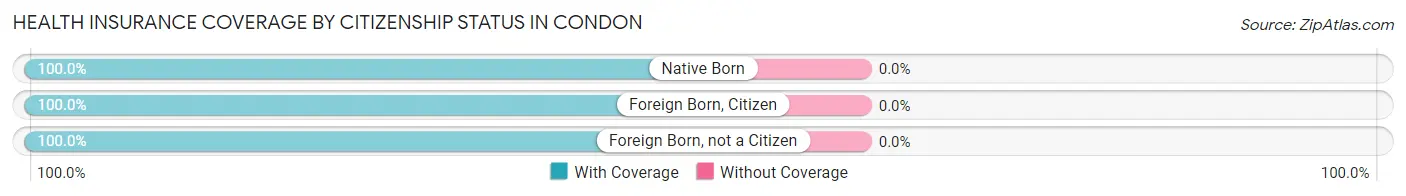
| Citizenship Status | With Coverage | Without Coverage |
| Native Born | 16 (100.0%) | 0 (0.0%) |
| Foreign Born, Citizen | 74 (100.0%) | 0 (0.0%) |
| Foreign Born, not a Citizen | 18 (100.0%) | 0 (0.0%) |
Health Insurance Coverage by Household Income in Condon
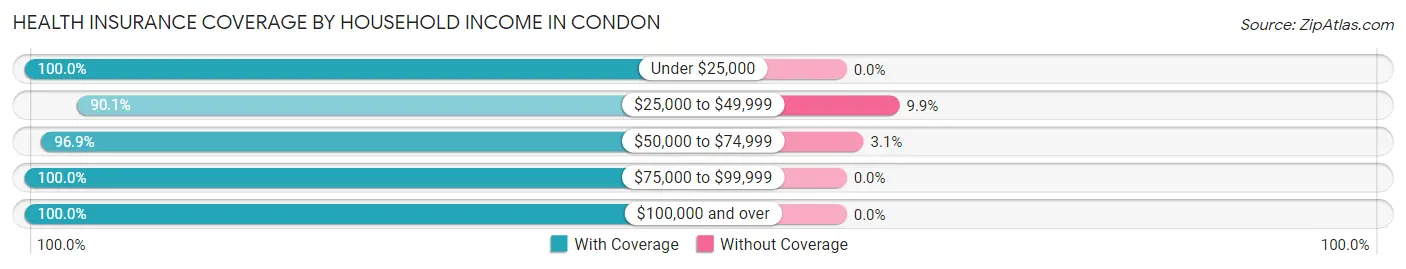
| Household Income | With Coverage | Without Coverage |
| Under $25,000 | 134 (100.0%) | 0 (0.0%) |
| $25,000 to $49,999 | 155 (90.1%) | 17 (9.9%) |
| $50,000 to $74,999 | 185 (96.9%) | 6 (3.1%) |
| $75,000 to $99,999 | 42 (100.0%) | 0 (0.0%) |
| $100,000 and over | 115 (100.0%) | 0 (0.0%) |
Public vs Private Health Insurance Coverage by Age in Condon
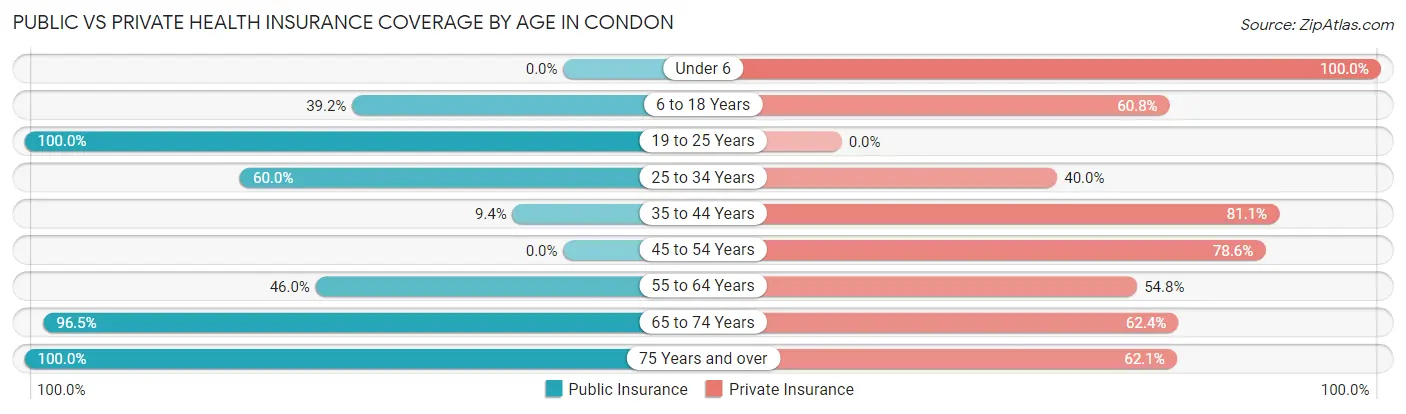
| Age Bracket | Public Insurance | Private Insurance |
| Under 6 | 0 (0.0%) | 16 (100.0%) |
| 6 to 18 Years | 29 (39.2%) | 45 (60.8%) |
| 19 to 25 Years | 18 (100.0%) | 0 (0.0%) |
| 25 to 34 Years | 12 (60.0%) | 8 (40.0%) |
| 35 to 44 Years | 5 (9.4%) | 43 (81.1%) |
| 45 to 54 Years | 0 (0.0%) | 44 (78.6%) |
| 55 to 64 Years | 57 (46.0%) | 68 (54.8%) |
| 65 to 74 Years | 167 (96.5%) | 108 (62.4%) |
| 75 Years and over | 132 (100.0%) | 82 (62.1%) |
| Total | 420 (63.1%) | 414 (62.2%) |
Disability Status by Sex by Age in Condon
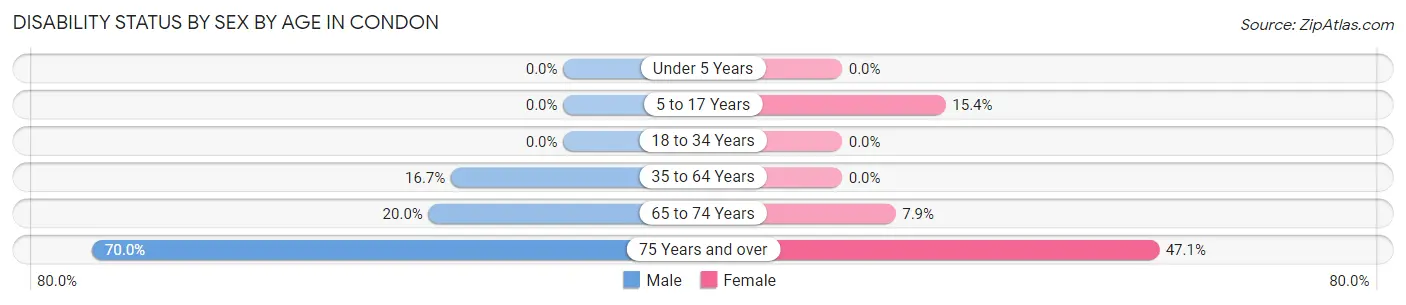
| Age Bracket | Male | Female |
| Under 5 Years | 0 (0.0%) | 0 (0.0%) |
| 5 to 17 Years | 0 (0.0%) | 4 (15.4%) |
| 18 to 34 Years | 0 (0.0%) | 0 (0.0%) |
| 35 to 64 Years | 19 (16.7%) | 0 (0.0%) |
| 65 to 74 Years | 22 (20.0%) | 5 (7.9%) |
| 75 Years and over | 21 (70.0%) | 48 (47.1%) |
Disability Class by Sex by Age in Condon
Disability Class: Hearing Difficulty
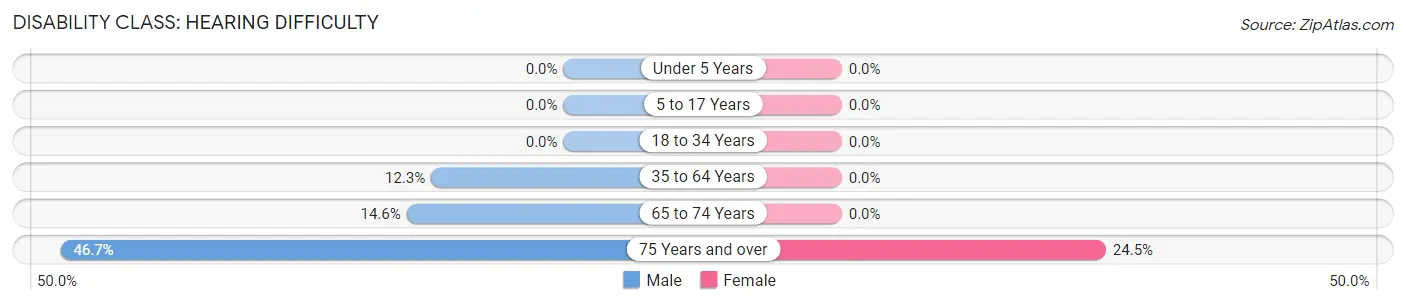
| Age Bracket | Male | Female |
| Under 5 Years | 0 (0.0%) | 0 (0.0%) |
| 5 to 17 Years | 0 (0.0%) | 0 (0.0%) |
| 18 to 34 Years | 0 (0.0%) | 0 (0.0%) |
| 35 to 64 Years | 14 (12.3%) | 0 (0.0%) |
| 65 to 74 Years | 16 (14.5%) | 0 (0.0%) |
| 75 Years and over | 14 (46.7%) | 25 (24.5%) |
Disability Class: Vision Difficulty
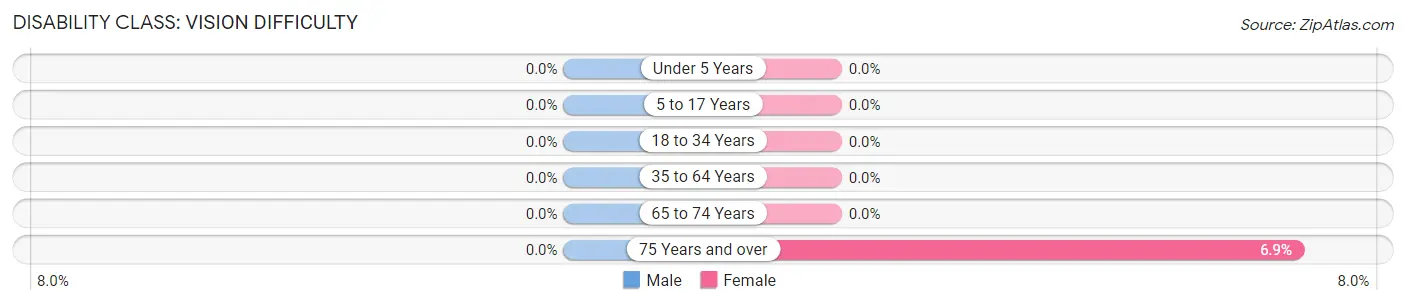
| Age Bracket | Male | Female |
| Under 5 Years | 0 (0.0%) | 0 (0.0%) |
| 5 to 17 Years | 0 (0.0%) | 0 (0.0%) |
| 18 to 34 Years | 0 (0.0%) | 0 (0.0%) |
| 35 to 64 Years | 0 (0.0%) | 0 (0.0%) |
| 65 to 74 Years | 0 (0.0%) | 0 (0.0%) |
| 75 Years and over | 0 (0.0%) | 7 (6.9%) |
Disability Class: Cognitive Difficulty
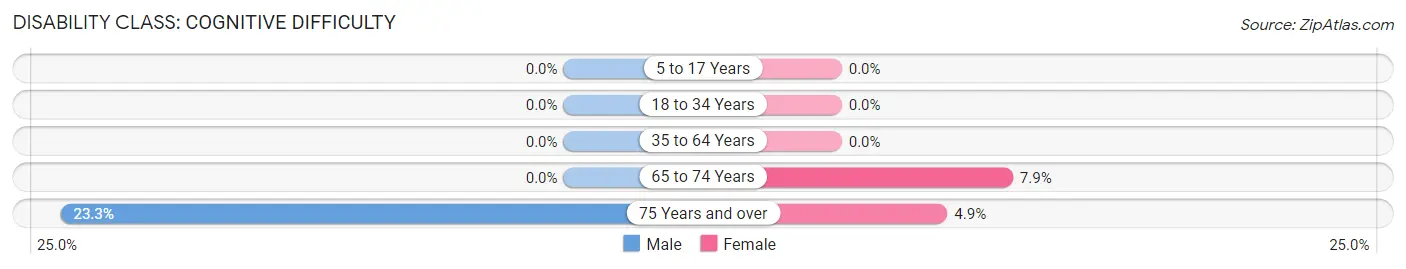
| Age Bracket | Male | Female |
| 5 to 17 Years | 0 (0.0%) | 0 (0.0%) |
| 18 to 34 Years | 0 (0.0%) | 0 (0.0%) |
| 35 to 64 Years | 0 (0.0%) | 0 (0.0%) |
| 65 to 74 Years | 0 (0.0%) | 5 (7.9%) |
| 75 Years and over | 7 (23.3%) | 5 (4.9%) |
Disability Class: Ambulatory Difficulty
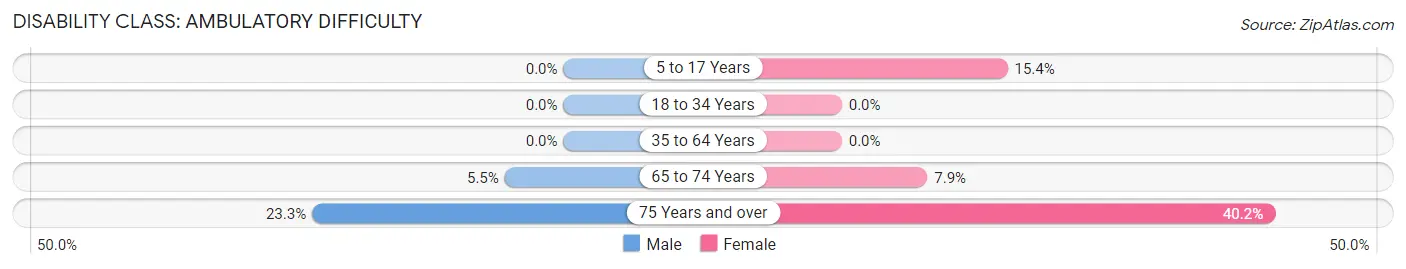
| Age Bracket | Male | Female |
| 5 to 17 Years | 0 (0.0%) | 4 (15.4%) |
| 18 to 34 Years | 0 (0.0%) | 0 (0.0%) |
| 35 to 64 Years | 0 (0.0%) | 0 (0.0%) |
| 65 to 74 Years | 6 (5.4%) | 5 (7.9%) |
| 75 Years and over | 7 (23.3%) | 41 (40.2%) |
Disability Class: Self-Care Difficulty
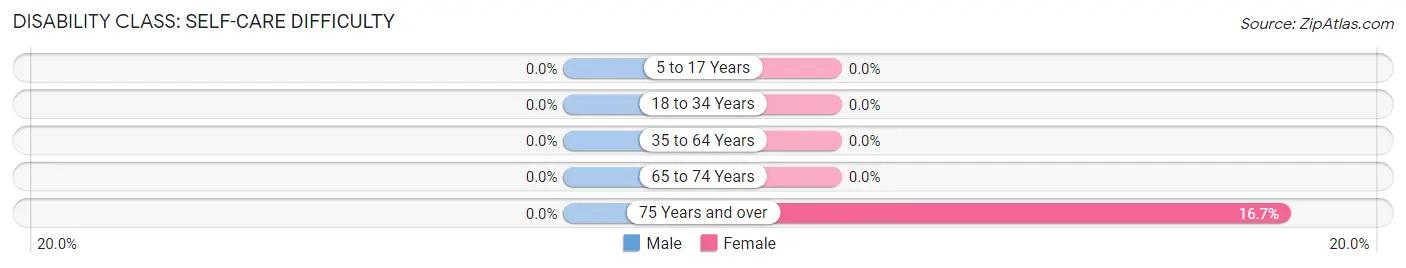
| Age Bracket | Male | Female |
| 5 to 17 Years | 0 (0.0%) | 0 (0.0%) |
| 18 to 34 Years | 0 (0.0%) | 0 (0.0%) |
| 35 to 64 Years | 0 (0.0%) | 0 (0.0%) |
| 65 to 74 Years | 0 (0.0%) | 0 (0.0%) |
| 75 Years and over | 0 (0.0%) | 17 (16.7%) |
Technology Access in Condon
Computing Device Access in Condon
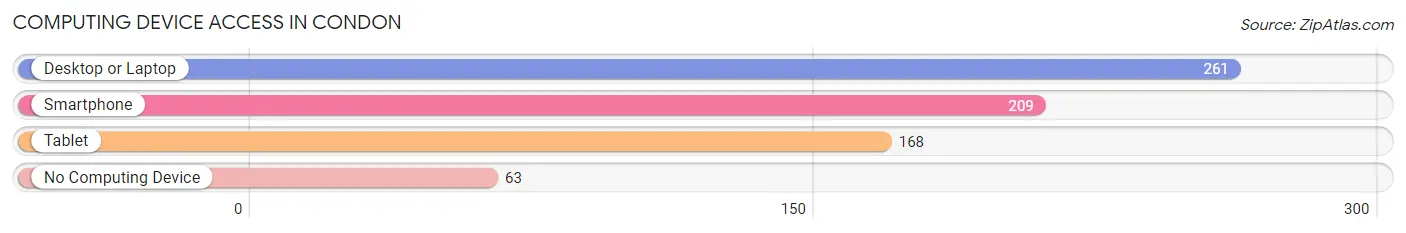
| Device Type | # Households | % Households |
| Desktop or Laptop | 261 | 69.1% |
| Smartphone | 209 | 55.3% |
| Tablet | 168 | 44.4% |
| No Computing Device | 63 | 16.7% |
| Total | 378 | 100.0% |
Internet Access in Condon
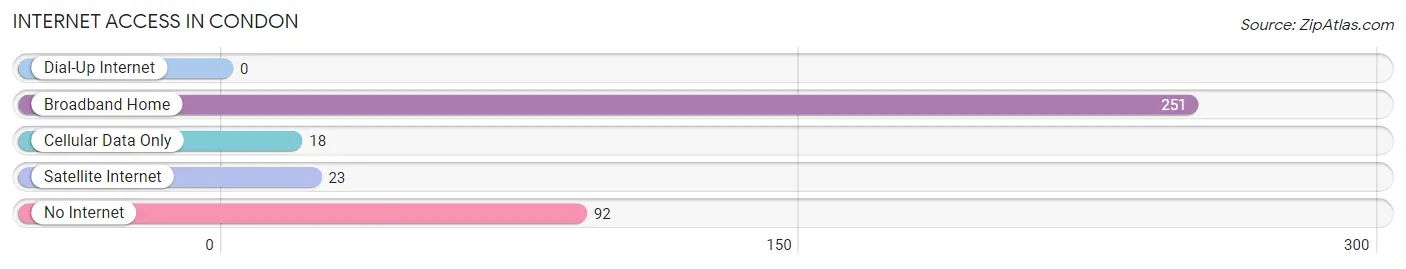
| Internet Type | # Households | % Households |
| Dial-Up Internet | 0 | 0.0% |
| Broadband Home | 251 | 66.4% |
| Cellular Data Only | 18 | 4.8% |
| Satellite Internet | 23 | 6.1% |
| No Internet | 92 | 24.3% |
| Total | 378 | 100.0% |
Condon Summary
Condon is a small city located in the state of Oregon, in the United States. It is situated in the foothills of the Blue Mountains, in the northeastern corner of the state. The city is located in Gilliam County, and is the county seat. As of the 2010 census, the population of Condon was 1,006.
History
The area that is now Condon was first settled in the late 1860s by homesteaders. The town was officially founded in 1872, and was named after the nearby Condon Creek. The creek was named after a local settler, John Condon. The town was incorporated in 1887.
In the early years, Condon was a center for the local agricultural industry. The town was also a major stop on the Oregon Trail, and was a popular destination for travelers. In the late 19th century, the town was home to several businesses, including a hotel, a bank, and a newspaper.
Geography
Condon is located in the foothills of the Blue Mountains, in the northeastern corner of Oregon. The city is situated at an elevation of 1,845 feet (562 m). The city is located in the Columbia River Basin, and is surrounded by rolling hills and grasslands. The city is located about 50 miles (80 km) east of the city of Pendleton.
The climate in Condon is semi-arid, with hot summers and cold winters. The average annual temperature is around 50°F (10°C). The average annual precipitation is around 12 inches (30 cm).
Economy
The economy of Condon is largely based on agriculture. The city is home to several farms and ranches, which produce a variety of crops, including wheat, barley, and hay. The city is also home to several businesses, including a lumber mill, a grain elevator, and a feed store.
The city is also home to several manufacturing companies, including a furniture factory and a metal fabrication plant. The city is also home to several retail stores, including a grocery store, a hardware store, and a clothing store.
Demographics
As of the 2010 census, the population of Condon was 1,006. The racial makeup of the city was 94.3% White, 0.3% African American, 0.7% Native American, 0.3% Asian, 0.1% Pacific Islander, 0.7% from other races, and 3.0% from two or more races. Hispanic or Latino of any race were 2.3% of the population.
The median income for a household in Condon was $35,000, and the median income for a family was $41,000. The per capita income for the city was $17,000. About 11.3% of families and 14.2% of the population were below the poverty line, including 18.2% of those under age 18 and 8.3% of those age 65 or over.
Common Questions
What is the Total Population of Condon?
Total Population of Condon is 697.
What is the Total Male Population of Condon?
Total Male Population of Condon is 319.
What is the Total Female Population of Condon?
Total Female Population of Condon is 378.
What is the Ratio of Males per 100 Females in Condon?
There are 84.39 Males per 100 Females in Condon.
What is the Ratio of Females per 100 Males in Condon?
There are 118.50 Females per 100 Males in Condon.
What is the Median Population Age in Condon?
Median Population Age in Condon is 64.7 Years.
What is the Average Family Size in Condon
Average Family Size in Condon is 2.6 People.
What is the Average Household Size in Condon
Average Household Size in Condon is 1.7 People.
What is Per Capita Income in Condon?
Per Capita income in Condon is $29,869.
What is the Median Family Income in Condon?
Median Family Income in Condon is $70,139.
What is the Median Household income in Condon?
Median Household Income in Condon is $38,594.
What is Income or Wage Gap in Condon?
Income or Wage Gap in Condon is 35.1%.
Women in Condon earn 64.9 cents for every dollar earned by a man.
What is Inequality or Gini Index in Condon?
Inequality or Gini Index in Condon is 0.45.
How Large is the Labor Force in Condon?
There are 223 People in the Labor Forcein in Condon.
What is the Percentage of People in the Labor Force in Condon?
33.9% of People are in the Labor Force in Condon.
What is the Unemployment Rate in Condon?
Unemployment Rate in Condon is 12.6%.