Bunker Hill, OR
Bunker Hill Map
Bunker Hill Overview
2,103
TOTAL POPULATION
1,184
MALE POPULATION
919
FEMALE POPULATION
128.84
MALES / 100 FEMALES
77.62
FEMALES / 100 MALES
33.5
MEDIAN AGE
3.5
AVG FAMILY SIZE
3.5
AVG HOUSEHOLD SIZE
$20,448
PER CAPITA INCOME
$63,517
AVG FAMILY INCOME
$63,417
AVG HOUSEHOLD INCOME
41.2%
WAGE / INCOME GAP [ % ]
58.8¢/ $1
WAGE / INCOME GAP [ $ ]
0.30
INEQUALITY / GINI INDEX
936
LABOR FORCE [ PEOPLE ]
60.1%
PERCENT IN LABOR FORCE
7.5%
UNEMPLOYMENT RATE
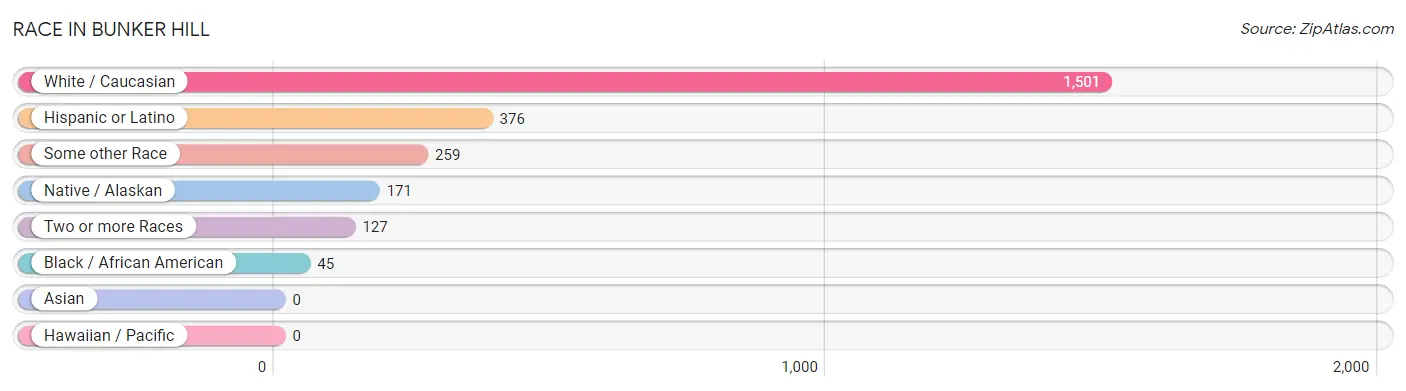
Race in Bunker Hill
The most populous races in Bunker Hill are White / Caucasian (1,501 | 71.4%), Hispanic or Latino (376 | 17.9%), and Some other Race (259 | 12.3%).
| Race | # Population | % Population |
| Asian | 0 | 0.0% |
| Black / African American | 45 | 2.1% |
| Hawaiian / Pacific | 0 | 0.0% |
| Hispanic or Latino | 376 | 17.9% |
| Native / Alaskan | 171 | 8.1% |
| White / Caucasian | 1,501 | 71.4% |
| Two or more Races | 127 | 6.0% |
| Some other Race | 259 | 12.3% |
| Total | 2,103 | 100.0% |
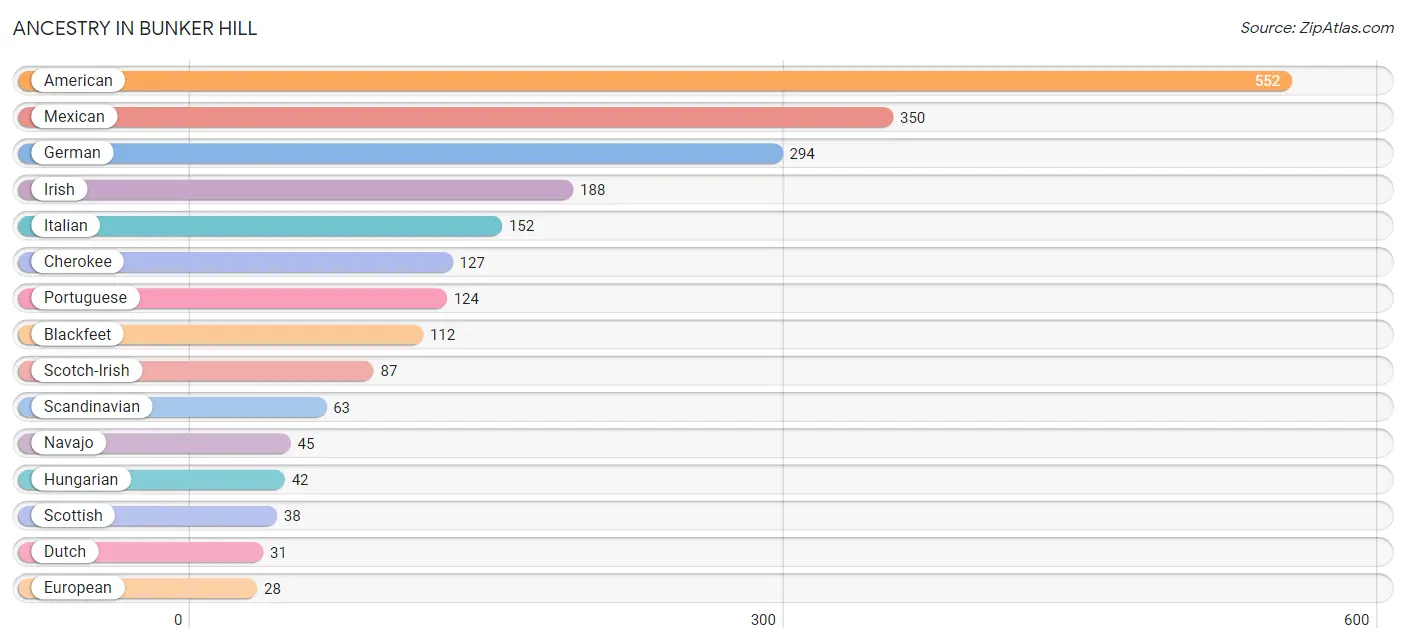
Ancestry in Bunker Hill
The most populous ancestries reported in Bunker Hill are American (552 | 26.3%), Mexican (350 | 16.6%), German (294 | 14.0%), Irish (188 | 8.9%), and Italian (152 | 7.2%), together accounting for 73.0% of all Bunker Hill residents.
| Ancestry | # Population | % Population |
| American | 552 | 26.3% |
| Basque | 20 | 0.9% |
| Bhutanese | 12 | 0.6% |
| Blackfeet | 112 | 5.3% |
| Cherokee | 127 | 6.0% |
| Dutch | 31 | 1.5% |
| English | 26 | 1.2% |
| European | 28 | 1.3% |
| German | 294 | 14.0% |
| Hungarian | 42 | 2.0% |
| Irish | 188 | 8.9% |
| Italian | 152 | 7.2% |
| Mexican | 350 | 16.6% |
| Navajo | 45 | 2.1% |
| Portuguese | 124 | 5.9% |
| Scandinavian | 63 | 3.0% |
| Scotch-Irish | 87 | 4.1% |
| Scottish | 38 | 1.8% |
| Slovene | 19 | 0.9% |
| Spaniard | 26 | 1.2% | View All 20 Rows |
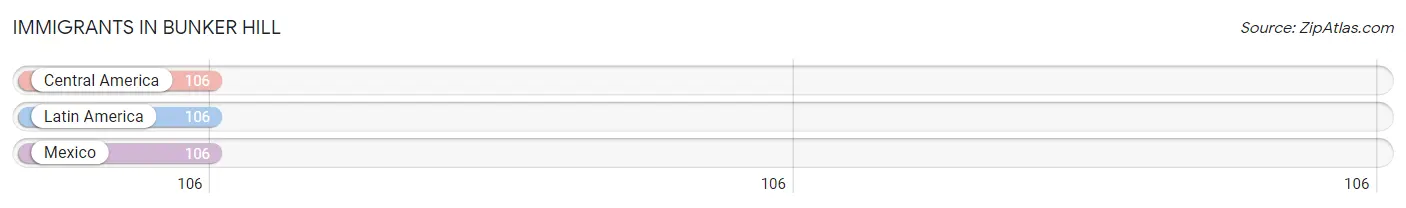
Immigrants in Bunker Hill
The most numerous immigrant groups reported in Bunker Hill came from Central America (106 | 5.0%), Latin America (106 | 5.0%), and Mexico (106 | 5.0%), together accounting for 15.1% of all Bunker Hill residents.
| Immigration Origin | # Population | % Population |
| Central America | 106 | 5.0% |
| Latin America | 106 | 5.0% |
| Mexico | 106 | 5.0% | View All 3 Rows |
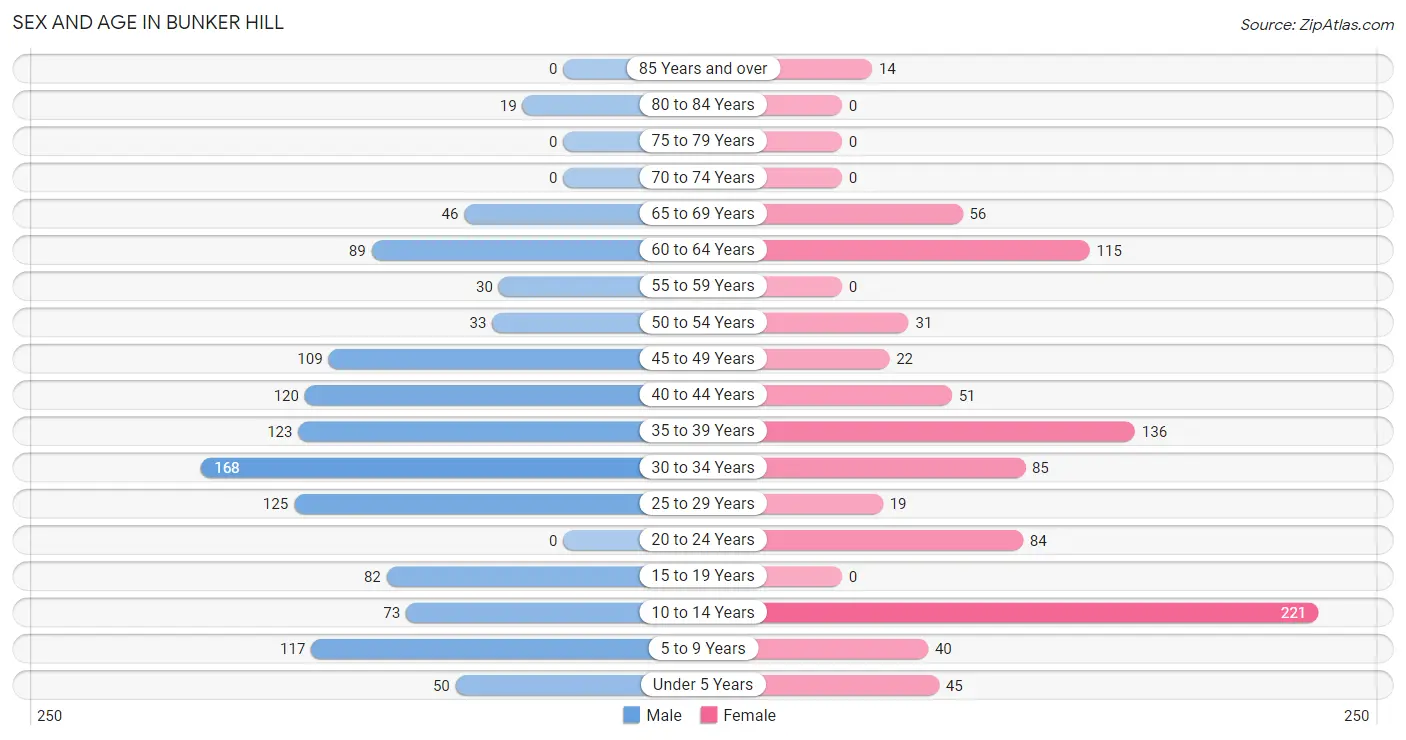
Sex and Age in Bunker Hill
Sex and Age in Bunker Hill
The most populous age groups in Bunker Hill are 30 to 34 Years (168 | 14.2%) for men and 10 to 14 Years (221 | 24.0%) for women.
| Age Bracket | Male | Female |
| Under 5 Years | 50 (4.2%) | 45 (4.9%) |
| 5 to 9 Years | 117 (9.9%) | 40 (4.3%) |
| 10 to 14 Years | 73 (6.2%) | 221 (24.0%) |
| 15 to 19 Years | 82 (6.9%) | 0 (0.0%) |
| 20 to 24 Years | 0 (0.0%) | 84 (9.1%) |
| 25 to 29 Years | 125 (10.6%) | 19 (2.1%) |
| 30 to 34 Years | 168 (14.2%) | 85 (9.2%) |
| 35 to 39 Years | 123 (10.4%) | 136 (14.8%) |
| 40 to 44 Years | 120 (10.1%) | 51 (5.6%) |
| 45 to 49 Years | 109 (9.2%) | 22 (2.4%) |
| 50 to 54 Years | 33 (2.8%) | 31 (3.4%) |
| 55 to 59 Years | 30 (2.5%) | 0 (0.0%) |
| 60 to 64 Years | 89 (7.5%) | 115 (12.5%) |
| 65 to 69 Years | 46 (3.9%) | 56 (6.1%) |
| 70 to 74 Years | 0 (0.0%) | 0 (0.0%) |
| 75 to 79 Years | 0 (0.0%) | 0 (0.0%) |
| 80 to 84 Years | 19 (1.6%) | 0 (0.0%) |
| 85 Years and over | 0 (0.0%) | 14 (1.5%) |
| Total | 1,184 (100.0%) | 919 (100.0%) |
Families and Households in Bunker Hill
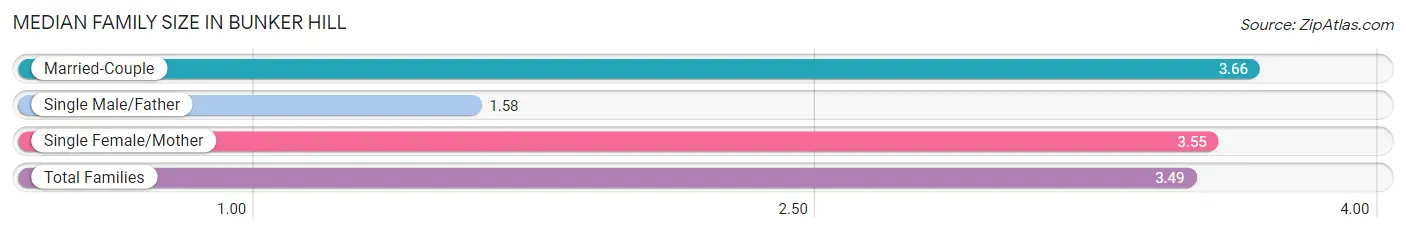
Median Family Size in Bunker Hill
The median family size in Bunker Hill is 3.49 persons per family, with married-couple families (222 | 59.5%) accounting for the largest median family size of 3.66 persons per family. On the other hand, single male/father families (24 | 6.4%) represent the smallest median family size with 1.58 persons per family.
| Family Type | # Families | Family Size |
| Married-Couple | 222 (59.5%) | 3.66 |
| Single Male/Father | 24 (6.4%) | 1.58 |
| Single Female/Mother | 127 (34.1%) | 3.55 |
| Total Families | 373 (100.0%) | 3.49 |
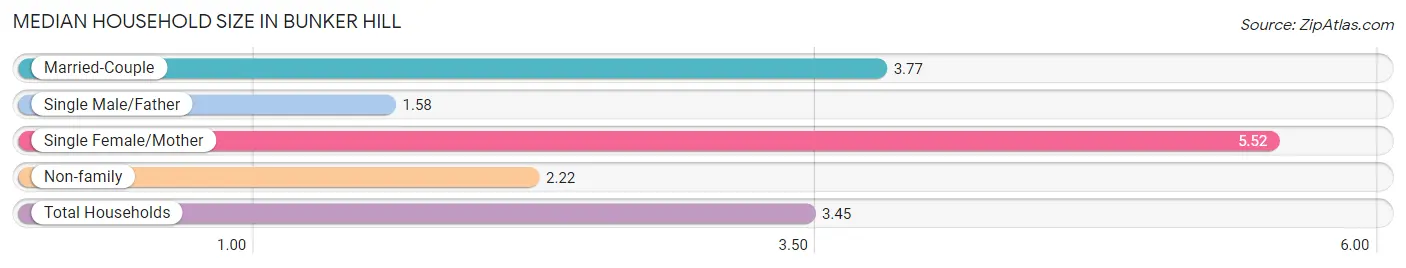
Median Household Size in Bunker Hill
The median household size in Bunker Hill is 3.45 persons per household, with single female/mother households (127 | 20.8%) accounting for the largest median household size of 5.52 persons per household. single male/father households (24 | 3.9%) represent the smallest median household size with 1.58 persons per household.
| Household Type | # Households | Household Size |
| Married-Couple | 222 (36.4%) | 3.77 |
| Single Male/Father | 24 (3.9%) | 1.58 |
| Single Female/Mother | 127 (20.8%) | 5.52 |
| Non-family | 237 (38.9%) | 2.22 |
| Total Households | 610 (100.0%) | 3.45 |
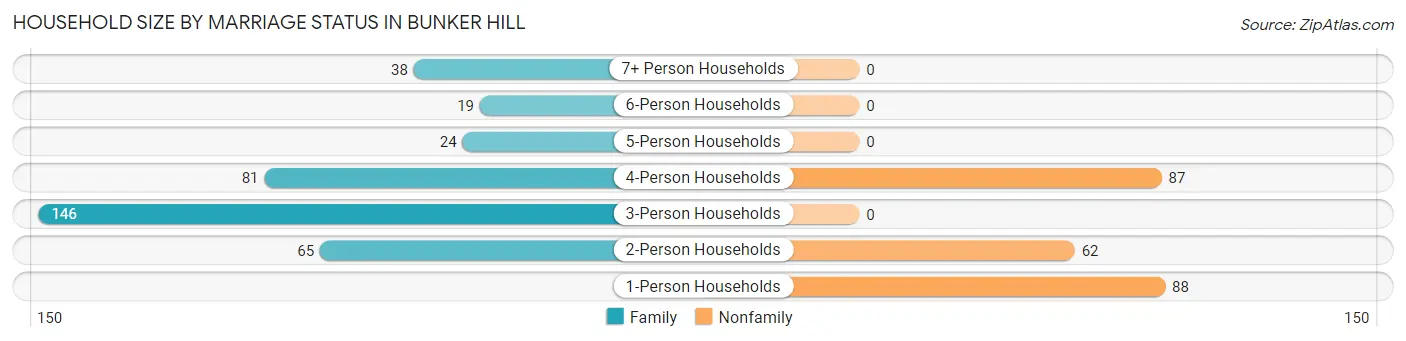
Household Size by Marriage Status in Bunker Hill
Out of a total of 610 households in Bunker Hill, 373 (61.2%) are family households, while 237 (38.9%) are nonfamily households. The most numerous type of family households are 3-person households, comprising 146, and the most common type of nonfamily households are 1-person households, comprising 88.
| Household Size | Family Households | Nonfamily Households |
| 1-Person Households | - | 88 (14.4%) |
| 2-Person Households | 65 (10.7%) | 62 (10.2%) |
| 3-Person Households | 146 (23.9%) | 0 (0.0%) |
| 4-Person Households | 81 (13.3%) | 87 (14.3%) |
| 5-Person Households | 24 (3.9%) | 0 (0.0%) |
| 6-Person Households | 19 (3.1%) | 0 (0.0%) |
| 7+ Person Households | 38 (6.2%) | 0 (0.0%) |
| Total | 373 (61.2%) | 237 (38.9%) |
Female Fertility in Bunker Hill
Fertility by Age in Bunker Hill
Average fertility rate in Bunker Hill is 30.0 births per 1,000 women. Women in the age bracket of 20 to 34 years have the highest fertility rate with 69.0 births per 1,000 women. Women in the age bracket of 20 to 34 years acount for 100.0% of all women with births.
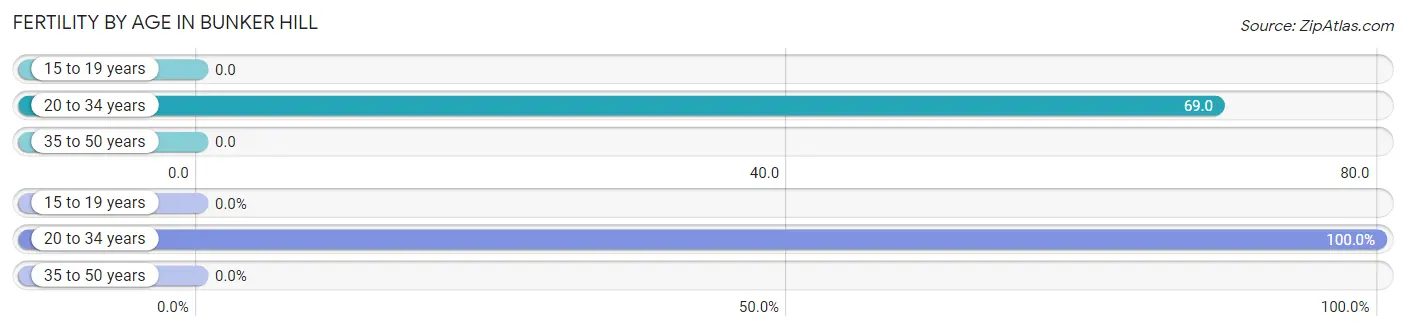
| Age Bracket | Women with Births | Births / 1,000 Women |
| 15 to 19 years | 0 (0.0%) | 0.0 |
| 20 to 34 years | 13 (100.0%) | 69.0 |
| 35 to 50 years | 0 (0.0%) | 0.0 |
| Total | 13 (100.0%) | 30.0 |
Fertility by Age by Marriage Status in Bunker Hill
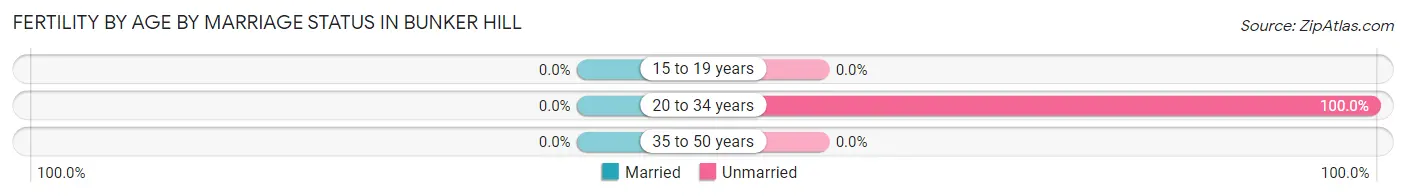
| Age Bracket | Married | Unmarried |
| 15 to 19 years | 0 (0.0%) | 0 (0.0%) |
| 20 to 34 years | 0 (0.0%) | 13 (100.0%) |
| 35 to 50 years | 0 (0.0%) | 0 (0.0%) |
| Total | 0 (0.0%) | 13 (100.0%) |
Fertility by Education in Bunker Hill
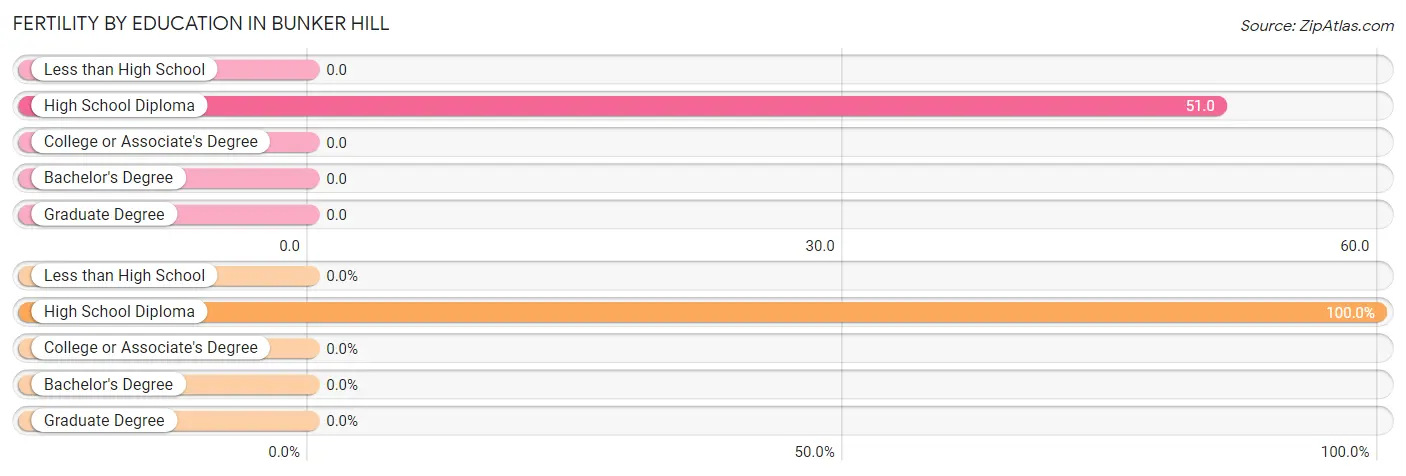
| Educational Attainment | Women with Births | Births / 1,000 Women |
| Less than High School | 0 (0.0%) | 0.0 |
| High School Diploma | 13 (100.0%) | 51.0 |
| College or Associate's Degree | 0 (0.0%) | 0.0 |
| Bachelor's Degree | 0 (0.0%) | 0.0 |
| Graduate Degree | 0 (0.0%) | 0.0 |
| Total | 13 (100.0%) | 30.0 |
Fertility by Education by Marriage Status in Bunker Hill
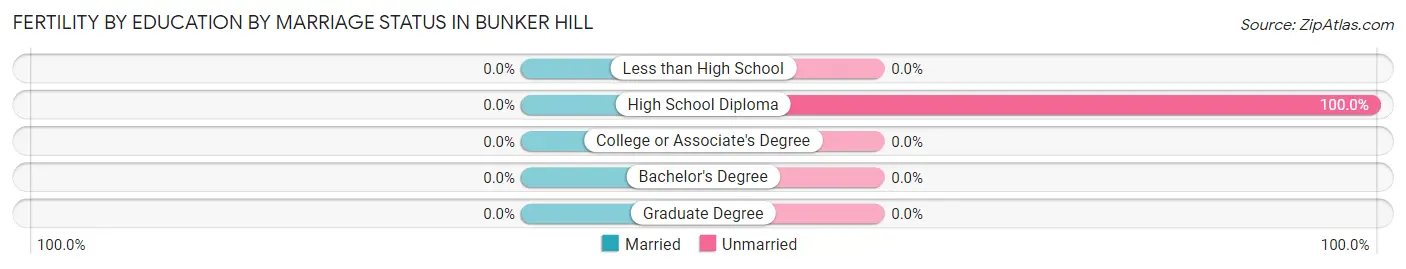
| Educational Attainment | Married | Unmarried |
| Less than High School | 0 (0.0%) | 0 (0.0%) |
| High School Diploma | 0 (0.0%) | 13 (100.0%) |
| College or Associate's Degree | 0 (0.0%) | 0 (0.0%) |
| Bachelor's Degree | 0 (0.0%) | 0 (0.0%) |
| Graduate Degree | 0 (0.0%) | 0 (0.0%) |
| Total | 0 (0.0%) | 13 (100.0%) |
Income in Bunker Hill
Income Overview in Bunker Hill
Per Capita Income in Bunker Hill is $20,448, while median incomes of families and households are $63,517 and $63,417 respectively.
| Characteristic | Number | Measure |
| Per Capita Income | 2,103 | $20,448 |
| Median Family Income | 373 | $63,517 |
| Mean Family Income | 373 | $64,286 |
| Median Household Income | 610 | $63,417 |
| Mean Household Income | 610 | $64,130 |
| Income Deficit | 373 | $0 |
| Wage / Income Gap (%) | 2,103 | 41.21% |
| Wage / Income Gap ($) | 2,103 | 58.79¢ per $1 |
| Gini / Inequality Index | 2,103 | 0.30 |
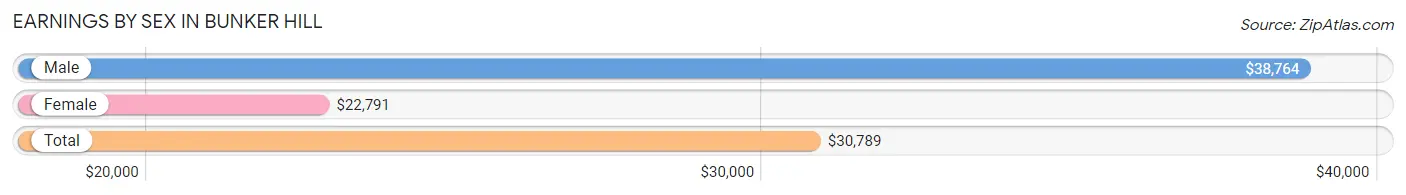
Earnings by Sex in Bunker Hill
Average Earnings in Bunker Hill are $30,789, $38,764 for men and $22,791 for women, a difference of 41.2%.
| Sex | Number | Average Earnings |
| Male | 586 (63.7%) | $38,764 |
| Female | 334 (36.3%) | $22,791 |
| Total | 920 (100.0%) | $30,789 |
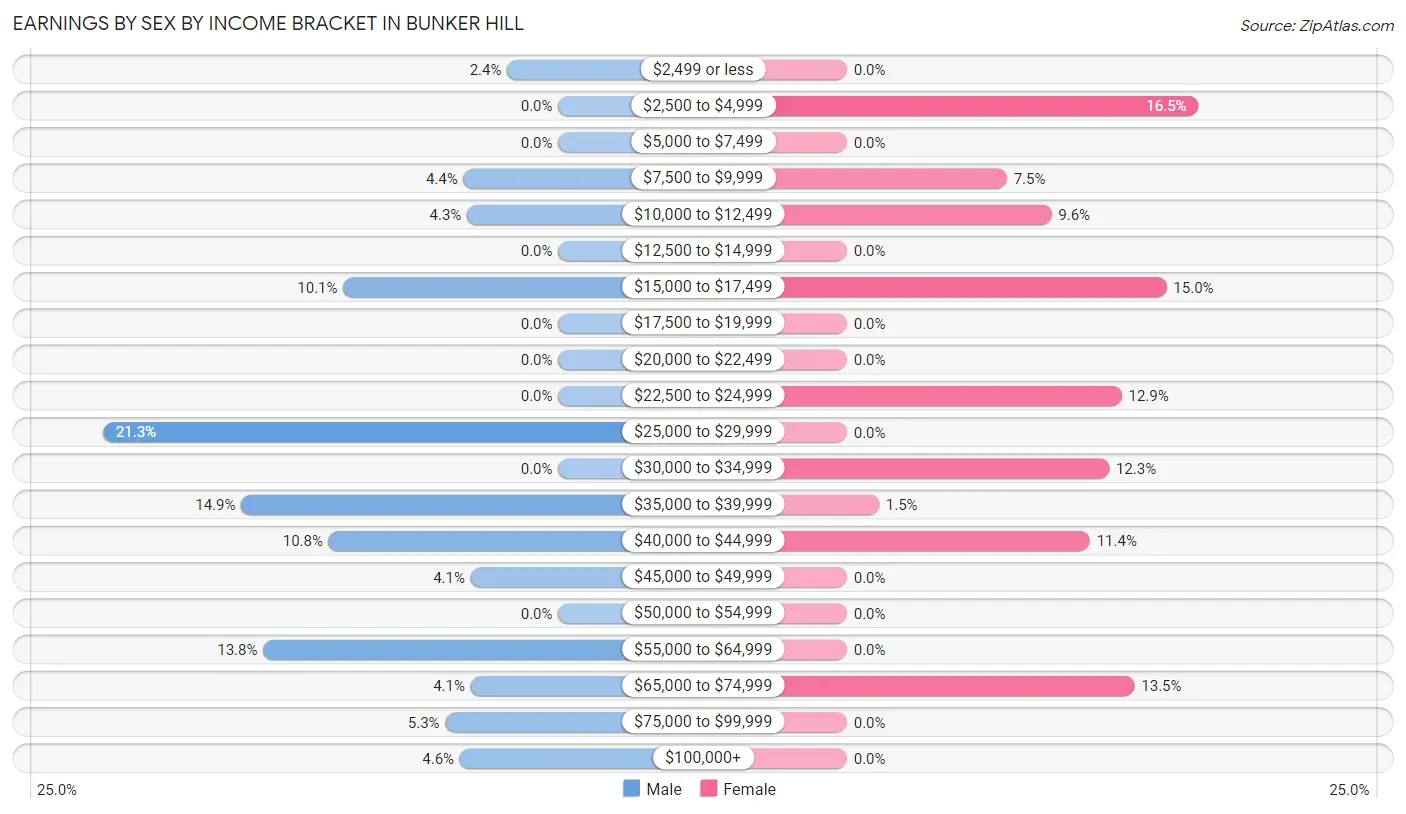
Earnings by Sex by Income Bracket in Bunker Hill
The most common earnings brackets in Bunker Hill are $25,000 to $29,999 for men (125 | 21.3%) and $2,500 to $4,999 for women (55 | 16.5%).
| Income | Male | Female |
| $2,499 or less | 14 (2.4%) | 0 (0.0%) |
| $2,500 to $4,999 | 0 (0.0%) | 55 (16.5%) |
| $5,000 to $7,499 | 0 (0.0%) | 0 (0.0%) |
| $7,500 to $9,999 | 26 (4.4%) | 25 (7.5%) |
| $10,000 to $12,499 | 25 (4.3%) | 32 (9.6%) |
| $12,500 to $14,999 | 0 (0.0%) | 0 (0.0%) |
| $15,000 to $17,499 | 59 (10.1%) | 50 (15.0%) |
| $17,500 to $19,999 | 0 (0.0%) | 0 (0.0%) |
| $20,000 to $22,499 | 0 (0.0%) | 0 (0.0%) |
| $22,500 to $24,999 | 0 (0.0%) | 43 (12.9%) |
| $25,000 to $29,999 | 125 (21.3%) | 0 (0.0%) |
| $30,000 to $34,999 | 0 (0.0%) | 41 (12.3%) |
| $35,000 to $39,999 | 87 (14.8%) | 5 (1.5%) |
| $40,000 to $44,999 | 63 (10.7%) | 38 (11.4%) |
| $45,000 to $49,999 | 24 (4.1%) | 0 (0.0%) |
| $50,000 to $54,999 | 0 (0.0%) | 0 (0.0%) |
| $55,000 to $64,999 | 81 (13.8%) | 0 (0.0%) |
| $65,000 to $74,999 | 24 (4.1%) | 45 (13.5%) |
| $75,000 to $99,999 | 31 (5.3%) | 0 (0.0%) |
| $100,000+ | 27 (4.6%) | 0 (0.0%) |
| Total | 586 (100.0%) | 334 (100.0%) |
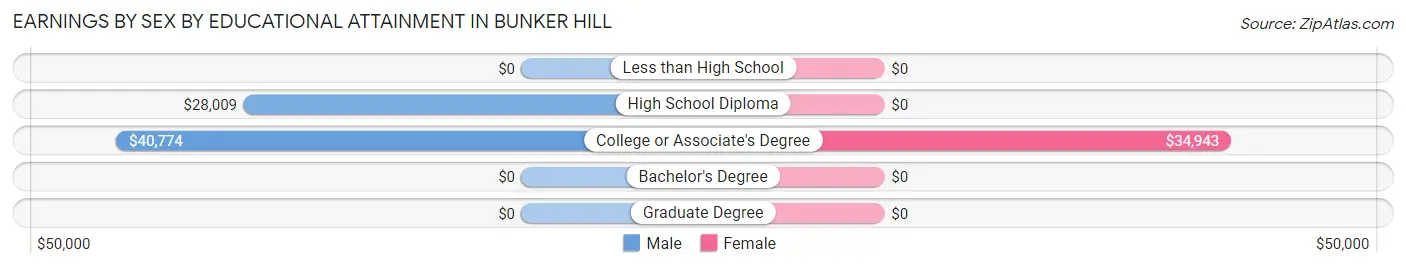
Earnings by Sex by Educational Attainment in Bunker Hill
Average earnings in Bunker Hill are $38,966 for men and $24,767 for women, a difference of 36.4%. Men with an educational attainment of college or associate's degree enjoy the highest average annual earnings of $40,774, while those with high school diploma education earn the least with $28,009. Women with an educational attainment of college or associate's degree earn the most with the average annual earnings of $34,943, while those with college or associate's degree education have the smallest earnings of $34,943.
| Educational Attainment | Male Income | Female Income |
| Less than High School | - | - |
| High School Diploma | $28,009 | $0 |
| College or Associate's Degree | $40,774 | $34,943 |
| Bachelor's Degree | - | - |
| Graduate Degree | - | - |
| Total | $38,966 | $24,767 |
Family Income in Bunker Hill
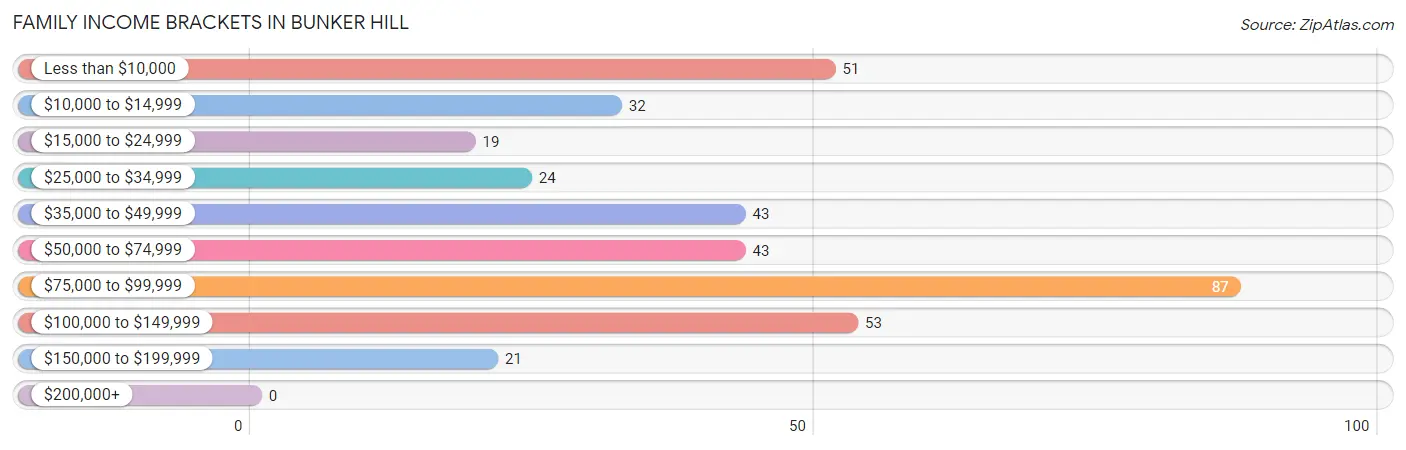
Family Income Brackets in Bunker Hill
According to the Bunker Hill family income data, there are 87 families falling into the $75,000 to $99,999 income range, which is the most common income bracket and makes up 23.3% of all families.
| Income Bracket | # Families | % Families |
| Less than $10,000 | 51 | 13.7% |
| $10,000 to $14,999 | 32 | 8.6% |
| $15,000 to $24,999 | 19 | 5.1% |
| $25,000 to $34,999 | 24 | 6.4% |
| $35,000 to $49,999 | 43 | 11.5% |
| $50,000 to $74,999 | 43 | 11.5% |
| $75,000 to $99,999 | 87 | 23.3% |
| $100,000 to $149,999 | 53 | 14.2% |
| $150,000 to $199,999 | 21 | 5.6% |
| $200,000+ | 0 | 0.0% |
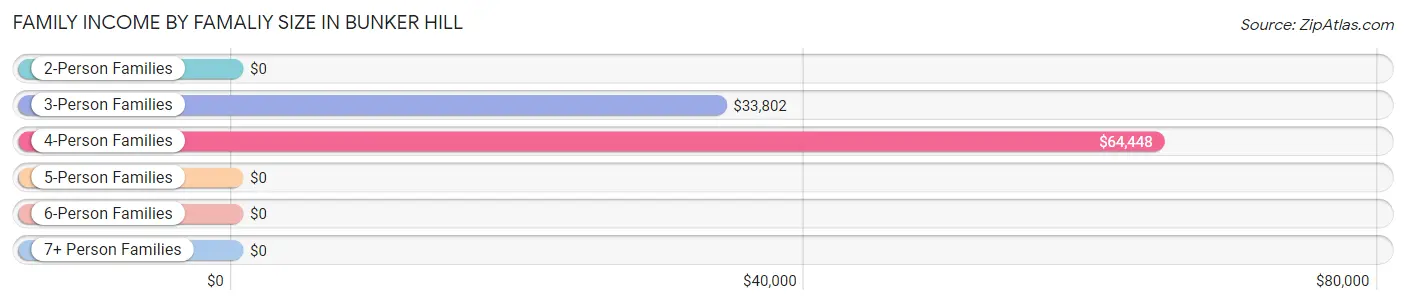
Family Income by Famaliy Size in Bunker Hill
4-person families (67 | 18.0%) account for the highest median family income in Bunker Hill with $64,448 per family, while 4-person families (67 | 18.0%) have the highest median income of $16,112 per family member.
| Income Bracket | # Families | Median Income |
| 2-Person Families | 78 (20.9%) | $0 |
| 3-Person Families | 203 (54.4%) | $33,802 |
| 4-Person Families | 67 (18.0%) | $64,448 |
| 5-Person Families | 6 (1.6%) | $0 |
| 6-Person Families | 19 (5.1%) | $0 |
| 7+ Person Families | 0 (0.0%) | $0 |
| Total | 373 (100.0%) | $63,517 |
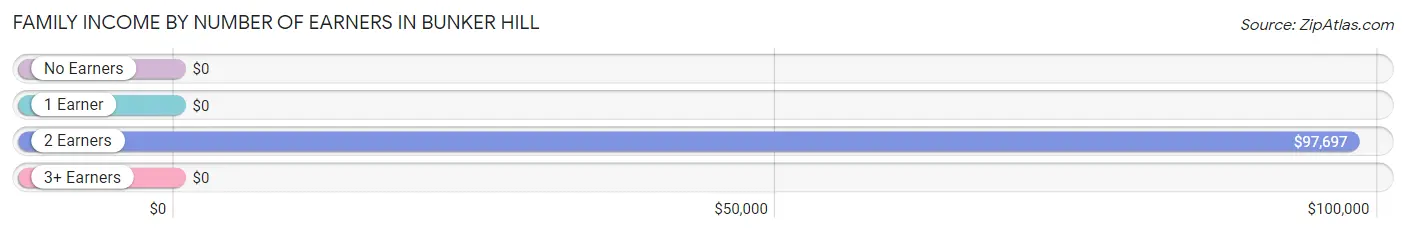
Family Income by Number of Earners in Bunker Hill
| Number of Earners | # Families | Median Income |
| No Earners | 92 (24.7%) | $0 |
| 1 Earner | 192 (51.5%) | $0 |
| 2 Earners | 89 (23.9%) | $97,697 |
| 3+ Earners | 0 (0.0%) | $0 |
| Total | 373 (100.0%) | $63,517 |
Household Income in Bunker Hill
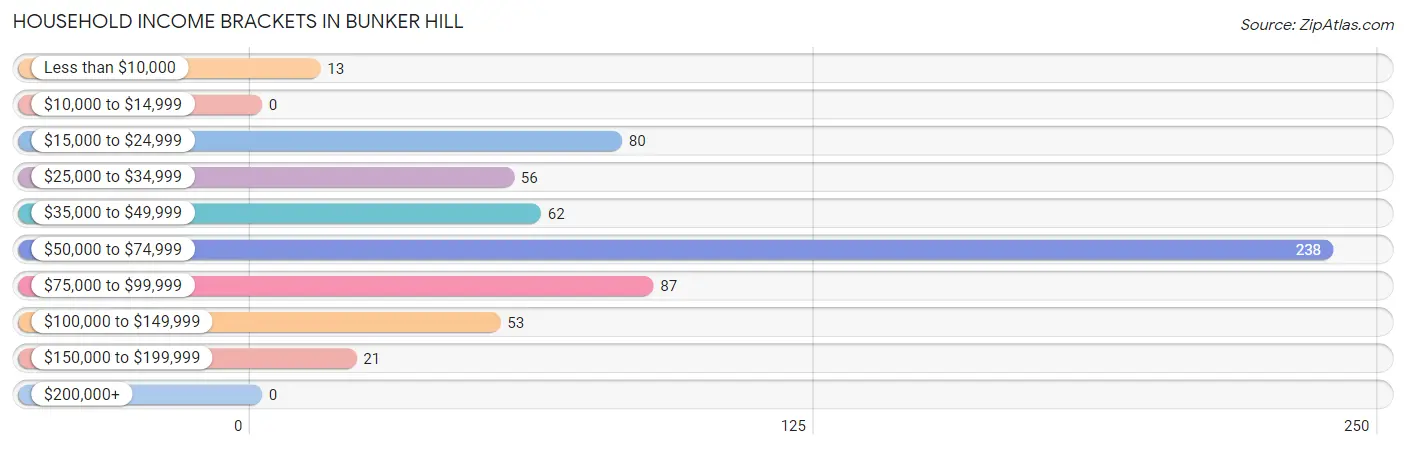
Household Income Brackets in Bunker Hill
With 238 households falling in the category, the $50,000 to $74,999 income range is the most frequent in Bunker Hill, accounting for 39.0% of all households.
| Income Bracket | # Households | % Households |
| Less than $10,000 | 13 | 2.1% |
| $10,000 to $14,999 | 0 | 0.0% |
| $15,000 to $24,999 | 80 | 13.1% |
| $25,000 to $34,999 | 56 | 9.2% |
| $35,000 to $49,999 | 62 | 10.2% |
| $50,000 to $74,999 | 238 | 39.0% |
| $75,000 to $99,999 | 87 | 14.3% |
| $100,000 to $149,999 | 53 | 8.7% |
| $150,000 to $199,999 | 21 | 3.4% |
| $200,000+ | 0 | 0.0% |
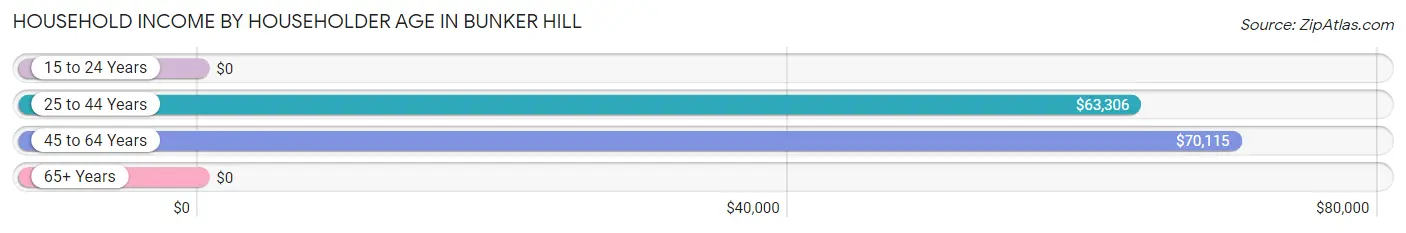
Household Income by Householder Age in Bunker Hill
The median household income in Bunker Hill is $63,417, with the highest median household income of $70,115 found in the 45 to 64 years age bracket for the primary householder. A total of 254 households (41.6%) fall into this category. Meanwhile, the 15 to 24 years age bracket for the primary householder has the lowest median household income of $0, with 13 households (2.1%) in this group.
| Income Bracket | # Households | Median Income |
| 15 to 24 Years | 13 (2.1%) | $0 |
| 25 to 44 Years | 284 (46.6%) | $63,306 |
| 45 to 64 Years | 254 (41.6%) | $70,115 |
| 65+ Years | 59 (9.7%) | $0 |
| Total | 610 (100.0%) | $63,417 |
Poverty in Bunker Hill
Income Below Poverty by Sex and Age in Bunker Hill
With 23.0% poverty level for males and 45.4% for females among the residents of Bunker Hill, 18 to 24 year old males and under 5 year old females are the most vulnerable to poverty, with 14 males (100.0%) and 45 females (100.0%) in their respective age groups living below the poverty level.
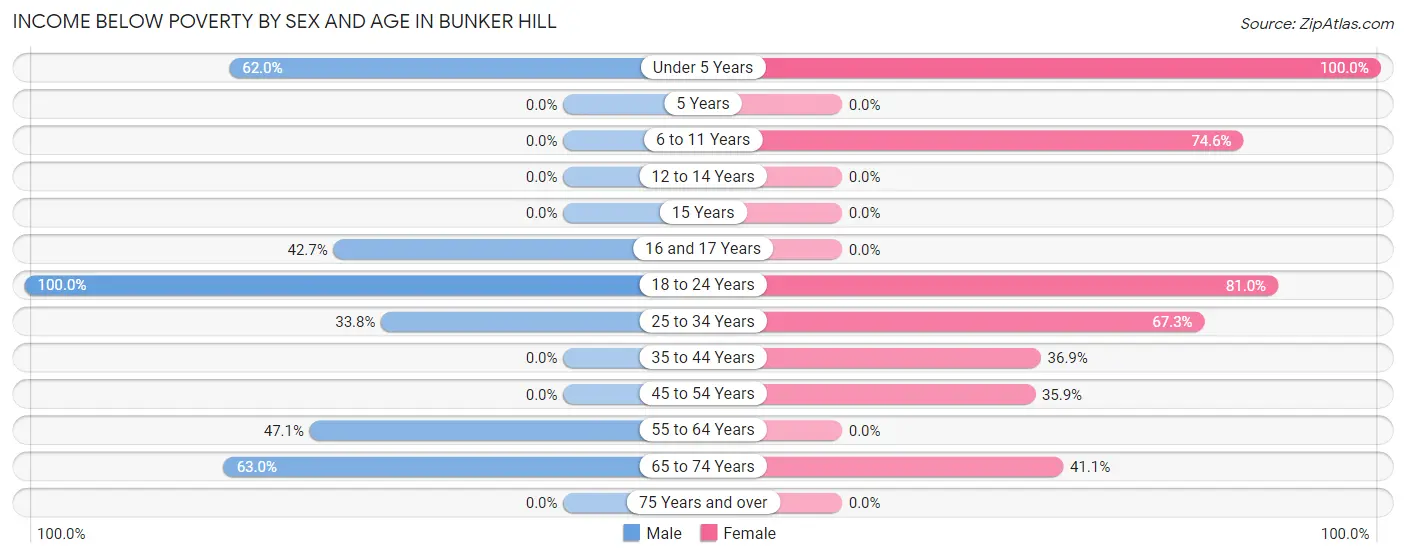
| Age Bracket | Male | Female |
| Under 5 Years | 31 (62.0%) | 45 (100.0%) |
| 5 Years | 0 (0.0%) | 0 (0.0%) |
| 6 to 11 Years | 0 (0.0%) | 123 (74.6%) |
| 12 to 14 Years | 0 (0.0%) | 0 (0.0%) |
| 15 Years | 0 (0.0%) | 0 (0.0%) |
| 16 and 17 Years | 29 (42.6%) | 0 (0.0%) |
| 18 to 24 Years | 14 (100.0%) | 68 (80.9%) |
| 25 to 34 Years | 99 (33.8%) | 70 (67.3%) |
| 35 to 44 Years | 0 (0.0%) | 69 (36.9%) |
| 45 to 54 Years | 0 (0.0%) | 19 (35.8%) |
| 55 to 64 Years | 56 (47.1%) | 0 (0.0%) |
| 65 to 74 Years | 29 (63.0%) | 23 (41.1%) |
| 75 Years and over | 0 (0.0%) | 0 (0.0%) |
| Total | 258 (23.0%) | 417 (45.4%) |
Income Above Poverty by Sex and Age in Bunker Hill
According to the poverty statistics in Bunker Hill, males aged 6 to 11 years and females aged 12 to 14 years are the age groups that are most secure financially, with 100.0% of males and 100.0% of females in these age groups living above the poverty line.
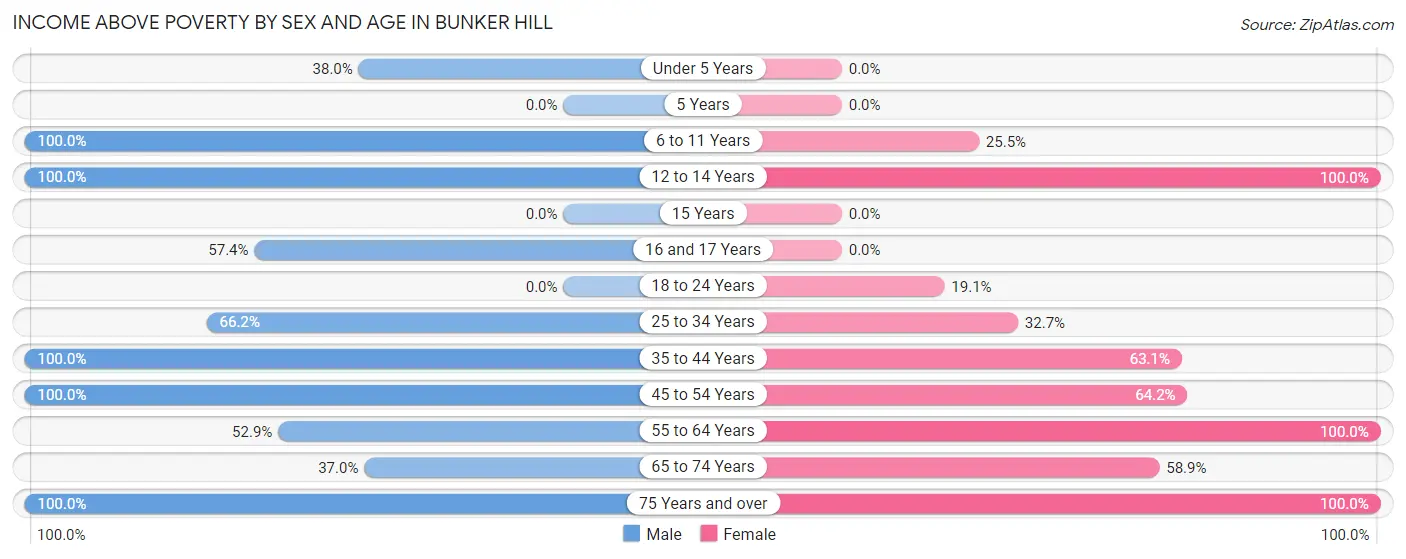
| Age Bracket | Male | Female |
| Under 5 Years | 19 (38.0%) | 0 (0.0%) |
| 5 Years | 0 (0.0%) | 0 (0.0%) |
| 6 to 11 Years | 117 (100.0%) | 42 (25.5%) |
| 12 to 14 Years | 9 (100.0%) | 96 (100.0%) |
| 15 Years | 0 (0.0%) | 0 (0.0%) |
| 16 and 17 Years | 39 (57.4%) | 0 (0.0%) |
| 18 to 24 Years | 0 (0.0%) | 16 (19.1%) |
| 25 to 34 Years | 194 (66.2%) | 34 (32.7%) |
| 35 to 44 Years | 243 (100.0%) | 118 (63.1%) |
| 45 to 54 Years | 142 (100.0%) | 34 (64.1%) |
| 55 to 64 Years | 63 (52.9%) | 115 (100.0%) |
| 65 to 74 Years | 17 (37.0%) | 33 (58.9%) |
| 75 Years and over | 19 (100.0%) | 14 (100.0%) |
| Total | 862 (77.0%) | 502 (54.6%) |
Income Below Poverty Among Married-Couple Families in Bunker Hill
The poverty statistics for married-couple families in Bunker Hill show that 8.6% or 19 of the total 222 families live below the poverty line. Families with no children have the highest poverty rate of 24.4%, comprising of 19 families. On the other hand, families with 1 or 2 children have the lowest poverty rate of 0.0%, which includes 0 families.
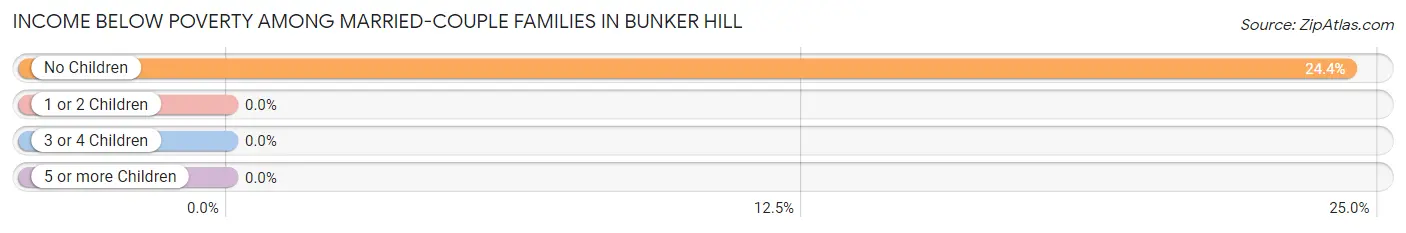
| Children | Above Poverty | Below Poverty |
| No Children | 59 (75.6%) | 19 (24.4%) |
| 1 or 2 Children | 119 (100.0%) | 0 (0.0%) |
| 3 or 4 Children | 25 (100.0%) | 0 (0.0%) |
| 5 or more Children | 0 (0.0%) | 0 (0.0%) |
| Total | 203 (91.4%) | 19 (8.6%) |
Income Below Poverty Among Single-Parent Households in Bunker Hill
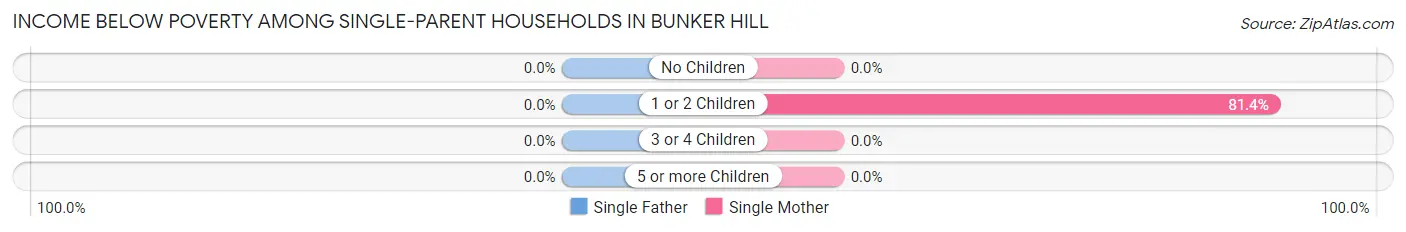
| Children | Single Father | Single Mother |
| No Children | 0 (0.0%) | 0 (0.0%) |
| 1 or 2 Children | 0 (0.0%) | 83 (81.4%) |
| 3 or 4 Children | 0 (0.0%) | 0 (0.0%) |
| 5 or more Children | 0 (0.0%) | 0 (0.0%) |
| Total | 0 (0.0%) | 83 (65.3%) |
Income Below Poverty Among Married-Couple vs Single-Parent Households in Bunker Hill
The poverty data for Bunker Hill shows that 19 of the married-couple family households (8.6%) and 83 of the single-parent households (55.0%) are living below the poverty level. Within the married-couple family households, those with no children have the highest poverty rate, with 19 households (24.4%) falling below the poverty line. Among the single-parent households, those with 1 or 2 children have the highest poverty rate, with 83 household (81.4%) living below poverty.
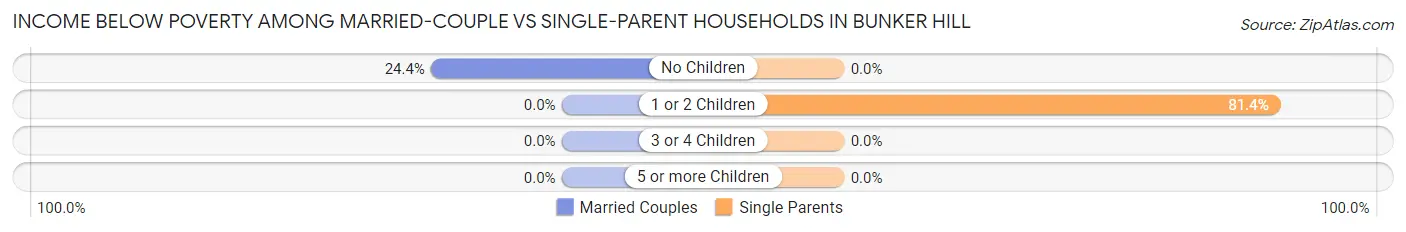
| Children | Married-Couple Families | Single-Parent Households |
| No Children | 19 (24.4%) | 0 (0.0%) |
| 1 or 2 Children | 0 (0.0%) | 83 (81.4%) |
| 3 or 4 Children | 0 (0.0%) | 0 (0.0%) |
| 5 or more Children | 0 (0.0%) | 0 (0.0%) |
| Total | 19 (8.6%) | 83 (55.0%) |
Employment Characteristics in Bunker Hill
Employment by Class of Employer in Bunker Hill
Among the 779 employed individuals in Bunker Hill, private company employees (552 | 70.9%), state government employees (81 | 10.4%), and unpaid family workers (59 | 7.6%) make up the most common classes of employment.
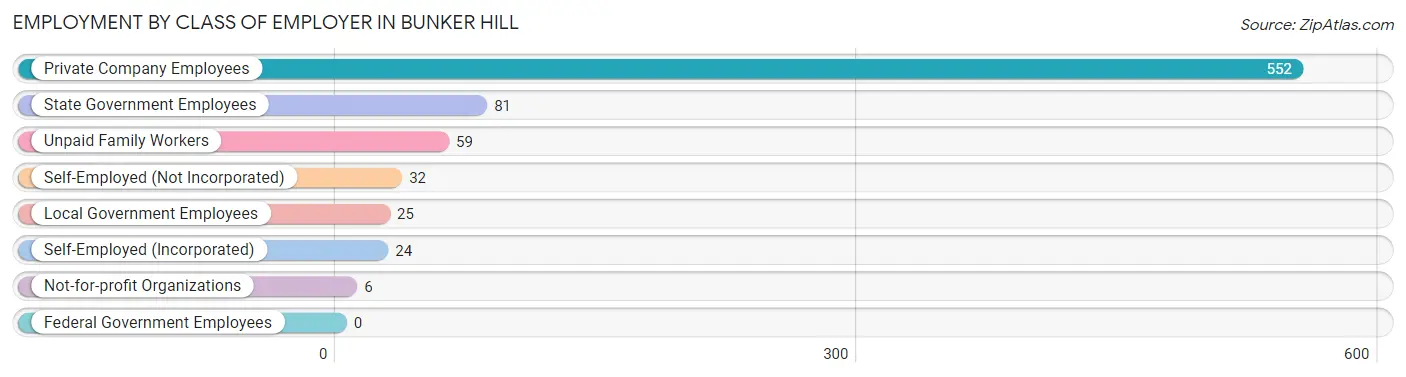
| Employer Class | # Employees | % Employees |
| Private Company Employees | 552 | 70.9% |
| Self-Employed (Incorporated) | 24 | 3.1% |
| Self-Employed (Not Incorporated) | 32 | 4.1% |
| Not-for-profit Organizations | 6 | 0.8% |
| Local Government Employees | 25 | 3.2% |
| State Government Employees | 81 | 10.4% |
| Federal Government Employees | 0 | 0.0% |
| Unpaid Family Workers | 59 | 7.6% |
| Total | 779 | 100.0% |
Employment Status by Age in Bunker Hill
According to the labor force statistics for Bunker Hill, out of the total population over 16 years of age (1,557), 60.1% or 936 individuals are in the labor force, with 7.5% or 70 of them unemployed. The age group with the highest labor force participation rate is 60 to 64 years, with 88.2% or 180 individuals in the labor force. Within the labor force, the 20 to 24 years age range has the highest percentage of unemployed individuals, with 80.9% or 55 of them being unemployed.
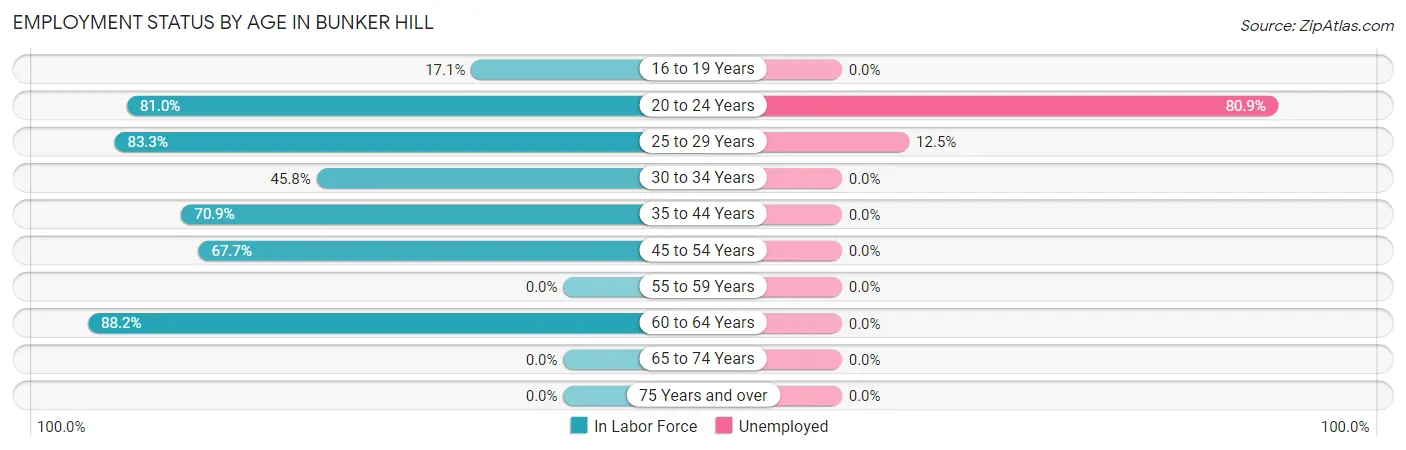
| Age Bracket | In Labor Force | Unemployed |
| 16 to 19 Years | 14 (17.1%) | 0 (0.0%) |
| 20 to 24 Years | 68 (81.0%) | 55 (80.9%) |
| 25 to 29 Years | 120 (83.3%) | 15 (12.5%) |
| 30 to 34 Years | 116 (45.8%) | 0 (0.0%) |
| 35 to 44 Years | 305 (70.9%) | 0 (0.0%) |
| 45 to 54 Years | 132 (67.7%) | 0 (0.0%) |
| 55 to 59 Years | 0 (0.0%) | 0 (0.0%) |
| 60 to 64 Years | 180 (88.2%) | 0 (0.0%) |
| 65 to 74 Years | 0 (0.0%) | 0 (0.0%) |
| 75 Years and over | 0 (0.0%) | 0 (0.0%) |
| Total | 936 (60.1%) | 70 (7.5%) |
Employment Status by Educational Attainment in Bunker Hill
According to labor force statistics for Bunker Hill, 67.9% of individuals (853) out of the total population between 25 and 64 years of age (1,256) are in the labor force, with 1.8% or 15 of them being unemployed. The group with the highest labor force participation rate are those with the educational attainment of bachelor's degree or higher, with 100.0% or 56 individuals in the labor force. Within the labor force, individuals with less than high school education have the highest percentage of unemployment, with 20.8% or 15 of them being unemployed.
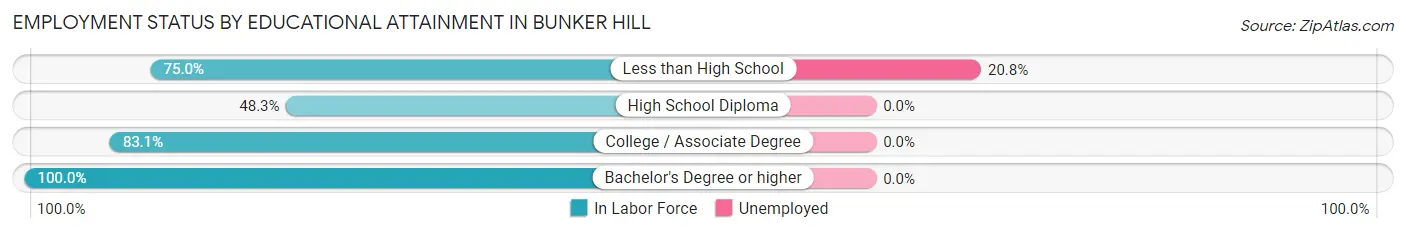
| Educational Attainment | In Labor Force | Unemployed |
| Less than High School | 72 (75.0%) | 20 (20.8%) |
| High School Diploma | 267 (48.3%) | 0 (0.0%) |
| College / Associate Degree | 458 (83.1%) | 0 (0.0%) |
| Bachelor's Degree or higher | 56 (100.0%) | 0 (0.0%) |
| Total | 853 (67.9%) | 23 (1.8%) |
Employment Occupations by Sex in Bunker Hill
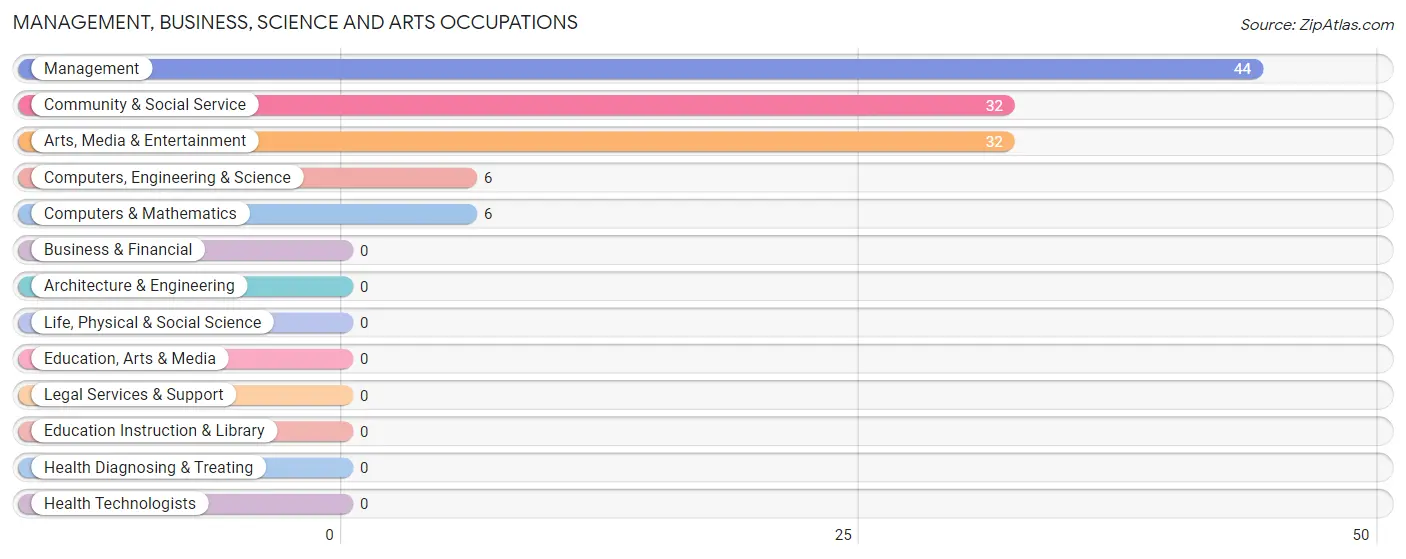
Management, Business, Science and Arts Occupations
The most common Management, Business, Science and Arts occupations in Bunker Hill are Management (44 | 5.1%), Community & Social Service (32 | 3.7%), Arts, Media & Entertainment (32 | 3.7%), Computers, Engineering & Science (6 | 0.7%), and Computers & Mathematics (6 | 0.7%).
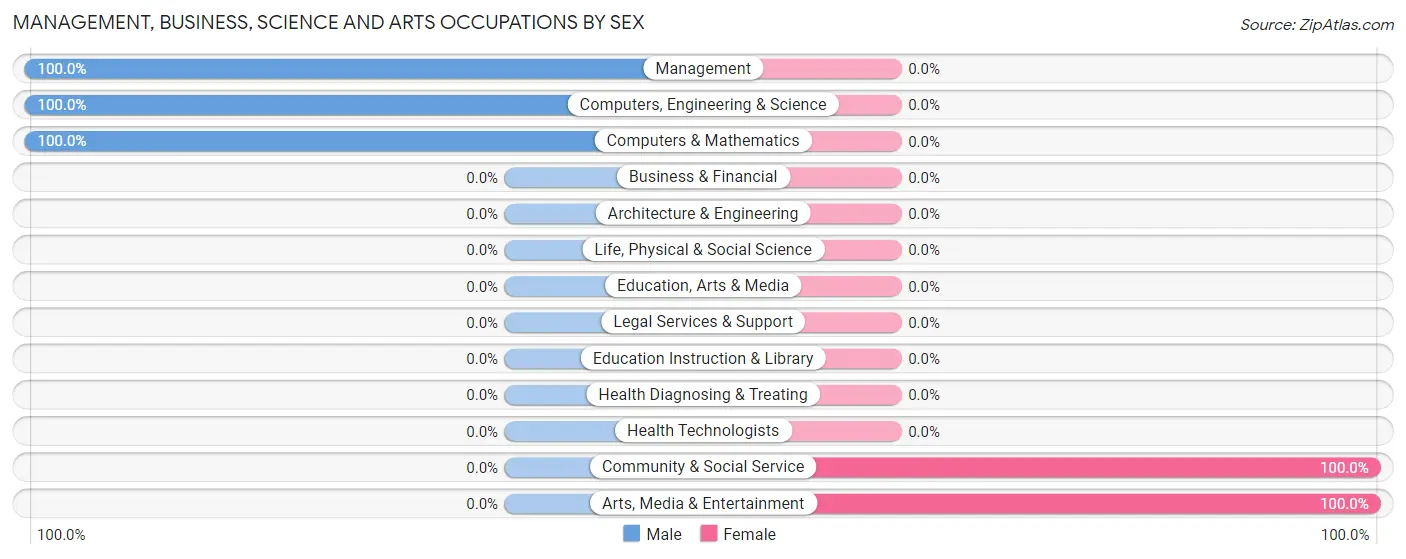
Management, Business, Science and Arts Occupations by Sex
Within the Management, Business, Science and Arts occupations in Bunker Hill, the most male-oriented occupations are Management (100.0%), Computers, Engineering & Science (100.0%), and Computers & Mathematics (100.0%), while the most female-oriented occupations are Community & Social Service (100.0%), and Arts, Media & Entertainment (100.0%).
| Occupation | Male | Female |
| Management | 44 (100.0%) | 0 (0.0%) |
| Business & Financial | 0 (0.0%) | 0 (0.0%) |
| Computers, Engineering & Science | 6 (100.0%) | 0 (0.0%) |
| Computers & Mathematics | 6 (100.0%) | 0 (0.0%) |
| Architecture & Engineering | 0 (0.0%) | 0 (0.0%) |
| Life, Physical & Social Science | 0 (0.0%) | 0 (0.0%) |
| Community & Social Service | 0 (0.0%) | 32 (100.0%) |
| Education, Arts & Media | 0 (0.0%) | 0 (0.0%) |
| Legal Services & Support | 0 (0.0%) | 0 (0.0%) |
| Education Instruction & Library | 0 (0.0%) | 0 (0.0%) |
| Arts, Media & Entertainment | 0 (0.0%) | 32 (100.0%) |
| Health Diagnosing & Treating | 0 (0.0%) | 0 (0.0%) |
| Health Technologists | 0 (0.0%) | 0 (0.0%) |
| Total (Category) | 50 (61.0%) | 32 (39.0%) |
| Total (Overall) | 586 (67.7%) | 279 (32.3%) |
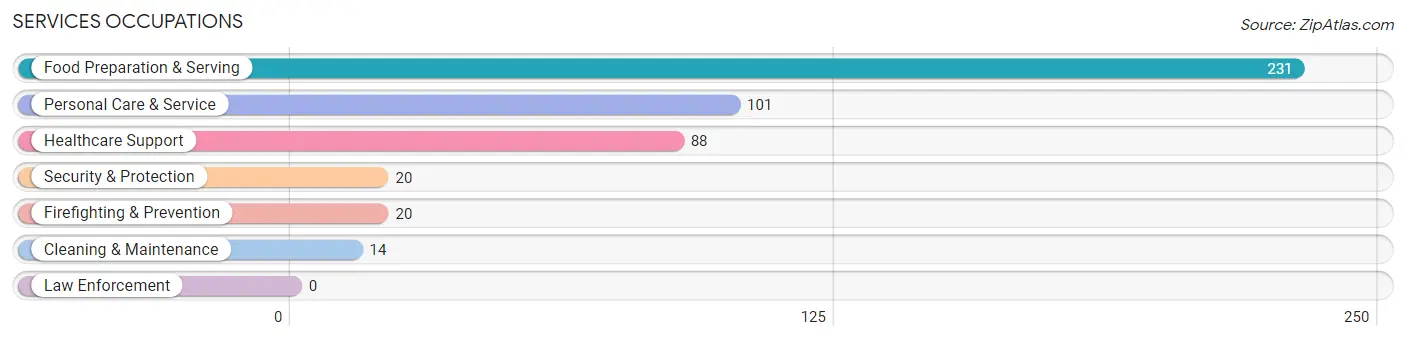
Services Occupations
The most common Services occupations in Bunker Hill are Food Preparation & Serving (231 | 26.7%), Personal Care & Service (101 | 11.7%), Healthcare Support (88 | 10.2%), Security & Protection (20 | 2.3%), and Firefighting & Prevention (20 | 2.3%).
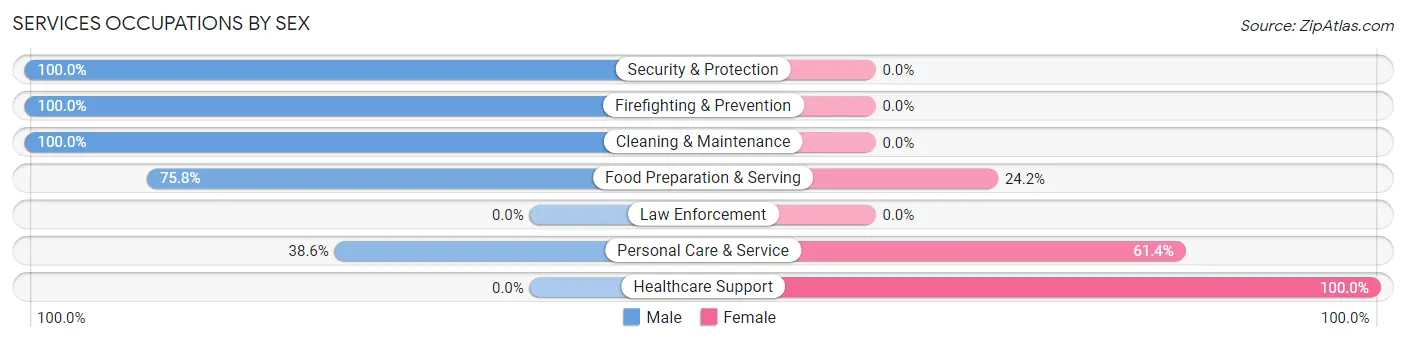
Services Occupations by Sex
Within the Services occupations in Bunker Hill, the most male-oriented occupations are Security & Protection (100.0%), Firefighting & Prevention (100.0%), and Cleaning & Maintenance (100.0%), while the most female-oriented occupations are Healthcare Support (100.0%), Personal Care & Service (61.4%), and Food Preparation & Serving (24.2%).
| Occupation | Male | Female |
| Healthcare Support | 0 (0.0%) | 88 (100.0%) |
| Security & Protection | 20 (100.0%) | 0 (0.0%) |
| Firefighting & Prevention | 20 (100.0%) | 0 (0.0%) |
| Law Enforcement | 0 (0.0%) | 0 (0.0%) |
| Food Preparation & Serving | 175 (75.8%) | 56 (24.2%) |
| Cleaning & Maintenance | 14 (100.0%) | 0 (0.0%) |
| Personal Care & Service | 39 (38.6%) | 62 (61.4%) |
| Total (Category) | 248 (54.6%) | 206 (45.4%) |
| Total (Overall) | 586 (67.7%) | 279 (32.3%) |
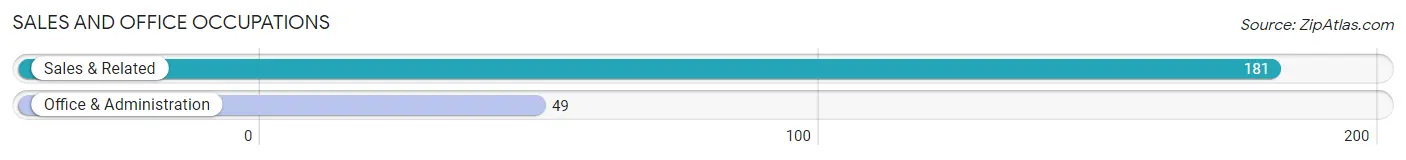
Sales and Office Occupations
The most common Sales and Office occupations in Bunker Hill are Sales & Related (181 | 20.9%), and Office & Administration (49 | 5.7%).
Sales and Office Occupations by Sex
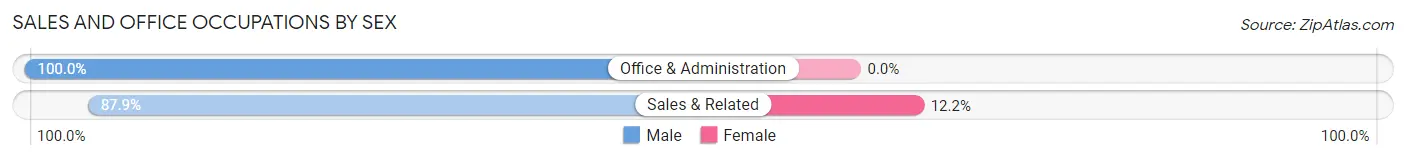
| Occupation | Male | Female |
| Sales & Related | 159 (87.8%) | 22 (12.1%) |
| Office & Administration | 49 (100.0%) | 0 (0.0%) |
| Total (Category) | 208 (90.4%) | 22 (9.6%) |
| Total (Overall) | 586 (67.7%) | 279 (32.3%) |
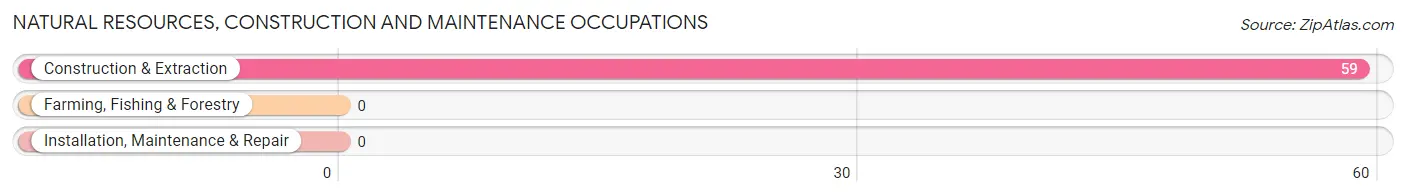
Natural Resources, Construction and Maintenance Occupations
The most common Natural Resources, Construction and Maintenance occupations in Bunker Hill are , and Construction & Extraction (59 | 6.8%).
Natural Resources, Construction and Maintenance Occupations by Sex
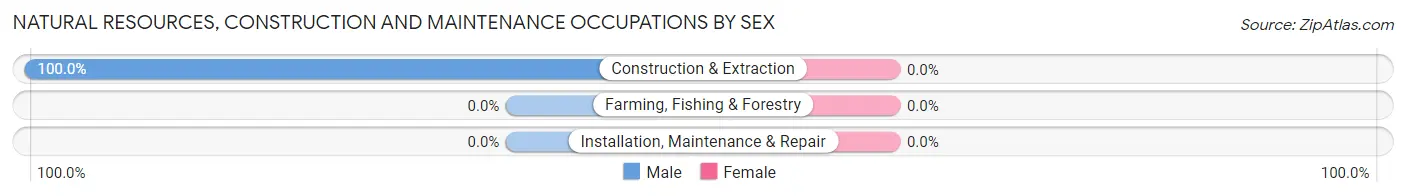
| Occupation | Male | Female |
| Farming, Fishing & Forestry | 0 (0.0%) | 0 (0.0%) |
| Construction & Extraction | 59 (100.0%) | 0 (0.0%) |
| Installation, Maintenance & Repair | 0 (0.0%) | 0 (0.0%) |
| Total (Category) | 59 (100.0%) | 0 (0.0%) |
| Total (Overall) | 586 (67.7%) | 279 (32.3%) |
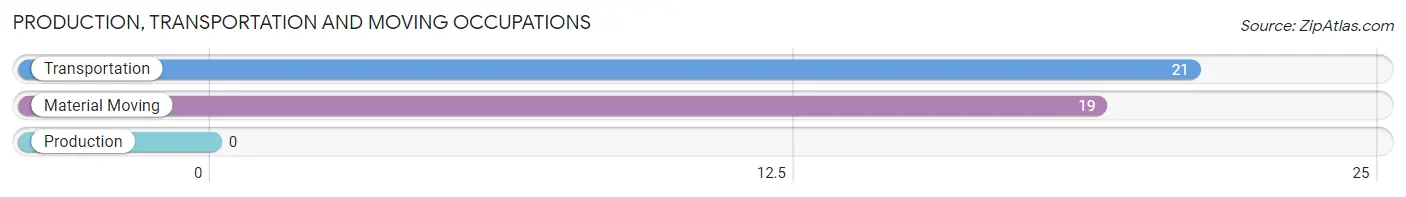
Production, Transportation and Moving Occupations
The most common Production, Transportation and Moving occupations in Bunker Hill are Transportation (21 | 2.4%), and Material Moving (19 | 2.2%).
Production, Transportation and Moving Occupations by Sex
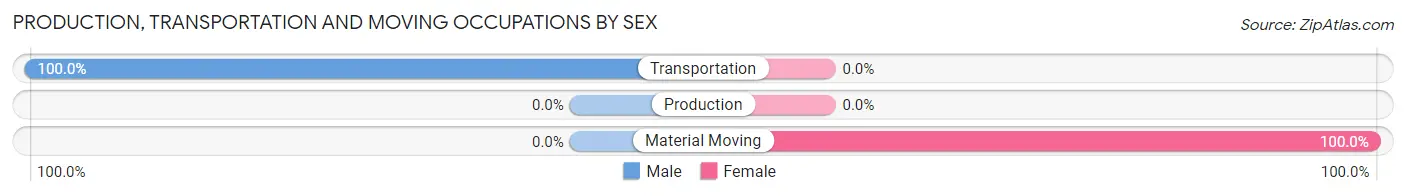
| Occupation | Male | Female |
| Production | 0 (0.0%) | 0 (0.0%) |
| Transportation | 21 (100.0%) | 0 (0.0%) |
| Material Moving | 0 (0.0%) | 19 (100.0%) |
| Total (Category) | 21 (52.5%) | 19 (47.5%) |
| Total (Overall) | 586 (67.7%) | 279 (32.3%) |
Employment Industries by Sex in Bunker Hill
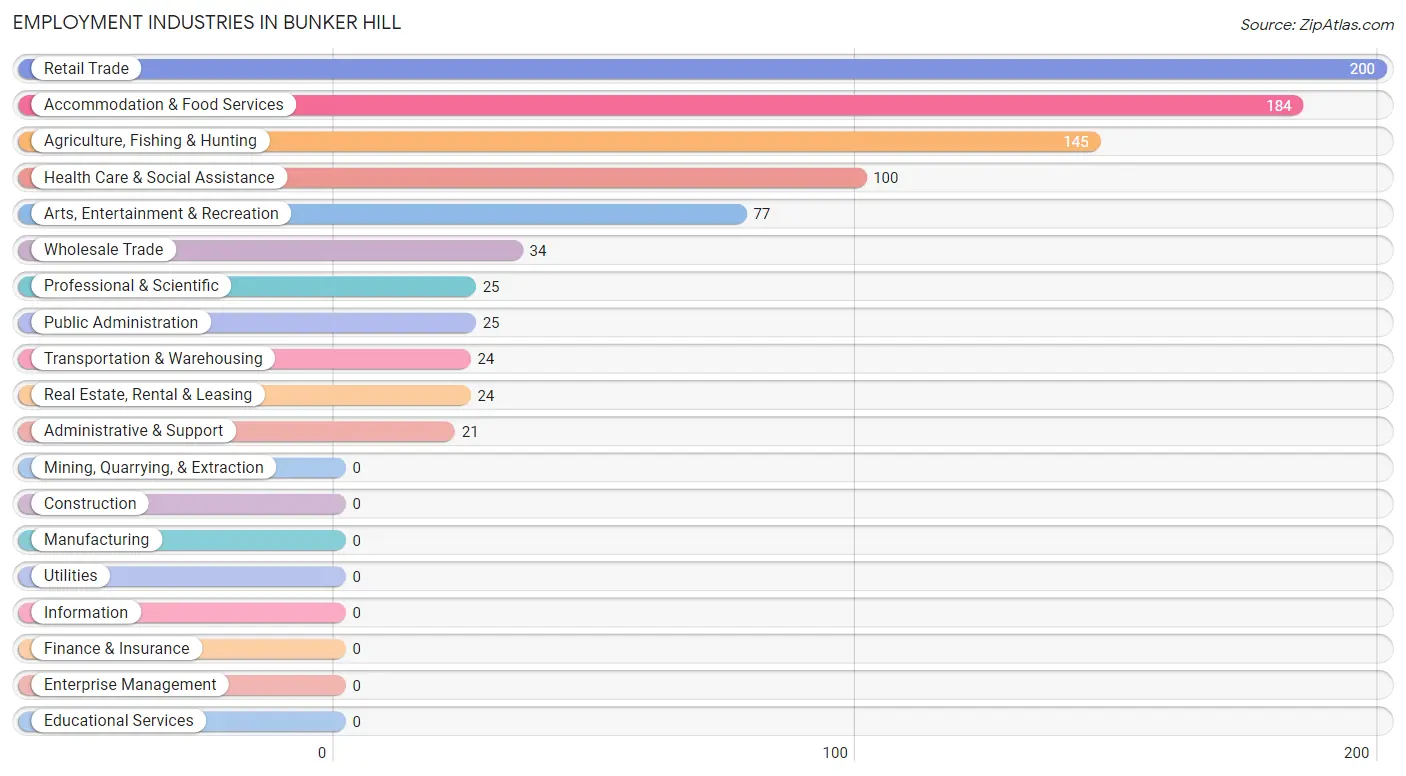
Employment Industries in Bunker Hill
The major employment industries in Bunker Hill include Retail Trade (200 | 23.1%), Accommodation & Food Services (184 | 21.3%), Agriculture, Fishing & Hunting (145 | 16.8%), Health Care & Social Assistance (100 | 11.6%), and Arts, Entertainment & Recreation (77 | 8.9%).
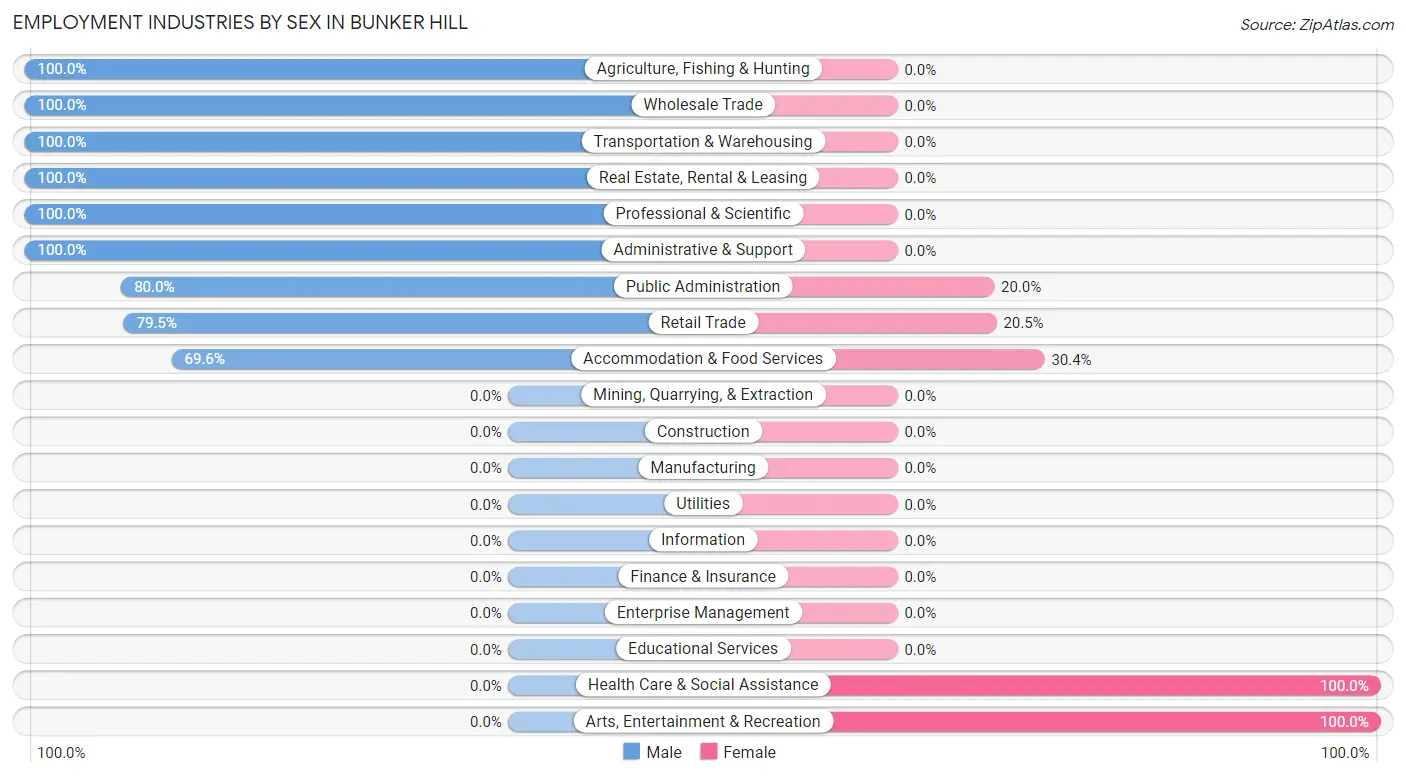
Employment Industries by Sex in Bunker Hill
The Bunker Hill industries that see more men than women are Agriculture, Fishing & Hunting (100.0%), Wholesale Trade (100.0%), and Transportation & Warehousing (100.0%), whereas the industries that tend to have a higher number of women are Health Care & Social Assistance (100.0%), Arts, Entertainment & Recreation (100.0%), and Accommodation & Food Services (30.4%).
| Industry | Male | Female |
| Agriculture, Fishing & Hunting | 145 (100.0%) | 0 (0.0%) |
| Mining, Quarrying, & Extraction | 0 (0.0%) | 0 (0.0%) |
| Construction | 0 (0.0%) | 0 (0.0%) |
| Manufacturing | 0 (0.0%) | 0 (0.0%) |
| Wholesale Trade | 34 (100.0%) | 0 (0.0%) |
| Retail Trade | 159 (79.5%) | 41 (20.5%) |
| Transportation & Warehousing | 24 (100.0%) | 0 (0.0%) |
| Utilities | 0 (0.0%) | 0 (0.0%) |
| Information | 0 (0.0%) | 0 (0.0%) |
| Finance & Insurance | 0 (0.0%) | 0 (0.0%) |
| Real Estate, Rental & Leasing | 24 (100.0%) | 0 (0.0%) |
| Professional & Scientific | 25 (100.0%) | 0 (0.0%) |
| Enterprise Management | 0 (0.0%) | 0 (0.0%) |
| Administrative & Support | 21 (100.0%) | 0 (0.0%) |
| Educational Services | 0 (0.0%) | 0 (0.0%) |
| Health Care & Social Assistance | 0 (0.0%) | 100 (100.0%) |
| Arts, Entertainment & Recreation | 0 (0.0%) | 77 (100.0%) |
| Accommodation & Food Services | 128 (69.6%) | 56 (30.4%) |
| Public Administration | 20 (80.0%) | 5 (20.0%) |
| Total | 586 (67.7%) | 279 (32.3%) |
Education in Bunker Hill
School Enrollment in Bunker Hill
The most common levels of schooling among the 551 students in Bunker Hill are elementary school (223 | 40.5%), middle school (196 | 35.6%), and high school (132 | 24.0%).
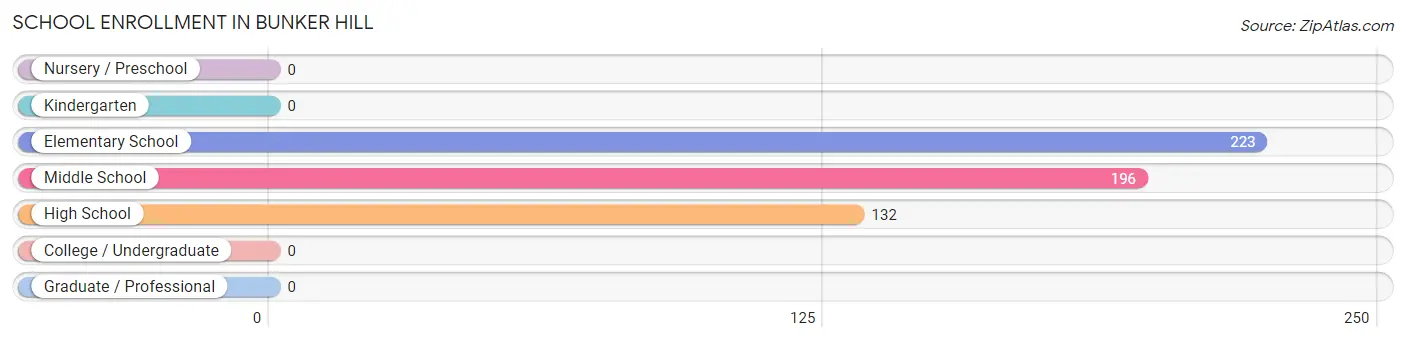
| School Level | # Students | % Students |
| Nursery / Preschool | 0 | 0.0% |
| Kindergarten | 0 | 0.0% |
| Elementary School | 223 | 40.5% |
| Middle School | 196 | 35.6% |
| High School | 132 | 24.0% |
| College / Undergraduate | 0 | 0.0% |
| Graduate / Professional | 0 | 0.0% |
| Total | 551 | 100.0% |
School Enrollment by Age by Funding Source in Bunker Hill
Out of a total of 551 students who are enrolled in schools in Bunker Hill, 57 (10.3%) attend a private institution, while the remaining 494 (89.7%) are enrolled in public schools. The age group of 15 to 17 year olds has the highest likelihood of being enrolled in private schools, with 39 (57.4% in the age bracket) enrolled. Conversely, the age group of 5 to 9 year old has the lowest likelihood of being enrolled in a private school, with 157 (100.0% in the age bracket) attending a public institution.
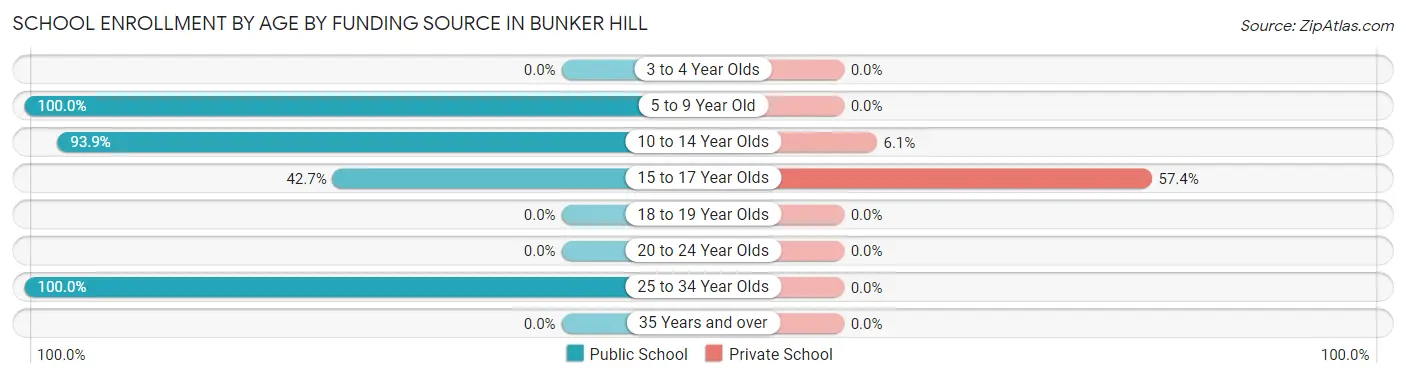
| Age Bracket | Public School | Private School |
| 3 to 4 Year Olds | 0 (0.0%) | 0 (0.0%) |
| 5 to 9 Year Old | 157 (100.0%) | 0 (0.0%) |
| 10 to 14 Year Olds | 276 (93.9%) | 18 (6.1%) |
| 15 to 17 Year Olds | 29 (42.6%) | 39 (57.4%) |
| 18 to 19 Year Olds | 0 (0.0%) | 0 (0.0%) |
| 20 to 24 Year Olds | 0 (0.0%) | 0 (0.0%) |
| 25 to 34 Year Olds | 32 (100.0%) | 0 (0.0%) |
| 35 Years and over | 0 (0.0%) | 0 (0.0%) |
| Total | 494 (89.7%) | 57 (10.3%) |
Educational Attainment by Field of Study in Bunker Hill
Physical & health sciences (25 | 35.2%), liberal arts & history (21 | 29.6%), education (14 | 19.7%), and bio, nature & agricultural (11 | 15.5%) are the most common fields of study among 71 individuals in Bunker Hill who have obtained a bachelor's degree or higher.
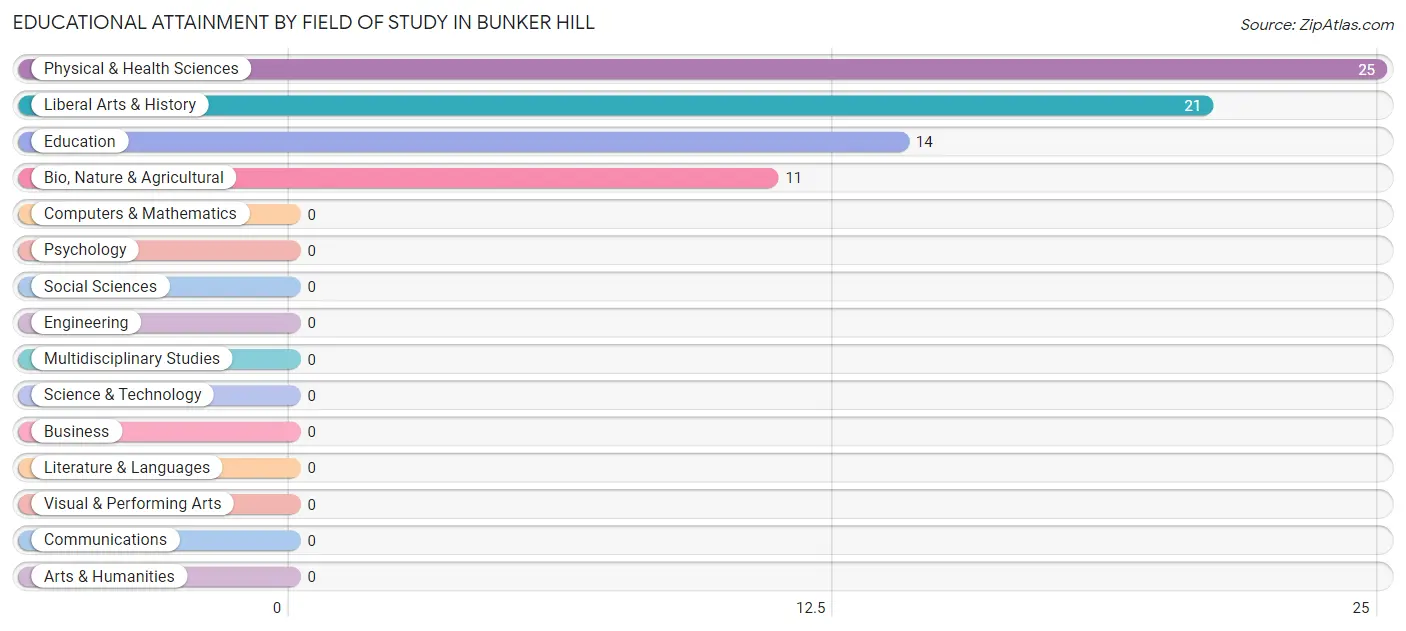
| Field of Study | # Graduates | % Graduates |
| Computers & Mathematics | 0 | 0.0% |
| Bio, Nature & Agricultural | 11 | 15.5% |
| Physical & Health Sciences | 25 | 35.2% |
| Psychology | 0 | 0.0% |
| Social Sciences | 0 | 0.0% |
| Engineering | 0 | 0.0% |
| Multidisciplinary Studies | 0 | 0.0% |
| Science & Technology | 0 | 0.0% |
| Business | 0 | 0.0% |
| Education | 14 | 19.7% |
| Literature & Languages | 0 | 0.0% |
| Liberal Arts & History | 21 | 29.6% |
| Visual & Performing Arts | 0 | 0.0% |
| Communications | 0 | 0.0% |
| Arts & Humanities | 0 | 0.0% |
| Total | 71 | 100.0% |
Transportation & Commute in Bunker Hill
Vehicle Availability by Sex in Bunker Hill
The most prevalent vehicle ownership categories in Bunker Hill are males with 3 vehicles (204, accounting for 40.8%) and females with 3 vehicles (87, making up 73.1%).
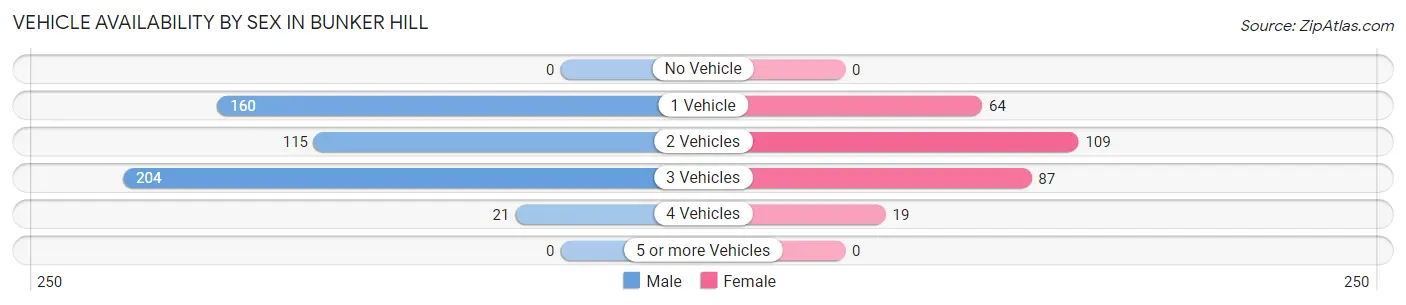
| Vehicles Available | Male | Female |
| No Vehicle | 0 (0.0%) | 0 (0.0%) |
| 1 Vehicle | 160 (32.0%) | 64 (22.9%) |
| 2 Vehicles | 115 (23.0%) | 109 (39.1%) |
| 3 Vehicles | 204 (40.8%) | 87 (31.2%) |
| 4 Vehicles | 21 (4.2%) | 19 (6.8%) |
| 5 or more Vehicles | 0 (0.0%) | 0 (0.0%) |
| Total | 500 (100.0%) | 279 (100.0%) |
Commute Time in Bunker Hill
The most frequently occuring commute durations in Bunker Hill are less than 5 minutes (210 commuters, 29.3%), 10 to 14 minutes (160 commuters, 22.4%), and 5 to 9 minutes (135 commuters, 18.9%).
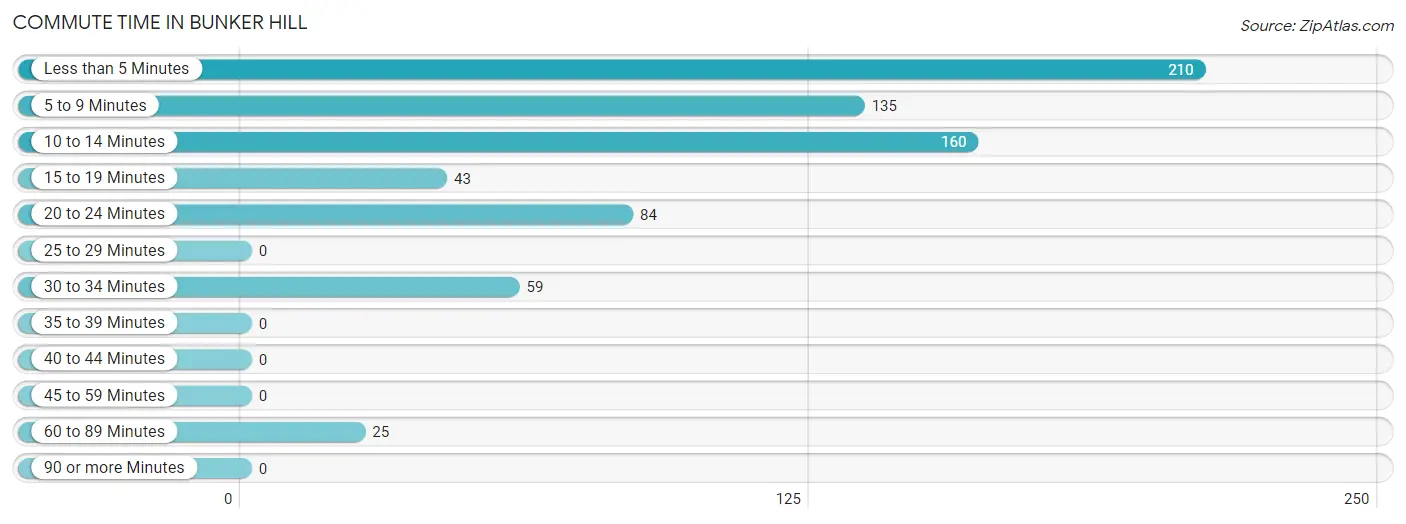
| Commute Time | # Commuters | % Commuters |
| Less than 5 Minutes | 210 | 29.3% |
| 5 to 9 Minutes | 135 | 18.9% |
| 10 to 14 Minutes | 160 | 22.4% |
| 15 to 19 Minutes | 43 | 6.0% |
| 20 to 24 Minutes | 84 | 11.7% |
| 25 to 29 Minutes | 0 | 0.0% |
| 30 to 34 Minutes | 59 | 8.2% |
| 35 to 39 Minutes | 0 | 0.0% |
| 40 to 44 Minutes | 0 | 0.0% |
| 45 to 59 Minutes | 0 | 0.0% |
| 60 to 89 Minutes | 25 | 3.5% |
| 90 or more Minutes | 0 | 0.0% |
Commute Time by Sex in Bunker Hill
The most common commute times in Bunker Hill are less than 5 minutes (160 commuters, 34.1%) for males and 5 to 9 minutes (97 commuters, 39.3%) for females.
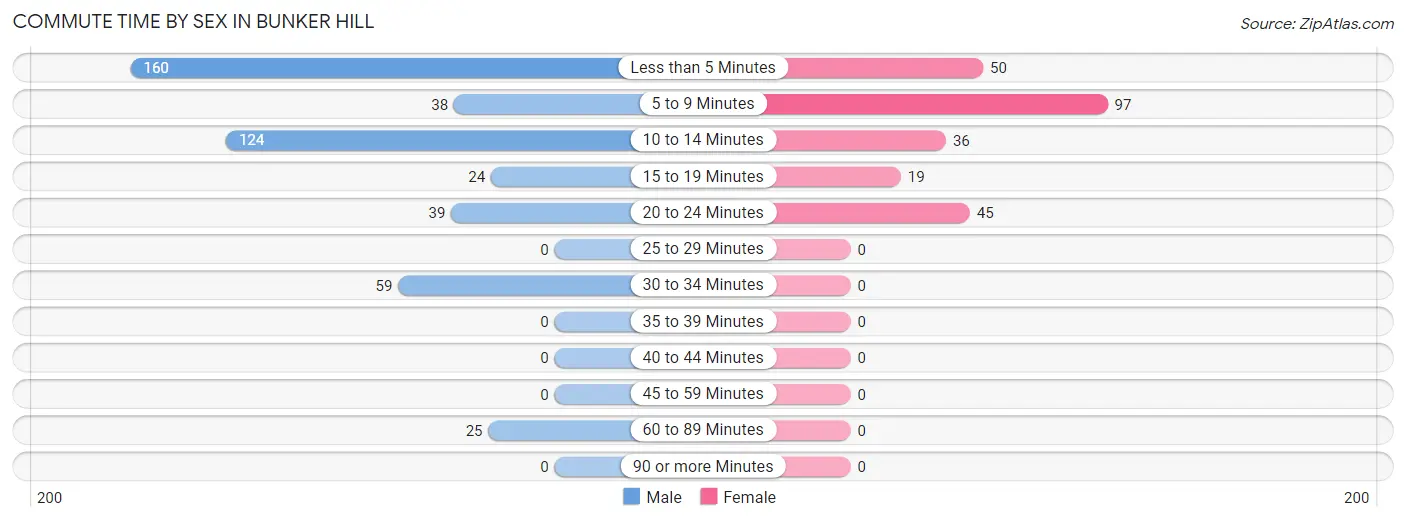
| Commute Time | Male | Female |
| Less than 5 Minutes | 160 (34.1%) | 50 (20.2%) |
| 5 to 9 Minutes | 38 (8.1%) | 97 (39.3%) |
| 10 to 14 Minutes | 124 (26.4%) | 36 (14.6%) |
| 15 to 19 Minutes | 24 (5.1%) | 19 (7.7%) |
| 20 to 24 Minutes | 39 (8.3%) | 45 (18.2%) |
| 25 to 29 Minutes | 0 (0.0%) | 0 (0.0%) |
| 30 to 34 Minutes | 59 (12.6%) | 0 (0.0%) |
| 35 to 39 Minutes | 0 (0.0%) | 0 (0.0%) |
| 40 to 44 Minutes | 0 (0.0%) | 0 (0.0%) |
| 45 to 59 Minutes | 0 (0.0%) | 0 (0.0%) |
| 60 to 89 Minutes | 25 (5.3%) | 0 (0.0%) |
| 90 or more Minutes | 0 (0.0%) | 0 (0.0%) |
Time of Departure to Work by Sex in Bunker Hill
The most frequent times of departure to work in Bunker Hill are 8:00 AM to 8:29 AM (152, 32.4%) for males and 11:00 AM to 11:59 AM (50, 20.2%) for females.
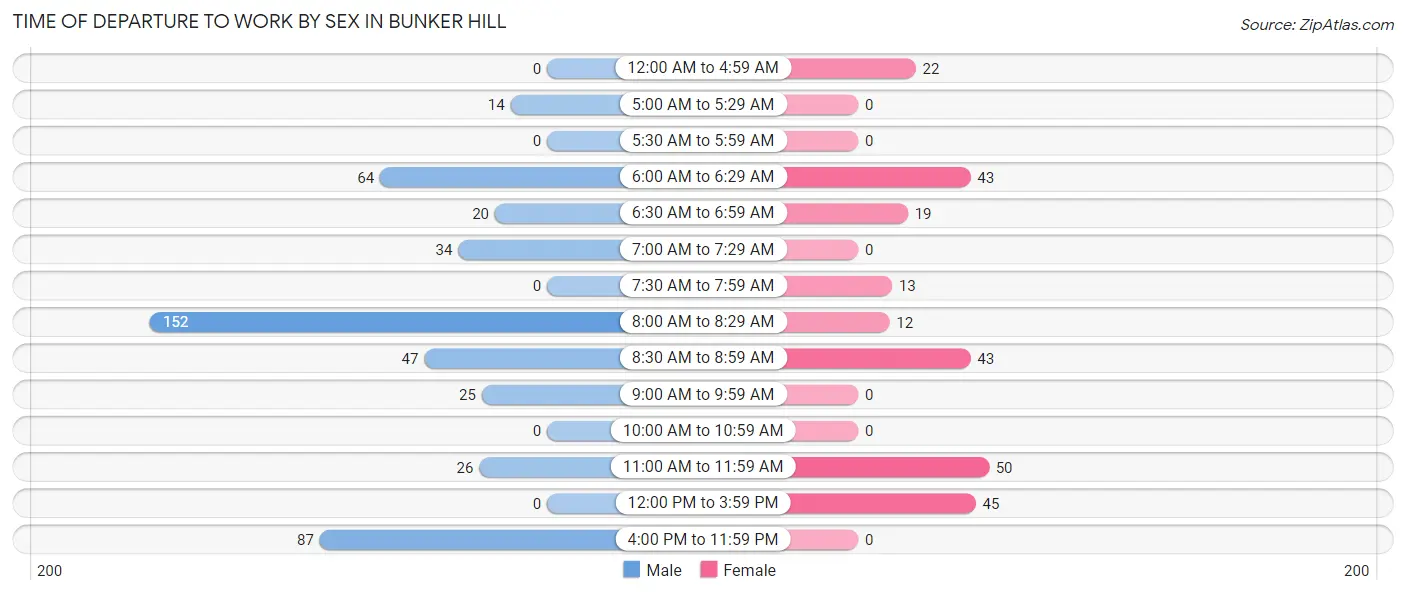
| Time of Departure | Male | Female |
| 12:00 AM to 4:59 AM | 0 (0.0%) | 22 (8.9%) |
| 5:00 AM to 5:29 AM | 14 (3.0%) | 0 (0.0%) |
| 5:30 AM to 5:59 AM | 0 (0.0%) | 0 (0.0%) |
| 6:00 AM to 6:29 AM | 64 (13.7%) | 43 (17.4%) |
| 6:30 AM to 6:59 AM | 20 (4.3%) | 19 (7.7%) |
| 7:00 AM to 7:29 AM | 34 (7.2%) | 0 (0.0%) |
| 7:30 AM to 7:59 AM | 0 (0.0%) | 13 (5.3%) |
| 8:00 AM to 8:29 AM | 152 (32.4%) | 12 (4.9%) |
| 8:30 AM to 8:59 AM | 47 (10.0%) | 43 (17.4%) |
| 9:00 AM to 9:59 AM | 25 (5.3%) | 0 (0.0%) |
| 10:00 AM to 10:59 AM | 0 (0.0%) | 0 (0.0%) |
| 11:00 AM to 11:59 AM | 26 (5.5%) | 50 (20.2%) |
| 12:00 PM to 3:59 PM | 0 (0.0%) | 45 (18.2%) |
| 4:00 PM to 11:59 PM | 87 (18.5%) | 0 (0.0%) |
| Total | 469 (100.0%) | 247 (100.0%) |
Housing Occupancy in Bunker Hill
Occupancy by Ownership in Bunker Hill
Of the total 610 dwellings in Bunker Hill, owner-occupied units account for 334 (54.7%), while renter-occupied units make up 276 (45.3%).
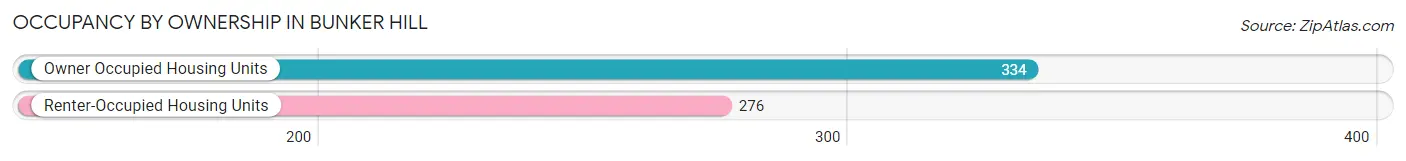
| Occupancy | # Housing Units | % Housing Units |
| Owner Occupied Housing Units | 334 | 54.7% |
| Renter-Occupied Housing Units | 276 | 45.3% |
| Total Occupied Housing Units | 610 | 100.0% |
Occupancy by Household Size in Bunker Hill
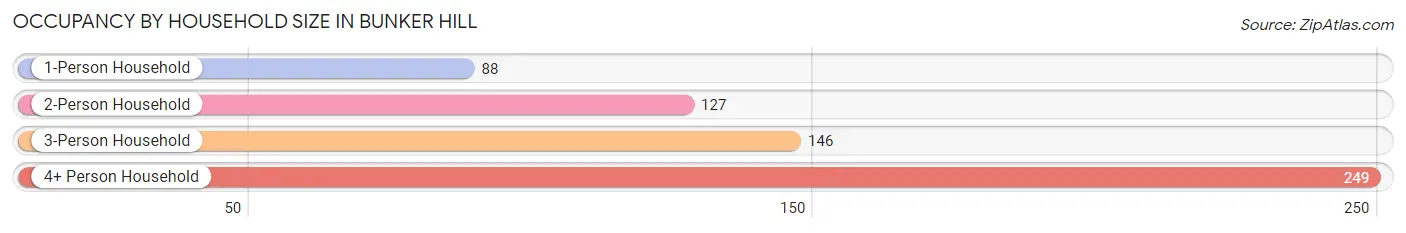
| Household Size | # Housing Units | % Housing Units |
| 1-Person Household | 88 | 14.4% |
| 2-Person Household | 127 | 20.8% |
| 3-Person Household | 146 | 23.9% |
| 4+ Person Household | 249 | 40.8% |
| Total Housing Units | 610 | 100.0% |
Occupancy by Ownership by Household Size in Bunker Hill
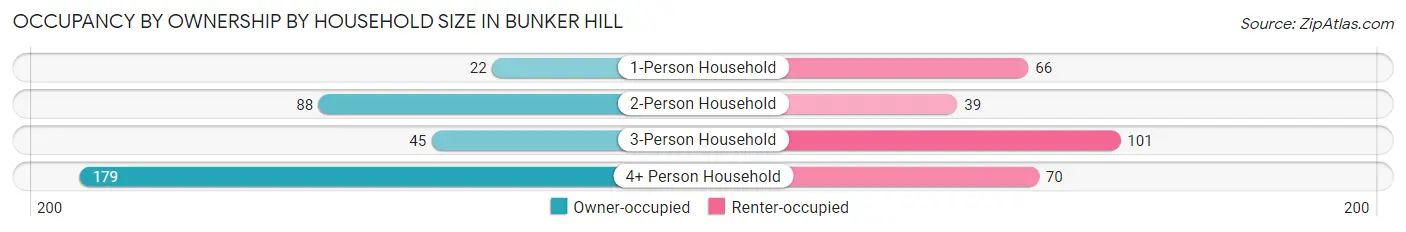
| Household Size | Owner-occupied | Renter-occupied |
| 1-Person Household | 22 (25.0%) | 66 (75.0%) |
| 2-Person Household | 88 (69.3%) | 39 (30.7%) |
| 3-Person Household | 45 (30.8%) | 101 (69.2%) |
| 4+ Person Household | 179 (71.9%) | 70 (28.1%) |
| Total Housing Units | 334 (54.7%) | 276 (45.3%) |
Occupancy by Educational Attainment in Bunker Hill
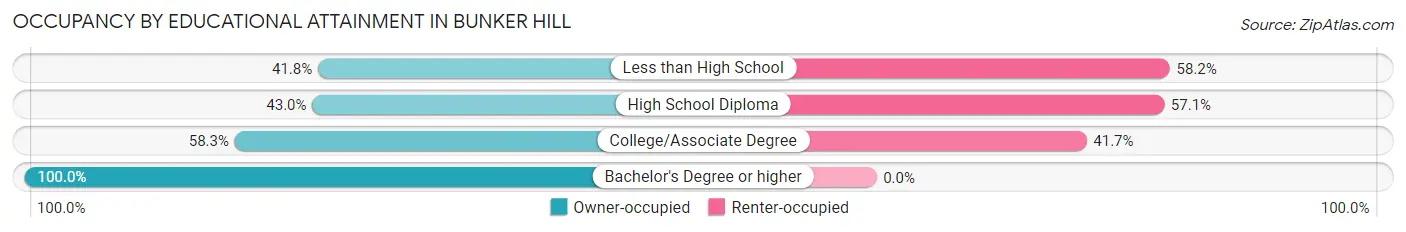
| Household Size | Owner-occupied | Renter-occupied |
| Less than High School | 23 (41.8%) | 32 (58.2%) |
| High School Diploma | 67 (42.9%) | 89 (57.1%) |
| College/Associate Degree | 217 (58.3%) | 155 (41.7%) |
| Bachelor's Degree or higher | 27 (100.0%) | 0 (0.0%) |
Occupancy by Age of Householder in Bunker Hill
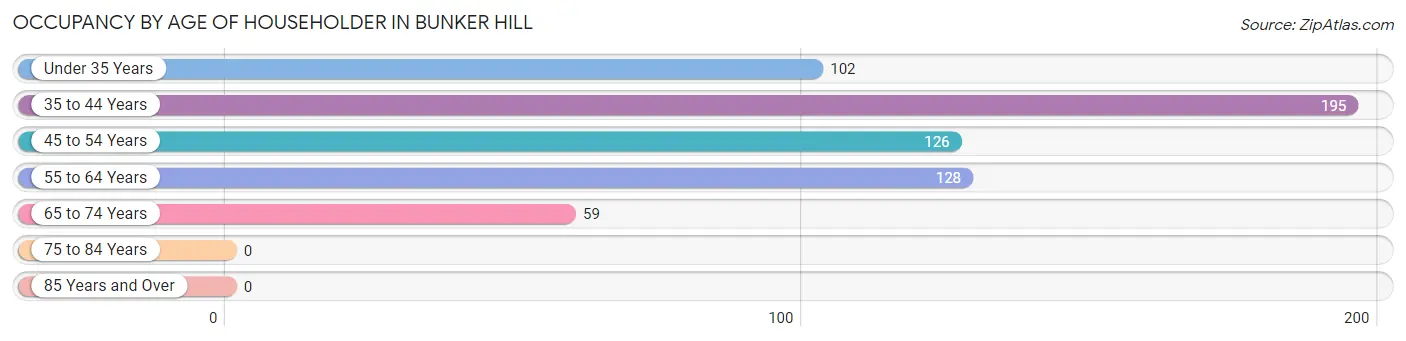
| Age Bracket | # Households | % Households |
| Under 35 Years | 102 | 16.7% |
| 35 to 44 Years | 195 | 32.0% |
| 45 to 54 Years | 126 | 20.7% |
| 55 to 64 Years | 128 | 21.0% |
| 65 to 74 Years | 59 | 9.7% |
| 75 to 84 Years | 0 | 0.0% |
| 85 Years and Over | 0 | 0.0% |
| Total | 610 | 100.0% |
Housing Finances in Bunker Hill
Median Income by Occupancy in Bunker Hill
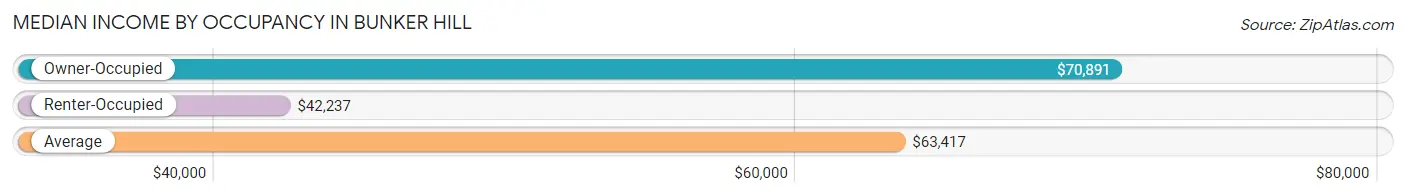
| Occupancy Type | # Households | Median Income |
| Owner-Occupied | 334 (54.7%) | $70,891 |
| Renter-Occupied | 276 (45.3%) | $42,237 |
| Average | 610 (100.0%) | $63,417 |
Occupancy by Householder Income Bracket in Bunker Hill
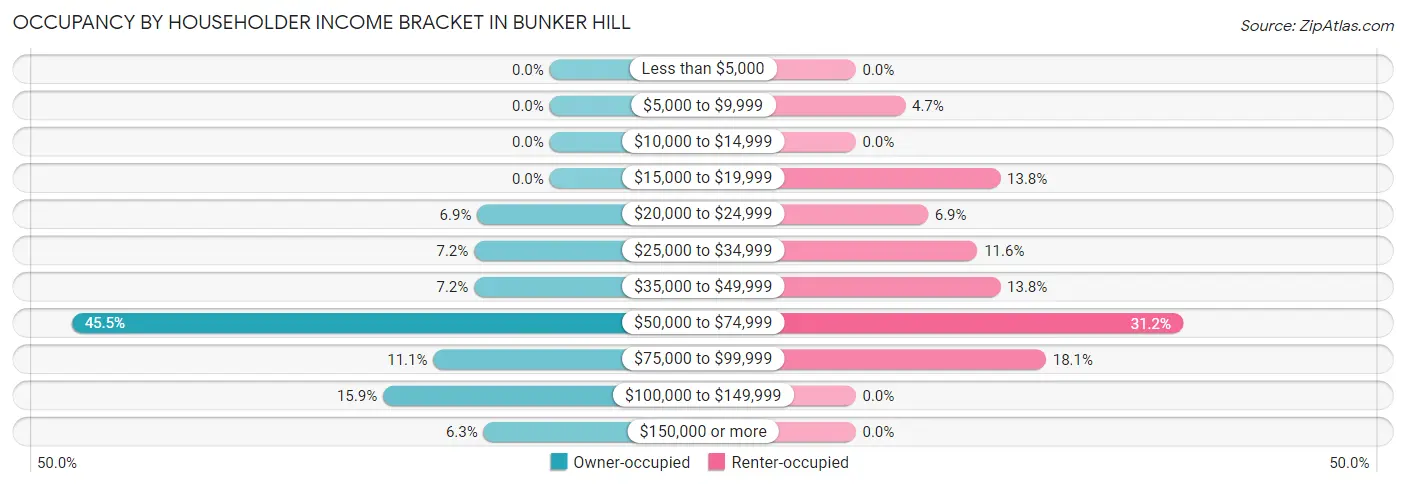
| Income Bracket | Owner-occupied | Renter-occupied |
| Less than $5,000 | 0 (0.0%) | 0 (0.0%) |
| $5,000 to $9,999 | 0 (0.0%) | 13 (4.7%) |
| $10,000 to $14,999 | 0 (0.0%) | 0 (0.0%) |
| $15,000 to $19,999 | 0 (0.0%) | 38 (13.8%) |
| $20,000 to $24,999 | 23 (6.9%) | 19 (6.9%) |
| $25,000 to $34,999 | 24 (7.2%) | 32 (11.6%) |
| $35,000 to $49,999 | 24 (7.2%) | 38 (13.8%) |
| $50,000 to $74,999 | 152 (45.5%) | 86 (31.2%) |
| $75,000 to $99,999 | 37 (11.1%) | 50 (18.1%) |
| $100,000 to $149,999 | 53 (15.9%) | 0 (0.0%) |
| $150,000 or more | 21 (6.3%) | 0 (0.0%) |
| Total | 334 (100.0%) | 276 (100.0%) |
Monthly Housing Cost Tiers in Bunker Hill
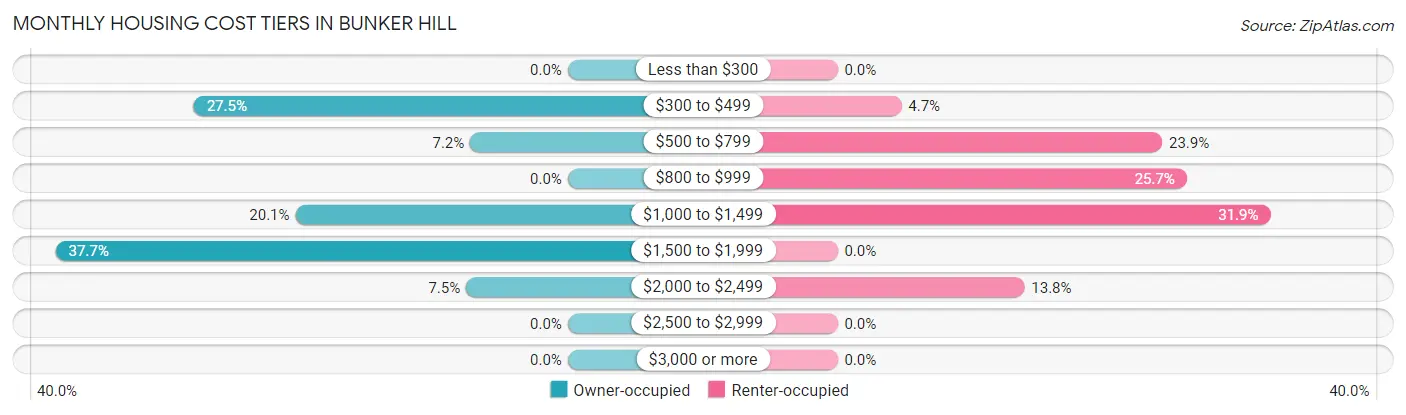
| Monthly Cost | Owner-occupied | Renter-occupied |
| Less than $300 | 0 (0.0%) | 0 (0.0%) |
| $300 to $499 | 92 (27.5%) | 13 (4.7%) |
| $500 to $799 | 24 (7.2%) | 66 (23.9%) |
| $800 to $999 | 0 (0.0%) | 71 (25.7%) |
| $1,000 to $1,499 | 67 (20.1%) | 88 (31.9%) |
| $1,500 to $1,999 | 126 (37.7%) | 0 (0.0%) |
| $2,000 to $2,499 | 25 (7.5%) | 38 (13.8%) |
| $2,500 to $2,999 | 0 (0.0%) | 0 (0.0%) |
| $3,000 or more | 0 (0.0%) | 0 (0.0%) |
| Total | 334 (100.0%) | 276 (100.0%) |
Physical Housing Characteristics in Bunker Hill
Housing Structures in Bunker Hill
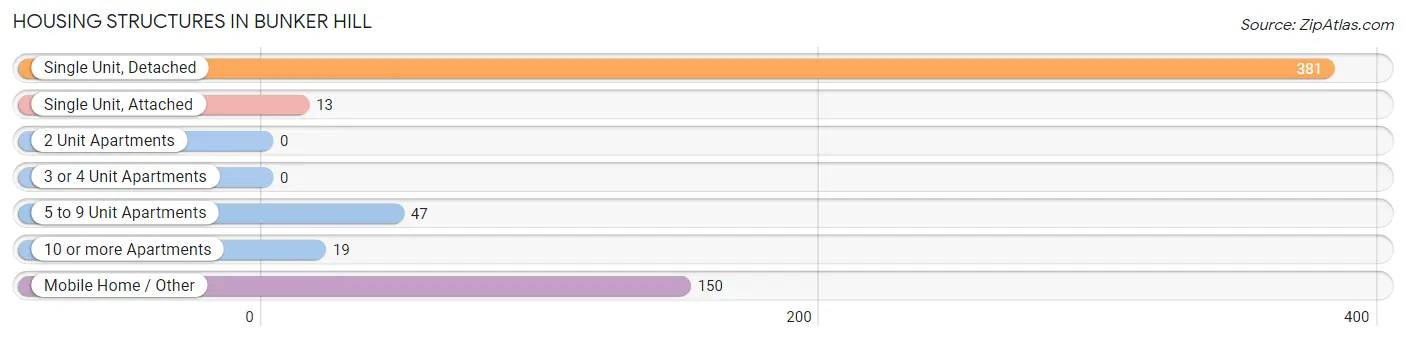
| Structure Type | # Housing Units | % Housing Units |
| Single Unit, Detached | 381 | 62.5% |
| Single Unit, Attached | 13 | 2.1% |
| 2 Unit Apartments | 0 | 0.0% |
| 3 or 4 Unit Apartments | 0 | 0.0% |
| 5 to 9 Unit Apartments | 47 | 7.7% |
| 10 or more Apartments | 19 | 3.1% |
| Mobile Home / Other | 150 | 24.6% |
| Total | 610 | 100.0% |
Housing Structures by Occupancy in Bunker Hill
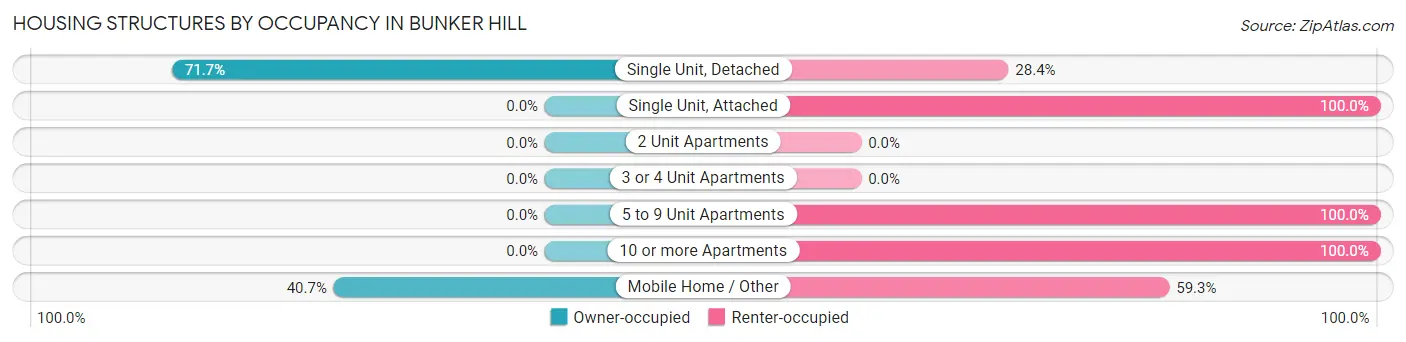
| Structure Type | Owner-occupied | Renter-occupied |
| Single Unit, Detached | 273 (71.7%) | 108 (28.3%) |
| Single Unit, Attached | 0 (0.0%) | 13 (100.0%) |
| 2 Unit Apartments | 0 (0.0%) | 0 (0.0%) |
| 3 or 4 Unit Apartments | 0 (0.0%) | 0 (0.0%) |
| 5 to 9 Unit Apartments | 0 (0.0%) | 47 (100.0%) |
| 10 or more Apartments | 0 (0.0%) | 19 (100.0%) |
| Mobile Home / Other | 61 (40.7%) | 89 (59.3%) |
| Total | 334 (54.7%) | 276 (45.3%) |
Housing Structures by Number of Rooms in Bunker Hill
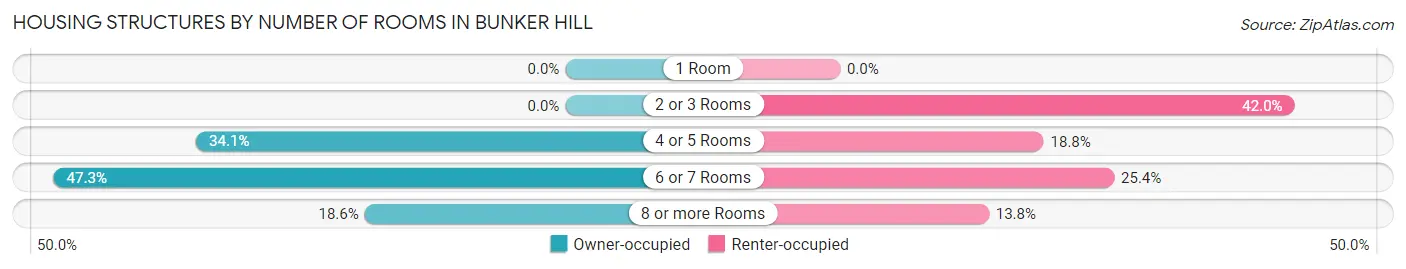
| Number of Rooms | Owner-occupied | Renter-occupied |
| 1 Room | 0 (0.0%) | 0 (0.0%) |
| 2 or 3 Rooms | 0 (0.0%) | 116 (42.0%) |
| 4 or 5 Rooms | 114 (34.1%) | 52 (18.8%) |
| 6 or 7 Rooms | 158 (47.3%) | 70 (25.4%) |
| 8 or more Rooms | 62 (18.6%) | 38 (13.8%) |
| Total | 334 (100.0%) | 276 (100.0%) |
Housing Structure by Heating Type in Bunker Hill
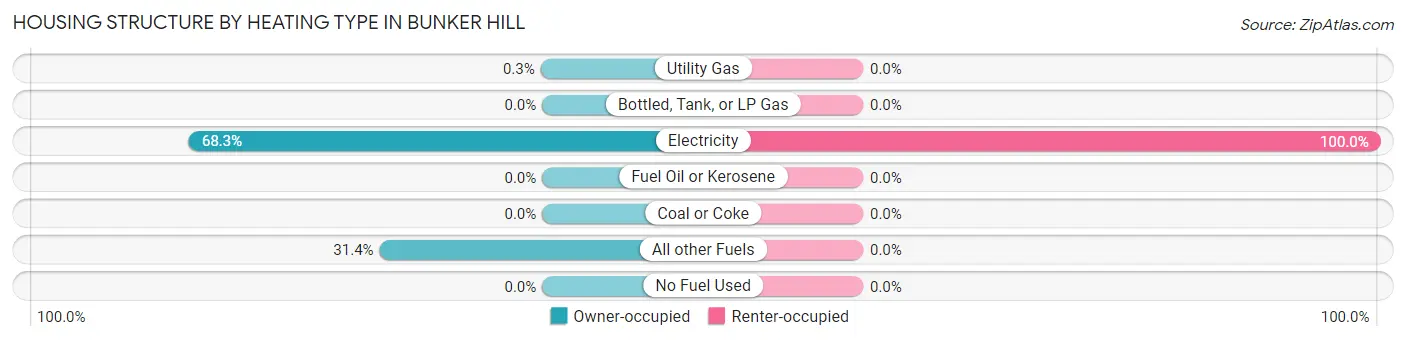
| Heating Type | Owner-occupied | Renter-occupied |
| Utility Gas | 1 (0.3%) | 0 (0.0%) |
| Bottled, Tank, or LP Gas | 0 (0.0%) | 0 (0.0%) |
| Electricity | 228 (68.3%) | 276 (100.0%) |
| Fuel Oil or Kerosene | 0 (0.0%) | 0 (0.0%) |
| Coal or Coke | 0 (0.0%) | 0 (0.0%) |
| All other Fuels | 105 (31.4%) | 0 (0.0%) |
| No Fuel Used | 0 (0.0%) | 0 (0.0%) |
| Total | 334 (100.0%) | 276 (100.0%) |
Household Vehicle Usage in Bunker Hill
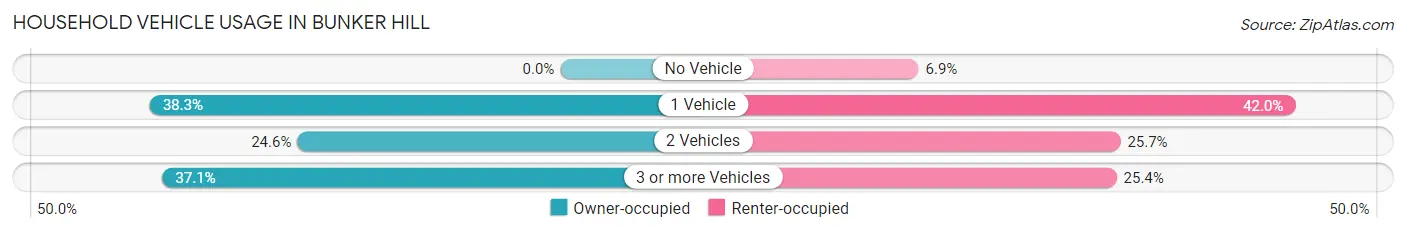
| Vehicles per Household | Owner-occupied | Renter-occupied |
| No Vehicle | 0 (0.0%) | 19 (6.9%) |
| 1 Vehicle | 128 (38.3%) | 116 (42.0%) |
| 2 Vehicles | 82 (24.5%) | 71 (25.7%) |
| 3 or more Vehicles | 124 (37.1%) | 70 (25.4%) |
| Total | 334 (100.0%) | 276 (100.0%) |
Real Estate & Mortgages in Bunker Hill
Real Estate and Mortgage Overview in Bunker Hill
| Characteristic | Without Mortgage | With Mortgage |
| Housing Units | 116 | 218 |
| Median Property Value | $260,600 | $138,800 |
| Median Household Income | - | - |
| Monthly Housing Costs | $450 | $0 |
| Real Estate Taxes | $1,886 | $0 |
Property Value by Mortgage Status in Bunker Hill
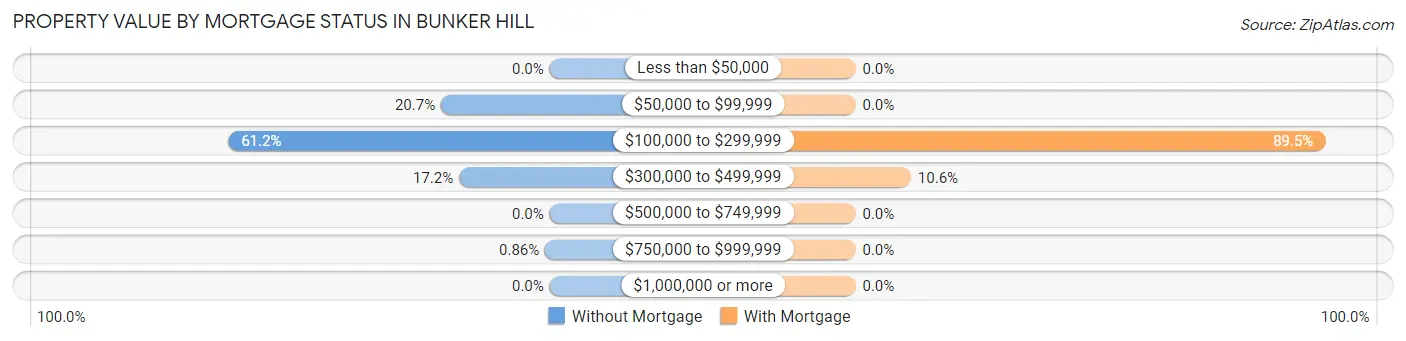
| Property Value | Without Mortgage | With Mortgage |
| Less than $50,000 | 0 (0.0%) | 0 (0.0%) |
| $50,000 to $99,999 | 24 (20.7%) | 0 (0.0%) |
| $100,000 to $299,999 | 71 (61.2%) | 195 (89.4%) |
| $300,000 to $499,999 | 20 (17.2%) | 23 (10.5%) |
| $500,000 to $749,999 | 0 (0.0%) | 0 (0.0%) |
| $750,000 to $999,999 | 1 (0.9%) | 0 (0.0%) |
| $1,000,000 or more | 0 (0.0%) | 0 (0.0%) |
| Total | 116 (100.0%) | 218 (100.0%) |
Household Income by Mortgage Status in Bunker Hill
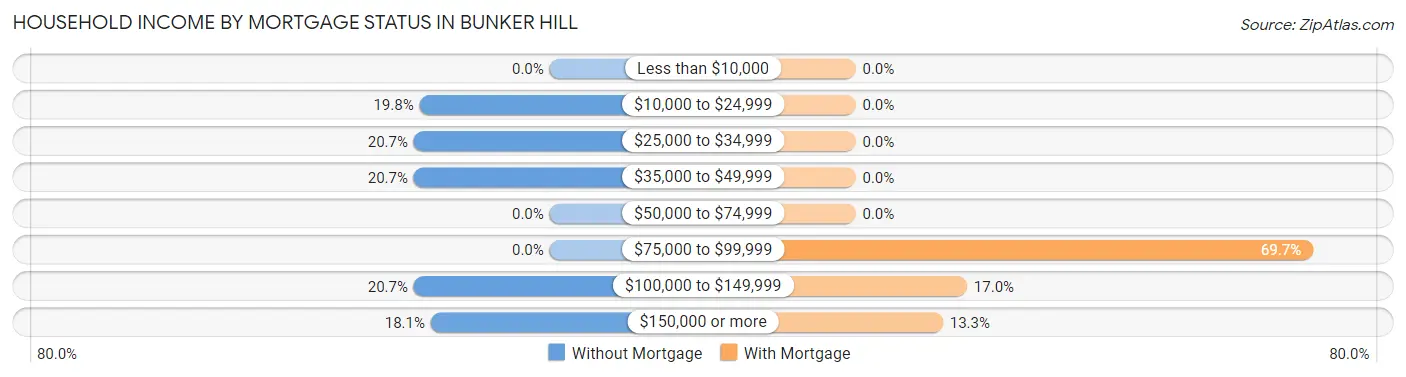
| Household Income | Without Mortgage | With Mortgage |
| Less than $10,000 | 0 (0.0%) | 0 (0.0%) |
| $10,000 to $24,999 | 23 (19.8%) | 0 (0.0%) |
| $25,000 to $34,999 | 24 (20.7%) | 0 (0.0%) |
| $35,000 to $49,999 | 24 (20.7%) | 0 (0.0%) |
| $50,000 to $74,999 | 0 (0.0%) | 0 (0.0%) |
| $75,000 to $99,999 | 0 (0.0%) | 152 (69.7%) |
| $100,000 to $149,999 | 24 (20.7%) | 37 (17.0%) |
| $150,000 or more | 21 (18.1%) | 29 (13.3%) |
| Total | 116 (100.0%) | 218 (100.0%) |
Property Value to Household Income Ratio in Bunker Hill
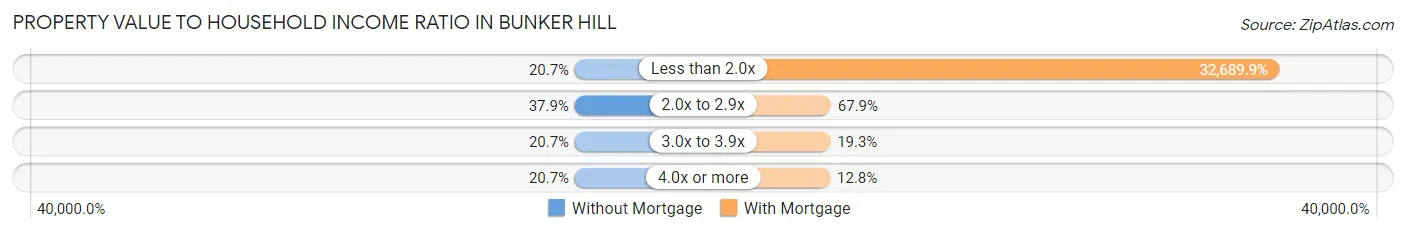
| Value-to-Income Ratio | Without Mortgage | With Mortgage |
| Less than 2.0x | 24 (20.7%) | 71,264 (32,689.9%) |
| 2.0x to 2.9x | 44 (37.9%) | 148 (67.9%) |
| 3.0x to 3.9x | 24 (20.7%) | 42 (19.3%) |
| 4.0x or more | 24 (20.7%) | 28 (12.8%) |
| Total | 116 (100.0%) | 218 (100.0%) |
Real Estate Taxes by Mortgage Status in Bunker Hill
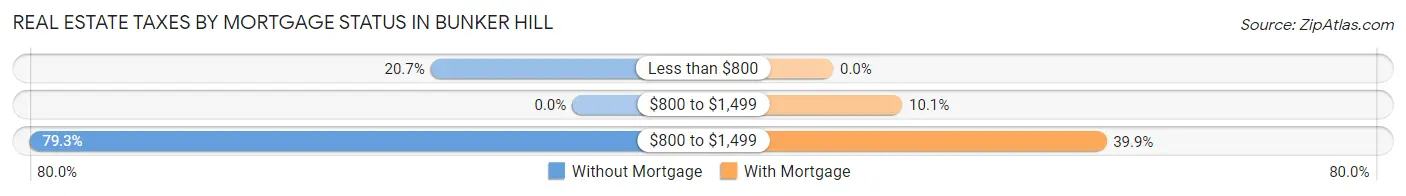
| Property Taxes | Without Mortgage | With Mortgage |
| Less than $800 | 24 (20.7%) | 0 (0.0%) |
| $800 to $1,499 | 0 (0.0%) | 22 (10.1%) |
| $800 to $1,499 | 92 (79.3%) | 87 (39.9%) |
| Total | 116 (100.0%) | 218 (100.0%) |
Health & Disability in Bunker Hill
Health Insurance Coverage by Age in Bunker Hill
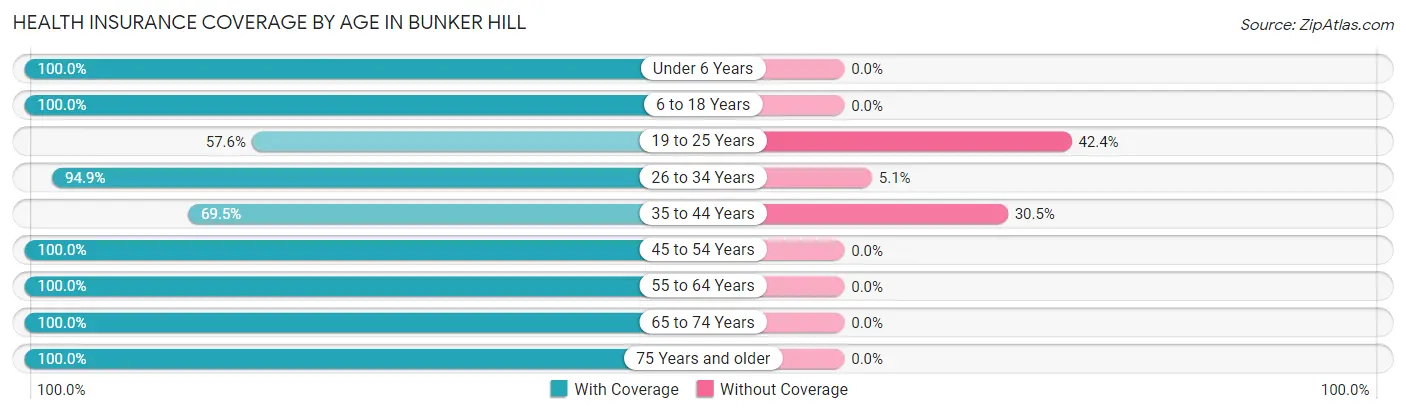
| Age Bracket | With Coverage | Without Coverage |
| Under 6 Years | 95 (100.0%) | 0 (0.0%) |
| 6 to 18 Years | 519 (100.0%) | 0 (0.0%) |
| 19 to 25 Years | 117 (57.6%) | 86 (42.4%) |
| 26 to 34 Years | 277 (94.9%) | 15 (5.1%) |
| 35 to 44 Years | 299 (69.5%) | 131 (30.5%) |
| 45 to 54 Years | 195 (100.0%) | 0 (0.0%) |
| 55 to 64 Years | 234 (100.0%) | 0 (0.0%) |
| 65 to 74 Years | 102 (100.0%) | 0 (0.0%) |
| 75 Years and older | 33 (100.0%) | 0 (0.0%) |
| Total | 1,871 (89.0%) | 232 (11.0%) |
Health Insurance Coverage by Citizenship Status in Bunker Hill
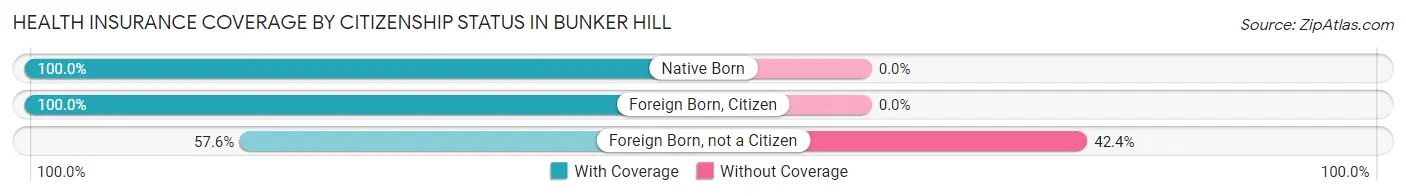
| Citizenship Status | With Coverage | Without Coverage |
| Native Born | 95 (100.0%) | 0 (0.0%) |
| Foreign Born, Citizen | 519 (100.0%) | 0 (0.0%) |
| Foreign Born, not a Citizen | 117 (57.6%) | 86 (42.4%) |
Health Insurance Coverage by Household Income in Bunker Hill
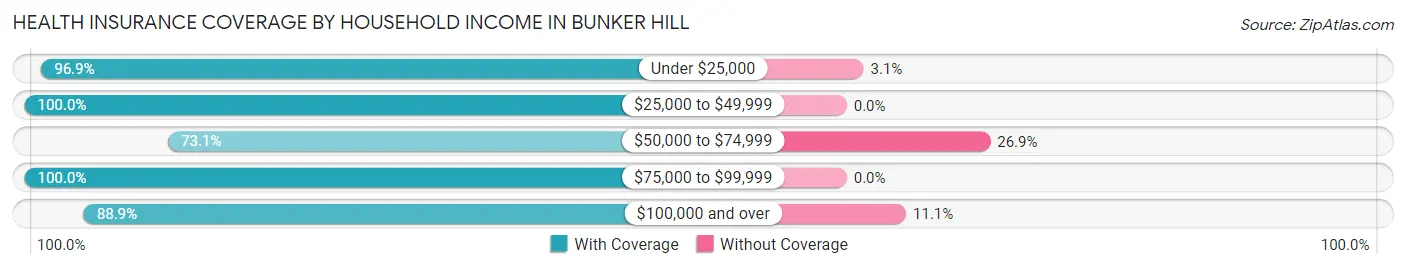
| Household Income | With Coverage | Without Coverage |
| Under $25,000 | 462 (96.9%) | 15 (3.1%) |
| $25,000 to $49,999 | 366 (100.0%) | 0 (0.0%) |
| $50,000 to $74,999 | 522 (73.1%) | 192 (26.9%) |
| $75,000 to $99,999 | 321 (100.0%) | 0 (0.0%) |
| $100,000 and over | 200 (88.9%) | 25 (11.1%) |
Public vs Private Health Insurance Coverage by Age in Bunker Hill
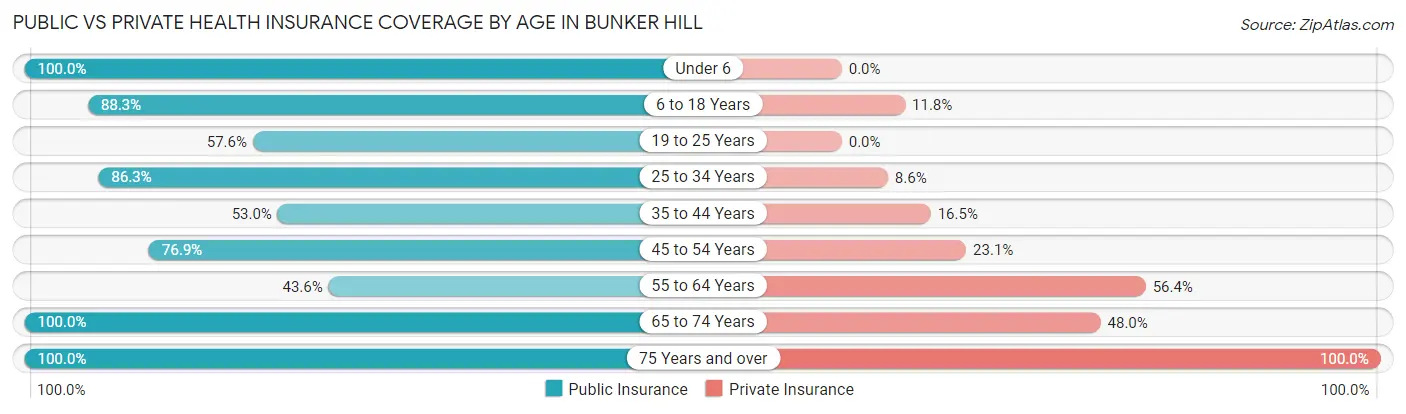
| Age Bracket | Public Insurance | Private Insurance |
| Under 6 | 95 (100.0%) | 0 (0.0%) |
| 6 to 18 Years | 458 (88.2%) | 61 (11.7%) |
| 19 to 25 Years | 117 (57.6%) | 0 (0.0%) |
| 25 to 34 Years | 252 (86.3%) | 25 (8.6%) |
| 35 to 44 Years | 228 (53.0%) | 71 (16.5%) |
| 45 to 54 Years | 150 (76.9%) | 45 (23.1%) |
| 55 to 64 Years | 102 (43.6%) | 132 (56.4%) |
| 65 to 74 Years | 102 (100.0%) | 49 (48.0%) |
| 75 Years and over | 33 (100.0%) | 33 (100.0%) |
| Total | 1,537 (73.1%) | 416 (19.8%) |
Disability Status by Sex by Age in Bunker Hill
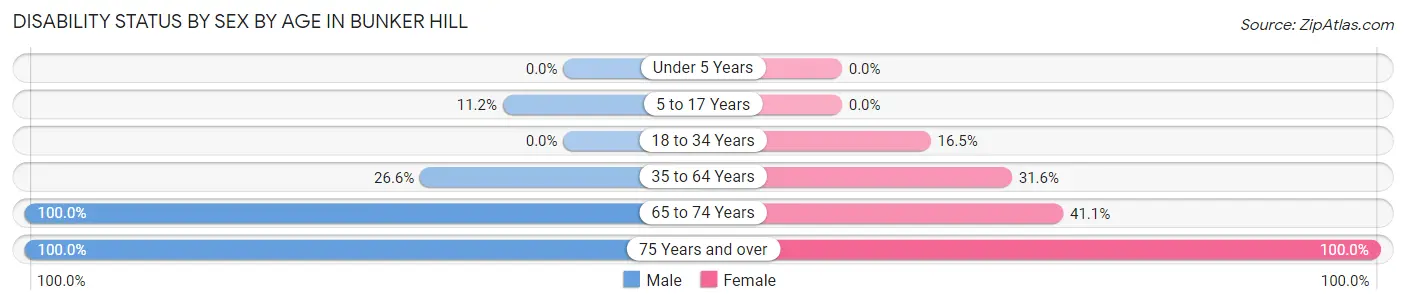
| Age Bracket | Male | Female |
| Under 5 Years | 0 (0.0%) | 0 (0.0%) |
| 5 to 17 Years | 29 (11.2%) | 0 (0.0%) |
| 18 to 34 Years | 0 (0.0%) | 31 (16.5%) |
| 35 to 64 Years | 134 (26.6%) | 112 (31.6%) |
| 65 to 74 Years | 46 (100.0%) | 23 (41.1%) |
| 75 Years and over | 19 (100.0%) | 14 (100.0%) |
Disability Class by Sex by Age in Bunker Hill
Disability Class: Hearing Difficulty
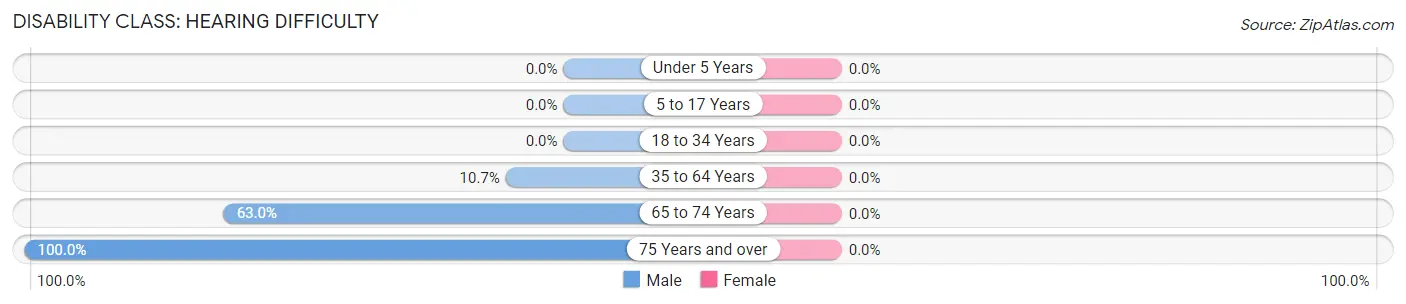
| Age Bracket | Male | Female |
| Under 5 Years | 0 (0.0%) | 0 (0.0%) |
| 5 to 17 Years | 0 (0.0%) | 0 (0.0%) |
| 18 to 34 Years | 0 (0.0%) | 0 (0.0%) |
| 35 to 64 Years | 54 (10.7%) | 0 (0.0%) |
| 65 to 74 Years | 29 (63.0%) | 0 (0.0%) |
| 75 Years and over | 19 (100.0%) | 0 (0.0%) |
Disability Class: Vision Difficulty
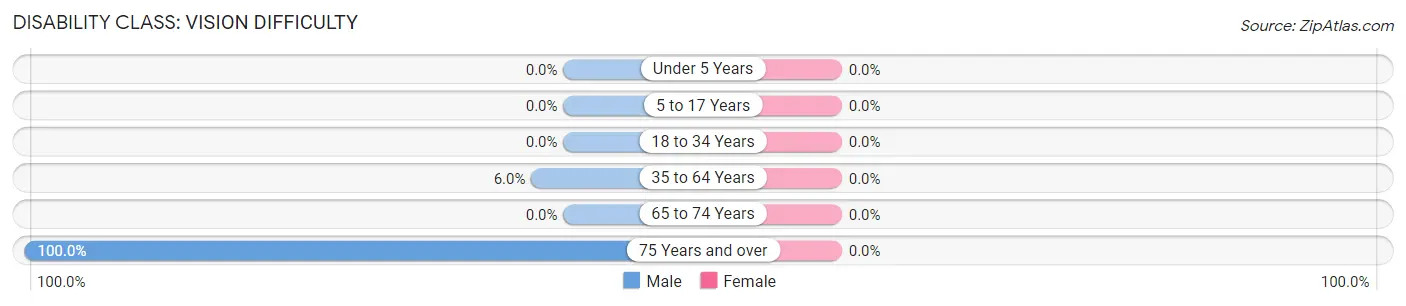
| Age Bracket | Male | Female |
| Under 5 Years | 0 (0.0%) | 0 (0.0%) |
| 5 to 17 Years | 0 (0.0%) | 0 (0.0%) |
| 18 to 34 Years | 0 (0.0%) | 0 (0.0%) |
| 35 to 64 Years | 30 (5.9%) | 0 (0.0%) |
| 65 to 74 Years | 0 (0.0%) | 0 (0.0%) |
| 75 Years and over | 19 (100.0%) | 0 (0.0%) |
Disability Class: Cognitive Difficulty
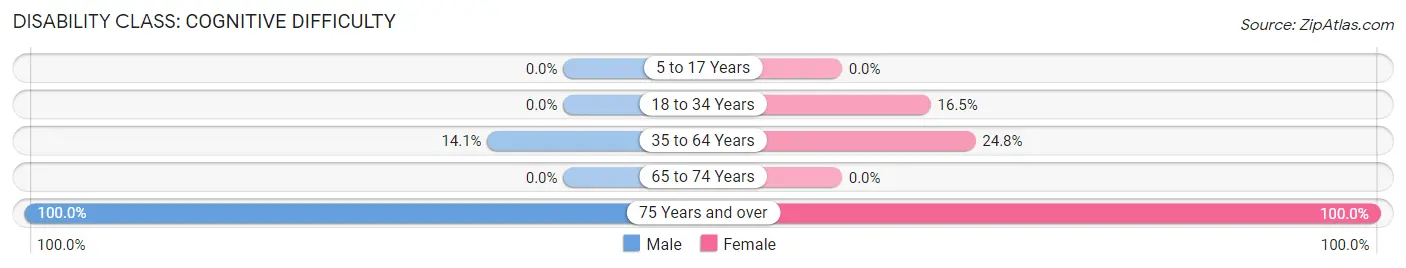
| Age Bracket | Male | Female |
| 5 to 17 Years | 0 (0.0%) | 0 (0.0%) |
| 18 to 34 Years | 0 (0.0%) | 31 (16.5%) |
| 35 to 64 Years | 71 (14.1%) | 88 (24.8%) |
| 65 to 74 Years | 0 (0.0%) | 0 (0.0%) |
| 75 Years and over | 19 (100.0%) | 14 (100.0%) |
Disability Class: Ambulatory Difficulty
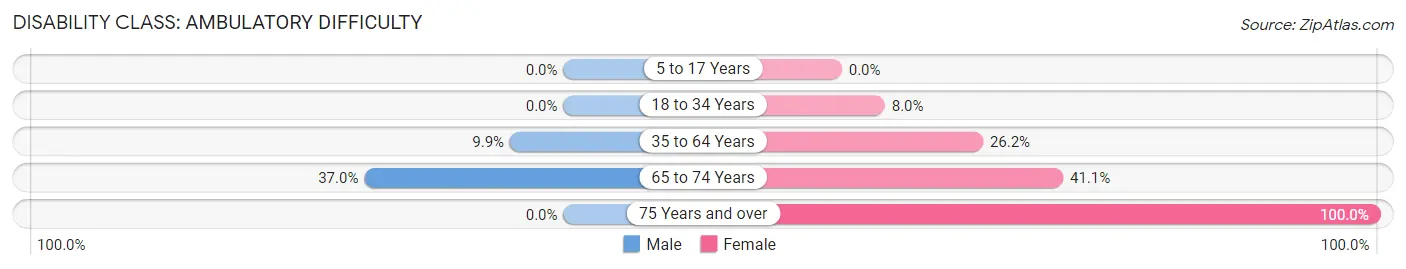
| Age Bracket | Male | Female |
| 5 to 17 Years | 0 (0.0%) | 0 (0.0%) |
| 18 to 34 Years | 0 (0.0%) | 15 (8.0%) |
| 35 to 64 Years | 50 (9.9%) | 93 (26.2%) |
| 65 to 74 Years | 17 (37.0%) | 23 (41.1%) |
| 75 Years and over | 0 (0.0%) | 14 (100.0%) |
Disability Class: Self-Care Difficulty
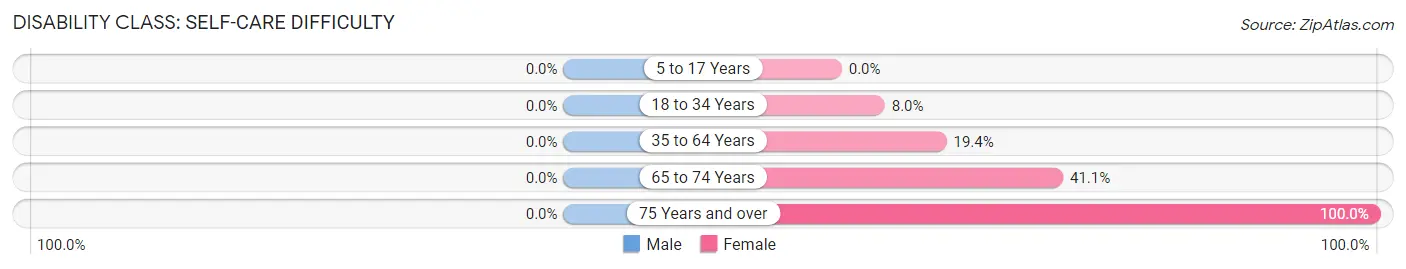
| Age Bracket | Male | Female |
| 5 to 17 Years | 0 (0.0%) | 0 (0.0%) |
| 18 to 34 Years | 0 (0.0%) | 15 (8.0%) |
| 35 to 64 Years | 0 (0.0%) | 69 (19.4%) |
| 65 to 74 Years | 0 (0.0%) | 23 (41.1%) |
| 75 Years and over | 0 (0.0%) | 14 (100.0%) |
Technology Access in Bunker Hill
Computing Device Access in Bunker Hill
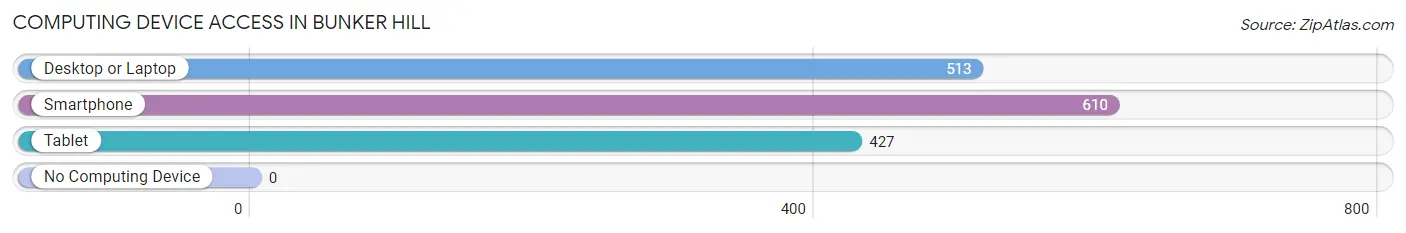
| Device Type | # Households | % Households |
| Desktop or Laptop | 513 | 84.1% |
| Smartphone | 610 | 100.0% |
| Tablet | 427 | 70.0% |
| No Computing Device | 0 | 0.0% |
| Total | 610 | 100.0% |
Internet Access in Bunker Hill
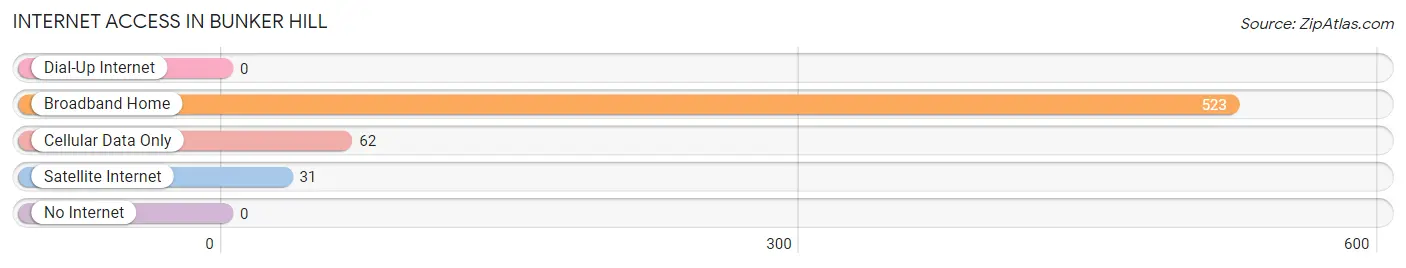
| Internet Type | # Households | % Households |
| Dial-Up Internet | 0 | 0.0% |
| Broadband Home | 523 | 85.7% |
| Cellular Data Only | 62 | 10.2% |
| Satellite Internet | 31 | 5.1% |
| No Internet | 0 | 0.0% |
| Total | 610 | 100.0% |
Bunker Hill Summary
Bunker Hill is a small unincorporated community located in the foothills of the Cascade Mountains in Oregon, United States. It is situated in the western part of the state, approximately 25 miles east of Eugene and 40 miles south of Portland. The community is located in Lane County and is part of the Eugene-Springfield Metropolitan Statistical Area.
History
The area that is now Bunker Hill was first settled in the late 1800s by homesteaders who were attracted to the area by its rich soil and abundant timber resources. The community was named after the nearby Bunker Hill, a prominent hill in the area. The first post office in the area was established in 1891 and the community was officially incorporated in 1895.
In the early 1900s, Bunker Hill was a thriving logging and farming community. The town had a sawmill, a general store, a blacksmith shop, a school, and a church. The town also had a hotel, a saloon, and a dance hall.
In the 1920s, the town began to decline as the timber resources in the area were depleted. The sawmill closed and the population began to dwindle. By the 1950s, the town was nearly abandoned.
In the late 1970s, the town began to experience a resurgence as people began to move to the area to take advantage of the area’s natural beauty and recreational opportunities. Today, Bunker Hill is a small, rural community with a population of approximately 200 people.
Geography
Bunker Hill is located in the foothills of the Cascade Mountains in western Oregon. The town is situated in the McKenzie River Valley, approximately 25 miles east of Eugene and 40 miles south of Portland. The town is located in Lane County and is part of the Eugene-Springfield Metropolitan Statistical Area.
The town is surrounded by lush forests and rolling hills. The nearby McKenzie River provides a variety of recreational opportunities, including fishing, rafting, and kayaking. The nearby Willamette National Forest offers a variety of outdoor activities, including hiking, camping, and mountain biking.
Economy
The economy of Bunker Hill is largely based on tourism and recreation. The town is a popular destination for outdoor enthusiasts, who come to take advantage of the area’s natural beauty and recreational opportunities. The town also has a few small businesses, including a general store, a cafe, and a few bed and breakfasts.
Demographics
As of the 2010 census, the population of Bunker Hill was 200 people. The racial makeup of the town was 95.0% White, 0.5% African American, 0.5% Native American, 0.5% Asian, 0.0% Pacific Islander, 0.5% from other races, and 2.5% from two or more races. Hispanic or Latino of any race were 2.5% of the population.
The median household income in Bunker Hill was $37,500, and the median family income was $41,250. The per capita income for the town was $17,500. About 10.0% of families and 12.5% of the population were below the poverty line, including 16.7% of those under the age of 18 and none of those 65 and older.
Common Questions
What is the Total Population of Bunker Hill?
Total Population of Bunker Hill is 2,103.
What is the Total Male Population of Bunker Hill?
Total Male Population of Bunker Hill is 1,184.
What is the Total Female Population of Bunker Hill?
Total Female Population of Bunker Hill is 919.
What is the Ratio of Males per 100 Females in Bunker Hill?
There are 128.84 Males per 100 Females in Bunker Hill.
What is the Ratio of Females per 100 Males in Bunker Hill?
There are 77.62 Females per 100 Males in Bunker Hill.
What is the Median Population Age in Bunker Hill?
Median Population Age in Bunker Hill is 33.5 Years.
What is the Average Family Size in Bunker Hill
Average Family Size in Bunker Hill is 3.5 People.
What is the Average Household Size in Bunker Hill
Average Household Size in Bunker Hill is 3.5 People.
What is Per Capita Income in Bunker Hill?
Per Capita income in Bunker Hill is $20,448.
What is the Median Family Income in Bunker Hill?
Median Family Income in Bunker Hill is $63,517.
What is the Median Household income in Bunker Hill?
Median Household Income in Bunker Hill is $63,417.
What is Income or Wage Gap in Bunker Hill?
Income or Wage Gap in Bunker Hill is 41.2%.
Women in Bunker Hill earn 58.8 cents for every dollar earned by a man.
What is Inequality or Gini Index in Bunker Hill?
Inequality or Gini Index in Bunker Hill is 0.30.
How Large is the Labor Force in Bunker Hill?
There are 936 People in the Labor Forcein in Bunker Hill.
What is the Percentage of People in the Labor Force in Bunker Hill?
60.1% of People are in the Labor Force in Bunker Hill.
What is the Unemployment Rate in Bunker Hill?
Unemployment Rate in Bunker Hill is 7.5%.