Coquille, OR
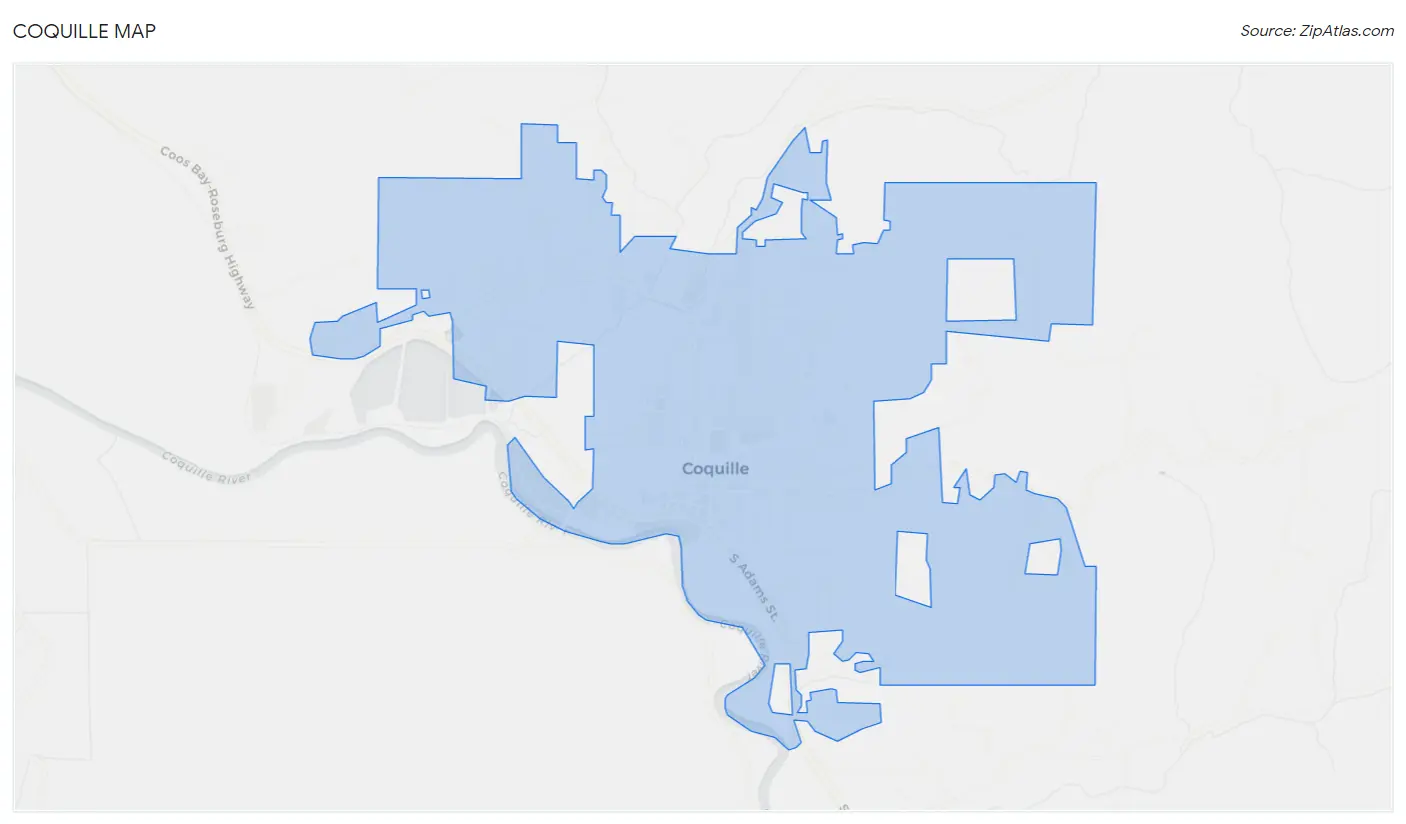
Coquille Map
Coquille Overview
4,009
TOTAL POPULATION
1,797
MALE POPULATION
2,212
FEMALE POPULATION
81.24
MALES / 100 FEMALES
123.09
FEMALES / 100 MALES
45.0
MEDIAN AGE
3.0
AVG FAMILY SIZE
2.3
AVG HOUSEHOLD SIZE
$26,180
PER CAPITA INCOME
$63,975
AVG FAMILY INCOME
$48,008
AVG HOUSEHOLD INCOME
62.5%
WAGE / INCOME GAP [ % ]
37.5¢/ $1
WAGE / INCOME GAP [ $ ]
0.43
INEQUALITY / GINI INDEX
1,375
LABOR FORCE [ PEOPLE ]
43.8%
PERCENT IN LABOR FORCE
6.0%
UNEMPLOYMENT RATE
Coquille Zip Codes
Coquille Area Codes
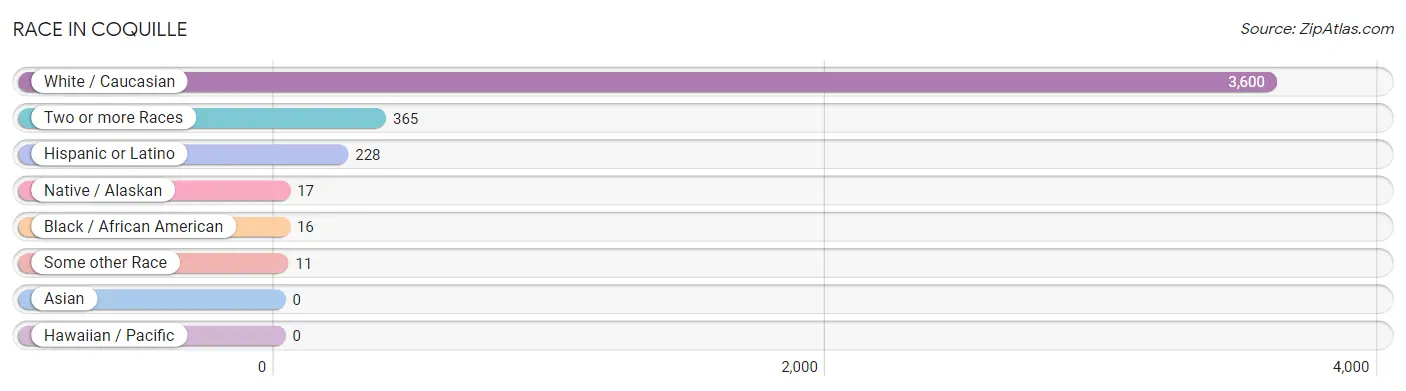
Race in Coquille
The most populous races in Coquille are White / Caucasian (3,600 | 89.8%), Two or more Races (365 | 9.1%), and Hispanic or Latino (228 | 5.7%).
| Race | # Population | % Population |
| Asian | 0 | 0.0% |
| Black / African American | 16 | 0.4% |
| Hawaiian / Pacific | 0 | 0.0% |
| Hispanic or Latino | 228 | 5.7% |
| Native / Alaskan | 17 | 0.4% |
| White / Caucasian | 3,600 | 89.8% |
| Two or more Races | 365 | 9.1% |
| Some other Race | 11 | 0.3% |
| Total | 4,009 | 100.0% |
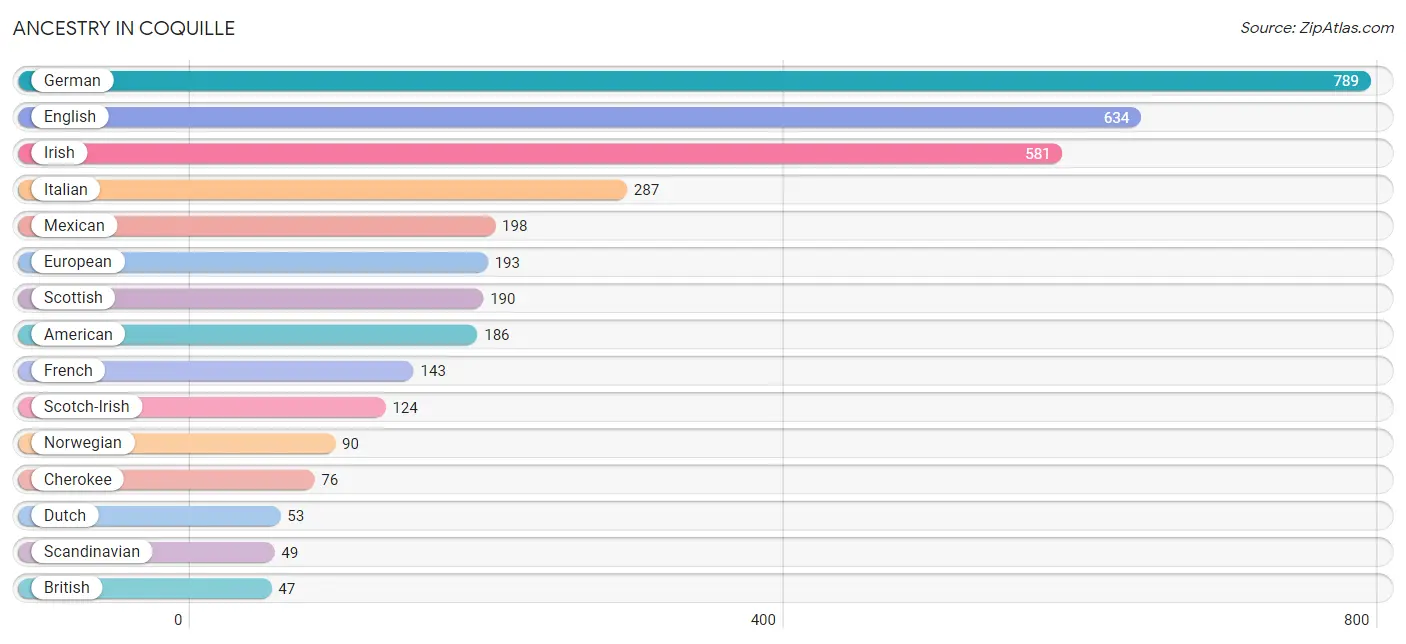
Ancestry in Coquille
The most populous ancestries reported in Coquille are German (789 | 19.7%), English (634 | 15.8%), Irish (581 | 14.5%), Italian (287 | 7.2%), and Mexican (198 | 4.9%), together accounting for 62.1% of all Coquille residents.
| Ancestry | # Population | % Population |
| African | 12 | 0.3% |
| American | 186 | 4.6% |
| Australian | 33 | 0.8% |
| Austrian | 31 | 0.8% |
| Bhutanese | 6 | 0.2% |
| British | 47 | 1.2% |
| Burmese | 12 | 0.3% |
| Canadian | 8 | 0.2% |
| Celtic | 7 | 0.2% |
| Cherokee | 76 | 1.9% |
| Danish | 38 | 0.9% |
| Dutch | 53 | 1.3% |
| English | 634 | 15.8% |
| European | 193 | 4.8% |
| Finnish | 23 | 0.6% |
| French | 143 | 3.6% |
| French Canadian | 31 | 0.8% |
| German | 789 | 19.7% |
| Greek | 12 | 0.3% |
| Inupiat | 17 | 0.4% |
| Irish | 581 | 14.5% |
| Italian | 287 | 7.2% |
| Mexican | 198 | 4.9% |
| Northern European | 4 | 0.1% |
| Norwegian | 90 | 2.2% |
| Polish | 39 | 1.0% |
| Romanian | 17 | 0.4% |
| Russian | 9 | 0.2% |
| Scandinavian | 49 | 1.2% |
| Scotch-Irish | 124 | 3.1% |
| Scottish | 190 | 4.7% |
| Spaniard | 30 | 0.7% |
| Subsaharan African | 12 | 0.3% |
| Swedish | 46 | 1.1% |
| Swiss | 11 | 0.3% |
| Welsh | 40 | 1.0% |
| Yup'ik | 17 | 0.4% | View All 37 Rows |
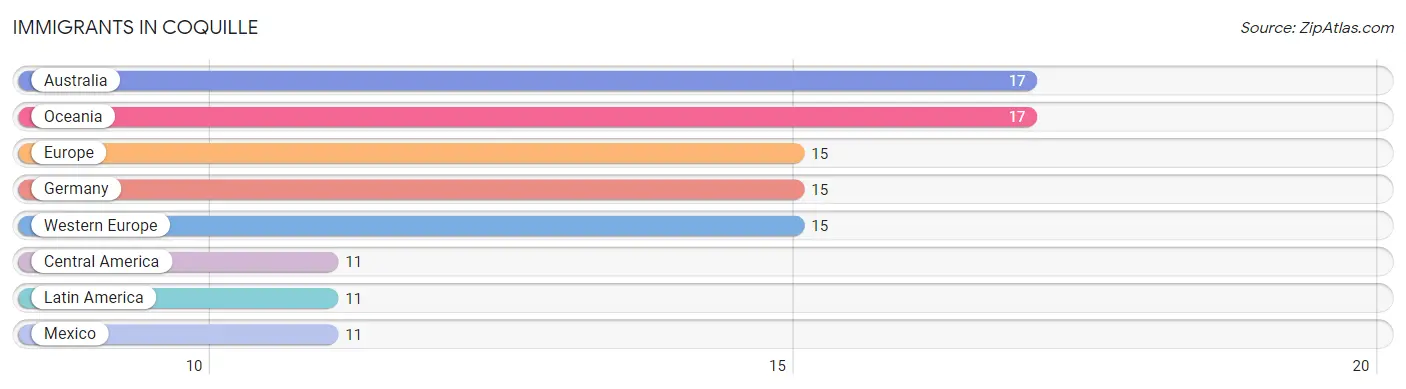
Immigrants in Coquille
The most numerous immigrant groups reported in Coquille came from Australia (17 | 0.4%), Oceania (17 | 0.4%), Europe (15 | 0.4%), Germany (15 | 0.4%), and Western Europe (15 | 0.4%), together accounting for 2.0% of all Coquille residents.
| Immigration Origin | # Population | % Population |
| Australia | 17 | 0.4% |
| Central America | 11 | 0.3% |
| Europe | 15 | 0.4% |
| Germany | 15 | 0.4% |
| Latin America | 11 | 0.3% |
| Mexico | 11 | 0.3% |
| Oceania | 17 | 0.4% |
| Western Europe | 15 | 0.4% | View All 8 Rows |
Sex and Age in Coquille
Sex and Age in Coquille
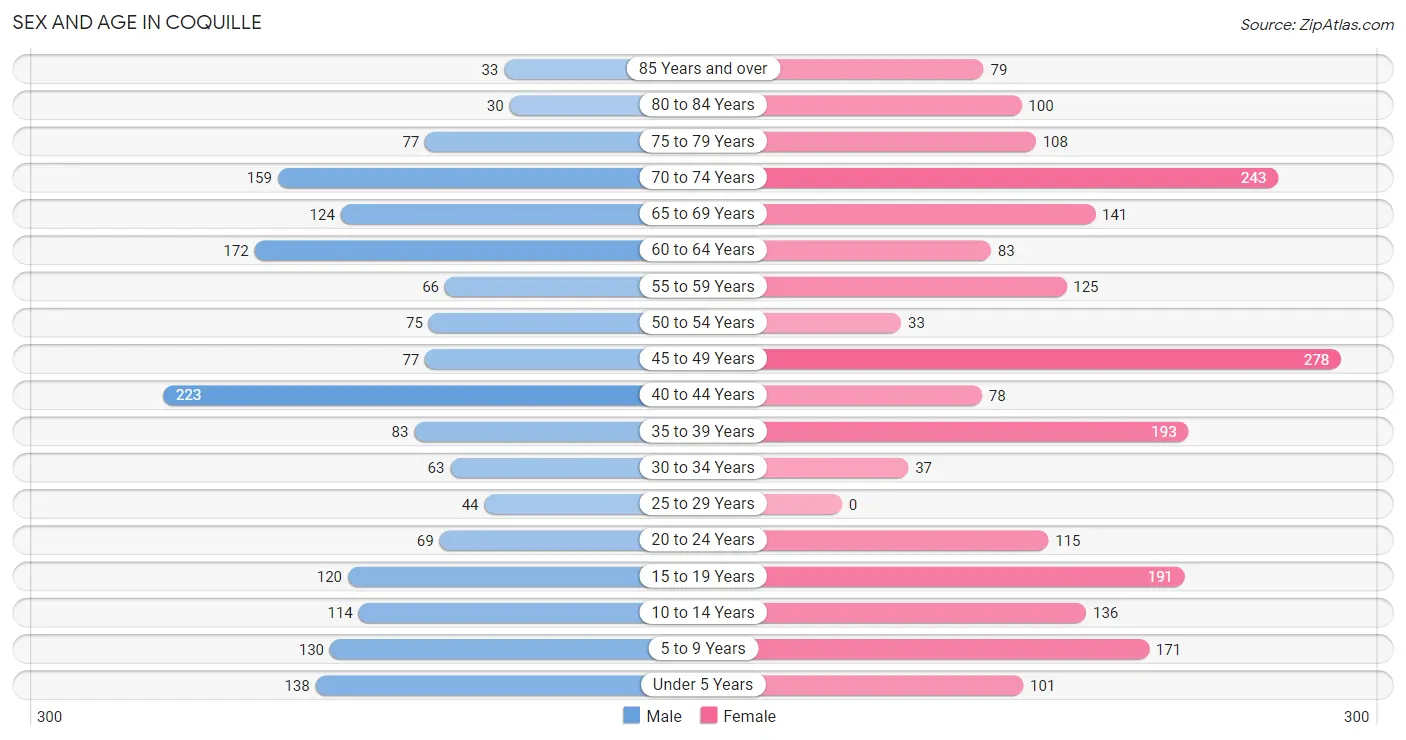
The most populous age groups in Coquille are 40 to 44 Years (223 | 12.4%) for men and 45 to 49 Years (278 | 12.6%) for women.
| Age Bracket | Male | Female |
| Under 5 Years | 138 (7.7%) | 101 (4.6%) |
| 5 to 9 Years | 130 (7.2%) | 171 (7.7%) |
| 10 to 14 Years | 114 (6.3%) | 136 (6.1%) |
| 15 to 19 Years | 120 (6.7%) | 191 (8.6%) |
| 20 to 24 Years | 69 (3.8%) | 115 (5.2%) |
| 25 to 29 Years | 44 (2.5%) | 0 (0.0%) |
| 30 to 34 Years | 63 (3.5%) | 37 (1.7%) |
| 35 to 39 Years | 83 (4.6%) | 193 (8.7%) |
| 40 to 44 Years | 223 (12.4%) | 78 (3.5%) |
| 45 to 49 Years | 77 (4.3%) | 278 (12.6%) |
| 50 to 54 Years | 75 (4.2%) | 33 (1.5%) |
| 55 to 59 Years | 66 (3.7%) | 125 (5.7%) |
| 60 to 64 Years | 172 (9.6%) | 83 (3.7%) |
| 65 to 69 Years | 124 (6.9%) | 141 (6.4%) |
| 70 to 74 Years | 159 (8.8%) | 243 (11.0%) |
| 75 to 79 Years | 77 (4.3%) | 108 (4.9%) |
| 80 to 84 Years | 30 (1.7%) | 100 (4.5%) |
| 85 Years and over | 33 (1.8%) | 79 (3.6%) |
| Total | 1,797 (100.0%) | 2,212 (100.0%) |
Families and Households in Coquille
Median Family Size in Coquille
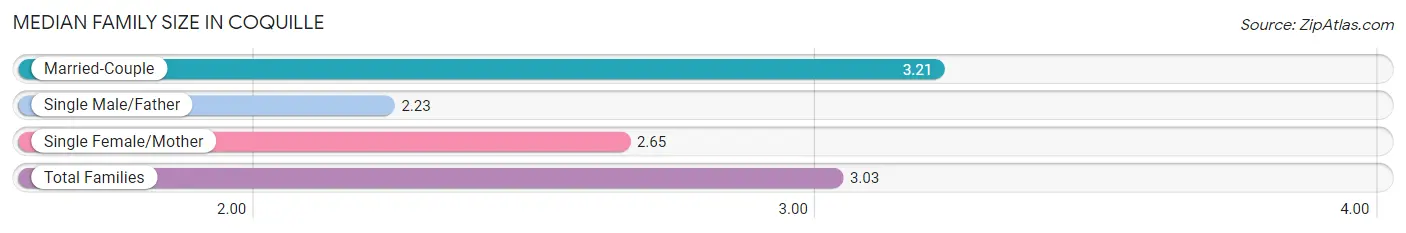
The median family size in Coquille is 3.03 persons per family, with married-couple families (706 | 72.3%) accounting for the largest median family size of 3.21 persons per family. On the other hand, single male/father families (52 | 5.3%) represent the smallest median family size with 2.23 persons per family.
| Family Type | # Families | Family Size |
| Married-Couple | 706 (72.3%) | 3.21 |
| Single Male/Father | 52 (5.3%) | 2.23 |
| Single Female/Mother | 218 (22.3%) | 2.65 |
| Total Families | 976 (100.0%) | 3.03 |
Median Household Size in Coquille
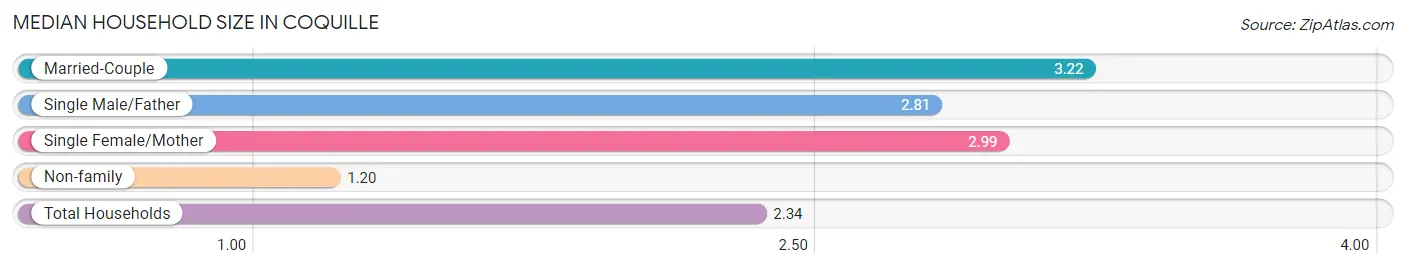
The median household size in Coquille is 2.34 persons per household, with married-couple households (706 | 42.3%) accounting for the largest median household size of 3.22 persons per household. non-family households (694 | 41.6%) represent the smallest median household size with 1.20 persons per household.
| Household Type | # Households | Household Size |
| Married-Couple | 706 (42.3%) | 3.22 |
| Single Male/Father | 52 (3.1%) | 2.81 |
| Single Female/Mother | 218 (13.1%) | 2.99 |
| Non-family | 694 (41.6%) | 1.20 |
| Total Households | 1,670 (100.0%) | 2.34 |
Household Size by Marriage Status in Coquille
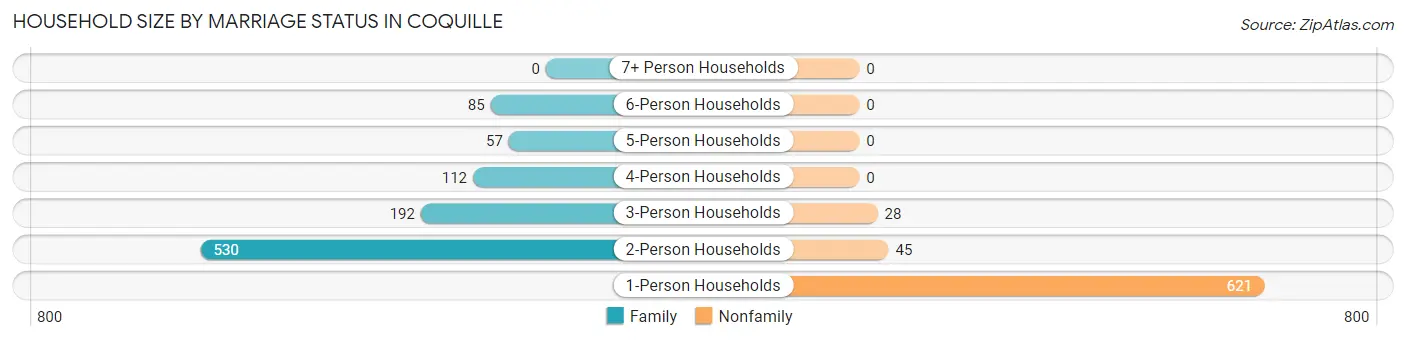
Out of a total of 1,670 households in Coquille, 976 (58.4%) are family households, while 694 (41.6%) are nonfamily households. The most numerous type of family households are 2-person households, comprising 530, and the most common type of nonfamily households are 1-person households, comprising 621.
| Household Size | Family Households | Nonfamily Households |
| 1-Person Households | - | 621 (37.2%) |
| 2-Person Households | 530 (31.7%) | 45 (2.7%) |
| 3-Person Households | 192 (11.5%) | 28 (1.7%) |
| 4-Person Households | 112 (6.7%) | 0 (0.0%) |
| 5-Person Households | 57 (3.4%) | 0 (0.0%) |
| 6-Person Households | 85 (5.1%) | 0 (0.0%) |
| 7+ Person Households | 0 (0.0%) | 0 (0.0%) |
| Total | 976 (58.4%) | 694 (41.6%) |
Female Fertility in Coquille
Fertility by Age in Coquille
| Age Bracket | Women with Births | Births / 1,000 Women |
| 15 to 19 years | 0 (0.0%) | 0.0 |
| 20 to 34 years | 0 (0.0%) | 0.0 |
| 35 to 50 years | 0 (0.0%) | 0.0 |
| Total | 0 (0.0%) | 0.0 |
Fertility by Age by Marriage Status in Coquille
| Age Bracket | Married | Unmarried |
| 15 to 19 years | 0 (0.0%) | 0 (0.0%) |
| 20 to 34 years | 0 (0.0%) | 0 (0.0%) |
| 35 to 50 years | 0 (0.0%) | 0 (0.0%) |
| Total | 0 (0.0%) | 0 (0.0%) |
Fertility by Education in Coquille
| Educational Attainment | Women with Births | Births / 1,000 Women |
| Less than High School | 0 (0.0%) | 0.0 |
| High School Diploma | 0 (0.0%) | 0.0 |
| College or Associate's Degree | 0 (0.0%) | 0.0 |
| Bachelor's Degree | 0 (0.0%) | 0.0 |
| Graduate Degree | 0 (0.0%) | 0.0 |
| Total | 0 (0.0%) | 0.0 |
Fertility by Education by Marriage Status in Coquille
| Educational Attainment | Married | Unmarried |
| Less than High School | 0 (0.0%) | 0 (0.0%) |
| High School Diploma | 0 (0.0%) | 0 (0.0%) |
| College or Associate's Degree | 0 (0.0%) | 0 (0.0%) |
| Bachelor's Degree | 0 (0.0%) | 0 (0.0%) |
| Graduate Degree | 0 (0.0%) | 0 (0.0%) |
| Total | 0 (0.0%) | 0 (0.0%) |
Income in Coquille
Income Overview in Coquille
Per Capita Income in Coquille is $26,180, while median incomes of families and households are $63,975 and $48,008 respectively.
| Characteristic | Number | Measure |
| Per Capita Income | 4,009 | $26,180 |
| Median Family Income | 976 | $63,975 |
| Mean Family Income | 976 | $76,647 |
| Median Household Income | 1,670 | $48,008 |
| Mean Household Income | 1,670 | $60,217 |
| Income Deficit | 976 | $0 |
| Wage / Income Gap (%) | 4,009 | 62.51% |
| Wage / Income Gap ($) | 4,009 | 37.49¢ per $1 |
| Gini / Inequality Index | 4,009 | 0.43 |
Earnings by Sex in Coquille
Average Earnings in Coquille are $30,134, $48,042 for men and $18,012 for women, a difference of 62.5%.
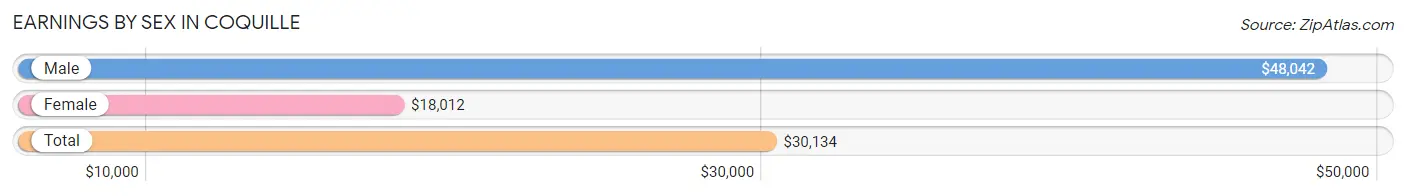
| Sex | Number | Average Earnings |
| Male | 731 (46.3%) | $48,042 |
| Female | 847 (53.7%) | $18,012 |
| Total | 1,578 (100.0%) | $30,134 |
Earnings by Sex by Income Bracket in Coquille
The most common earnings brackets in Coquille are $75,000 to $99,999 for men (108 | 14.8%) and $2,499 or less for women (122 | 14.4%).
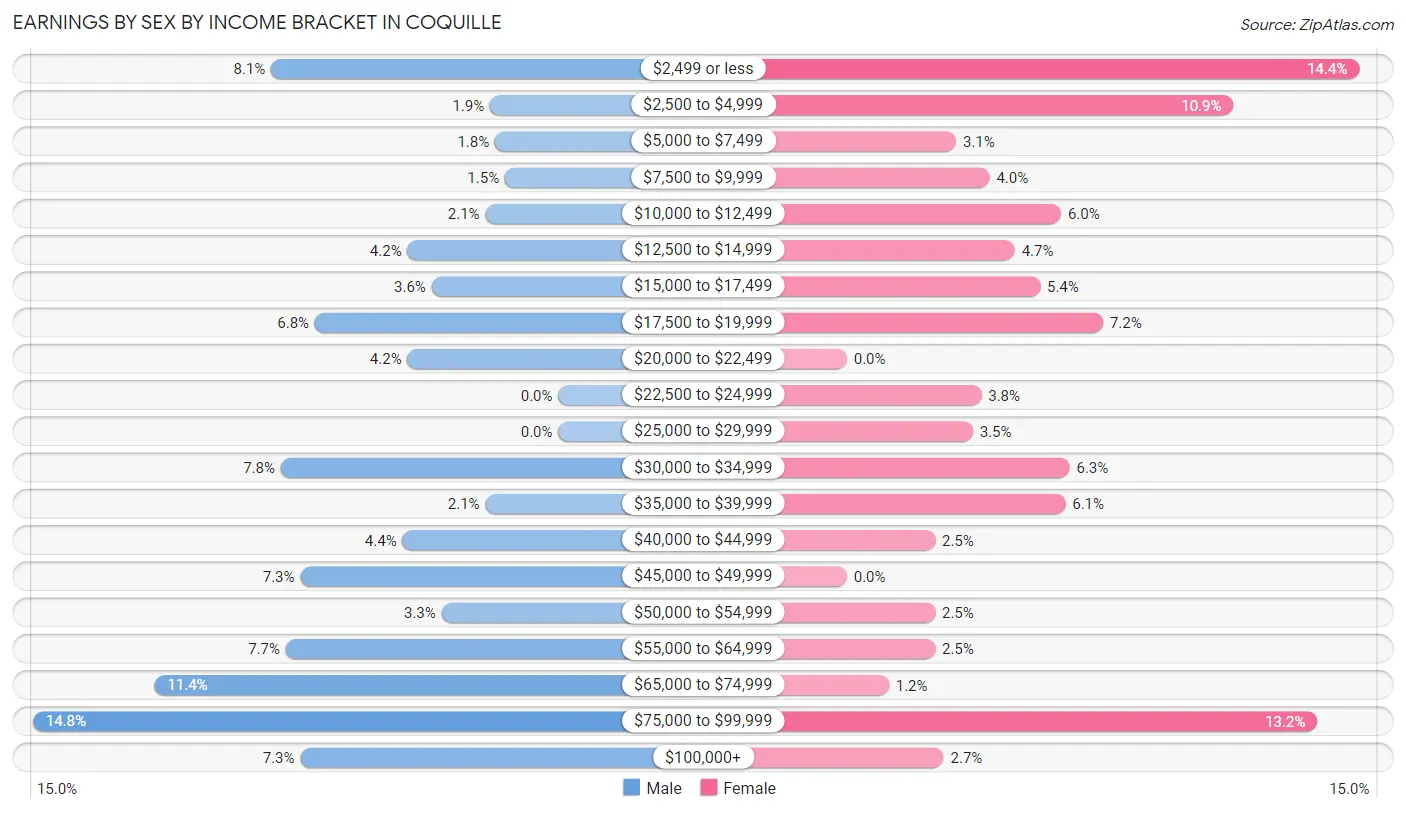
| Income | Male | Female |
| $2,499 or less | 59 (8.1%) | 122 (14.4%) |
| $2,500 to $4,999 | 14 (1.9%) | 92 (10.9%) |
| $5,000 to $7,499 | 13 (1.8%) | 26 (3.1%) |
| $7,500 to $9,999 | 11 (1.5%) | 34 (4.0%) |
| $10,000 to $12,499 | 15 (2.1%) | 51 (6.0%) |
| $12,500 to $14,999 | 31 (4.2%) | 40 (4.7%) |
| $15,000 to $17,499 | 26 (3.6%) | 46 (5.4%) |
| $17,500 to $19,999 | 50 (6.8%) | 61 (7.2%) |
| $20,000 to $22,499 | 31 (4.2%) | 0 (0.0%) |
| $22,500 to $24,999 | 0 (0.0%) | 32 (3.8%) |
| $25,000 to $29,999 | 0 (0.0%) | 30 (3.5%) |
| $30,000 to $34,999 | 57 (7.8%) | 53 (6.3%) |
| $35,000 to $39,999 | 15 (2.1%) | 52 (6.1%) |
| $40,000 to $44,999 | 32 (4.4%) | 21 (2.5%) |
| $45,000 to $49,999 | 53 (7.2%) | 0 (0.0%) |
| $50,000 to $54,999 | 24 (3.3%) | 21 (2.5%) |
| $55,000 to $64,999 | 56 (7.7%) | 21 (2.5%) |
| $65,000 to $74,999 | 83 (11.4%) | 10 (1.2%) |
| $75,000 to $99,999 | 108 (14.8%) | 112 (13.2%) |
| $100,000+ | 53 (7.2%) | 23 (2.7%) |
| Total | 731 (100.0%) | 847 (100.0%) |
Earnings by Sex by Educational Attainment in Coquille
Average earnings in Coquille are $54,844 for men and $25,556 for women, a difference of 53.4%. Men with an educational attainment of college or associate's degree enjoy the highest average annual earnings of $61,081, while those with bachelor's degree education earn the least with $48,821. Women with an educational attainment of graduate degree earn the most with the average annual earnings of $79,048, while those with high school diploma education have the smallest earnings of $15,750.
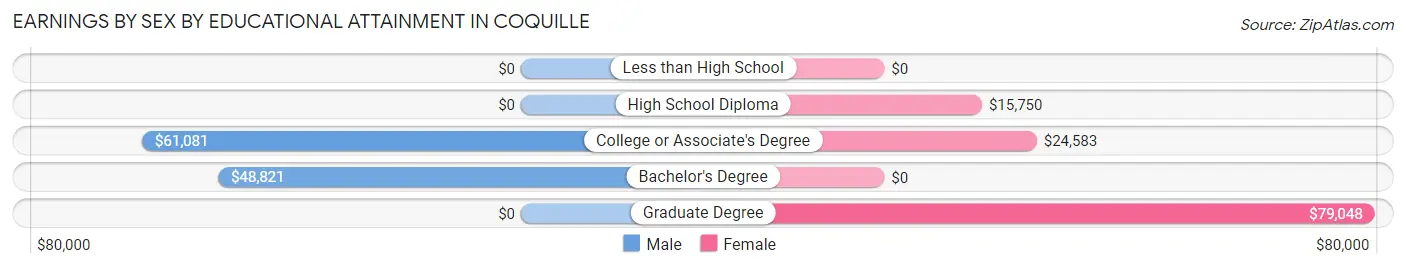
| Educational Attainment | Male Income | Female Income |
| Less than High School | - | - |
| High School Diploma | - | - |
| College or Associate's Degree | $61,081 | $24,583 |
| Bachelor's Degree | $48,821 | $0 |
| Graduate Degree | - | - |
| Total | $54,844 | $25,556 |
Family Income in Coquille
Family Income Brackets in Coquille
According to the Coquille family income data, there are 200 families falling into the $50,000 to $74,999 income range, which is the most common income bracket and makes up 20.5% of all families. Conversely, the less than $10,000 income bracket is the least frequent group with only 8 families (0.8%) belonging to this category.
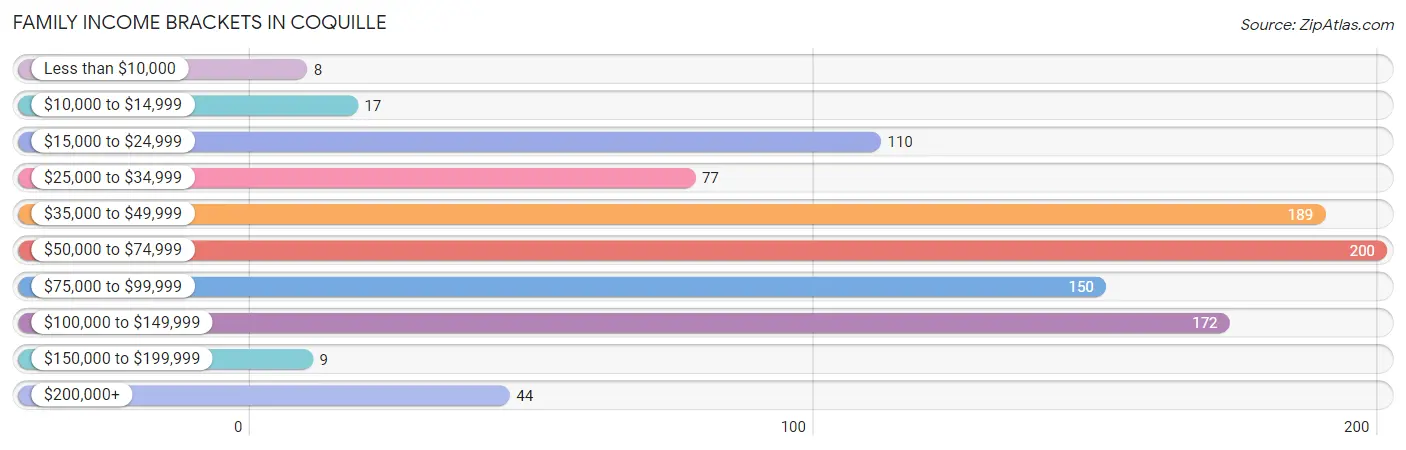
| Income Bracket | # Families | % Families |
| Less than $10,000 | 8 | 0.8% |
| $10,000 to $14,999 | 17 | 1.7% |
| $15,000 to $24,999 | 110 | 11.3% |
| $25,000 to $34,999 | 77 | 7.9% |
| $35,000 to $49,999 | 189 | 19.4% |
| $50,000 to $74,999 | 200 | 20.5% |
| $75,000 to $99,999 | 150 | 15.4% |
| $100,000 to $149,999 | 172 | 17.6% |
| $150,000 to $199,999 | 9 | 0.9% |
| $200,000+ | 44 | 4.5% |
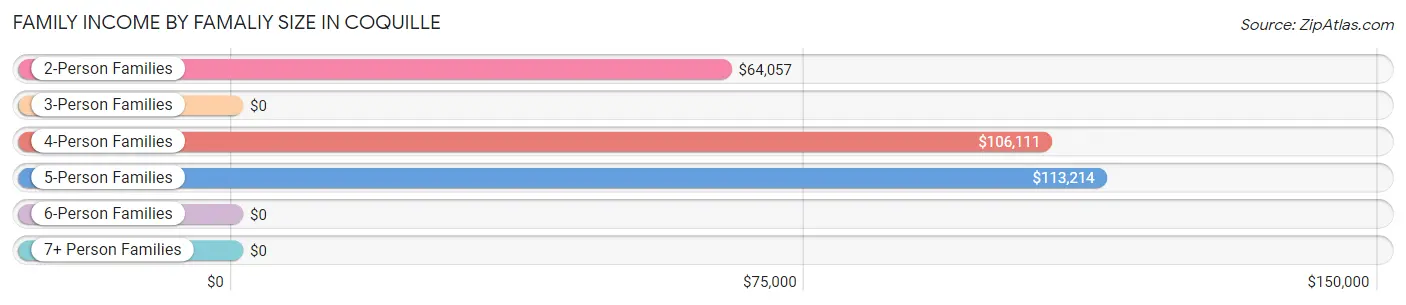
Family Income by Famaliy Size in Coquille
5-person families (42 | 4.3%) account for the highest median family income in Coquille with $113,214 per family, while 2-person families (558 | 57.2%) have the highest median income of $32,028 per family member.
| Income Bracket | # Families | Median Income |
| 2-Person Families | 558 (57.2%) | $64,057 |
| 3-Person Families | 210 (21.5%) | $0 |
| 4-Person Families | 92 (9.4%) | $106,111 |
| 5-Person Families | 42 (4.3%) | $113,214 |
| 6-Person Families | 74 (7.6%) | $0 |
| 7+ Person Families | 0 (0.0%) | $0 |
| Total | 976 (100.0%) | $63,975 |
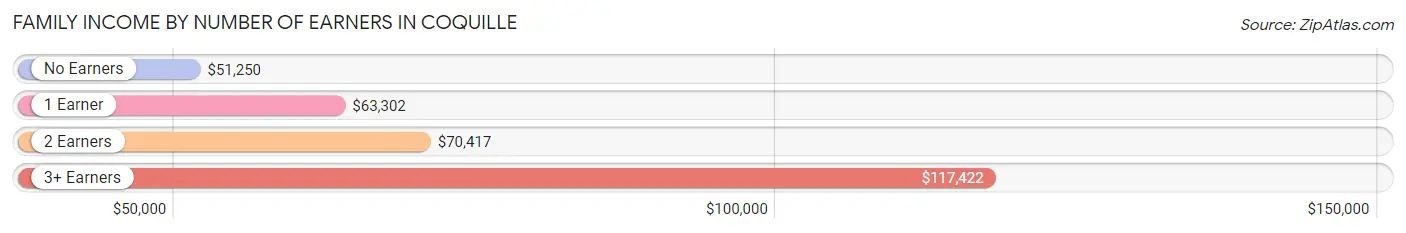
Family Income by Number of Earners in Coquille
The median family income in Coquille is $63,975, with families comprising 3+ earners (113) having the highest median family income of $117,422, while families with no earners (274) have the lowest median family income of $51,250, accounting for 11.6% and 28.1% of families, respectively.
| Number of Earners | # Families | Median Income |
| No Earners | 274 (28.1%) | $51,250 |
| 1 Earner | 336 (34.4%) | $63,302 |
| 2 Earners | 253 (25.9%) | $70,417 |
| 3+ Earners | 113 (11.6%) | $117,422 |
| Total | 976 (100.0%) | $63,975 |
Household Income in Coquille
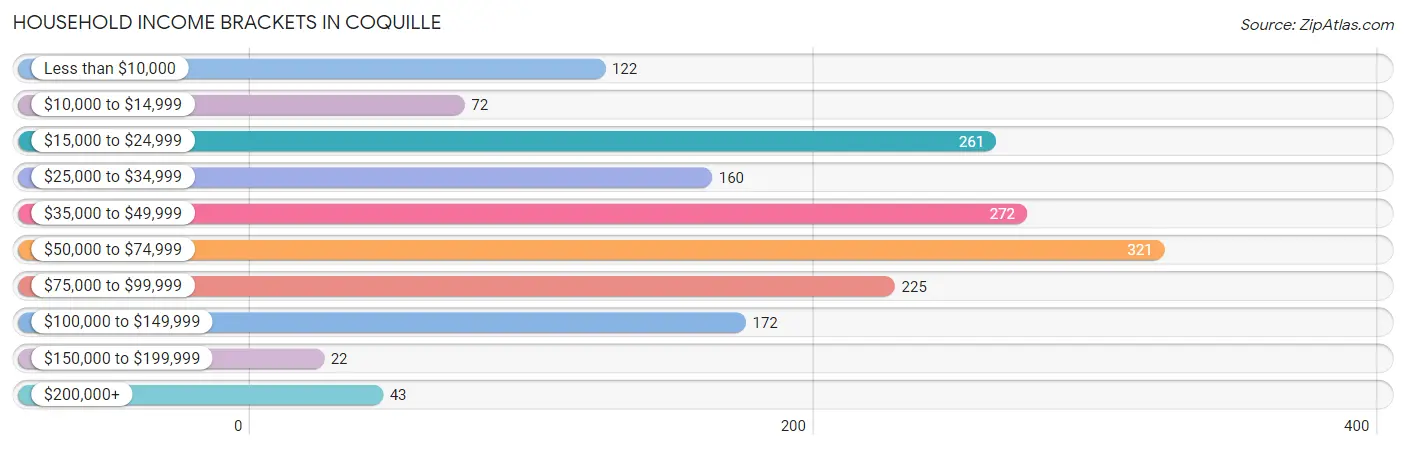
Household Income Brackets in Coquille
With 321 households falling in the category, the $50,000 to $74,999 income range is the most frequent in Coquille, accounting for 19.2% of all households. In contrast, only 22 households (1.3%) fall into the $150,000 to $199,999 income bracket, making it the least populous group.
| Income Bracket | # Households | % Households |
| Less than $10,000 | 122 | 7.3% |
| $10,000 to $14,999 | 72 | 4.3% |
| $15,000 to $24,999 | 261 | 15.6% |
| $25,000 to $34,999 | 160 | 9.6% |
| $35,000 to $49,999 | 272 | 16.3% |
| $50,000 to $74,999 | 321 | 19.2% |
| $75,000 to $99,999 | 225 | 13.5% |
| $100,000 to $149,999 | 172 | 10.3% |
| $150,000 to $199,999 | 22 | 1.3% |
| $200,000+ | 43 | 2.6% |
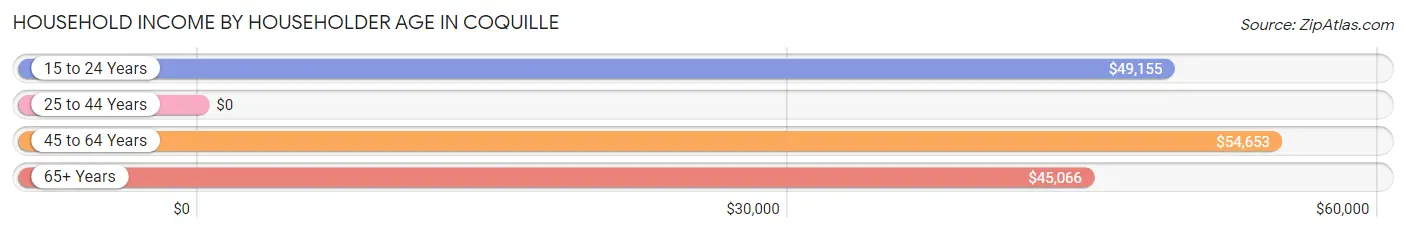
Household Income by Householder Age in Coquille
The median household income in Coquille is $48,008, with the highest median household income of $54,653 found in the 45 to 64 years age bracket for the primary householder. A total of 608 households (36.4%) fall into this category. Meanwhile, the 25 to 44 years age bracket for the primary householder has the lowest median household income of $0, with 375 households (22.5%) in this group.
| Income Bracket | # Households | Median Income |
| 15 to 24 Years | 67 (4.0%) | $49,155 |
| 25 to 44 Years | 375 (22.5%) | $0 |
| 45 to 64 Years | 608 (36.4%) | $54,653 |
| 65+ Years | 620 (37.1%) | $45,066 |
| Total | 1,670 (100.0%) | $48,008 |
Poverty in Coquille
Income Below Poverty by Sex and Age in Coquille
With 19.9% poverty level for males and 19.8% for females among the residents of Coquille, 6 to 11 year old males and under 5 year old females are the most vulnerable to poverty, with 85 males (51.2%) and 61 females (60.4%) in their respective age groups living below the poverty level.
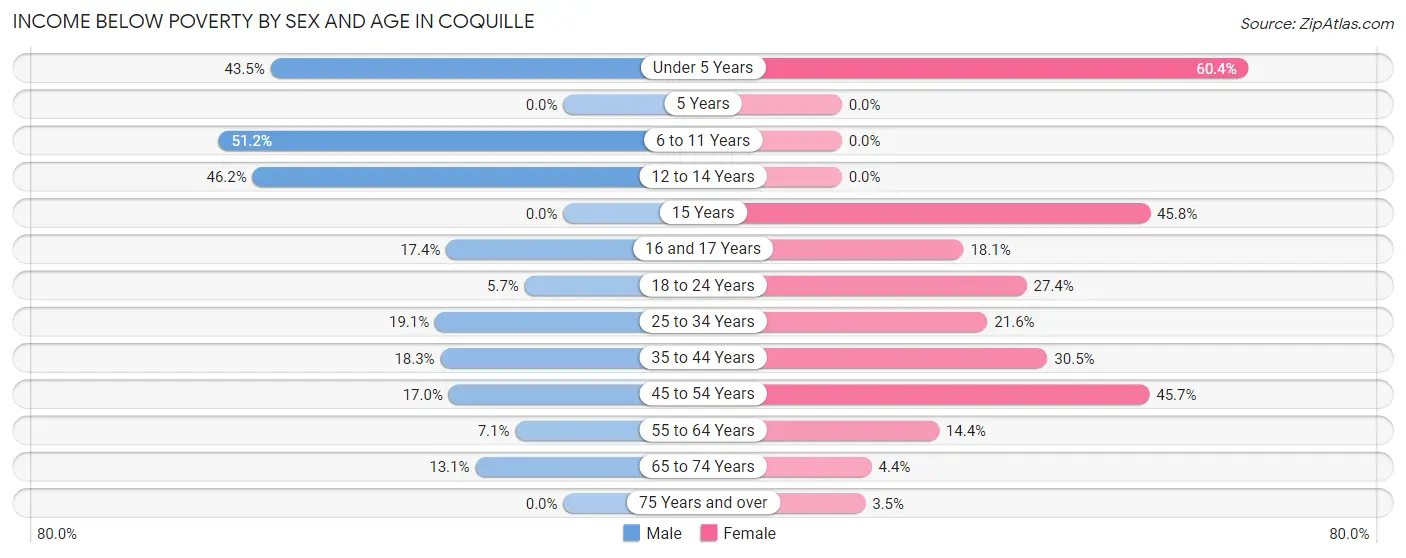
| Age Bracket | Male | Female |
| Under 5 Years | 60 (43.5%) | 61 (60.4%) |
| 5 Years | 0 (0.0%) | 0 (0.0%) |
| 6 to 11 Years | 85 (51.2%) | 0 (0.0%) |
| 12 to 14 Years | 36 (46.2%) | 0 (0.0%) |
| 15 Years | 0 (0.0%) | 27 (45.8%) |
| 16 and 17 Years | 8 (17.4%) | 15 (18.1%) |
| 18 to 24 Years | 7 (5.7%) | 45 (27.4%) |
| 25 to 34 Years | 16 (19.1%) | 8 (21.6%) |
| 35 to 44 Years | 50 (18.2%) | 80 (30.5%) |
| 45 to 54 Years | 24 (17.0%) | 142 (45.7%) |
| 55 to 64 Years | 17 (7.1%) | 30 (14.4%) |
| 65 to 74 Years | 37 (13.1%) | 17 (4.4%) |
| 75 Years and over | 0 (0.0%) | 10 (3.5%) |
| Total | 340 (19.9%) | 435 (19.8%) |
Income Above Poverty by Sex and Age in Coquille
According to the poverty statistics in Coquille, males aged 15 years and females aged 6 to 11 years are the age groups that are most secure financially, with 100.0% of males and 100.0% of females in these age groups living above the poverty line.
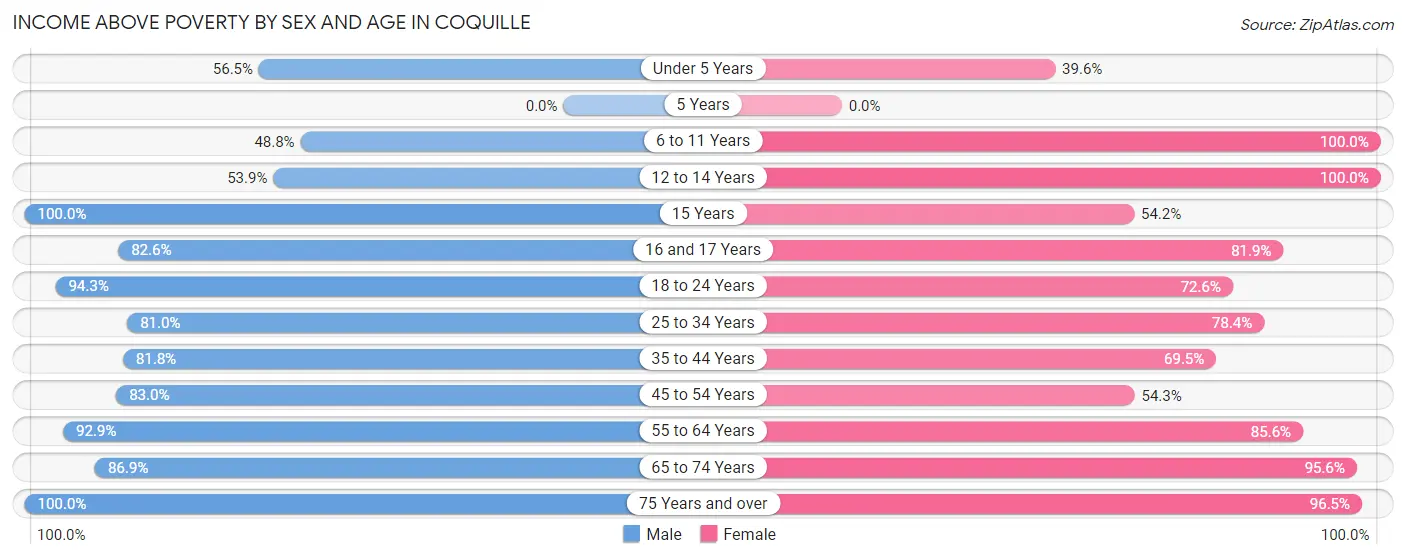
| Age Bracket | Male | Female |
| Under 5 Years | 78 (56.5%) | 40 (39.6%) |
| 5 Years | 0 (0.0%) | 0 (0.0%) |
| 6 to 11 Years | 81 (48.8%) | 199 (100.0%) |
| 12 to 14 Years | 42 (53.8%) | 108 (100.0%) |
| 15 Years | 21 (100.0%) | 32 (54.2%) |
| 16 and 17 Years | 38 (82.6%) | 68 (81.9%) |
| 18 to 24 Years | 115 (94.3%) | 119 (72.6%) |
| 25 to 34 Years | 68 (80.9%) | 29 (78.4%) |
| 35 to 44 Years | 224 (81.8%) | 182 (69.5%) |
| 45 to 54 Years | 117 (83.0%) | 169 (54.3%) |
| 55 to 64 Years | 221 (92.9%) | 178 (85.6%) |
| 65 to 74 Years | 246 (86.9%) | 367 (95.6%) |
| 75 Years and over | 121 (100.0%) | 277 (96.5%) |
| Total | 1,372 (80.1%) | 1,768 (80.2%) |
Income Below Poverty Among Married-Couple Families in Coquille
The poverty statistics for married-couple families in Coquille show that 7.1% or 50 of the total 706 families live below the poverty line. Families with 3 or 4 children have the highest poverty rate of 53.8%, comprising of 50 families. On the other hand, families with no children have the lowest poverty rate of 0.0%, which includes 0 families.
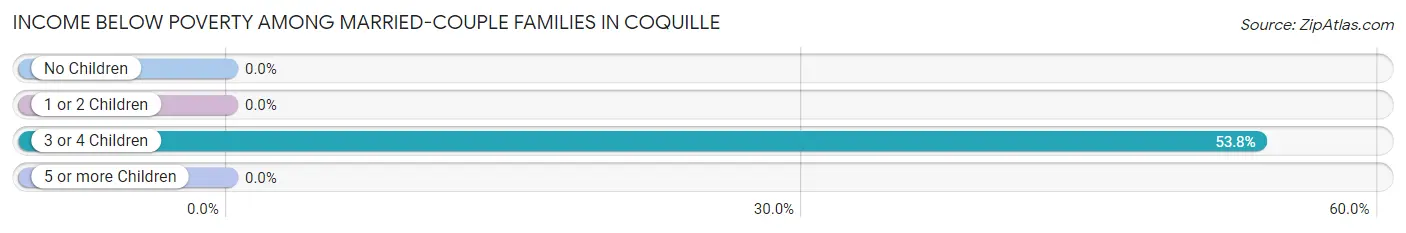
| Children | Above Poverty | Below Poverty |
| No Children | 458 (100.0%) | 0 (0.0%) |
| 1 or 2 Children | 155 (100.0%) | 0 (0.0%) |
| 3 or 4 Children | 43 (46.2%) | 50 (53.8%) |
| 5 or more Children | 0 (0.0%) | 0 (0.0%) |
| Total | 656 (92.9%) | 50 (7.1%) |
Income Below Poverty Among Single-Parent Households in Coquille
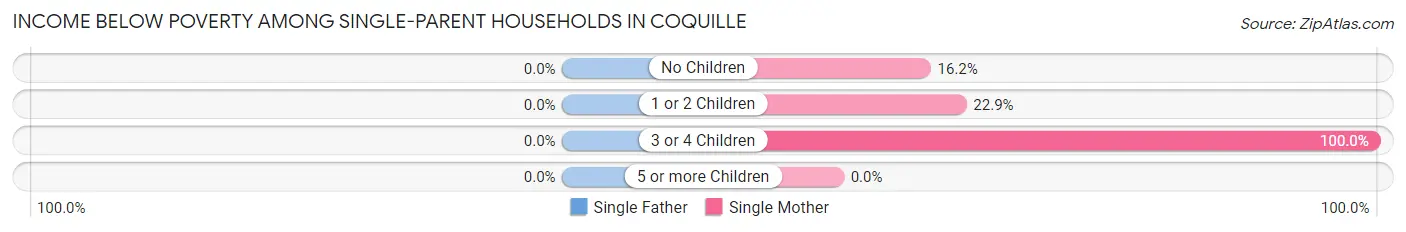
| Children | Single Father | Single Mother |
| No Children | 0 (0.0%) | 17 (16.2%) |
| 1 or 2 Children | 0 (0.0%) | 24 (22.9%) |
| 3 or 4 Children | 0 (0.0%) | 8 (100.0%) |
| 5 or more Children | 0 (0.0%) | 0 (0.0%) |
| Total | 0 (0.0%) | 49 (22.5%) |
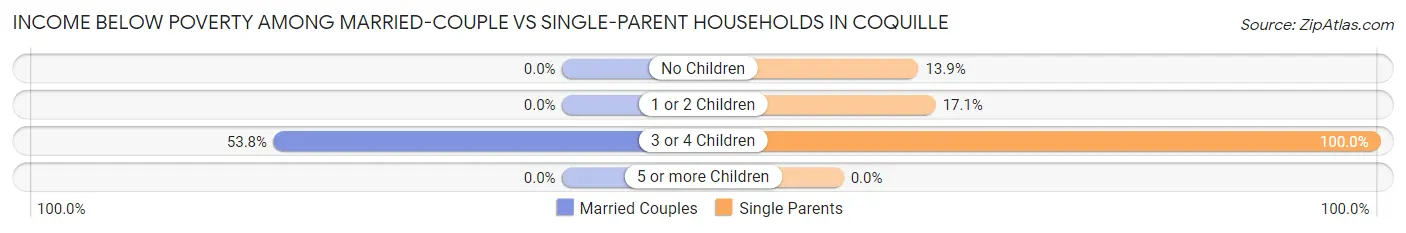
Income Below Poverty Among Married-Couple vs Single-Parent Households in Coquille
The poverty data for Coquille shows that 50 of the married-couple family households (7.1%) and 49 of the single-parent households (18.1%) are living below the poverty level. Within the married-couple family households, those with 3 or 4 children have the highest poverty rate, with 50 households (53.8%) falling below the poverty line. Among the single-parent households, those with 3 or 4 children have the highest poverty rate, with 8 household (100.0%) living below poverty.
| Children | Married-Couple Families | Single-Parent Households |
| No Children | 0 (0.0%) | 17 (13.9%) |
| 1 or 2 Children | 0 (0.0%) | 24 (17.1%) |
| 3 or 4 Children | 50 (53.8%) | 8 (100.0%) |
| 5 or more Children | 0 (0.0%) | 0 (0.0%) |
| Total | 50 (7.1%) | 49 (18.1%) |
Employment Characteristics in Coquille
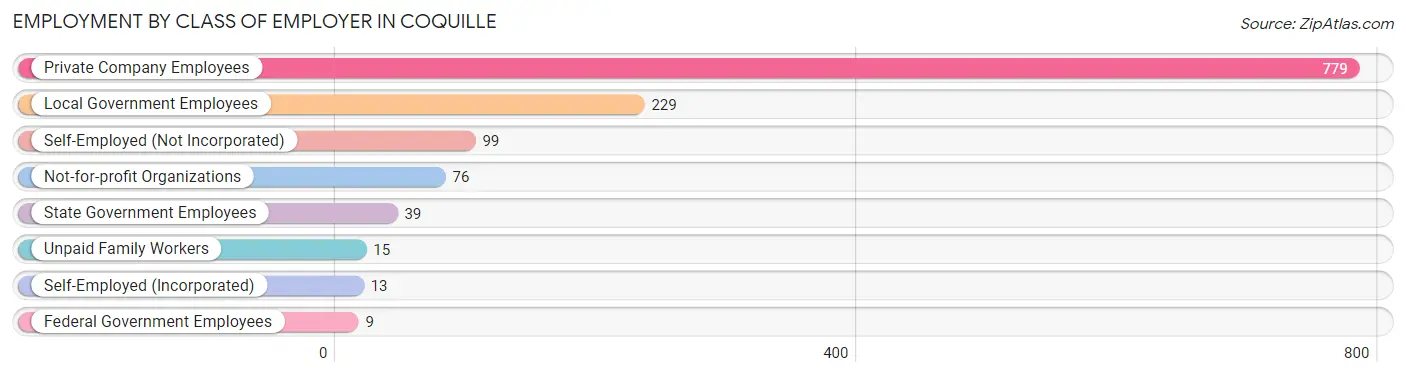
Employment by Class of Employer in Coquille
Among the 1,259 employed individuals in Coquille, private company employees (779 | 61.9%), local government employees (229 | 18.2%), and self-employed (not incorporated) (99 | 7.9%) make up the most common classes of employment.
| Employer Class | # Employees | % Employees |
| Private Company Employees | 779 | 61.9% |
| Self-Employed (Incorporated) | 13 | 1.0% |
| Self-Employed (Not Incorporated) | 99 | 7.9% |
| Not-for-profit Organizations | 76 | 6.0% |
| Local Government Employees | 229 | 18.2% |
| State Government Employees | 39 | 3.1% |
| Federal Government Employees | 9 | 0.7% |
| Unpaid Family Workers | 15 | 1.2% |
| Total | 1,259 | 100.0% |
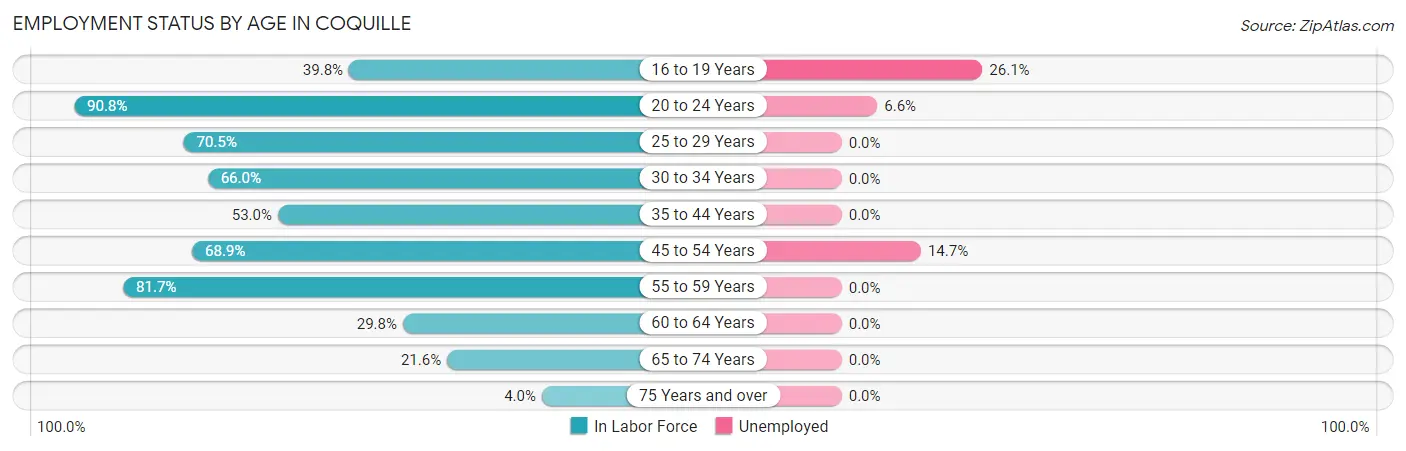
Employment Status by Age in Coquille
According to the labor force statistics for Coquille, out of the total population over 16 years of age (3,139), 43.8% or 1,375 individuals are in the labor force, with 6.0% or 82 of them unemployed. The age group with the highest labor force participation rate is 20 to 24 years, with 90.8% or 167 individuals in the labor force. Within the labor force, the 16 to 19 years age range has the highest percentage of unemployed individuals, with 26.1% or 24 of them being unemployed.
| Age Bracket | In Labor Force | Unemployed |
| 16 to 19 Years | 92 (39.8%) | 24 (26.1%) |
| 20 to 24 Years | 167 (90.8%) | 11 (6.6%) |
| 25 to 29 Years | 31 (70.5%) | 0 (0.0%) |
| 30 to 34 Years | 66 (66.0%) | 0 (0.0%) |
| 35 to 44 Years | 306 (53.0%) | 0 (0.0%) |
| 45 to 54 Years | 319 (68.9%) | 47 (14.7%) |
| 55 to 59 Years | 156 (81.7%) | 0 (0.0%) |
| 60 to 64 Years | 76 (29.8%) | 0 (0.0%) |
| 65 to 74 Years | 144 (21.6%) | 0 (0.0%) |
| 75 Years and over | 17 (4.0%) | 0 (0.0%) |
| Total | 1,375 (43.8%) | 82 (6.0%) |
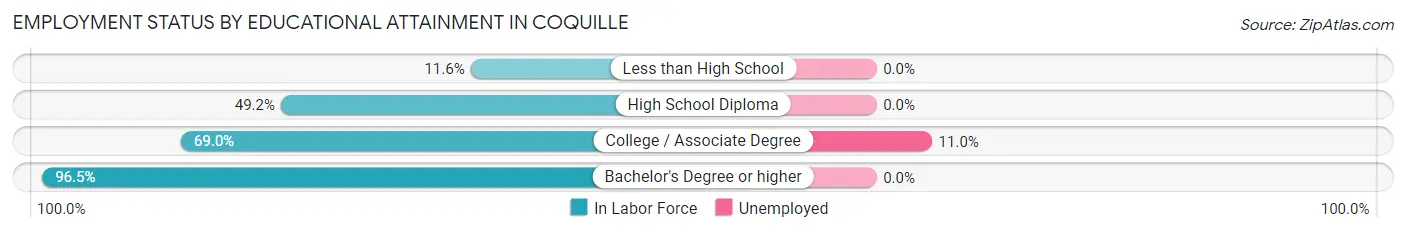
Employment Status by Educational Attainment in Coquille
According to labor force statistics for Coquille, 58.5% of individuals (954) out of the total population between 25 and 64 years of age (1,630) are in the labor force, with 4.9% or 47 of them being unemployed. The group with the highest labor force participation rate are those with the educational attainment of bachelor's degree or higher, with 96.5% or 245 individuals in the labor force. Within the labor force, individuals with college / associate degree education have the highest percentage of unemployment, with 11.0% or 47 of them being unemployed.
| Educational Attainment | In Labor Force | Unemployed |
| Less than High School | 28 (11.6%) | 0 (0.0%) |
| High School Diploma | 254 (49.2%) | 0 (0.0%) |
| College / Associate Degree | 427 (69.0%) | 68 (11.0%) |
| Bachelor's Degree or higher | 245 (96.5%) | 0 (0.0%) |
| Total | 954 (58.5%) | 80 (4.9%) |
Employment Occupations by Sex in Coquille
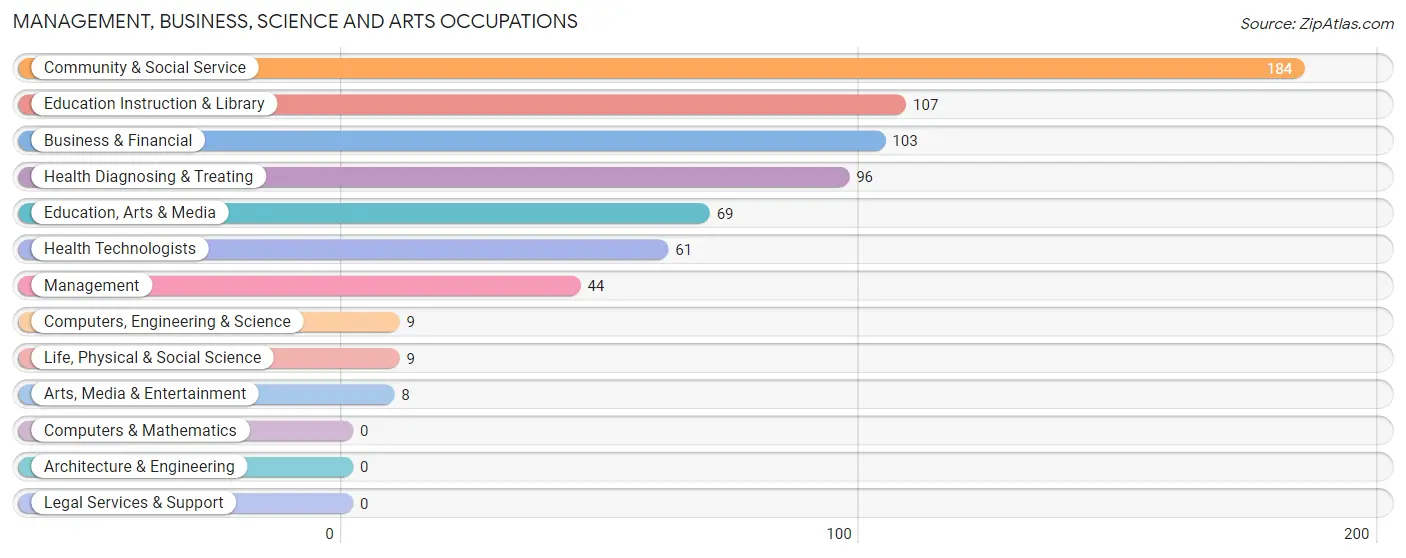
Management, Business, Science and Arts Occupations
The most common Management, Business, Science and Arts occupations in Coquille are Community & Social Service (184 | 14.2%), Education Instruction & Library (107 | 8.3%), Business & Financial (103 | 8.0%), Health Diagnosing & Treating (96 | 7.4%), and Education, Arts & Media (69 | 5.3%).
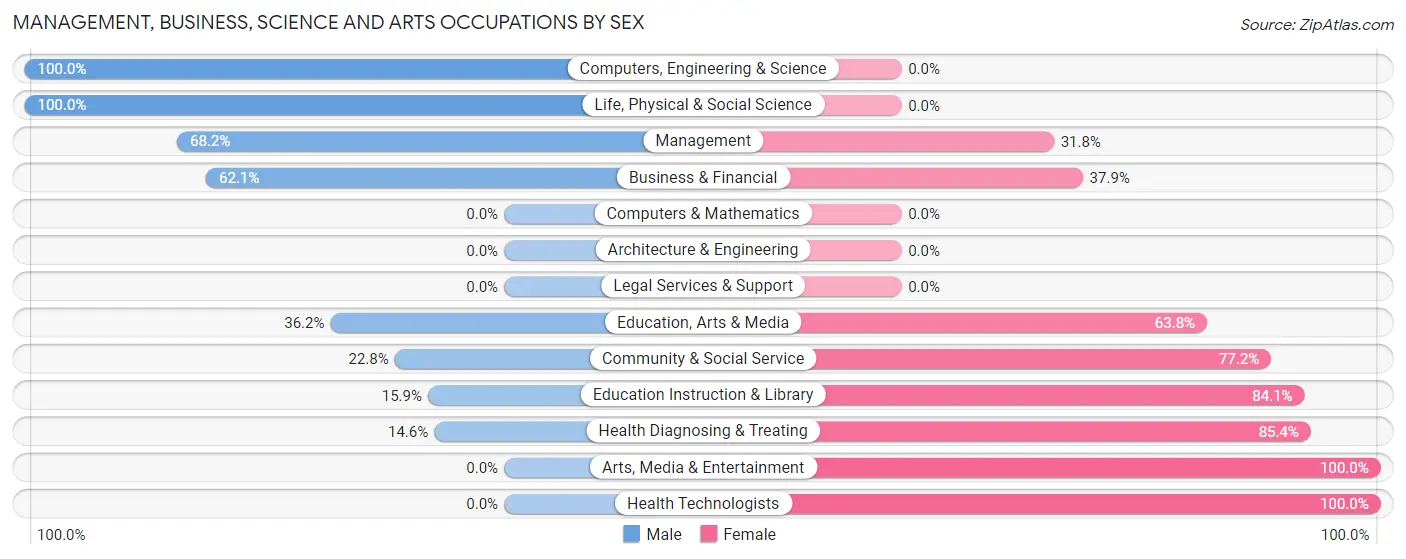
Management, Business, Science and Arts Occupations by Sex
Within the Management, Business, Science and Arts occupations in Coquille, the most male-oriented occupations are Computers, Engineering & Science (100.0%), Life, Physical & Social Science (100.0%), and Management (68.2%), while the most female-oriented occupations are Arts, Media & Entertainment (100.0%), Health Technologists (100.0%), and Health Diagnosing & Treating (85.4%).
| Occupation | Male | Female |
| Management | 30 (68.2%) | 14 (31.8%) |
| Business & Financial | 64 (62.1%) | 39 (37.9%) |
| Computers, Engineering & Science | 9 (100.0%) | 0 (0.0%) |
| Computers & Mathematics | 0 (0.0%) | 0 (0.0%) |
| Architecture & Engineering | 0 (0.0%) | 0 (0.0%) |
| Life, Physical & Social Science | 9 (100.0%) | 0 (0.0%) |
| Community & Social Service | 42 (22.8%) | 142 (77.2%) |
| Education, Arts & Media | 25 (36.2%) | 44 (63.8%) |
| Legal Services & Support | 0 (0.0%) | 0 (0.0%) |
| Education Instruction & Library | 17 (15.9%) | 90 (84.1%) |
| Arts, Media & Entertainment | 0 (0.0%) | 8 (100.0%) |
| Health Diagnosing & Treating | 14 (14.6%) | 82 (85.4%) |
| Health Technologists | 0 (0.0%) | 61 (100.0%) |
| Total (Category) | 159 (36.5%) | 277 (63.5%) |
| Total (Overall) | 628 (48.6%) | 664 (51.4%) |
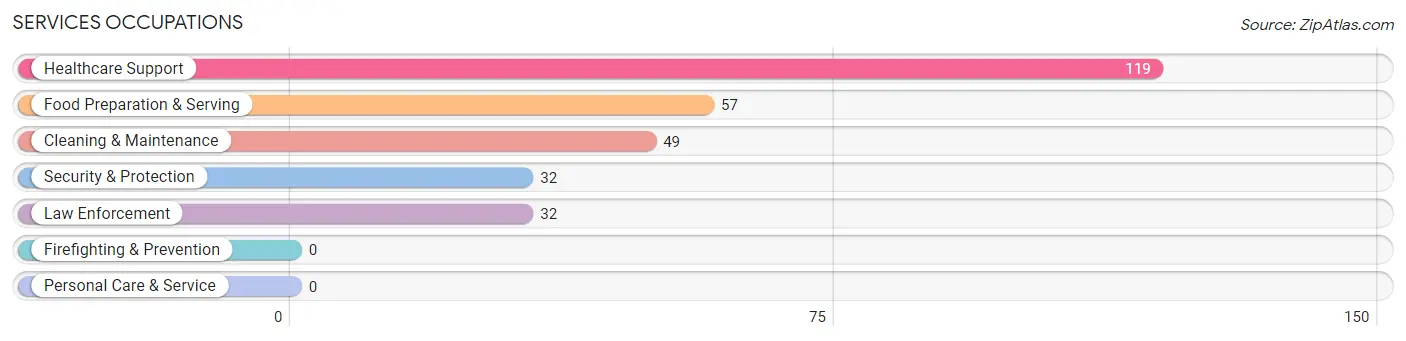
Services Occupations
The most common Services occupations in Coquille are Healthcare Support (119 | 9.2%), Food Preparation & Serving (57 | 4.4%), Cleaning & Maintenance (49 | 3.8%), Security & Protection (32 | 2.5%), and Law Enforcement (32 | 2.5%).
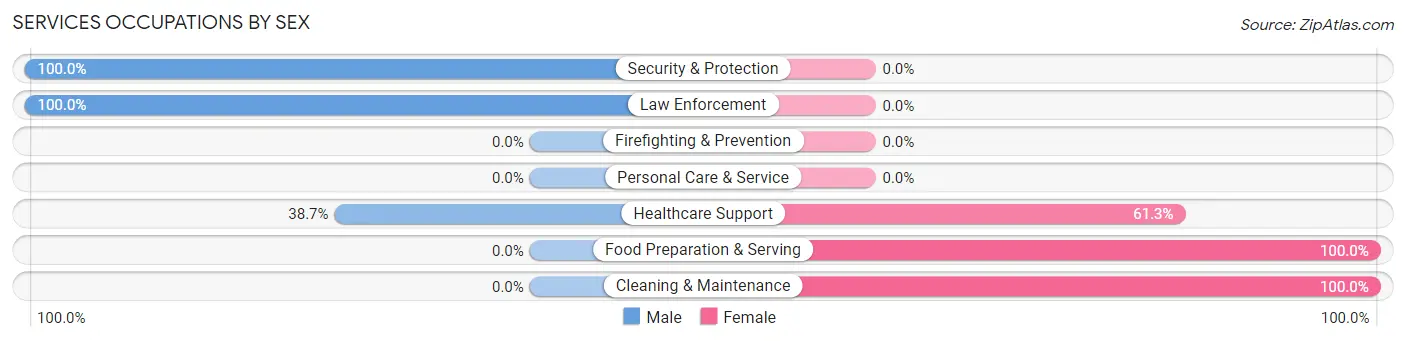
Services Occupations by Sex
Within the Services occupations in Coquille, the most male-oriented occupations are Security & Protection (100.0%), Law Enforcement (100.0%), and Healthcare Support (38.7%), while the most female-oriented occupations are Food Preparation & Serving (100.0%), Cleaning & Maintenance (100.0%), and Healthcare Support (61.3%).
| Occupation | Male | Female |
| Healthcare Support | 46 (38.7%) | 73 (61.3%) |
| Security & Protection | 32 (100.0%) | 0 (0.0%) |
| Firefighting & Prevention | 0 (0.0%) | 0 (0.0%) |
| Law Enforcement | 32 (100.0%) | 0 (0.0%) |
| Food Preparation & Serving | 0 (0.0%) | 57 (100.0%) |
| Cleaning & Maintenance | 0 (0.0%) | 49 (100.0%) |
| Personal Care & Service | 0 (0.0%) | 0 (0.0%) |
| Total (Category) | 78 (30.3%) | 179 (69.7%) |
| Total (Overall) | 628 (48.6%) | 664 (51.4%) |
Sales and Office Occupations
The most common Sales and Office occupations in Coquille are Sales & Related (125 | 9.7%), and Office & Administration (121 | 9.4%).

Sales and Office Occupations by Sex
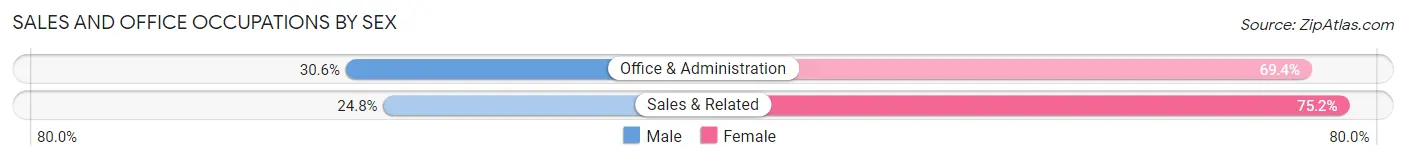
| Occupation | Male | Female |
| Sales & Related | 31 (24.8%) | 94 (75.2%) |
| Office & Administration | 37 (30.6%) | 84 (69.4%) |
| Total (Category) | 68 (27.6%) | 178 (72.4%) |
| Total (Overall) | 628 (48.6%) | 664 (51.4%) |
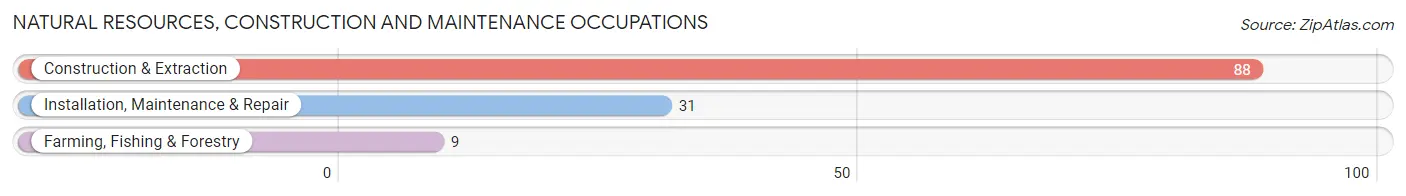
Natural Resources, Construction and Maintenance Occupations
The most common Natural Resources, Construction and Maintenance occupations in Coquille are Construction & Extraction (88 | 6.8%), Installation, Maintenance & Repair (31 | 2.4%), and Farming, Fishing & Forestry (9 | 0.7%).
Natural Resources, Construction and Maintenance Occupations by Sex
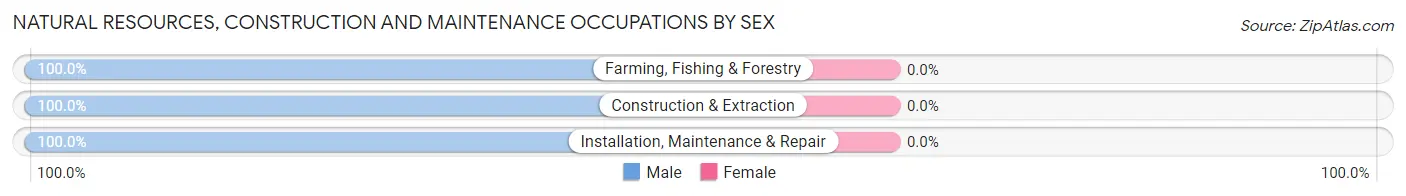
| Occupation | Male | Female |
| Farming, Fishing & Forestry | 9 (100.0%) | 0 (0.0%) |
| Construction & Extraction | 88 (100.0%) | 0 (0.0%) |
| Installation, Maintenance & Repair | 31 (100.0%) | 0 (0.0%) |
| Total (Category) | 128 (100.0%) | 0 (0.0%) |
| Total (Overall) | 628 (48.6%) | 664 (51.4%) |
Production, Transportation and Moving Occupations
The most common Production, Transportation and Moving occupations in Coquille are Material Moving (124 | 9.6%), and Transportation (101 | 7.8%).
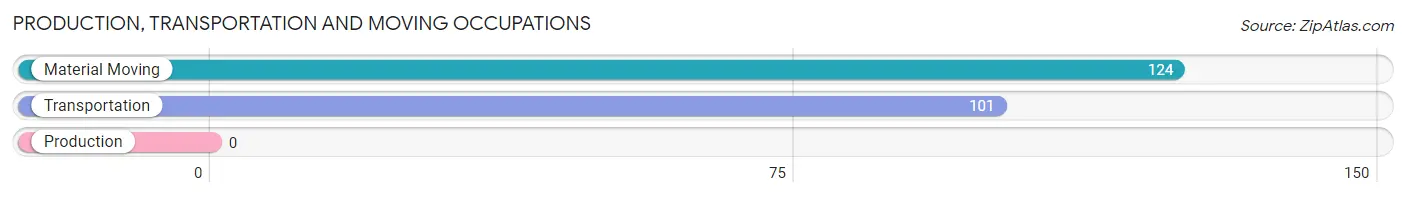
Production, Transportation and Moving Occupations by Sex
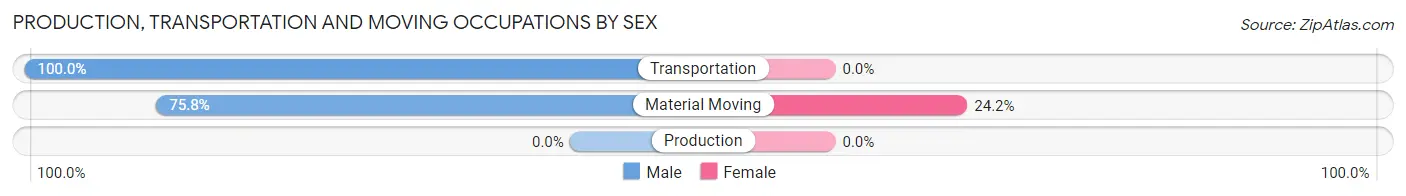
| Occupation | Male | Female |
| Production | 0 (0.0%) | 0 (0.0%) |
| Transportation | 101 (100.0%) | 0 (0.0%) |
| Material Moving | 94 (75.8%) | 30 (24.2%) |
| Total (Category) | 195 (86.7%) | 30 (13.3%) |
| Total (Overall) | 628 (48.6%) | 664 (51.4%) |
Employment Industries by Sex in Coquille
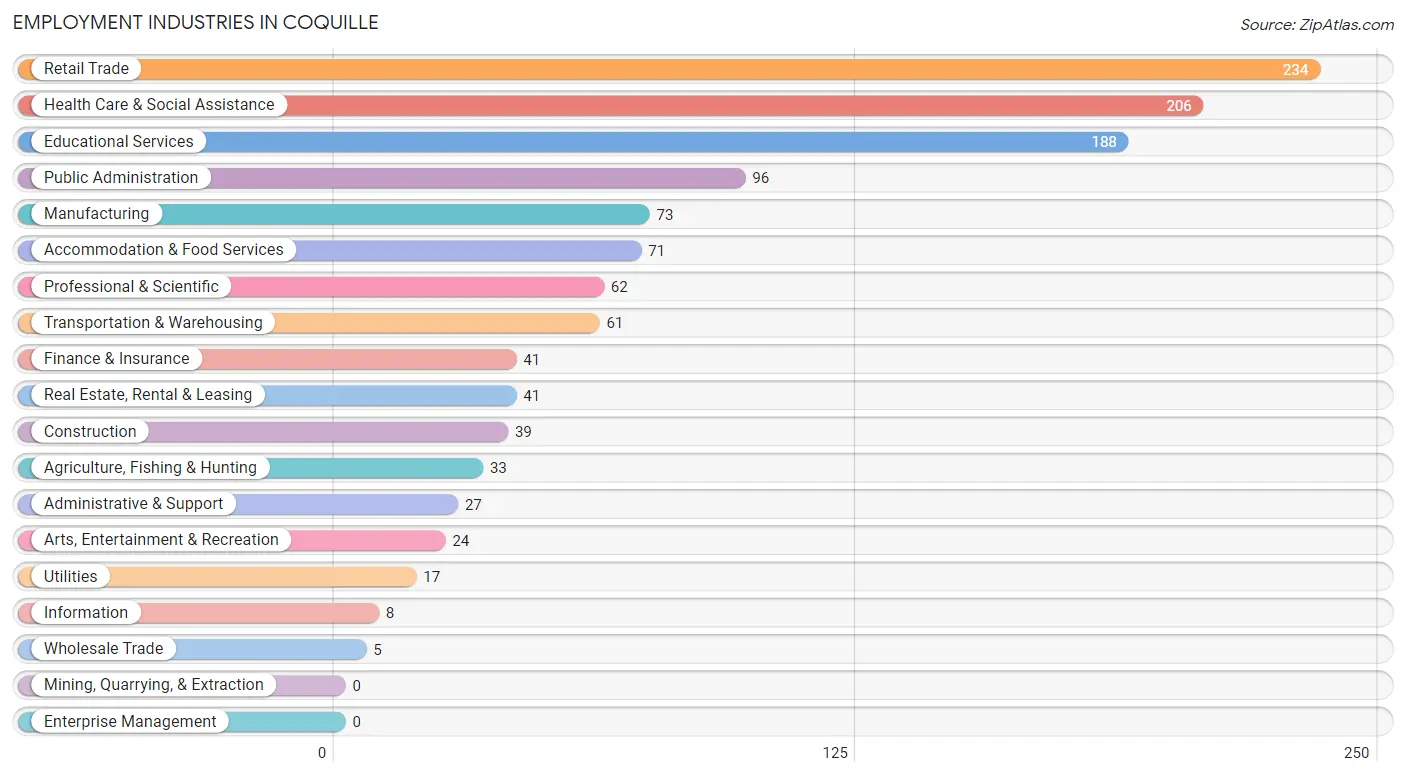
Employment Industries in Coquille
The major employment industries in Coquille include Retail Trade (234 | 18.1%), Health Care & Social Assistance (206 | 15.9%), Educational Services (188 | 14.5%), Public Administration (96 | 7.4%), and Manufacturing (73 | 5.7%).
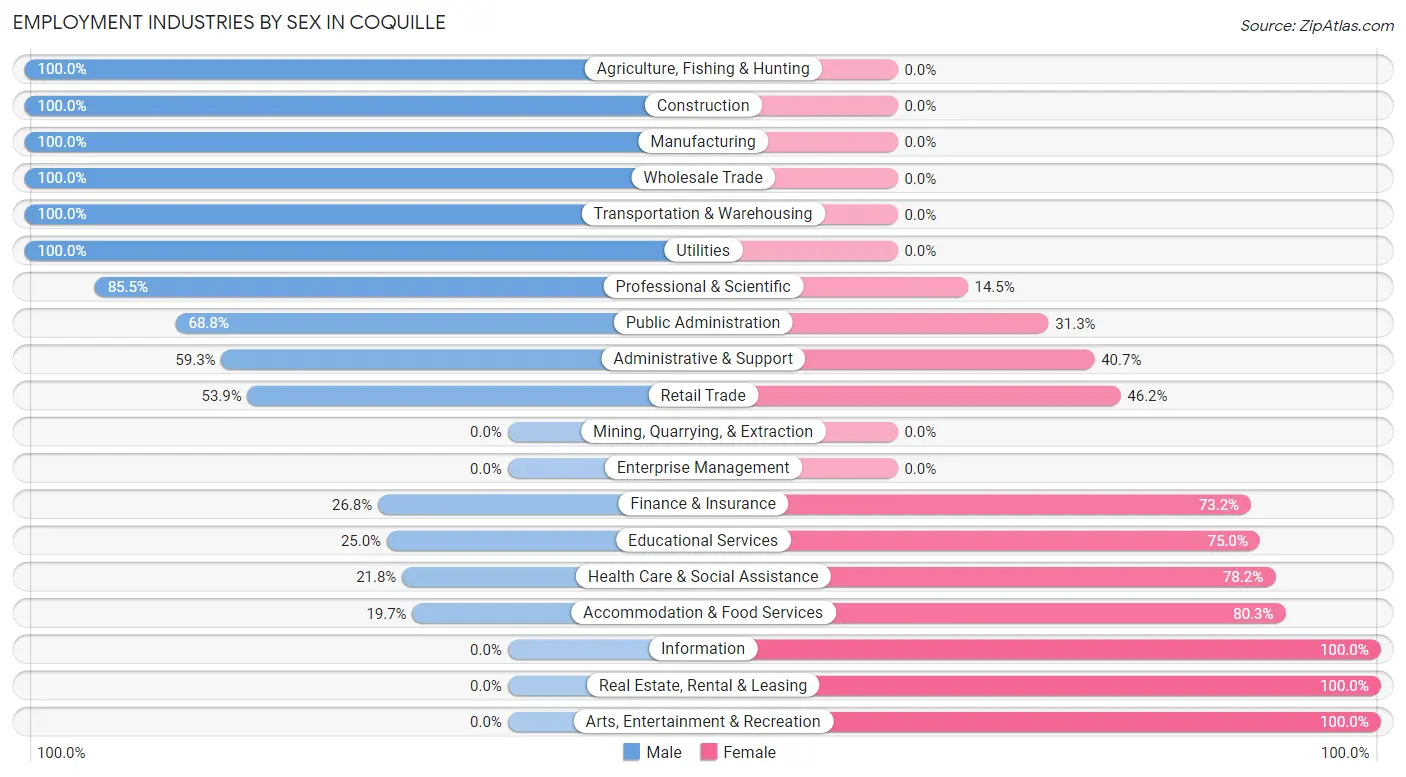
Employment Industries by Sex in Coquille
The Coquille industries that see more men than women are Agriculture, Fishing & Hunting (100.0%), Construction (100.0%), and Manufacturing (100.0%), whereas the industries that tend to have a higher number of women are Information (100.0%), Real Estate, Rental & Leasing (100.0%), and Arts, Entertainment & Recreation (100.0%).
| Industry | Male | Female |
| Agriculture, Fishing & Hunting | 33 (100.0%) | 0 (0.0%) |
| Mining, Quarrying, & Extraction | 0 (0.0%) | 0 (0.0%) |
| Construction | 39 (100.0%) | 0 (0.0%) |
| Manufacturing | 73 (100.0%) | 0 (0.0%) |
| Wholesale Trade | 5 (100.0%) | 0 (0.0%) |
| Retail Trade | 126 (53.8%) | 108 (46.2%) |
| Transportation & Warehousing | 61 (100.0%) | 0 (0.0%) |
| Utilities | 17 (100.0%) | 0 (0.0%) |
| Information | 0 (0.0%) | 8 (100.0%) |
| Finance & Insurance | 11 (26.8%) | 30 (73.2%) |
| Real Estate, Rental & Leasing | 0 (0.0%) | 41 (100.0%) |
| Professional & Scientific | 53 (85.5%) | 9 (14.5%) |
| Enterprise Management | 0 (0.0%) | 0 (0.0%) |
| Administrative & Support | 16 (59.3%) | 11 (40.7%) |
| Educational Services | 47 (25.0%) | 141 (75.0%) |
| Health Care & Social Assistance | 45 (21.8%) | 161 (78.2%) |
| Arts, Entertainment & Recreation | 0 (0.0%) | 24 (100.0%) |
| Accommodation & Food Services | 14 (19.7%) | 57 (80.3%) |
| Public Administration | 66 (68.8%) | 30 (31.2%) |
| Total | 628 (48.6%) | 664 (51.4%) |
Education in Coquille
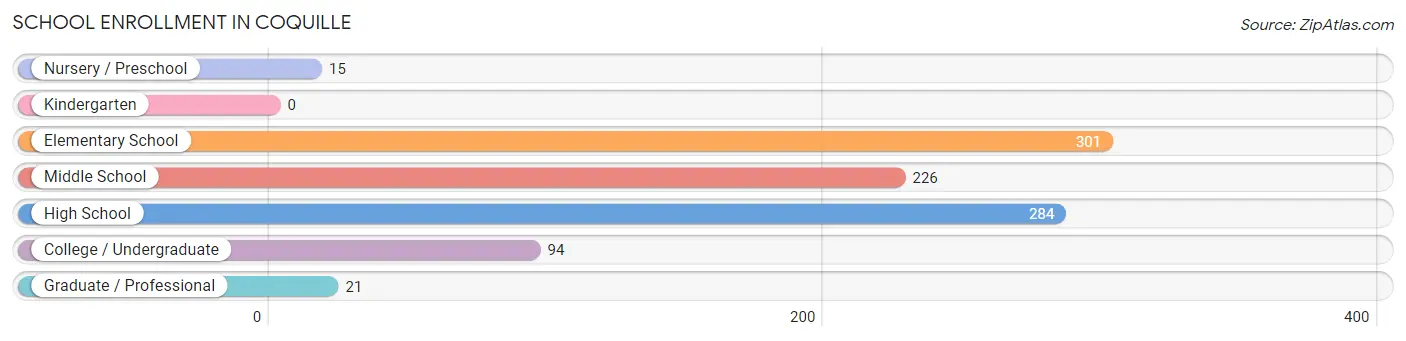
School Enrollment in Coquille
The most common levels of schooling among the 941 students in Coquille are elementary school (301 | 32.0%), high school (284 | 30.2%), and middle school (226 | 24.0%).
| School Level | # Students | % Students |
| Nursery / Preschool | 15 | 1.6% |
| Kindergarten | 0 | 0.0% |
| Elementary School | 301 | 32.0% |
| Middle School | 226 | 24.0% |
| High School | 284 | 30.2% |
| College / Undergraduate | 94 | 10.0% |
| Graduate / Professional | 21 | 2.2% |
| Total | 941 | 100.0% |
School Enrollment by Age by Funding Source in Coquille
Out of a total of 941 students who are enrolled in schools in Coquille, 115 (12.2%) attend a private institution, while the remaining 826 (87.8%) are enrolled in public schools. The age group of 5 to 9 year old has the highest likelihood of being enrolled in private schools, with 85 (28.2% in the age bracket) enrolled. Conversely, the age group of 3 to 4 year olds has the lowest likelihood of being enrolled in a private school, with 15 (100.0% in the age bracket) attending a public institution.
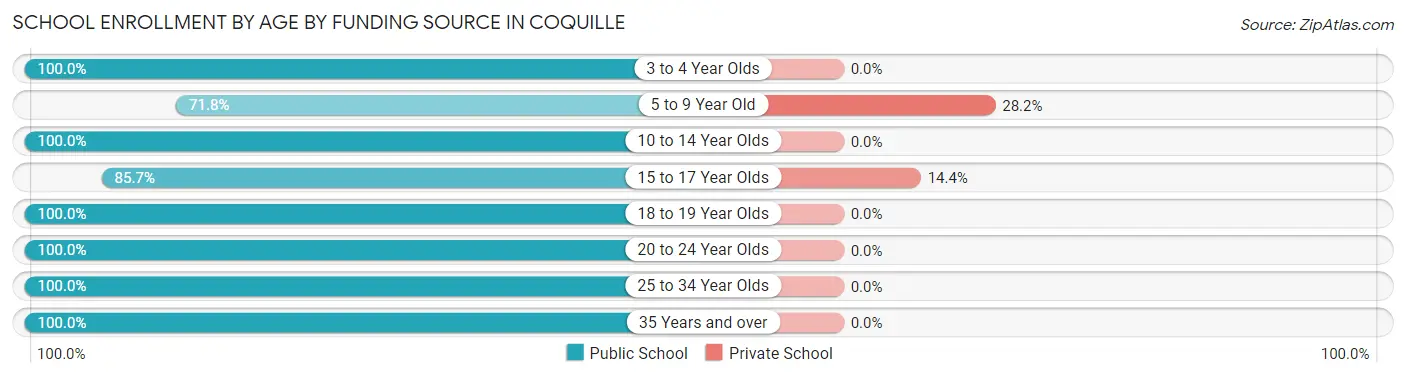
| Age Bracket | Public School | Private School |
| 3 to 4 Year Olds | 15 (100.0%) | 0 (0.0%) |
| 5 to 9 Year Old | 216 (71.8%) | 85 (28.2%) |
| 10 to 14 Year Olds | 250 (100.0%) | 0 (0.0%) |
| 15 to 17 Year Olds | 179 (85.7%) | 30 (14.3%) |
| 18 to 19 Year Olds | 68 (100.0%) | 0 (0.0%) |
| 20 to 24 Year Olds | 48 (100.0%) | 0 (0.0%) |
| 25 to 34 Year Olds | 17 (100.0%) | 0 (0.0%) |
| 35 Years and over | 33 (100.0%) | 0 (0.0%) |
| Total | 826 (87.8%) | 115 (12.2%) |
Educational Attainment by Field of Study in Coquille
Physical & health sciences (92 | 17.0%), science & technology (90 | 16.6%), liberal arts & history (88 | 16.3%), social sciences (70 | 12.9%), and communications (53 | 9.8%) are the most common fields of study among 541 individuals in Coquille who have obtained a bachelor's degree or higher.
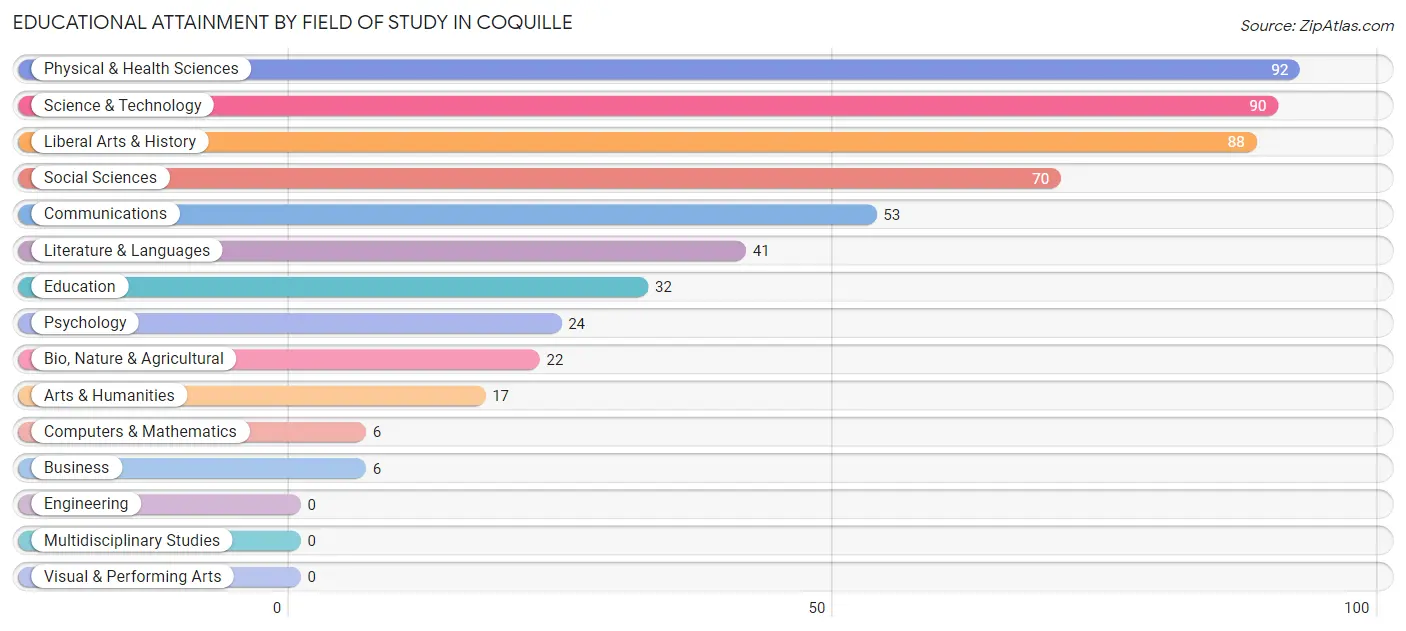
| Field of Study | # Graduates | % Graduates |
| Computers & Mathematics | 6 | 1.1% |
| Bio, Nature & Agricultural | 22 | 4.1% |
| Physical & Health Sciences | 92 | 17.0% |
| Psychology | 24 | 4.4% |
| Social Sciences | 70 | 12.9% |
| Engineering | 0 | 0.0% |
| Multidisciplinary Studies | 0 | 0.0% |
| Science & Technology | 90 | 16.6% |
| Business | 6 | 1.1% |
| Education | 32 | 5.9% |
| Literature & Languages | 41 | 7.6% |
| Liberal Arts & History | 88 | 16.3% |
| Visual & Performing Arts | 0 | 0.0% |
| Communications | 53 | 9.8% |
| Arts & Humanities | 17 | 3.1% |
| Total | 541 | 100.0% |
Transportation & Commute in Coquille
Vehicle Availability by Sex in Coquille
The most prevalent vehicle ownership categories in Coquille are males with 1 vehicle (244, accounting for 41.0%) and females with 1 vehicle (264, making up 36.7%).
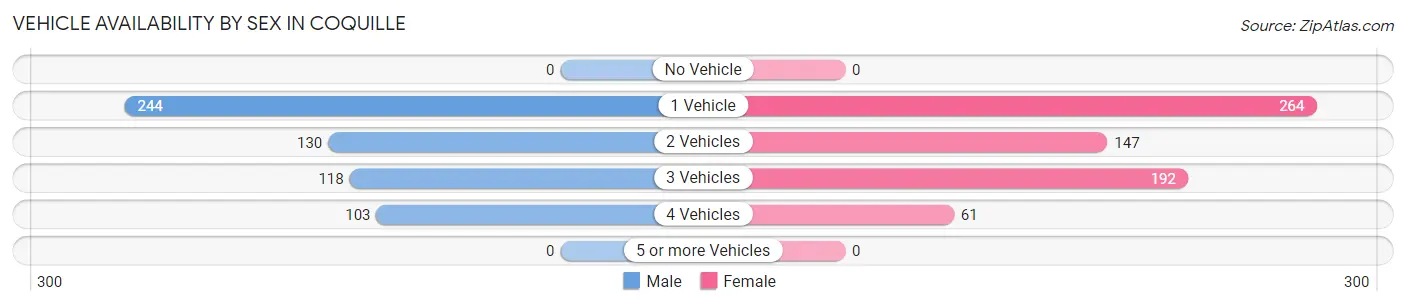
| Vehicles Available | Male | Female |
| No Vehicle | 0 (0.0%) | 0 (0.0%) |
| 1 Vehicle | 244 (41.0%) | 264 (39.8%) |
| 2 Vehicles | 130 (21.8%) | 147 (22.1%) |
| 3 Vehicles | 118 (19.8%) | 192 (28.9%) |
| 4 Vehicles | 103 (17.3%) | 61 (9.2%) |
| 5 or more Vehicles | 0 (0.0%) | 0 (0.0%) |
| Total | 595 (100.0%) | 664 (100.0%) |
Commute Time in Coquille
The most frequently occuring commute durations in Coquille are 5 to 9 minutes (368 commuters, 32.6%), 30 to 34 minutes (221 commuters, 19.6%), and 10 to 14 minutes (100 commuters, 8.9%).
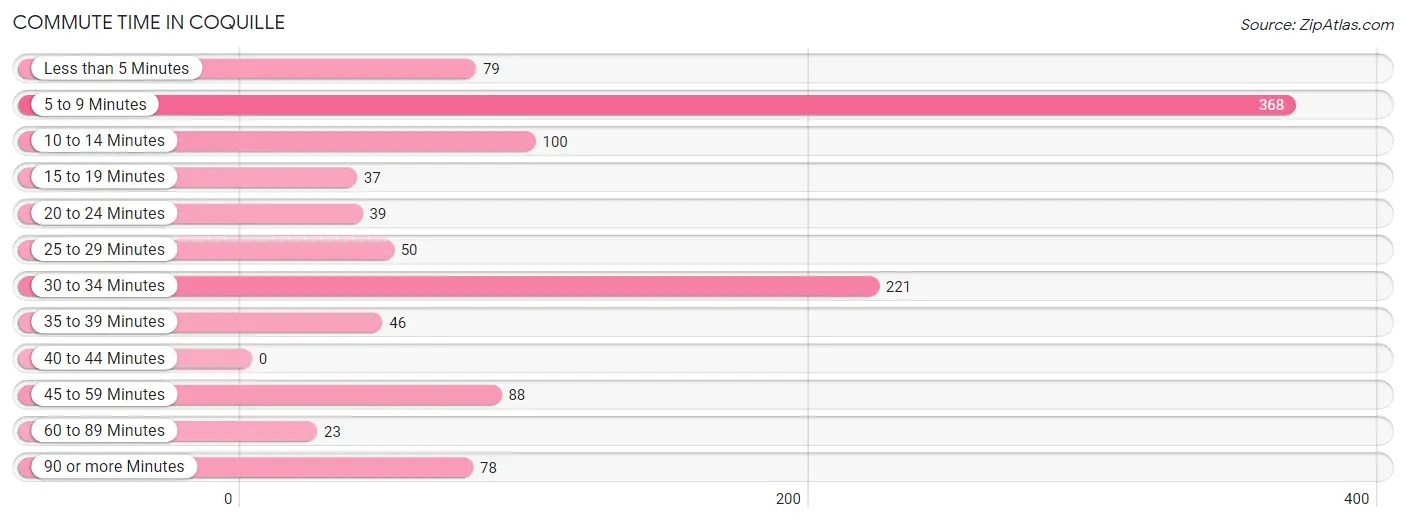
| Commute Time | # Commuters | % Commuters |
| Less than 5 Minutes | 79 | 7.0% |
| 5 to 9 Minutes | 368 | 32.6% |
| 10 to 14 Minutes | 100 | 8.9% |
| 15 to 19 Minutes | 37 | 3.3% |
| 20 to 24 Minutes | 39 | 3.5% |
| 25 to 29 Minutes | 50 | 4.4% |
| 30 to 34 Minutes | 221 | 19.6% |
| 35 to 39 Minutes | 46 | 4.1% |
| 40 to 44 Minutes | 0 | 0.0% |
| 45 to 59 Minutes | 88 | 7.8% |
| 60 to 89 Minutes | 23 | 2.0% |
| 90 or more Minutes | 78 | 6.9% |
Commute Time by Sex in Coquille
The most common commute times in Coquille are 5 to 9 minutes (243 commuters, 46.6%) for males and 30 to 34 minutes (185 commuters, 30.5%) for females.
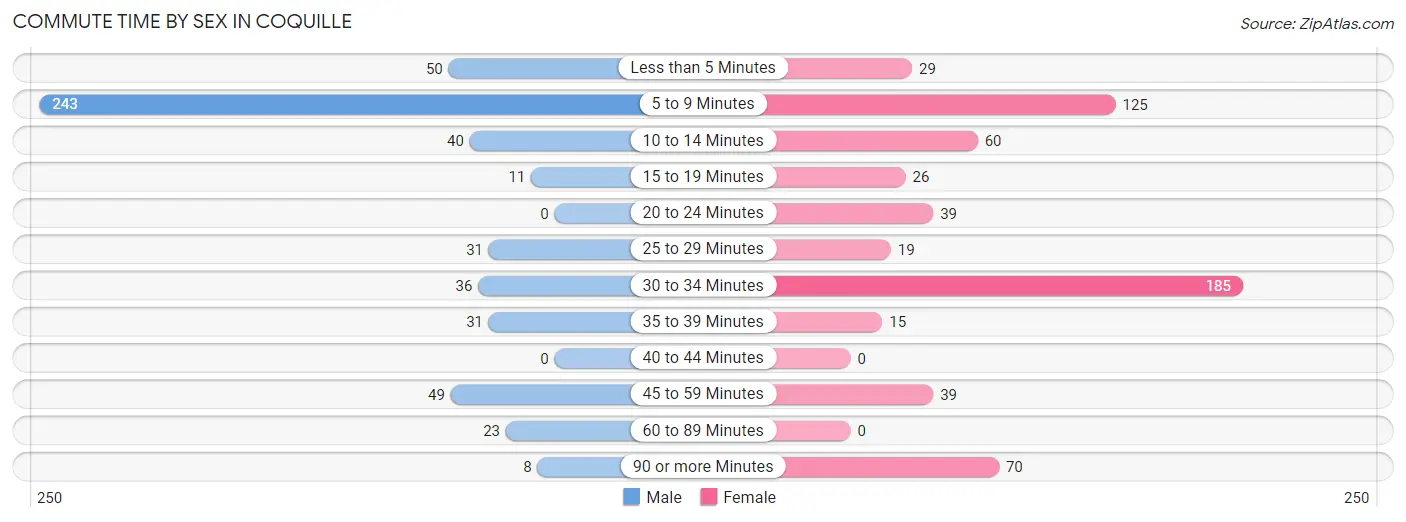
| Commute Time | Male | Female |
| Less than 5 Minutes | 50 (9.6%) | 29 (4.8%) |
| 5 to 9 Minutes | 243 (46.6%) | 125 (20.6%) |
| 10 to 14 Minutes | 40 (7.7%) | 60 (9.9%) |
| 15 to 19 Minutes | 11 (2.1%) | 26 (4.3%) |
| 20 to 24 Minutes | 0 (0.0%) | 39 (6.4%) |
| 25 to 29 Minutes | 31 (5.9%) | 19 (3.1%) |
| 30 to 34 Minutes | 36 (6.9%) | 185 (30.5%) |
| 35 to 39 Minutes | 31 (5.9%) | 15 (2.5%) |
| 40 to 44 Minutes | 0 (0.0%) | 0 (0.0%) |
| 45 to 59 Minutes | 49 (9.4%) | 39 (6.4%) |
| 60 to 89 Minutes | 23 (4.4%) | 0 (0.0%) |
| 90 or more Minutes | 8 (1.5%) | 70 (11.5%) |
Time of Departure to Work by Sex in Coquille
The most frequent times of departure to work in Coquille are 7:30 AM to 7:59 AM (112, 21.5%) for males and 7:00 AM to 7:29 AM (185, 30.5%) for females.
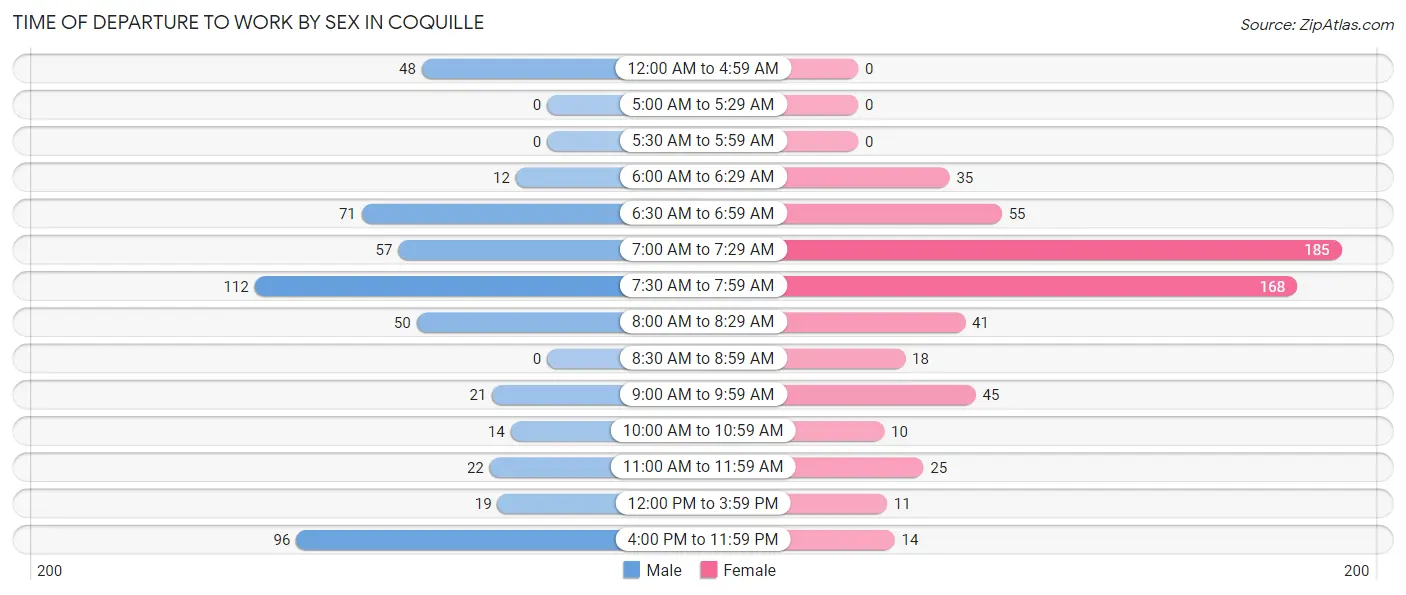
| Time of Departure | Male | Female |
| 12:00 AM to 4:59 AM | 48 (9.2%) | 0 (0.0%) |
| 5:00 AM to 5:29 AM | 0 (0.0%) | 0 (0.0%) |
| 5:30 AM to 5:59 AM | 0 (0.0%) | 0 (0.0%) |
| 6:00 AM to 6:29 AM | 12 (2.3%) | 35 (5.8%) |
| 6:30 AM to 6:59 AM | 71 (13.6%) | 55 (9.1%) |
| 7:00 AM to 7:29 AM | 57 (10.9%) | 185 (30.5%) |
| 7:30 AM to 7:59 AM | 112 (21.5%) | 168 (27.7%) |
| 8:00 AM to 8:29 AM | 50 (9.6%) | 41 (6.8%) |
| 8:30 AM to 8:59 AM | 0 (0.0%) | 18 (3.0%) |
| 9:00 AM to 9:59 AM | 21 (4.0%) | 45 (7.4%) |
| 10:00 AM to 10:59 AM | 14 (2.7%) | 10 (1.7%) |
| 11:00 AM to 11:59 AM | 22 (4.2%) | 25 (4.1%) |
| 12:00 PM to 3:59 PM | 19 (3.6%) | 11 (1.8%) |
| 4:00 PM to 11:59 PM | 96 (18.4%) | 14 (2.3%) |
| Total | 522 (100.0%) | 607 (100.0%) |
Housing Occupancy in Coquille
Occupancy by Ownership in Coquille
Of the total 1,670 dwellings in Coquille, owner-occupied units account for 1,240 (74.3%), while renter-occupied units make up 430 (25.8%).
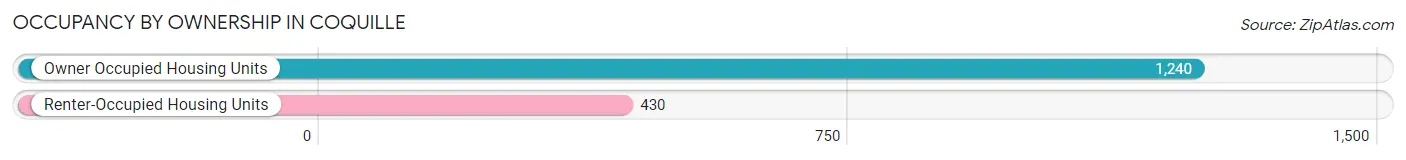
| Occupancy | # Housing Units | % Housing Units |
| Owner Occupied Housing Units | 1,240 | 74.3% |
| Renter-Occupied Housing Units | 430 | 25.8% |
| Total Occupied Housing Units | 1,670 | 100.0% |
Occupancy by Household Size in Coquille
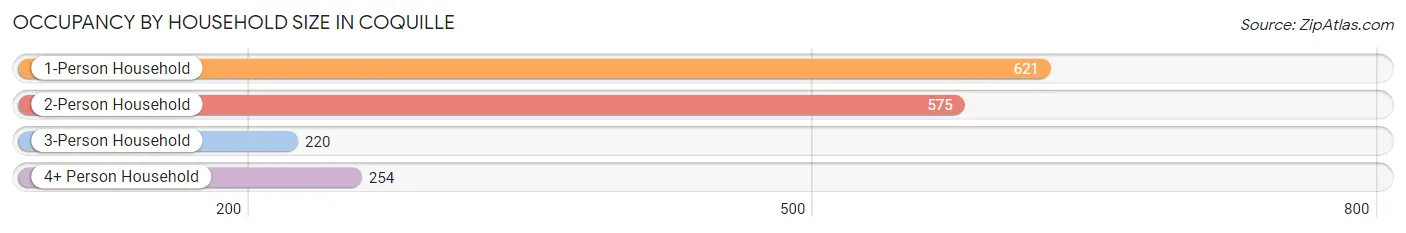
| Household Size | # Housing Units | % Housing Units |
| 1-Person Household | 621 | 37.2% |
| 2-Person Household | 575 | 34.4% |
| 3-Person Household | 220 | 13.2% |
| 4+ Person Household | 254 | 15.2% |
| Total Housing Units | 1,670 | 100.0% |
Occupancy by Ownership by Household Size in Coquille
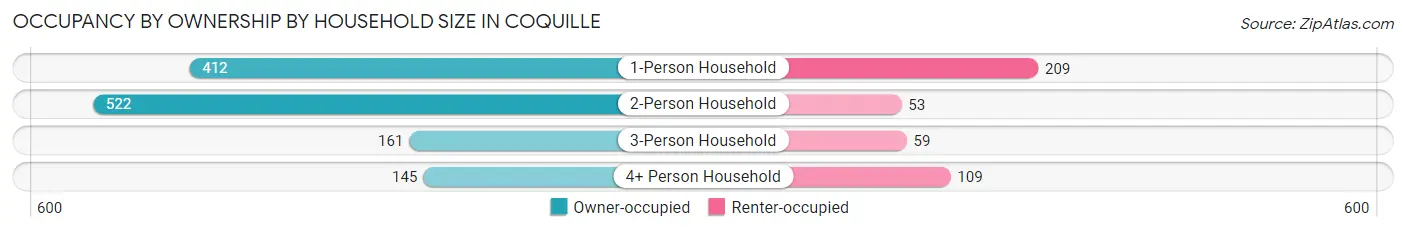
| Household Size | Owner-occupied | Renter-occupied |
| 1-Person Household | 412 (66.3%) | 209 (33.7%) |
| 2-Person Household | 522 (90.8%) | 53 (9.2%) |
| 3-Person Household | 161 (73.2%) | 59 (26.8%) |
| 4+ Person Household | 145 (57.1%) | 109 (42.9%) |
| Total Housing Units | 1,240 (74.3%) | 430 (25.8%) |
Occupancy by Educational Attainment in Coquille
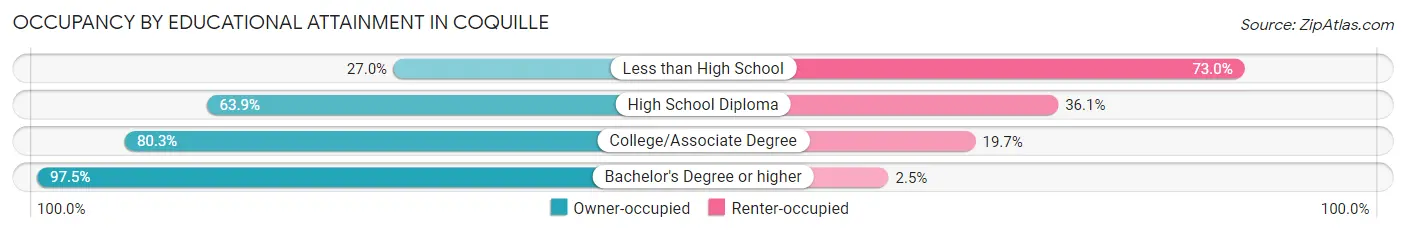
| Household Size | Owner-occupied | Renter-occupied |
| Less than High School | 51 (27.0%) | 138 (73.0%) |
| High School Diploma | 246 (63.9%) | 139 (36.1%) |
| College/Associate Degree | 587 (80.3%) | 144 (19.7%) |
| Bachelor's Degree or higher | 356 (97.5%) | 9 (2.5%) |
Occupancy by Age of Householder in Coquille
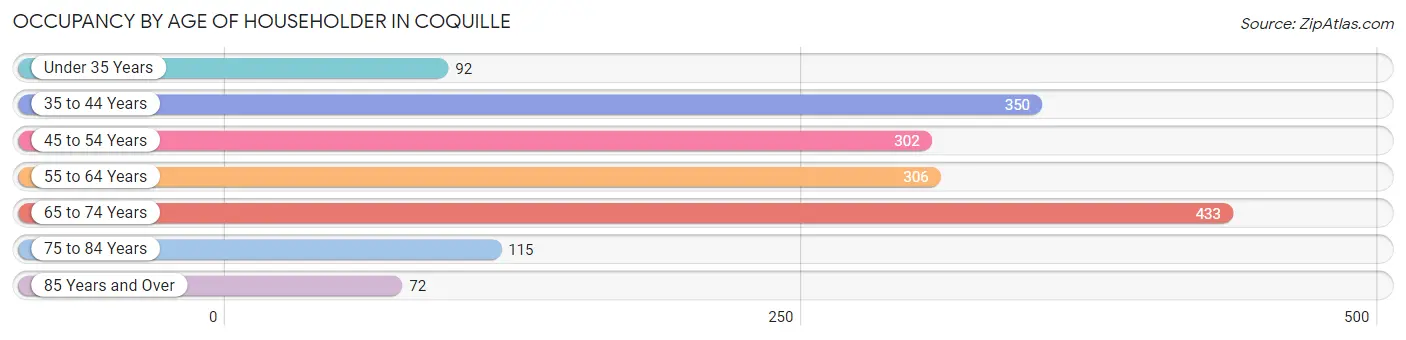
| Age Bracket | # Households | % Households |
| Under 35 Years | 92 | 5.5% |
| 35 to 44 Years | 350 | 21.0% |
| 45 to 54 Years | 302 | 18.1% |
| 55 to 64 Years | 306 | 18.3% |
| 65 to 74 Years | 433 | 25.9% |
| 75 to 84 Years | 115 | 6.9% |
| 85 Years and Over | 72 | 4.3% |
| Total | 1,670 | 100.0% |
Housing Finances in Coquille
Median Income by Occupancy in Coquille
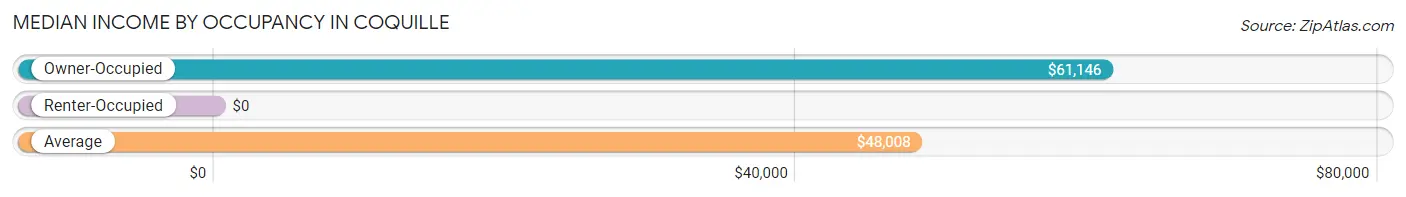
| Occupancy Type | # Households | Median Income |
| Owner-Occupied | 1,240 (74.3%) | $61,146 |
| Renter-Occupied | 430 (25.8%) | $0 |
| Average | 1,670 (100.0%) | $48,008 |
Occupancy by Householder Income Bracket in Coquille
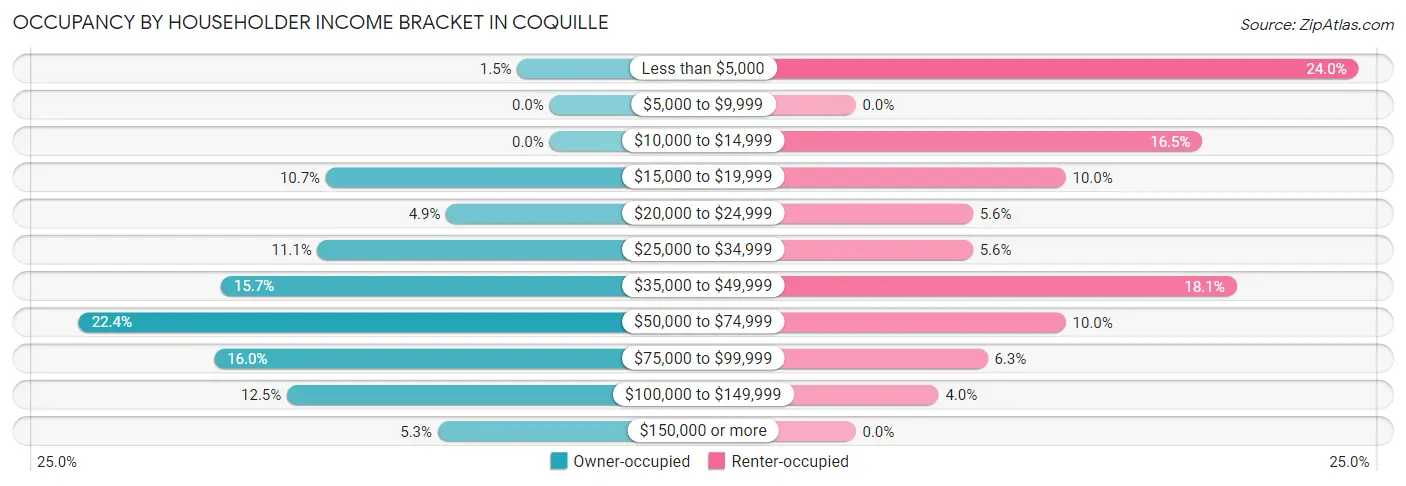
| Income Bracket | Owner-occupied | Renter-occupied |
| Less than $5,000 | 19 (1.5%) | 103 (23.9%) |
| $5,000 to $9,999 | 0 (0.0%) | 0 (0.0%) |
| $10,000 to $14,999 | 0 (0.0%) | 71 (16.5%) |
| $15,000 to $19,999 | 132 (10.6%) | 43 (10.0%) |
| $20,000 to $24,999 | 61 (4.9%) | 24 (5.6%) |
| $25,000 to $34,999 | 137 (11.1%) | 24 (5.6%) |
| $35,000 to $49,999 | 194 (15.7%) | 78 (18.1%) |
| $50,000 to $74,999 | 278 (22.4%) | 43 (10.0%) |
| $75,000 to $99,999 | 198 (16.0%) | 27 (6.3%) |
| $100,000 to $149,999 | 155 (12.5%) | 17 (4.0%) |
| $150,000 or more | 66 (5.3%) | 0 (0.0%) |
| Total | 1,240 (100.0%) | 430 (100.0%) |
Monthly Housing Cost Tiers in Coquille
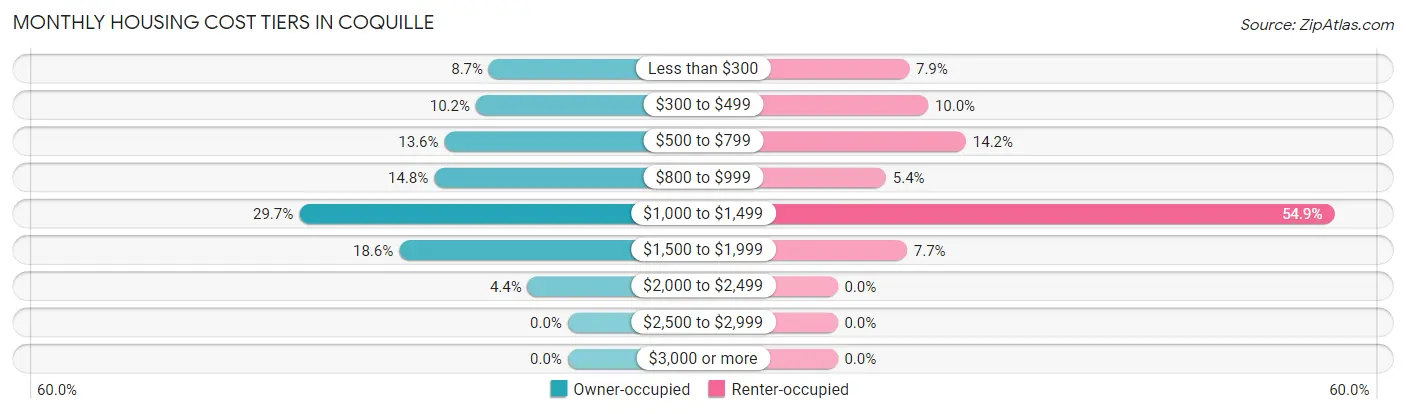
| Monthly Cost | Owner-occupied | Renter-occupied |
| Less than $300 | 108 (8.7%) | 34 (7.9%) |
| $300 to $499 | 126 (10.2%) | 43 (10.0%) |
| $500 to $799 | 169 (13.6%) | 61 (14.2%) |
| $800 to $999 | 183 (14.8%) | 23 (5.3%) |
| $1,000 to $1,499 | 368 (29.7%) | 236 (54.9%) |
| $1,500 to $1,999 | 231 (18.6%) | 33 (7.7%) |
| $2,000 to $2,499 | 55 (4.4%) | 0 (0.0%) |
| $2,500 to $2,999 | 0 (0.0%) | 0 (0.0%) |
| $3,000 or more | 0 (0.0%) | 0 (0.0%) |
| Total | 1,240 (100.0%) | 430 (100.0%) |
Physical Housing Characteristics in Coquille
Housing Structures in Coquille
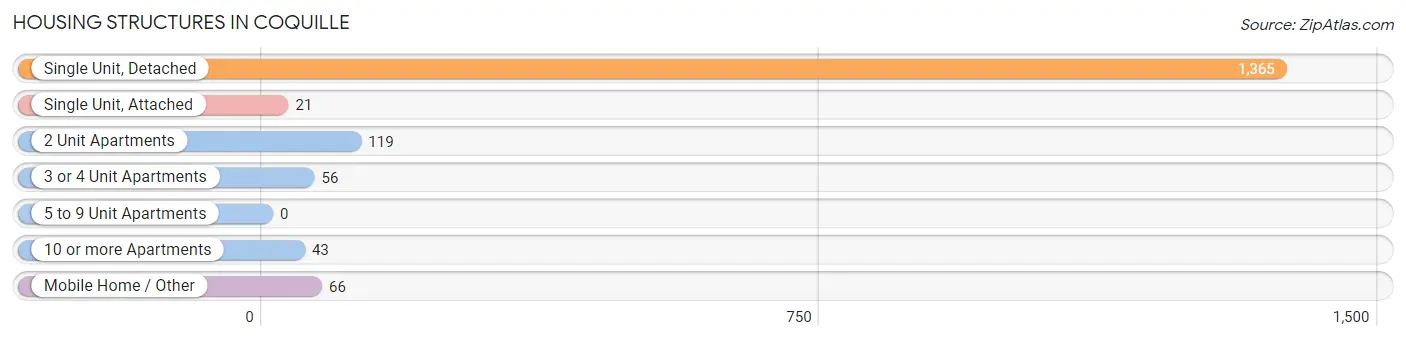
| Structure Type | # Housing Units | % Housing Units |
| Single Unit, Detached | 1,365 | 81.7% |
| Single Unit, Attached | 21 | 1.3% |
| 2 Unit Apartments | 119 | 7.1% |
| 3 or 4 Unit Apartments | 56 | 3.4% |
| 5 to 9 Unit Apartments | 0 | 0.0% |
| 10 or more Apartments | 43 | 2.6% |
| Mobile Home / Other | 66 | 4.0% |
| Total | 1,670 | 100.0% |
Housing Structures by Occupancy in Coquille
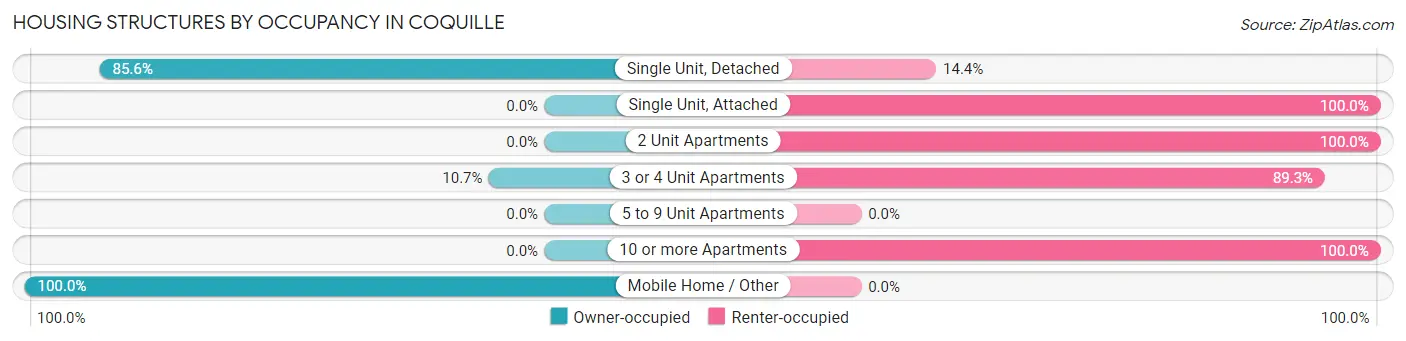
| Structure Type | Owner-occupied | Renter-occupied |
| Single Unit, Detached | 1,168 (85.6%) | 197 (14.4%) |
| Single Unit, Attached | 0 (0.0%) | 21 (100.0%) |
| 2 Unit Apartments | 0 (0.0%) | 119 (100.0%) |
| 3 or 4 Unit Apartments | 6 (10.7%) | 50 (89.3%) |
| 5 to 9 Unit Apartments | 0 (0.0%) | 0 (0.0%) |
| 10 or more Apartments | 0 (0.0%) | 43 (100.0%) |
| Mobile Home / Other | 66 (100.0%) | 0 (0.0%) |
| Total | 1,240 (74.3%) | 430 (25.8%) |
Housing Structures by Number of Rooms in Coquille
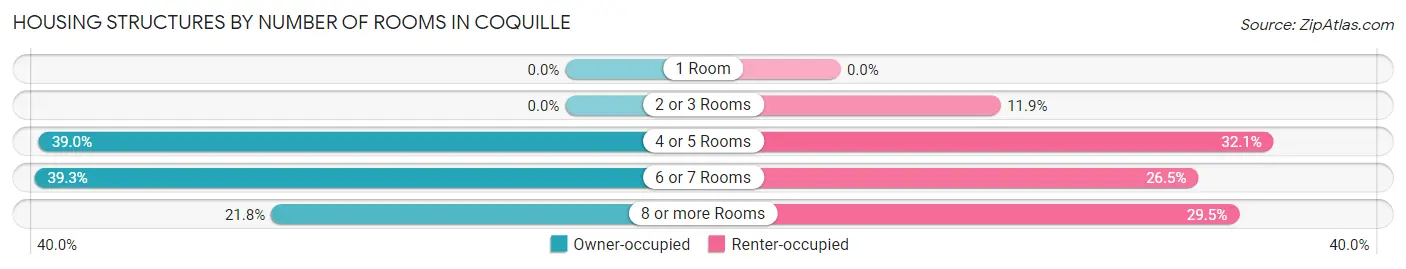
| Number of Rooms | Owner-occupied | Renter-occupied |
| 1 Room | 0 (0.0%) | 0 (0.0%) |
| 2 or 3 Rooms | 0 (0.0%) | 51 (11.9%) |
| 4 or 5 Rooms | 483 (39.0%) | 138 (32.1%) |
| 6 or 7 Rooms | 487 (39.3%) | 114 (26.5%) |
| 8 or more Rooms | 270 (21.8%) | 127 (29.5%) |
| Total | 1,240 (100.0%) | 430 (100.0%) |
Housing Structure by Heating Type in Coquille
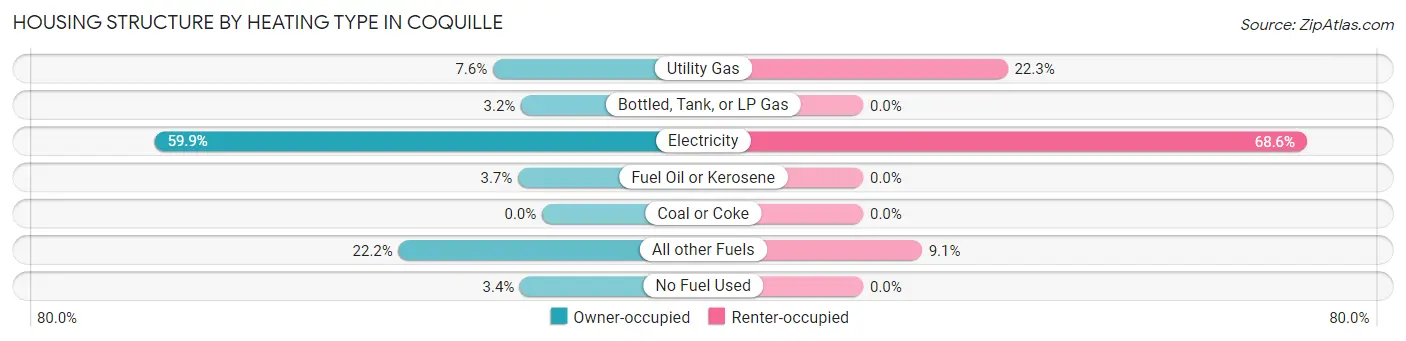
| Heating Type | Owner-occupied | Renter-occupied |
| Utility Gas | 94 (7.6%) | 96 (22.3%) |
| Bottled, Tank, or LP Gas | 40 (3.2%) | 0 (0.0%) |
| Electricity | 743 (59.9%) | 295 (68.6%) |
| Fuel Oil or Kerosene | 46 (3.7%) | 0 (0.0%) |
| Coal or Coke | 0 (0.0%) | 0 (0.0%) |
| All other Fuels | 275 (22.2%) | 39 (9.1%) |
| No Fuel Used | 42 (3.4%) | 0 (0.0%) |
| Total | 1,240 (100.0%) | 430 (100.0%) |
Household Vehicle Usage in Coquille
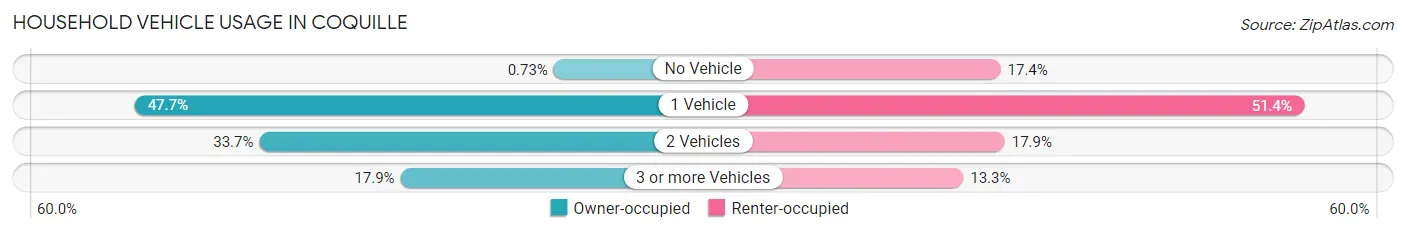
| Vehicles per Household | Owner-occupied | Renter-occupied |
| No Vehicle | 9 (0.7%) | 75 (17.4%) |
| 1 Vehicle | 591 (47.7%) | 221 (51.4%) |
| 2 Vehicles | 418 (33.7%) | 77 (17.9%) |
| 3 or more Vehicles | 222 (17.9%) | 57 (13.3%) |
| Total | 1,240 (100.0%) | 430 (100.0%) |
Real Estate & Mortgages in Coquille
Real Estate and Mortgage Overview in Coquille
| Characteristic | Without Mortgage | With Mortgage |
| Housing Units | 382 | 858 |
| Median Property Value | $187,200 | $233,500 |
| Median Household Income | $31,920 | $32 |
| Monthly Housing Costs | $458 | $0 |
| Real Estate Taxes | $2,242 | $6 |
Property Value by Mortgage Status in Coquille
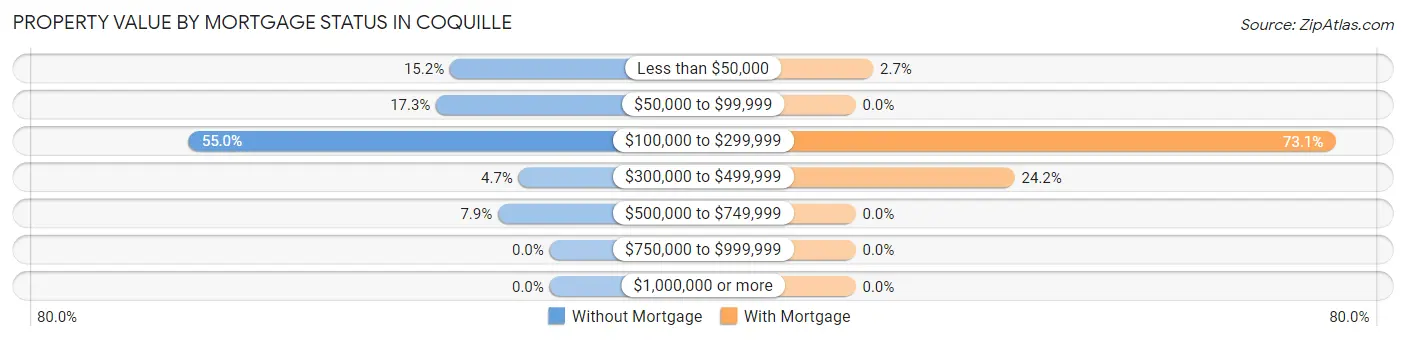
| Property Value | Without Mortgage | With Mortgage |
| Less than $50,000 | 58 (15.2%) | 23 (2.7%) |
| $50,000 to $99,999 | 66 (17.3%) | 0 (0.0%) |
| $100,000 to $299,999 | 210 (55.0%) | 627 (73.1%) |
| $300,000 to $499,999 | 18 (4.7%) | 208 (24.2%) |
| $500,000 to $749,999 | 30 (7.9%) | 0 (0.0%) |
| $750,000 to $999,999 | 0 (0.0%) | 0 (0.0%) |
| $1,000,000 or more | 0 (0.0%) | 0 (0.0%) |
| Total | 382 (100.0%) | 858 (100.0%) |
Household Income by Mortgage Status in Coquille
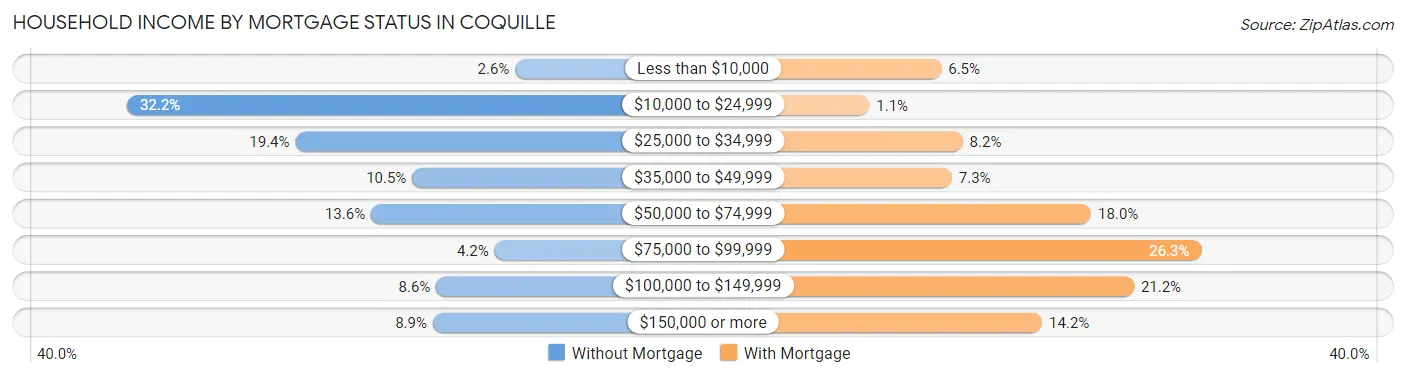
| Household Income | Without Mortgage | With Mortgage |
| Less than $10,000 | 10 (2.6%) | 56 (6.5%) |
| $10,000 to $24,999 | 123 (32.2%) | 9 (1.1%) |
| $25,000 to $34,999 | 74 (19.4%) | 70 (8.2%) |
| $35,000 to $49,999 | 40 (10.5%) | 63 (7.3%) |
| $50,000 to $74,999 | 52 (13.6%) | 154 (17.9%) |
| $75,000 to $99,999 | 16 (4.2%) | 226 (26.3%) |
| $100,000 to $149,999 | 33 (8.6%) | 182 (21.2%) |
| $150,000 or more | 34 (8.9%) | 122 (14.2%) |
| Total | 382 (100.0%) | 858 (100.0%) |
Property Value to Household Income Ratio in Coquille
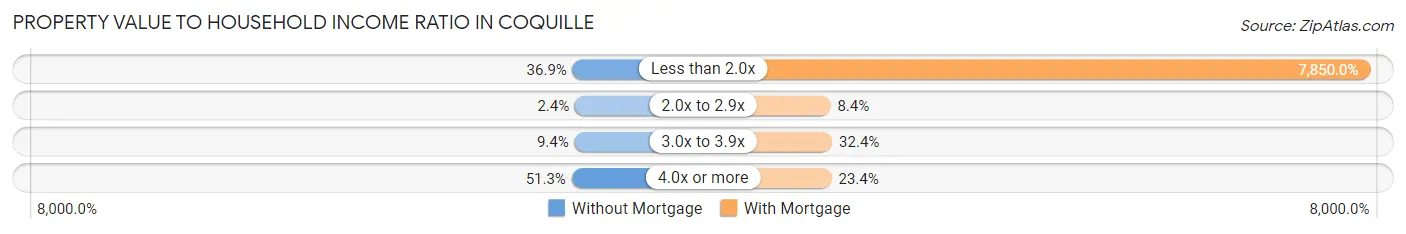
| Value-to-Income Ratio | Without Mortgage | With Mortgage |
| Less than 2.0x | 141 (36.9%) | 67,353 (7,850.0%) |
| 2.0x to 2.9x | 9 (2.4%) | 72 (8.4%) |
| 3.0x to 3.9x | 36 (9.4%) | 278 (32.4%) |
| 4.0x or more | 196 (51.3%) | 201 (23.4%) |
| Total | 382 (100.0%) | 858 (100.0%) |
Real Estate Taxes by Mortgage Status in Coquille
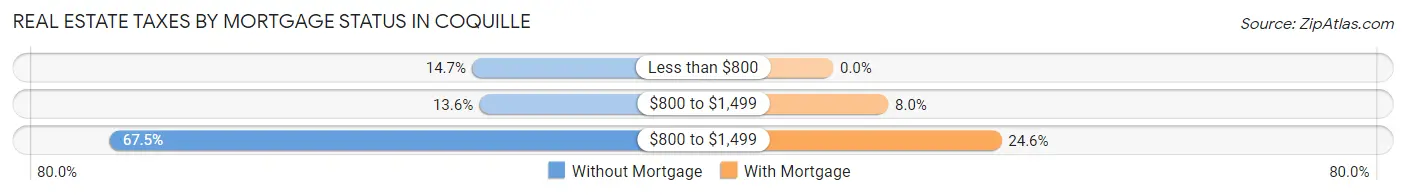
| Property Taxes | Without Mortgage | With Mortgage |
| Less than $800 | 56 (14.7%) | 0 (0.0%) |
| $800 to $1,499 | 52 (13.6%) | 69 (8.0%) |
| $800 to $1,499 | 258 (67.5%) | 211 (24.6%) |
| Total | 382 (100.0%) | 858 (100.0%) |
Health & Disability in Coquille
Health Insurance Coverage by Age in Coquille
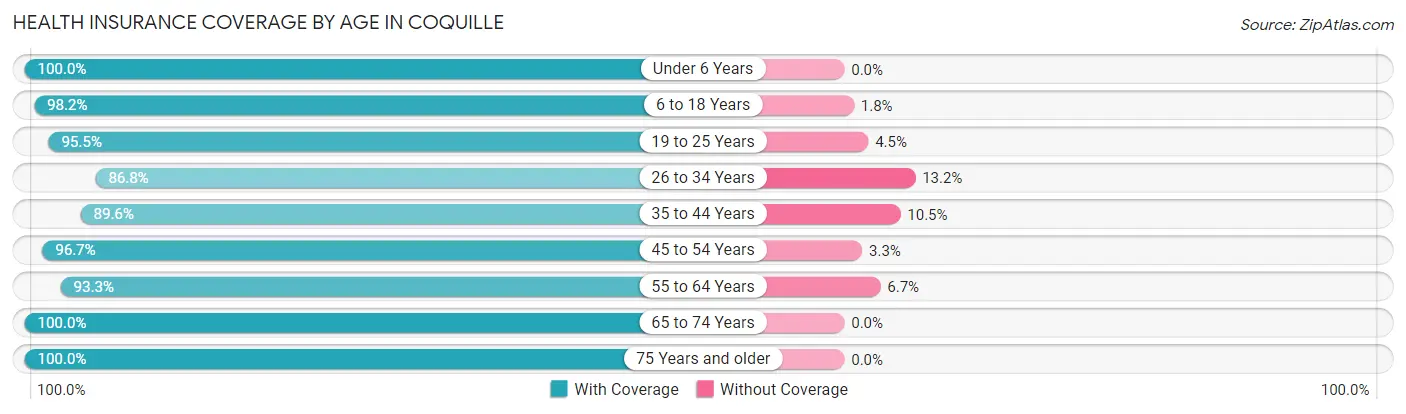
| Age Bracket | With Coverage | Without Coverage |
| Under 6 Years | 239 (100.0%) | 0 (0.0%) |
| 6 to 18 Years | 829 (98.2%) | 15 (1.8%) |
| 19 to 25 Years | 193 (95.5%) | 9 (4.5%) |
| 26 to 34 Years | 105 (86.8%) | 16 (13.2%) |
| 35 to 44 Years | 480 (89.5%) | 56 (10.4%) |
| 45 to 54 Years | 437 (96.7%) | 15 (3.3%) |
| 55 to 64 Years | 416 (93.3%) | 30 (6.7%) |
| 65 to 74 Years | 667 (100.0%) | 0 (0.0%) |
| 75 Years and older | 408 (100.0%) | 0 (0.0%) |
| Total | 3,774 (96.4%) | 141 (3.6%) |
Health Insurance Coverage by Citizenship Status in Coquille
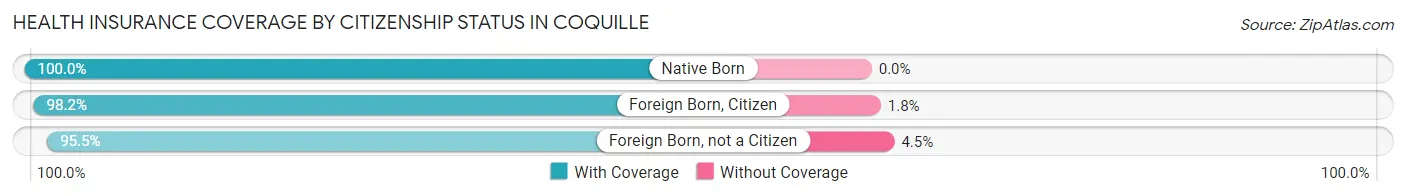
| Citizenship Status | With Coverage | Without Coverage |
| Native Born | 239 (100.0%) | 0 (0.0%) |
| Foreign Born, Citizen | 829 (98.2%) | 15 (1.8%) |
| Foreign Born, not a Citizen | 193 (95.5%) | 9 (4.5%) |
Health Insurance Coverage by Household Income in Coquille
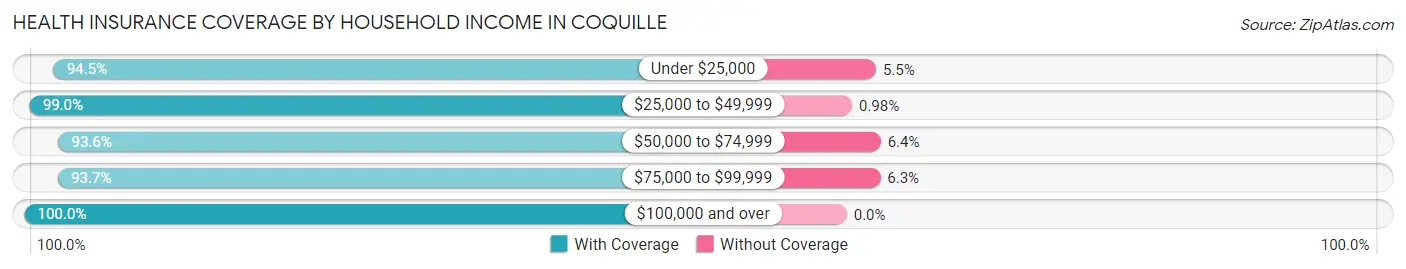
| Household Income | With Coverage | Without Coverage |
| Under $25,000 | 778 (94.5%) | 45 (5.5%) |
| $25,000 to $49,999 | 905 (99.0%) | 9 (1.0%) |
| $50,000 to $74,999 | 722 (93.6%) | 49 (6.4%) |
| $75,000 to $99,999 | 567 (93.7%) | 38 (6.3%) |
| $100,000 and over | 790 (100.0%) | 0 (0.0%) |
Public vs Private Health Insurance Coverage by Age in Coquille
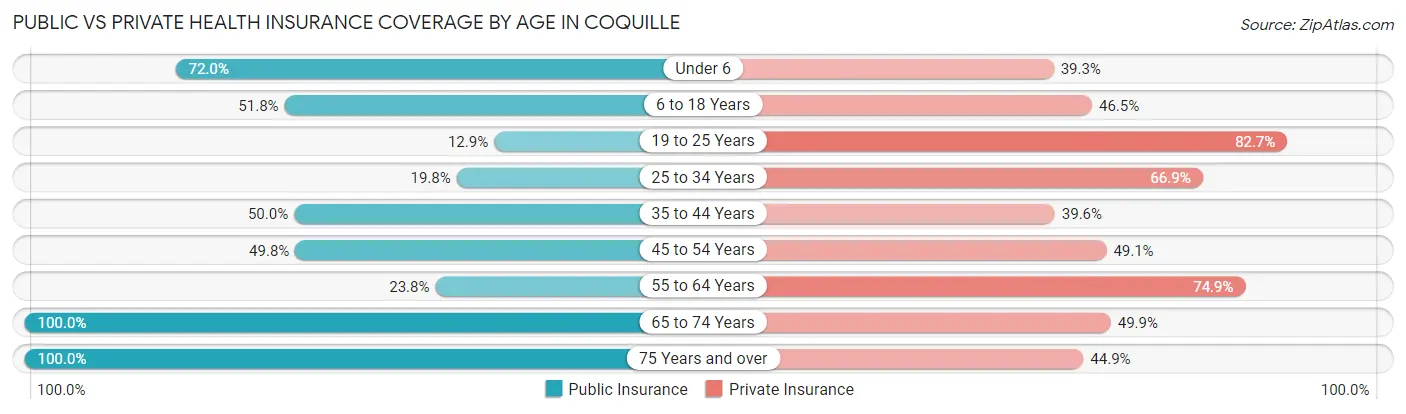
| Age Bracket | Public Insurance | Private Insurance |
| Under 6 | 172 (72.0%) | 94 (39.3%) |
| 6 to 18 Years | 437 (51.8%) | 392 (46.5%) |
| 19 to 25 Years | 26 (12.9%) | 167 (82.7%) |
| 25 to 34 Years | 24 (19.8%) | 81 (66.9%) |
| 35 to 44 Years | 268 (50.0%) | 212 (39.6%) |
| 45 to 54 Years | 225 (49.8%) | 222 (49.1%) |
| 55 to 64 Years | 106 (23.8%) | 334 (74.9%) |
| 65 to 74 Years | 667 (100.0%) | 333 (49.9%) |
| 75 Years and over | 408 (100.0%) | 183 (44.9%) |
| Total | 2,333 (59.6%) | 2,018 (51.5%) |
Disability Status by Sex by Age in Coquille
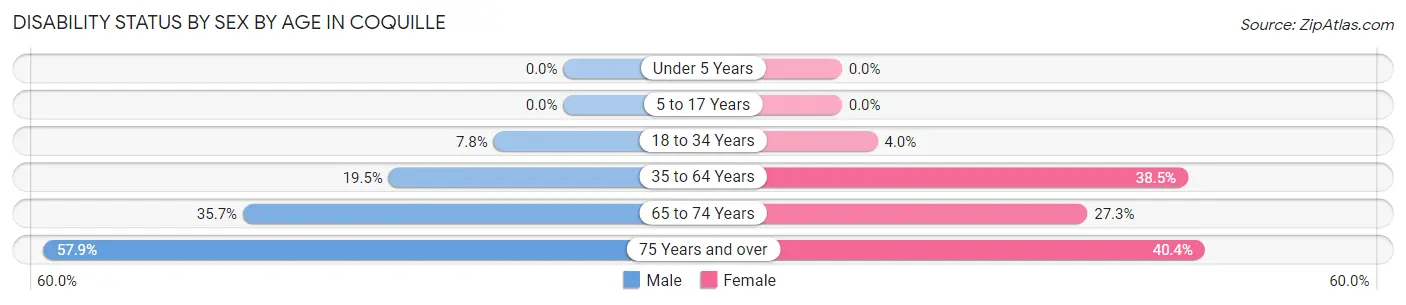
| Age Bracket | Male | Female |
| Under 5 Years | 0 (0.0%) | 0 (0.0%) |
| 5 to 17 Years | 0 (0.0%) | 0 (0.0%) |
| 18 to 34 Years | 16 (7.8%) | 8 (4.0%) |
| 35 to 64 Years | 127 (19.5%) | 301 (38.5%) |
| 65 to 74 Years | 101 (35.7%) | 105 (27.3%) |
| 75 Years and over | 70 (57.9%) | 116 (40.4%) |
Disability Class by Sex by Age in Coquille
Disability Class: Hearing Difficulty
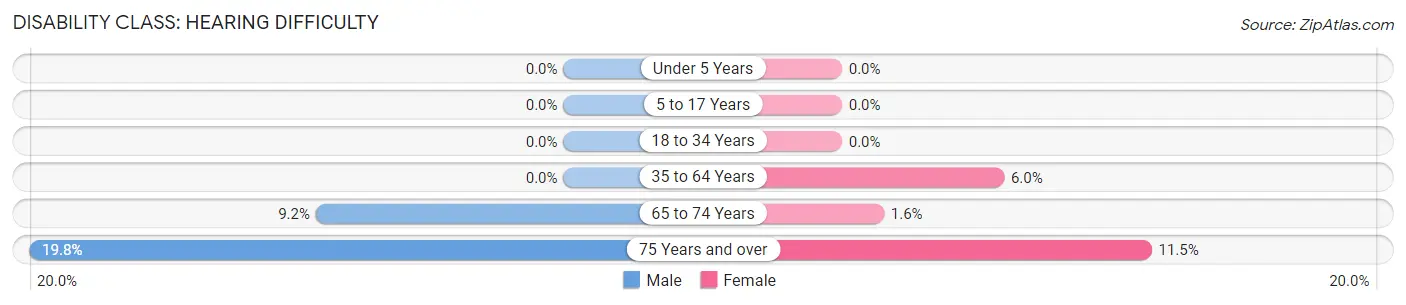
| Age Bracket | Male | Female |
| Under 5 Years | 0 (0.0%) | 0 (0.0%) |
| 5 to 17 Years | 0 (0.0%) | 0 (0.0%) |
| 18 to 34 Years | 0 (0.0%) | 0 (0.0%) |
| 35 to 64 Years | 0 (0.0%) | 47 (6.0%) |
| 65 to 74 Years | 26 (9.2%) | 6 (1.6%) |
| 75 Years and over | 24 (19.8%) | 33 (11.5%) |
Disability Class: Vision Difficulty
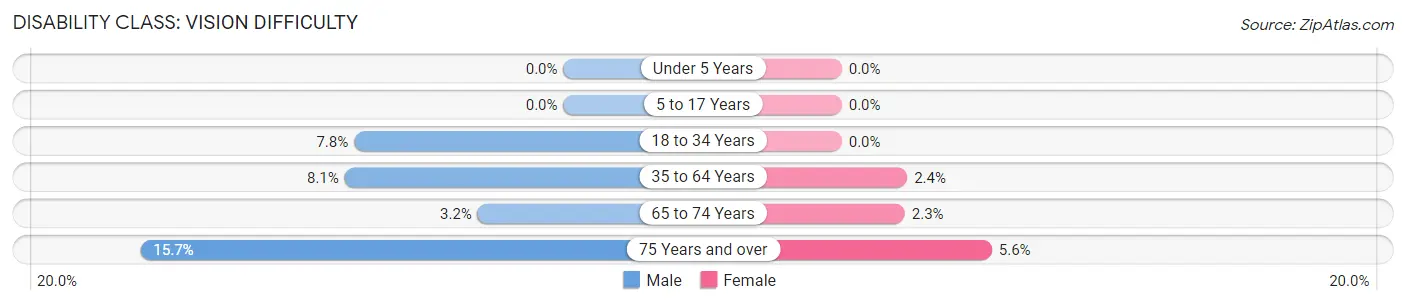
| Age Bracket | Male | Female |
| Under 5 Years | 0 (0.0%) | 0 (0.0%) |
| 5 to 17 Years | 0 (0.0%) | 0 (0.0%) |
| 18 to 34 Years | 16 (7.8%) | 0 (0.0%) |
| 35 to 64 Years | 53 (8.1%) | 19 (2.4%) |
| 65 to 74 Years | 9 (3.2%) | 9 (2.3%) |
| 75 Years and over | 19 (15.7%) | 16 (5.6%) |
Disability Class: Cognitive Difficulty
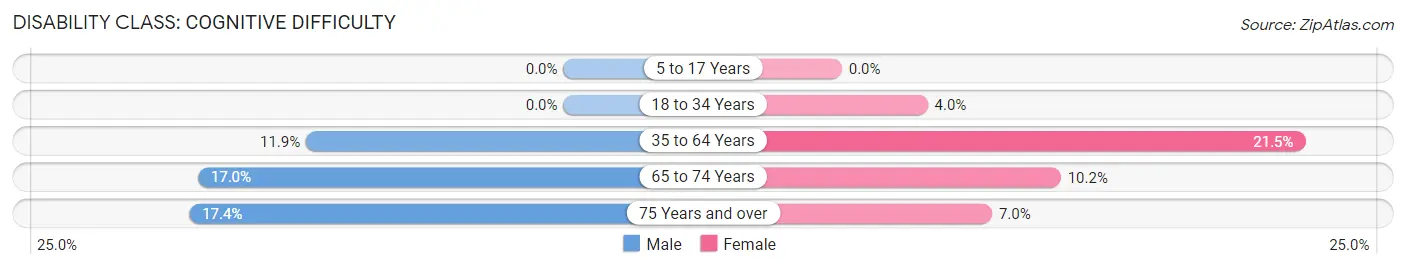
| Age Bracket | Male | Female |
| 5 to 17 Years | 0 (0.0%) | 0 (0.0%) |
| 18 to 34 Years | 0 (0.0%) | 8 (4.0%) |
| 35 to 64 Years | 78 (11.9%) | 168 (21.5%) |
| 65 to 74 Years | 48 (17.0%) | 39 (10.2%) |
| 75 Years and over | 21 (17.4%) | 20 (7.0%) |
Disability Class: Ambulatory Difficulty
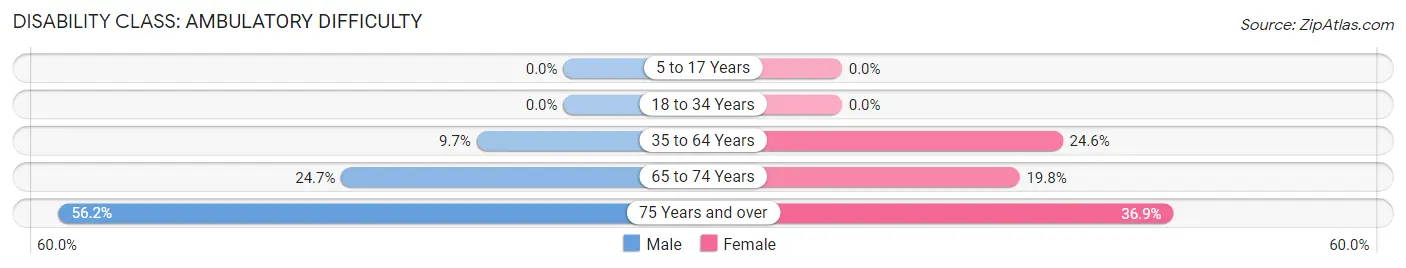
| Age Bracket | Male | Female |
| 5 to 17 Years | 0 (0.0%) | 0 (0.0%) |
| 18 to 34 Years | 0 (0.0%) | 0 (0.0%) |
| 35 to 64 Years | 63 (9.7%) | 192 (24.6%) |
| 65 to 74 Years | 70 (24.7%) | 76 (19.8%) |
| 75 Years and over | 68 (56.2%) | 106 (36.9%) |
Disability Class: Self-Care Difficulty
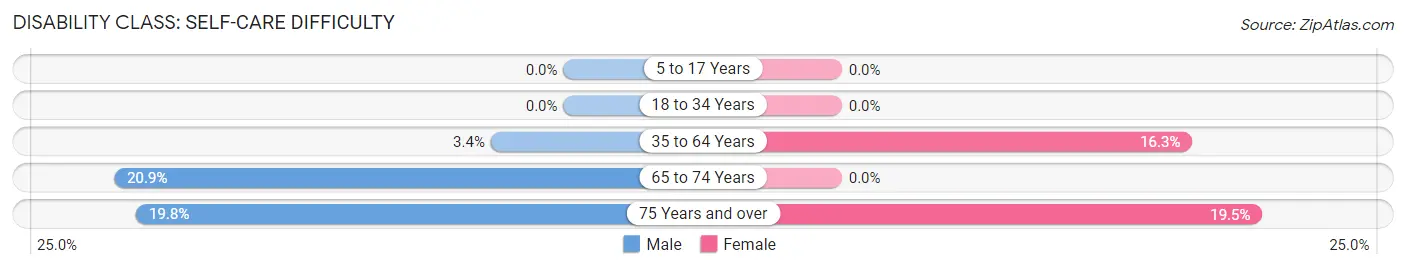
| Age Bracket | Male | Female |
| 5 to 17 Years | 0 (0.0%) | 0 (0.0%) |
| 18 to 34 Years | 0 (0.0%) | 0 (0.0%) |
| 35 to 64 Years | 22 (3.4%) | 127 (16.3%) |
| 65 to 74 Years | 59 (20.8%) | 0 (0.0%) |
| 75 Years and over | 24 (19.8%) | 56 (19.5%) |
Technology Access in Coquille
Computing Device Access in Coquille
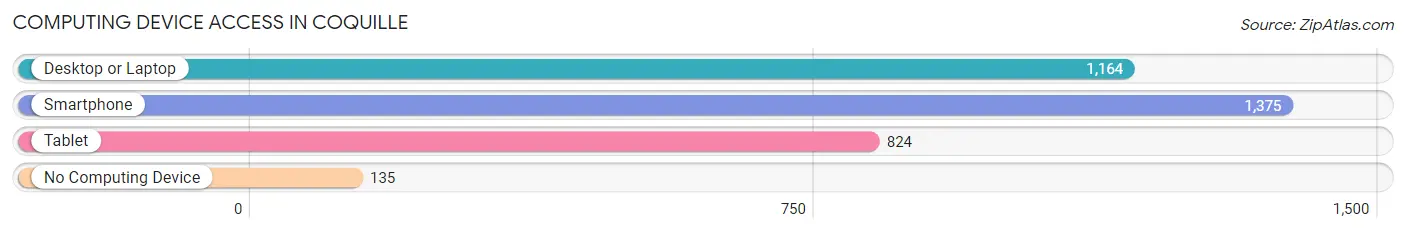
| Device Type | # Households | % Households |
| Desktop or Laptop | 1,164 | 69.7% |
| Smartphone | 1,375 | 82.3% |
| Tablet | 824 | 49.3% |
| No Computing Device | 135 | 8.1% |
| Total | 1,670 | 100.0% |
Internet Access in Coquille
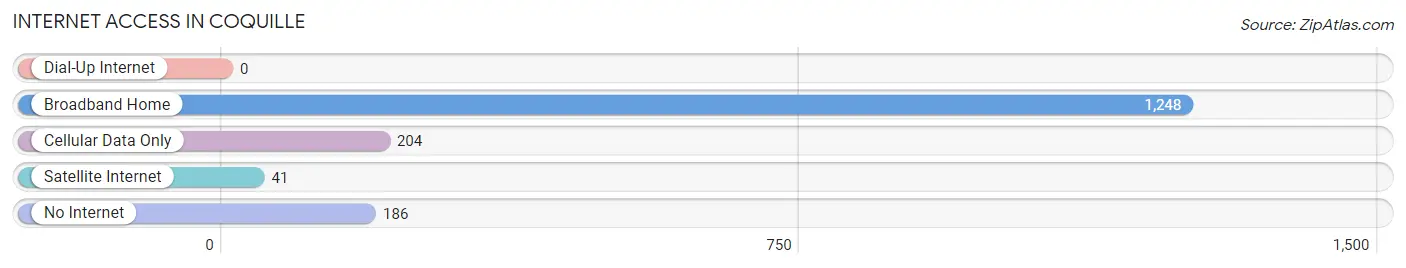
| Internet Type | # Households | % Households |
| Dial-Up Internet | 0 | 0.0% |
| Broadband Home | 1,248 | 74.7% |
| Cellular Data Only | 204 | 12.2% |
| Satellite Internet | 41 | 2.5% |
| No Internet | 186 | 11.1% |
| Total | 1,670 | 100.0% |
Coquille Summary
Coquille is a city located in Coos County, Oregon, United States. It is situated on the Coquille River, approximately 25 miles south of Coos Bay. The city is the county seat of Coos County and has a population of 3,921 as of the 2010 census.
History
The area that is now Coquille was originally inhabited by the Coquille Indians, a tribe of the Coos people. The first European settlers arrived in the area in the early 1850s, and the town of Coquille was officially established in 1853. The town was named after the Coquille River, which was named by French fur traders in the late 1700s.
The town grew slowly but steadily over the next few decades, and by the early 1900s, it had become a major logging center. The timber industry was the main source of employment for the town’s residents, and it remained so until the late 1970s.
In the late 1970s, the timber industry began to decline, and the town’s economy shifted to focus on tourism and recreation. The Coquille River was designated as a Wild and Scenic River in 1988, and the Coquille River State Park was established in 1989.
Geography
Coquille is located in the southern part of Coos County, approximately 25 miles south of Coos Bay. The city is situated on the Coquille River, and is surrounded by the Coquille National Forest. The city has a total area of 2.3 square miles, all of which is land.
The climate in Coquille is mild and temperate, with warm summers and cool winters. The average annual temperature is around 50 degrees Fahrenheit, and the average annual precipitation is around 50 inches.
Economy
The economy of Coquille is largely based on tourism and recreation. The Coquille River State Park is a major tourist attraction, and the city is also home to several other recreational activities, such as fishing, hunting, and camping.
The timber industry is still a major employer in the area, and the city is home to several lumber mills. The city is also home to several small businesses, including restaurants, retail stores, and service providers.
Demographics
As of the 2010 census, the population of Coquille was 3,921. The racial makeup of the city was 91.3% White, 0.7% African American, 1.2% Native American, 0.7% Asian, 0.1% Pacific Islander, 2.2% from other races, and 3.8% from two or more races. Hispanic or Latino of any race were 5.2% of the population.
The median household income in Coquille was $35,938, and the median family income was $41,944. The per capita income was $17,945. About 16.2% of the population was below the poverty line.
Coquille is a small city with a rich history and a diverse economy. The city is home to a variety of recreational activities, and its economy is largely based on tourism and recreation. The city is also home to several small businesses, and the timber industry is still a major employer in the area. The population of Coquille is diverse, and the median household income is slightly below the national average.
Common Questions
What is the Total Population of Coquille?
Total Population of Coquille is 4,009.
What is the Total Male Population of Coquille?
Total Male Population of Coquille is 1,797.
What is the Total Female Population of Coquille?
Total Female Population of Coquille is 2,212.
What is the Ratio of Males per 100 Females in Coquille?
There are 81.24 Males per 100 Females in Coquille.
What is the Ratio of Females per 100 Males in Coquille?
There are 123.09 Females per 100 Males in Coquille.
What is the Median Population Age in Coquille?
Median Population Age in Coquille is 45.0 Years.
What is the Average Family Size in Coquille
Average Family Size in Coquille is 3.0 People.
What is the Average Household Size in Coquille
Average Household Size in Coquille is 2.3 People.
What is Per Capita Income in Coquille?
Per Capita income in Coquille is $26,180.
What is the Median Family Income in Coquille?
Median Family Income in Coquille is $63,975.
What is the Median Household income in Coquille?
Median Household Income in Coquille is $48,008.
What is Income or Wage Gap in Coquille?
Income or Wage Gap in Coquille is 62.5%.
Women in Coquille earn 37.5 cents for every dollar earned by a man.
What is Inequality or Gini Index in Coquille?
Inequality or Gini Index in Coquille is 0.43.
How Large is the Labor Force in Coquille?
There are 1,375 People in the Labor Forcein in Coquille.
What is the Percentage of People in the Labor Force in Coquille?
43.8% of People are in the Labor Force in Coquille.
What is the Unemployment Rate in Coquille?
Unemployment Rate in Coquille is 6.0%.