Haines, OR
Haines Map
Haines Overview
220
TOTAL POPULATION
117
MALE POPULATION
103
FEMALE POPULATION
113.59
MALES / 100 FEMALES
88.03
FEMALES / 100 MALES
61.5
MEDIAN AGE
2.8
AVG FAMILY SIZE
1.9
AVG HOUSEHOLD SIZE
$27,629
PER CAPITA INCOME
$66,250
AVG FAMILY INCOME
$43,750
AVG HOUSEHOLD INCOME
0.41
INEQUALITY / GINI INDEX
100
LABOR FORCE [ PEOPLE ]
51.5%
PERCENT IN LABOR FORCE
16.0%
UNEMPLOYMENT RATE
Haines Zip Codes
Haines Area Codes
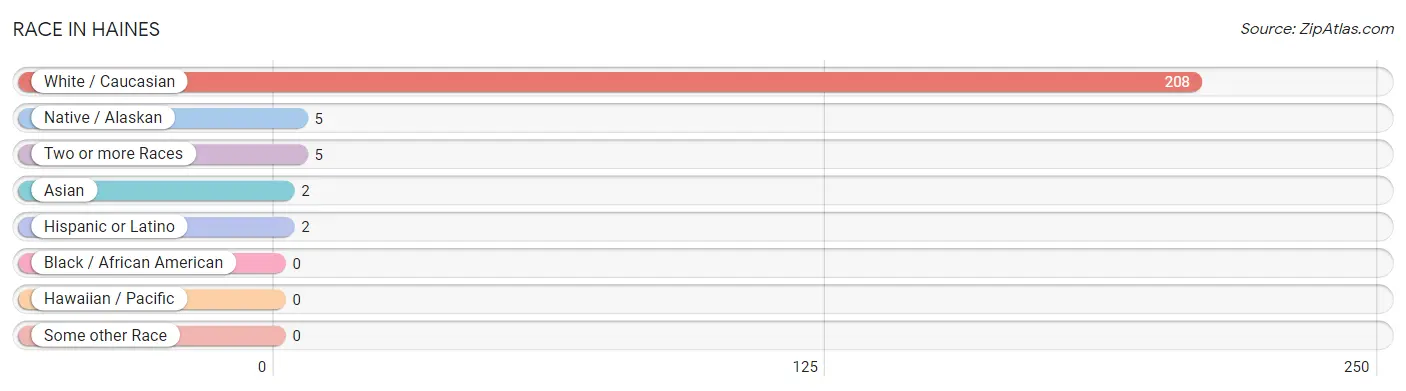
Race in Haines
The most populous races in Haines are White / Caucasian (208 | 94.6%), Native / Alaskan (5 | 2.3%), and Two or more Races (5 | 2.3%).
| Race | # Population | % Population |
| Asian | 2 | 0.9% |
| Black / African American | 0 | 0.0% |
| Hawaiian / Pacific | 0 | 0.0% |
| Hispanic or Latino | 2 | 0.9% |
| Native / Alaskan | 5 | 2.3% |
| White / Caucasian | 208 | 94.6% |
| Two or more Races | 5 | 2.3% |
| Some other Race | 0 | 0.0% |
| Total | 220 | 100.0% |
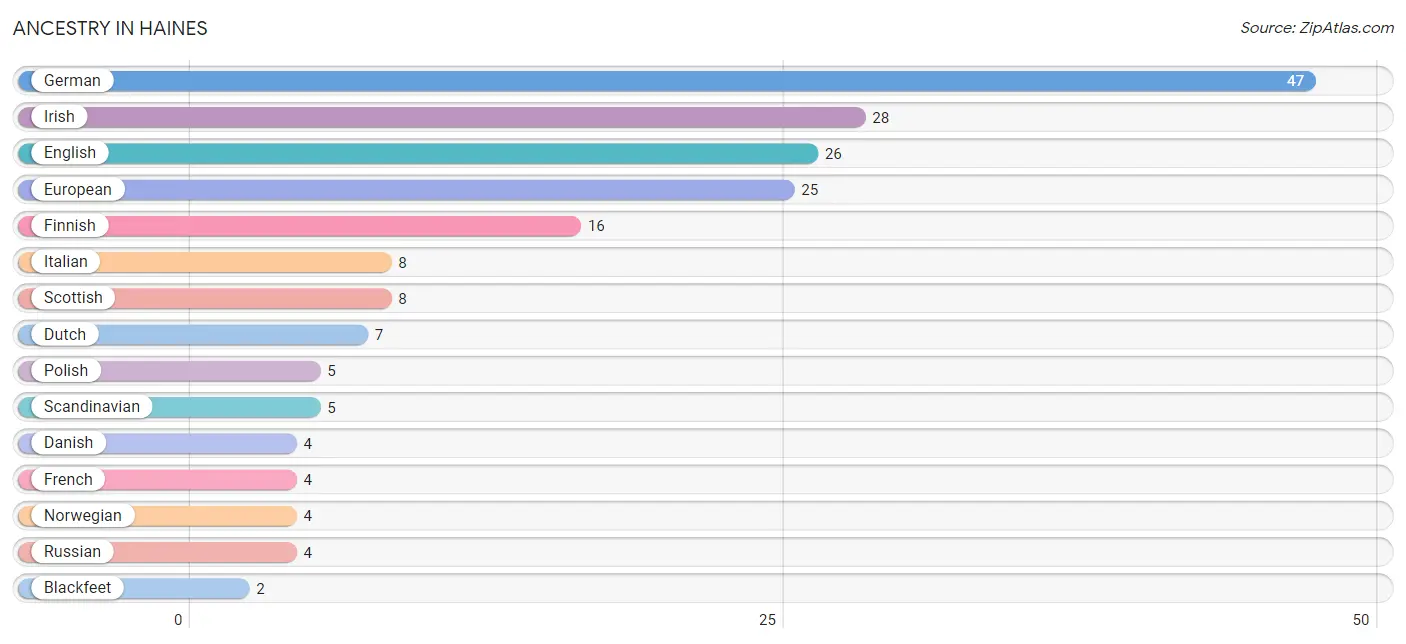
Ancestry in Haines
The most populous ancestries reported in Haines are German (47 | 21.4%), Irish (28 | 12.7%), English (26 | 11.8%), European (25 | 11.4%), and Finnish (16 | 7.3%), together accounting for 64.5% of all Haines residents.
| Ancestry | # Population | % Population |
| Blackfeet | 2 | 0.9% |
| Danish | 4 | 1.8% |
| Dutch | 7 | 3.2% |
| English | 26 | 11.8% |
| European | 25 | 11.4% |
| Finnish | 16 | 7.3% |
| French | 4 | 1.8% |
| German | 47 | 21.4% |
| Indian (Asian) | 2 | 0.9% |
| Irish | 28 | 12.7% |
| Italian | 8 | 3.6% |
| Mexican | 2 | 0.9% |
| Nigerian | 2 | 0.9% |
| Norwegian | 4 | 1.8% |
| Pennsylvania German | 2 | 0.9% |
| Polish | 5 | 2.3% |
| Russian | 4 | 1.8% |
| Scandinavian | 5 | 2.3% |
| Scottish | 8 | 3.6% |
| Subsaharan African | 2 | 0.9% | View All 20 Rows |
Immigrants in Haines
The most numerous immigrant groups reported in Haines came from , and Canada (2 | 0.9%), together accounting for 0.9% of all Haines residents.

| Immigration Origin | # Population | % Population |
| Canada | 2 | 0.9% | View All 1 Rows |
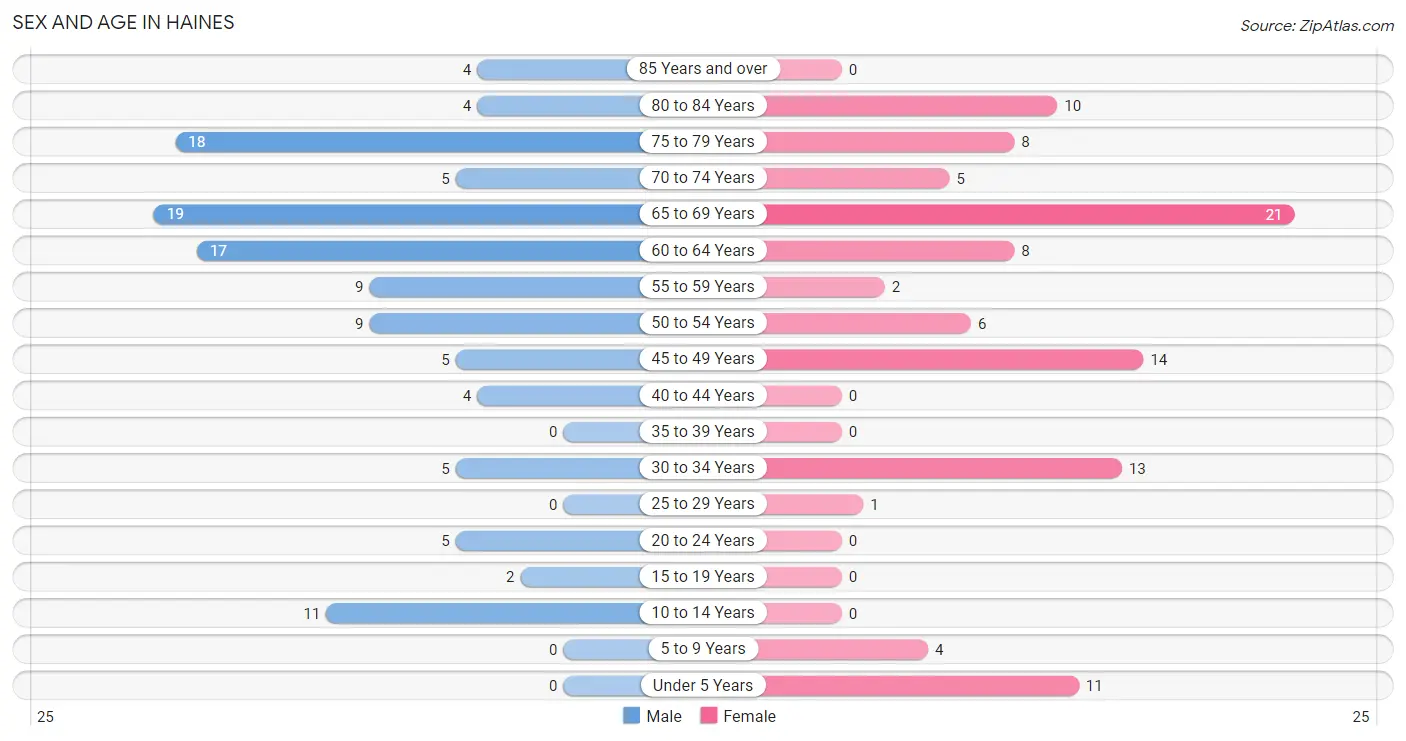
Sex and Age in Haines
Sex and Age in Haines
The most populous age groups in Haines are 65 to 69 Years (19 | 16.2%) for men and 65 to 69 Years (21 | 20.4%) for women.
| Age Bracket | Male | Female |
| Under 5 Years | 0 (0.0%) | 11 (10.7%) |
| 5 to 9 Years | 0 (0.0%) | 4 (3.9%) |
| 10 to 14 Years | 11 (9.4%) | 0 (0.0%) |
| 15 to 19 Years | 2 (1.7%) | 0 (0.0%) |
| 20 to 24 Years | 5 (4.3%) | 0 (0.0%) |
| 25 to 29 Years | 0 (0.0%) | 1 (1.0%) |
| 30 to 34 Years | 5 (4.3%) | 13 (12.6%) |
| 35 to 39 Years | 0 (0.0%) | 0 (0.0%) |
| 40 to 44 Years | 4 (3.4%) | 0 (0.0%) |
| 45 to 49 Years | 5 (4.3%) | 14 (13.6%) |
| 50 to 54 Years | 9 (7.7%) | 6 (5.8%) |
| 55 to 59 Years | 9 (7.7%) | 2 (1.9%) |
| 60 to 64 Years | 17 (14.5%) | 8 (7.8%) |
| 65 to 69 Years | 19 (16.2%) | 21 (20.4%) |
| 70 to 74 Years | 5 (4.3%) | 5 (4.9%) |
| 75 to 79 Years | 18 (15.4%) | 8 (7.8%) |
| 80 to 84 Years | 4 (3.4%) | 10 (9.7%) |
| 85 Years and over | 4 (3.4%) | 0 (0.0%) |
| Total | 117 (100.0%) | 103 (100.0%) |
Families and Households in Haines
Median Family Size in Haines
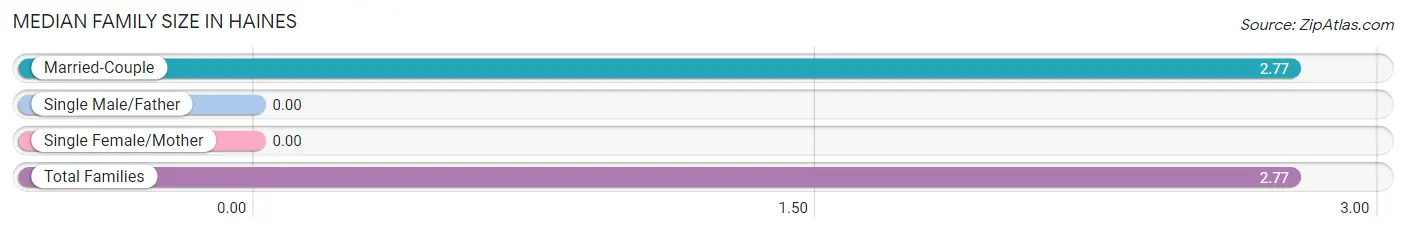
| Family Type | # Families | Family Size |
| Married-Couple | 48 (100.0%) | 2.77 |
| Single Male/Father | 0 (0.0%) | - |
| Single Female/Mother | 0 (0.0%) | - |
| Total Families | 48 (100.0%) | 2.77 |
Median Household Size in Haines
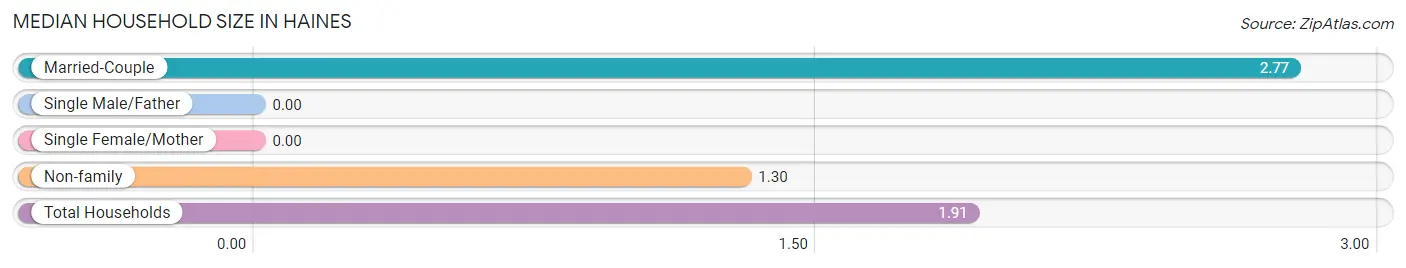
| Household Type | # Households | Household Size |
| Married-Couple | 48 (41.7%) | 2.77 |
| Single Male/Father | 0 (0.0%) | - |
| Single Female/Mother | 0 (0.0%) | - |
| Non-family | 67 (58.3%) | 1.30 |
| Total Households | 115 (100.0%) | 1.91 |
Household Size by Marriage Status in Haines
Out of a total of 115 households in Haines, 48 (41.7%) are family households, while 67 (58.3%) are nonfamily households. The most numerous type of family households are 2-person households, comprising 36, and the most common type of nonfamily households are 1-person households, comprising 59.
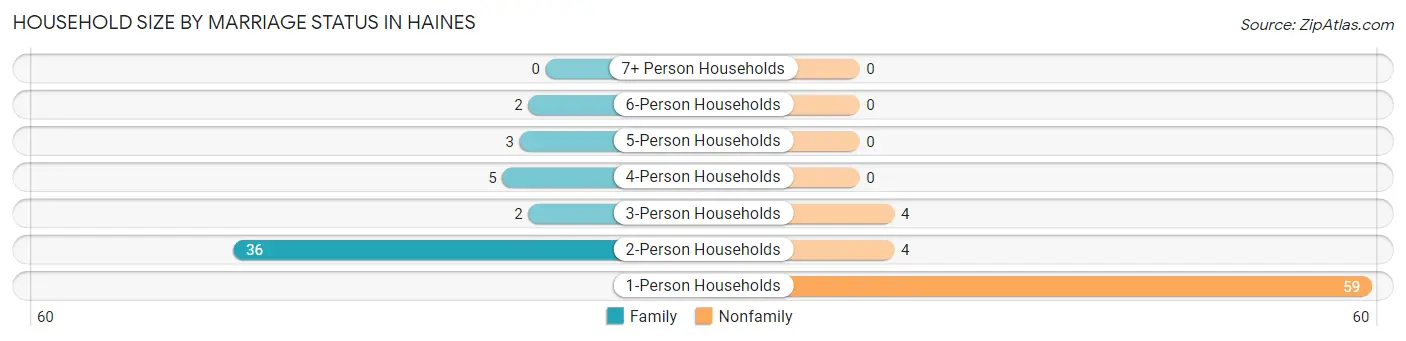
| Household Size | Family Households | Nonfamily Households |
| 1-Person Households | - | 59 (51.3%) |
| 2-Person Households | 36 (31.3%) | 4 (3.5%) |
| 3-Person Households | 2 (1.7%) | 4 (3.5%) |
| 4-Person Households | 5 (4.3%) | 0 (0.0%) |
| 5-Person Households | 3 (2.6%) | 0 (0.0%) |
| 6-Person Households | 2 (1.7%) | 0 (0.0%) |
| 7+ Person Households | 0 (0.0%) | 0 (0.0%) |
| Total | 48 (41.7%) | 67 (58.3%) |
Female Fertility in Haines
Fertility by Age in Haines
Average fertility rate in Haines is 143.0 births per 1,000 women. Women in the age bracket of 20 to 34 years have the highest fertility rate with 286.0 births per 1,000 women. Women in the age bracket of 20 to 34 years acount for 100.0% of all women with births.
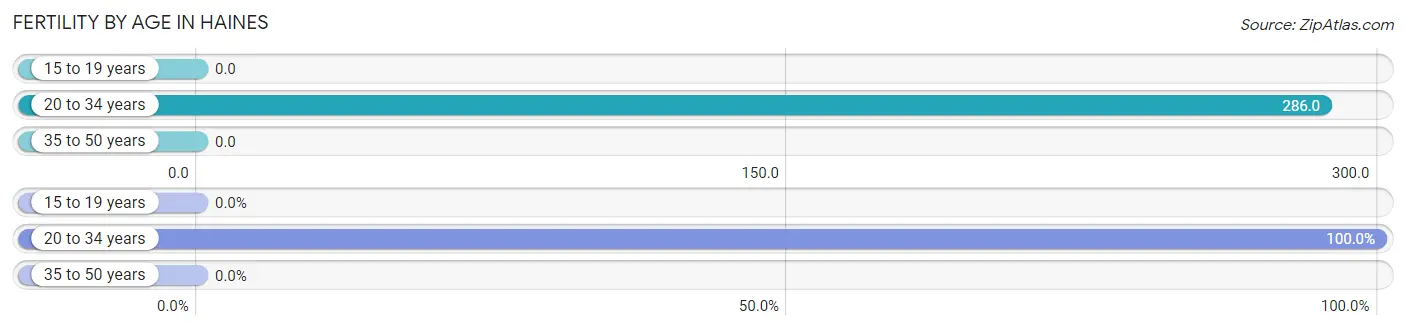
| Age Bracket | Women with Births | Births / 1,000 Women |
| 15 to 19 years | 0 (0.0%) | 0.0 |
| 20 to 34 years | 4 (100.0%) | 286.0 |
| 35 to 50 years | 0 (0.0%) | 0.0 |
| Total | 4 (100.0%) | 143.0 |
Fertility by Age by Marriage Status in Haines
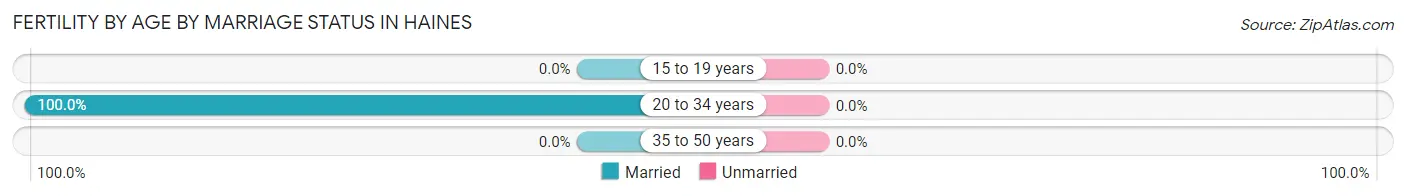
| Age Bracket | Married | Unmarried |
| 15 to 19 years | 0 (0.0%) | 0 (0.0%) |
| 20 to 34 years | 4 (100.0%) | 0 (0.0%) |
| 35 to 50 years | 0 (0.0%) | 0 (0.0%) |
| Total | 4 (100.0%) | 0 (0.0%) |
Fertility by Education in Haines
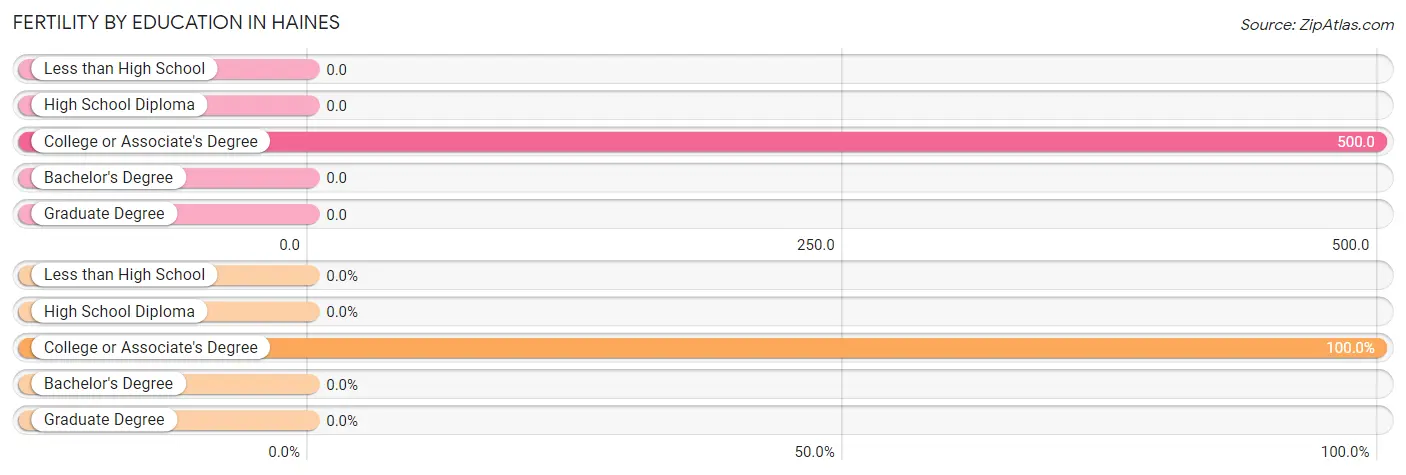
| Educational Attainment | Women with Births | Births / 1,000 Women |
| Less than High School | 0 (0.0%) | 0.0 |
| High School Diploma | 0 (0.0%) | 0.0 |
| College or Associate's Degree | 4 (100.0%) | 500.0 |
| Bachelor's Degree | 0 (0.0%) | 0.0 |
| Graduate Degree | 0 (0.0%) | 0.0 |
| Total | 4 (100.0%) | 143.0 |
Fertility by Education by Marriage Status in Haines
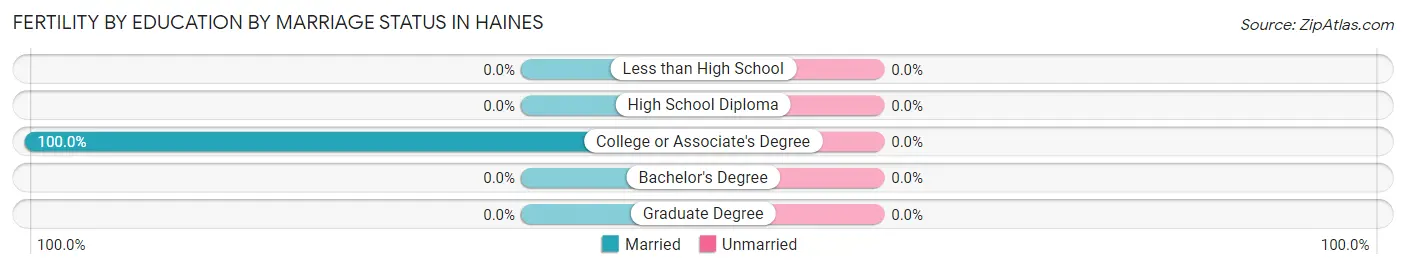
| Educational Attainment | Married | Unmarried |
| Less than High School | 0 (0.0%) | 0 (0.0%) |
| High School Diploma | 0 (0.0%) | 0 (0.0%) |
| College or Associate's Degree | 4 (100.0%) | 0 (0.0%) |
| Bachelor's Degree | 0 (0.0%) | 0 (0.0%) |
| Graduate Degree | 0 (0.0%) | 0 (0.0%) |
| Total | 4 (100.0%) | 0 (0.0%) |
Income in Haines
Income Overview in Haines
Per Capita Income in Haines is $27,629, while median incomes of families and households are $66,250 and $43,750 respectively.
| Characteristic | Number | Measure |
| Per Capita Income | 220 | $27,629 |
| Median Family Income | 48 | $66,250 |
| Mean Family Income | 48 | $67,638 |
| Median Household Income | 115 | $43,750 |
| Mean Household Income | 115 | $48,666 |
| Income Deficit | 48 | $0 |
| Wage / Income Gap (%) | 220 | 0.00% |
| Wage / Income Gap ($) | 220 | 100.00¢ per $1 |
| Gini / Inequality Index | 220 | 0.41 |
Earnings by Sex in Haines
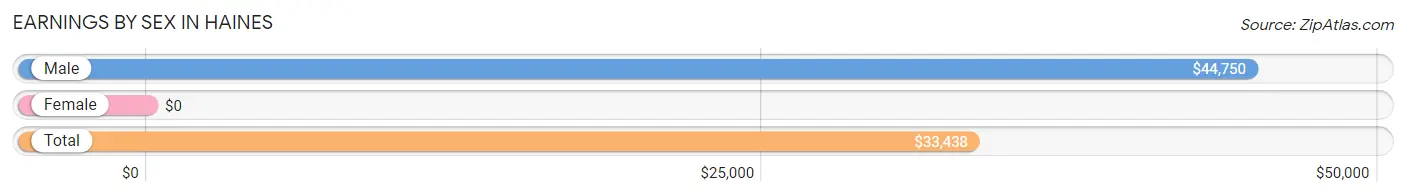
| Sex | Number | Average Earnings |
| Male | 59 (56.2%) | $44,750 |
| Female | 46 (43.8%) | $0 |
| Total | 105 (100.0%) | $33,438 |
Earnings by Sex by Income Bracket in Haines
The most common earnings brackets in Haines are $50,000 to $54,999 for men (13 | 22.0%) and $2,499 or less for women (9 | 19.6%).
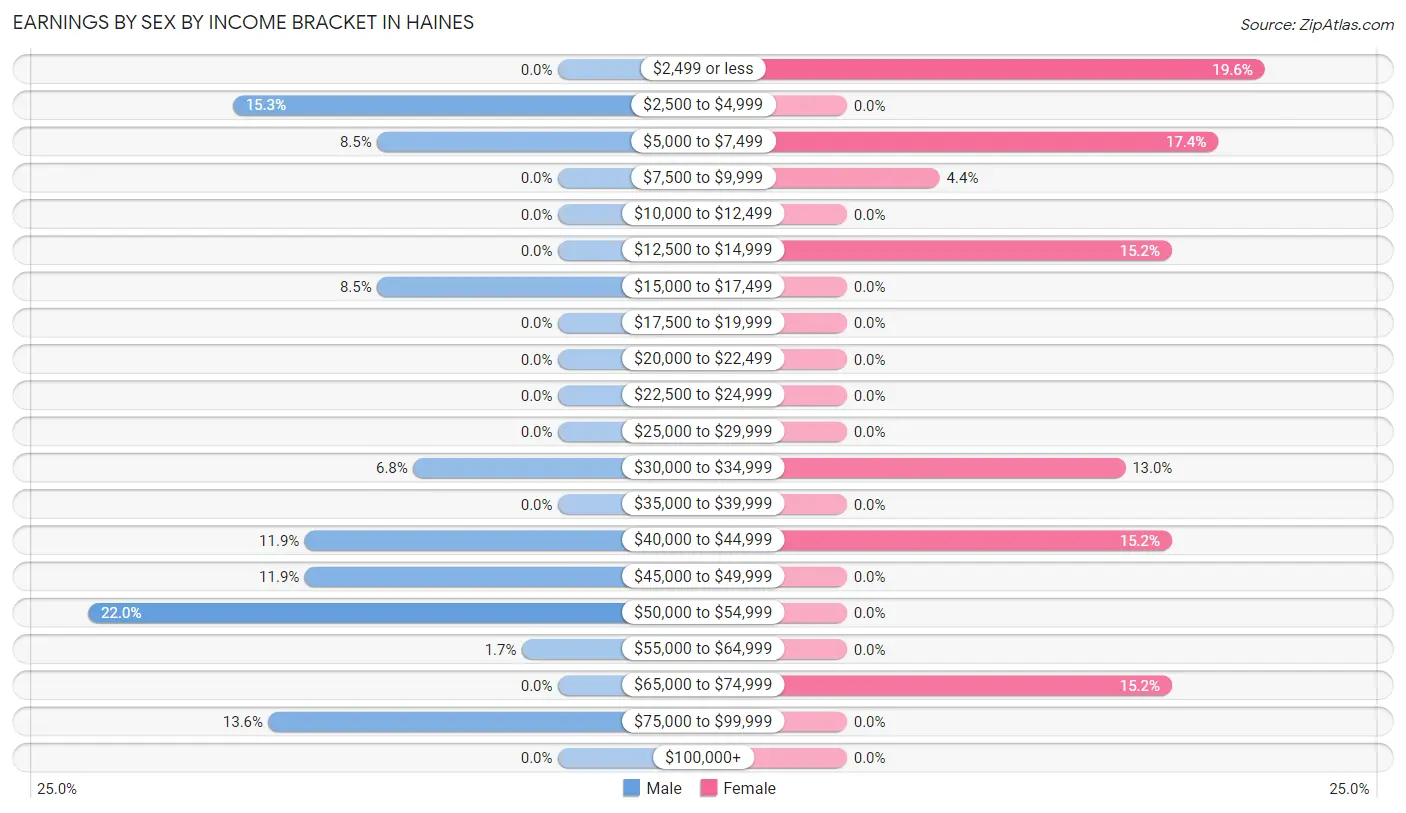
| Income | Male | Female |
| $2,499 or less | 0 (0.0%) | 9 (19.6%) |
| $2,500 to $4,999 | 9 (15.2%) | 0 (0.0%) |
| $5,000 to $7,499 | 5 (8.5%) | 8 (17.4%) |
| $7,500 to $9,999 | 0 (0.0%) | 2 (4.3%) |
| $10,000 to $12,499 | 0 (0.0%) | 0 (0.0%) |
| $12,500 to $14,999 | 0 (0.0%) | 7 (15.2%) |
| $15,000 to $17,499 | 5 (8.5%) | 0 (0.0%) |
| $17,500 to $19,999 | 0 (0.0%) | 0 (0.0%) |
| $20,000 to $22,499 | 0 (0.0%) | 0 (0.0%) |
| $22,500 to $24,999 | 0 (0.0%) | 0 (0.0%) |
| $25,000 to $29,999 | 0 (0.0%) | 0 (0.0%) |
| $30,000 to $34,999 | 4 (6.8%) | 6 (13.0%) |
| $35,000 to $39,999 | 0 (0.0%) | 0 (0.0%) |
| $40,000 to $44,999 | 7 (11.9%) | 7 (15.2%) |
| $45,000 to $49,999 | 7 (11.9%) | 0 (0.0%) |
| $50,000 to $54,999 | 13 (22.0%) | 0 (0.0%) |
| $55,000 to $64,999 | 1 (1.7%) | 0 (0.0%) |
| $65,000 to $74,999 | 0 (0.0%) | 7 (15.2%) |
| $75,000 to $99,999 | 8 (13.6%) | 0 (0.0%) |
| $100,000+ | 0 (0.0%) | 0 (0.0%) |
| Total | 59 (100.0%) | 46 (100.0%) |
Earnings by Sex by Educational Attainment in Haines
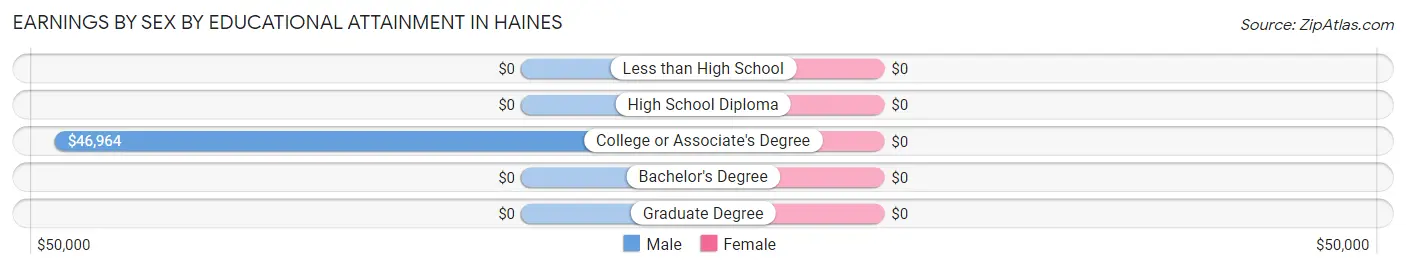
| Educational Attainment | Male Income | Female Income |
| Less than High School | - | - |
| High School Diploma | - | - |
| College or Associate's Degree | $46,964 | $0 |
| Bachelor's Degree | - | - |
| Graduate Degree | - | - |
| Total | $45,714 | $0 |
Family Income in Haines
Family Income Brackets in Haines
According to the Haines family income data, there are 12 families falling into the $50,000 to $74,999 income range, which is the most common income bracket and makes up 25.0% of all families.
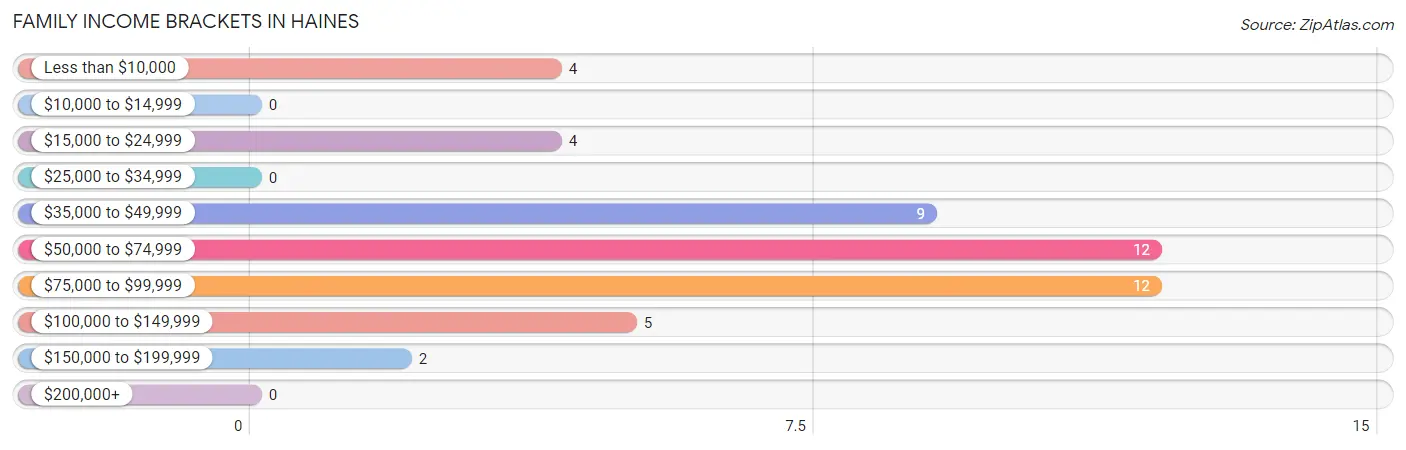
| Income Bracket | # Families | % Families |
| Less than $10,000 | 4 | 8.3% |
| $10,000 to $14,999 | 0 | 0.0% |
| $15,000 to $24,999 | 4 | 8.3% |
| $25,000 to $34,999 | 0 | 0.0% |
| $35,000 to $49,999 | 9 | 18.8% |
| $50,000 to $74,999 | 12 | 25.0% |
| $75,000 to $99,999 | 12 | 25.0% |
| $100,000 to $149,999 | 5 | 10.4% |
| $150,000 to $199,999 | 2 | 4.2% |
| $200,000+ | 0 | 0.0% |
Family Income by Famaliy Size in Haines
2-person families (36 | 75.0%) account for the highest median family income in Haines with $60,000 per family, while 2-person families (36 | 75.0%) have the highest median income of $30,000 per family member.
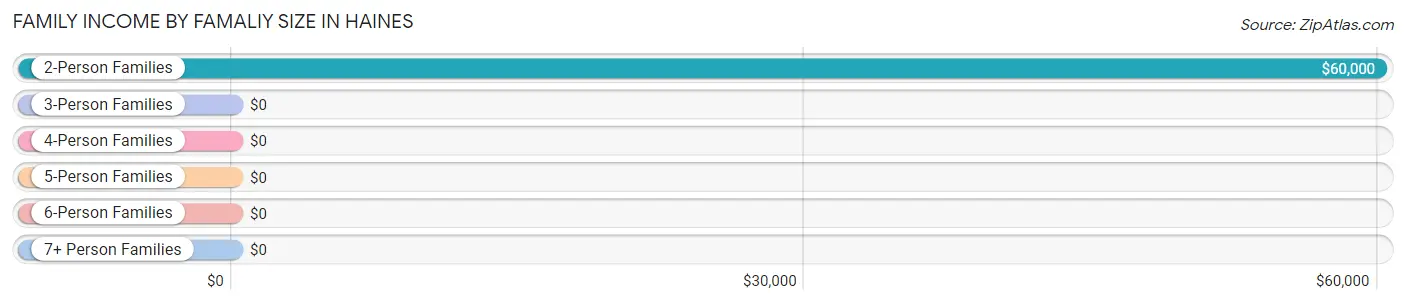
| Income Bracket | # Families | Median Income |
| 2-Person Families | 36 (75.0%) | $60,000 |
| 3-Person Families | 2 (4.2%) | $0 |
| 4-Person Families | 5 (10.4%) | $0 |
| 5-Person Families | 3 (6.2%) | $0 |
| 6-Person Families | 2 (4.2%) | $0 |
| 7+ Person Families | 0 (0.0%) | $0 |
| Total | 48 (100.0%) | $66,250 |
Family Income by Number of Earners in Haines
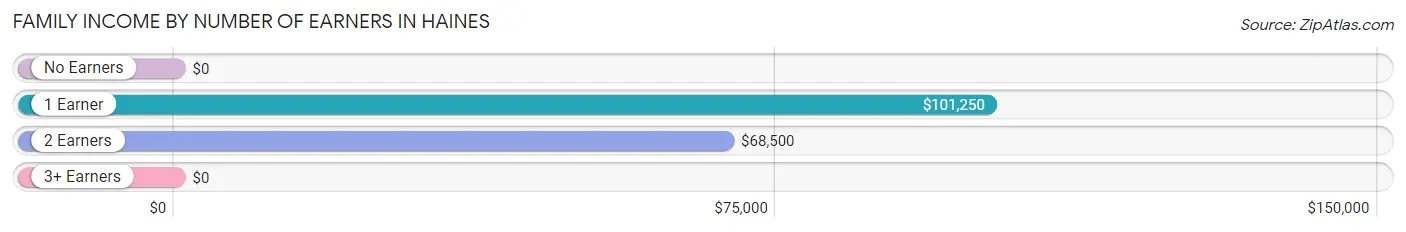
| Number of Earners | # Families | Median Income |
| No Earners | 14 (29.2%) | $0 |
| 1 Earner | 14 (29.2%) | $101,250 |
| 2 Earners | 20 (41.7%) | $68,500 |
| 3+ Earners | 0 (0.0%) | $0 |
| Total | 48 (100.0%) | $66,250 |
Household Income in Haines
Household Income Brackets in Haines
With 23 households falling in the category, the $50,000 to $74,999 income range is the most frequent in Haines, accounting for 20.0% of all households.
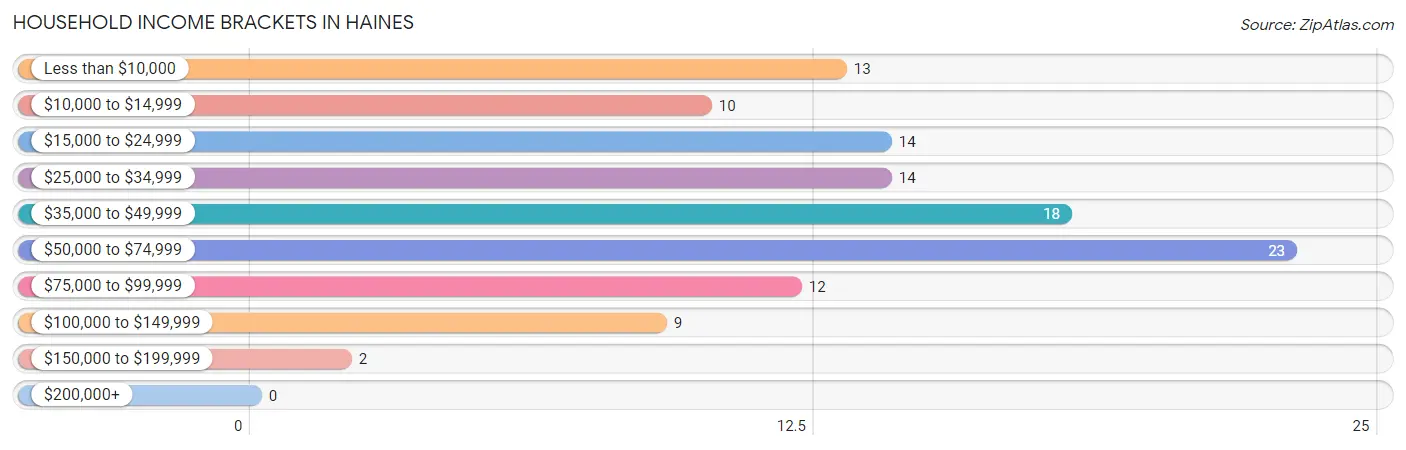
| Income Bracket | # Households | % Households |
| Less than $10,000 | 13 | 11.3% |
| $10,000 to $14,999 | 10 | 8.7% |
| $15,000 to $24,999 | 14 | 12.2% |
| $25,000 to $34,999 | 14 | 12.2% |
| $35,000 to $49,999 | 18 | 15.7% |
| $50,000 to $74,999 | 23 | 20.0% |
| $75,000 to $99,999 | 12 | 10.4% |
| $100,000 to $149,999 | 9 | 7.8% |
| $150,000 to $199,999 | 2 | 1.7% |
| $200,000+ | 0 | 0.0% |
Household Income by Householder Age in Haines
The median household income in Haines is $43,750, with the highest median household income of $56,875 found in the 45 to 64 years age bracket for the primary householder. A total of 40 households (34.8%) fall into this category.
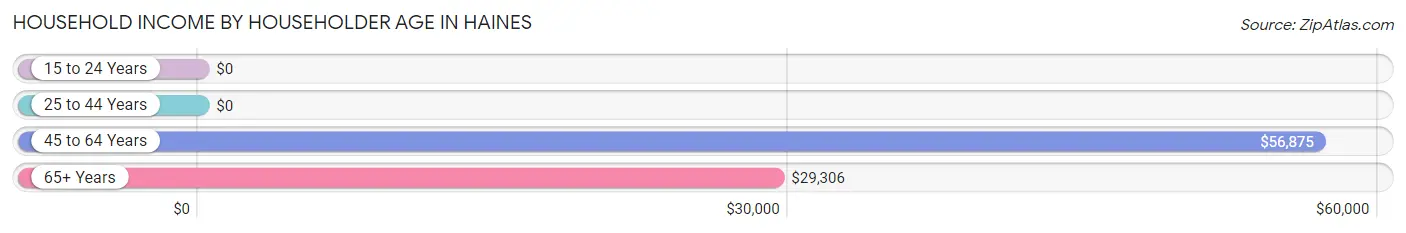
| Income Bracket | # Households | Median Income |
| 15 to 24 Years | 0 (0.0%) | $0 |
| 25 to 44 Years | 8 (7.0%) | $0 |
| 45 to 64 Years | 40 (34.8%) | $56,875 |
| 65+ Years | 67 (58.3%) | $29,306 |
| Total | 115 (100.0%) | $43,750 |
Poverty in Haines
Income Below Poverty by Sex and Age in Haines
With 14.5% poverty level for males and 23.3% for females among the residents of Haines, 75 year old and over males and 55 to 64 year old females are the most vulnerable to poverty, with 7 males (26.9%) and 8 females (80.0%) in their respective age groups living below the poverty level.
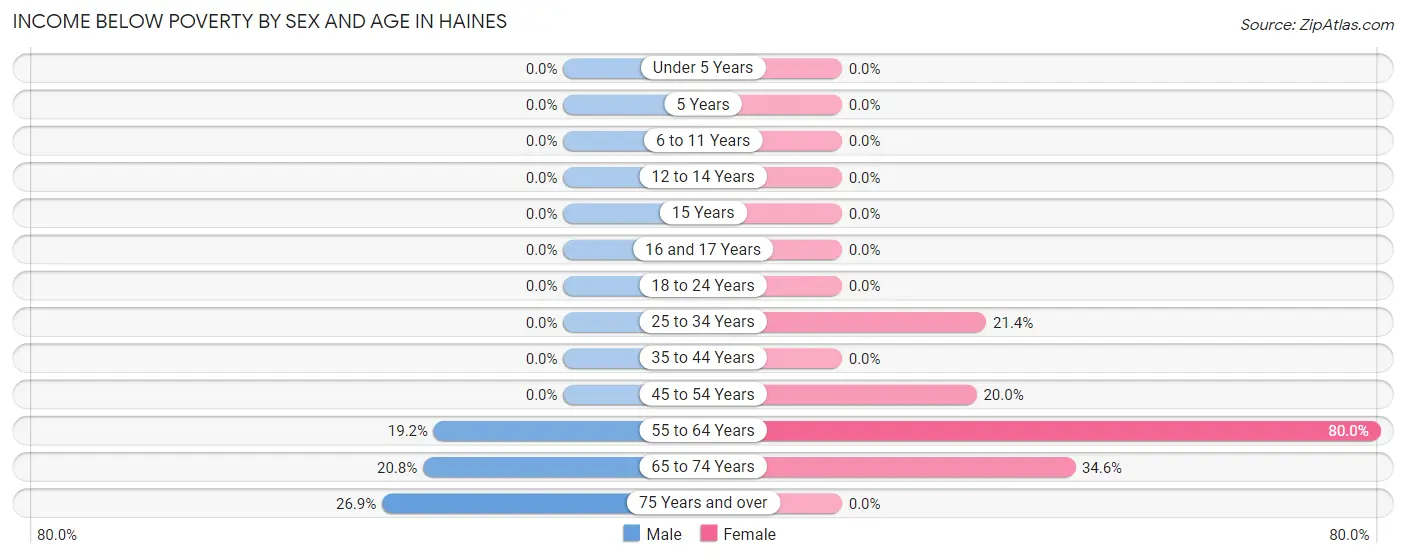
| Age Bracket | Male | Female |
| Under 5 Years | 0 (0.0%) | 0 (0.0%) |
| 5 Years | 0 (0.0%) | 0 (0.0%) |
| 6 to 11 Years | 0 (0.0%) | 0 (0.0%) |
| 12 to 14 Years | 0 (0.0%) | 0 (0.0%) |
| 15 Years | 0 (0.0%) | 0 (0.0%) |
| 16 and 17 Years | 0 (0.0%) | 0 (0.0%) |
| 18 to 24 Years | 0 (0.0%) | 0 (0.0%) |
| 25 to 34 Years | 0 (0.0%) | 3 (21.4%) |
| 35 to 44 Years | 0 (0.0%) | 0 (0.0%) |
| 45 to 54 Years | 0 (0.0%) | 4 (20.0%) |
| 55 to 64 Years | 5 (19.2%) | 8 (80.0%) |
| 65 to 74 Years | 5 (20.8%) | 9 (34.6%) |
| 75 Years and over | 7 (26.9%) | 0 (0.0%) |
| Total | 17 (14.5%) | 24 (23.3%) |
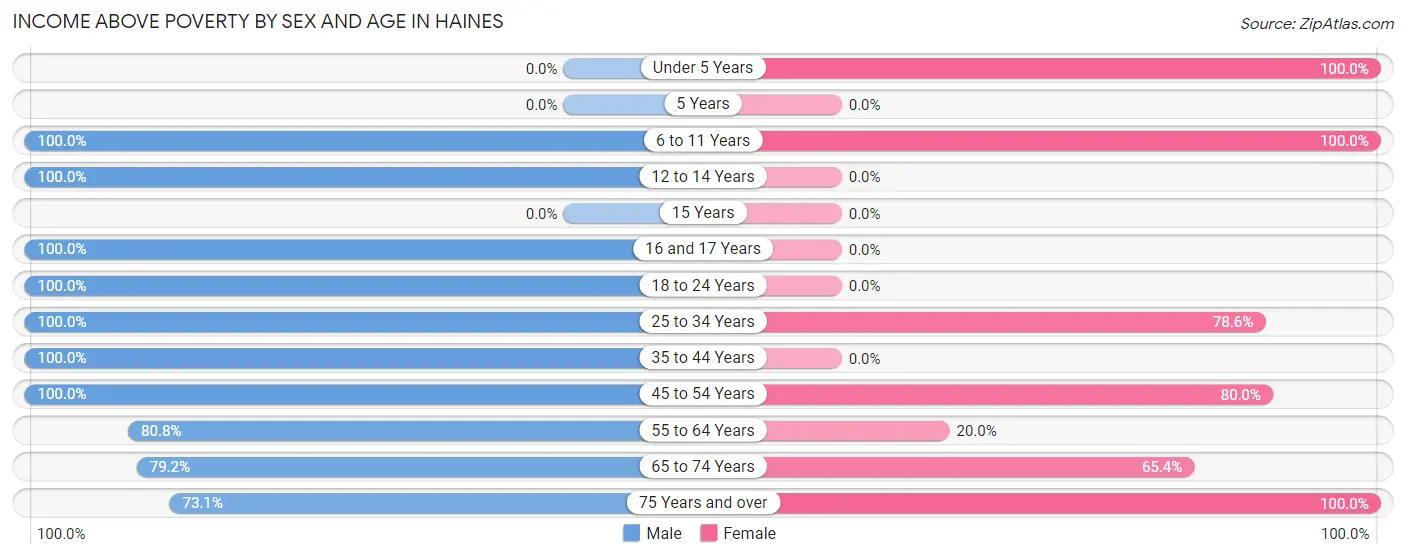
Income Above Poverty by Sex and Age in Haines
According to the poverty statistics in Haines, males aged 6 to 11 years and females aged under 5 years are the age groups that are most secure financially, with 100.0% of males and 100.0% of females in these age groups living above the poverty line.
| Age Bracket | Male | Female |
| Under 5 Years | 0 (0.0%) | 11 (100.0%) |
| 5 Years | 0 (0.0%) | 0 (0.0%) |
| 6 to 11 Years | 5 (100.0%) | 4 (100.0%) |
| 12 to 14 Years | 6 (100.0%) | 0 (0.0%) |
| 15 Years | 0 (0.0%) | 0 (0.0%) |
| 16 and 17 Years | 2 (100.0%) | 0 (0.0%) |
| 18 to 24 Years | 5 (100.0%) | 0 (0.0%) |
| 25 to 34 Years | 5 (100.0%) | 11 (78.6%) |
| 35 to 44 Years | 4 (100.0%) | 0 (0.0%) |
| 45 to 54 Years | 14 (100.0%) | 16 (80.0%) |
| 55 to 64 Years | 21 (80.8%) | 2 (20.0%) |
| 65 to 74 Years | 19 (79.2%) | 17 (65.4%) |
| 75 Years and over | 19 (73.1%) | 18 (100.0%) |
| Total | 100 (85.5%) | 79 (76.7%) |
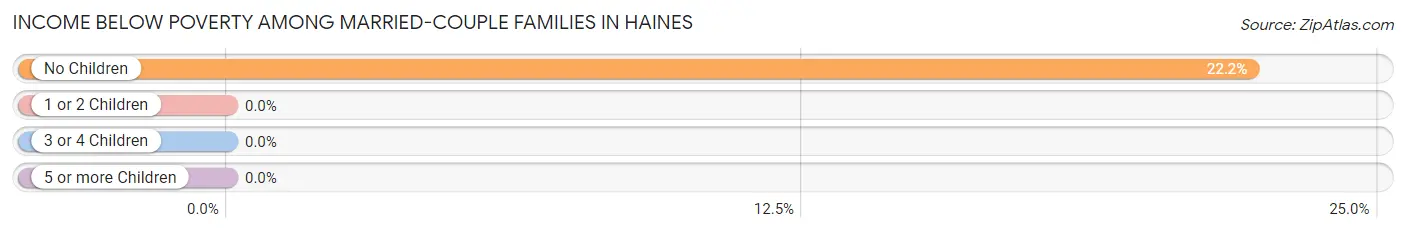
Income Below Poverty Among Married-Couple Families in Haines
The poverty statistics for married-couple families in Haines show that 16.7% or 8 of the total 48 families live below the poverty line. Families with no children have the highest poverty rate of 22.2%, comprising of 8 families. On the other hand, families with 1 or 2 children have the lowest poverty rate of 0.0%, which includes 0 families.
| Children | Above Poverty | Below Poverty |
| No Children | 28 (77.8%) | 8 (22.2%) |
| 1 or 2 Children | 9 (100.0%) | 0 (0.0%) |
| 3 or 4 Children | 3 (100.0%) | 0 (0.0%) |
| 5 or more Children | 0 (0.0%) | 0 (0.0%) |
| Total | 40 (83.3%) | 8 (16.7%) |
Income Below Poverty Among Single-Parent Households in Haines
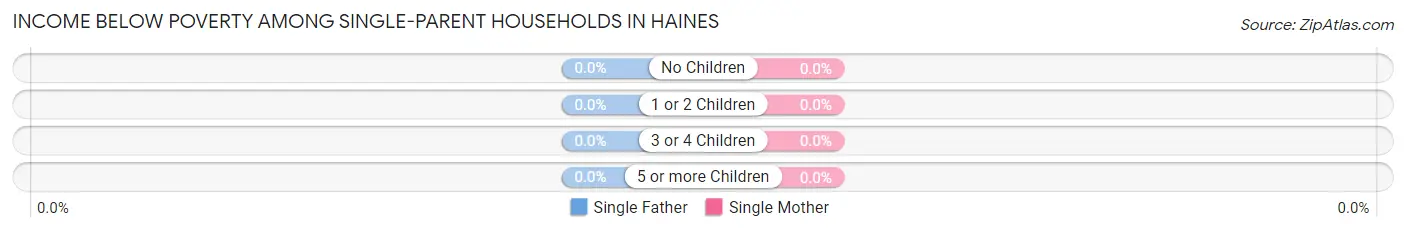
| Children | Single Father | Single Mother |
| No Children | 0 (0.0%) | 0 (0.0%) |
| 1 or 2 Children | 0 (0.0%) | 0 (0.0%) |
| 3 or 4 Children | 0 (0.0%) | 0 (0.0%) |
| 5 or more Children | 0 (0.0%) | 0 (0.0%) |
| Total | 0 (0.0%) | 0 (0.0%) |
Income Below Poverty Among Married-Couple vs Single-Parent Households in Haines
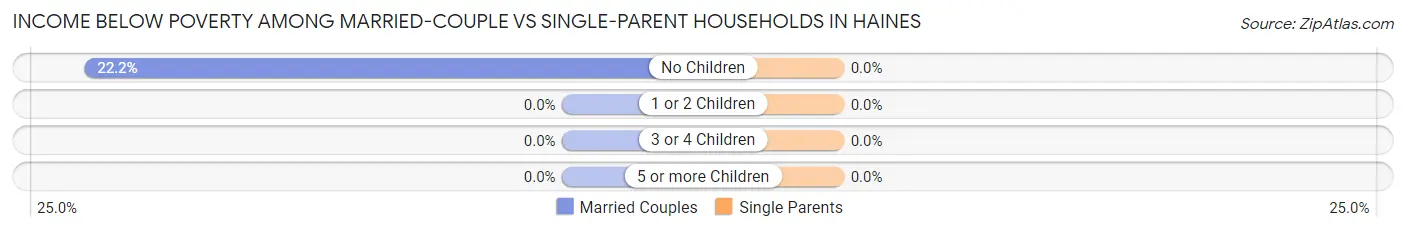
| Children | Married-Couple Families | Single-Parent Households |
| No Children | 8 (22.2%) | 0 (0.0%) |
| 1 or 2 Children | 0 (0.0%) | 0 (0.0%) |
| 3 or 4 Children | 0 (0.0%) | 0 (0.0%) |
| 5 or more Children | 0 (0.0%) | 0 (0.0%) |
| Total | 8 (16.7%) | 0 (0.0%) |
Employment Characteristics in Haines
Employment by Class of Employer in Haines
Among the 84 employed individuals in Haines, private company employees (32 | 38.1%), local government employees (15 | 17.9%), and self-employed (incorporated) (14 | 16.7%) make up the most common classes of employment.
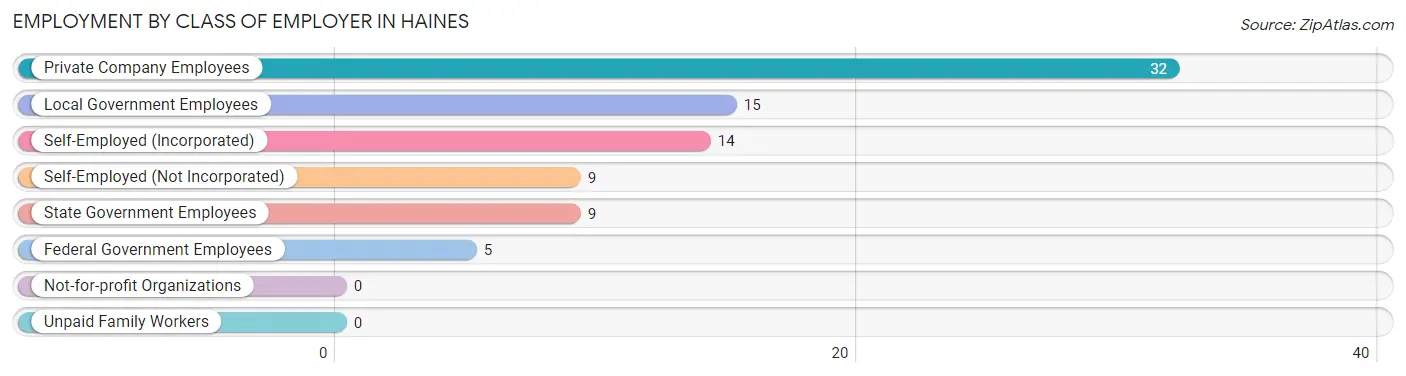
| Employer Class | # Employees | % Employees |
| Private Company Employees | 32 | 38.1% |
| Self-Employed (Incorporated) | 14 | 16.7% |
| Self-Employed (Not Incorporated) | 9 | 10.7% |
| Not-for-profit Organizations | 0 | 0.0% |
| Local Government Employees | 15 | 17.9% |
| State Government Employees | 9 | 10.7% |
| Federal Government Employees | 5 | 5.9% |
| Unpaid Family Workers | 0 | 0.0% |
| Total | 84 | 100.0% |
Employment Status by Age in Haines
According to the labor force statistics for Haines, out of the total population over 16 years of age (194), 51.5% or 100 individuals are in the labor force, with 16.0% or 16 of them unemployed. The age group with the highest labor force participation rate is 20 to 24 years, with 100.0% or 5 individuals in the labor force. Within the labor force, the 35 to 44 years age range has the highest percentage of unemployed individuals, with 100.0% or 4 of them being unemployed.
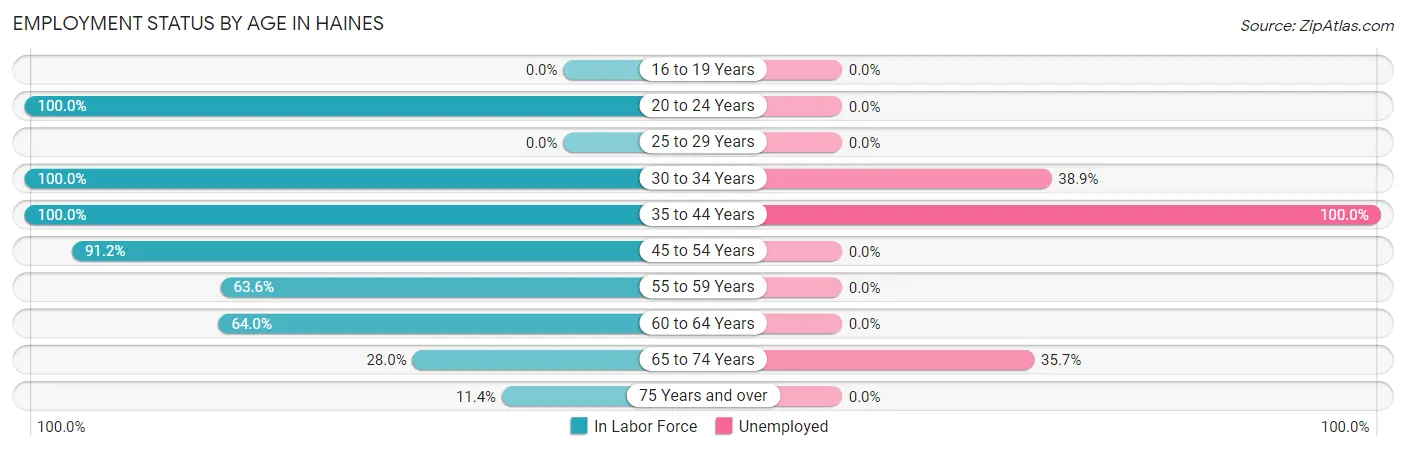
| Age Bracket | In Labor Force | Unemployed |
| 16 to 19 Years | 0 (0.0%) | 0 (0.0%) |
| 20 to 24 Years | 5 (100.0%) | 0 (0.0%) |
| 25 to 29 Years | 0 (0.0%) | 0 (0.0%) |
| 30 to 34 Years | 18 (100.0%) | 7 (38.9%) |
| 35 to 44 Years | 4 (100.0%) | 4 (100.0%) |
| 45 to 54 Years | 31 (91.2%) | 0 (0.0%) |
| 55 to 59 Years | 7 (63.6%) | 0 (0.0%) |
| 60 to 64 Years | 16 (64.0%) | 0 (0.0%) |
| 65 to 74 Years | 14 (28.0%) | 5 (35.7%) |
| 75 Years and over | 5 (11.4%) | 0 (0.0%) |
| Total | 100 (51.5%) | 16 (16.0%) |
Employment Status by Educational Attainment in Haines
According to labor force statistics for Haines, 81.7% of individuals (76) out of the total population between 25 and 64 years of age (93) are in the labor force, with 14.5% or 11 of them being unemployed. The group with the highest labor force participation rate are those with the educational attainment of less than high school, with 100.0% or 3 individuals in the labor force. Within the labor force, individuals with high school diploma education have the highest percentage of unemployment, with 45.8% or 11 of them being unemployed.
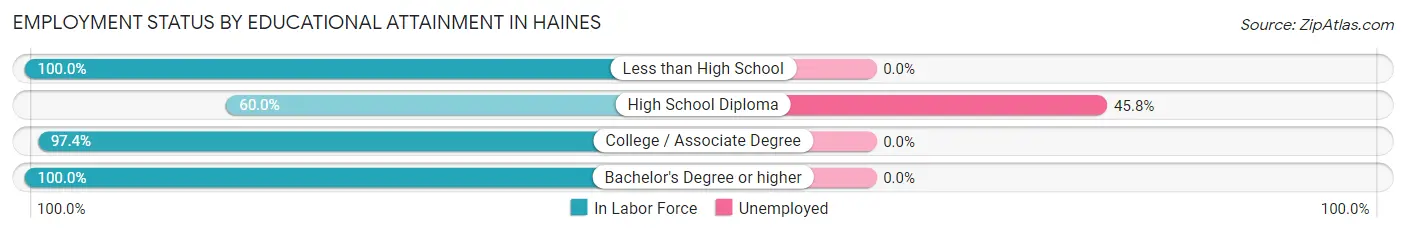
| Educational Attainment | In Labor Force | Unemployed |
| Less than High School | 3 (100.0%) | 0 (0.0%) |
| High School Diploma | 24 (60.0%) | 18 (45.8%) |
| College / Associate Degree | 37 (97.4%) | 0 (0.0%) |
| Bachelor's Degree or higher | 12 (100.0%) | 0 (0.0%) |
| Total | 76 (81.7%) | 13 (14.5%) |
Employment Occupations by Sex in Haines
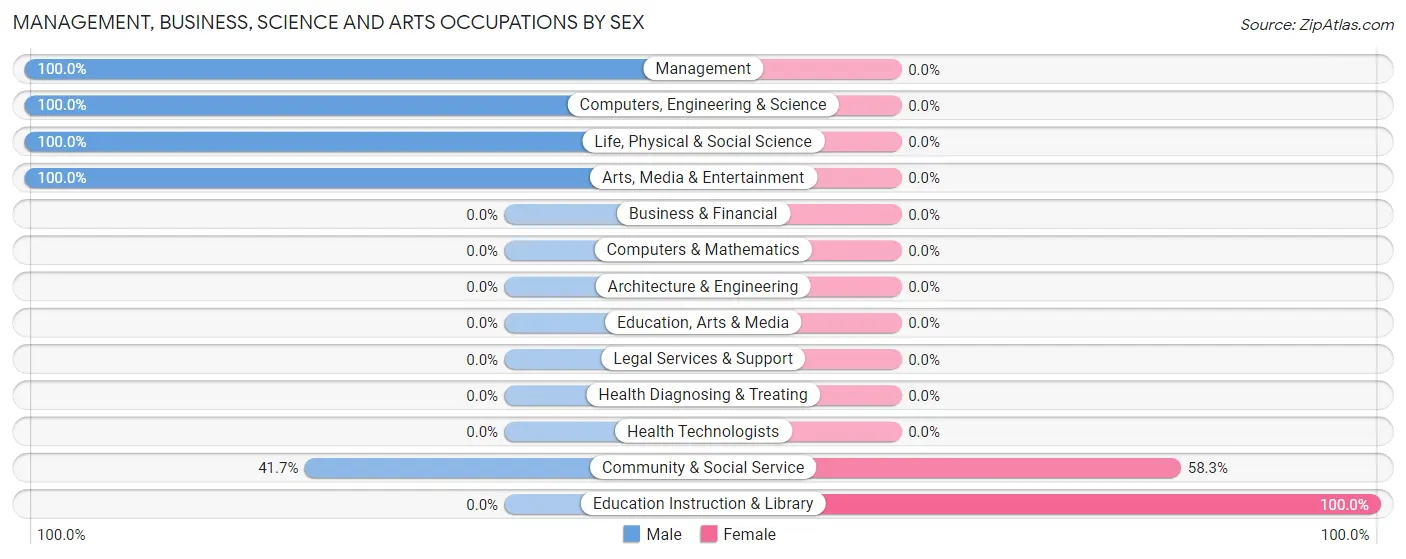
Management, Business, Science and Arts Occupations
The most common Management, Business, Science and Arts occupations in Haines are Management (14 | 16.7%), Community & Social Service (12 | 14.3%), Education Instruction & Library (7 | 8.3%), Arts, Media & Entertainment (5 | 5.9%), and Computers, Engineering & Science (2 | 2.4%).
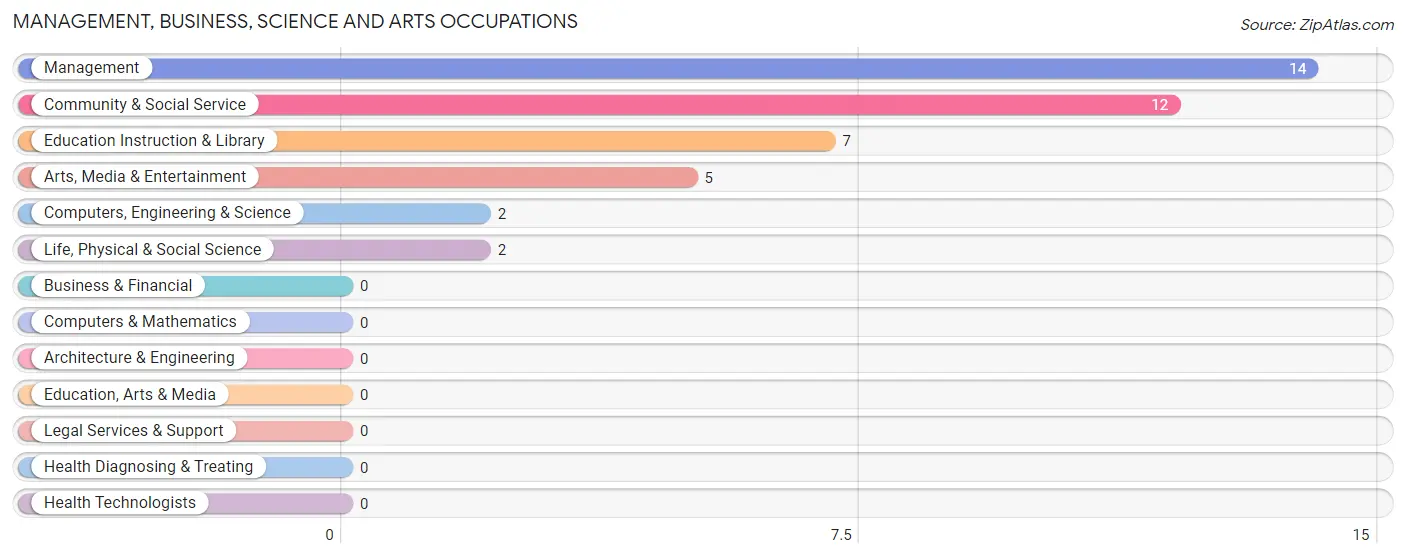
Management, Business, Science and Arts Occupations by Sex
Within the Management, Business, Science and Arts occupations in Haines, the most male-oriented occupations are Management (100.0%), Computers, Engineering & Science (100.0%), and Life, Physical & Social Science (100.0%), while the most female-oriented occupations are Education Instruction & Library (100.0%), and Community & Social Service (58.3%).
| Occupation | Male | Female |
| Management | 14 (100.0%) | 0 (0.0%) |
| Business & Financial | 0 (0.0%) | 0 (0.0%) |
| Computers, Engineering & Science | 2 (100.0%) | 0 (0.0%) |
| Computers & Mathematics | 0 (0.0%) | 0 (0.0%) |
| Architecture & Engineering | 0 (0.0%) | 0 (0.0%) |
| Life, Physical & Social Science | 2 (100.0%) | 0 (0.0%) |
| Community & Social Service | 5 (41.7%) | 7 (58.3%) |
| Education, Arts & Media | 0 (0.0%) | 0 (0.0%) |
| Legal Services & Support | 0 (0.0%) | 0 (0.0%) |
| Education Instruction & Library | 0 (0.0%) | 7 (100.0%) |
| Arts, Media & Entertainment | 5 (100.0%) | 0 (0.0%) |
| Health Diagnosing & Treating | 0 (0.0%) | 0 (0.0%) |
| Health Technologists | 0 (0.0%) | 0 (0.0%) |
| Total (Category) | 21 (75.0%) | 7 (25.0%) |
| Total (Overall) | 50 (59.5%) | 34 (40.5%) |
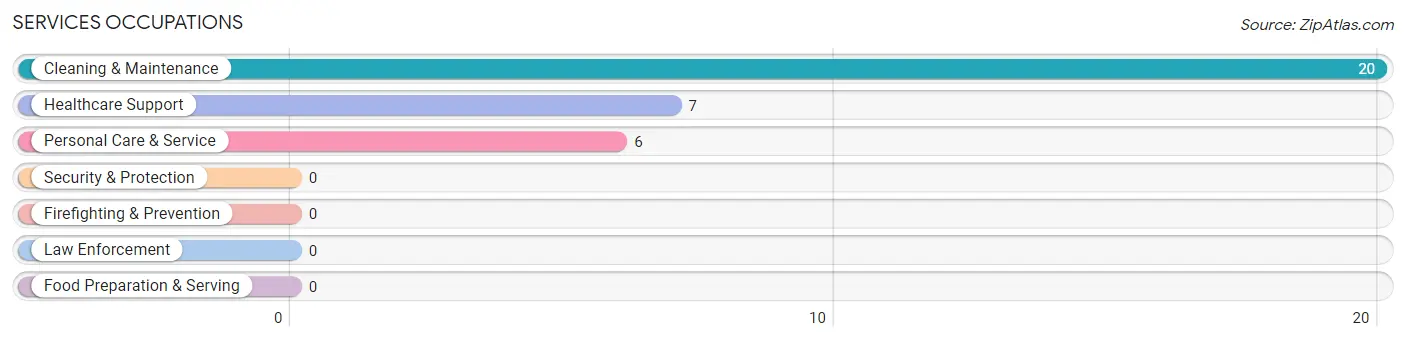
Services Occupations
The most common Services occupations in Haines are Cleaning & Maintenance (20 | 23.8%), Healthcare Support (7 | 8.3%), and Personal Care & Service (6 | 7.1%).
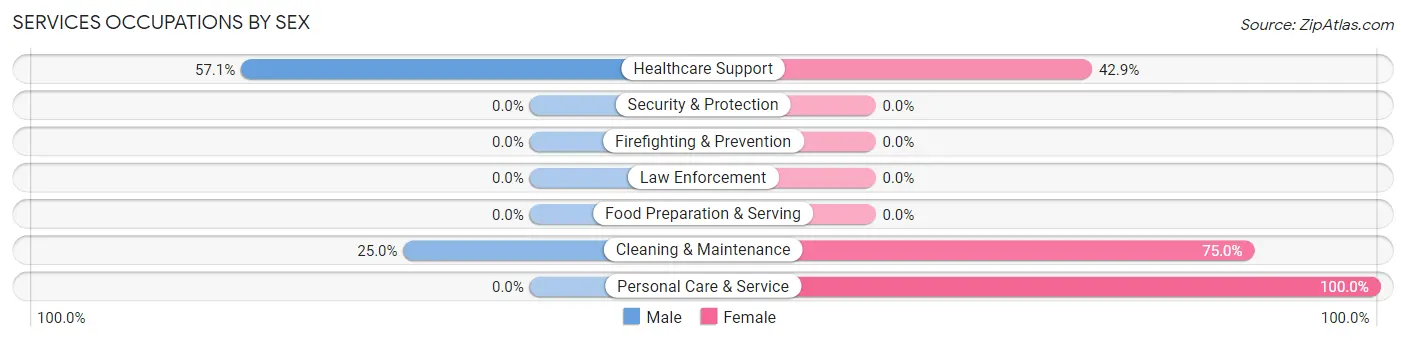
Services Occupations by Sex
Within the Services occupations in Haines, the most male-oriented occupations are Healthcare Support (57.1%), and Cleaning & Maintenance (25.0%), while the most female-oriented occupations are Personal Care & Service (100.0%), Cleaning & Maintenance (75.0%), and Healthcare Support (42.9%).
| Occupation | Male | Female |
| Healthcare Support | 4 (57.1%) | 3 (42.9%) |
| Security & Protection | 0 (0.0%) | 0 (0.0%) |
| Firefighting & Prevention | 0 (0.0%) | 0 (0.0%) |
| Law Enforcement | 0 (0.0%) | 0 (0.0%) |
| Food Preparation & Serving | 0 (0.0%) | 0 (0.0%) |
| Cleaning & Maintenance | 5 (25.0%) | 15 (75.0%) |
| Personal Care & Service | 0 (0.0%) | 6 (100.0%) |
| Total (Category) | 9 (27.3%) | 24 (72.7%) |
| Total (Overall) | 50 (59.5%) | 34 (40.5%) |
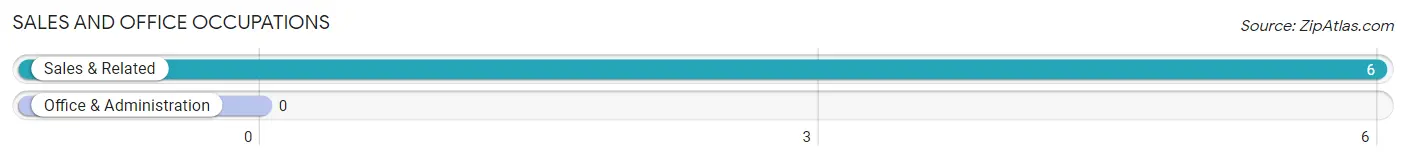
Sales and Office Occupations
The most common Sales and Office occupations in Haines are , and Sales & Related (6 | 7.1%).
Sales and Office Occupations by Sex
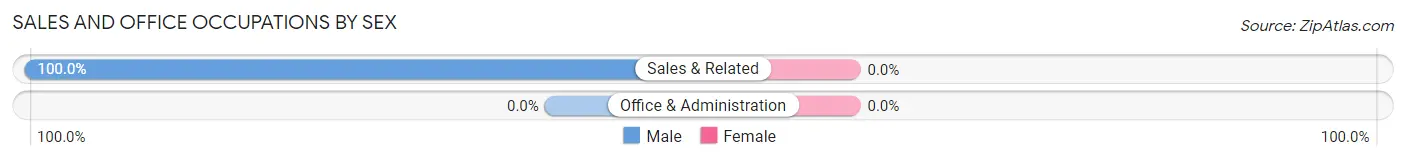
| Occupation | Male | Female |
| Sales & Related | 6 (100.0%) | 0 (0.0%) |
| Office & Administration | 0 (0.0%) | 0 (0.0%) |
| Total (Category) | 6 (100.0%) | 0 (0.0%) |
| Total (Overall) | 50 (59.5%) | 34 (40.5%) |
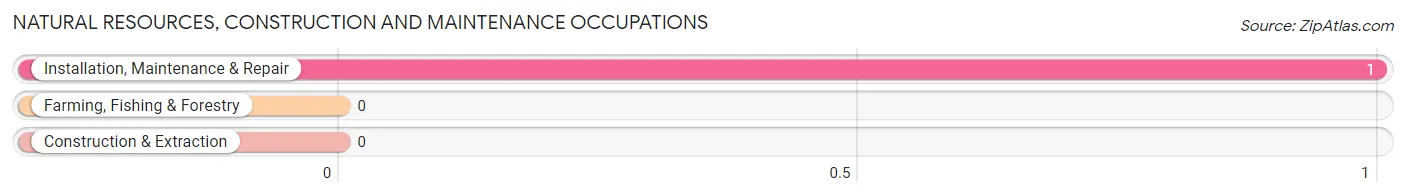
Natural Resources, Construction and Maintenance Occupations
The most common Natural Resources, Construction and Maintenance occupations in Haines are , and Installation, Maintenance & Repair (1 | 1.2%).
Natural Resources, Construction and Maintenance Occupations by Sex
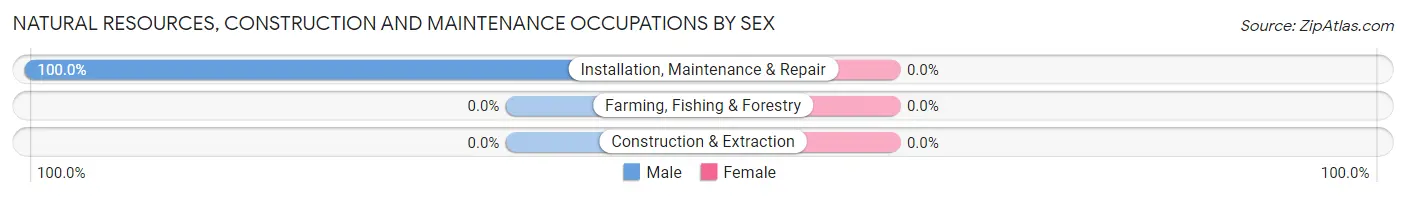
| Occupation | Male | Female |
| Farming, Fishing & Forestry | 0 (0.0%) | 0 (0.0%) |
| Construction & Extraction | 0 (0.0%) | 0 (0.0%) |
| Installation, Maintenance & Repair | 1 (100.0%) | 0 (0.0%) |
| Total (Category) | 1 (100.0%) | 0 (0.0%) |
| Total (Overall) | 50 (59.5%) | 34 (40.5%) |
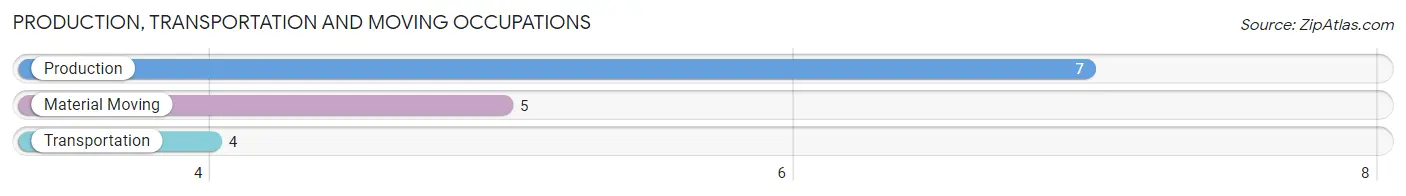
Production, Transportation and Moving Occupations
The most common Production, Transportation and Moving occupations in Haines are Production (7 | 8.3%), Material Moving (5 | 5.9%), and Transportation (4 | 4.8%).
Production, Transportation and Moving Occupations by Sex
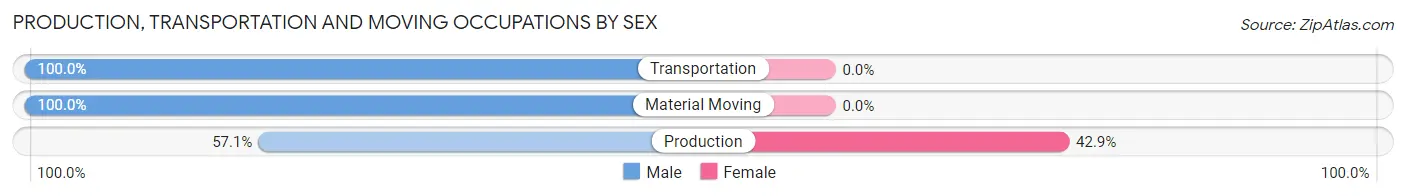
| Occupation | Male | Female |
| Production | 4 (57.1%) | 3 (42.9%) |
| Transportation | 4 (100.0%) | 0 (0.0%) |
| Material Moving | 5 (100.0%) | 0 (0.0%) |
| Total (Category) | 13 (81.2%) | 3 (18.8%) |
| Total (Overall) | 50 (59.5%) | 34 (40.5%) |
Employment Industries by Sex in Haines
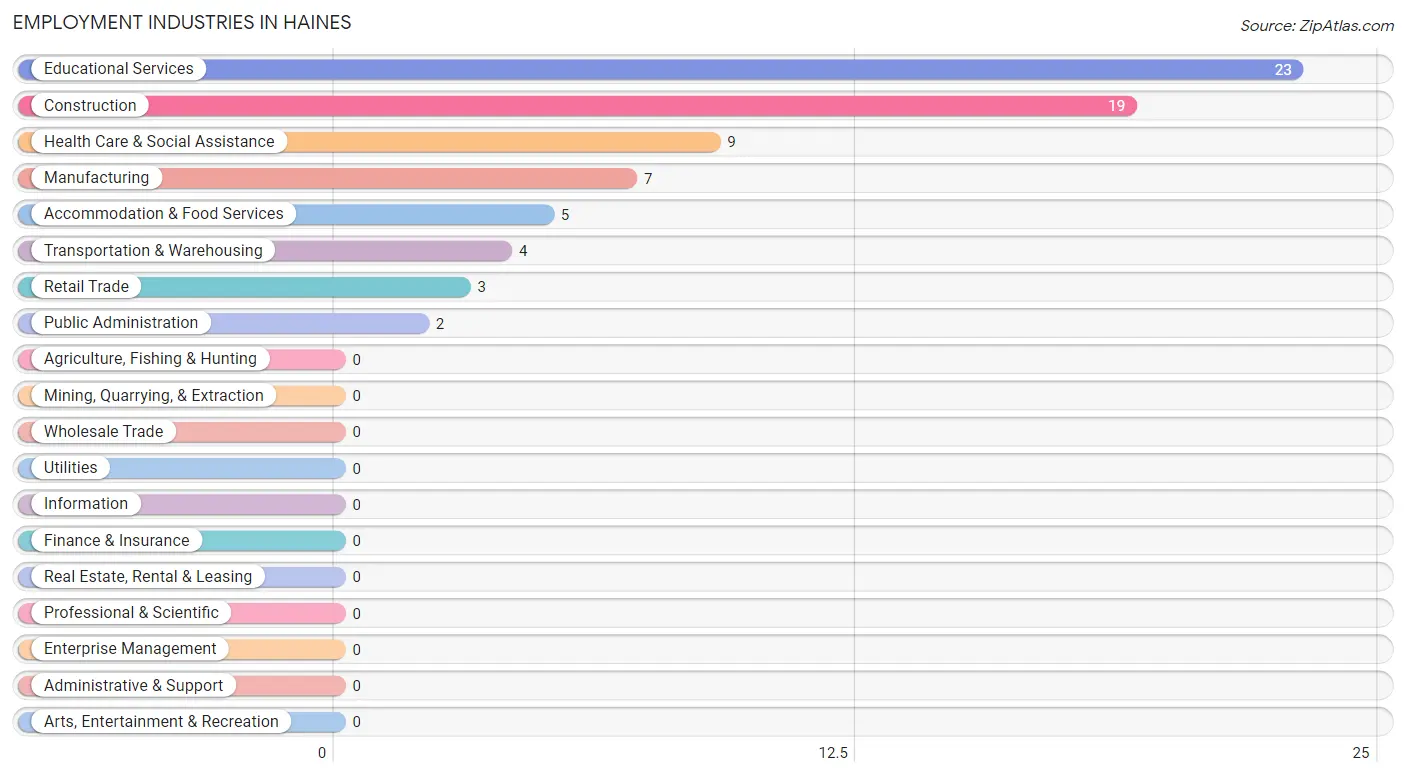
Employment Industries in Haines
The major employment industries in Haines include Educational Services (23 | 27.4%), Construction (19 | 22.6%), Health Care & Social Assistance (9 | 10.7%), Manufacturing (7 | 8.3%), and Accommodation & Food Services (5 | 5.9%).
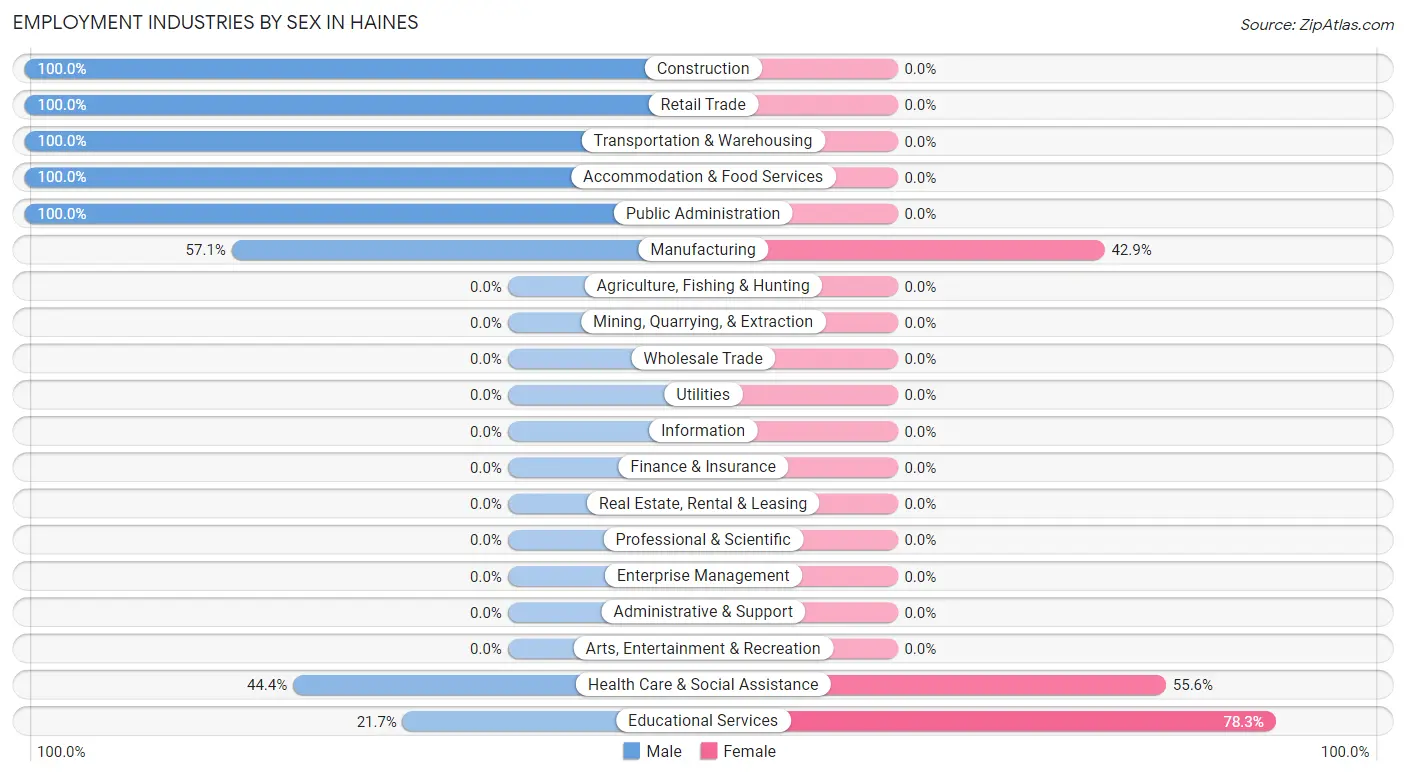
Employment Industries by Sex in Haines
The Haines industries that see more men than women are Construction (100.0%), Retail Trade (100.0%), and Transportation & Warehousing (100.0%), whereas the industries that tend to have a higher number of women are Educational Services (78.3%), Health Care & Social Assistance (55.6%), and Manufacturing (42.9%).
| Industry | Male | Female |
| Agriculture, Fishing & Hunting | 0 (0.0%) | 0 (0.0%) |
| Mining, Quarrying, & Extraction | 0 (0.0%) | 0 (0.0%) |
| Construction | 19 (100.0%) | 0 (0.0%) |
| Manufacturing | 4 (57.1%) | 3 (42.9%) |
| Wholesale Trade | 0 (0.0%) | 0 (0.0%) |
| Retail Trade | 3 (100.0%) | 0 (0.0%) |
| Transportation & Warehousing | 4 (100.0%) | 0 (0.0%) |
| Utilities | 0 (0.0%) | 0 (0.0%) |
| Information | 0 (0.0%) | 0 (0.0%) |
| Finance & Insurance | 0 (0.0%) | 0 (0.0%) |
| Real Estate, Rental & Leasing | 0 (0.0%) | 0 (0.0%) |
| Professional & Scientific | 0 (0.0%) | 0 (0.0%) |
| Enterprise Management | 0 (0.0%) | 0 (0.0%) |
| Administrative & Support | 0 (0.0%) | 0 (0.0%) |
| Educational Services | 5 (21.7%) | 18 (78.3%) |
| Health Care & Social Assistance | 4 (44.4%) | 5 (55.6%) |
| Arts, Entertainment & Recreation | 0 (0.0%) | 0 (0.0%) |
| Accommodation & Food Services | 5 (100.0%) | 0 (0.0%) |
| Public Administration | 2 (100.0%) | 0 (0.0%) |
| Total | 50 (59.5%) | 34 (40.5%) |
Education in Haines
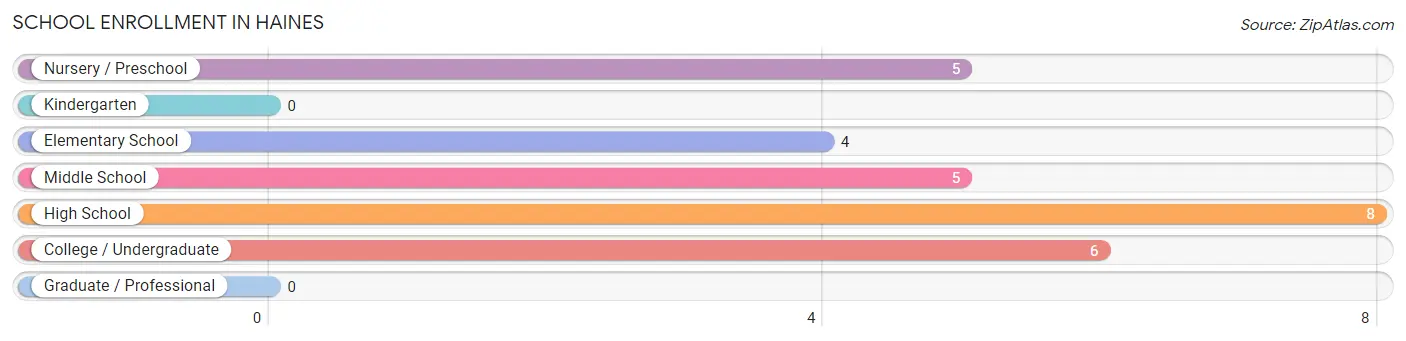
School Enrollment in Haines
The most common levels of schooling among the 28 students in Haines are high school (8 | 28.6%), college / undergraduate (6 | 21.4%), and nursery / preschool (5 | 17.9%).
| School Level | # Students | % Students |
| Nursery / Preschool | 5 | 17.9% |
| Kindergarten | 0 | 0.0% |
| Elementary School | 4 | 14.3% |
| Middle School | 5 | 17.9% |
| High School | 8 | 28.6% |
| College / Undergraduate | 6 | 21.4% |
| Graduate / Professional | 0 | 0.0% |
| Total | 28 | 100.0% |
School Enrollment by Age by Funding Source in Haines
Out of a total of 28 students who are enrolled in schools in Haines, 5 (17.9%) attend a private institution, while the remaining 23 (82.1%) are enrolled in public schools. The age group of 20 to 24 year olds has the highest likelihood of being enrolled in private schools, with 5 (100.0% in the age bracket) enrolled. Conversely, the age group of 3 to 4 year olds has the lowest likelihood of being enrolled in a private school, with 5 (100.0% in the age bracket) attending a public institution.
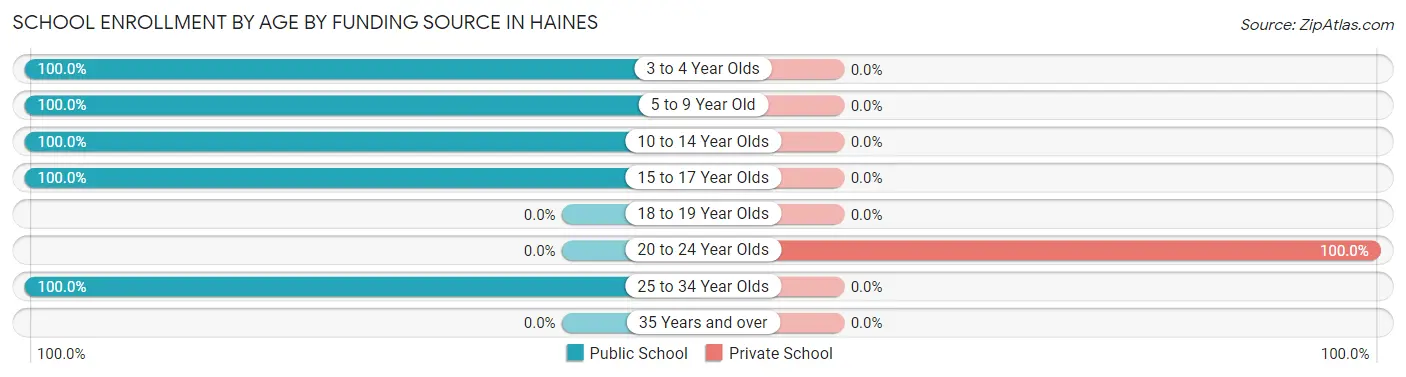
| Age Bracket | Public School | Private School |
| 3 to 4 Year Olds | 5 (100.0%) | 0 (0.0%) |
| 5 to 9 Year Old | 4 (100.0%) | 0 (0.0%) |
| 10 to 14 Year Olds | 11 (100.0%) | 0 (0.0%) |
| 15 to 17 Year Olds | 2 (100.0%) | 0 (0.0%) |
| 18 to 19 Year Olds | 0 (0.0%) | 0 (0.0%) |
| 20 to 24 Year Olds | 0 (0.0%) | 5 (100.0%) |
| 25 to 34 Year Olds | 1 (100.0%) | 0 (0.0%) |
| 35 Years and over | 0 (0.0%) | 0 (0.0%) |
| Total | 23 (82.1%) | 5 (17.9%) |
Educational Attainment by Field of Study in Haines
Psychology (6 | 24.0%), engineering (5 | 20.0%), science & technology (5 | 20.0%), business (4 | 16.0%), and liberal arts & history (3 | 12.0%) are the most common fields of study among 25 individuals in Haines who have obtained a bachelor's degree or higher.
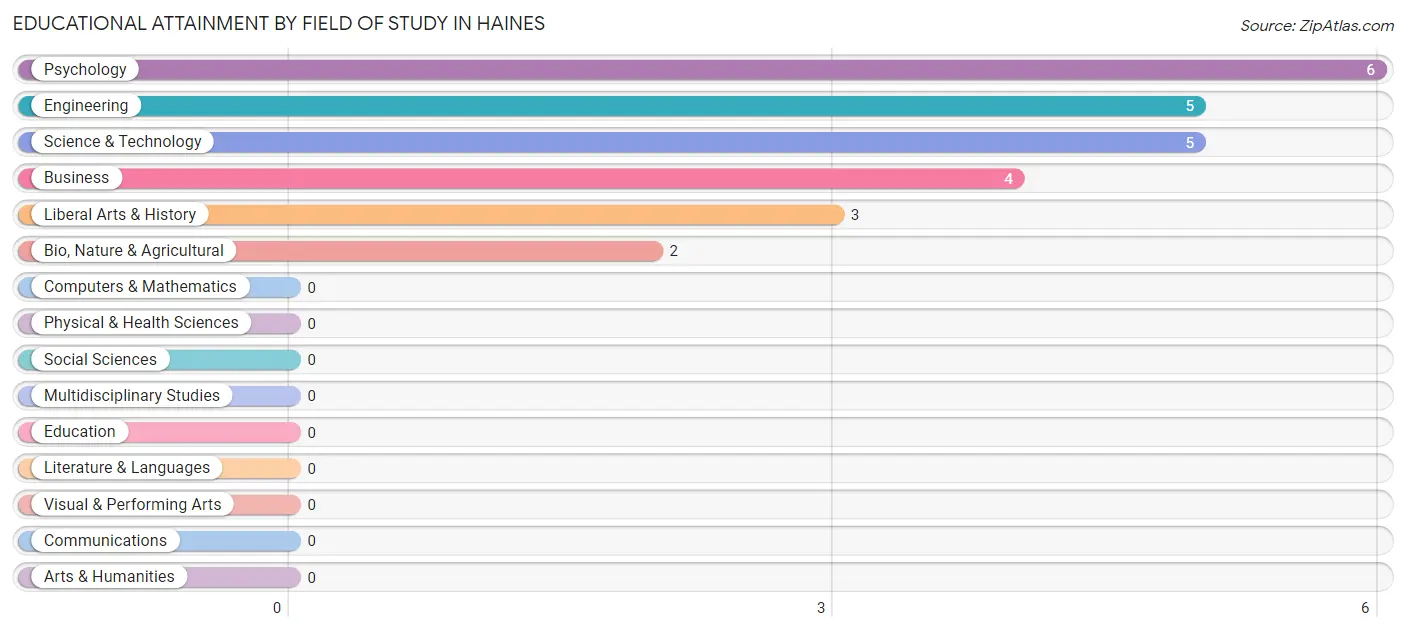
| Field of Study | # Graduates | % Graduates |
| Computers & Mathematics | 0 | 0.0% |
| Bio, Nature & Agricultural | 2 | 8.0% |
| Physical & Health Sciences | 0 | 0.0% |
| Psychology | 6 | 24.0% |
| Social Sciences | 0 | 0.0% |
| Engineering | 5 | 20.0% |
| Multidisciplinary Studies | 0 | 0.0% |
| Science & Technology | 5 | 20.0% |
| Business | 4 | 16.0% |
| Education | 0 | 0.0% |
| Literature & Languages | 0 | 0.0% |
| Liberal Arts & History | 3 | 12.0% |
| Visual & Performing Arts | 0 | 0.0% |
| Communications | 0 | 0.0% |
| Arts & Humanities | 0 | 0.0% |
| Total | 25 | 100.0% |
Transportation & Commute in Haines
Vehicle Availability by Sex in Haines
The most prevalent vehicle ownership categories in Haines are males with 3 vehicles (19, accounting for 38.0%) and females with 3 vehicles (7, making up 55.9%).
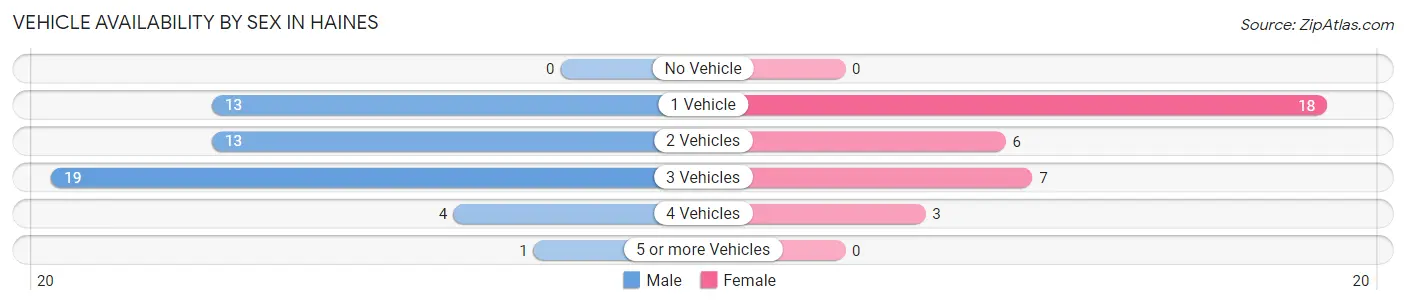
| Vehicles Available | Male | Female |
| No Vehicle | 0 (0.0%) | 0 (0.0%) |
| 1 Vehicle | 13 (26.0%) | 18 (52.9%) |
| 2 Vehicles | 13 (26.0%) | 6 (17.6%) |
| 3 Vehicles | 19 (38.0%) | 7 (20.6%) |
| 4 Vehicles | 4 (8.0%) | 3 (8.8%) |
| 5 or more Vehicles | 1 (2.0%) | 0 (0.0%) |
| Total | 50 (100.0%) | 34 (100.0%) |
Commute Time in Haines
The most frequently occuring commute durations in Haines are 10 to 14 minutes (29 commuters, 40.8%), 15 to 19 minutes (19 commuters, 26.8%), and 20 to 24 minutes (10 commuters, 14.1%).
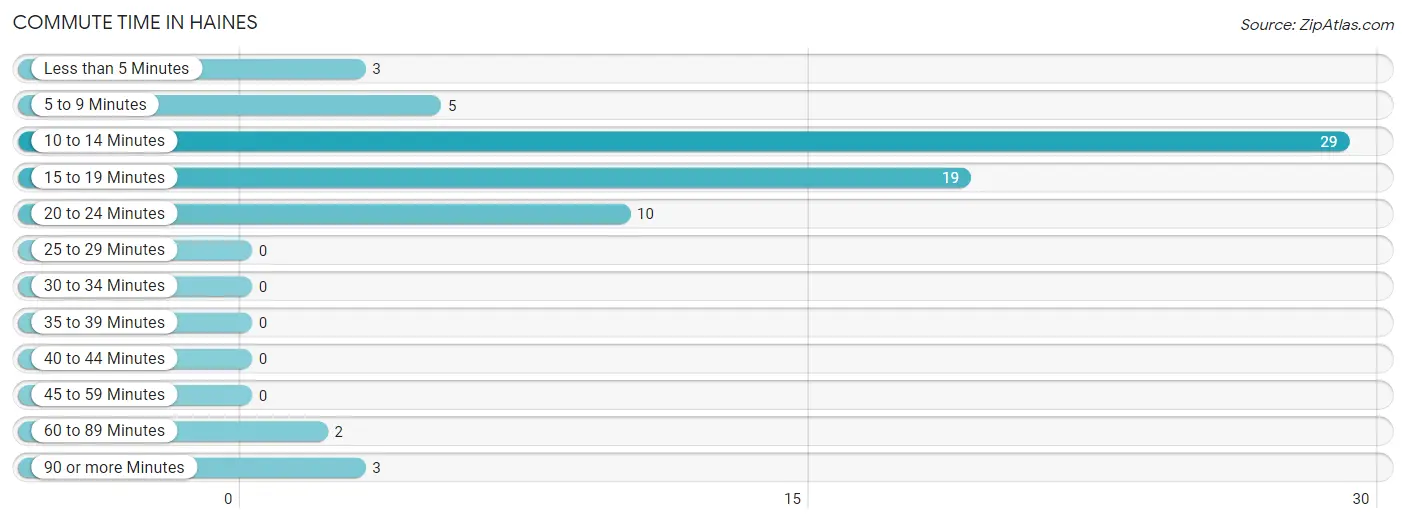
| Commute Time | # Commuters | % Commuters |
| Less than 5 Minutes | 3 | 4.2% |
| 5 to 9 Minutes | 5 | 7.0% |
| 10 to 14 Minutes | 29 | 40.8% |
| 15 to 19 Minutes | 19 | 26.8% |
| 20 to 24 Minutes | 10 | 14.1% |
| 25 to 29 Minutes | 0 | 0.0% |
| 30 to 34 Minutes | 0 | 0.0% |
| 35 to 39 Minutes | 0 | 0.0% |
| 40 to 44 Minutes | 0 | 0.0% |
| 45 to 59 Minutes | 0 | 0.0% |
| 60 to 89 Minutes | 2 | 2.8% |
| 90 or more Minutes | 3 | 4.2% |
Commute Time by Sex in Haines
The most common commute times in Haines are 10 to 14 minutes (18 commuters, 39.1%) for males and 10 to 14 minutes (11 commuters, 44.0%) for females.
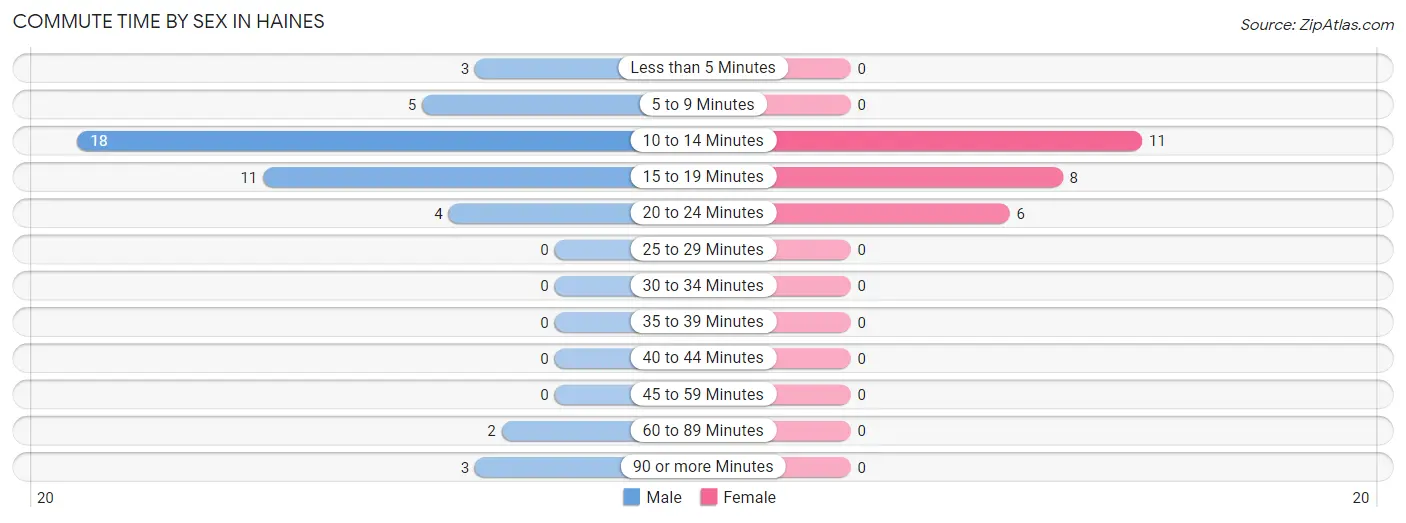
| Commute Time | Male | Female |
| Less than 5 Minutes | 3 (6.5%) | 0 (0.0%) |
| 5 to 9 Minutes | 5 (10.9%) | 0 (0.0%) |
| 10 to 14 Minutes | 18 (39.1%) | 11 (44.0%) |
| 15 to 19 Minutes | 11 (23.9%) | 8 (32.0%) |
| 20 to 24 Minutes | 4 (8.7%) | 6 (24.0%) |
| 25 to 29 Minutes | 0 (0.0%) | 0 (0.0%) |
| 30 to 34 Minutes | 0 (0.0%) | 0 (0.0%) |
| 35 to 39 Minutes | 0 (0.0%) | 0 (0.0%) |
| 40 to 44 Minutes | 0 (0.0%) | 0 (0.0%) |
| 45 to 59 Minutes | 0 (0.0%) | 0 (0.0%) |
| 60 to 89 Minutes | 2 (4.3%) | 0 (0.0%) |
| 90 or more Minutes | 3 (6.5%) | 0 (0.0%) |
Time of Departure to Work by Sex in Haines
The most frequent times of departure to work in Haines are 6:30 AM to 6:59 AM (10, 21.7%) for males and 7:30 AM to 7:59 AM (8, 32.0%) for females.

| Time of Departure | Male | Female |
| 12:00 AM to 4:59 AM | 0 (0.0%) | 5 (20.0%) |
| 5:00 AM to 5:29 AM | 5 (10.9%) | 0 (0.0%) |
| 5:30 AM to 5:59 AM | 0 (0.0%) | 0 (0.0%) |
| 6:00 AM to 6:29 AM | 6 (13.0%) | 0 (0.0%) |
| 6:30 AM to 6:59 AM | 10 (21.7%) | 3 (12.0%) |
| 7:00 AM to 7:29 AM | 0 (0.0%) | 0 (0.0%) |
| 7:30 AM to 7:59 AM | 8 (17.4%) | 8 (32.0%) |
| 8:00 AM to 8:29 AM | 3 (6.5%) | 0 (0.0%) |
| 8:30 AM to 8:59 AM | 0 (0.0%) | 3 (12.0%) |
| 9:00 AM to 9:59 AM | 5 (10.9%) | 0 (0.0%) |
| 10:00 AM to 10:59 AM | 0 (0.0%) | 0 (0.0%) |
| 11:00 AM to 11:59 AM | 0 (0.0%) | 0 (0.0%) |
| 12:00 PM to 3:59 PM | 0 (0.0%) | 6 (24.0%) |
| 4:00 PM to 11:59 PM | 9 (19.6%) | 0 (0.0%) |
| Total | 46 (100.0%) | 25 (100.0%) |
Housing Occupancy in Haines
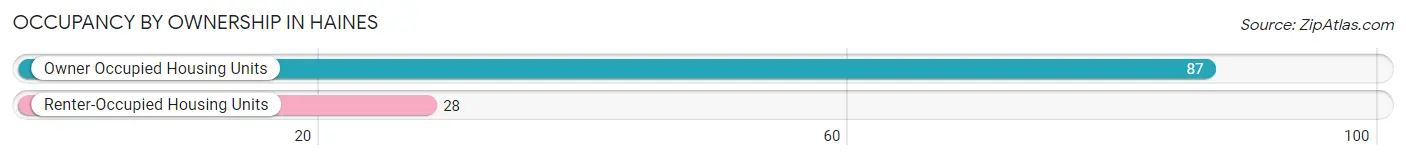
Occupancy by Ownership in Haines
Of the total 115 dwellings in Haines, owner-occupied units account for 87 (75.6%), while renter-occupied units make up 28 (24.3%).
| Occupancy | # Housing Units | % Housing Units |
| Owner Occupied Housing Units | 87 | 75.6% |
| Renter-Occupied Housing Units | 28 | 24.3% |
| Total Occupied Housing Units | 115 | 100.0% |
Occupancy by Household Size in Haines
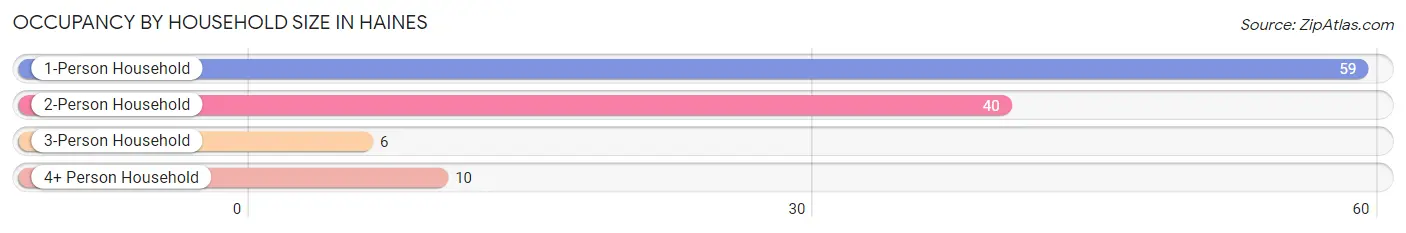
| Household Size | # Housing Units | % Housing Units |
| 1-Person Household | 59 | 51.3% |
| 2-Person Household | 40 | 34.8% |
| 3-Person Household | 6 | 5.2% |
| 4+ Person Household | 10 | 8.7% |
| Total Housing Units | 115 | 100.0% |
Occupancy by Ownership by Household Size in Haines
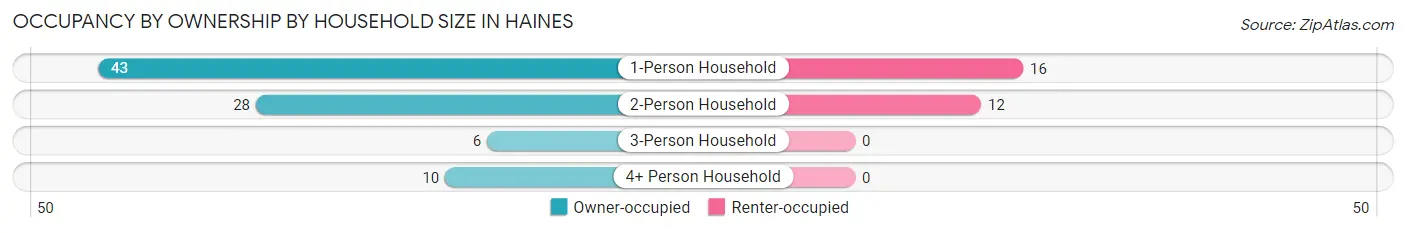
| Household Size | Owner-occupied | Renter-occupied |
| 1-Person Household | 43 (72.9%) | 16 (27.1%) |
| 2-Person Household | 28 (70.0%) | 12 (30.0%) |
| 3-Person Household | 6 (100.0%) | 0 (0.0%) |
| 4+ Person Household | 10 (100.0%) | 0 (0.0%) |
| Total Housing Units | 87 (75.6%) | 28 (24.3%) |
Occupancy by Educational Attainment in Haines
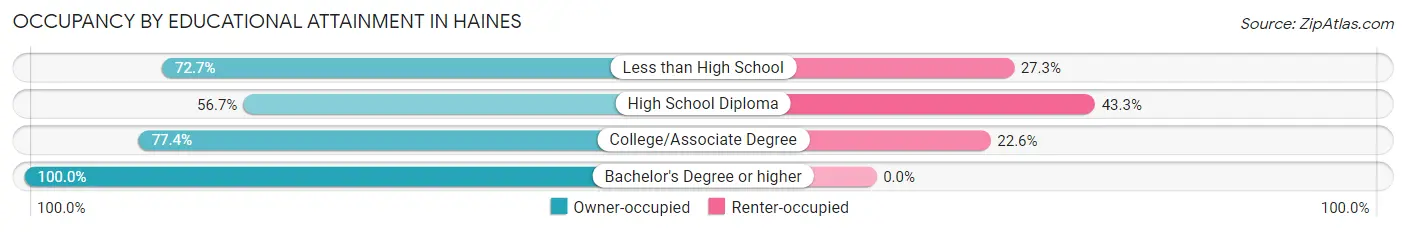
| Household Size | Owner-occupied | Renter-occupied |
| Less than High School | 8 (72.7%) | 3 (27.3%) |
| High School Diploma | 17 (56.7%) | 13 (43.3%) |
| College/Associate Degree | 41 (77.4%) | 12 (22.6%) |
| Bachelor's Degree or higher | 21 (100.0%) | 0 (0.0%) |
Occupancy by Age of Householder in Haines
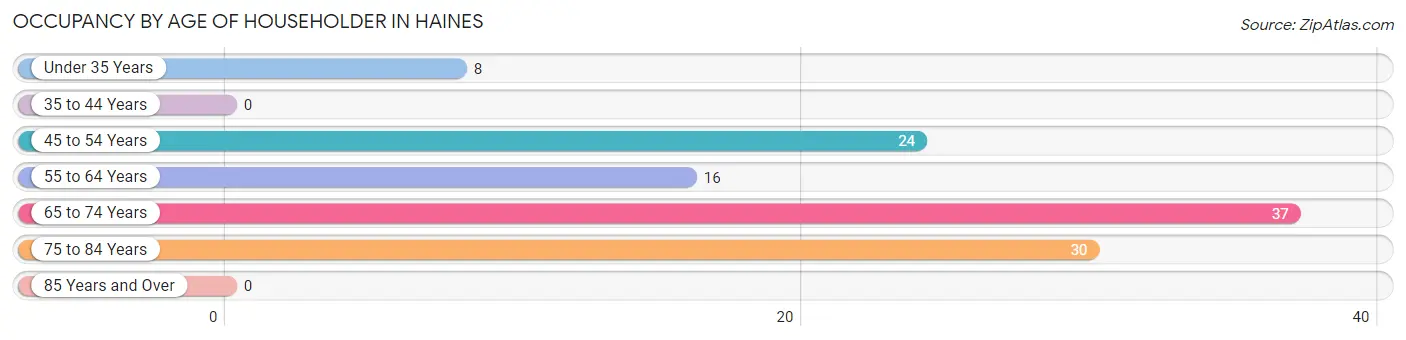
| Age Bracket | # Households | % Households |
| Under 35 Years | 8 | 7.0% |
| 35 to 44 Years | 0 | 0.0% |
| 45 to 54 Years | 24 | 20.9% |
| 55 to 64 Years | 16 | 13.9% |
| 65 to 74 Years | 37 | 32.2% |
| 75 to 84 Years | 30 | 26.1% |
| 85 Years and Over | 0 | 0.0% |
| Total | 115 | 100.0% |
Housing Finances in Haines
Median Income by Occupancy in Haines
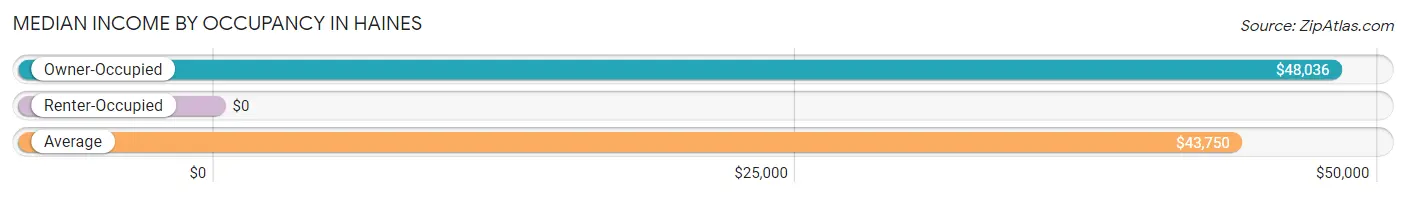
| Occupancy Type | # Households | Median Income |
| Owner-Occupied | 87 (75.6%) | $48,036 |
| Renter-Occupied | 28 (24.3%) | $0 |
| Average | 115 (100.0%) | $43,750 |
Occupancy by Householder Income Bracket in Haines
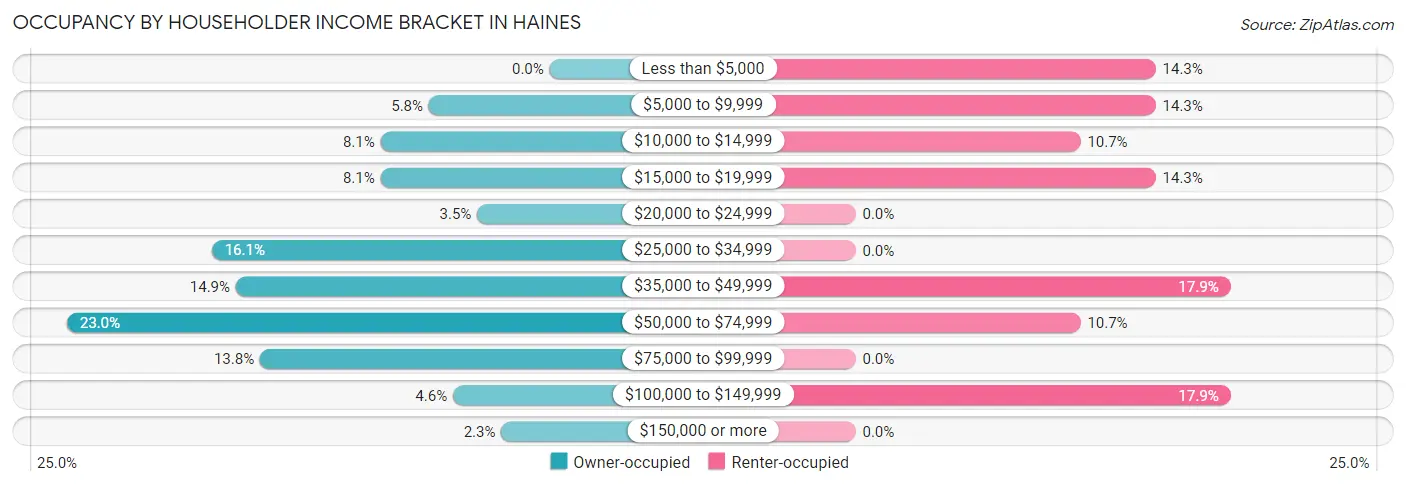
| Income Bracket | Owner-occupied | Renter-occupied |
| Less than $5,000 | 0 (0.0%) | 4 (14.3%) |
| $5,000 to $9,999 | 5 (5.8%) | 4 (14.3%) |
| $10,000 to $14,999 | 7 (8.1%) | 3 (10.7%) |
| $15,000 to $19,999 | 7 (8.1%) | 4 (14.3%) |
| $20,000 to $24,999 | 3 (3.5%) | 0 (0.0%) |
| $25,000 to $34,999 | 14 (16.1%) | 0 (0.0%) |
| $35,000 to $49,999 | 13 (14.9%) | 5 (17.9%) |
| $50,000 to $74,999 | 20 (23.0%) | 3 (10.7%) |
| $75,000 to $99,999 | 12 (13.8%) | 0 (0.0%) |
| $100,000 to $149,999 | 4 (4.6%) | 5 (17.9%) |
| $150,000 or more | 2 (2.3%) | 0 (0.0%) |
| Total | 87 (100.0%) | 28 (100.0%) |
Monthly Housing Cost Tiers in Haines
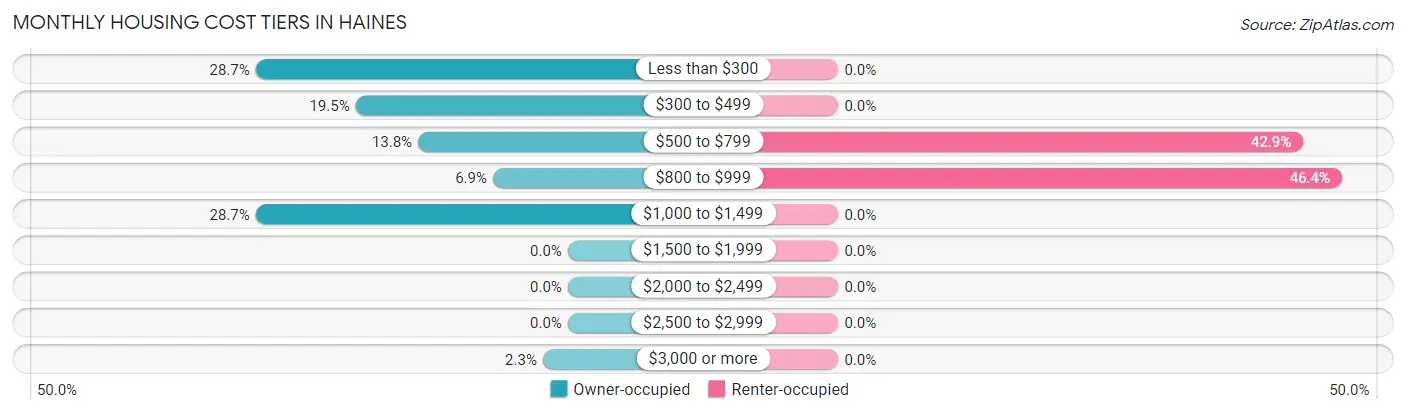
| Monthly Cost | Owner-occupied | Renter-occupied |
| Less than $300 | 25 (28.7%) | 0 (0.0%) |
| $300 to $499 | 17 (19.5%) | 0 (0.0%) |
| $500 to $799 | 12 (13.8%) | 12 (42.9%) |
| $800 to $999 | 6 (6.9%) | 13 (46.4%) |
| $1,000 to $1,499 | 25 (28.7%) | 0 (0.0%) |
| $1,500 to $1,999 | 0 (0.0%) | 0 (0.0%) |
| $2,000 to $2,499 | 0 (0.0%) | 0 (0.0%) |
| $2,500 to $2,999 | 0 (0.0%) | 0 (0.0%) |
| $3,000 or more | 2 (2.3%) | 0 (0.0%) |
| Total | 87 (100.0%) | 28 (100.0%) |
Physical Housing Characteristics in Haines
Housing Structures in Haines
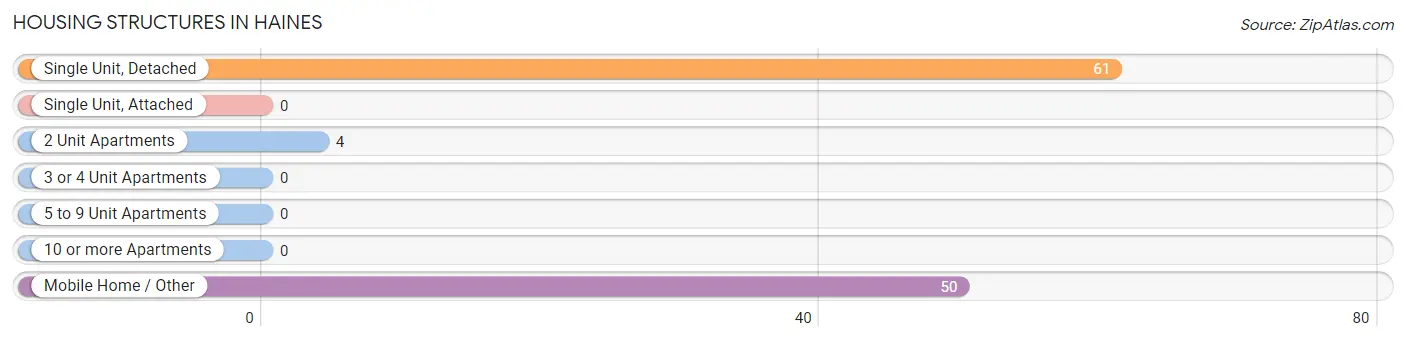
| Structure Type | # Housing Units | % Housing Units |
| Single Unit, Detached | 61 | 53.0% |
| Single Unit, Attached | 0 | 0.0% |
| 2 Unit Apartments | 4 | 3.5% |
| 3 or 4 Unit Apartments | 0 | 0.0% |
| 5 to 9 Unit Apartments | 0 | 0.0% |
| 10 or more Apartments | 0 | 0.0% |
| Mobile Home / Other | 50 | 43.5% |
| Total | 115 | 100.0% |
Housing Structures by Occupancy in Haines
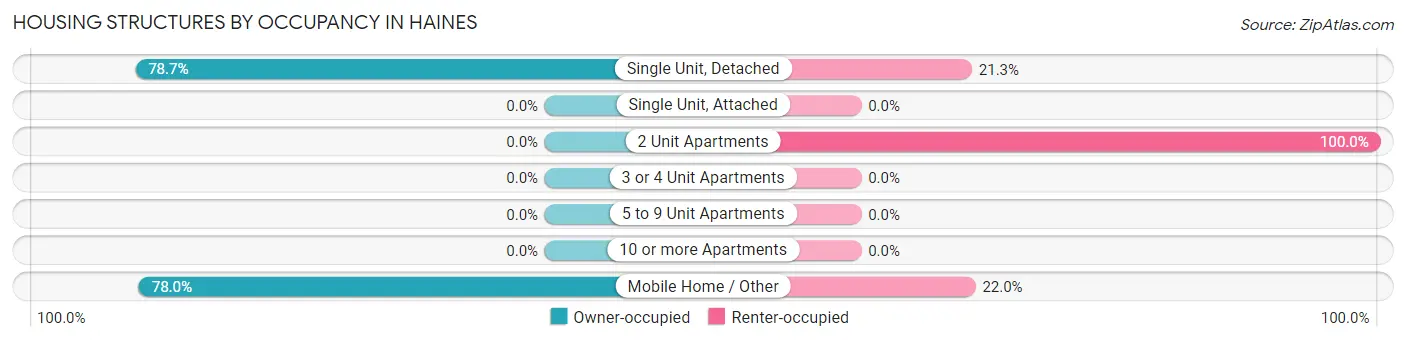
| Structure Type | Owner-occupied | Renter-occupied |
| Single Unit, Detached | 48 (78.7%) | 13 (21.3%) |
| Single Unit, Attached | 0 (0.0%) | 0 (0.0%) |
| 2 Unit Apartments | 0 (0.0%) | 4 (100.0%) |
| 3 or 4 Unit Apartments | 0 (0.0%) | 0 (0.0%) |
| 5 to 9 Unit Apartments | 0 (0.0%) | 0 (0.0%) |
| 10 or more Apartments | 0 (0.0%) | 0 (0.0%) |
| Mobile Home / Other | 39 (78.0%) | 11 (22.0%) |
| Total | 87 (75.6%) | 28 (24.3%) |
Housing Structures by Number of Rooms in Haines
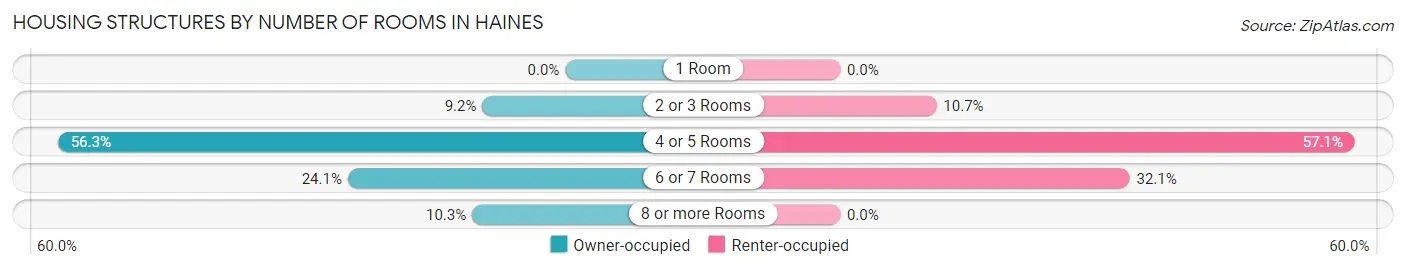
| Number of Rooms | Owner-occupied | Renter-occupied |
| 1 Room | 0 (0.0%) | 0 (0.0%) |
| 2 or 3 Rooms | 8 (9.2%) | 3 (10.7%) |
| 4 or 5 Rooms | 49 (56.3%) | 16 (57.1%) |
| 6 or 7 Rooms | 21 (24.1%) | 9 (32.1%) |
| 8 or more Rooms | 9 (10.3%) | 0 (0.0%) |
| Total | 87 (100.0%) | 28 (100.0%) |
Housing Structure by Heating Type in Haines
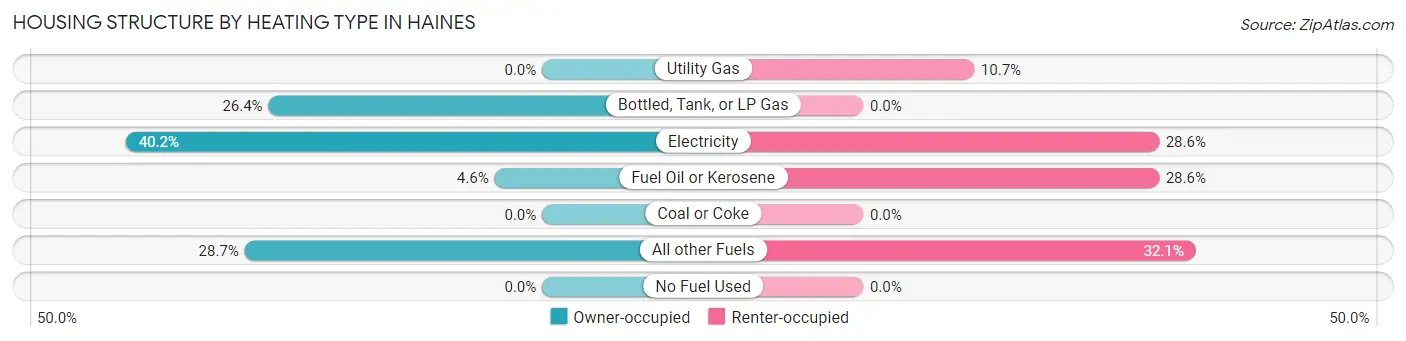
| Heating Type | Owner-occupied | Renter-occupied |
| Utility Gas | 0 (0.0%) | 3 (10.7%) |
| Bottled, Tank, or LP Gas | 23 (26.4%) | 0 (0.0%) |
| Electricity | 35 (40.2%) | 8 (28.6%) |
| Fuel Oil or Kerosene | 4 (4.6%) | 8 (28.6%) |
| Coal or Coke | 0 (0.0%) | 0 (0.0%) |
| All other Fuels | 25 (28.7%) | 9 (32.1%) |
| No Fuel Used | 0 (0.0%) | 0 (0.0%) |
| Total | 87 (100.0%) | 28 (100.0%) |
Household Vehicle Usage in Haines
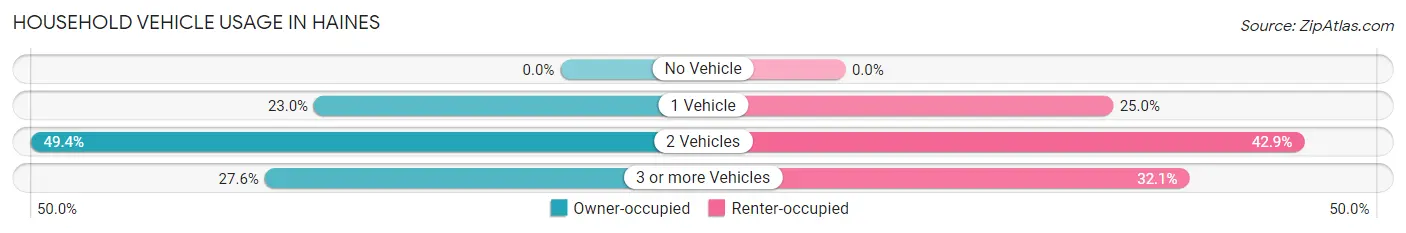
| Vehicles per Household | Owner-occupied | Renter-occupied |
| No Vehicle | 0 (0.0%) | 0 (0.0%) |
| 1 Vehicle | 20 (23.0%) | 7 (25.0%) |
| 2 Vehicles | 43 (49.4%) | 12 (42.9%) |
| 3 or more Vehicles | 24 (27.6%) | 9 (32.1%) |
| Total | 87 (100.0%) | 28 (100.0%) |
Real Estate & Mortgages in Haines
Real Estate and Mortgage Overview in Haines
| Characteristic | Without Mortgage | With Mortgage |
| Housing Units | 43 | 44 |
| Median Property Value | $58,000 | $187,500 |
| Median Household Income | $22,083 | $2 |
| Monthly Housing Costs | $275 | $2 |
| Real Estate Taxes | $458 | $0 |
Property Value by Mortgage Status in Haines
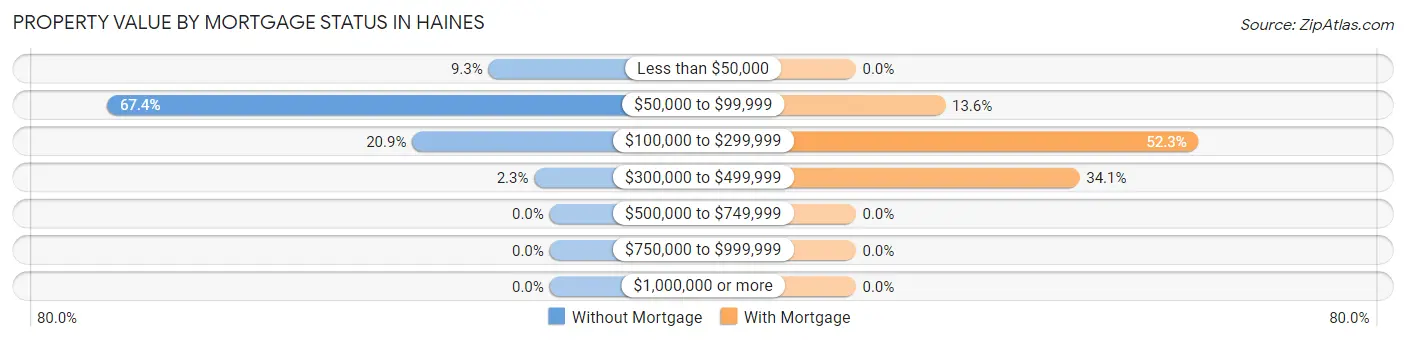
| Property Value | Without Mortgage | With Mortgage |
| Less than $50,000 | 4 (9.3%) | 0 (0.0%) |
| $50,000 to $99,999 | 29 (67.4%) | 6 (13.6%) |
| $100,000 to $299,999 | 9 (20.9%) | 23 (52.3%) |
| $300,000 to $499,999 | 1 (2.3%) | 15 (34.1%) |
| $500,000 to $749,999 | 0 (0.0%) | 0 (0.0%) |
| $750,000 to $999,999 | 0 (0.0%) | 0 (0.0%) |
| $1,000,000 or more | 0 (0.0%) | 0 (0.0%) |
| Total | 43 (100.0%) | 44 (100.0%) |
Household Income by Mortgage Status in Haines
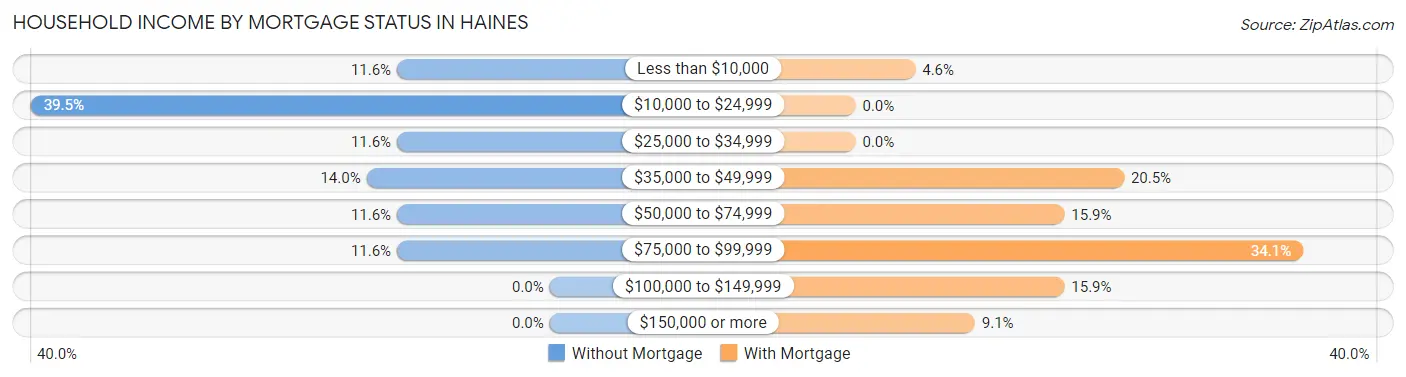
| Household Income | Without Mortgage | With Mortgage |
| Less than $10,000 | 5 (11.6%) | 2 (4.5%) |
| $10,000 to $24,999 | 17 (39.5%) | 0 (0.0%) |
| $25,000 to $34,999 | 5 (11.6%) | 0 (0.0%) |
| $35,000 to $49,999 | 6 (14.0%) | 9 (20.4%) |
| $50,000 to $74,999 | 5 (11.6%) | 7 (15.9%) |
| $75,000 to $99,999 | 5 (11.6%) | 15 (34.1%) |
| $100,000 to $149,999 | 0 (0.0%) | 7 (15.9%) |
| $150,000 or more | 0 (0.0%) | 4 (9.1%) |
| Total | 43 (100.0%) | 44 (100.0%) |
Property Value to Household Income Ratio in Haines
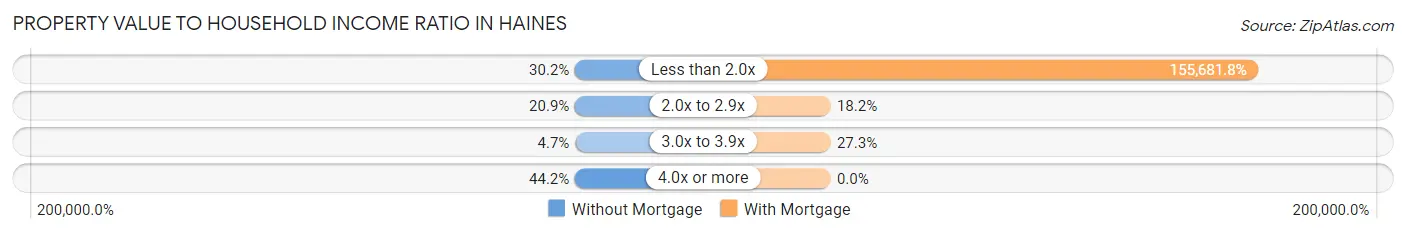
| Value-to-Income Ratio | Without Mortgage | With Mortgage |
| Less than 2.0x | 13 (30.2%) | 68,500 (155,681.8%) |
| 2.0x to 2.9x | 9 (20.9%) | 8 (18.2%) |
| 3.0x to 3.9x | 2 (4.6%) | 12 (27.3%) |
| 4.0x or more | 19 (44.2%) | 0 (0.0%) |
| Total | 43 (100.0%) | 44 (100.0%) |
Real Estate Taxes by Mortgage Status in Haines
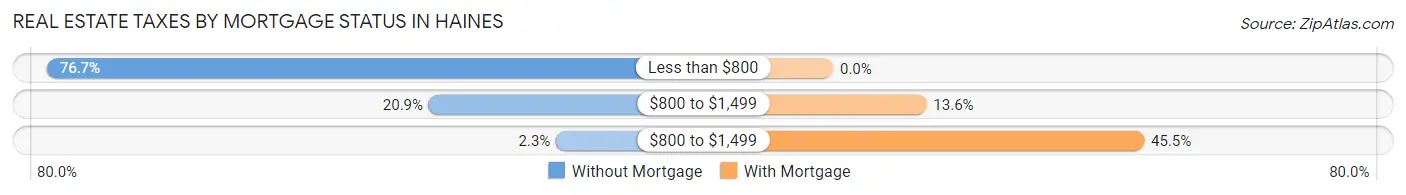
| Property Taxes | Without Mortgage | With Mortgage |
| Less than $800 | 33 (76.7%) | 0 (0.0%) |
| $800 to $1,499 | 9 (20.9%) | 6 (13.6%) |
| $800 to $1,499 | 1 (2.3%) | 20 (45.5%) |
| Total | 43 (100.0%) | 44 (100.0%) |
Health & Disability in Haines
Health Insurance Coverage by Age in Haines
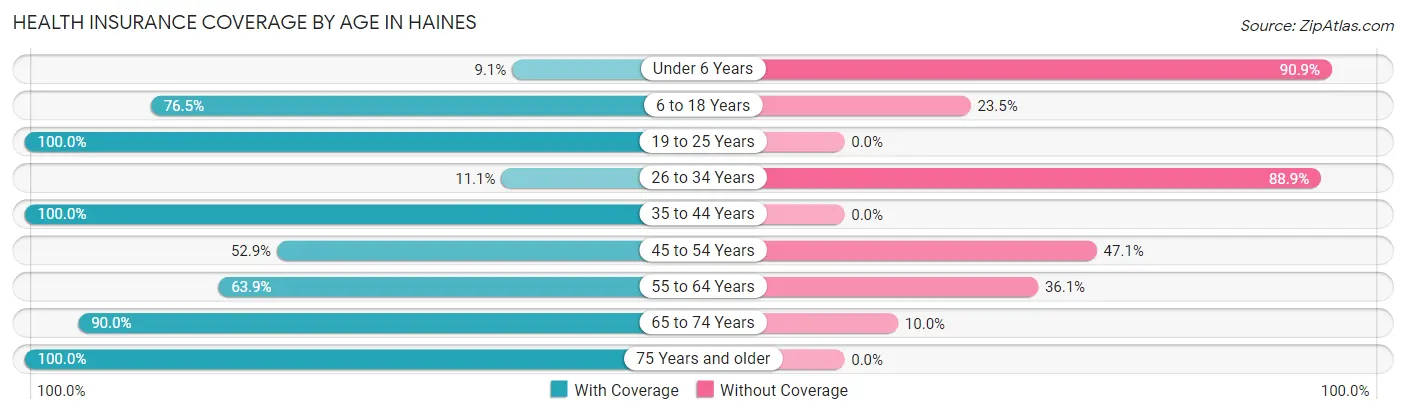
| Age Bracket | With Coverage | Without Coverage |
| Under 6 Years | 1 (9.1%) | 10 (90.9%) |
| 6 to 18 Years | 13 (76.5%) | 4 (23.5%) |
| 19 to 25 Years | 6 (100.0%) | 0 (0.0%) |
| 26 to 34 Years | 2 (11.1%) | 16 (88.9%) |
| 35 to 44 Years | 4 (100.0%) | 0 (0.0%) |
| 45 to 54 Years | 18 (52.9%) | 16 (47.1%) |
| 55 to 64 Years | 23 (63.9%) | 13 (36.1%) |
| 65 to 74 Years | 45 (90.0%) | 5 (10.0%) |
| 75 Years and older | 44 (100.0%) | 0 (0.0%) |
| Total | 156 (70.9%) | 64 (29.1%) |
Health Insurance Coverage by Citizenship Status in Haines
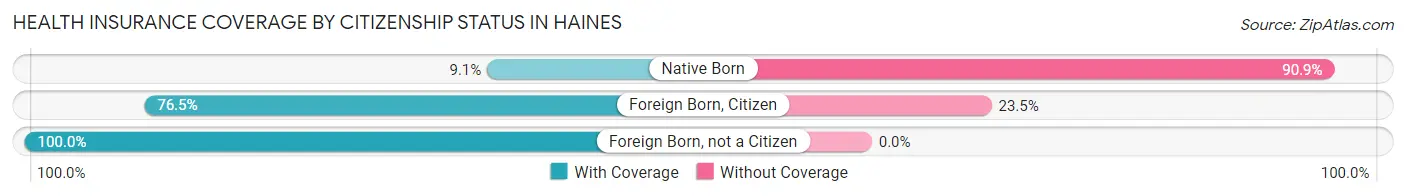
| Citizenship Status | With Coverage | Without Coverage |
| Native Born | 1 (9.1%) | 10 (90.9%) |
| Foreign Born, Citizen | 13 (76.5%) | 4 (23.5%) |
| Foreign Born, not a Citizen | 6 (100.0%) | 0 (0.0%) |
Health Insurance Coverage by Household Income in Haines
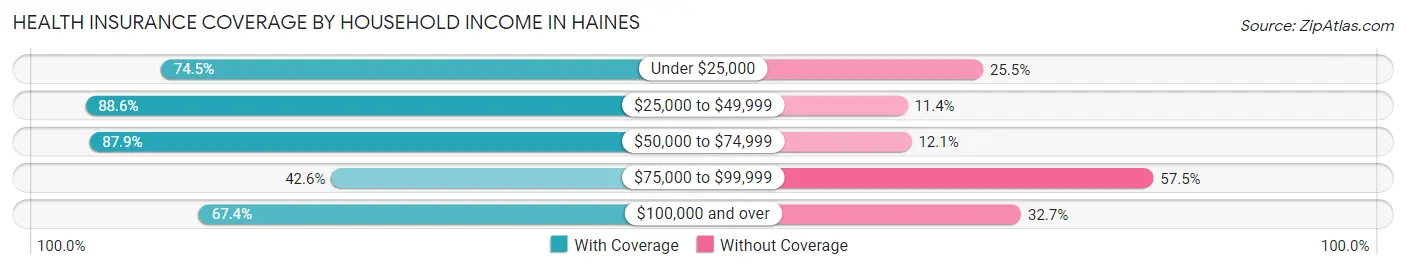
| Household Income | With Coverage | Without Coverage |
| Under $25,000 | 35 (74.5%) | 12 (25.5%) |
| $25,000 to $49,999 | 39 (88.6%) | 5 (11.4%) |
| $50,000 to $74,999 | 29 (87.9%) | 4 (12.1%) |
| $75,000 to $99,999 | 20 (42.5%) | 27 (57.5%) |
| $100,000 and over | 33 (67.3%) | 16 (32.7%) |
Public vs Private Health Insurance Coverage by Age in Haines
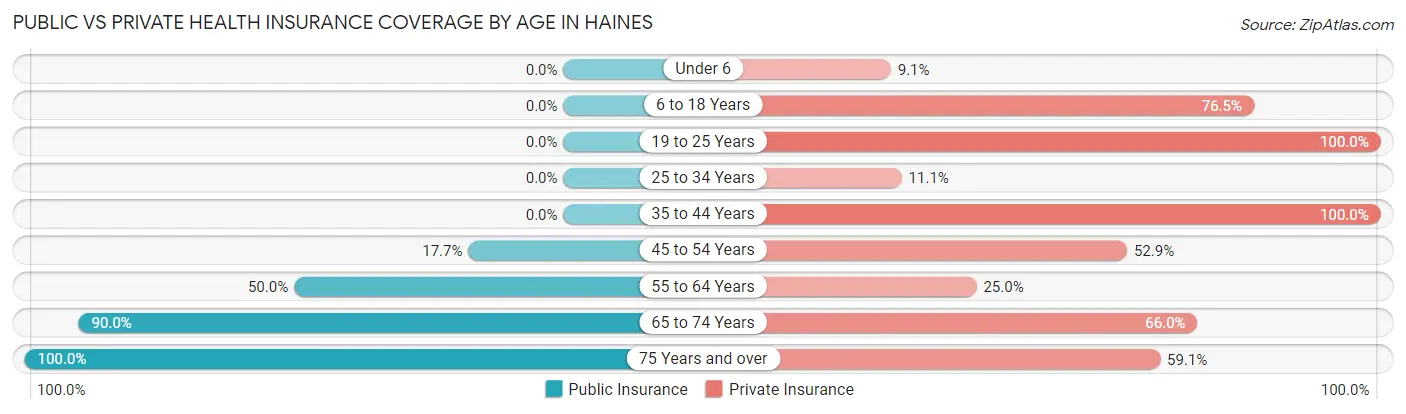
| Age Bracket | Public Insurance | Private Insurance |
| Under 6 | 0 (0.0%) | 1 (9.1%) |
| 6 to 18 Years | 0 (0.0%) | 13 (76.5%) |
| 19 to 25 Years | 0 (0.0%) | 6 (100.0%) |
| 25 to 34 Years | 0 (0.0%) | 2 (11.1%) |
| 35 to 44 Years | 0 (0.0%) | 4 (100.0%) |
| 45 to 54 Years | 6 (17.6%) | 18 (52.9%) |
| 55 to 64 Years | 18 (50.0%) | 9 (25.0%) |
| 65 to 74 Years | 45 (90.0%) | 33 (66.0%) |
| 75 Years and over | 44 (100.0%) | 26 (59.1%) |
| Total | 113 (51.4%) | 112 (50.9%) |
Disability Status by Sex by Age in Haines
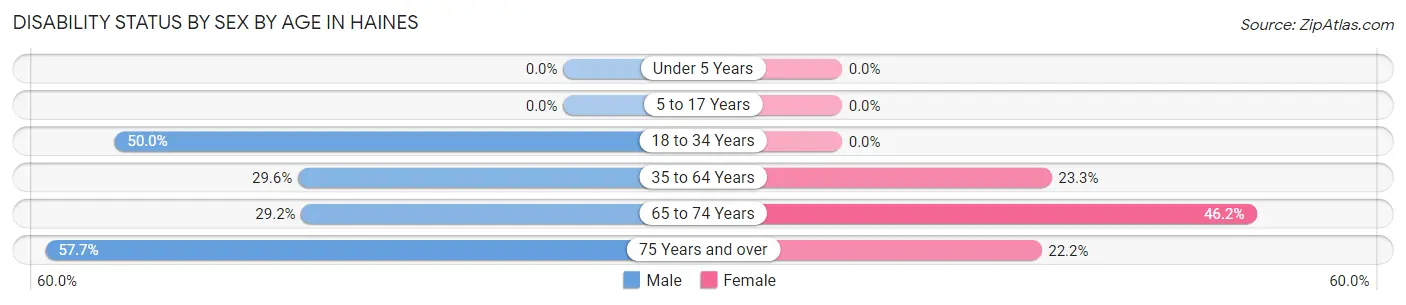
| Age Bracket | Male | Female |
| Under 5 Years | 0 (0.0%) | 0 (0.0%) |
| 5 to 17 Years | 0 (0.0%) | 0 (0.0%) |
| 18 to 34 Years | 5 (50.0%) | 0 (0.0%) |
| 35 to 64 Years | 13 (29.5%) | 7 (23.3%) |
| 65 to 74 Years | 7 (29.2%) | 12 (46.2%) |
| 75 Years and over | 15 (57.7%) | 4 (22.2%) |
Disability Class by Sex by Age in Haines
Disability Class: Hearing Difficulty
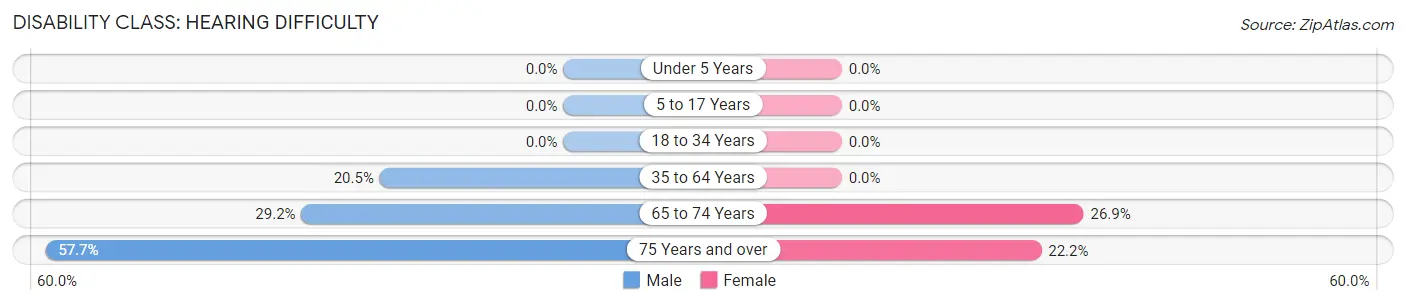
| Age Bracket | Male | Female |
| Under 5 Years | 0 (0.0%) | 0 (0.0%) |
| 5 to 17 Years | 0 (0.0%) | 0 (0.0%) |
| 18 to 34 Years | 0 (0.0%) | 0 (0.0%) |
| 35 to 64 Years | 9 (20.4%) | 0 (0.0%) |
| 65 to 74 Years | 7 (29.2%) | 7 (26.9%) |
| 75 Years and over | 15 (57.7%) | 4 (22.2%) |
Disability Class: Vision Difficulty
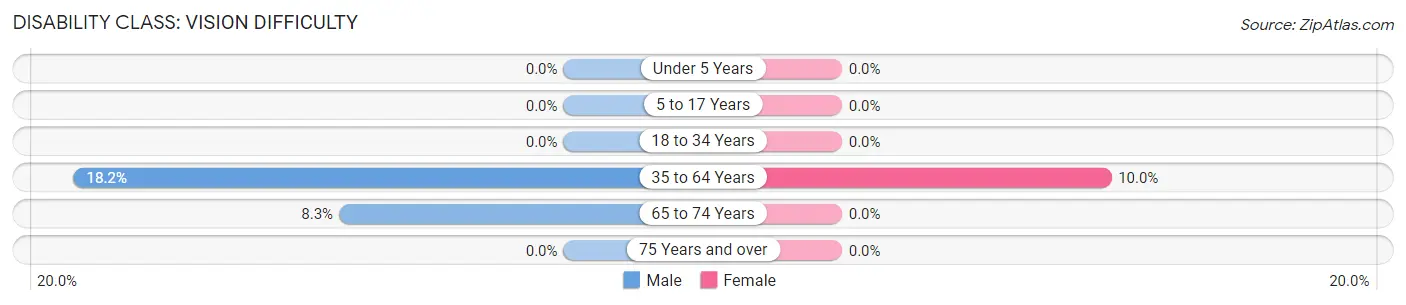
| Age Bracket | Male | Female |
| Under 5 Years | 0 (0.0%) | 0 (0.0%) |
| 5 to 17 Years | 0 (0.0%) | 0 (0.0%) |
| 18 to 34 Years | 0 (0.0%) | 0 (0.0%) |
| 35 to 64 Years | 8 (18.2%) | 3 (10.0%) |
| 65 to 74 Years | 2 (8.3%) | 0 (0.0%) |
| 75 Years and over | 0 (0.0%) | 0 (0.0%) |
Disability Class: Cognitive Difficulty
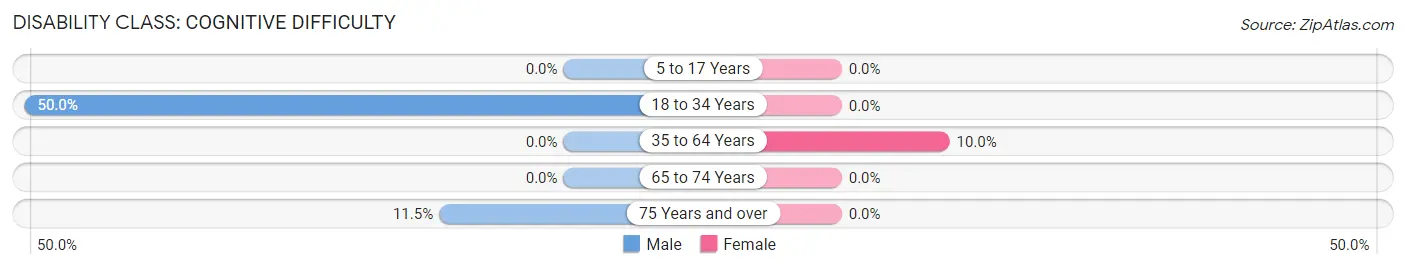
| Age Bracket | Male | Female |
| 5 to 17 Years | 0 (0.0%) | 0 (0.0%) |
| 18 to 34 Years | 5 (50.0%) | 0 (0.0%) |
| 35 to 64 Years | 0 (0.0%) | 3 (10.0%) |
| 65 to 74 Years | 0 (0.0%) | 0 (0.0%) |
| 75 Years and over | 3 (11.5%) | 0 (0.0%) |
Disability Class: Ambulatory Difficulty
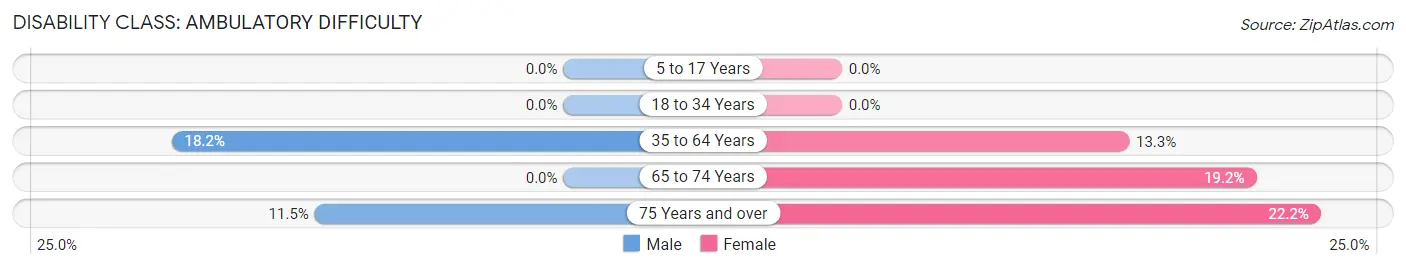
| Age Bracket | Male | Female |
| 5 to 17 Years | 0 (0.0%) | 0 (0.0%) |
| 18 to 34 Years | 0 (0.0%) | 0 (0.0%) |
| 35 to 64 Years | 8 (18.2%) | 4 (13.3%) |
| 65 to 74 Years | 0 (0.0%) | 5 (19.2%) |
| 75 Years and over | 3 (11.5%) | 4 (22.2%) |
Disability Class: Self-Care Difficulty
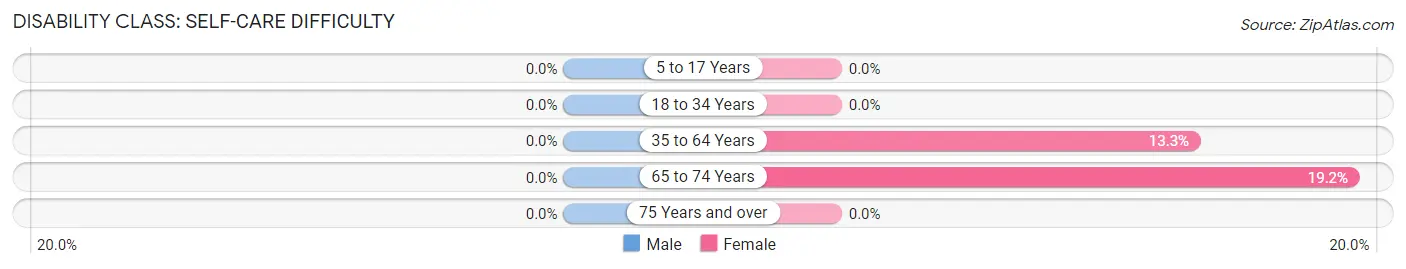
| Age Bracket | Male | Female |
| 5 to 17 Years | 0 (0.0%) | 0 (0.0%) |
| 18 to 34 Years | 0 (0.0%) | 0 (0.0%) |
| 35 to 64 Years | 0 (0.0%) | 4 (13.3%) |
| 65 to 74 Years | 0 (0.0%) | 5 (19.2%) |
| 75 Years and over | 0 (0.0%) | 0 (0.0%) |
Technology Access in Haines
Computing Device Access in Haines
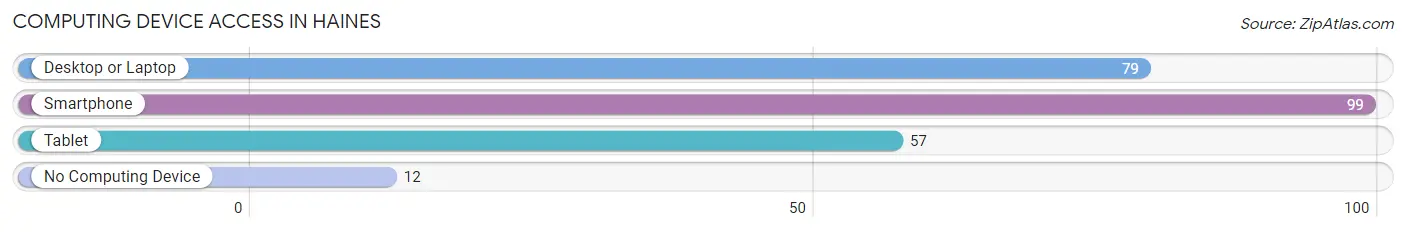
| Device Type | # Households | % Households |
| Desktop or Laptop | 79 | 68.7% |
| Smartphone | 99 | 86.1% |
| Tablet | 57 | 49.6% |
| No Computing Device | 12 | 10.4% |
| Total | 115 | 100.0% |
Internet Access in Haines
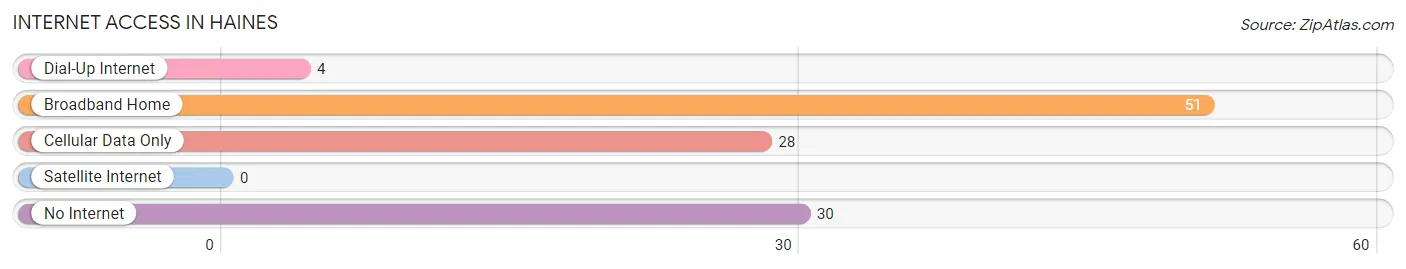
| Internet Type | # Households | % Households |
| Dial-Up Internet | 4 | 3.5% |
| Broadband Home | 51 | 44.4% |
| Cellular Data Only | 28 | 24.3% |
| Satellite Internet | 0 | 0.0% |
| No Internet | 30 | 26.1% |
| Total | 115 | 100.0% |
Haines Summary
Haines is a small city located in the northeastern corner of Oregon, United States. It is situated in the Columbia River Gorge, a region of the Pacific Northwest known for its stunning natural beauty. The city is located in the county of Wasco, and is part of the larger metropolitan area of The Dalles. The population of Haines was 1,845 at the time of the 2000 census.
Geography
Haines is located at 45°37'17" North, 121°11'17" West (45.6214, -121.1881). It is situated in the Columbia River Gorge, a region of the Pacific Northwest known for its stunning natural beauty. The city is located in the county of Wasco, and is part of the larger metropolitan area of The Dalles. The city is situated on the banks of the Columbia River, and is surrounded by the Cascade Mountains to the east and the Columbia River Gorge to the west.
The city has a total area of 1.2 square miles, all of which is land. The elevation of Haines is 845 feet above sea level. The climate of the area is generally mild, with warm summers and cool winters.
History
Haines was founded in 1883 by a group of settlers from the Midwest. The city was named after the Haines family, who were among the first settlers in the area. The city was incorporated in 1887, and the first post office was established in 1888.
The city grew steadily throughout the late 19th and early 20th centuries, and by the 1950s, it had become a thriving agricultural and logging community. The city was also home to a number of small businesses, including a sawmill, a flour mill, and a cannery.
Economy
The economy of Haines is largely based on agriculture and tourism. The city is home to a number of farms, which produce a variety of crops, including wheat, corn, and hay. The city is also home to a number of wineries, which produce a variety of wines.
Tourism is also an important part of the local economy. The city is home to a number of attractions, including the Columbia River Gorge National Scenic Area, the Haines State Park, and the Haines Historical Museum. The city is also home to a number of outdoor recreation opportunities, including fishing, hiking, and camping.
Demographics
As of the 2000 census, there were 1,845 people, 745 households, and 486 families residing in the city. The population density was 1,521.2 people per square mile. There were 809 housing units at an average density of 667.2 per square mile. The racial makeup of the city was 91.2% White, 0.2% African American, 0.7% Native American, 0.4% Asian, 0.1% Pacific Islander, 4.7% from other races, and 2.7% from two or more races. Hispanic or Latino of any race were 8.2% of the population.
There were 745 households, out of which 28.2% had children under the age of 18 living with them, 51.2% were married couples living together, 9.7% had a female householder with no husband present, and 34.7% were non-families. 29.2% of all households were made up of individuals, and 13.2% had someone living alone who was 65 years of age or older. The average household size was 2.45 and the average family size was 3.02.
In the city, the population was spread out, with 25.2% under the age of 18, 8.2% from 18 to 24, 25.2% from 25 to 44, 24.2% from 45 to 64, and 17.2% who were 65 years of age or older. The median age was 38 years. For every 100 females, there were 97.2 males. For every 100 females age 18 and over, there were 92.2 males.
The median income for a household in the city was $30,938, and the median income for a family was $36,250. Males had a median income of $30,000 versus $21,250 for females. The per capita income for the city was $15,845. About 11.2% of families and 14.2% of the population were below the poverty line, including 19.2% of those under age 18 and 8.2% of those age 65 or over.
Common Questions
What is the Total Population of Haines?
Total Population of Haines is 220.
What is the Total Male Population of Haines?
Total Male Population of Haines is 117.
What is the Total Female Population of Haines?
Total Female Population of Haines is 103.
What is the Ratio of Males per 100 Females in Haines?
There are 113.59 Males per 100 Females in Haines.
What is the Ratio of Females per 100 Males in Haines?
There are 88.03 Females per 100 Males in Haines.
What is the Median Population Age in Haines?
Median Population Age in Haines is 61.5 Years.
What is the Average Family Size in Haines
Average Family Size in Haines is 2.8 People.
What is the Average Household Size in Haines
Average Household Size in Haines is 1.9 People.
What is Per Capita Income in Haines?
Per Capita income in Haines is $27,629.
What is the Median Family Income in Haines?
Median Family Income in Haines is $66,250.
What is the Median Household income in Haines?
Median Household Income in Haines is $43,750.
What is Inequality or Gini Index in Haines?
Inequality or Gini Index in Haines is 0.41.
How Large is the Labor Force in Haines?
There are 100 People in the Labor Forcein in Haines.
What is the Percentage of People in the Labor Force in Haines?
51.5% of People are in the Labor Force in Haines.
What is the Unemployment Rate in Haines?
Unemployment Rate in Haines is 16.0%.