Cities with the Highest Percentage of Population with a Degree in Liberal Arts and History in Iowa
RELATED REPORTS & OPTIONS
Liberal Arts and History
Iowa
Compare Cities
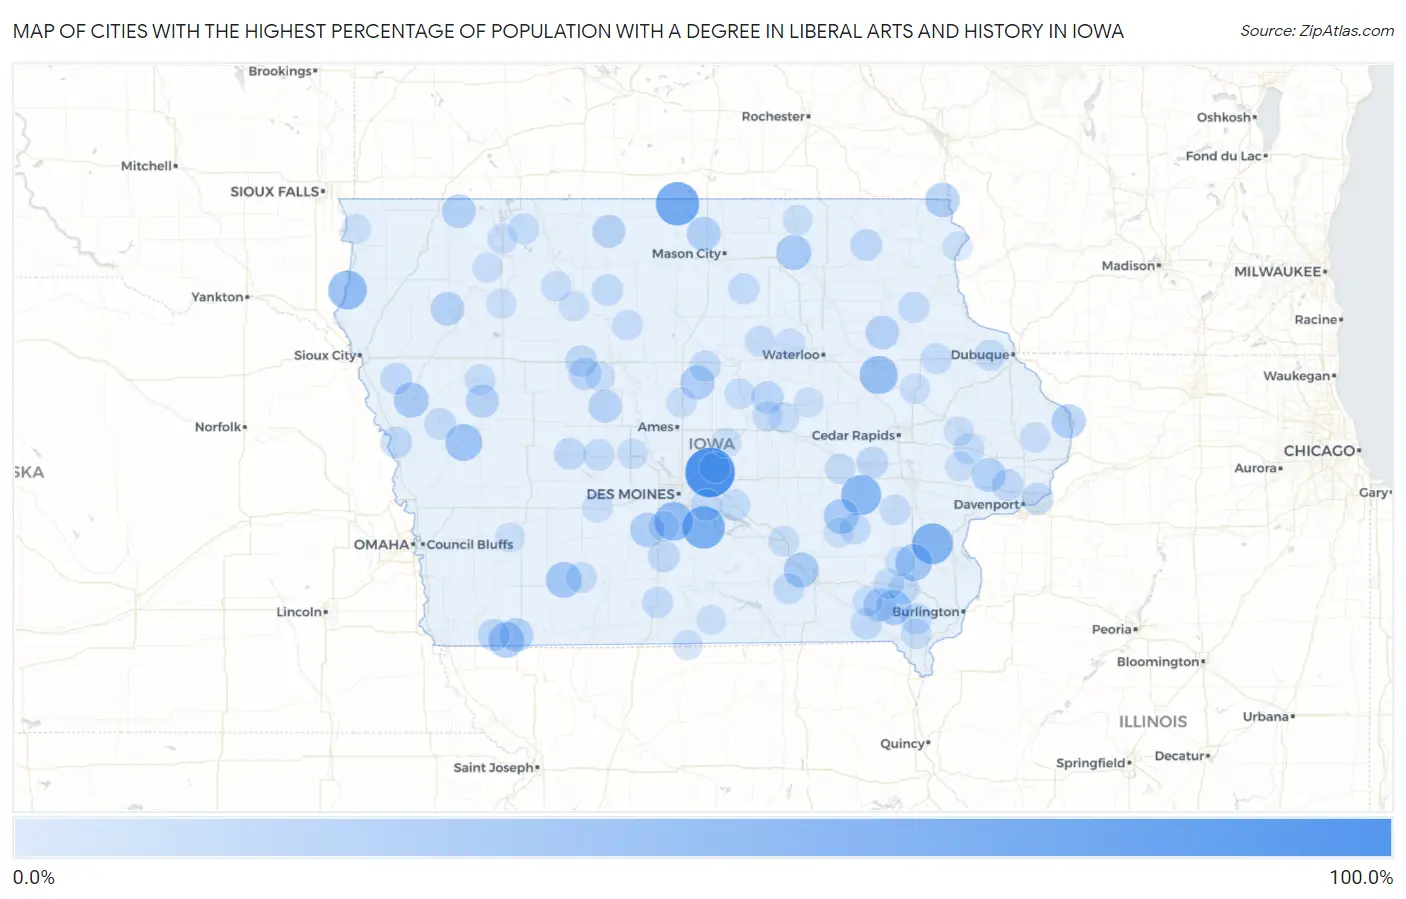
Map of Cities with the Highest Percentage of Population with a Degree in Liberal Arts and History in Iowa
0.0%
100.0%
Cities with the Highest Percentage of Population with a Degree in Liberal Arts and History in Iowa
| City | % Graduates | vs State | vs National | |
| 1. | Valeria | 100.0% | 4.5%(+95.5)#1 | 4.9%(+95.1)#82 |
| 2. | Scarville | 71.4% | 4.5%(+66.9)#2 | 4.9%(+66.6)#128 |
| 3. | Sandyville | 66.7% | 4.5%(+62.2)#3 | 4.9%(+61.8)#149 |
| 4. | Columbus City | 60.0% | 4.5%(+55.5)#4 | 4.9%(+55.1)#175 |
| 5. | Parnell | 55.6% | 4.5%(+51.0)#5 | 4.9%(+50.7)#198 |
| 6. | Chatsworth | 50.0% | 4.5%(+45.5)#6 | 4.9%(+45.1)#262 |
| 7. | Spring Hill | 50.0% | 4.5%(+45.5)#7 | 4.9%(+45.1)#264 |
| 8. | Rowley | 47.2% | 4.5%(+42.7)#8 | 4.9%(+42.3)#291 |
| 9. | Dow City | 41.7% | 4.5%(+37.2)#9 | 4.9%(+36.8)#358 |
| 10. | Olds | 41.7% | 4.5%(+37.2)#10 | 4.9%(+36.8)#359 |
| 11. | Prescott | 36.8% | 4.5%(+32.3)#11 | 4.9%(+32.0)#438 |
| 12. | College Springs | 35.7% | 4.5%(+31.2)#12 | 4.9%(+30.8)#468 |
| 13. | Webster | 33.3% | 4.5%(+28.8)#13 | 4.9%(+28.5)#539 |
| 14. | Hillsboro | 33.3% | 4.5%(+28.8)#14 | 4.9%(+28.5)#540 |
| 15. | Chillicothe | 33.3% | 4.5%(+28.8)#15 | 4.9%(+28.5)#551 |
| 16. | Colwell | 33.3% | 4.5%(+28.8)#16 | 4.9%(+28.5)#555 |
| 17. | Rodney | 33.3% | 4.5%(+28.8)#17 | 4.9%(+28.5)#556 |
| 18. | Patterson | 31.2% | 4.5%(+26.7)#18 | 4.9%(+26.4)#620 |
| 19. | New Albin | 30.8% | 4.5%(+26.3)#19 | 4.9%(+25.9)#629 |
| 20. | Radcliffe | 29.4% | 4.5%(+24.9)#20 | 4.9%(+24.5)#679 |
| 21. | Sabula | 29.4% | 4.5%(+24.9)#21 | 4.9%(+24.5)#680 |
| 22. | Hanlontown | 28.6% | 4.5%(+24.1)#22 | 4.9%(+23.7)#714 |
| 23. | New Liberty | 28.6% | 4.5%(+24.1)#23 | 4.9%(+23.7)#717 |
| 24. | Ocheyedan | 28.1% | 4.5%(+23.6)#24 | 4.9%(+23.3)#733 |
| 25. | Shambaugh | 27.8% | 4.5%(+23.3)#25 | 4.9%(+22.9)#749 |
| 26. | Meriden | 27.3% | 4.5%(+22.8)#26 | 4.9%(+22.4)#778 |
| 27. | Stanley | 27.3% | 4.5%(+22.8)#27 | 4.9%(+22.4)#781 |
| 28. | Stockport | 26.1% | 4.5%(+21.6)#28 | 4.9%(+21.2)#838 |
| 29. | Bancroft | 25.0% | 4.5%(+20.5)#29 | 4.9%(+20.1)#891 |
| 30. | Kiron | 25.0% | 4.5%(+20.5)#30 | 4.9%(+20.1)#899 |
| 31. | Paton | 25.0% | 4.5%(+20.5)#31 | 4.9%(+20.1)#906 |
| 32. | Beaman | 22.2% | 4.5%(+17.7)#32 | 4.9%(+17.4)#1,094 |
| 33. | Somers | 21.4% | 4.5%(+16.9)#33 | 4.9%(+16.6)#1,160 |
| 34. | Coin | 20.8% | 4.5%(+16.3)#34 | 4.9%(+16.0)#1,205 |
| 35. | Bayard | 20.0% | 4.5%(+15.5)#35 | 4.9%(+15.1)#1,278 |
| 36. | Maysville | 20.0% | 4.5%(+15.5)#36 | 4.9%(+15.1)#1,294 |
| 37. | Panorama Park | 20.0% | 4.5%(+15.5)#37 | 4.9%(+15.1)#1,300 |
| 38. | Knierim | 20.0% | 4.5%(+15.5)#38 | 4.9%(+15.1)#1,305 |
| 39. | Climbing Hill | 20.0% | 4.5%(+15.5)#39 | 4.9%(+15.1)#1,306 |
| 40. | Middle Amana | 19.9% | 4.5%(+15.4)#40 | 4.9%(+15.0)#1,312 |
| 41. | New Virginia | 19.8% | 4.5%(+15.3)#41 | 4.9%(+14.9)#1,320 |
| 42. | Spillville | 18.8% | 4.5%(+14.2)#42 | 4.9%(+13.9)#1,424 |
| 43. | Blencoe | 18.8% | 4.5%(+14.2)#43 | 4.9%(+13.9)#1,426 |
| 44. | Runnells | 18.6% | 4.5%(+14.1)#44 | 4.9%(+13.8)#1,433 |
| 45. | Ute | 18.5% | 4.5%(+14.0)#45 | 4.9%(+13.6)#1,449 |
| 46. | St Joseph | 18.3% | 4.5%(+13.8)#46 | 4.9%(+13.5)#1,464 |
| 47. | Jamaica | 18.2% | 4.5%(+13.7)#47 | 4.9%(+13.3)#1,495 |
| 48. | Buckeye | 18.2% | 4.5%(+13.7)#48 | 4.9%(+13.3)#1,502 |
| 49. | St Paul | 18.2% | 4.5%(+13.7)#49 | 4.9%(+13.3)#1,503 |
| 50. | Keosauqua | 18.0% | 4.5%(+13.5)#50 | 4.9%(+13.1)#1,517 |
| 51. | Westwood | 17.6% | 4.5%(+13.1)#51 | 4.9%(+12.8)#1,565 |
| 52. | Blakesburg | 17.4% | 4.5%(+12.9)#52 | 4.9%(+12.5)#1,602 |
| 53. | Clarence | 17.0% | 4.5%(+12.5)#53 | 4.9%(+12.1)#1,658 |
| 54. | Monroe | 17.0% | 4.5%(+12.5)#54 | 4.9%(+12.1)#1,659 |
| 55. | Terril | 17.0% | 4.5%(+12.5)#55 | 4.9%(+12.1)#1,661 |
| 56. | Arthur | 16.7% | 4.5%(+12.2)#56 | 4.9%(+11.8)#1,726 |
| 57. | Delaware | 16.7% | 4.5%(+12.2)#57 | 4.9%(+11.8)#1,741 |
| 58. | Harper | 16.7% | 4.5%(+12.2)#58 | 4.9%(+11.8)#1,743 |
| 59. | Van Wert | 16.7% | 4.5%(+12.2)#59 | 4.9%(+11.8)#1,745 |
| 60. | Cromwell | 16.7% | 4.5%(+12.2)#60 | 4.9%(+11.8)#1,751 |
| 61. | Dougherty | 16.7% | 4.5%(+12.2)#61 | 4.9%(+11.8)#1,753 |
| 62. | Graf | 16.7% | 4.5%(+12.2)#62 | 4.9%(+11.8)#1,758 |
| 63. | Volga | 16.1% | 4.5%(+11.6)#63 | 4.9%(+11.3)#1,831 |
| 64. | Lockridge | 15.9% | 4.5%(+11.4)#64 | 4.9%(+11.0)#1,870 |
| 65. | Garwin | 15.4% | 4.5%(+10.9)#65 | 4.9%(+10.5)#1,969 |
| 66. | Beacon | 15.4% | 4.5%(+10.9)#66 | 4.9%(+10.5)#1,972 |
| 67. | Kalona | 15.1% | 4.5%(+10.6)#67 | 4.9%(+10.2)#2,034 |
| 68. | Bouton | 15.0% | 4.5%(+10.5)#68 | 4.9%(+10.1)#2,052 |
| 69. | Martensdale | 14.8% | 4.5%(+10.3)#69 | 4.9%(+9.94)#2,080 |
| 70. | Aplington | 14.6% | 4.5%(+10.1)#70 | 4.9%(+9.78)#2,116 |
| 71. | Union | 14.6% | 4.5%(+10.1)#71 | 4.9%(+9.71)#2,138 |
| 72. | Mingo | 14.3% | 4.5%(+9.77)#72 | 4.9%(+9.41)#2,214 |
| 73. | Ladora | 14.3% | 4.5%(+9.77)#73 | 4.9%(+9.41)#2,224 |
| 74. | Mallard | 14.3% | 4.5%(+9.77)#74 | 4.9%(+9.41)#2,227 |
| 75. | Thor | 14.3% | 4.5%(+9.77)#75 | 4.9%(+9.41)#2,234 |
| 76. | Franklin | 14.3% | 4.5%(+9.77)#76 | 4.9%(+9.41)#2,244 |
| 77. | Stuart | 14.1% | 4.5%(+9.58)#77 | 4.9%(+9.22)#2,282 |
| 78. | Royal | 14.0% | 4.5%(+9.52)#78 | 4.9%(+9.16)#2,293 |
| 79. | Fostoria | 14.0% | 4.5%(+9.44)#79 | 4.9%(+9.08)#2,316 |
| 80. | Green Mountain | 13.6% | 4.5%(+9.12)#80 | 4.9%(+8.76)#2,421 |
| 81. | Story City | 13.5% | 4.5%(+9.00)#81 | 4.9%(+8.64)#2,448 |
| 82. | New Hartford | 13.4% | 4.5%(+8.92)#82 | 4.9%(+8.56)#2,474 |
| 83. | Charlotte | 13.3% | 4.5%(+8.82)#83 | 4.9%(+8.46)#2,508 |
| 84. | Coggon | 12.9% | 4.5%(+8.43)#84 | 4.9%(+8.07)#2,631 |
| 85. | Riceville | 12.8% | 4.5%(+8.33)#85 | 4.9%(+7.97)#2,666 |
| 86. | Birmingham | 12.8% | 4.5%(+8.25)#86 | 4.9%(+7.89)#2,682 |
| 87. | Lineville | 12.8% | 4.5%(+8.25)#87 | 4.9%(+7.89)#2,684 |
| 88. | Rolfe | 12.7% | 4.5%(+8.21)#88 | 4.9%(+7.86)#2,694 |
| 89. | Lewis | 12.5% | 4.5%(+7.99)#89 | 4.9%(+7.63)#2,765 |
| 90. | Callender | 12.5% | 4.5%(+7.99)#90 | 4.9%(+7.63)#2,766 |
| 91. | Rhodes | 12.5% | 4.5%(+7.99)#91 | 4.9%(+7.63)#2,778 |
| 92. | Rembrandt | 12.5% | 4.5%(+7.99)#92 | 4.9%(+7.63)#2,790 |
| 93. | Inwood | 12.4% | 4.5%(+7.86)#93 | 4.9%(+7.50)#2,828 |
| 94. | Corydon | 12.3% | 4.5%(+7.80)#94 | 4.9%(+7.44)#2,849 |
| 95. | Traer | 12.3% | 4.5%(+7.74)#95 | 4.9%(+7.38)#2,869 |
| 96. | Harpers Ferry | 12.2% | 4.5%(+7.73)#96 | 4.9%(+7.37)#2,877 |
| 97. | Wayland | 12.2% | 4.5%(+7.66)#97 | 4.9%(+7.30)#2,903 |
| 98. | Sigourney | 12.1% | 4.5%(+7.57)#98 | 4.9%(+7.21)#2,931 |
| 99. | Tipton | 12.0% | 4.5%(+7.49)#99 | 4.9%(+7.13)#2,963 |
| 100. | Olin | 12.0% | 4.5%(+7.49)#100 | 4.9%(+7.13)#2,968 |
Common Questions
What are the Top 10 Cities with the Highest Percentage of Population with a Degree in Liberal Arts and History in Iowa?
Top 10 Cities with the Highest Percentage of Population with a Degree in Liberal Arts and History in Iowa are:
#1
100.0%
#2
71.4%
#3
66.7%
#4
60.0%
#5
55.6%
#6
50.0%
#7
50.0%
#8
47.2%
#9
41.7%
#10
41.7%
What city has the Highest Percentage of Population with a Degree in Liberal Arts and History in Iowa?
Valeria has the Highest Percentage of Population with a Degree in Liberal Arts and History in Iowa with 100.0%.
What is the Percentage of Population with a Degree in Liberal Arts and History in the State of Iowa?
Percentage of Population with a Degree in Liberal Arts and History in Iowa is 4.5%.
What is the Percentage of Population with a Degree in Liberal Arts and History in the United States?
Percentage of Population with a Degree in Liberal Arts and History in the United States is 4.9%.