New Hope, OR
New Hope Map
New Hope Overview
1,399
TOTAL POPULATION
656
MALE POPULATION
743
FEMALE POPULATION
88.29
MALES / 100 FEMALES
113.26
FEMALES / 100 MALES
55.6
MEDIAN AGE
2.9
AVG FAMILY SIZE
2.6
AVG HOUSEHOLD SIZE
$31,257
PER CAPITA INCOME
$68,375
AVG FAMILY INCOME
$68,194
AVG HOUSEHOLD INCOME
57.8%
WAGE / INCOME GAP [ % ]
42.2¢/ $1
WAGE / INCOME GAP [ $ ]
0.40
INEQUALITY / GINI INDEX
417
LABOR FORCE [ PEOPLE ]
36.5%
PERCENT IN LABOR FORCE
11.8%
UNEMPLOYMENT RATE
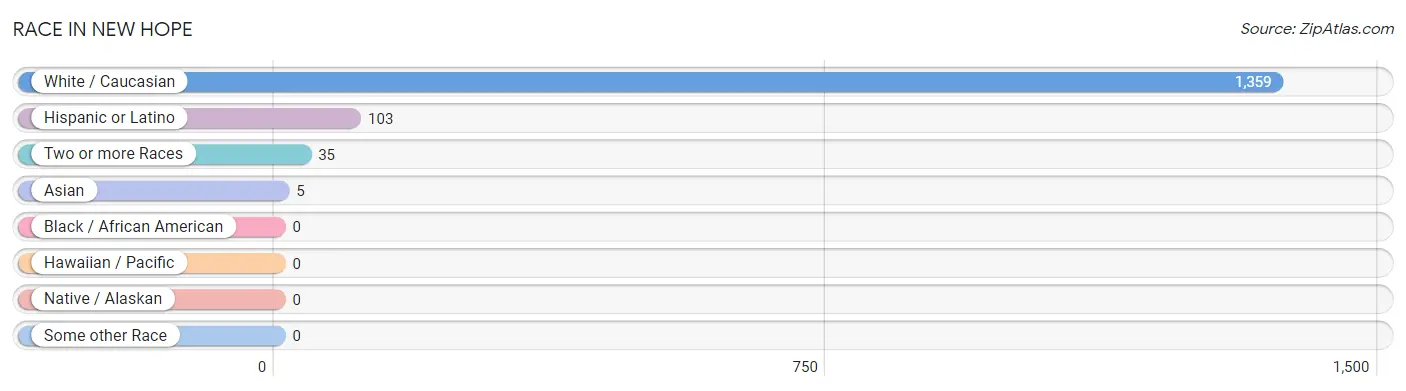
Race in New Hope
The most populous races in New Hope are White / Caucasian (1,359 | 97.1%), Hispanic or Latino (103 | 7.4%), and Two or more Races (35 | 2.5%).
| Race | # Population | % Population |
| Asian | 5 | 0.4% |
| Black / African American | 0 | 0.0% |
| Hawaiian / Pacific | 0 | 0.0% |
| Hispanic or Latino | 103 | 7.4% |
| Native / Alaskan | 0 | 0.0% |
| White / Caucasian | 1,359 | 97.1% |
| Two or more Races | 35 | 2.5% |
| Some other Race | 0 | 0.0% |
| Total | 1,399 | 100.0% |
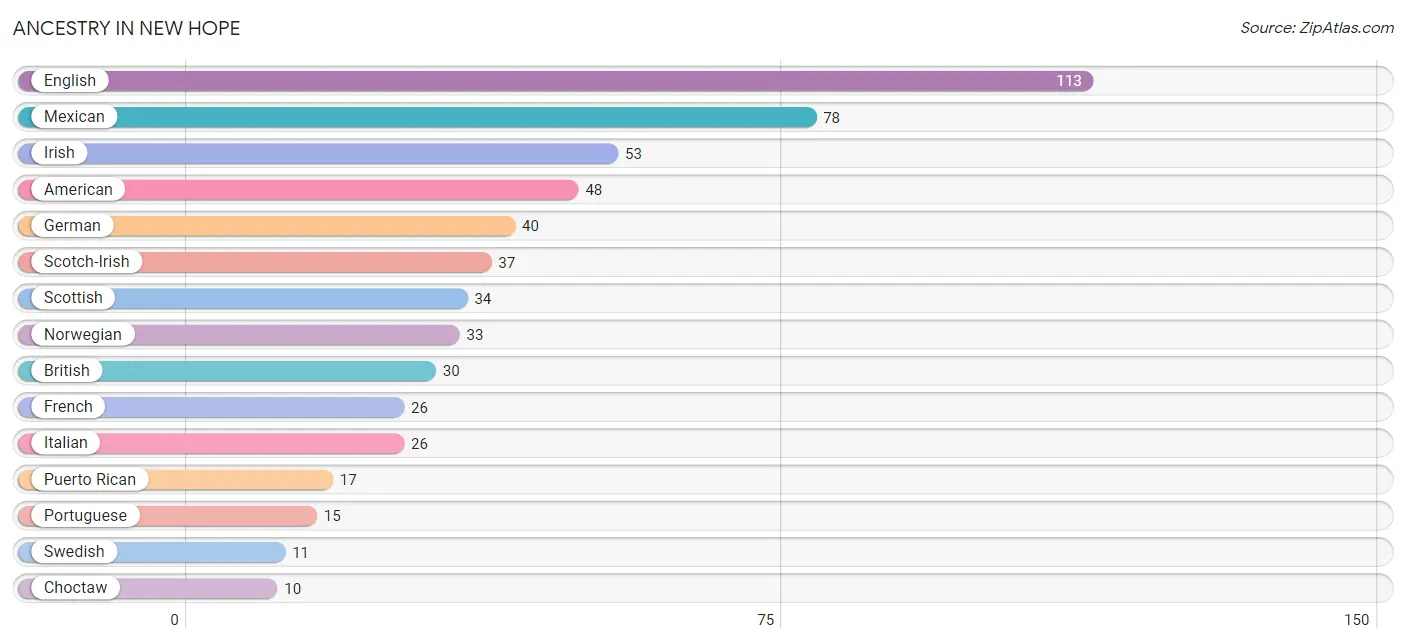
Ancestry in New Hope
The most populous ancestries reported in New Hope are English (113 | 8.1%), Mexican (78 | 5.6%), Irish (53 | 3.8%), American (48 | 3.4%), and German (40 | 2.9%), together accounting for 23.7% of all New Hope residents.
| Ancestry | # Population | % Population |
| American | 48 | 3.4% |
| Argentinean | 8 | 0.6% |
| Austrian | 9 | 0.6% |
| British | 30 | 2.1% |
| Choctaw | 10 | 0.7% |
| Czechoslovakian | 8 | 0.6% |
| Dutch | 10 | 0.7% |
| English | 113 | 8.1% |
| French | 26 | 1.9% |
| German | 40 | 2.9% |
| Irish | 53 | 3.8% |
| Italian | 26 | 1.9% |
| Korean | 5 | 0.4% |
| Mexican | 78 | 5.6% |
| Norwegian | 33 | 2.4% |
| Portuguese | 15 | 1.1% |
| Puerto Rican | 17 | 1.2% |
| Scotch-Irish | 37 | 2.6% |
| Scottish | 34 | 2.4% |
| South American | 8 | 0.6% |
| Swedish | 11 | 0.8% | View All 21 Rows |
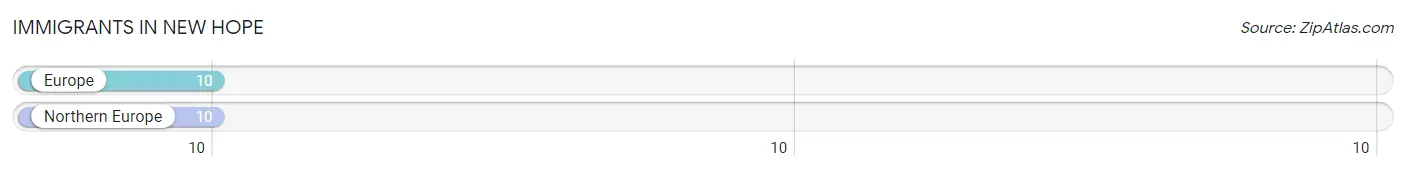
Immigrants in New Hope
The most numerous immigrant groups reported in New Hope came from Europe (10 | 0.7%), and Northern Europe (10 | 0.7%), together accounting for 1.4% of all New Hope residents.
| Immigration Origin | # Population | % Population |
| Europe | 10 | 0.7% |
| Northern Europe | 10 | 0.7% | View All 2 Rows |
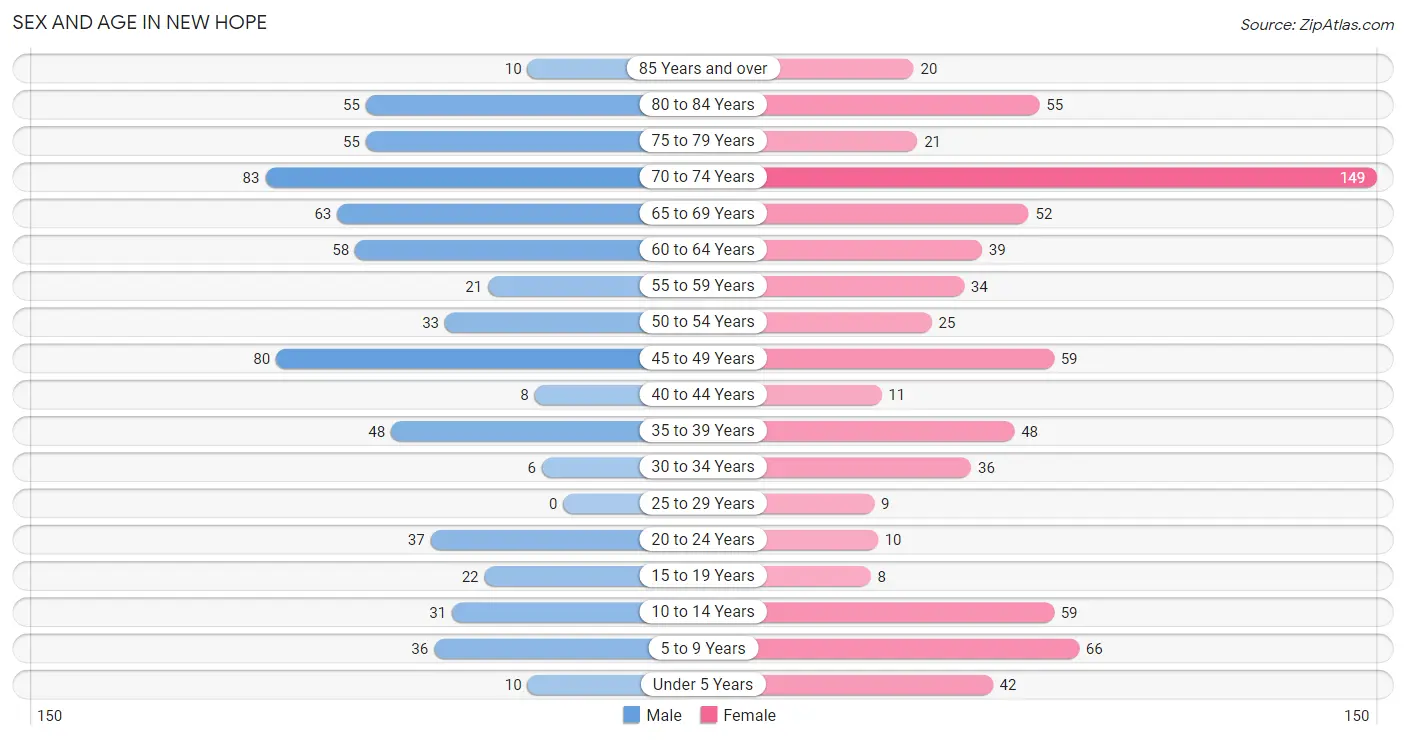
Sex and Age in New Hope
Sex and Age in New Hope
The most populous age groups in New Hope are 70 to 74 Years (83 | 12.7%) for men and 70 to 74 Years (149 | 20.1%) for women.
| Age Bracket | Male | Female |
| Under 5 Years | 10 (1.5%) | 42 (5.7%) |
| 5 to 9 Years | 36 (5.5%) | 66 (8.9%) |
| 10 to 14 Years | 31 (4.7%) | 59 (7.9%) |
| 15 to 19 Years | 22 (3.4%) | 8 (1.1%) |
| 20 to 24 Years | 37 (5.6%) | 10 (1.3%) |
| 25 to 29 Years | 0 (0.0%) | 9 (1.2%) |
| 30 to 34 Years | 6 (0.9%) | 36 (4.9%) |
| 35 to 39 Years | 48 (7.3%) | 48 (6.5%) |
| 40 to 44 Years | 8 (1.2%) | 11 (1.5%) |
| 45 to 49 Years | 80 (12.2%) | 59 (7.9%) |
| 50 to 54 Years | 33 (5.0%) | 25 (3.4%) |
| 55 to 59 Years | 21 (3.2%) | 34 (4.6%) |
| 60 to 64 Years | 58 (8.8%) | 39 (5.2%) |
| 65 to 69 Years | 63 (9.6%) | 52 (7.0%) |
| 70 to 74 Years | 83 (12.7%) | 149 (20.1%) |
| 75 to 79 Years | 55 (8.4%) | 21 (2.8%) |
| 80 to 84 Years | 55 (8.4%) | 55 (7.4%) |
| 85 Years and over | 10 (1.5%) | 20 (2.7%) |
| Total | 656 (100.0%) | 743 (100.0%) |
Families and Households in New Hope
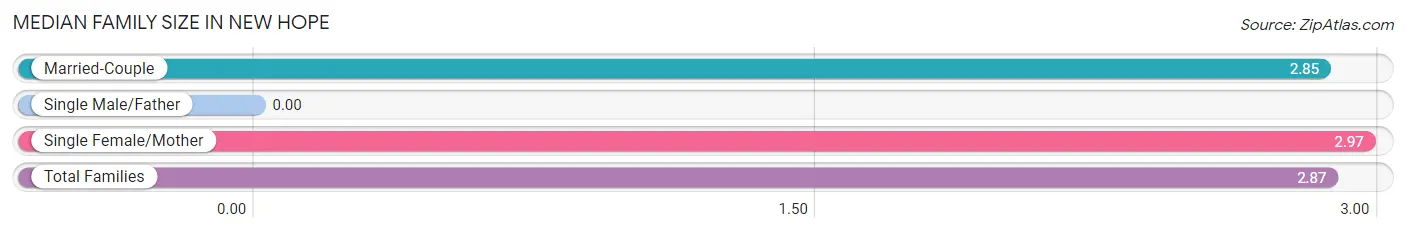
Median Family Size in New Hope
| Family Type | # Families | Family Size |
| Married-Couple | 365 (85.9%) | 2.85 |
| Single Male/Father | 0 (0.0%) | - |
| Single Female/Mother | 60 (14.1%) | 2.97 |
| Total Families | 425 (100.0%) | 2.87 |
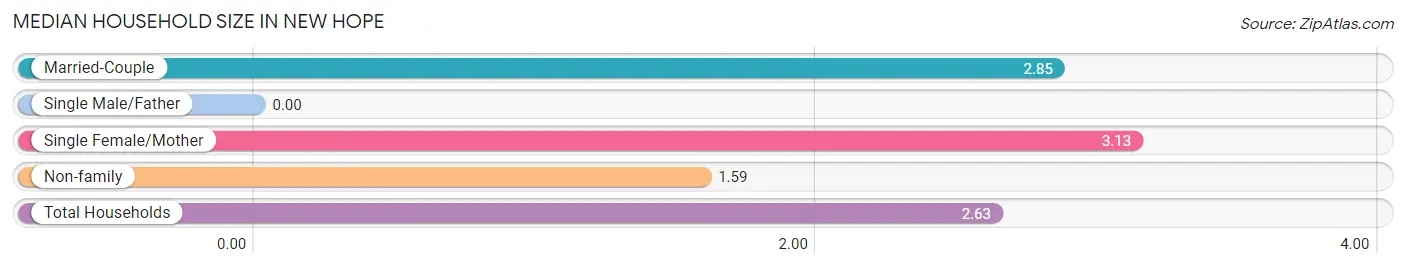
Median Household Size in New Hope
| Household Type | # Households | Household Size |
| Married-Couple | 365 (68.6%) | 2.85 |
| Single Male/Father | 0 (0.0%) | - |
| Single Female/Mother | 60 (11.3%) | 3.13 |
| Non-family | 107 (20.1%) | 1.59 |
| Total Households | 532 (100.0%) | 2.63 |
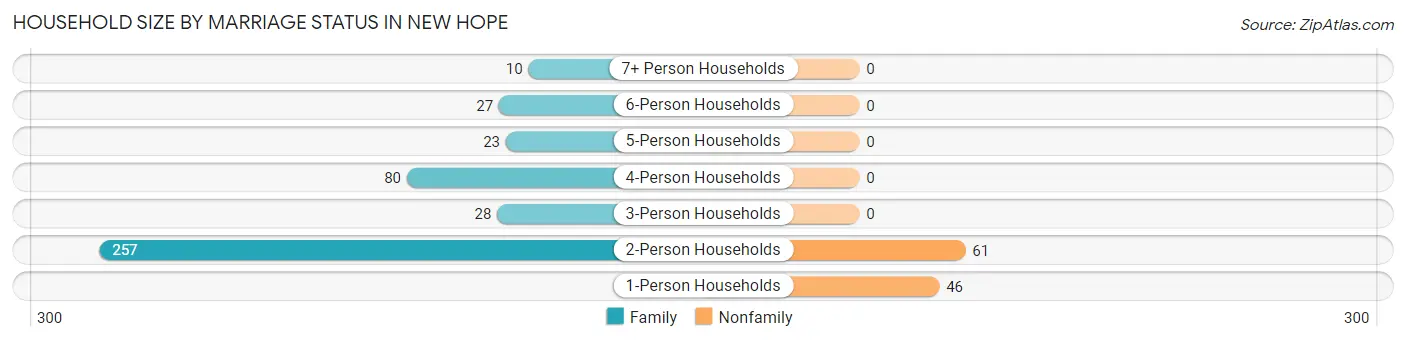
Household Size by Marriage Status in New Hope
Out of a total of 532 households in New Hope, 425 (79.9%) are family households, while 107 (20.1%) are nonfamily households. The most numerous type of family households are 2-person households, comprising 257, and the most common type of nonfamily households are 2-person households, comprising 61.
| Household Size | Family Households | Nonfamily Households |
| 1-Person Households | - | 46 (8.6%) |
| 2-Person Households | 257 (48.3%) | 61 (11.5%) |
| 3-Person Households | 28 (5.3%) | 0 (0.0%) |
| 4-Person Households | 80 (15.0%) | 0 (0.0%) |
| 5-Person Households | 23 (4.3%) | 0 (0.0%) |
| 6-Person Households | 27 (5.1%) | 0 (0.0%) |
| 7+ Person Households | 10 (1.9%) | 0 (0.0%) |
| Total | 425 (79.9%) | 107 (20.1%) |
Female Fertility in New Hope
Fertility by Age in New Hope
| Age Bracket | Women with Births | Births / 1,000 Women |
| 15 to 19 years | 0 (0.0%) | 0.0 |
| 20 to 34 years | 0 (0.0%) | 0.0 |
| 35 to 50 years | 0 (0.0%) | 0.0 |
| Total | 0 (0.0%) | 0.0 |
Fertility by Age by Marriage Status in New Hope
| Age Bracket | Married | Unmarried |
| 15 to 19 years | 0 (0.0%) | 0 (0.0%) |
| 20 to 34 years | 0 (0.0%) | 0 (0.0%) |
| 35 to 50 years | 0 (0.0%) | 0 (0.0%) |
| Total | 0 (0.0%) | 0 (0.0%) |
Fertility by Education in New Hope
| Educational Attainment | Women with Births | Births / 1,000 Women |
| Less than High School | 0 (0.0%) | 0.0 |
| High School Diploma | 0 (0.0%) | 0.0 |
| College or Associate's Degree | 0 (0.0%) | 0.0 |
| Bachelor's Degree | 0 (0.0%) | 0.0 |
| Graduate Degree | 0 (0.0%) | 0.0 |
| Total | 0 (0.0%) | 0.0 |
Fertility by Education by Marriage Status in New Hope
| Educational Attainment | Married | Unmarried |
| Less than High School | 0 (0.0%) | 0 (0.0%) |
| High School Diploma | 0 (0.0%) | 0 (0.0%) |
| College or Associate's Degree | 0 (0.0%) | 0 (0.0%) |
| Bachelor's Degree | 0 (0.0%) | 0 (0.0%) |
| Graduate Degree | 0 (0.0%) | 0 (0.0%) |
| Total | 0 (0.0%) | 0 (0.0%) |
Income in New Hope
Income Overview in New Hope
Per Capita Income in New Hope is $31,257, while median incomes of families and households are $68,375 and $68,194 respectively.
| Characteristic | Number | Measure |
| Per Capita Income | 1,399 | $31,257 |
| Median Family Income | 425 | $68,375 |
| Mean Family Income | 425 | $82,583 |
| Median Household Income | 532 | $68,194 |
| Mean Household Income | 532 | $84,692 |
| Income Deficit | 425 | $0 |
| Wage / Income Gap (%) | 1,399 | 57.81% |
| Wage / Income Gap ($) | 1,399 | 42.19¢ per $1 |
| Gini / Inequality Index | 1,399 | 0.40 |
Earnings by Sex in New Hope
Average Earnings in New Hope are $26,250, $48,587 for men and $20,500 for women, a difference of 57.8%.
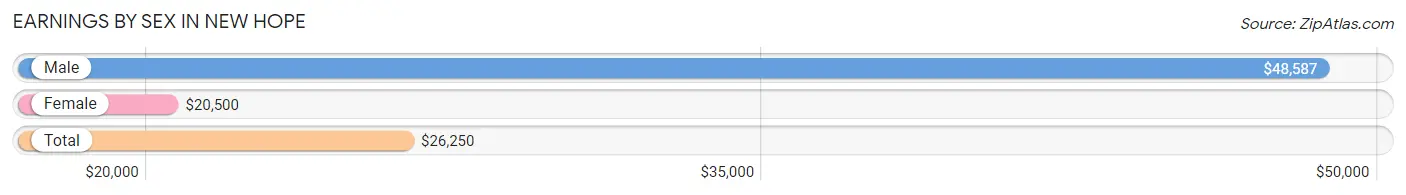
| Sex | Number | Average Earnings |
| Male | 256 (54.0%) | $48,587 |
| Female | 218 (46.0%) | $20,500 |
| Total | 474 (100.0%) | $26,250 |
Earnings by Sex by Income Bracket in New Hope
The most common earnings brackets in New Hope are $55,000 to $64,999 for men (77 | 30.1%) and $5,000 to $7,499 for women (47 | 21.6%).
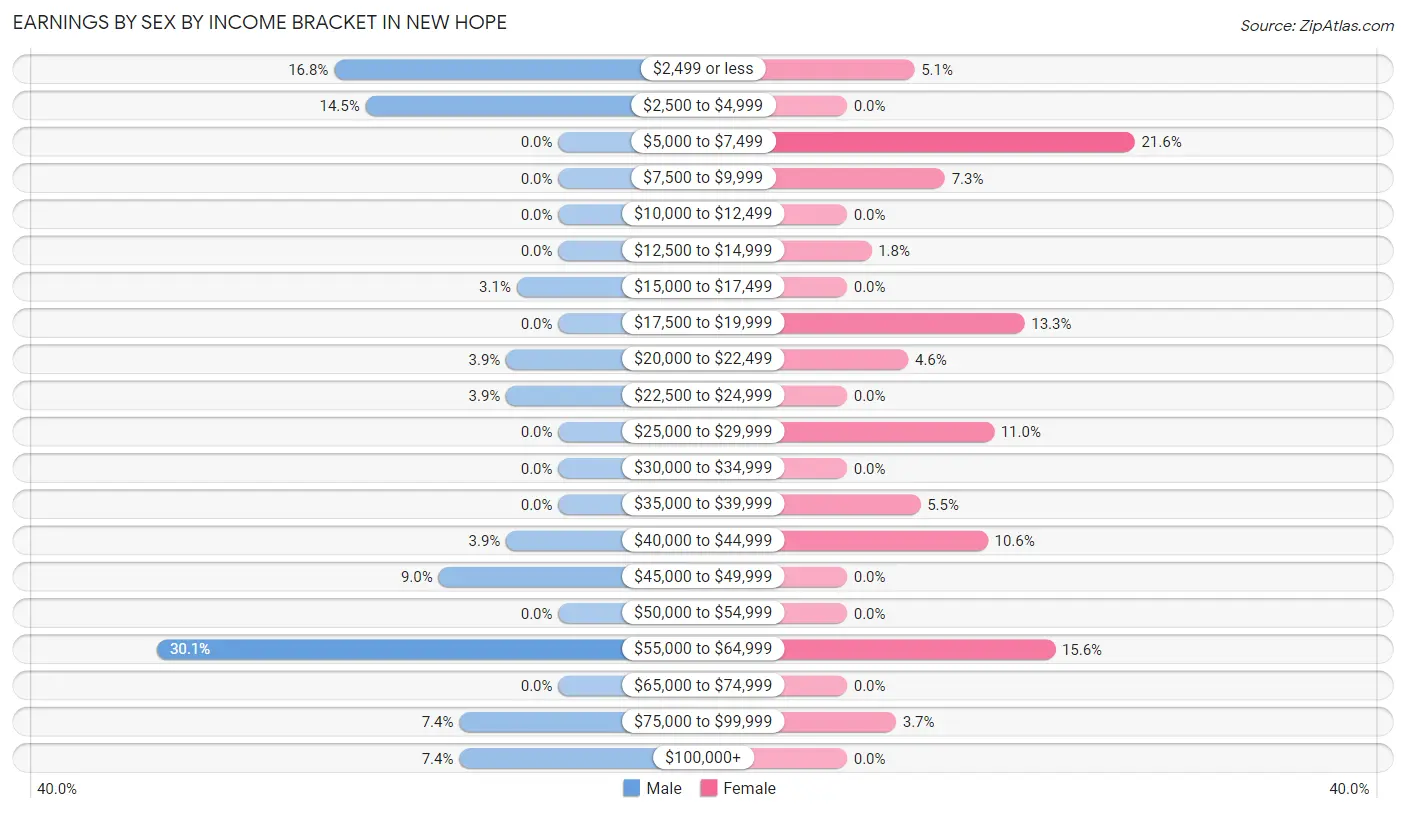
| Income | Male | Female |
| $2,499 or less | 43 (16.8%) | 11 (5.1%) |
| $2,500 to $4,999 | 37 (14.4%) | 0 (0.0%) |
| $5,000 to $7,499 | 0 (0.0%) | 47 (21.6%) |
| $7,500 to $9,999 | 0 (0.0%) | 16 (7.3%) |
| $10,000 to $12,499 | 0 (0.0%) | 0 (0.0%) |
| $12,500 to $14,999 | 0 (0.0%) | 4 (1.8%) |
| $15,000 to $17,499 | 8 (3.1%) | 0 (0.0%) |
| $17,500 to $19,999 | 0 (0.0%) | 29 (13.3%) |
| $20,000 to $22,499 | 10 (3.9%) | 10 (4.6%) |
| $22,500 to $24,999 | 10 (3.9%) | 0 (0.0%) |
| $25,000 to $29,999 | 0 (0.0%) | 24 (11.0%) |
| $30,000 to $34,999 | 0 (0.0%) | 0 (0.0%) |
| $35,000 to $39,999 | 0 (0.0%) | 12 (5.5%) |
| $40,000 to $44,999 | 10 (3.9%) | 23 (10.5%) |
| $45,000 to $49,999 | 23 (9.0%) | 0 (0.0%) |
| $50,000 to $54,999 | 0 (0.0%) | 0 (0.0%) |
| $55,000 to $64,999 | 77 (30.1%) | 34 (15.6%) |
| $65,000 to $74,999 | 0 (0.0%) | 0 (0.0%) |
| $75,000 to $99,999 | 19 (7.4%) | 8 (3.7%) |
| $100,000+ | 19 (7.4%) | 0 (0.0%) |
| Total | 256 (100.0%) | 218 (100.0%) |
Earnings by Sex by Educational Attainment in New Hope
Average earnings in New Hope are $55,859 for men and $25,104 for women, a difference of 55.1%. Men with an educational attainment of less than high school enjoy the highest average annual earnings of $57,422, while those with less than high school education earn the least with $57,422. Women with an educational attainment of bachelor's degree earn the most with the average annual earnings of $60,772, while those with bachelor's degree education have the smallest earnings of $60,772.
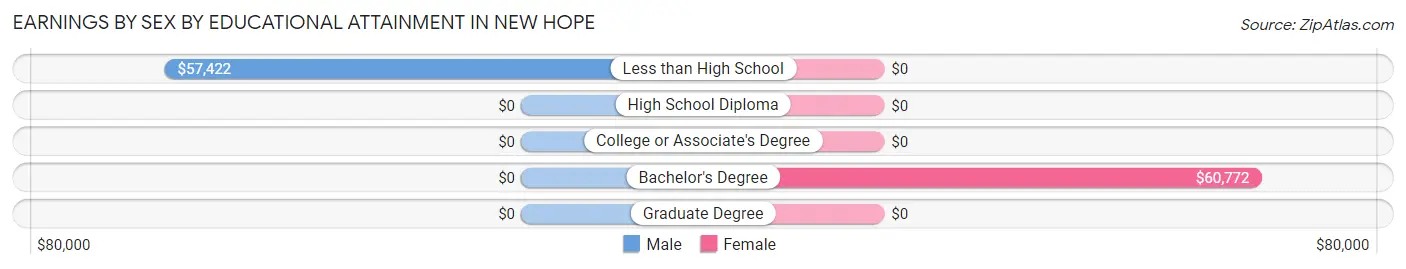
| Educational Attainment | Male Income | Female Income |
| Less than High School | $57,422 | $0 |
| High School Diploma | - | - |
| College or Associate's Degree | - | - |
| Bachelor's Degree | - | - |
| Graduate Degree | - | - |
| Total | $55,859 | $25,104 |
Family Income in New Hope
Family Income Brackets in New Hope
According to the New Hope family income data, there are 142 families falling into the $100,000 to $149,999 income range, which is the most common income bracket and makes up 33.4% of all families.
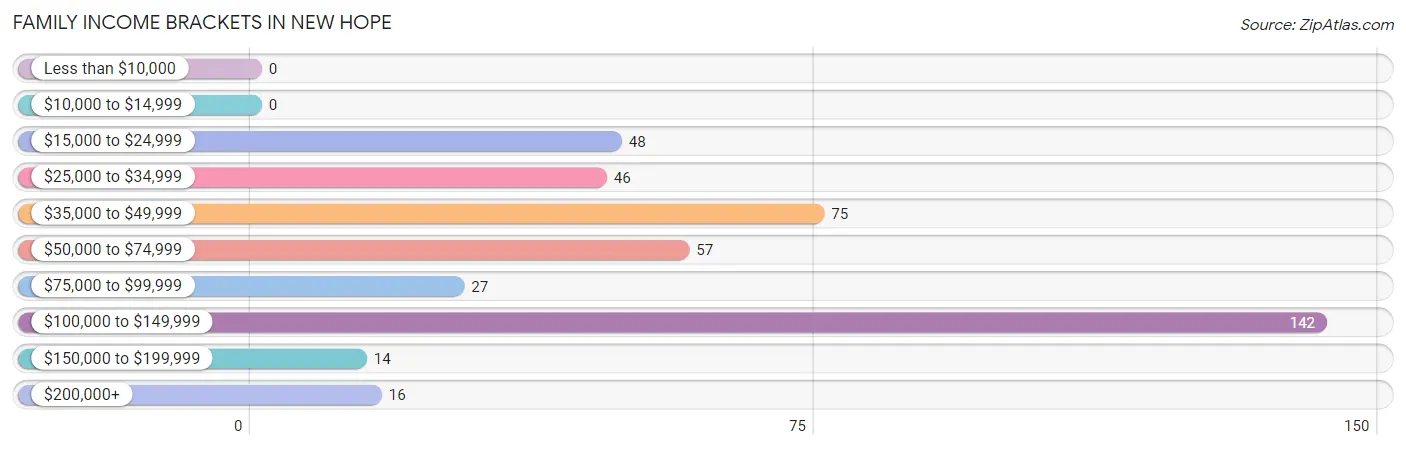
| Income Bracket | # Families | % Families |
| Less than $10,000 | 0 | 0.0% |
| $10,000 to $14,999 | 0 | 0.0% |
| $15,000 to $24,999 | 48 | 11.3% |
| $25,000 to $34,999 | 46 | 10.8% |
| $35,000 to $49,999 | 75 | 17.6% |
| $50,000 to $74,999 | 57 | 13.4% |
| $75,000 to $99,999 | 27 | 6.4% |
| $100,000 to $149,999 | 142 | 33.4% |
| $150,000 to $199,999 | 14 | 3.3% |
| $200,000+ | 16 | 3.8% |
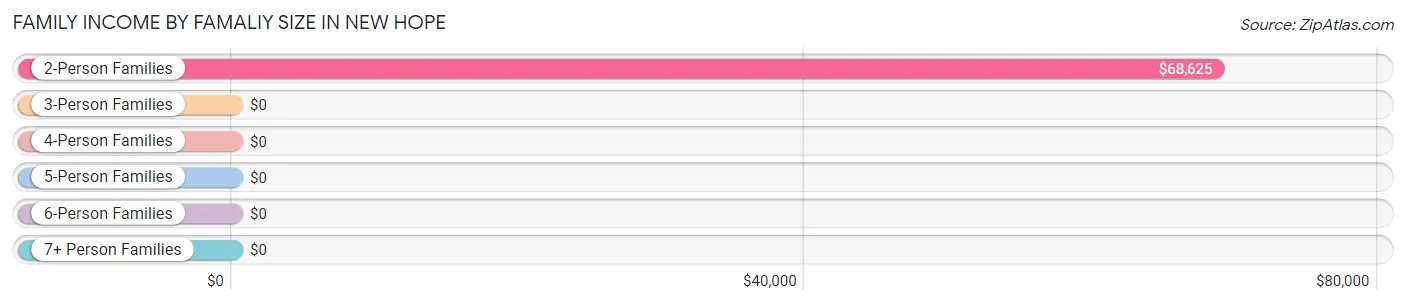
Family Income by Famaliy Size in New Hope
2-person families (257 | 60.5%) account for the highest median family income in New Hope with $68,625 per family, while 2-person families (257 | 60.5%) have the highest median income of $34,312 per family member.
| Income Bracket | # Families | Median Income |
| 2-Person Families | 257 (60.5%) | $68,625 |
| 3-Person Families | 41 (9.7%) | $0 |
| 4-Person Families | 67 (15.8%) | $0 |
| 5-Person Families | 23 (5.4%) | $0 |
| 6-Person Families | 27 (6.4%) | $0 |
| 7+ Person Families | 10 (2.4%) | $0 |
| Total | 425 (100.0%) | $68,375 |
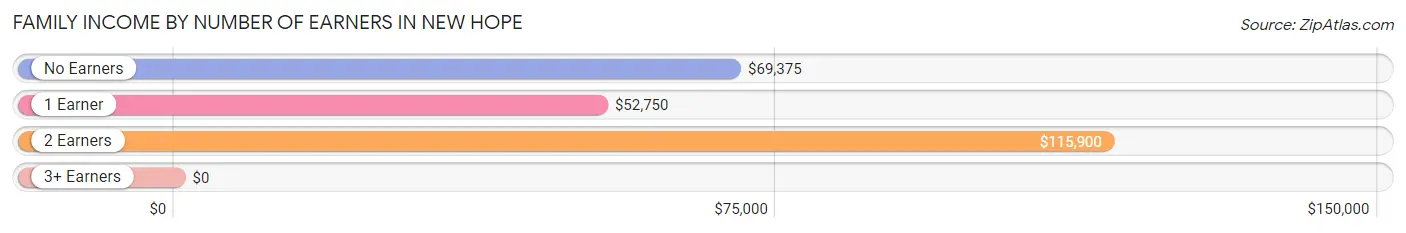
Family Income by Number of Earners in New Hope
| Number of Earners | # Families | Median Income |
| No Earners | 123 (28.9%) | $69,375 |
| 1 Earner | 218 (51.3%) | $52,750 |
| 2 Earners | 60 (14.1%) | $115,900 |
| 3+ Earners | 24 (5.7%) | $0 |
| Total | 425 (100.0%) | $68,375 |
Household Income in New Hope
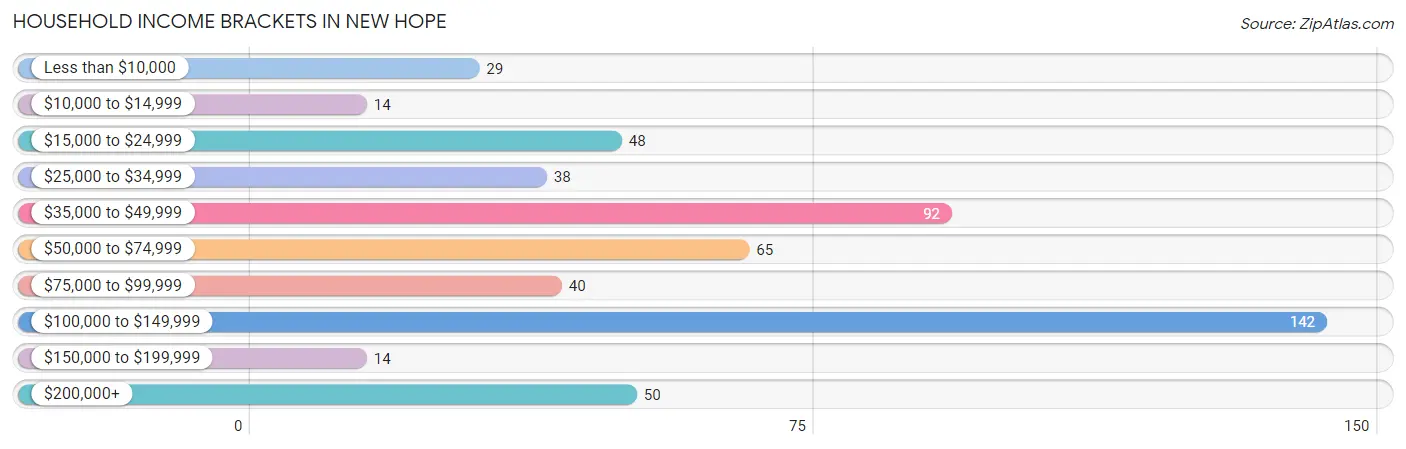
Household Income Brackets in New Hope
With 142 households falling in the category, the $100,000 to $149,999 income range is the most frequent in New Hope, accounting for 26.7% of all households. In contrast, only 14 households (2.6%) fall into the $10,000 to $14,999 income bracket, making it the least populous group.
| Income Bracket | # Households | % Households |
| Less than $10,000 | 29 | 5.5% |
| $10,000 to $14,999 | 14 | 2.6% |
| $15,000 to $24,999 | 48 | 9.0% |
| $25,000 to $34,999 | 38 | 7.1% |
| $35,000 to $49,999 | 92 | 17.3% |
| $50,000 to $74,999 | 65 | 12.2% |
| $75,000 to $99,999 | 40 | 7.5% |
| $100,000 to $149,999 | 142 | 26.7% |
| $150,000 to $199,999 | 14 | 2.6% |
| $200,000+ | 50 | 9.4% |
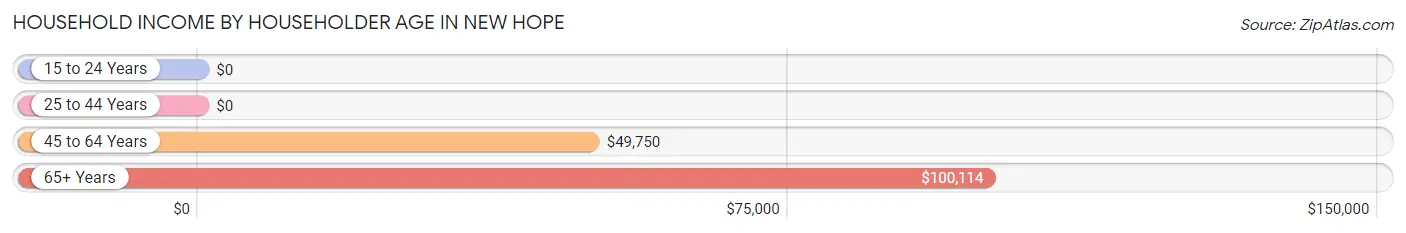
Household Income by Householder Age in New Hope
The median household income in New Hope is $68,194, with the highest median household income of $100,114 found in the 65+ years age bracket for the primary householder. A total of 279 households (52.4%) fall into this category.
| Income Bracket | # Households | Median Income |
| 15 to 24 Years | 0 (0.0%) | $0 |
| 25 to 44 Years | 88 (16.5%) | $0 |
| 45 to 64 Years | 165 (31.0%) | $49,750 |
| 65+ Years | 279 (52.4%) | $100,114 |
| Total | 532 (100.0%) | $68,194 |
Poverty in New Hope
Income Below Poverty by Sex and Age in New Hope
With 16.5% poverty level for males and 16.3% for females among the residents of New Hope, 16 and 17 year old males and 16 and 17 year old females are the most vulnerable to poverty, with 10 males (100.0%) and 8 females (100.0%) in their respective age groups living below the poverty level.
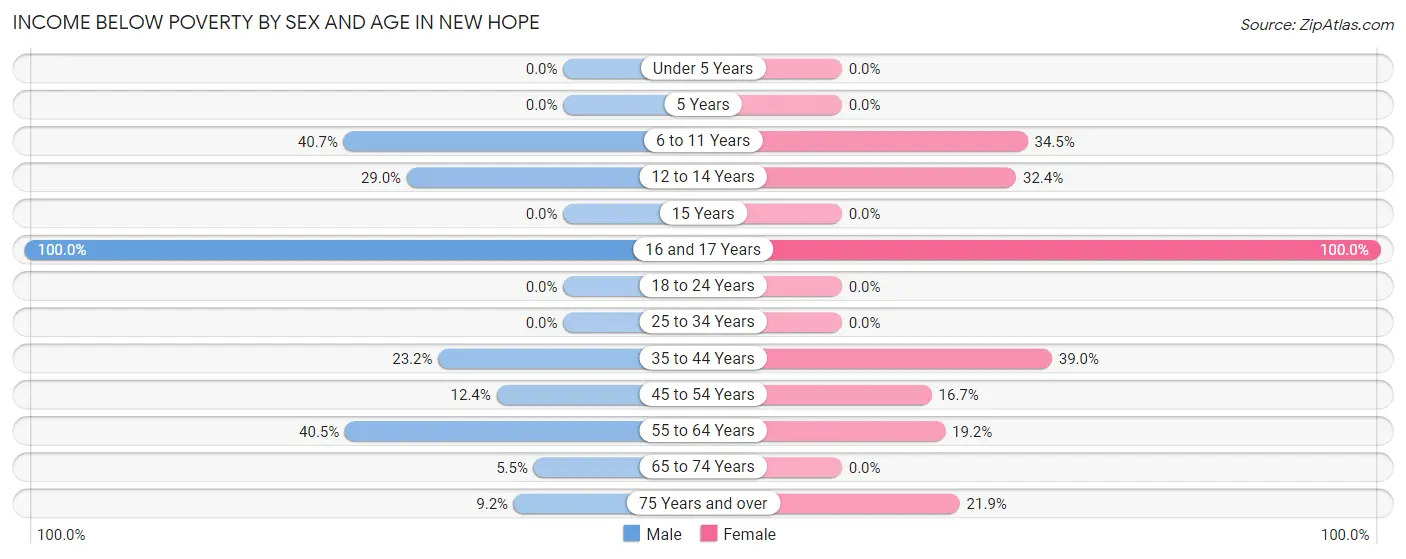
| Age Bracket | Male | Female |
| Under 5 Years | 0 (0.0%) | 0 (0.0%) |
| 5 Years | 0 (0.0%) | 0 (0.0%) |
| 6 to 11 Years | 11 (40.7%) | 30 (34.5%) |
| 12 to 14 Years | 9 (29.0%) | 11 (32.4%) |
| 15 Years | 0 (0.0%) | 0 (0.0%) |
| 16 and 17 Years | 10 (100.0%) | 8 (100.0%) |
| 18 to 24 Years | 0 (0.0%) | 0 (0.0%) |
| 25 to 34 Years | 0 (0.0%) | 0 (0.0%) |
| 35 to 44 Years | 13 (23.2%) | 23 (39.0%) |
| 45 to 54 Years | 14 (12.4%) | 14 (16.7%) |
| 55 to 64 Years | 32 (40.5%) | 14 (19.2%) |
| 65 to 74 Years | 8 (5.5%) | 0 (0.0%) |
| 75 Years and over | 11 (9.2%) | 21 (21.9%) |
| Total | 108 (16.5%) | 121 (16.3%) |
Income Above Poverty by Sex and Age in New Hope
According to the poverty statistics in New Hope, males aged under 5 years and females aged under 5 years are the age groups that are most secure financially, with 100.0% of males and 100.0% of females in these age groups living above the poverty line.
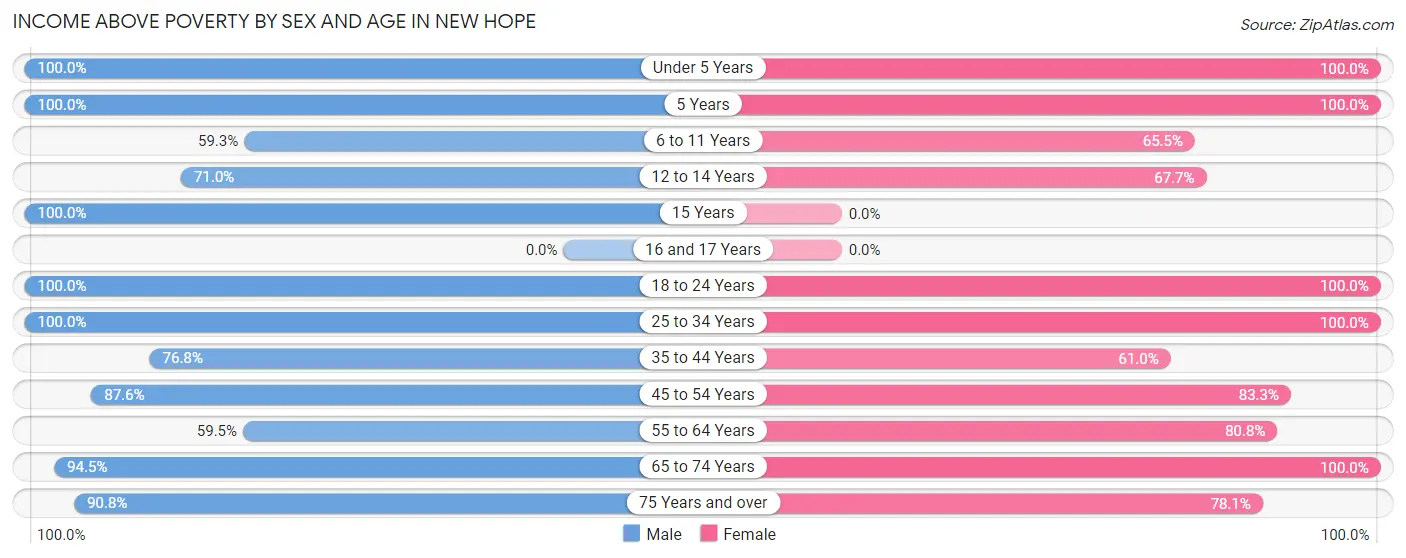
| Age Bracket | Male | Female |
| Under 5 Years | 10 (100.0%) | 42 (100.0%) |
| 5 Years | 9 (100.0%) | 4 (100.0%) |
| 6 to 11 Years | 16 (59.3%) | 57 (65.5%) |
| 12 to 14 Years | 22 (71.0%) | 23 (67.6%) |
| 15 Years | 12 (100.0%) | 0 (0.0%) |
| 16 and 17 Years | 0 (0.0%) | 0 (0.0%) |
| 18 to 24 Years | 37 (100.0%) | 10 (100.0%) |
| 25 to 34 Years | 6 (100.0%) | 45 (100.0%) |
| 35 to 44 Years | 43 (76.8%) | 36 (61.0%) |
| 45 to 54 Years | 99 (87.6%) | 70 (83.3%) |
| 55 to 64 Years | 47 (59.5%) | 59 (80.8%) |
| 65 to 74 Years | 138 (94.5%) | 201 (100.0%) |
| 75 Years and over | 109 (90.8%) | 75 (78.1%) |
| Total | 548 (83.5%) | 622 (83.7%) |
Income Below Poverty Among Married-Couple Families in New Hope
The poverty statistics for married-couple families in New Hope show that 6.3% or 23 of the total 365 families live below the poverty line. Families with 1 or 2 children have the highest poverty rate of 79.3%, comprising of 23 families. On the other hand, families with no children have the lowest poverty rate of 0.0%, which includes 0 families.
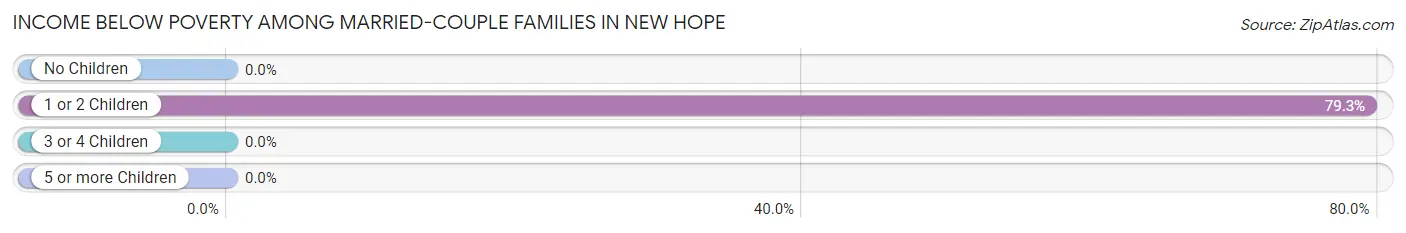
| Children | Above Poverty | Below Poverty |
| No Children | 287 (100.0%) | 0 (0.0%) |
| 1 or 2 Children | 6 (20.7%) | 23 (79.3%) |
| 3 or 4 Children | 49 (100.0%) | 0 (0.0%) |
| 5 or more Children | 0 (0.0%) | 0 (0.0%) |
| Total | 342 (93.7%) | 23 (6.3%) |
Income Below Poverty Among Single-Parent Households in New Hope
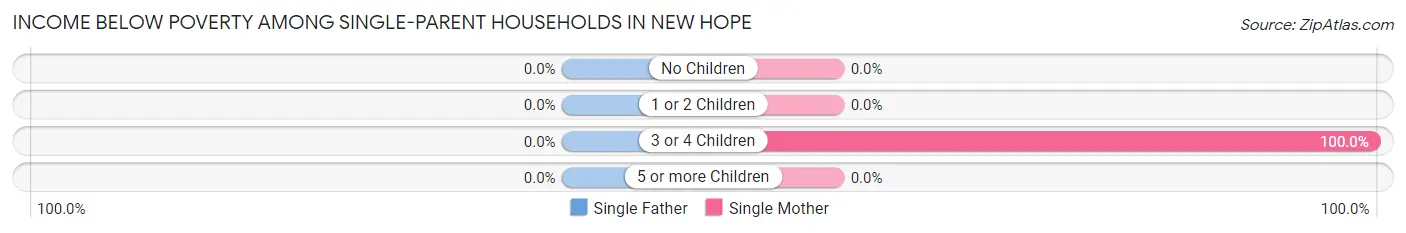
| Children | Single Father | Single Mother |
| No Children | 0 (0.0%) | 0 (0.0%) |
| 1 or 2 Children | 0 (0.0%) | 0 (0.0%) |
| 3 or 4 Children | 0 (0.0%) | 14 (100.0%) |
| 5 or more Children | 0 (0.0%) | 0 (0.0%) |
| Total | 0 (0.0%) | 14 (23.3%) |
Income Below Poverty Among Married-Couple vs Single-Parent Households in New Hope
The poverty data for New Hope shows that 23 of the married-couple family households (6.3%) and 14 of the single-parent households (23.3%) are living below the poverty level. Within the married-couple family households, those with 1 or 2 children have the highest poverty rate, with 23 households (79.3%) falling below the poverty line. Among the single-parent households, those with 3 or 4 children have the highest poverty rate, with 14 household (100.0%) living below poverty.
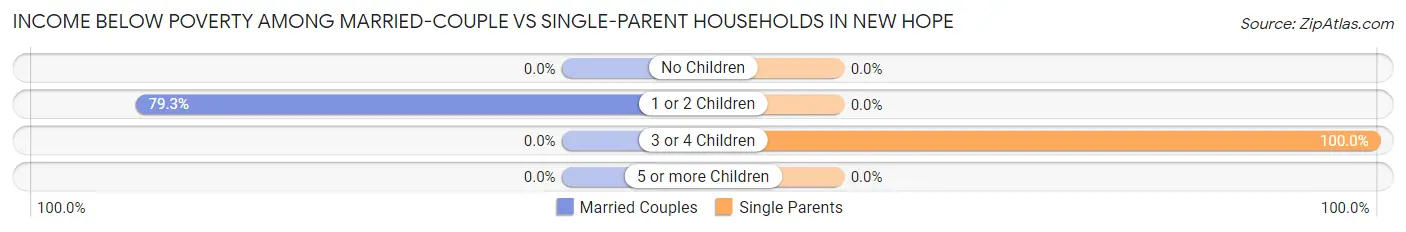
| Children | Married-Couple Families | Single-Parent Households |
| No Children | 0 (0.0%) | 0 (0.0%) |
| 1 or 2 Children | 23 (79.3%) | 0 (0.0%) |
| 3 or 4 Children | 0 (0.0%) | 14 (100.0%) |
| 5 or more Children | 0 (0.0%) | 0 (0.0%) |
| Total | 23 (6.3%) | 14 (23.3%) |
Employment Characteristics in New Hope
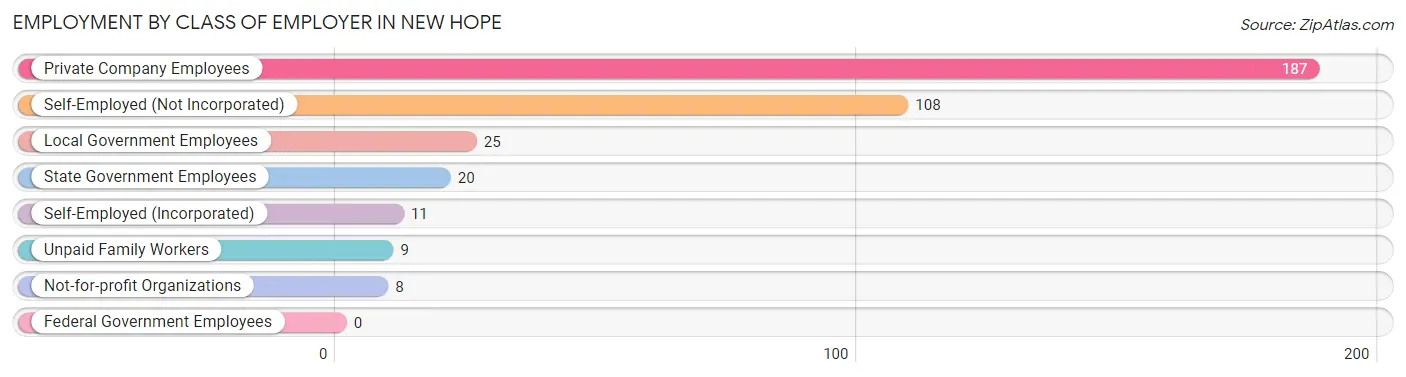
Employment by Class of Employer in New Hope
Among the 368 employed individuals in New Hope, private company employees (187 | 50.8%), self-employed (not incorporated) (108 | 29.3%), and local government employees (25 | 6.8%) make up the most common classes of employment.
| Employer Class | # Employees | % Employees |
| Private Company Employees | 187 | 50.8% |
| Self-Employed (Incorporated) | 11 | 3.0% |
| Self-Employed (Not Incorporated) | 108 | 29.3% |
| Not-for-profit Organizations | 8 | 2.2% |
| Local Government Employees | 25 | 6.8% |
| State Government Employees | 20 | 5.4% |
| Federal Government Employees | 0 | 0.0% |
| Unpaid Family Workers | 9 | 2.5% |
| Total | 368 | 100.0% |
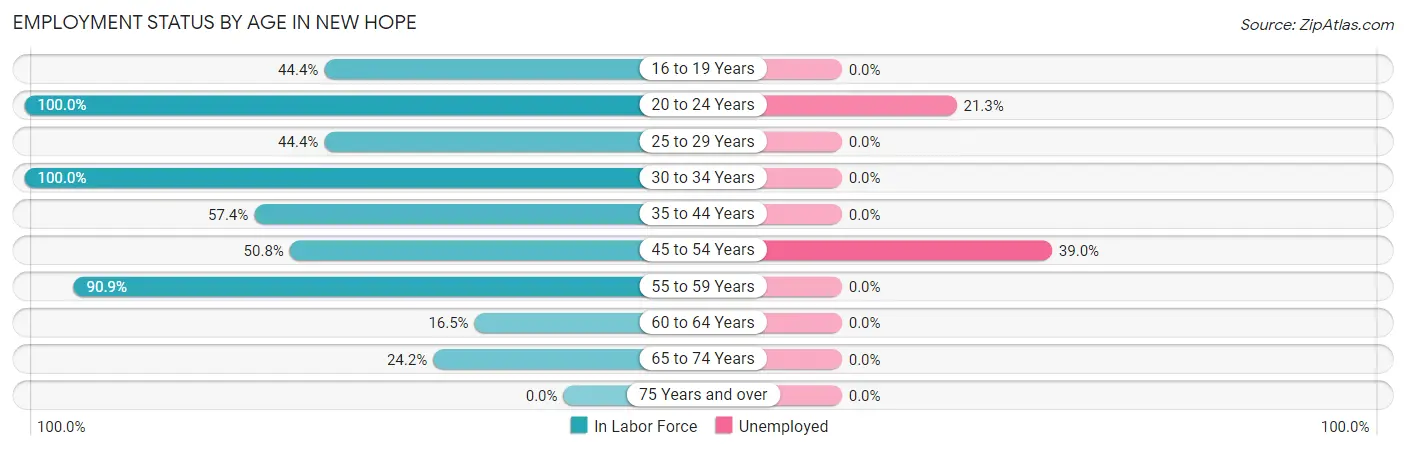
Employment Status by Age in New Hope
According to the labor force statistics for New Hope, out of the total population over 16 years of age (1,143), 36.5% or 417 individuals are in the labor force, with 11.8% or 49 of them unemployed. The age group with the highest labor force participation rate is 20 to 24 years, with 100.0% or 47 individuals in the labor force. Within the labor force, the 45 to 54 years age range has the highest percentage of unemployed individuals, with 39.0% or 39 of them being unemployed.
| Age Bracket | In Labor Force | Unemployed |
| 16 to 19 Years | 8 (44.4%) | 0 (0.0%) |
| 20 to 24 Years | 47 (100.0%) | 10 (21.3%) |
| 25 to 29 Years | 4 (44.4%) | 0 (0.0%) |
| 30 to 34 Years | 42 (100.0%) | 0 (0.0%) |
| 35 to 44 Years | 66 (57.4%) | 0 (0.0%) |
| 45 to 54 Years | 100 (50.8%) | 39 (39.0%) |
| 55 to 59 Years | 50 (90.9%) | 0 (0.0%) |
| 60 to 64 Years | 16 (16.5%) | 0 (0.0%) |
| 65 to 74 Years | 84 (24.2%) | 0 (0.0%) |
| 75 Years and over | 0 (0.0%) | 0 (0.0%) |
| Total | 417 (36.5%) | 49 (11.8%) |
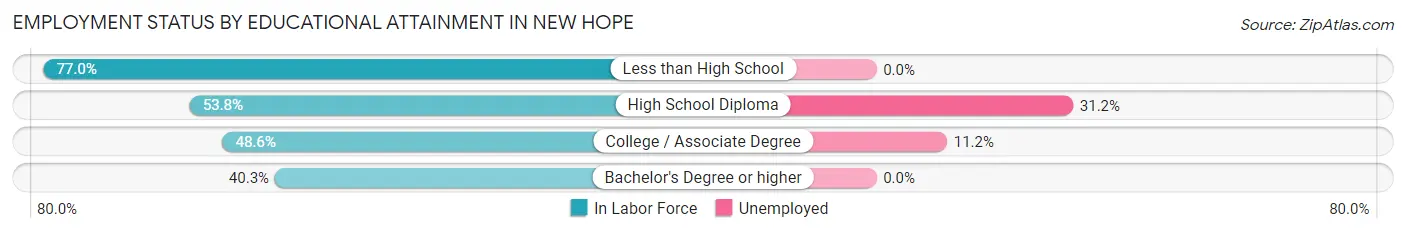
Employment Status by Educational Attainment in New Hope
According to labor force statistics for New Hope, 54.0% of individuals (278) out of the total population between 25 and 64 years of age (515) are in the labor force, with 14.0% or 39 of them being unemployed. The group with the highest labor force participation rate are those with the educational attainment of less than high school, with 77.0% or 67 individuals in the labor force. Within the labor force, individuals with high school diploma education have the highest percentage of unemployment, with 31.2% or 29 of them being unemployed.
| Educational Attainment | In Labor Force | Unemployed |
| Less than High School | 67 (77.0%) | 0 (0.0%) |
| High School Diploma | 93 (53.8%) | 54 (31.2%) |
| College / Associate Degree | 89 (48.6%) | 20 (11.2%) |
| Bachelor's Degree or higher | 29 (40.3%) | 0 (0.0%) |
| Total | 278 (54.0%) | 72 (14.0%) |
Employment Occupations by Sex in New Hope
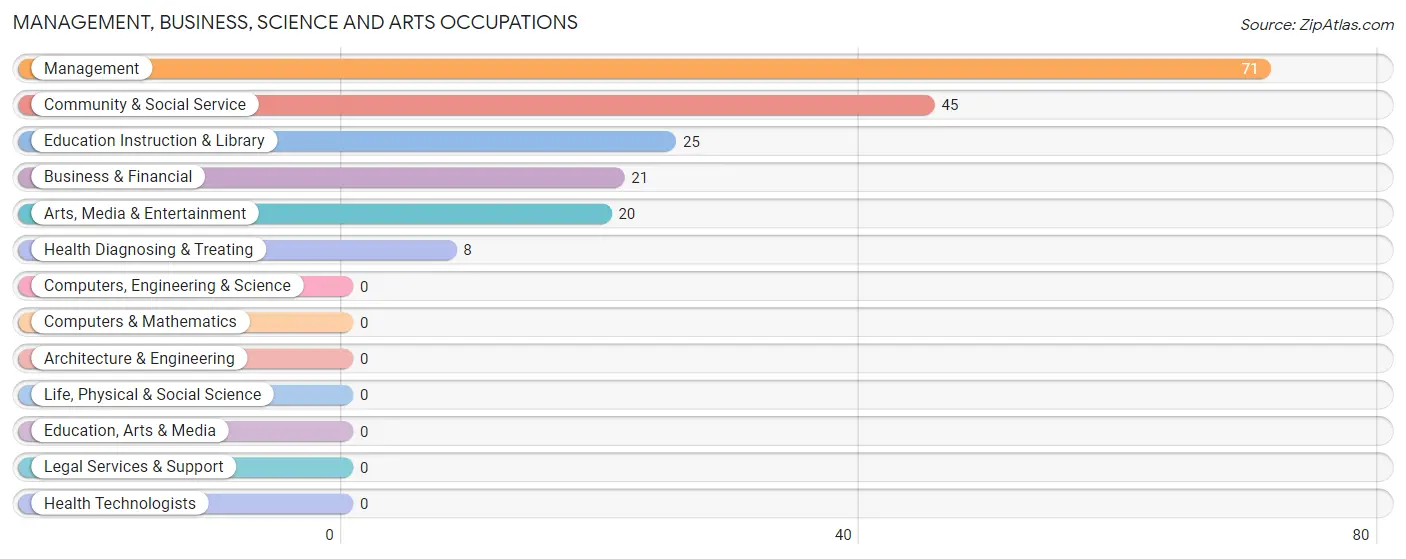
Management, Business, Science and Arts Occupations
The most common Management, Business, Science and Arts occupations in New Hope are Management (71 | 19.3%), Community & Social Service (45 | 12.2%), Education Instruction & Library (25 | 6.8%), Business & Financial (21 | 5.7%), and Arts, Media & Entertainment (20 | 5.4%).
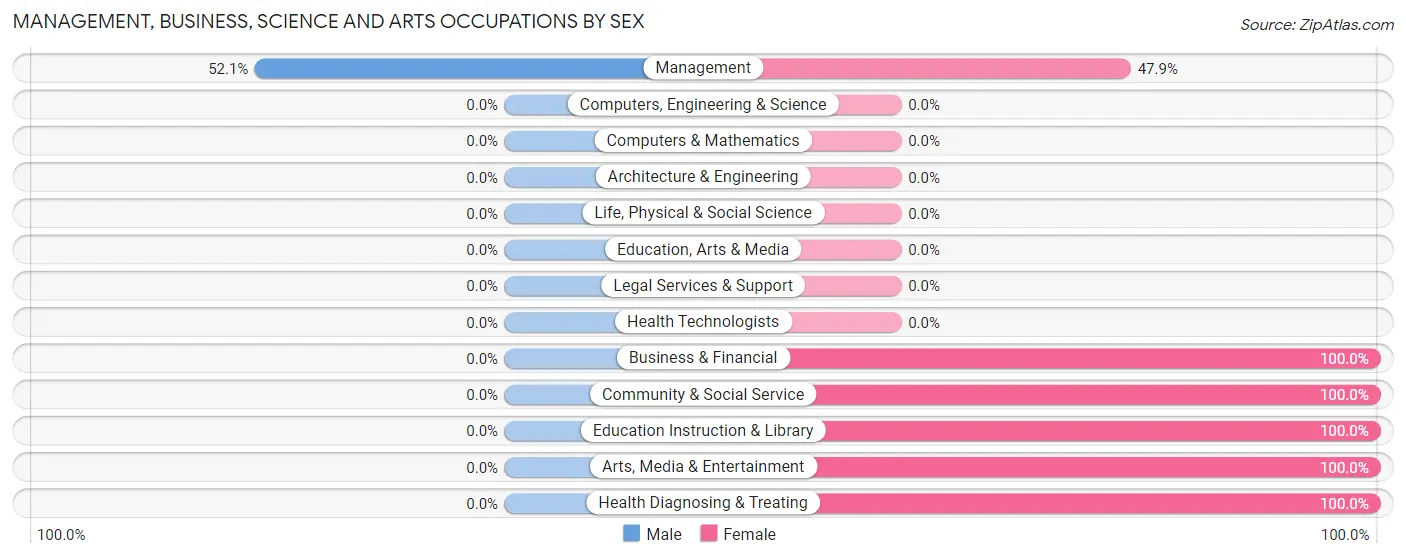
Management, Business, Science and Arts Occupations by Sex
| Occupation | Male | Female |
| Management | 37 (52.1%) | 34 (47.9%) |
| Business & Financial | 0 (0.0%) | 21 (100.0%) |
| Computers, Engineering & Science | 0 (0.0%) | 0 (0.0%) |
| Computers & Mathematics | 0 (0.0%) | 0 (0.0%) |
| Architecture & Engineering | 0 (0.0%) | 0 (0.0%) |
| Life, Physical & Social Science | 0 (0.0%) | 0 (0.0%) |
| Community & Social Service | 0 (0.0%) | 45 (100.0%) |
| Education, Arts & Media | 0 (0.0%) | 0 (0.0%) |
| Legal Services & Support | 0 (0.0%) | 0 (0.0%) |
| Education Instruction & Library | 0 (0.0%) | 25 (100.0%) |
| Arts, Media & Entertainment | 0 (0.0%) | 20 (100.0%) |
| Health Diagnosing & Treating | 0 (0.0%) | 8 (100.0%) |
| Health Technologists | 0 (0.0%) | 0 (0.0%) |
| Total (Category) | 37 (25.5%) | 108 (74.5%) |
| Total (Overall) | 179 (48.6%) | 189 (51.4%) |
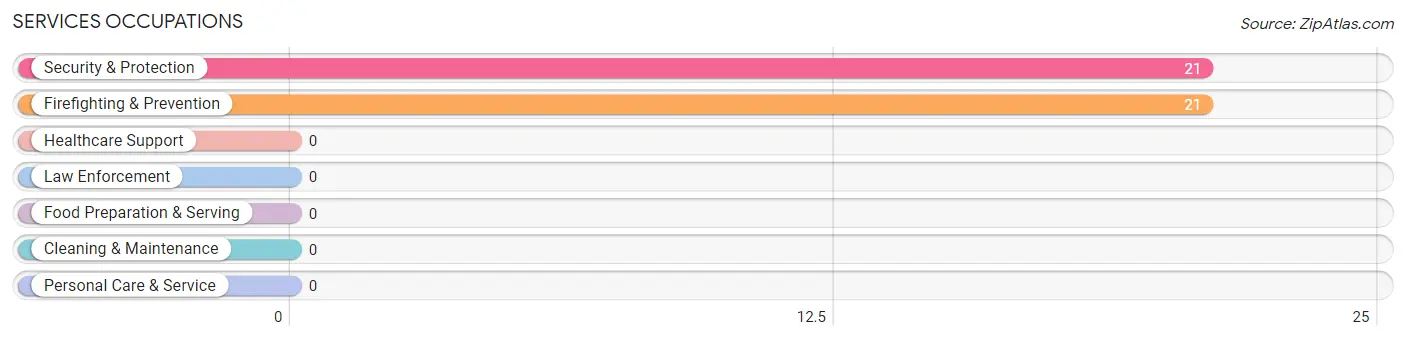
Services Occupations
The most common Services occupations in New Hope are Security & Protection (21 | 5.7%), and Firefighting & Prevention (21 | 5.7%).
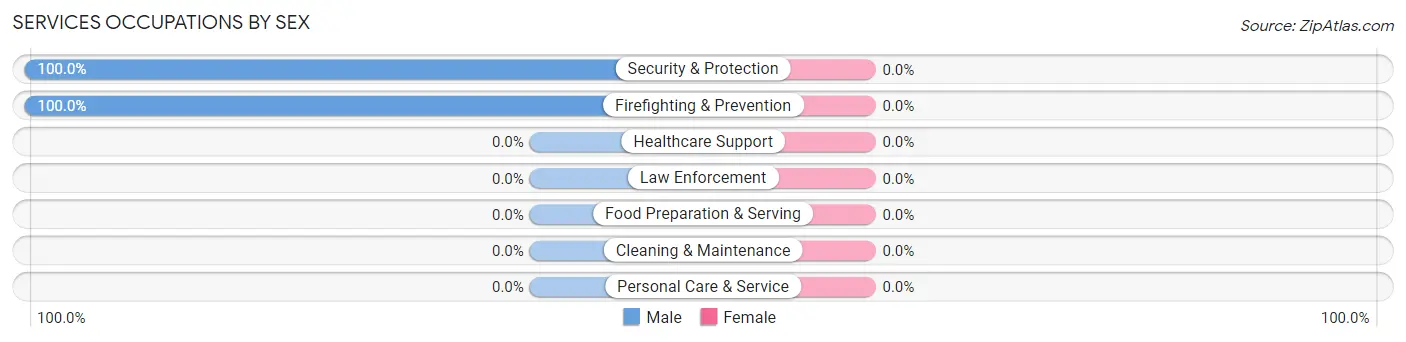
Services Occupations by Sex
| Occupation | Male | Female |
| Healthcare Support | 0 (0.0%) | 0 (0.0%) |
| Security & Protection | 21 (100.0%) | 0 (0.0%) |
| Firefighting & Prevention | 21 (100.0%) | 0 (0.0%) |
| Law Enforcement | 0 (0.0%) | 0 (0.0%) |
| Food Preparation & Serving | 0 (0.0%) | 0 (0.0%) |
| Cleaning & Maintenance | 0 (0.0%) | 0 (0.0%) |
| Personal Care & Service | 0 (0.0%) | 0 (0.0%) |
| Total (Category) | 21 (100.0%) | 0 (0.0%) |
| Total (Overall) | 179 (48.6%) | 189 (51.4%) |
Sales and Office Occupations
The most common Sales and Office occupations in New Hope are Sales & Related (68 | 18.5%), and Office & Administration (29 | 7.9%).

Sales and Office Occupations by Sex

| Occupation | Male | Female |
| Sales & Related | 16 (23.5%) | 52 (76.5%) |
| Office & Administration | 0 (0.0%) | 29 (100.0%) |
| Total (Category) | 16 (16.5%) | 81 (83.5%) |
| Total (Overall) | 179 (48.6%) | 189 (51.4%) |
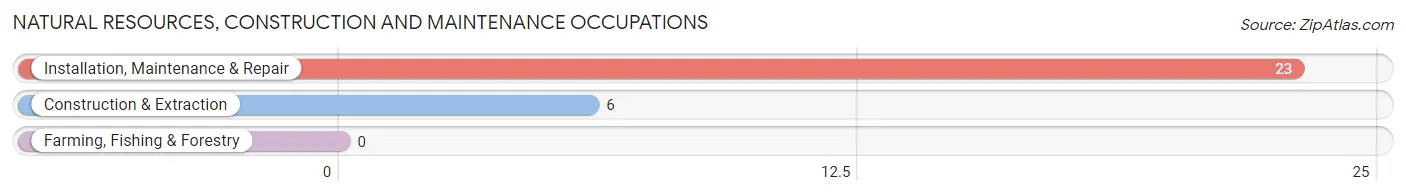
Natural Resources, Construction and Maintenance Occupations
The most common Natural Resources, Construction and Maintenance occupations in New Hope are Installation, Maintenance & Repair (23 | 6.2%), and Construction & Extraction (6 | 1.6%).
Natural Resources, Construction and Maintenance Occupations by Sex
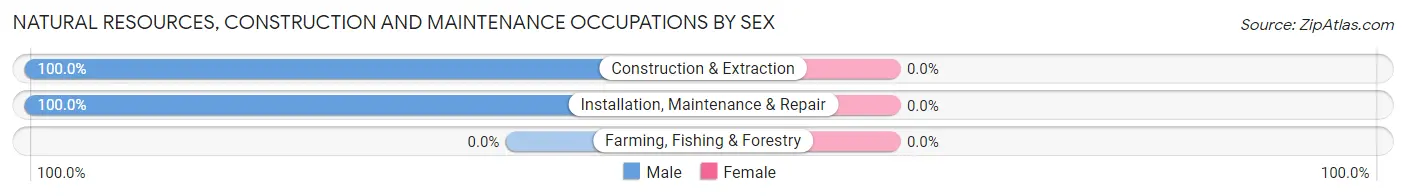
| Occupation | Male | Female |
| Farming, Fishing & Forestry | 0 (0.0%) | 0 (0.0%) |
| Construction & Extraction | 6 (100.0%) | 0 (0.0%) |
| Installation, Maintenance & Repair | 23 (100.0%) | 0 (0.0%) |
| Total (Category) | 29 (100.0%) | 0 (0.0%) |
| Total (Overall) | 179 (48.6%) | 189 (51.4%) |
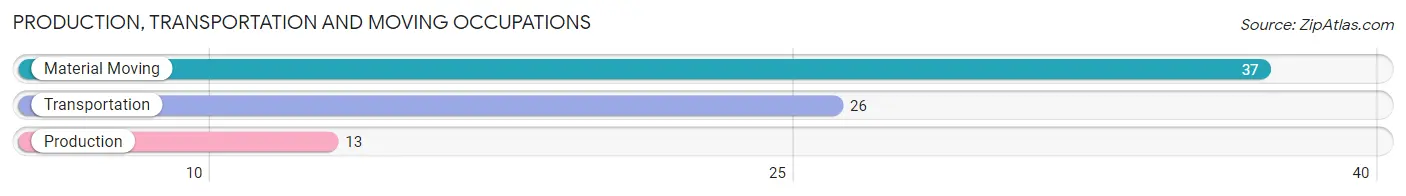
Production, Transportation and Moving Occupations
The most common Production, Transportation and Moving occupations in New Hope are Material Moving (37 | 10.1%), Transportation (26 | 7.1%), and Production (13 | 3.5%).
Production, Transportation and Moving Occupations by Sex
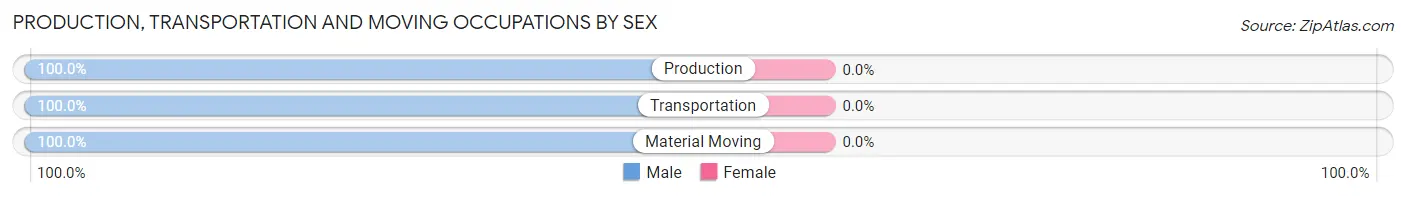
| Occupation | Male | Female |
| Production | 13 (100.0%) | 0 (0.0%) |
| Transportation | 26 (100.0%) | 0 (0.0%) |
| Material Moving | 37 (100.0%) | 0 (0.0%) |
| Total (Category) | 76 (100.0%) | 0 (0.0%) |
| Total (Overall) | 179 (48.6%) | 189 (51.4%) |
Employment Industries by Sex in New Hope
Employment Industries in New Hope
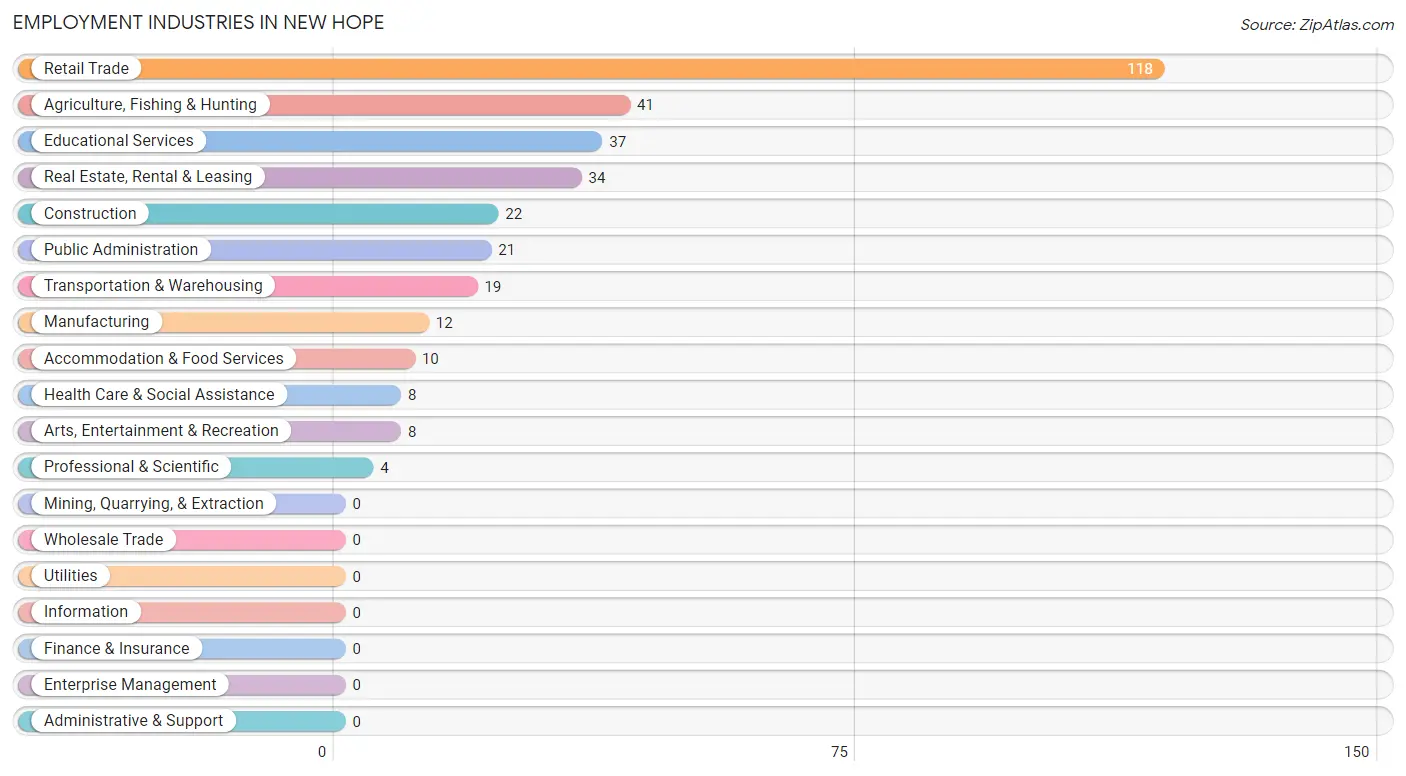
The major employment industries in New Hope include Retail Trade (118 | 32.1%), Agriculture, Fishing & Hunting (41 | 11.1%), Educational Services (37 | 10.1%), Real Estate, Rental & Leasing (34 | 9.2%), and Construction (22 | 6.0%).
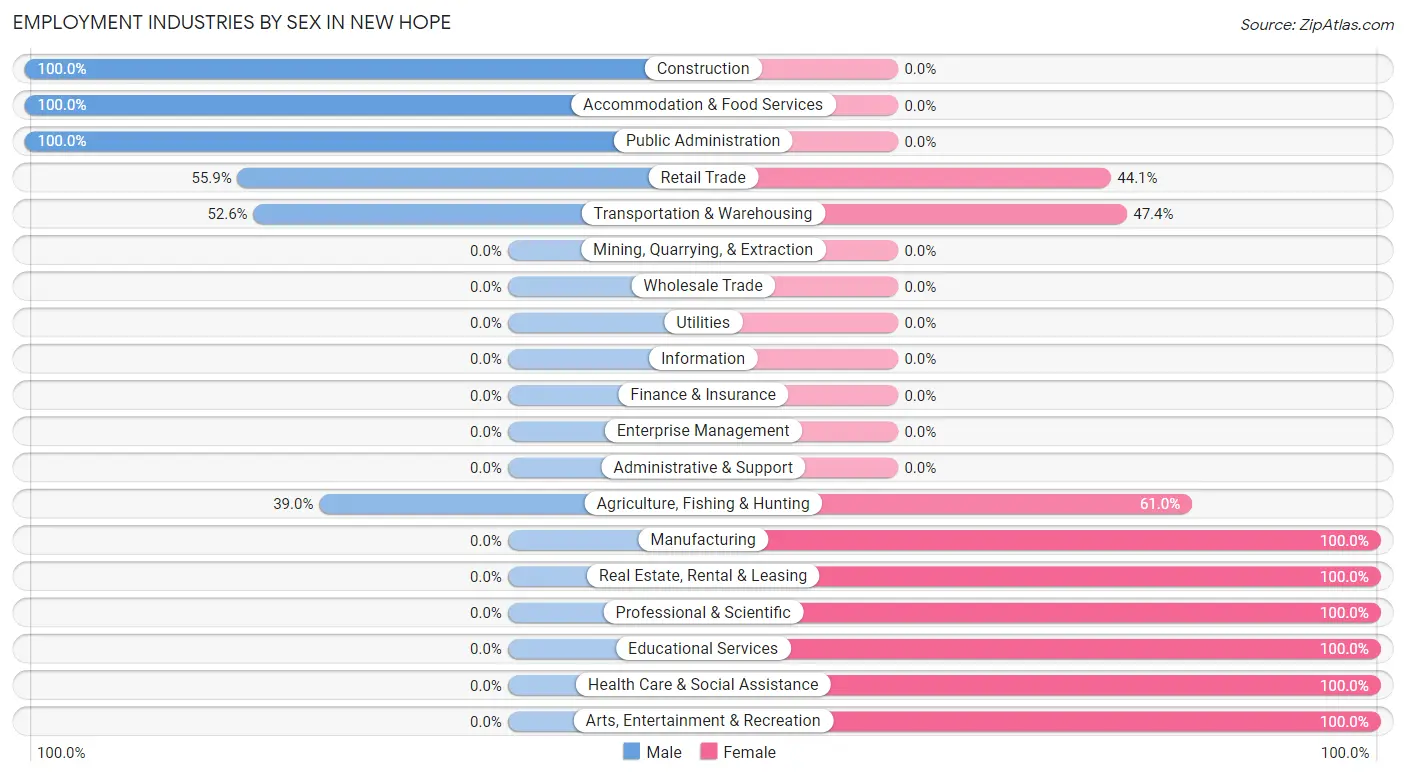
Employment Industries by Sex in New Hope
The New Hope industries that see more men than women are Construction (100.0%), Accommodation & Food Services (100.0%), and Public Administration (100.0%), whereas the industries that tend to have a higher number of women are Manufacturing (100.0%), Real Estate, Rental & Leasing (100.0%), and Professional & Scientific (100.0%).
| Industry | Male | Female |
| Agriculture, Fishing & Hunting | 16 (39.0%) | 25 (61.0%) |
| Mining, Quarrying, & Extraction | 0 (0.0%) | 0 (0.0%) |
| Construction | 22 (100.0%) | 0 (0.0%) |
| Manufacturing | 0 (0.0%) | 12 (100.0%) |
| Wholesale Trade | 0 (0.0%) | 0 (0.0%) |
| Retail Trade | 66 (55.9%) | 52 (44.1%) |
| Transportation & Warehousing | 10 (52.6%) | 9 (47.4%) |
| Utilities | 0 (0.0%) | 0 (0.0%) |
| Information | 0 (0.0%) | 0 (0.0%) |
| Finance & Insurance | 0 (0.0%) | 0 (0.0%) |
| Real Estate, Rental & Leasing | 0 (0.0%) | 34 (100.0%) |
| Professional & Scientific | 0 (0.0%) | 4 (100.0%) |
| Enterprise Management | 0 (0.0%) | 0 (0.0%) |
| Administrative & Support | 0 (0.0%) | 0 (0.0%) |
| Educational Services | 0 (0.0%) | 37 (100.0%) |
| Health Care & Social Assistance | 0 (0.0%) | 8 (100.0%) |
| Arts, Entertainment & Recreation | 0 (0.0%) | 8 (100.0%) |
| Accommodation & Food Services | 10 (100.0%) | 0 (0.0%) |
| Public Administration | 21 (100.0%) | 0 (0.0%) |
| Total | 179 (48.6%) | 189 (51.4%) |
Education in New Hope
School Enrollment in New Hope
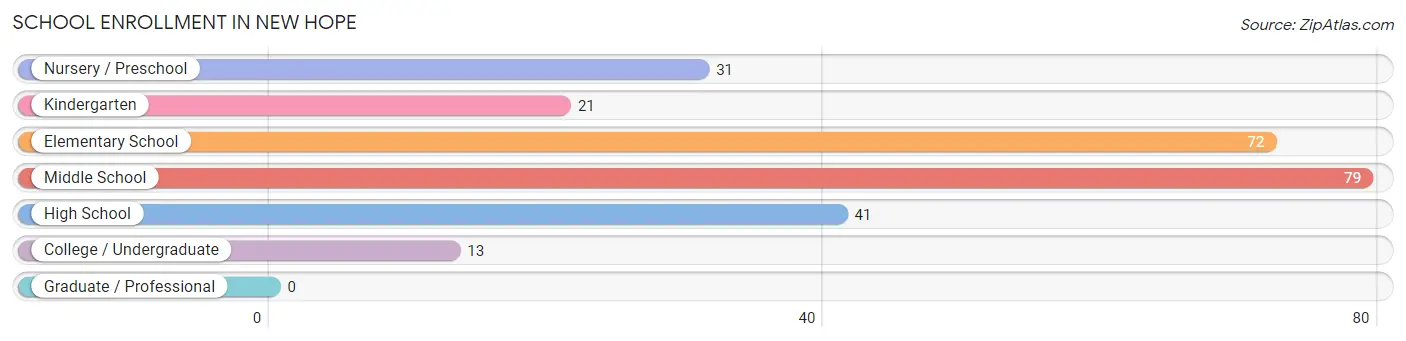
The most common levels of schooling among the 257 students in New Hope are middle school (79 | 30.7%), elementary school (72 | 28.0%), and high school (41 | 16.0%).
| School Level | # Students | % Students |
| Nursery / Preschool | 31 | 12.1% |
| Kindergarten | 21 | 8.2% |
| Elementary School | 72 | 28.0% |
| Middle School | 79 | 30.7% |
| High School | 41 | 16.0% |
| College / Undergraduate | 13 | 5.1% |
| Graduate / Professional | 0 | 0.0% |
| Total | 257 | 100.0% |
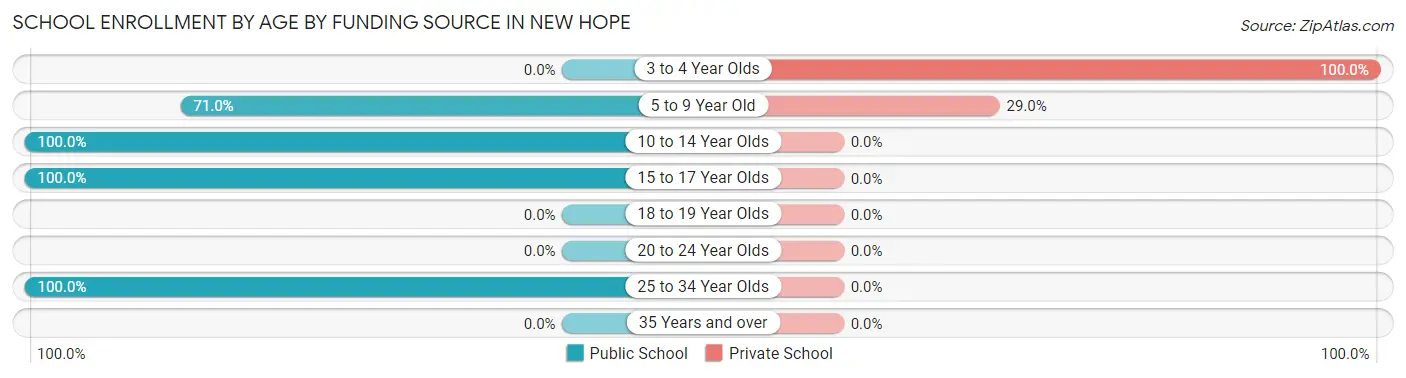
School Enrollment by Age by Funding Source in New Hope
Out of a total of 257 students who are enrolled in schools in New Hope, 58 (22.6%) attend a private institution, while the remaining 199 (77.4%) are enrolled in public schools. The age group of 3 to 4 year olds has the highest likelihood of being enrolled in private schools, with 31 (100.0% in the age bracket) enrolled. Conversely, the age group of 10 to 14 year olds has the lowest likelihood of being enrolled in a private school, with 90 (100.0% in the age bracket) attending a public institution.
| Age Bracket | Public School | Private School |
| 3 to 4 Year Olds | 0 (0.0%) | 31 (100.0%) |
| 5 to 9 Year Old | 66 (71.0%) | 27 (29.0%) |
| 10 to 14 Year Olds | 90 (100.0%) | 0 (0.0%) |
| 15 to 17 Year Olds | 30 (100.0%) | 0 (0.0%) |
| 18 to 19 Year Olds | 0 (0.0%) | 0 (0.0%) |
| 20 to 24 Year Olds | 0 (0.0%) | 0 (0.0%) |
| 25 to 34 Year Olds | 13 (100.0%) | 0 (0.0%) |
| 35 Years and over | 0 (0.0%) | 0 (0.0%) |
| Total | 199 (77.4%) | 58 (22.6%) |
Educational Attainment by Field of Study in New Hope
Liberal arts & history (69 | 25.0%), education (44 | 15.9%), science & technology (43 | 15.6%), bio, nature & agricultural (29 | 10.5%), and arts & humanities (23 | 8.3%) are the most common fields of study among 276 individuals in New Hope who have obtained a bachelor's degree or higher.
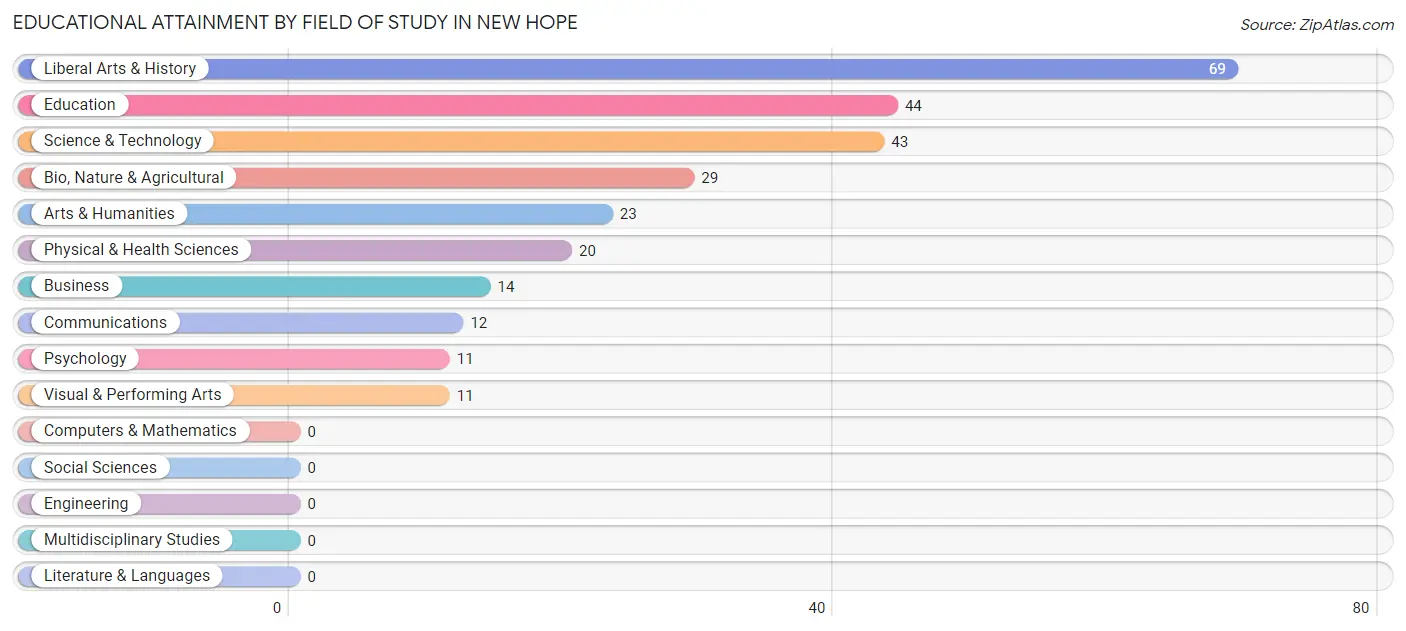
| Field of Study | # Graduates | % Graduates |
| Computers & Mathematics | 0 | 0.0% |
| Bio, Nature & Agricultural | 29 | 10.5% |
| Physical & Health Sciences | 20 | 7.2% |
| Psychology | 11 | 4.0% |
| Social Sciences | 0 | 0.0% |
| Engineering | 0 | 0.0% |
| Multidisciplinary Studies | 0 | 0.0% |
| Science & Technology | 43 | 15.6% |
| Business | 14 | 5.1% |
| Education | 44 | 15.9% |
| Literature & Languages | 0 | 0.0% |
| Liberal Arts & History | 69 | 25.0% |
| Visual & Performing Arts | 11 | 4.0% |
| Communications | 12 | 4.3% |
| Arts & Humanities | 23 | 8.3% |
| Total | 276 | 100.0% |
Transportation & Commute in New Hope
Vehicle Availability by Sex in New Hope
The most prevalent vehicle ownership categories in New Hope are males with 4 vehicles (75, accounting for 41.9%) and females with 4 vehicles (45, making up 39.7%).
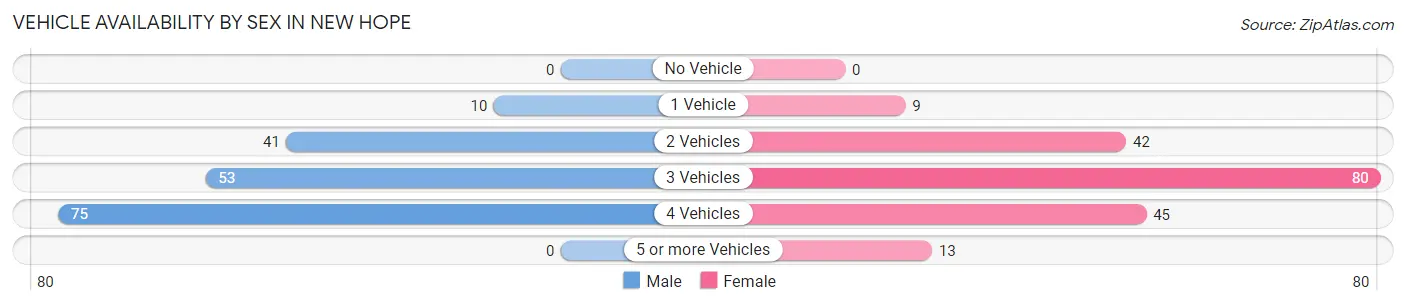
| Vehicles Available | Male | Female |
| No Vehicle | 0 (0.0%) | 0 (0.0%) |
| 1 Vehicle | 10 (5.6%) | 9 (4.8%) |
| 2 Vehicles | 41 (22.9%) | 42 (22.2%) |
| 3 Vehicles | 53 (29.6%) | 80 (42.3%) |
| 4 Vehicles | 75 (41.9%) | 45 (23.8%) |
| 5 or more Vehicles | 0 (0.0%) | 13 (6.9%) |
| Total | 179 (100.0%) | 189 (100.0%) |
Commute Time in New Hope
The most frequently occuring commute durations in New Hope are 15 to 19 minutes (66 commuters, 23.6%), 10 to 14 minutes (44 commuters, 15.7%), and 20 to 24 minutes (40 commuters, 14.3%).
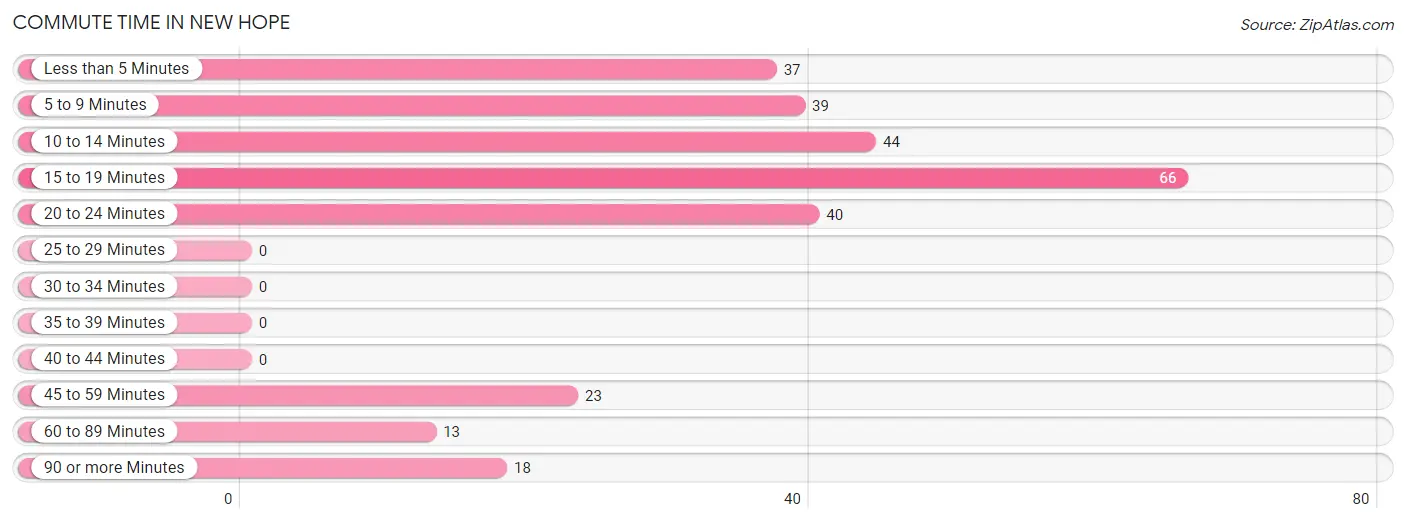
| Commute Time | # Commuters | % Commuters |
| Less than 5 Minutes | 37 | 13.2% |
| 5 to 9 Minutes | 39 | 13.9% |
| 10 to 14 Minutes | 44 | 15.7% |
| 15 to 19 Minutes | 66 | 23.6% |
| 20 to 24 Minutes | 40 | 14.3% |
| 25 to 29 Minutes | 0 | 0.0% |
| 30 to 34 Minutes | 0 | 0.0% |
| 35 to 39 Minutes | 0 | 0.0% |
| 40 to 44 Minutes | 0 | 0.0% |
| 45 to 59 Minutes | 23 | 8.2% |
| 60 to 89 Minutes | 13 | 4.6% |
| 90 or more Minutes | 18 | 6.4% |
Commute Time by Sex in New Hope
The most common commute times in New Hope are 15 to 19 minutes (45 commuters, 30.0%) for males and 5 to 9 minutes (39 commuters, 30.0%) for females.
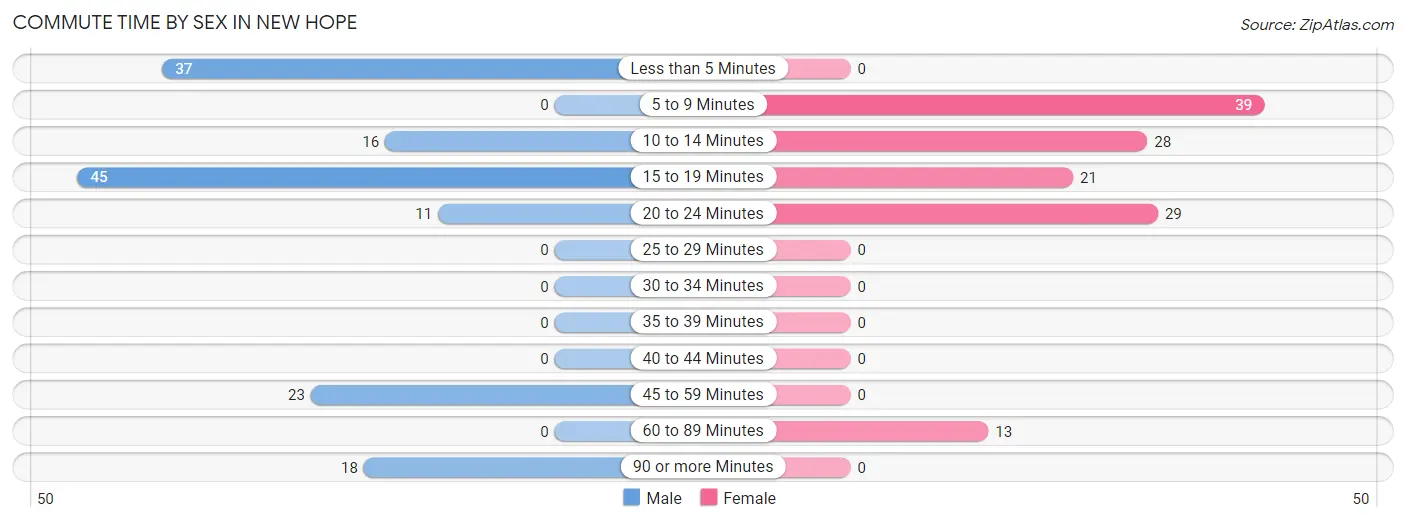
| Commute Time | Male | Female |
| Less than 5 Minutes | 37 (24.7%) | 0 (0.0%) |
| 5 to 9 Minutes | 0 (0.0%) | 39 (30.0%) |
| 10 to 14 Minutes | 16 (10.7%) | 28 (21.5%) |
| 15 to 19 Minutes | 45 (30.0%) | 21 (16.2%) |
| 20 to 24 Minutes | 11 (7.3%) | 29 (22.3%) |
| 25 to 29 Minutes | 0 (0.0%) | 0 (0.0%) |
| 30 to 34 Minutes | 0 (0.0%) | 0 (0.0%) |
| 35 to 39 Minutes | 0 (0.0%) | 0 (0.0%) |
| 40 to 44 Minutes | 0 (0.0%) | 0 (0.0%) |
| 45 to 59 Minutes | 23 (15.3%) | 0 (0.0%) |
| 60 to 89 Minutes | 0 (0.0%) | 13 (10.0%) |
| 90 or more Minutes | 18 (12.0%) | 0 (0.0%) |
Time of Departure to Work by Sex in New Hope
The most frequent times of departure to work in New Hope are 7:00 AM to 7:29 AM (62, 41.3%) for males and 7:30 AM to 7:59 AM (41, 31.5%) for females.
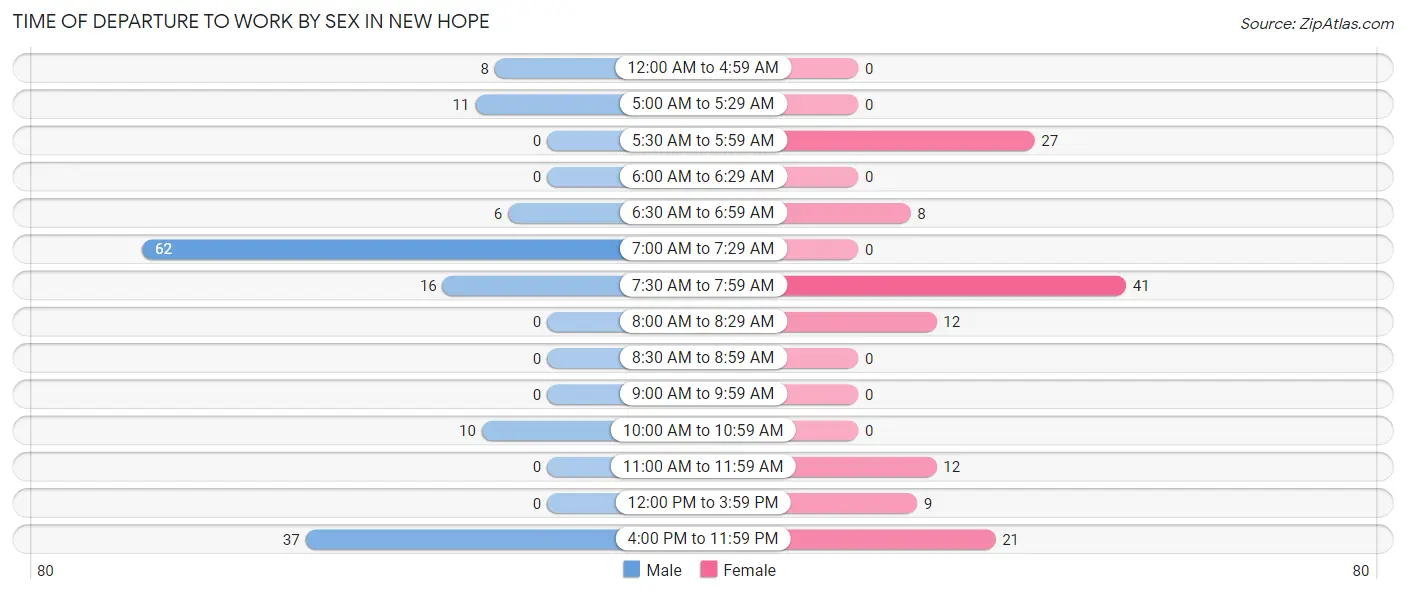
| Time of Departure | Male | Female |
| 12:00 AM to 4:59 AM | 8 (5.3%) | 0 (0.0%) |
| 5:00 AM to 5:29 AM | 11 (7.3%) | 0 (0.0%) |
| 5:30 AM to 5:59 AM | 0 (0.0%) | 27 (20.8%) |
| 6:00 AM to 6:29 AM | 0 (0.0%) | 0 (0.0%) |
| 6:30 AM to 6:59 AM | 6 (4.0%) | 8 (6.1%) |
| 7:00 AM to 7:29 AM | 62 (41.3%) | 0 (0.0%) |
| 7:30 AM to 7:59 AM | 16 (10.7%) | 41 (31.5%) |
| 8:00 AM to 8:29 AM | 0 (0.0%) | 12 (9.2%) |
| 8:30 AM to 8:59 AM | 0 (0.0%) | 0 (0.0%) |
| 9:00 AM to 9:59 AM | 0 (0.0%) | 0 (0.0%) |
| 10:00 AM to 10:59 AM | 10 (6.7%) | 0 (0.0%) |
| 11:00 AM to 11:59 AM | 0 (0.0%) | 12 (9.2%) |
| 12:00 PM to 3:59 PM | 0 (0.0%) | 9 (6.9%) |
| 4:00 PM to 11:59 PM | 37 (24.7%) | 21 (16.2%) |
| Total | 150 (100.0%) | 130 (100.0%) |
Housing Occupancy in New Hope
Occupancy by Ownership in New Hope
Of the total 532 dwellings in New Hope, owner-occupied units account for 498 (93.6%), while renter-occupied units make up 34 (6.4%).
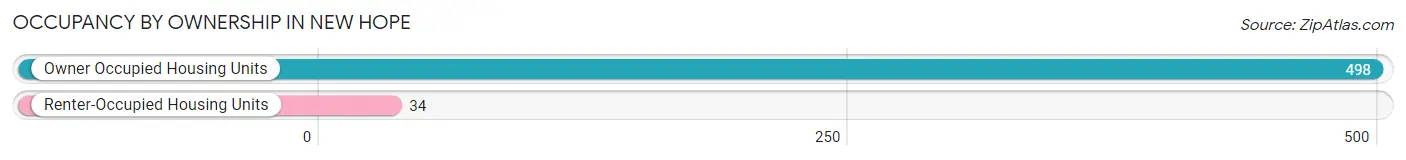
| Occupancy | # Housing Units | % Housing Units |
| Owner Occupied Housing Units | 498 | 93.6% |
| Renter-Occupied Housing Units | 34 | 6.4% |
| Total Occupied Housing Units | 532 | 100.0% |
Occupancy by Household Size in New Hope
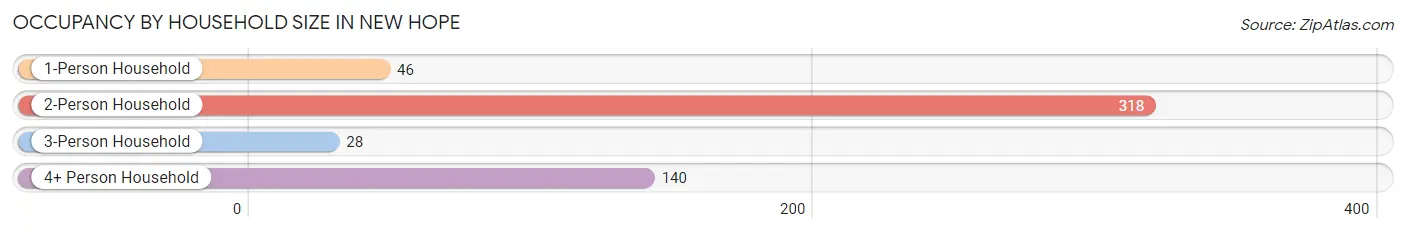
| Household Size | # Housing Units | % Housing Units |
| 1-Person Household | 46 | 8.6% |
| 2-Person Household | 318 | 59.8% |
| 3-Person Household | 28 | 5.3% |
| 4+ Person Household | 140 | 26.3% |
| Total Housing Units | 532 | 100.0% |
Occupancy by Ownership by Household Size in New Hope
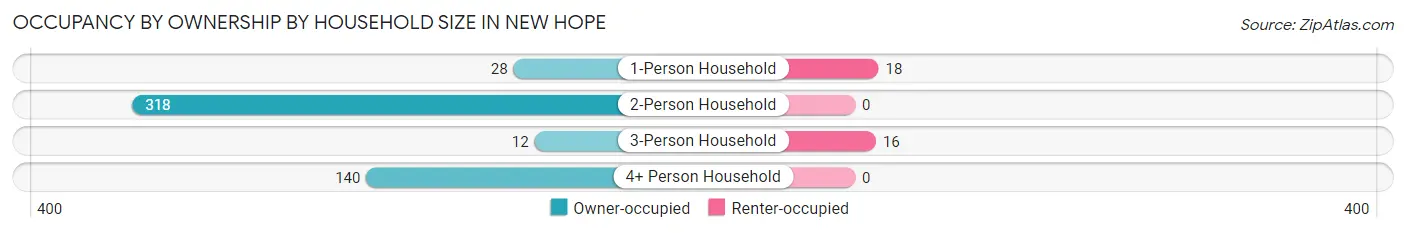
| Household Size | Owner-occupied | Renter-occupied |
| 1-Person Household | 28 (60.9%) | 18 (39.1%) |
| 2-Person Household | 318 (100.0%) | 0 (0.0%) |
| 3-Person Household | 12 (42.9%) | 16 (57.1%) |
| 4+ Person Household | 140 (100.0%) | 0 (0.0%) |
| Total Housing Units | 498 (93.6%) | 34 (6.4%) |
Occupancy by Educational Attainment in New Hope
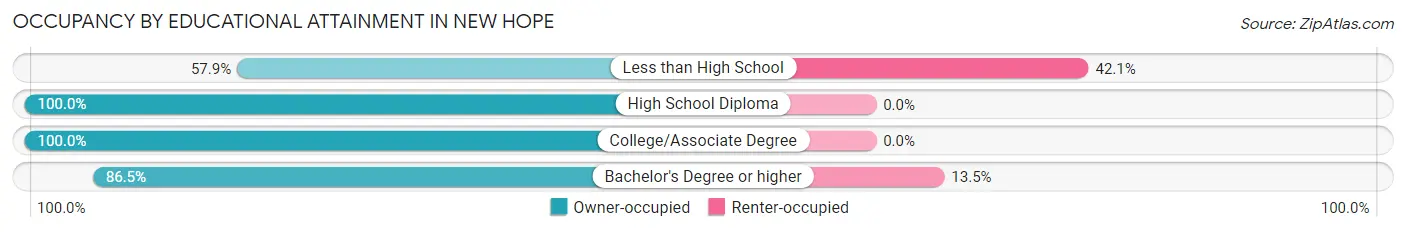
| Household Size | Owner-occupied | Renter-occupied |
| Less than High School | 22 (57.9%) | 16 (42.1%) |
| High School Diploma | 172 (100.0%) | 0 (0.0%) |
| College/Associate Degree | 189 (100.0%) | 0 (0.0%) |
| Bachelor's Degree or higher | 115 (86.5%) | 18 (13.5%) |
Occupancy by Age of Householder in New Hope
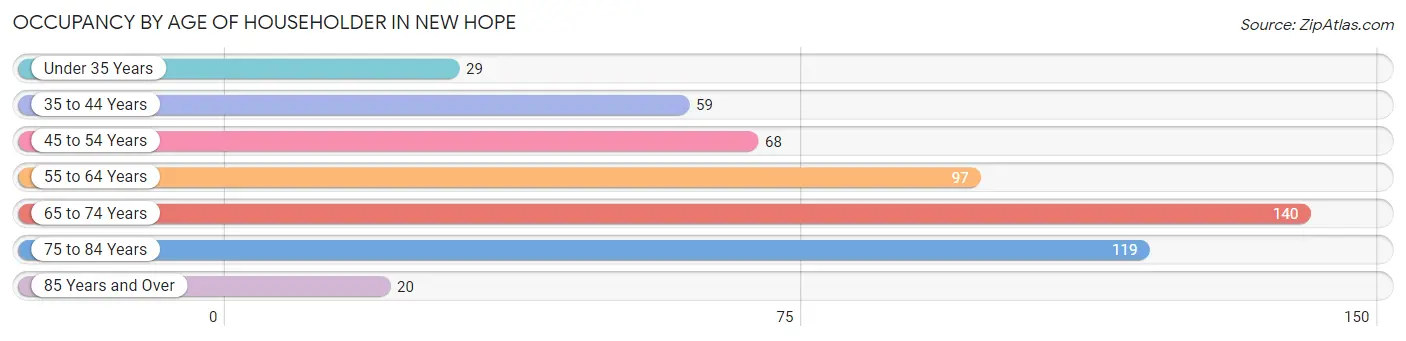
| Age Bracket | # Households | % Households |
| Under 35 Years | 29 | 5.4% |
| 35 to 44 Years | 59 | 11.1% |
| 45 to 54 Years | 68 | 12.8% |
| 55 to 64 Years | 97 | 18.2% |
| 65 to 74 Years | 140 | 26.3% |
| 75 to 84 Years | 119 | 22.4% |
| 85 Years and Over | 20 | 3.8% |
| Total | 532 | 100.0% |
Housing Finances in New Hope
Median Income by Occupancy in New Hope
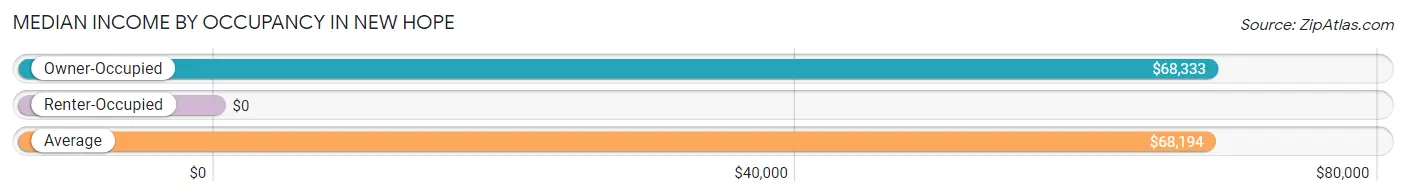
| Occupancy Type | # Households | Median Income |
| Owner-Occupied | 498 (93.6%) | $68,333 |
| Renter-Occupied | 34 (6.4%) | $0 |
| Average | 532 (100.0%) | $68,194 |
Occupancy by Householder Income Bracket in New Hope
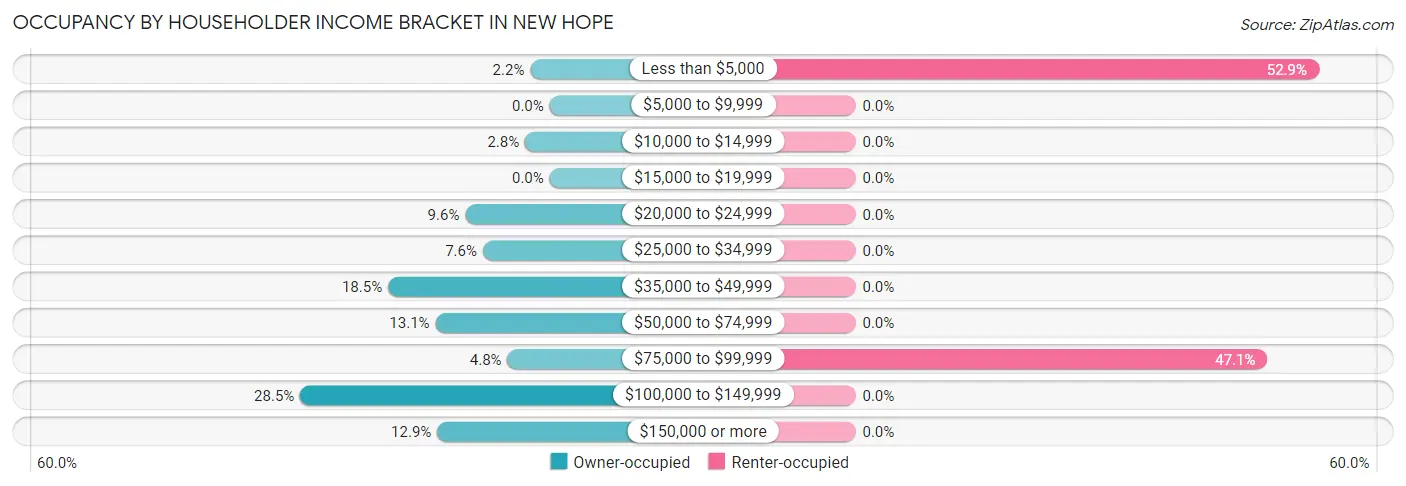
| Income Bracket | Owner-occupied | Renter-occupied |
| Less than $5,000 | 11 (2.2%) | 18 (52.9%) |
| $5,000 to $9,999 | 0 (0.0%) | 0 (0.0%) |
| $10,000 to $14,999 | 14 (2.8%) | 0 (0.0%) |
| $15,000 to $19,999 | 0 (0.0%) | 0 (0.0%) |
| $20,000 to $24,999 | 48 (9.6%) | 0 (0.0%) |
| $25,000 to $34,999 | 38 (7.6%) | 0 (0.0%) |
| $35,000 to $49,999 | 92 (18.5%) | 0 (0.0%) |
| $50,000 to $74,999 | 65 (13.1%) | 0 (0.0%) |
| $75,000 to $99,999 | 24 (4.8%) | 16 (47.1%) |
| $100,000 to $149,999 | 142 (28.5%) | 0 (0.0%) |
| $150,000 or more | 64 (12.9%) | 0 (0.0%) |
| Total | 498 (100.0%) | 34 (100.0%) |
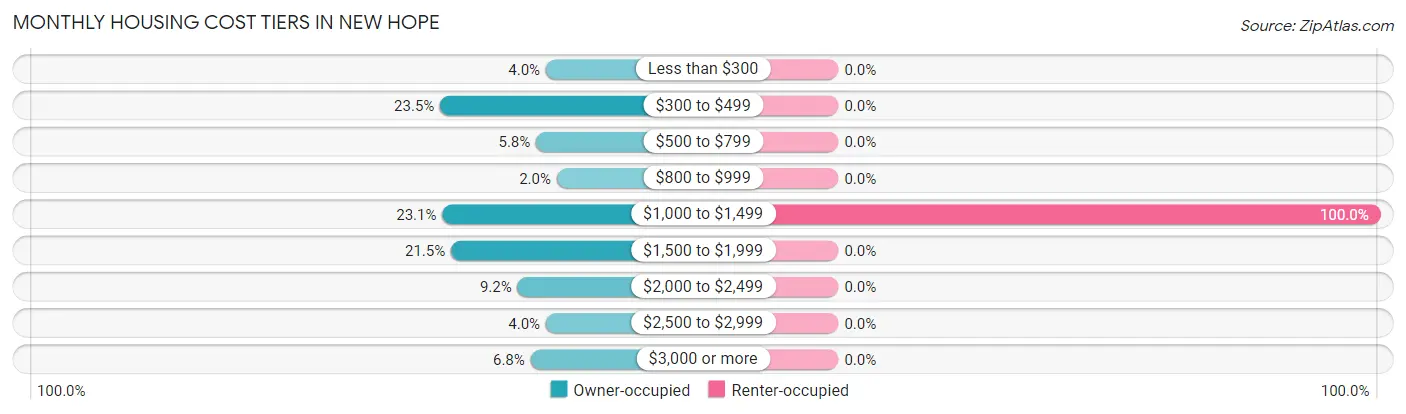
Monthly Housing Cost Tiers in New Hope
| Monthly Cost | Owner-occupied | Renter-occupied |
| Less than $300 | 20 (4.0%) | 0 (0.0%) |
| $300 to $499 | 117 (23.5%) | 0 (0.0%) |
| $500 to $799 | 29 (5.8%) | 0 (0.0%) |
| $800 to $999 | 10 (2.0%) | 0 (0.0%) |
| $1,000 to $1,499 | 115 (23.1%) | 34 (100.0%) |
| $1,500 to $1,999 | 107 (21.5%) | 0 (0.0%) |
| $2,000 to $2,499 | 46 (9.2%) | 0 (0.0%) |
| $2,500 to $2,999 | 20 (4.0%) | 0 (0.0%) |
| $3,000 or more | 34 (6.8%) | 0 (0.0%) |
| Total | 498 (100.0%) | 34 (100.0%) |
Physical Housing Characteristics in New Hope
Housing Structures in New Hope
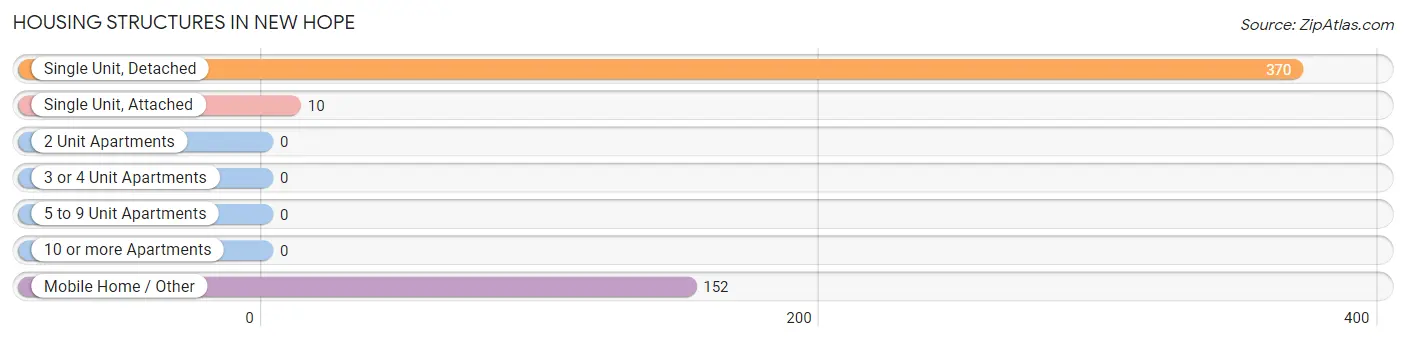
| Structure Type | # Housing Units | % Housing Units |
| Single Unit, Detached | 370 | 69.6% |
| Single Unit, Attached | 10 | 1.9% |
| 2 Unit Apartments | 0 | 0.0% |
| 3 or 4 Unit Apartments | 0 | 0.0% |
| 5 to 9 Unit Apartments | 0 | 0.0% |
| 10 or more Apartments | 0 | 0.0% |
| Mobile Home / Other | 152 | 28.6% |
| Total | 532 | 100.0% |
Housing Structures by Occupancy in New Hope
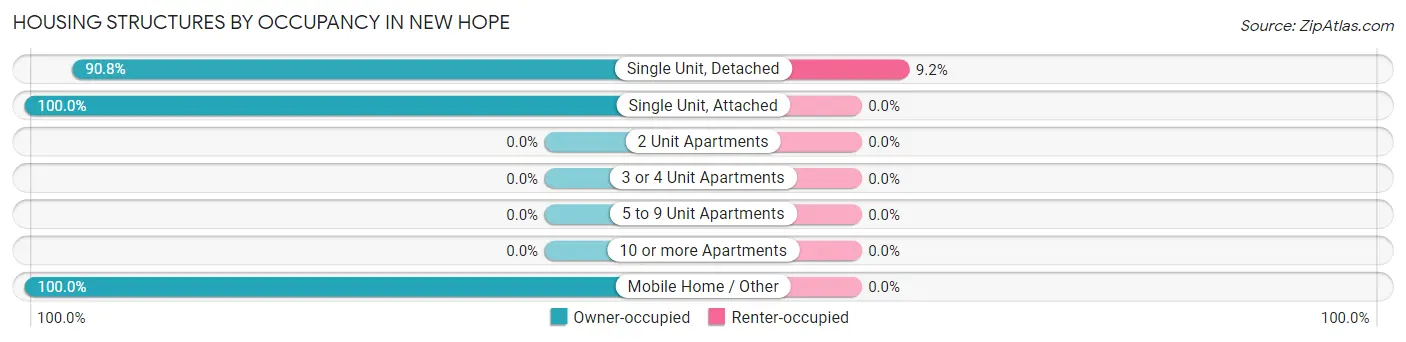
| Structure Type | Owner-occupied | Renter-occupied |
| Single Unit, Detached | 336 (90.8%) | 34 (9.2%) |
| Single Unit, Attached | 10 (100.0%) | 0 (0.0%) |
| 2 Unit Apartments | 0 (0.0%) | 0 (0.0%) |
| 3 or 4 Unit Apartments | 0 (0.0%) | 0 (0.0%) |
| 5 to 9 Unit Apartments | 0 (0.0%) | 0 (0.0%) |
| 10 or more Apartments | 0 (0.0%) | 0 (0.0%) |
| Mobile Home / Other | 152 (100.0%) | 0 (0.0%) |
| Total | 498 (93.6%) | 34 (6.4%) |
Housing Structures by Number of Rooms in New Hope
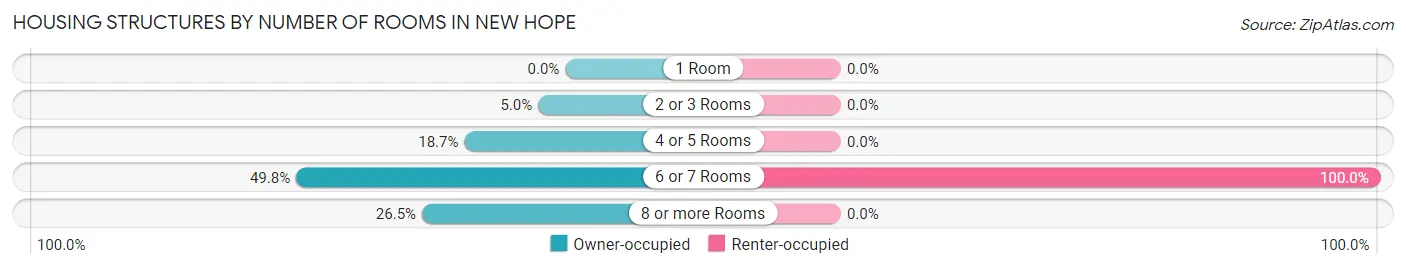
| Number of Rooms | Owner-occupied | Renter-occupied |
| 1 Room | 0 (0.0%) | 0 (0.0%) |
| 2 or 3 Rooms | 25 (5.0%) | 0 (0.0%) |
| 4 or 5 Rooms | 93 (18.7%) | 0 (0.0%) |
| 6 or 7 Rooms | 248 (49.8%) | 34 (100.0%) |
| 8 or more Rooms | 132 (26.5%) | 0 (0.0%) |
| Total | 498 (100.0%) | 34 (100.0%) |
Housing Structure by Heating Type in New Hope
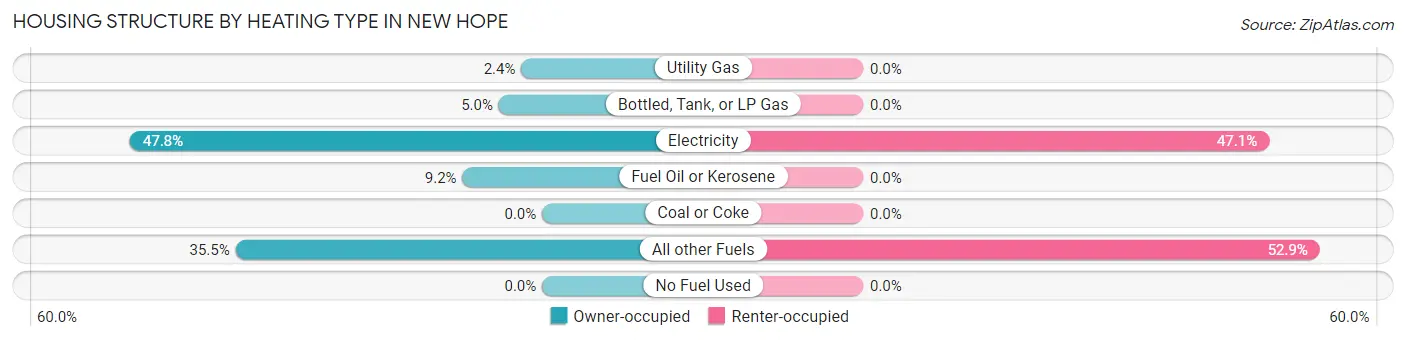
| Heating Type | Owner-occupied | Renter-occupied |
| Utility Gas | 12 (2.4%) | 0 (0.0%) |
| Bottled, Tank, or LP Gas | 25 (5.0%) | 0 (0.0%) |
| Electricity | 238 (47.8%) | 16 (47.1%) |
| Fuel Oil or Kerosene | 46 (9.2%) | 0 (0.0%) |
| Coal or Coke | 0 (0.0%) | 0 (0.0%) |
| All other Fuels | 177 (35.5%) | 18 (52.9%) |
| No Fuel Used | 0 (0.0%) | 0 (0.0%) |
| Total | 498 (100.0%) | 34 (100.0%) |
Household Vehicle Usage in New Hope
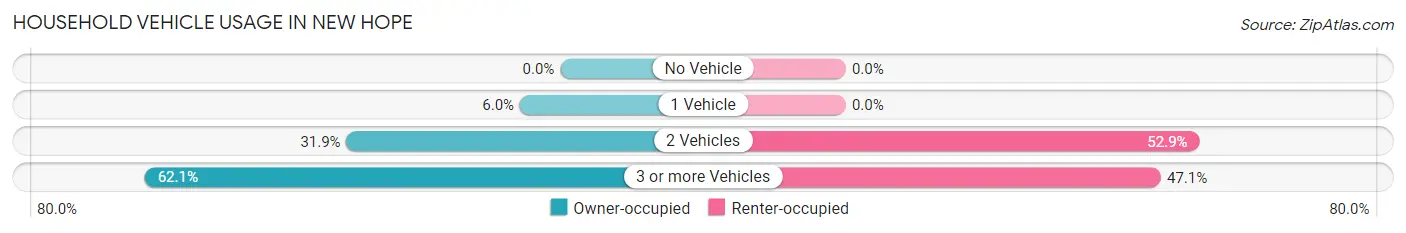
| Vehicles per Household | Owner-occupied | Renter-occupied |
| No Vehicle | 0 (0.0%) | 0 (0.0%) |
| 1 Vehicle | 30 (6.0%) | 0 (0.0%) |
| 2 Vehicles | 159 (31.9%) | 18 (52.9%) |
| 3 or more Vehicles | 309 (62.1%) | 16 (47.1%) |
| Total | 498 (100.0%) | 34 (100.0%) |
Real Estate & Mortgages in New Hope
Real Estate and Mortgage Overview in New Hope
| Characteristic | Without Mortgage | With Mortgage |
| Housing Units | 163 | 335 |
| Median Property Value | $475,800 | $298,500 |
| Median Household Income | $49,007 | $64 |
| Monthly Housing Costs | $376 | $34 |
| Real Estate Taxes | $1,765 | $0 |
Property Value by Mortgage Status in New Hope
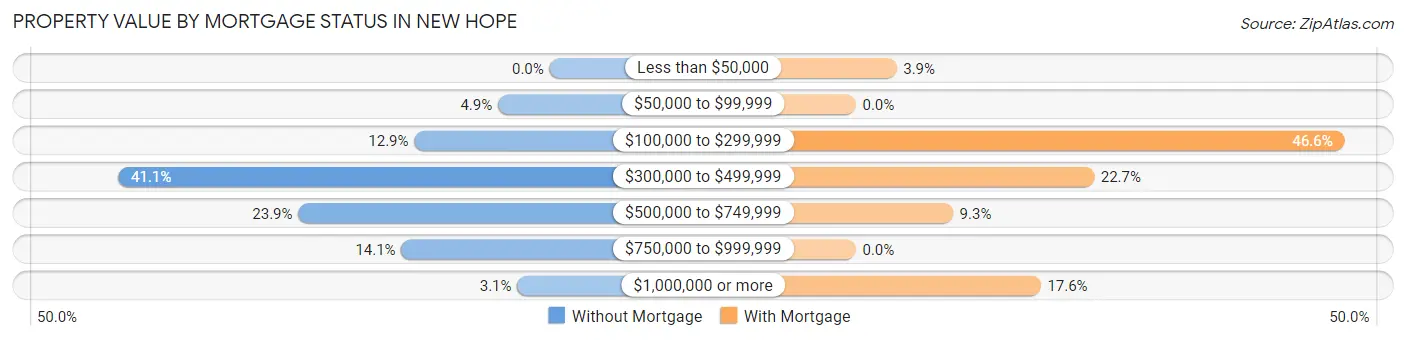
| Property Value | Without Mortgage | With Mortgage |
| Less than $50,000 | 0 (0.0%) | 13 (3.9%) |
| $50,000 to $99,999 | 8 (4.9%) | 0 (0.0%) |
| $100,000 to $299,999 | 21 (12.9%) | 156 (46.6%) |
| $300,000 to $499,999 | 67 (41.1%) | 76 (22.7%) |
| $500,000 to $749,999 | 39 (23.9%) | 31 (9.2%) |
| $750,000 to $999,999 | 23 (14.1%) | 0 (0.0%) |
| $1,000,000 or more | 5 (3.1%) | 59 (17.6%) |
| Total | 163 (100.0%) | 335 (100.0%) |
Household Income by Mortgage Status in New Hope
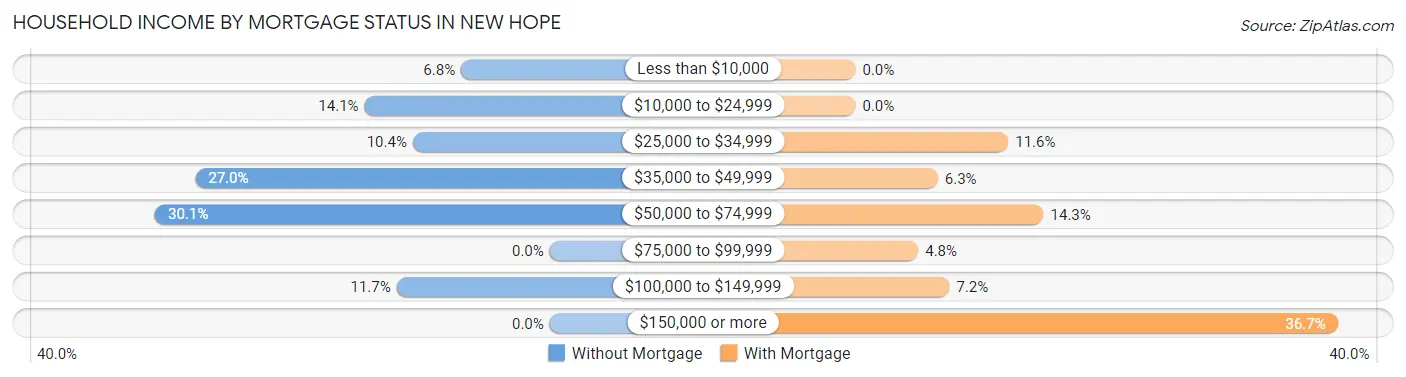
| Household Income | Without Mortgage | With Mortgage |
| Less than $10,000 | 11 (6.8%) | 0 (0.0%) |
| $10,000 to $24,999 | 23 (14.1%) | 0 (0.0%) |
| $25,000 to $34,999 | 17 (10.4%) | 39 (11.6%) |
| $35,000 to $49,999 | 44 (27.0%) | 21 (6.3%) |
| $50,000 to $74,999 | 49 (30.1%) | 48 (14.3%) |
| $75,000 to $99,999 | 0 (0.0%) | 16 (4.8%) |
| $100,000 to $149,999 | 19 (11.7%) | 24 (7.2%) |
| $150,000 or more | 0 (0.0%) | 123 (36.7%) |
| Total | 163 (100.0%) | 335 (100.0%) |
Property Value to Household Income Ratio in New Hope
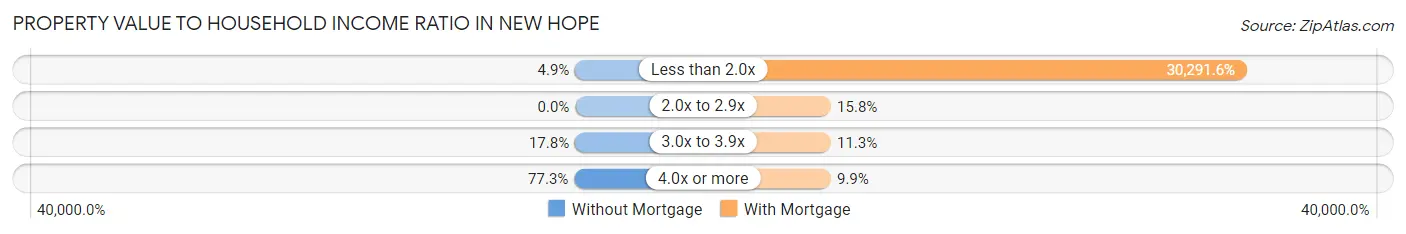
| Value-to-Income Ratio | Without Mortgage | With Mortgage |
| Less than 2.0x | 8 (4.9%) | 101,477 (30,291.6%) |
| 2.0x to 2.9x | 0 (0.0%) | 53 (15.8%) |
| 3.0x to 3.9x | 29 (17.8%) | 38 (11.3%) |
| 4.0x or more | 126 (77.3%) | 33 (9.9%) |
| Total | 163 (100.0%) | 335 (100.0%) |
Real Estate Taxes by Mortgage Status in New Hope
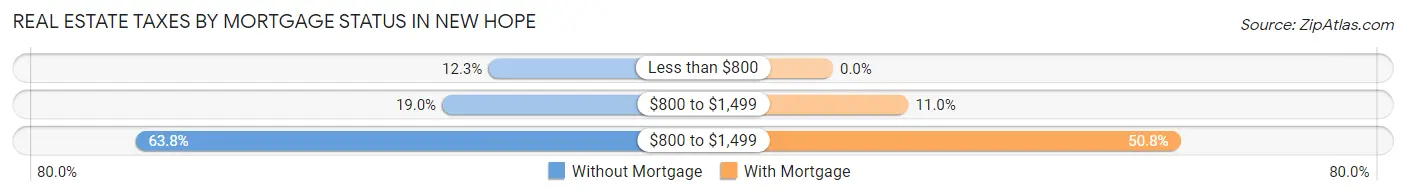
| Property Taxes | Without Mortgage | With Mortgage |
| Less than $800 | 20 (12.3%) | 0 (0.0%) |
| $800 to $1,499 | 31 (19.0%) | 37 (11.0%) |
| $800 to $1,499 | 104 (63.8%) | 170 (50.7%) |
| Total | 163 (100.0%) | 335 (100.0%) |
Health & Disability in New Hope
Health Insurance Coverage by Age in New Hope
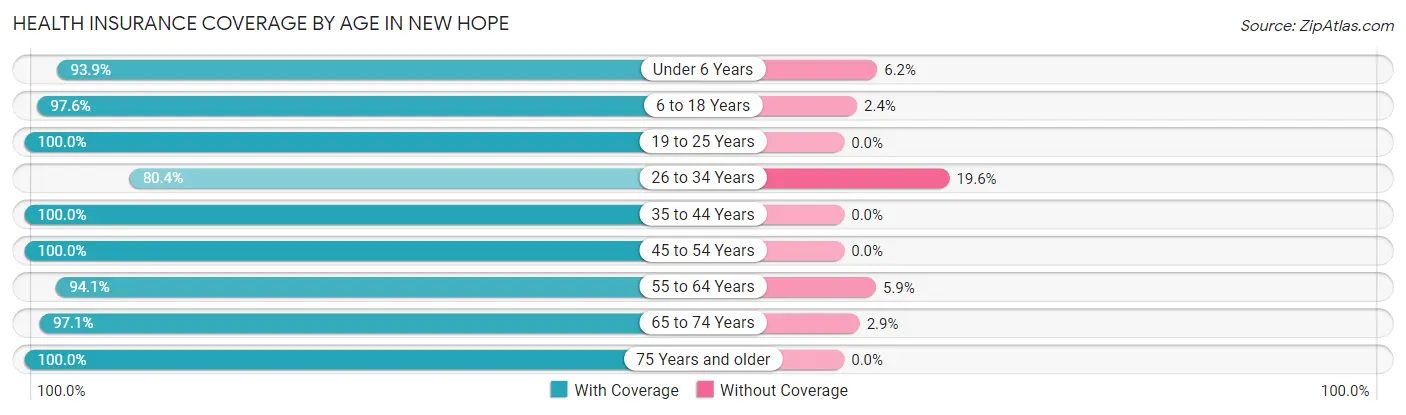
| Age Bracket | With Coverage | Without Coverage |
| Under 6 Years | 61 (93.9%) | 4 (6.1%) |
| 6 to 18 Years | 204 (97.6%) | 5 (2.4%) |
| 19 to 25 Years | 47 (100.0%) | 0 (0.0%) |
| 26 to 34 Years | 41 (80.4%) | 10 (19.6%) |
| 35 to 44 Years | 115 (100.0%) | 0 (0.0%) |
| 45 to 54 Years | 197 (100.0%) | 0 (0.0%) |
| 55 to 64 Years | 143 (94.1%) | 9 (5.9%) |
| 65 to 74 Years | 337 (97.1%) | 10 (2.9%) |
| 75 Years and older | 216 (100.0%) | 0 (0.0%) |
| Total | 1,361 (97.3%) | 38 (2.7%) |
Health Insurance Coverage by Citizenship Status in New Hope
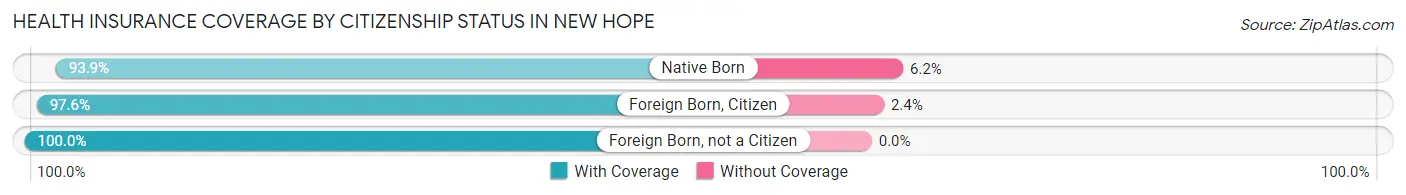
| Citizenship Status | With Coverage | Without Coverage |
| Native Born | 61 (93.9%) | 4 (6.1%) |
| Foreign Born, Citizen | 204 (97.6%) | 5 (2.4%) |
| Foreign Born, not a Citizen | 47 (100.0%) | 0 (0.0%) |
Health Insurance Coverage by Household Income in New Hope
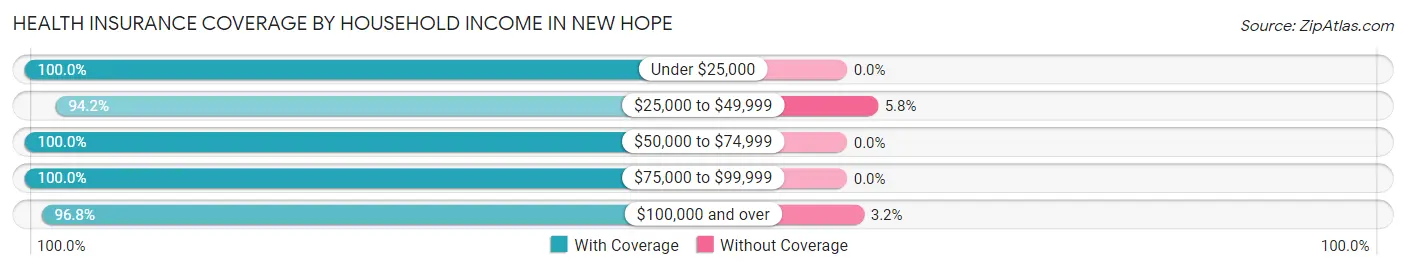
| Household Income | With Coverage | Without Coverage |
| Under $25,000 | 212 (100.0%) | 0 (0.0%) |
| $25,000 to $49,999 | 309 (94.2%) | 19 (5.8%) |
| $50,000 to $74,999 | 136 (100.0%) | 0 (0.0%) |
| $75,000 to $99,999 | 125 (100.0%) | 0 (0.0%) |
| $100,000 and over | 579 (96.8%) | 19 (3.2%) |
Public vs Private Health Insurance Coverage by Age in New Hope
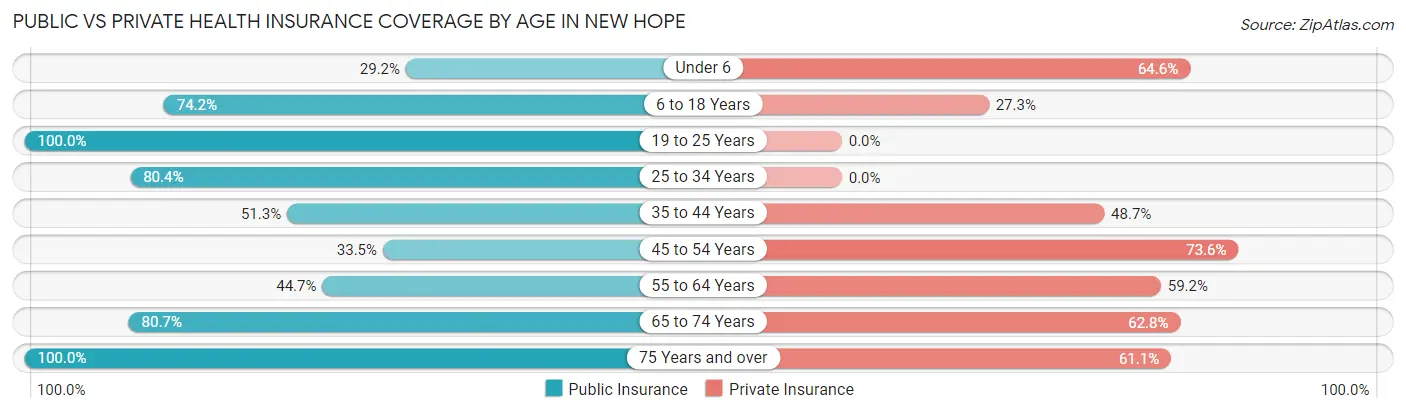
| Age Bracket | Public Insurance | Private Insurance |
| Under 6 | 19 (29.2%) | 42 (64.6%) |
| 6 to 18 Years | 155 (74.2%) | 57 (27.3%) |
| 19 to 25 Years | 47 (100.0%) | 0 (0.0%) |
| 25 to 34 Years | 41 (80.4%) | 0 (0.0%) |
| 35 to 44 Years | 59 (51.3%) | 56 (48.7%) |
| 45 to 54 Years | 66 (33.5%) | 145 (73.6%) |
| 55 to 64 Years | 68 (44.7%) | 90 (59.2%) |
| 65 to 74 Years | 280 (80.7%) | 218 (62.8%) |
| 75 Years and over | 216 (100.0%) | 132 (61.1%) |
| Total | 951 (68.0%) | 740 (52.9%) |
Disability Status by Sex by Age in New Hope
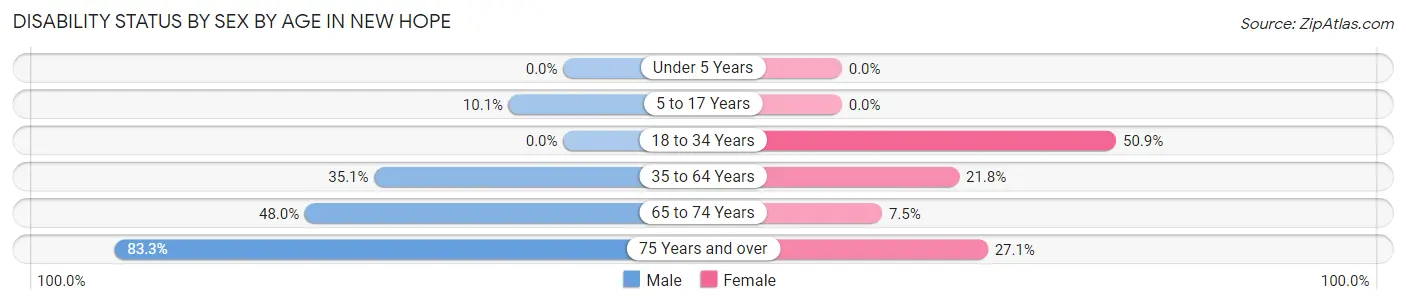
| Age Bracket | Male | Female |
| Under 5 Years | 0 (0.0%) | 0 (0.0%) |
| 5 to 17 Years | 9 (10.1%) | 0 (0.0%) |
| 18 to 34 Years | 0 (0.0%) | 28 (50.9%) |
| 35 to 64 Years | 87 (35.1%) | 47 (21.8%) |
| 65 to 74 Years | 70 (47.9%) | 15 (7.5%) |
| 75 Years and over | 100 (83.3%) | 26 (27.1%) |
Disability Class by Sex by Age in New Hope
Disability Class: Hearing Difficulty
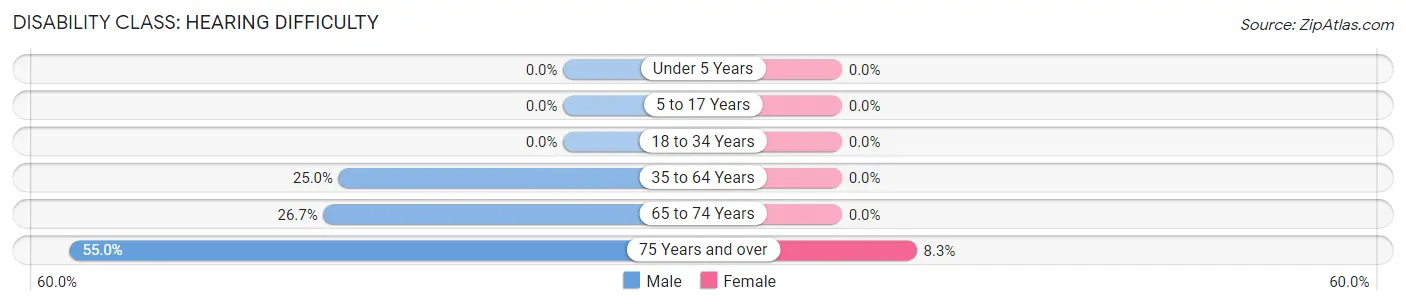
| Age Bracket | Male | Female |
| Under 5 Years | 0 (0.0%) | 0 (0.0%) |
| 5 to 17 Years | 0 (0.0%) | 0 (0.0%) |
| 18 to 34 Years | 0 (0.0%) | 0 (0.0%) |
| 35 to 64 Years | 62 (25.0%) | 0 (0.0%) |
| 65 to 74 Years | 39 (26.7%) | 0 (0.0%) |
| 75 Years and over | 66 (55.0%) | 8 (8.3%) |
Disability Class: Vision Difficulty
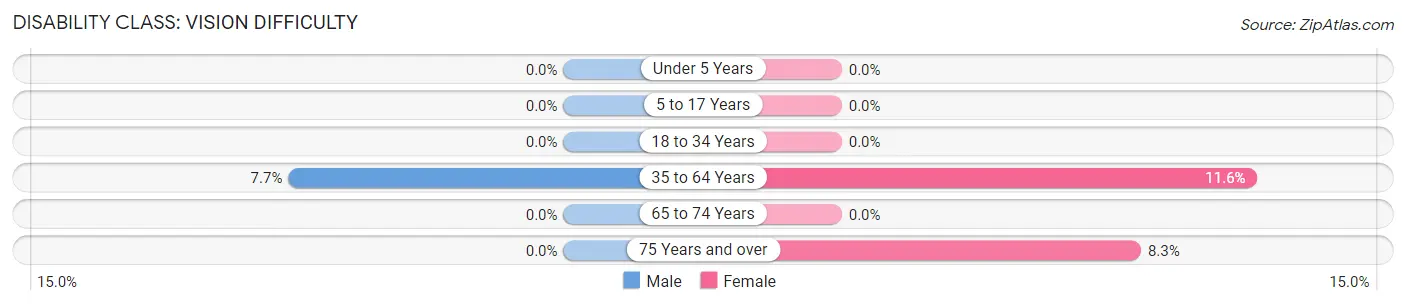
| Age Bracket | Male | Female |
| Under 5 Years | 0 (0.0%) | 0 (0.0%) |
| 5 to 17 Years | 0 (0.0%) | 0 (0.0%) |
| 18 to 34 Years | 0 (0.0%) | 0 (0.0%) |
| 35 to 64 Years | 19 (7.7%) | 25 (11.6%) |
| 65 to 74 Years | 0 (0.0%) | 0 (0.0%) |
| 75 Years and over | 0 (0.0%) | 8 (8.3%) |
Disability Class: Cognitive Difficulty
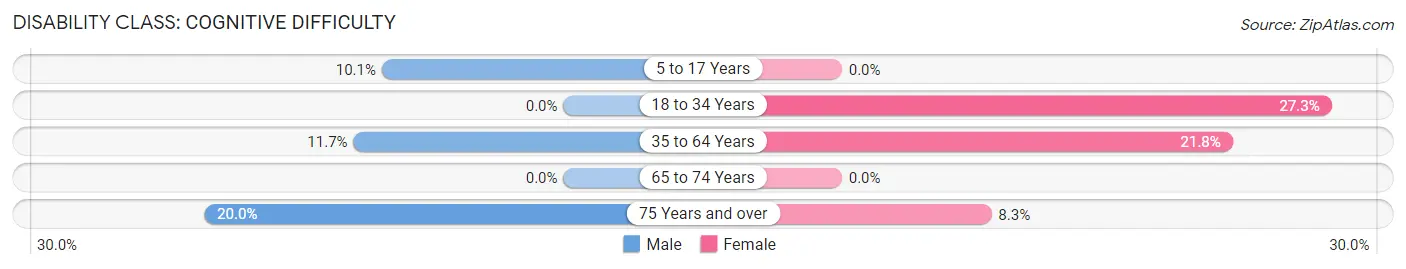
| Age Bracket | Male | Female |
| 5 to 17 Years | 9 (10.1%) | 0 (0.0%) |
| 18 to 34 Years | 0 (0.0%) | 15 (27.3%) |
| 35 to 64 Years | 29 (11.7%) | 47 (21.8%) |
| 65 to 74 Years | 0 (0.0%) | 0 (0.0%) |
| 75 Years and over | 24 (20.0%) | 8 (8.3%) |
Disability Class: Ambulatory Difficulty
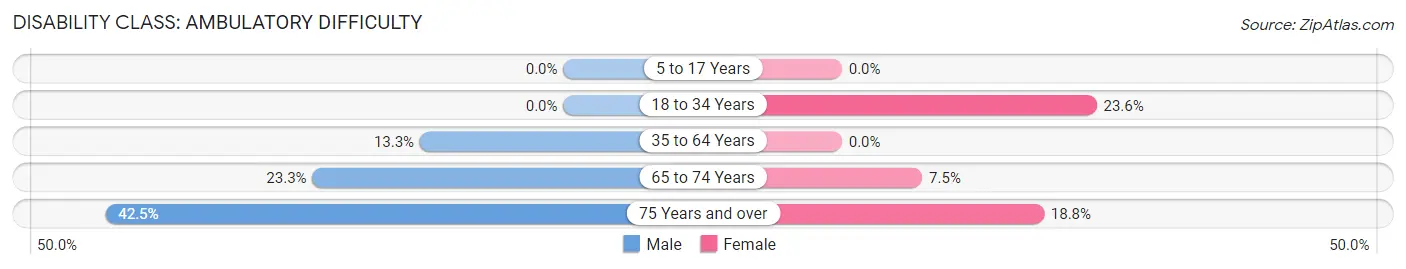
| Age Bracket | Male | Female |
| 5 to 17 Years | 0 (0.0%) | 0 (0.0%) |
| 18 to 34 Years | 0 (0.0%) | 13 (23.6%) |
| 35 to 64 Years | 33 (13.3%) | 0 (0.0%) |
| 65 to 74 Years | 34 (23.3%) | 15 (7.5%) |
| 75 Years and over | 51 (42.5%) | 18 (18.8%) |
Disability Class: Self-Care Difficulty
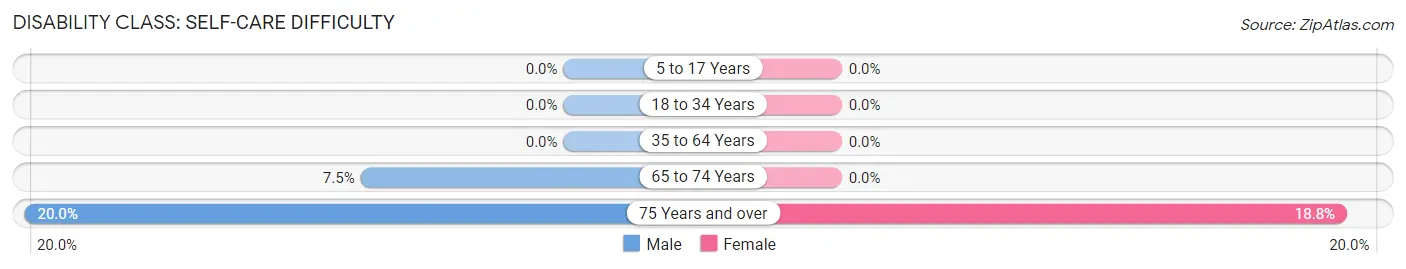
| Age Bracket | Male | Female |
| 5 to 17 Years | 0 (0.0%) | 0 (0.0%) |
| 18 to 34 Years | 0 (0.0%) | 0 (0.0%) |
| 35 to 64 Years | 0 (0.0%) | 0 (0.0%) |
| 65 to 74 Years | 11 (7.5%) | 0 (0.0%) |
| 75 Years and over | 24 (20.0%) | 18 (18.8%) |
Technology Access in New Hope
Computing Device Access in New Hope
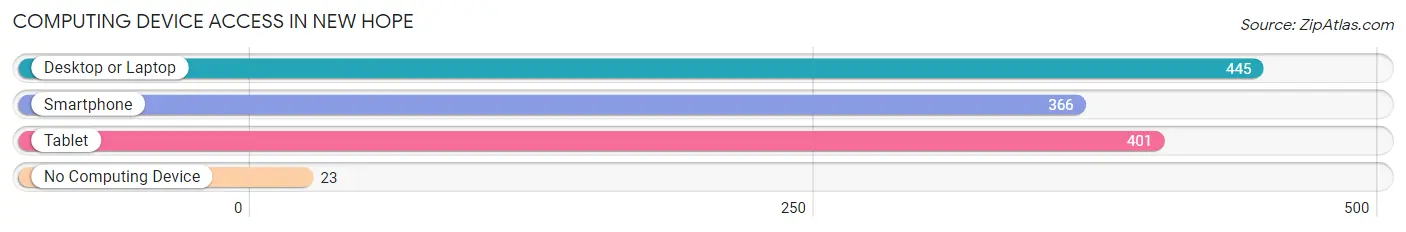
| Device Type | # Households | % Households |
| Desktop or Laptop | 445 | 83.7% |
| Smartphone | 366 | 68.8% |
| Tablet | 401 | 75.4% |
| No Computing Device | 23 | 4.3% |
| Total | 532 | 100.0% |
Internet Access in New Hope
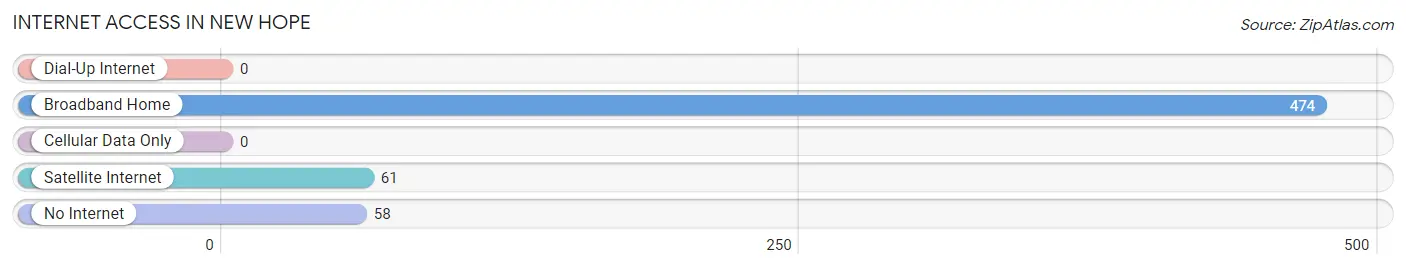
| Internet Type | # Households | % Households |
| Dial-Up Internet | 0 | 0.0% |
| Broadband Home | 474 | 89.1% |
| Cellular Data Only | 0 | 0.0% |
| Satellite Internet | 61 | 11.5% |
| No Internet | 58 | 10.9% |
| Total | 532 | 100.0% |
New Hope Summary
New Hope, Oregon is a small unincorporated community located in the foothills of the Cascade Mountains in Lane County, Oregon. The community is situated on the banks of the McKenzie River, approximately 25 miles east of Eugene. The population of New Hope was estimated to be around 200 people in 2020.
History
The area that is now New Hope was first settled in the late 1800s by homesteaders who were drawn to the area by its abundance of natural resources. The first post office in the area was established in 1891 and the community was officially named New Hope in 1895.
The town was originally a logging and farming community, but in the early 1900s, the area began to attract tourists who were drawn to the area’s natural beauty. The town was also home to a number of resorts and lodges, which helped to attract more visitors to the area.
In the 1950s, the town began to experience a decline in population as many of the residents moved away in search of better economic opportunities. However, in the late 1970s, the town began to experience a resurgence in population as people began to move back to the area in search of a more rural lifestyle.
Geography
New Hope is located in the foothills of the Cascade Mountains in Lane County, Oregon. The town is situated on the banks of the McKenzie River, approximately 25 miles east of Eugene. The town is surrounded by lush forests and is home to a number of recreational activities, including fishing, camping, and hiking.
The town is located at an elevation of 1,400 feet and has a total area of 0.3 square miles. The climate in New Hope is classified as a humid continental climate, with warm summers and cold winters.
Economy
The economy of New Hope is largely based on tourism and recreation. The town is home to a number of resorts and lodges, which attract visitors from all over the region. The town is also home to a number of small businesses, including restaurants, shops, and galleries.
In addition to tourism and recreation, the town is also home to a number of small farms and ranches. The town is also home to a number of logging and timber companies, which provide employment to many of the town’s residents.
Demographics
The population of New Hope was estimated to be around 200 people in 2020. The town is predominantly white, with approximately 95% of the population identifying as white. The town is also home to a small Hispanic population, with approximately 4% of the population identifying as Hispanic or Latino. The median household income in New Hope is approximately $45,000, which is slightly lower than the national average. The town also has a higher than average poverty rate, with approximately 15% of the population living below the poverty line.
Common Questions
What is the Total Population of New Hope?
Total Population of New Hope is 1,399.
What is the Total Male Population of New Hope?
Total Male Population of New Hope is 656.
What is the Total Female Population of New Hope?
Total Female Population of New Hope is 743.
What is the Ratio of Males per 100 Females in New Hope?
There are 88.29 Males per 100 Females in New Hope.
What is the Ratio of Females per 100 Males in New Hope?
There are 113.26 Females per 100 Males in New Hope.
What is the Median Population Age in New Hope?
Median Population Age in New Hope is 55.6 Years.
What is the Average Family Size in New Hope
Average Family Size in New Hope is 2.9 People.
What is the Average Household Size in New Hope
Average Household Size in New Hope is 2.6 People.
What is Per Capita Income in New Hope?
Per Capita income in New Hope is $31,257.
What is the Median Family Income in New Hope?
Median Family Income in New Hope is $68,375.
What is the Median Household income in New Hope?
Median Household Income in New Hope is $68,194.
What is Income or Wage Gap in New Hope?
Income or Wage Gap in New Hope is 57.8%.
Women in New Hope earn 42.2 cents for every dollar earned by a man.
What is Inequality or Gini Index in New Hope?
Inequality or Gini Index in New Hope is 0.40.
How Large is the Labor Force in New Hope?
There are 417 People in the Labor Forcein in New Hope.
What is the Percentage of People in the Labor Force in New Hope?
36.5% of People are in the Labor Force in New Hope.
What is the Unemployment Rate in New Hope?
Unemployment Rate in New Hope is 11.8%.