Cities with the Highest Percentage of Population with a Degree in Liberal Arts and History in New Hampshire
RELATED REPORTS & OPTIONS
Liberal Arts and History
New Hampshire
Compare Cities
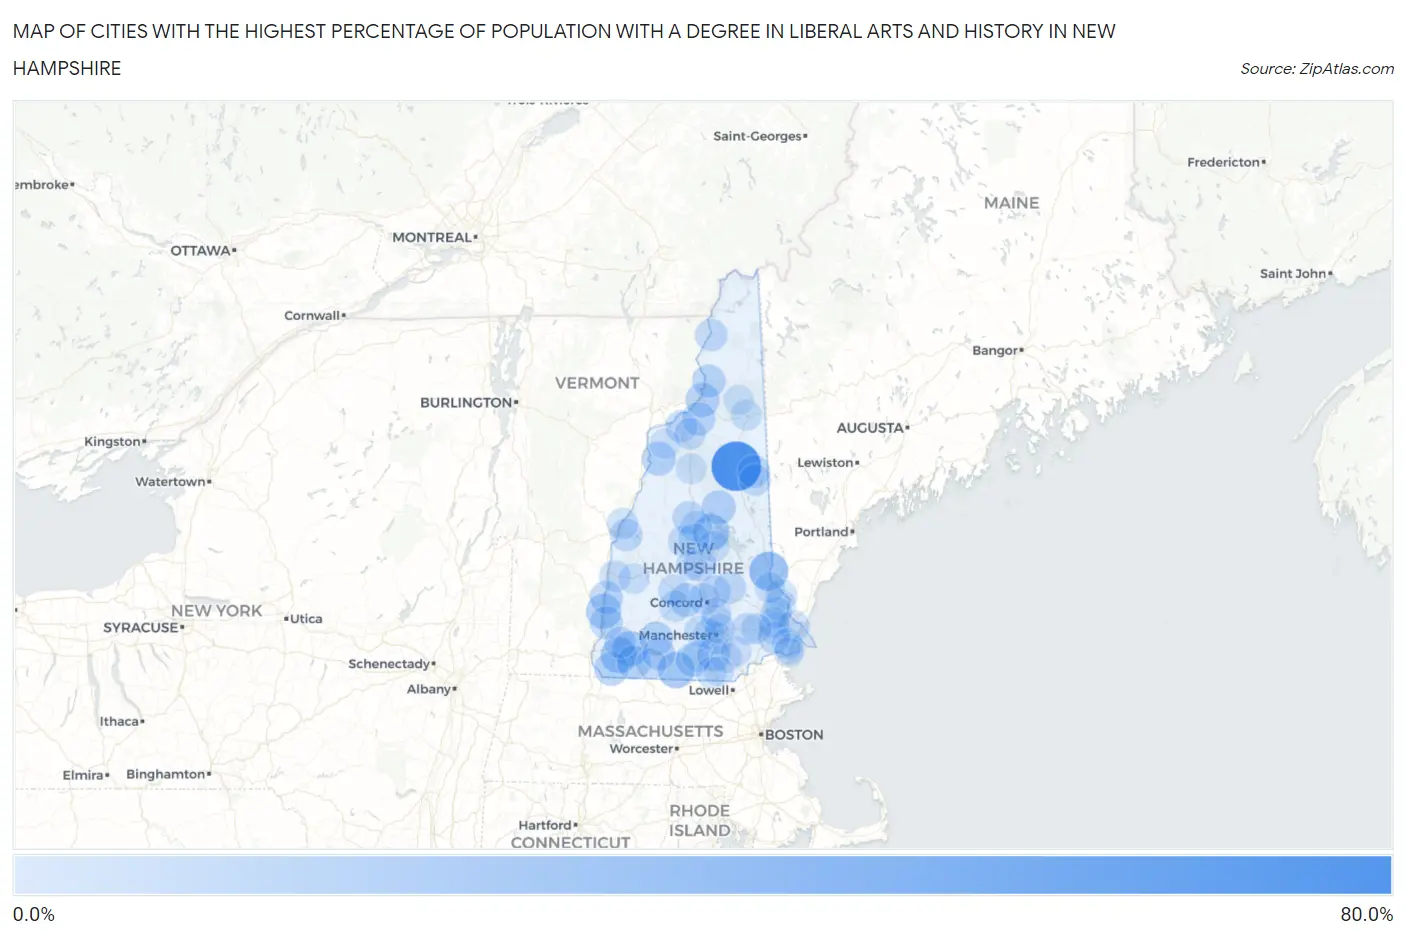
Map of Cities with the Highest Percentage of Population with a Degree in Liberal Arts and History in New Hampshire
0.0%
80.0%
Cities with the Highest Percentage of Population with a Degree in Liberal Arts and History in New Hampshire
| City | % Graduates | vs State | vs National | |
| 1. | Bartlett | 66.7% | 4.9%(+61.8)#1 | 4.9%(+61.8)#139 |
| 2. | New Boston | 37.2% | 4.9%(+32.3)#2 | 4.9%(+32.3)#424 |
| 3. | Milton | 30.0% | 4.9%(+25.1)#3 | 4.9%(+25.1)#654 |
| 4. | Greenville | 21.5% | 4.9%(+16.7)#4 | 4.9%(+16.7)#1,142 |
| 5. | West Swanzey | 20.3% | 4.9%(+15.4)#5 | 4.9%(+15.4)#1,251 |
| 6. | Meredith | 20.2% | 4.9%(+15.3)#6 | 4.9%(+15.3)#1,254 |
| 7. | Marlborough | 18.6% | 4.9%(+13.8)#7 | 4.9%(+13.7)#1,435 |
| 8. | North Walpole | 17.2% | 4.9%(+12.3)#8 | 4.9%(+12.3)#1,632 |
| 9. | Center Sandwich | 13.8% | 4.9%(+8.98)#9 | 4.9%(+8.97)#2,348 |
| 10. | Lancaster | 13.5% | 4.9%(+8.58)#10 | 4.9%(+8.58)#2,465 |
| 11. | Mountain Lakes | 13.0% | 4.9%(+8.18)#11 | 4.9%(+8.17)#2,596 |
| 12. | Winchester | 13.0% | 4.9%(+8.12)#12 | 4.9%(+8.11)#2,616 |
| 13. | Hancock | 12.8% | 4.9%(+7.91)#13 | 4.9%(+7.91)#2,676 |
| 14. | Troy | 12.6% | 4.9%(+7.70)#14 | 4.9%(+7.70)#2,735 |
| 15. | Contoocook | 12.1% | 4.9%(+7.28)#15 | 4.9%(+7.27)#2,910 |
| 16. | Milford | 11.2% | 4.9%(+6.35)#16 | 4.9%(+6.34)#3,302 |
| 17. | Whitefield | 11.0% | 4.9%(+6.17)#17 | 4.9%(+6.17)#3,406 |
| 18. | Groveton | 10.9% | 4.9%(+6.00)#18 | 4.9%(+6.00)#3,494 |
| 19. | Charlestown | 10.6% | 4.9%(+5.76)#19 | 4.9%(+5.75)#3,618 |
| 20. | Walpole | 10.1% | 4.9%(+5.22)#20 | 4.9%(+5.22)#3,924 |
| 21. | East Merrimack | 9.7% | 4.9%(+4.79)#21 | 4.9%(+4.79)#4,210 |
| 22. | Tilton Northfield | 9.6% | 4.9%(+4.72)#22 | 4.9%(+4.71)#4,266 |
| 23. | Peterborough | 9.4% | 4.9%(+4.53)#23 | 4.9%(+4.53)#4,401 |
| 24. | Plymouth | 8.8% | 4.9%(+3.95)#24 | 4.9%(+3.94)#4,870 |
| 25. | North Conway | 8.4% | 4.9%(+3.51)#25 | 4.9%(+3.50)#5,241 |
| 26. | Colebrook | 8.2% | 4.9%(+3.34)#26 | 4.9%(+3.34)#5,448 |
| 27. | Lebanon | 8.0% | 4.9%(+3.17)#27 | 4.9%(+3.17)#5,618 |
| 28. | Pittsfield | 7.4% | 4.9%(+2.54)#28 | 4.9%(+2.54)#6,313 |
| 29. | Littleton | 7.3% | 4.9%(+2.48)#29 | 4.9%(+2.47)#6,401 |
| 30. | Loudon | 7.1% | 4.9%(+2.25)#30 | 4.9%(+2.24)#6,720 |
| 31. | Newfields | 6.6% | 4.9%(+1.75)#31 | 4.9%(+1.75)#7,432 |
| 32. | Conway | 6.6% | 4.9%(+1.70)#32 | 4.9%(+1.70)#7,494 |
| 33. | Raymond | 6.5% | 4.9%(+1.62)#33 | 4.9%(+1.62)#7,595 |
| 34. | Portsmouth | 6.4% | 4.9%(+1.56)#34 | 4.9%(+1.55)#7,708 |
| 35. | Concord | 6.3% | 4.9%(+1.48)#35 | 4.9%(+1.47)#7,822 |
| 36. | Bristol | 6.0% | 4.9%(+1.15)#36 | 4.9%(+1.14)#8,368 |
| 37. | Manchester | 6.0% | 4.9%(+1.13)#37 | 4.9%(+1.12)#8,407 |
| 38. | Klondike Corner | 5.8% | 4.9%(+0.982)#38 | 4.9%(+0.977)#8,687 |
| 39. | Bethlehem | 5.8% | 4.9%(+0.906)#39 | 4.9%(+0.902)#8,826 |
| 40. | Exeter | 5.7% | 4.9%(+0.846)#40 | 4.9%(+0.842)#8,928 |
| 41. | Claremont | 5.6% | 4.9%(+0.733)#41 | 4.9%(+0.728)#9,151 |
| 42. | Keene | 5.6% | 4.9%(+0.707)#42 | 4.9%(+0.702)#9,200 |
| 43. | Ashland | 5.4% | 4.9%(+0.551)#43 | 4.9%(+0.547)#9,521 |
| 44. | Laconia | 5.1% | 4.9%(+0.266)#44 | 4.9%(+0.262)#10,112 |
| 45. | Hanover | 5.0% | 4.9%(+0.129)#45 | 4.9%(+0.125)#10,422 |
| 46. | Henniker | 5.0% | 4.9%(+0.106)#46 | 4.9%(+0.102)#10,467 |
| 47. | Goffstown | 5.0% | 4.9%(+0.084)#47 | 4.9%(+0.080)#10,512 |
| 48. | Dover | 4.7% | 4.9%(-0.149)#48 | 4.9%(-0.153)#11,078 |
| 49. | Somersworth | 4.7% | 4.9%(-0.194)#49 | 4.9%(-0.199)#11,181 |
| 50. | Durham | 4.5% | 4.9%(-0.383)#50 | 4.9%(-0.388)#11,583 |
| 51. | Newmarket | 4.4% | 4.9%(-0.431)#51 | 4.9%(-0.436)#11,702 |
| 52. | Pinardville | 4.0% | 4.9%(-0.883)#52 | 4.9%(-0.887)#12,763 |
| 53. | Warner | 3.9% | 4.9%(-0.920)#53 | 4.9%(-0.925)#12,850 |
| 54. | Hampton | 3.9% | 4.9%(-0.946)#54 | 4.9%(-0.950)#12,889 |
| 55. | Amherst | 3.9% | 4.9%(-0.982)#55 | 4.9%(-0.986)#13,005 |
| 56. | Nashua | 3.7% | 4.9%(-1.19)#56 | 4.9%(-1.20)#13,527 |
| 57. | New Hampton | 3.6% | 4.9%(-1.24)#57 | 4.9%(-1.25)#13,666 |
| 58. | Gorham | 3.5% | 4.9%(-1.36)#58 | 4.9%(-1.36)#13,941 |
| 59. | Londonderry | 3.1% | 4.9%(-1.74)#59 | 4.9%(-1.75)#14,861 |
| 60. | Lincoln | 3.0% | 4.9%(-1.87)#60 | 4.9%(-1.88)#15,178 |
| 61. | Rochester | 2.6% | 4.9%(-2.23)#61 | 4.9%(-2.23)#15,940 |
| 62. | Epping | 2.6% | 4.9%(-2.32)#62 | 4.9%(-2.32)#16,128 |
| 63. | Newport | 2.5% | 4.9%(-2.36)#63 | 4.9%(-2.36)#16,214 |
| 64. | Jaffrey | 2.4% | 4.9%(-2.42)#64 | 4.9%(-2.43)#16,331 |
| 65. | Franklin | 2.3% | 4.9%(-2.54)#65 | 4.9%(-2.54)#16,592 |
| 66. | Lisbon | 2.1% | 4.9%(-2.81)#66 | 4.9%(-2.82)#17,130 |
| 67. | Derry | 2.0% | 4.9%(-2.87)#67 | 4.9%(-2.88)#17,229 |
| 68. | Hooksett | 2.0% | 4.9%(-2.90)#68 | 4.9%(-2.90)#17,264 |
| 69. | Suncook | 1.2% | 4.9%(-3.70)#69 | 4.9%(-3.70)#18,495 |
| 70. | Hudson | 1.1% | 4.9%(-3.79)#70 | 4.9%(-3.79)#18,593 |
| 71. | Berlin | 1.0% | 4.9%(-3.85)#71 | 4.9%(-3.86)#18,669 |
| 72. | Hampton Beach | 0.79% | 4.9%(-4.08)#72 | 4.9%(-4.09)#18,881 |
| 73. | South Hooksett | 0.62% | 4.9%(-4.24)#73 | 4.9%(-4.25)#18,977 |
| 74. | Seabrook Beach | 0.58% | 4.9%(-4.28)#74 | 4.9%(-4.29)#19,002 |
1
Common Questions
What are the Top 10 Cities with the Highest Percentage of Population with a Degree in Liberal Arts and History in New Hampshire?
Top 10 Cities with the Highest Percentage of Population with a Degree in Liberal Arts and History in New Hampshire are:
#1
66.7%
#2
30.0%
#3
21.5%
#4
20.3%
#5
20.2%
#6
18.6%
#7
17.2%
#8
13.8%
#9
13.5%
#10
13.0%
What city has the Highest Percentage of Population with a Degree in Liberal Arts and History in New Hampshire?
Bartlett has the Highest Percentage of Population with a Degree in Liberal Arts and History in New Hampshire with 66.7%.
What is the Percentage of Population with a Degree in Liberal Arts and History in the State of New Hampshire?
Percentage of Population with a Degree in Liberal Arts and History in New Hampshire is 4.9%.
What is the Percentage of Population with a Degree in Liberal Arts and History in the United States?
Percentage of Population with a Degree in Liberal Arts and History in the United States is 4.9%.