Wheeler, OR
Wheeler Map
Wheeler Overview
429
TOTAL POPULATION
174
MALE POPULATION
255
FEMALE POPULATION
68.24
MALES / 100 FEMALES
146.55
FEMALES / 100 MALES
49.5
MEDIAN AGE
2.5
AVG FAMILY SIZE
1.7
AVG HOUSEHOLD SIZE
$29,846
PER CAPITA INCOME
$86,250
AVG FAMILY INCOME
$53,750
AVG HOUSEHOLD INCOME
55.1%
WAGE / INCOME GAP [ % ]
44.9¢/ $1
WAGE / INCOME GAP [ $ ]
0.37
INEQUALITY / GINI INDEX
169
LABOR FORCE [ PEOPLE ]
44.4%
PERCENT IN LABOR FORCE
7.1%
UNEMPLOYMENT RATE
Wheeler Zip Codes
Wheeler Area Codes
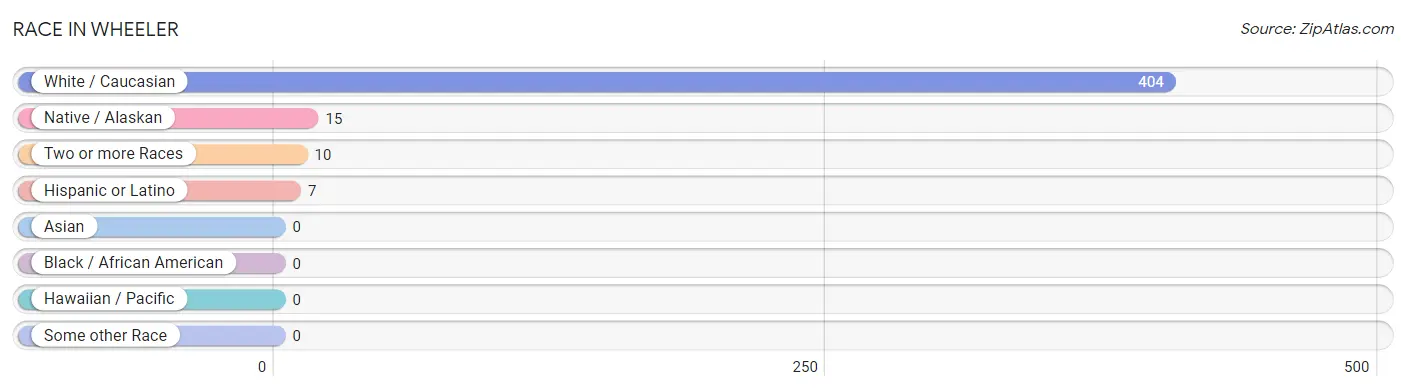
Race in Wheeler
The most populous races in Wheeler are White / Caucasian (404 | 94.2%), Native / Alaskan (15 | 3.5%), and Two or more Races (10 | 2.3%).
| Race | # Population | % Population |
| Asian | 0 | 0.0% |
| Black / African American | 0 | 0.0% |
| Hawaiian / Pacific | 0 | 0.0% |
| Hispanic or Latino | 7 | 1.6% |
| Native / Alaskan | 15 | 3.5% |
| White / Caucasian | 404 | 94.2% |
| Two or more Races | 10 | 2.3% |
| Some other Race | 0 | 0.0% |
| Total | 429 | 100.0% |
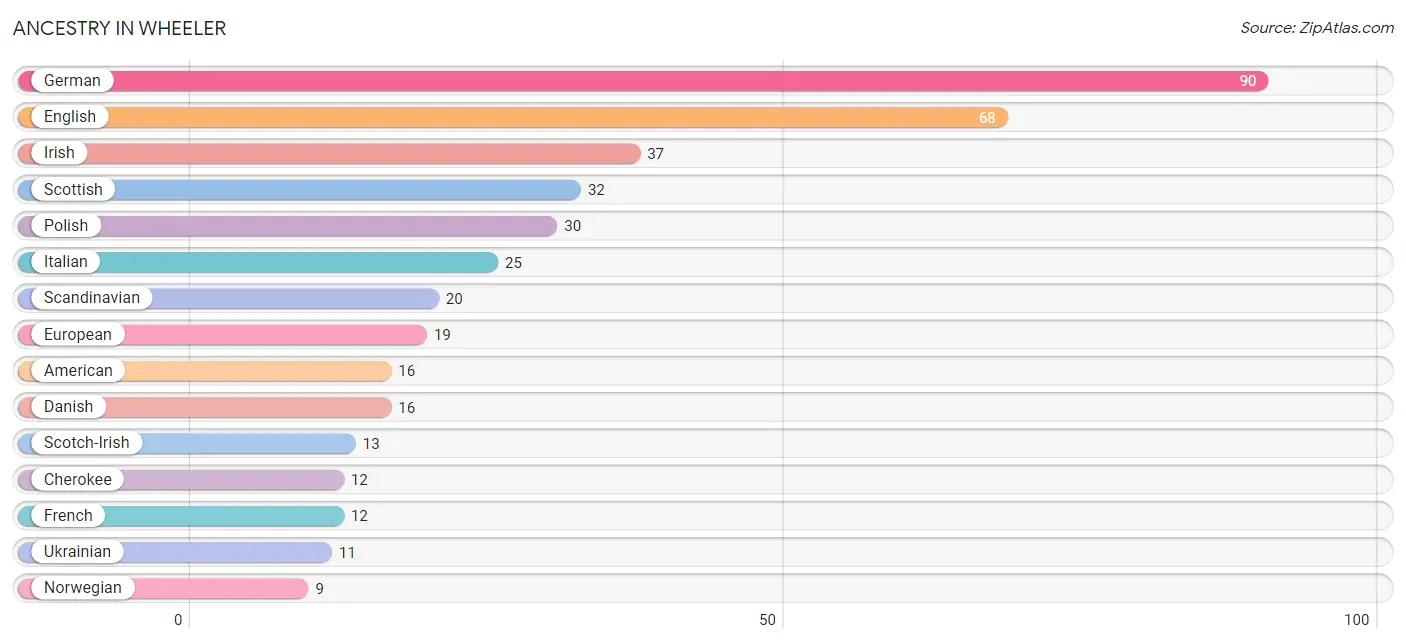
Ancestry in Wheeler
The most populous ancestries reported in Wheeler are German (90 | 21.0%), English (68 | 15.9%), Irish (37 | 8.6%), Scottish (32 | 7.5%), and Polish (30 | 7.0%), together accounting for 59.9% of all Wheeler residents.
| Ancestry | # Population | % Population |
| American | 16 | 3.7% |
| Arab | 4 | 0.9% |
| Cherokee | 12 | 2.8% |
| Danish | 16 | 3.7% |
| Dutch | 5 | 1.2% |
| Eastern European | 4 | 0.9% |
| English | 68 | 15.9% |
| European | 19 | 4.4% |
| French | 12 | 2.8% |
| German | 90 | 21.0% |
| Irish | 37 | 8.6% |
| Italian | 25 | 5.8% |
| Mexican | 7 | 1.6% |
| Northern European | 6 | 1.4% |
| Norwegian | 9 | 2.1% |
| Polish | 30 | 7.0% |
| Romanian | 9 | 2.1% |
| Scandinavian | 20 | 4.7% |
| Scotch-Irish | 13 | 3.0% |
| Scottish | 32 | 7.5% |
| Slovak | 4 | 0.9% |
| Swedish | 6 | 1.4% |
| Ukrainian | 11 | 2.6% | View All 23 Rows |
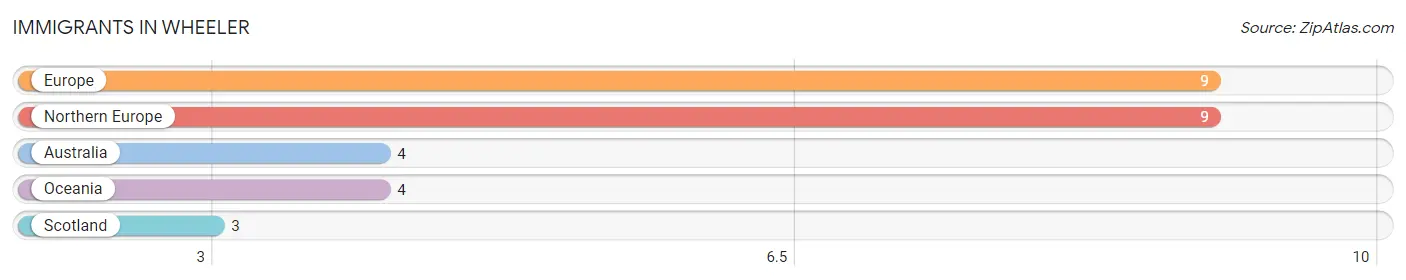
Immigrants in Wheeler
The most numerous immigrant groups reported in Wheeler came from Europe (9 | 2.1%), Northern Europe (9 | 2.1%), Australia (4 | 0.9%), Oceania (4 | 0.9%), and Scotland (3 | 0.7%), together accounting for 6.8% of all Wheeler residents.
| Immigration Origin | # Population | % Population |
| Australia | 4 | 0.9% |
| Europe | 9 | 2.1% |
| Northern Europe | 9 | 2.1% |
| Oceania | 4 | 0.9% |
| Scotland | 3 | 0.7% | View All 5 Rows |
Sex and Age in Wheeler
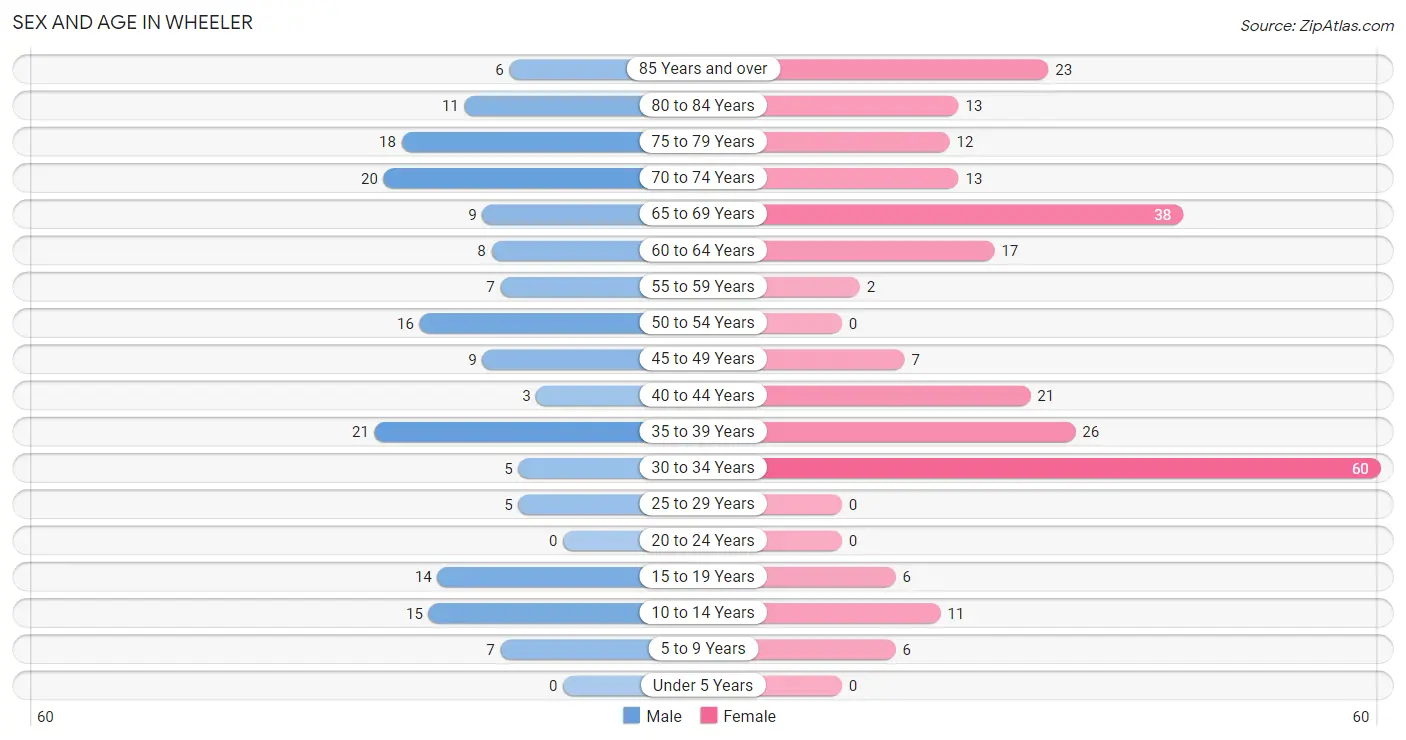
Sex and Age in Wheeler
The most populous age groups in Wheeler are 35 to 39 Years (21 | 12.1%) for men and 30 to 34 Years (60 | 23.5%) for women.
| Age Bracket | Male | Female |
| Under 5 Years | 0 (0.0%) | 0 (0.0%) |
| 5 to 9 Years | 7 (4.0%) | 6 (2.4%) |
| 10 to 14 Years | 15 (8.6%) | 11 (4.3%) |
| 15 to 19 Years | 14 (8.1%) | 6 (2.4%) |
| 20 to 24 Years | 0 (0.0%) | 0 (0.0%) |
| 25 to 29 Years | 5 (2.9%) | 0 (0.0%) |
| 30 to 34 Years | 5 (2.9%) | 60 (23.5%) |
| 35 to 39 Years | 21 (12.1%) | 26 (10.2%) |
| 40 to 44 Years | 3 (1.7%) | 21 (8.2%) |
| 45 to 49 Years | 9 (5.2%) | 7 (2.8%) |
| 50 to 54 Years | 16 (9.2%) | 0 (0.0%) |
| 55 to 59 Years | 7 (4.0%) | 2 (0.8%) |
| 60 to 64 Years | 8 (4.6%) | 17 (6.7%) |
| 65 to 69 Years | 9 (5.2%) | 38 (14.9%) |
| 70 to 74 Years | 20 (11.5%) | 13 (5.1%) |
| 75 to 79 Years | 18 (10.3%) | 12 (4.7%) |
| 80 to 84 Years | 11 (6.3%) | 13 (5.1%) |
| 85 Years and over | 6 (3.5%) | 23 (9.0%) |
| Total | 174 (100.0%) | 255 (100.0%) |
Families and Households in Wheeler
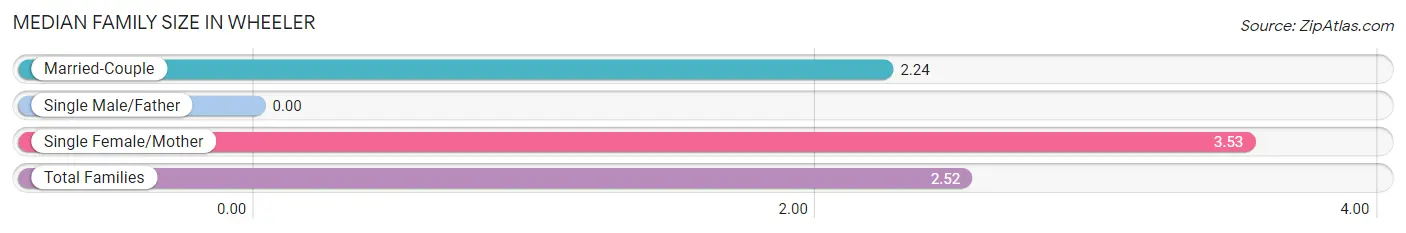
Median Family Size in Wheeler
| Family Type | # Families | Family Size |
| Married-Couple | 67 (77.9%) | 2.24 |
| Single Male/Father | 0 (0.0%) | - |
| Single Female/Mother | 19 (22.1%) | 3.53 |
| Total Families | 86 (100.0%) | 2.52 |
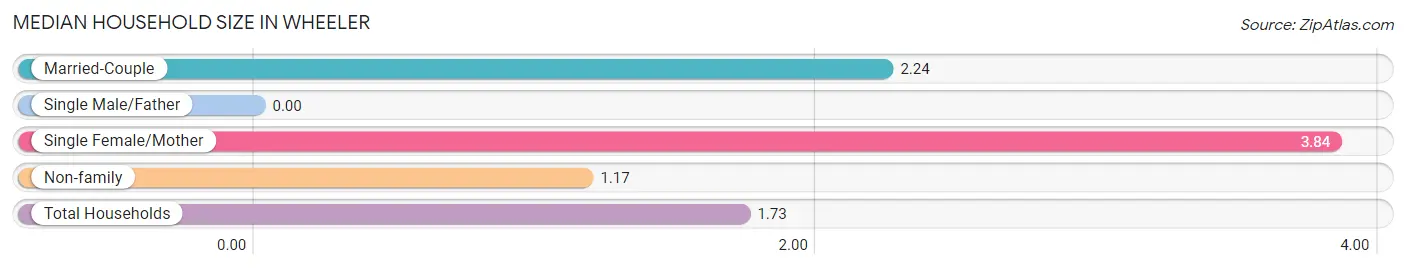
Median Household Size in Wheeler
| Household Type | # Households | Household Size |
| Married-Couple | 67 (30.6%) | 2.24 |
| Single Male/Father | 0 (0.0%) | - |
| Single Female/Mother | 19 (8.7%) | 3.84 |
| Non-family | 133 (60.7%) | 1.17 |
| Total Households | 219 (100.0%) | 1.73 |
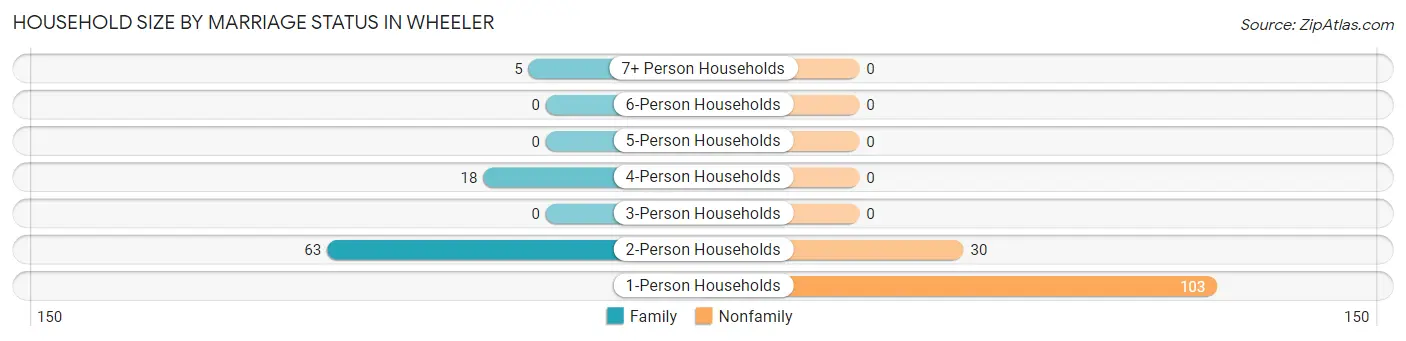
Household Size by Marriage Status in Wheeler
Out of a total of 219 households in Wheeler, 86 (39.3%) are family households, while 133 (60.7%) are nonfamily households. The most numerous type of family households are 2-person households, comprising 63, and the most common type of nonfamily households are 1-person households, comprising 103.
| Household Size | Family Households | Nonfamily Households |
| 1-Person Households | - | 103 (47.0%) |
| 2-Person Households | 63 (28.8%) | 30 (13.7%) |
| 3-Person Households | 0 (0.0%) | 0 (0.0%) |
| 4-Person Households | 18 (8.2%) | 0 (0.0%) |
| 5-Person Households | 0 (0.0%) | 0 (0.0%) |
| 6-Person Households | 0 (0.0%) | 0 (0.0%) |
| 7+ Person Households | 5 (2.3%) | 0 (0.0%) |
| Total | 86 (39.3%) | 133 (60.7%) |
Female Fertility in Wheeler
Fertility by Age in Wheeler
| Age Bracket | Women with Births | Births / 1,000 Women |
| 15 to 19 years | 0 (0.0%) | 0.0 |
| 20 to 34 years | 0 (0.0%) | 0.0 |
| 35 to 50 years | 0 (0.0%) | 0.0 |
| Total | 0 (0.0%) | 0.0 |
Fertility by Age by Marriage Status in Wheeler
| Age Bracket | Married | Unmarried |
| 15 to 19 years | 0 (0.0%) | 0 (0.0%) |
| 20 to 34 years | 0 (0.0%) | 0 (0.0%) |
| 35 to 50 years | 0 (0.0%) | 0 (0.0%) |
| Total | 0 (0.0%) | 0 (0.0%) |
Fertility by Education in Wheeler
| Educational Attainment | Women with Births | Births / 1,000 Women |
| Less than High School | 0 (0.0%) | 0.0 |
| High School Diploma | 0 (0.0%) | 0.0 |
| College or Associate's Degree | 0 (0.0%) | 0.0 |
| Bachelor's Degree | 0 (0.0%) | 0.0 |
| Graduate Degree | 0 (0.0%) | 0.0 |
| Total | 0 (0.0%) | 0.0 |
Fertility by Education by Marriage Status in Wheeler
| Educational Attainment | Married | Unmarried |
| Less than High School | 0 (0.0%) | 0 (0.0%) |
| High School Diploma | 0 (0.0%) | 0 (0.0%) |
| College or Associate's Degree | 0 (0.0%) | 0 (0.0%) |
| Bachelor's Degree | 0 (0.0%) | 0 (0.0%) |
| Graduate Degree | 0 (0.0%) | 0 (0.0%) |
| Total | 0 (0.0%) | 0 (0.0%) |
Income in Wheeler
Income Overview in Wheeler
Per Capita Income in Wheeler is $29,846, while median incomes of families and households are $86,250 and $53,750 respectively.
| Characteristic | Number | Measure |
| Per Capita Income | 429 | $29,846 |
| Median Family Income | 86 | $86,250 |
| Mean Family Income | 86 | $73,171 |
| Median Household Income | 219 | $53,750 |
| Mean Household Income | 219 | $53,952 |
| Income Deficit | 86 | $0 |
| Wage / Income Gap (%) | 429 | 55.07% |
| Wage / Income Gap ($) | 429 | 44.93¢ per $1 |
| Gini / Inequality Index | 429 | 0.37 |
Earnings by Sex in Wheeler
Average Earnings in Wheeler are $25,893, $37,361 for men and $16,786 for women, a difference of 55.1%.
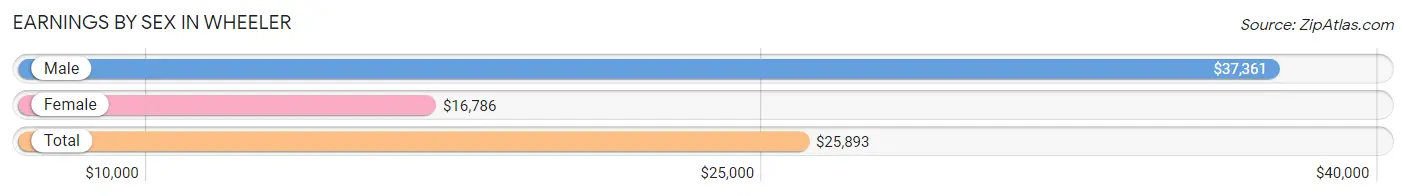
| Sex | Number | Average Earnings |
| Male | 65 (32.3%) | $37,361 |
| Female | 136 (67.7%) | $16,786 |
| Total | 201 (100.0%) | $25,893 |
Earnings by Sex by Income Bracket in Wheeler
The most common earnings brackets in Wheeler are $25,000 to $29,999 for men (18 | 27.7%) and $12,500 to $14,999 for women (25 | 18.4%).
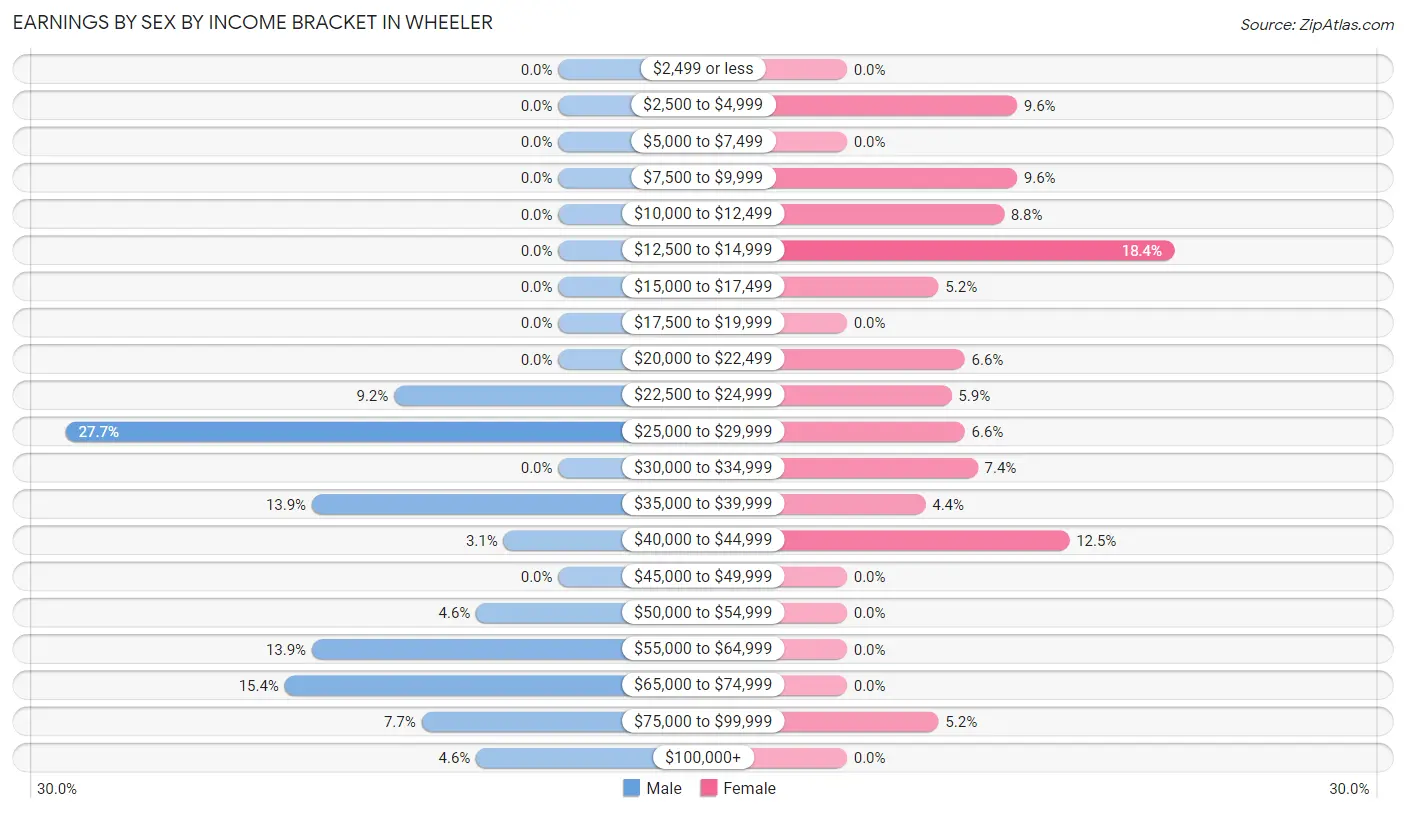
| Income | Male | Female |
| $2,499 or less | 0 (0.0%) | 0 (0.0%) |
| $2,500 to $4,999 | 0 (0.0%) | 13 (9.6%) |
| $5,000 to $7,499 | 0 (0.0%) | 0 (0.0%) |
| $7,500 to $9,999 | 0 (0.0%) | 13 (9.6%) |
| $10,000 to $12,499 | 0 (0.0%) | 12 (8.8%) |
| $12,500 to $14,999 | 0 (0.0%) | 25 (18.4%) |
| $15,000 to $17,499 | 0 (0.0%) | 7 (5.1%) |
| $17,500 to $19,999 | 0 (0.0%) | 0 (0.0%) |
| $20,000 to $22,499 | 0 (0.0%) | 9 (6.6%) |
| $22,500 to $24,999 | 6 (9.2%) | 8 (5.9%) |
| $25,000 to $29,999 | 18 (27.7%) | 9 (6.6%) |
| $30,000 to $34,999 | 0 (0.0%) | 10 (7.3%) |
| $35,000 to $39,999 | 9 (13.9%) | 6 (4.4%) |
| $40,000 to $44,999 | 2 (3.1%) | 17 (12.5%) |
| $45,000 to $49,999 | 0 (0.0%) | 0 (0.0%) |
| $50,000 to $54,999 | 3 (4.6%) | 0 (0.0%) |
| $55,000 to $64,999 | 9 (13.9%) | 0 (0.0%) |
| $65,000 to $74,999 | 10 (15.4%) | 0 (0.0%) |
| $75,000 to $99,999 | 5 (7.7%) | 7 (5.1%) |
| $100,000+ | 3 (4.6%) | 0 (0.0%) |
| Total | 65 (100.0%) | 136 (100.0%) |
Earnings by Sex by Educational Attainment in Wheeler
Average earnings in Wheeler are $37,361 for men and $16,786 for women, a difference of 55.1%. Men with an educational attainment of graduate degree enjoy the highest average annual earnings of $57,361, while those with bachelor's degree education earn the least with $28,958. Women with an educational attainment of bachelor's degree earn the most with the average annual earnings of $24,375, while those with college or associate's degree education have the smallest earnings of $12,880.
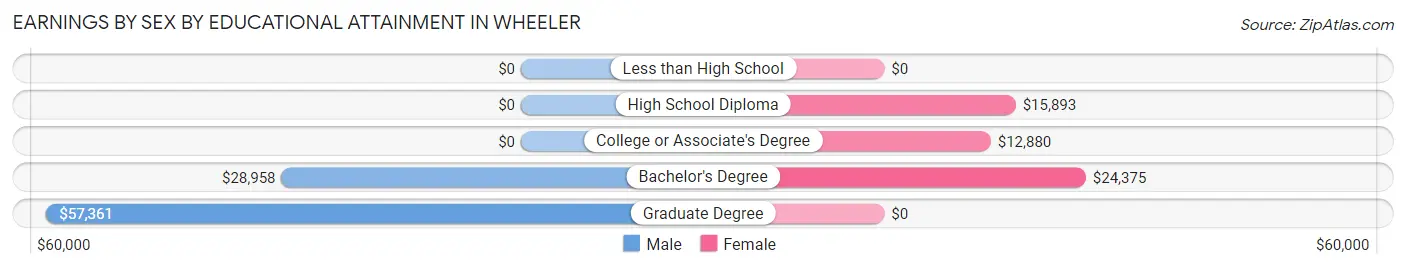
| Educational Attainment | Male Income | Female Income |
| Less than High School | - | - |
| High School Diploma | - | - |
| College or Associate's Degree | - | - |
| Bachelor's Degree | $28,958 | $24,375 |
| Graduate Degree | $57,361 | $0 |
| Total | $37,361 | $16,786 |
Family Income in Wheeler
Family Income Brackets in Wheeler
According to the Wheeler family income data, there are 36 families falling into the $75,000 to $99,999 income range, which is the most common income bracket and makes up 41.9% of all families.
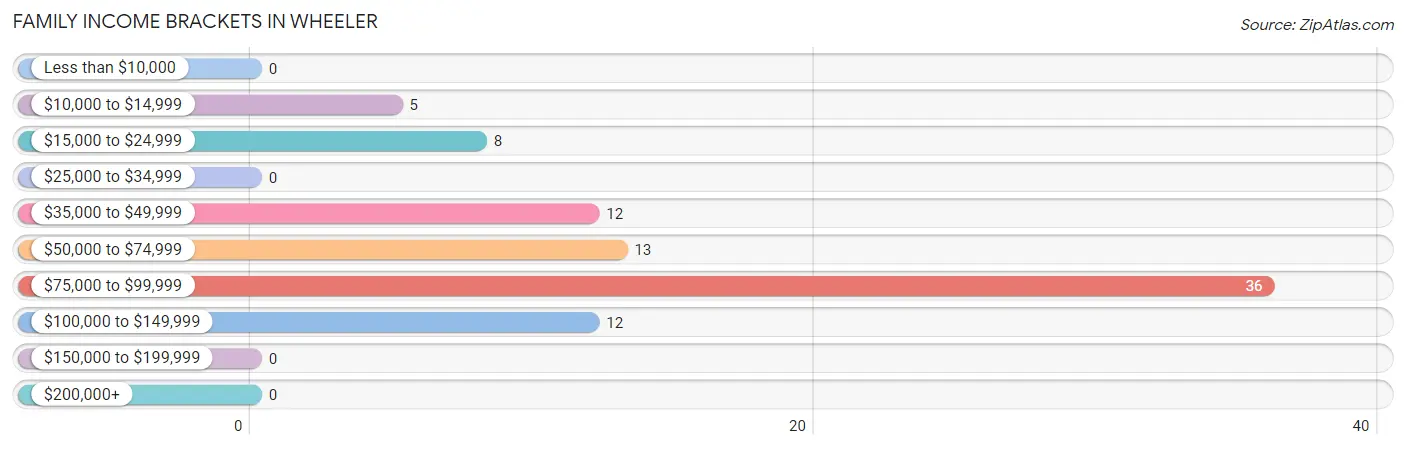
| Income Bracket | # Families | % Families |
| Less than $10,000 | 0 | 0.0% |
| $10,000 to $14,999 | 5 | 5.8% |
| $15,000 to $24,999 | 8 | 9.3% |
| $25,000 to $34,999 | 0 | 0.0% |
| $35,000 to $49,999 | 12 | 14.0% |
| $50,000 to $74,999 | 13 | 15.1% |
| $75,000 to $99,999 | 36 | 41.9% |
| $100,000 to $149,999 | 12 | 14.0% |
| $150,000 to $199,999 | 0 | 0.0% |
| $200,000+ | 0 | 0.0% |
Family Income by Famaliy Size in Wheeler
2-person families (63 | 73.3%) account for the highest median family income in Wheeler with $94,306 per family, while 2-person families (63 | 73.3%) have the highest median income of $47,153 per family member.
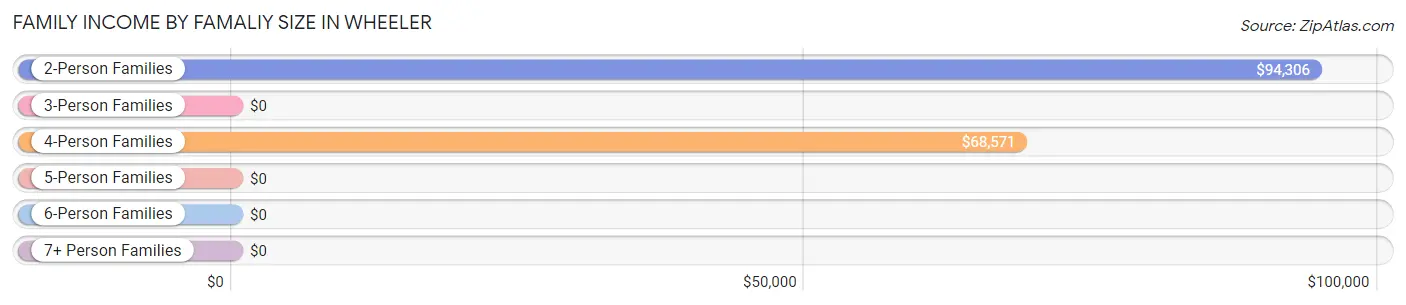
| Income Bracket | # Families | Median Income |
| 2-Person Families | 63 (73.3%) | $94,306 |
| 3-Person Families | 0 (0.0%) | $0 |
| 4-Person Families | 18 (20.9%) | $68,571 |
| 5-Person Families | 0 (0.0%) | $0 |
| 6-Person Families | 5 (5.8%) | $0 |
| 7+ Person Families | 0 (0.0%) | $0 |
| Total | 86 (100.0%) | $86,250 |
Family Income by Number of Earners in Wheeler
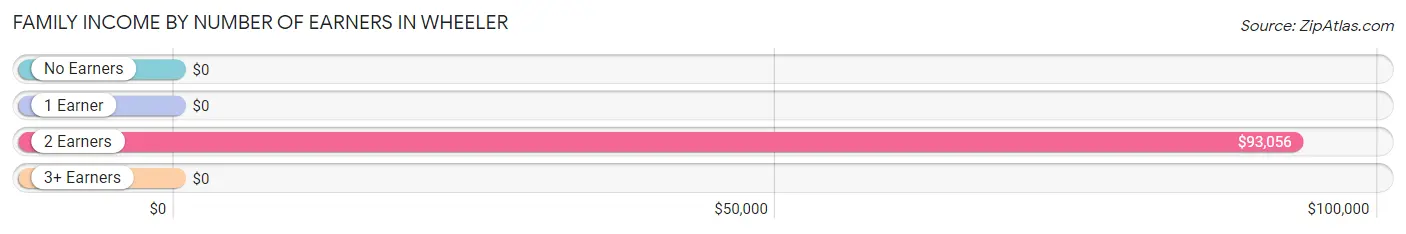
| Number of Earners | # Families | Median Income |
| No Earners | 15 (17.4%) | $0 |
| 1 Earner | 43 (50.0%) | $0 |
| 2 Earners | 28 (32.6%) | $93,056 |
| 3+ Earners | 0 (0.0%) | $0 |
| Total | 86 (100.0%) | $86,250 |
Household Income in Wheeler
Household Income Brackets in Wheeler
With 55 households falling in the category, the $50,000 to $74,999 income range is the most frequent in Wheeler, accounting for 25.1% of all households.
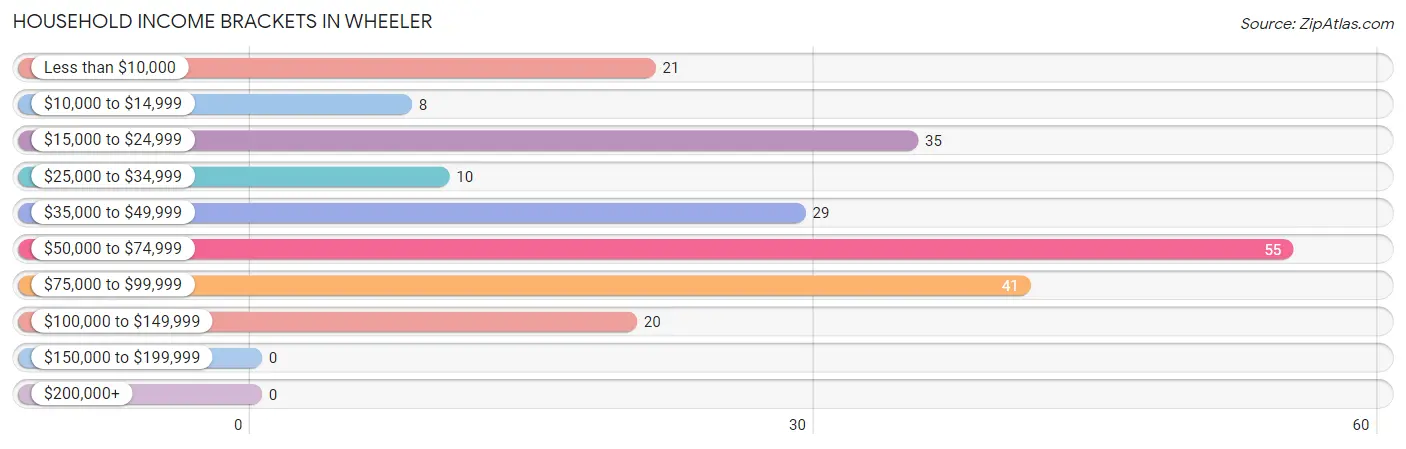
| Income Bracket | # Households | % Households |
| Less than $10,000 | 21 | 9.6% |
| $10,000 to $14,999 | 8 | 3.7% |
| $15,000 to $24,999 | 35 | 16.0% |
| $25,000 to $34,999 | 10 | 4.6% |
| $35,000 to $49,999 | 29 | 13.2% |
| $50,000 to $74,999 | 55 | 25.1% |
| $75,000 to $99,999 | 41 | 18.7% |
| $100,000 to $149,999 | 20 | 9.1% |
| $150,000 to $199,999 | 0 | 0.0% |
| $200,000+ | 0 | 0.0% |
Household Income by Householder Age in Wheeler
The median household income in Wheeler is $53,750, with the highest median household income of $90,250 found in the 45 to 64 years age bracket for the primary householder. A total of 35 households (16.0%) fall into this category.
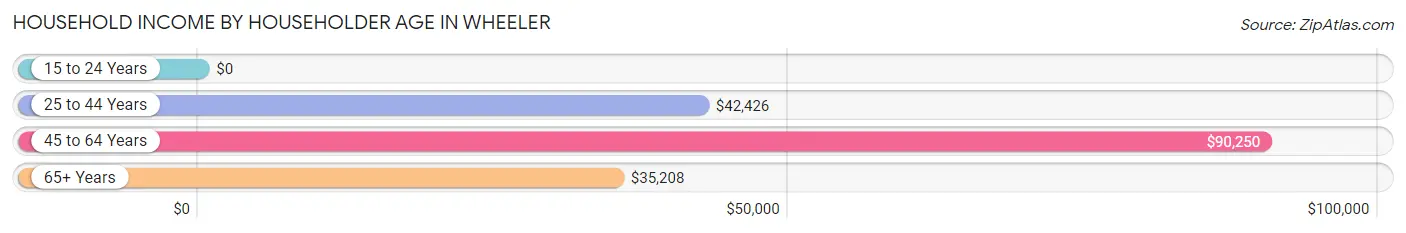
| Income Bracket | # Households | Median Income |
| 15 to 24 Years | 0 (0.0%) | $0 |
| 25 to 44 Years | 103 (47.0%) | $42,426 |
| 45 to 64 Years | 35 (16.0%) | $90,250 |
| 65+ Years | 81 (37.0%) | $35,208 |
| Total | 219 (100.0%) | $53,750 |
Poverty in Wheeler
Income Below Poverty by Sex and Age in Wheeler
With 15.3% poverty level for males and 20.3% for females among the residents of Wheeler, 12 to 14 year old males and 6 to 11 year old females are the most vulnerable to poverty, with 10 males (100.0%) and 5 females (45.5%) in their respective age groups living below the poverty level.
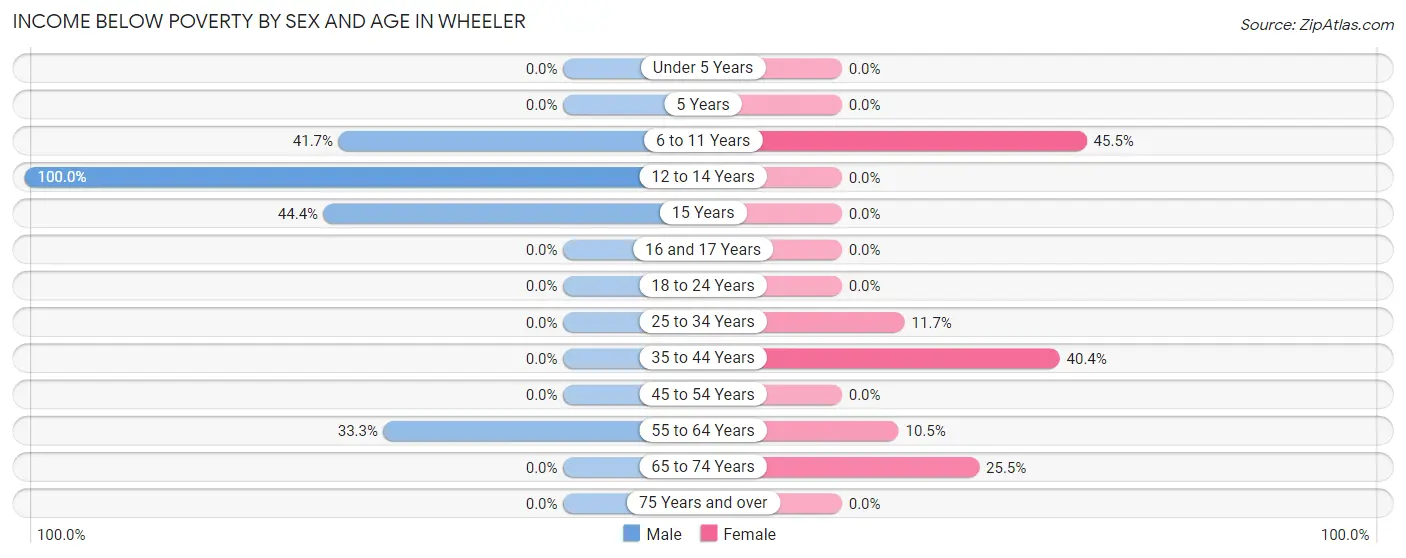
| Age Bracket | Male | Female |
| Under 5 Years | 0 (0.0%) | 0 (0.0%) |
| 5 Years | 0 (0.0%) | 0 (0.0%) |
| 6 to 11 Years | 5 (41.7%) | 5 (45.5%) |
| 12 to 14 Years | 10 (100.0%) | 0 (0.0%) |
| 15 Years | 4 (44.4%) | 0 (0.0%) |
| 16 and 17 Years | 0 (0.0%) | 0 (0.0%) |
| 18 to 24 Years | 0 (0.0%) | 0 (0.0%) |
| 25 to 34 Years | 0 (0.0%) | 7 (11.7%) |
| 35 to 44 Years | 0 (0.0%) | 19 (40.4%) |
| 45 to 54 Years | 0 (0.0%) | 0 (0.0%) |
| 55 to 64 Years | 5 (33.3%) | 2 (10.5%) |
| 65 to 74 Years | 0 (0.0%) | 13 (25.5%) |
| 75 Years and over | 0 (0.0%) | 0 (0.0%) |
| Total | 24 (15.3%) | 46 (20.3%) |
Income Above Poverty by Sex and Age in Wheeler
According to the poverty statistics in Wheeler, males aged 16 and 17 years and females aged 12 to 14 years are the age groups that are most secure financially, with 100.0% of males and 100.0% of females in these age groups living above the poverty line.
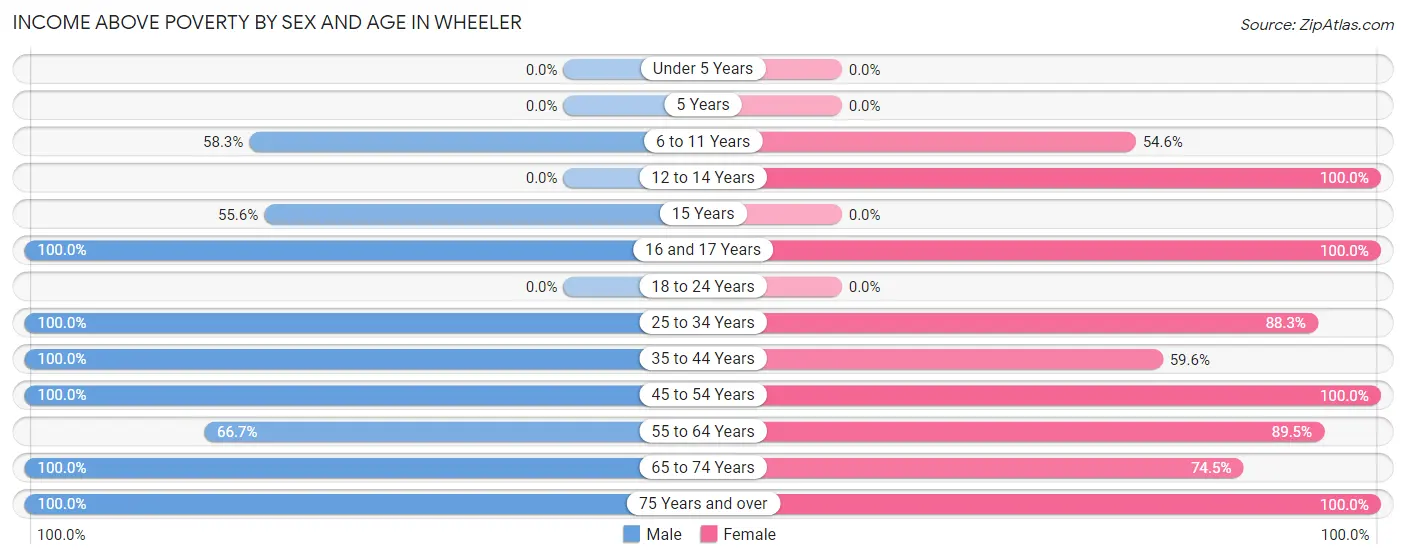
| Age Bracket | Male | Female |
| Under 5 Years | 0 (0.0%) | 0 (0.0%) |
| 5 Years | 0 (0.0%) | 0 (0.0%) |
| 6 to 11 Years | 7 (58.3%) | 6 (54.5%) |
| 12 to 14 Years | 0 (0.0%) | 6 (100.0%) |
| 15 Years | 5 (55.6%) | 0 (0.0%) |
| 16 and 17 Years | 5 (100.0%) | 6 (100.0%) |
| 18 to 24 Years | 0 (0.0%) | 0 (0.0%) |
| 25 to 34 Years | 10 (100.0%) | 53 (88.3%) |
| 35 to 44 Years | 24 (100.0%) | 28 (59.6%) |
| 45 to 54 Years | 25 (100.0%) | 7 (100.0%) |
| 55 to 64 Years | 10 (66.7%) | 17 (89.5%) |
| 65 to 74 Years | 29 (100.0%) | 38 (74.5%) |
| 75 Years and over | 18 (100.0%) | 19 (100.0%) |
| Total | 133 (84.7%) | 180 (79.6%) |
Income Below Poverty Among Married-Couple Families in Wheeler
| Children | Above Poverty | Below Poverty |
| No Children | 60 (100.0%) | 0 (0.0%) |
| 1 or 2 Children | 7 (100.0%) | 0 (0.0%) |
| 3 or 4 Children | 0 (0.0%) | 0 (0.0%) |
| 5 or more Children | 0 (0.0%) | 0 (0.0%) |
| Total | 67 (100.0%) | 0 (0.0%) |
Income Below Poverty Among Single-Parent Households in Wheeler
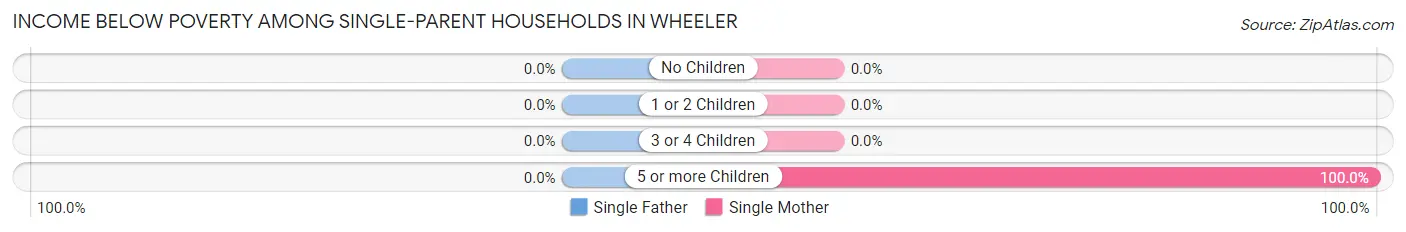
| Children | Single Father | Single Mother |
| No Children | 0 (0.0%) | 0 (0.0%) |
| 1 or 2 Children | 0 (0.0%) | 0 (0.0%) |
| 3 or 4 Children | 0 (0.0%) | 0 (0.0%) |
| 5 or more Children | 0 (0.0%) | 5 (100.0%) |
| Total | 0 (0.0%) | 5 (26.3%) |
Income Below Poverty Among Married-Couple vs Single-Parent Households in Wheeler
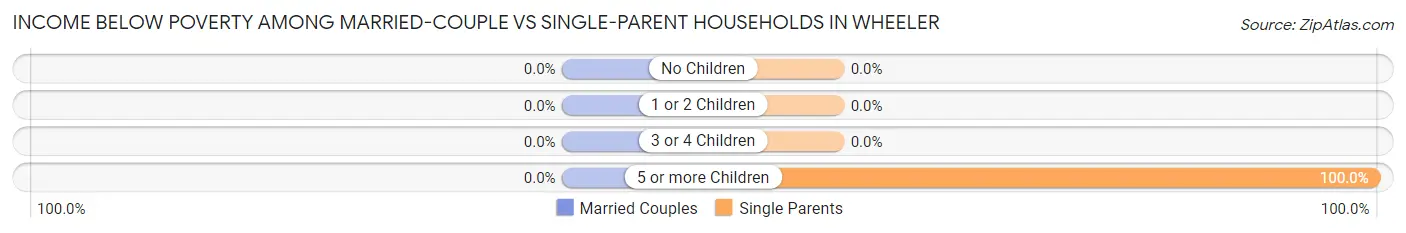
| Children | Married-Couple Families | Single-Parent Households |
| No Children | 0 (0.0%) | 0 (0.0%) |
| 1 or 2 Children | 0 (0.0%) | 0 (0.0%) |
| 3 or 4 Children | 0 (0.0%) | 0 (0.0%) |
| 5 or more Children | 0 (0.0%) | 5 (100.0%) |
| Total | 0 (0.0%) | 5 (26.3%) |
Employment Characteristics in Wheeler
Employment by Class of Employer in Wheeler
Among the 157 employed individuals in Wheeler, private company employees (103 | 65.6%), self-employed (incorporated) (18 | 11.5%), and not-for-profit organizations (15 | 9.6%) make up the most common classes of employment.
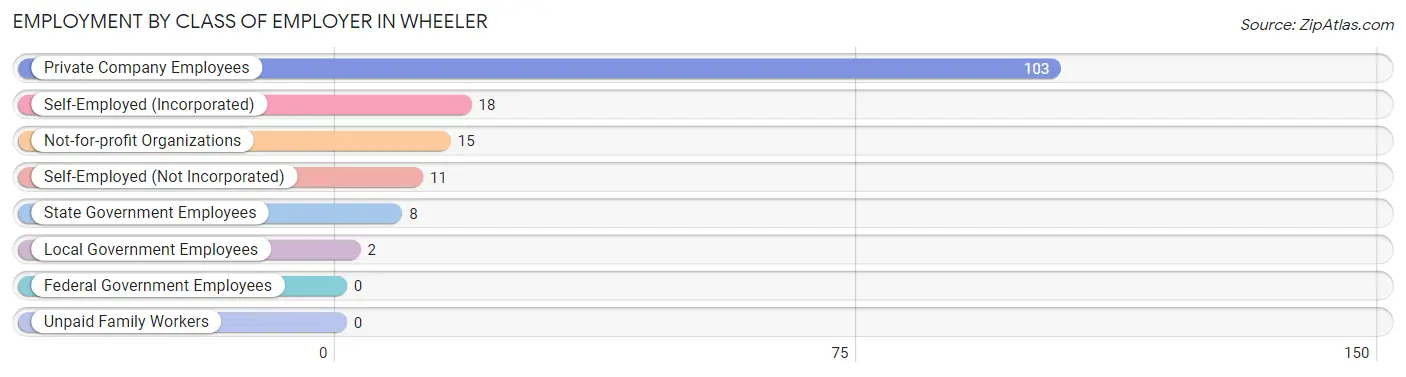
| Employer Class | # Employees | % Employees |
| Private Company Employees | 103 | 65.6% |
| Self-Employed (Incorporated) | 18 | 11.5% |
| Self-Employed (Not Incorporated) | 11 | 7.0% |
| Not-for-profit Organizations | 15 | 9.6% |
| Local Government Employees | 2 | 1.3% |
| State Government Employees | 8 | 5.1% |
| Federal Government Employees | 0 | 0.0% |
| Unpaid Family Workers | 0 | 0.0% |
| Total | 157 | 100.0% |
Employment Status by Age in Wheeler
According to the labor force statistics for Wheeler, out of the total population over 16 years of age (381), 44.4% or 169 individuals are in the labor force, with 7.1% or 12 of them unemployed. The age group with the highest labor force participation rate is 25 to 29 years, with 100.0% or 5 individuals in the labor force. Within the labor force, the 35 to 44 years age range has the highest percentage of unemployed individuals, with 19.4% or 12 of them being unemployed.
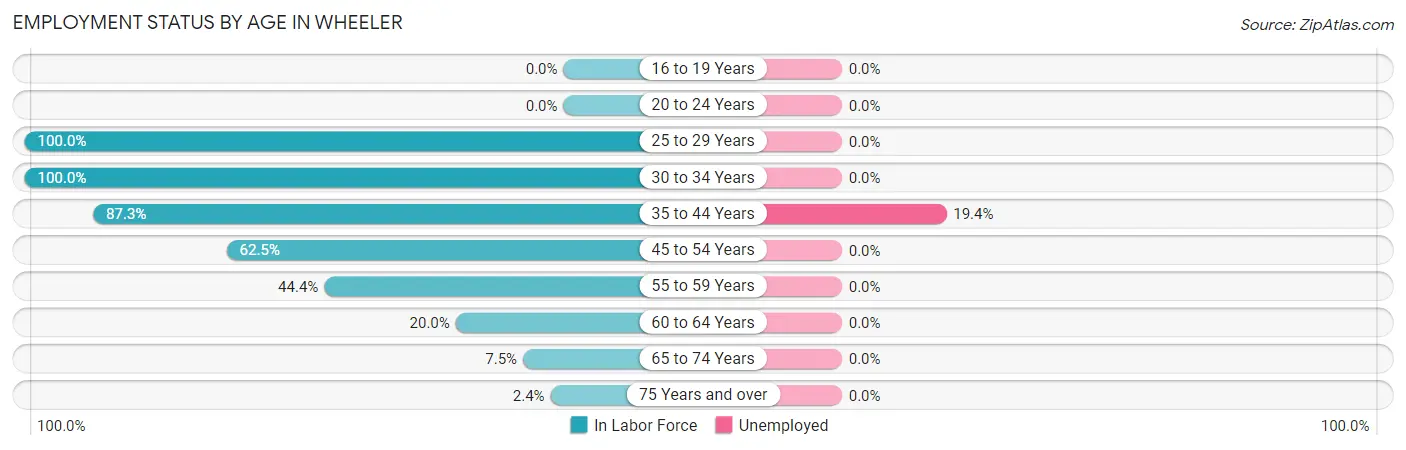
| Age Bracket | In Labor Force | Unemployed |
| 16 to 19 Years | 0 (0.0%) | 0 (0.0%) |
| 20 to 24 Years | 0 (0.0%) | 0 (0.0%) |
| 25 to 29 Years | 5 (100.0%) | 0 (0.0%) |
| 30 to 34 Years | 65 (100.0%) | 0 (0.0%) |
| 35 to 44 Years | 62 (87.3%) | 12 (19.4%) |
| 45 to 54 Years | 20 (62.5%) | 0 (0.0%) |
| 55 to 59 Years | 4 (44.4%) | 0 (0.0%) |
| 60 to 64 Years | 5 (20.0%) | 0 (0.0%) |
| 65 to 74 Years | 6 (7.5%) | 0 (0.0%) |
| 75 Years and over | 2 (2.4%) | 0 (0.0%) |
| Total | 169 (44.4%) | 12 (7.1%) |
Employment Status by Educational Attainment in Wheeler
According to labor force statistics for Wheeler, 77.8% of individuals (161) out of the total population between 25 and 64 years of age (207) are in the labor force, with 7.5% or 12 of them being unemployed. The group with the highest labor force participation rate are those with the educational attainment of less than high school, with 100.0% or 3 individuals in the labor force. Within the labor force, individuals with college / associate degree education have the highest percentage of unemployment, with 17.2% or 5 of them being unemployed.
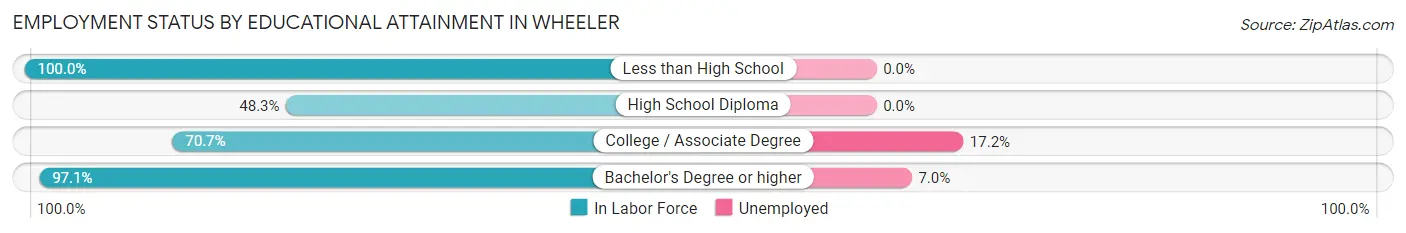
| Educational Attainment | In Labor Force | Unemployed |
| Less than High School | 3 (100.0%) | 0 (0.0%) |
| High School Diploma | 29 (48.3%) | 0 (0.0%) |
| College / Associate Degree | 29 (70.7%) | 7 (17.2%) |
| Bachelor's Degree or higher | 100 (97.1%) | 7 (7.0%) |
| Total | 161 (77.8%) | 16 (7.5%) |
Employment Occupations by Sex in Wheeler
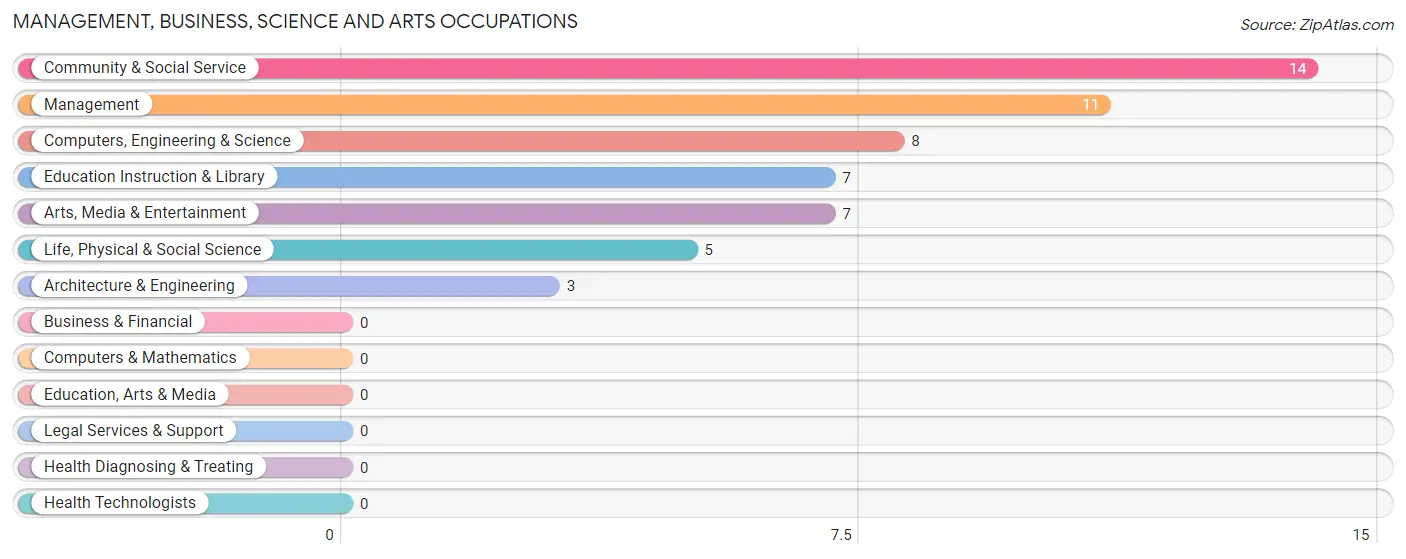
Management, Business, Science and Arts Occupations
The most common Management, Business, Science and Arts occupations in Wheeler are Community & Social Service (14 | 8.9%), Management (11 | 7.0%), Computers, Engineering & Science (8 | 5.1%), Education Instruction & Library (7 | 4.5%), and Arts, Media & Entertainment (7 | 4.5%).
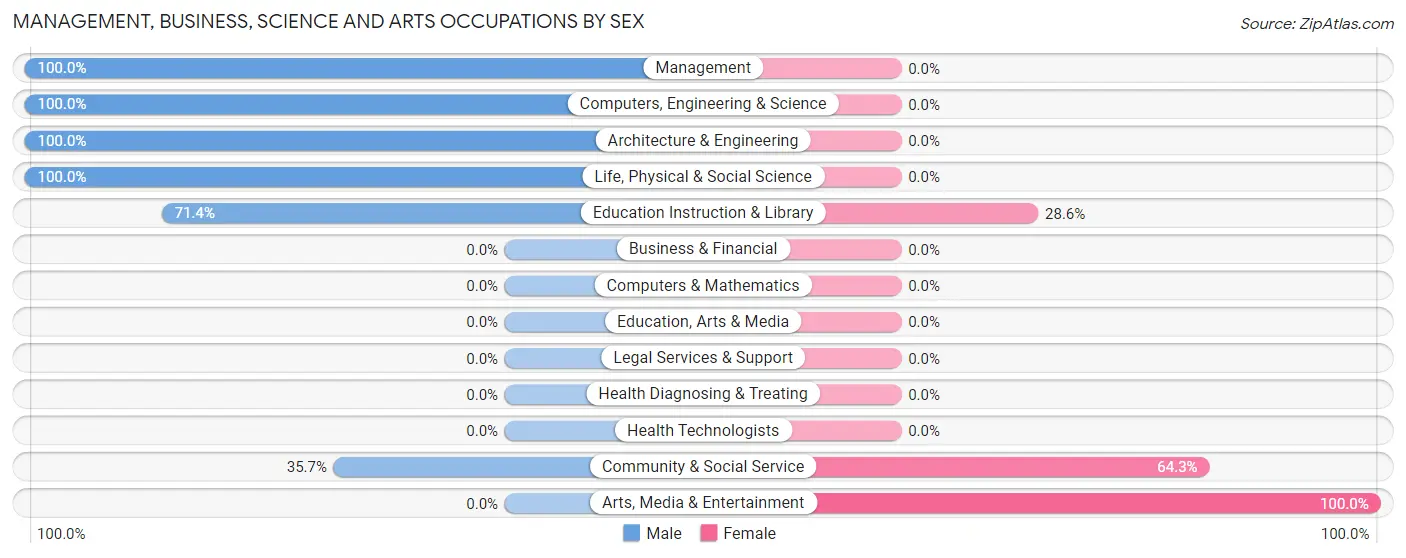
Management, Business, Science and Arts Occupations by Sex
Within the Management, Business, Science and Arts occupations in Wheeler, the most male-oriented occupations are Management (100.0%), Computers, Engineering & Science (100.0%), and Architecture & Engineering (100.0%), while the most female-oriented occupations are Arts, Media & Entertainment (100.0%), Community & Social Service (64.3%), and Education Instruction & Library (28.6%).
| Occupation | Male | Female |
| Management | 11 (100.0%) | 0 (0.0%) |
| Business & Financial | 0 (0.0%) | 0 (0.0%) |
| Computers, Engineering & Science | 8 (100.0%) | 0 (0.0%) |
| Computers & Mathematics | 0 (0.0%) | 0 (0.0%) |
| Architecture & Engineering | 3 (100.0%) | 0 (0.0%) |
| Life, Physical & Social Science | 5 (100.0%) | 0 (0.0%) |
| Community & Social Service | 5 (35.7%) | 9 (64.3%) |
| Education, Arts & Media | 0 (0.0%) | 0 (0.0%) |
| Legal Services & Support | 0 (0.0%) | 0 (0.0%) |
| Education Instruction & Library | 5 (71.4%) | 2 (28.6%) |
| Arts, Media & Entertainment | 0 (0.0%) | 7 (100.0%) |
| Health Diagnosing & Treating | 0 (0.0%) | 0 (0.0%) |
| Health Technologists | 0 (0.0%) | 0 (0.0%) |
| Total (Category) | 24 (72.7%) | 9 (27.3%) |
| Total (Overall) | 65 (41.4%) | 92 (58.6%) |
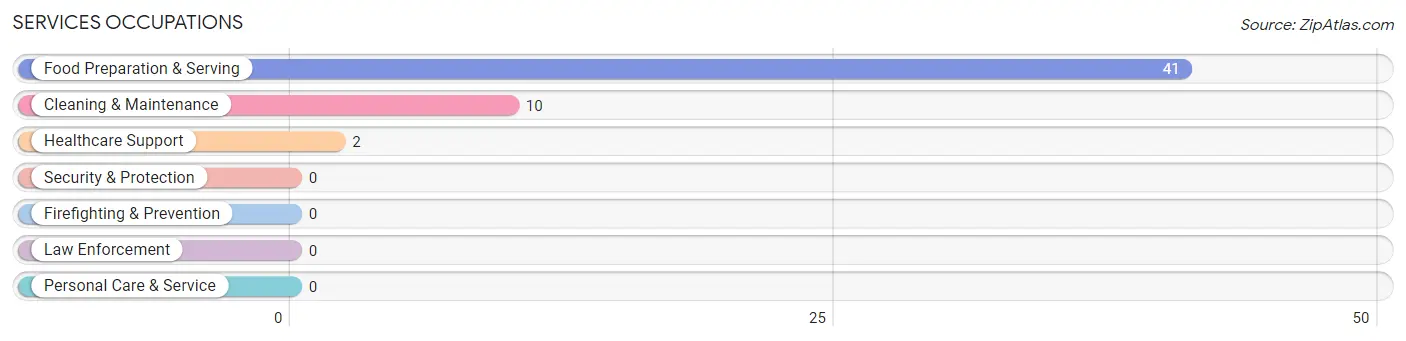
Services Occupations
The most common Services occupations in Wheeler are Food Preparation & Serving (41 | 26.1%), Cleaning & Maintenance (10 | 6.4%), and Healthcare Support (2 | 1.3%).
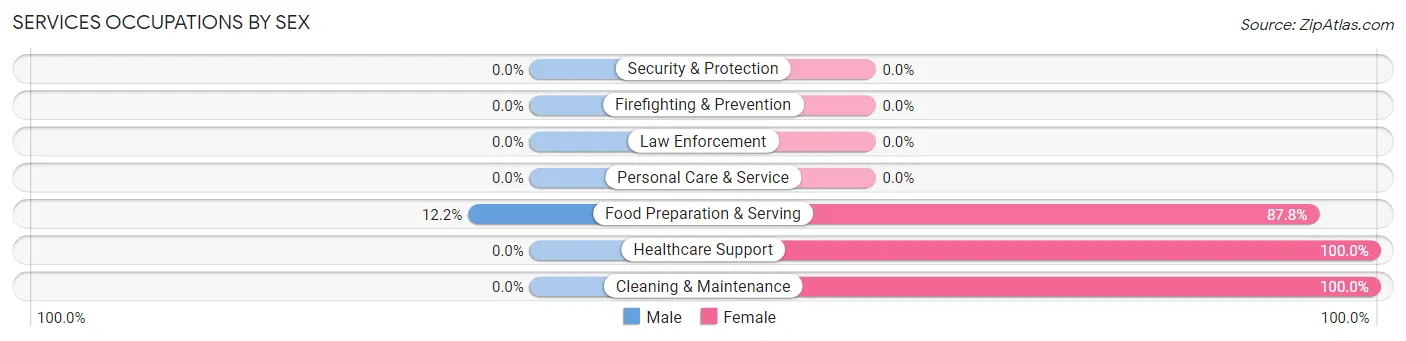
Services Occupations by Sex
| Occupation | Male | Female |
| Healthcare Support | 0 (0.0%) | 2 (100.0%) |
| Security & Protection | 0 (0.0%) | 0 (0.0%) |
| Firefighting & Prevention | 0 (0.0%) | 0 (0.0%) |
| Law Enforcement | 0 (0.0%) | 0 (0.0%) |
| Food Preparation & Serving | 5 (12.2%) | 36 (87.8%) |
| Cleaning & Maintenance | 0 (0.0%) | 10 (100.0%) |
| Personal Care & Service | 0 (0.0%) | 0 (0.0%) |
| Total (Category) | 5 (9.4%) | 48 (90.6%) |
| Total (Overall) | 65 (41.4%) | 92 (58.6%) |
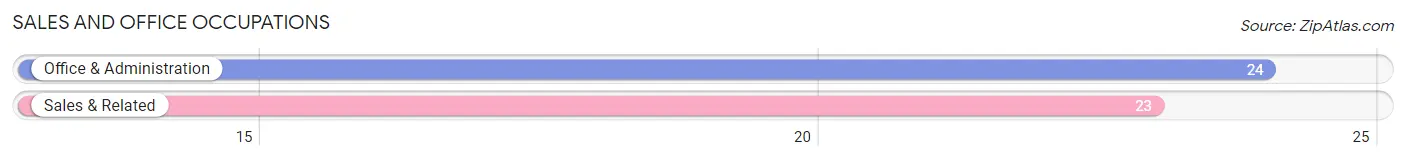
Sales and Office Occupations
The most common Sales and Office occupations in Wheeler are Office & Administration (24 | 15.3%), and Sales & Related (23 | 14.6%).
Sales and Office Occupations by Sex
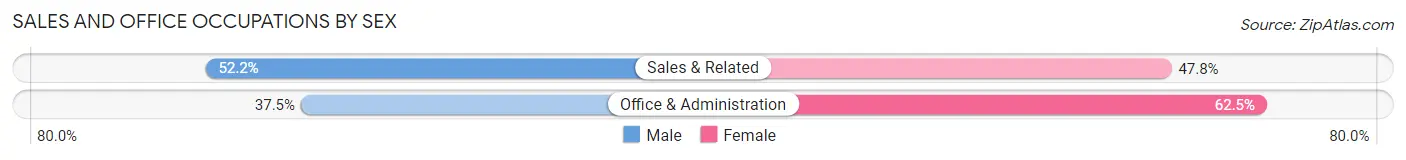
| Occupation | Male | Female |
| Sales & Related | 12 (52.2%) | 11 (47.8%) |
| Office & Administration | 9 (37.5%) | 15 (62.5%) |
| Total (Category) | 21 (44.7%) | 26 (55.3%) |
| Total (Overall) | 65 (41.4%) | 92 (58.6%) |
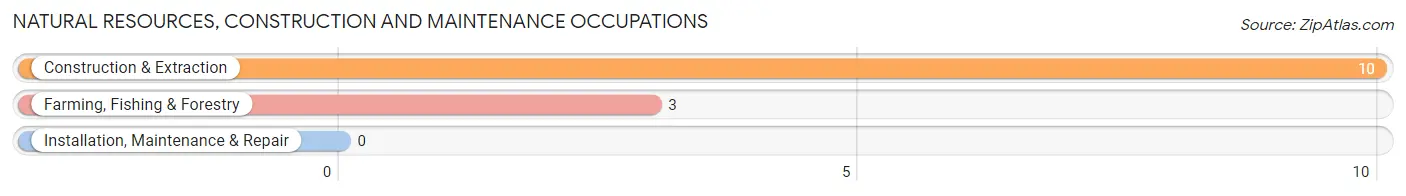
Natural Resources, Construction and Maintenance Occupations
The most common Natural Resources, Construction and Maintenance occupations in Wheeler are Construction & Extraction (10 | 6.4%), and Farming, Fishing & Forestry (3 | 1.9%).
Natural Resources, Construction and Maintenance Occupations by Sex
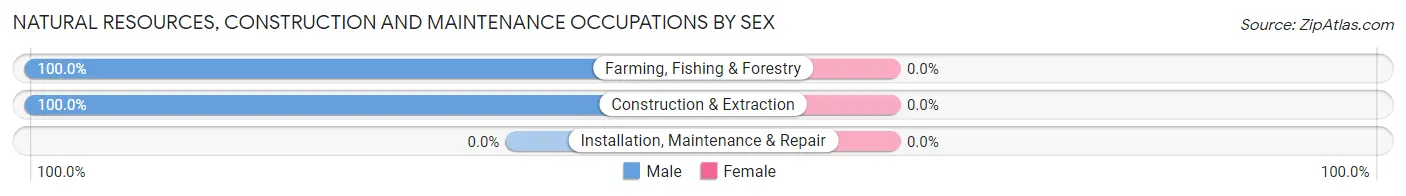
| Occupation | Male | Female |
| Farming, Fishing & Forestry | 3 (100.0%) | 0 (0.0%) |
| Construction & Extraction | 10 (100.0%) | 0 (0.0%) |
| Installation, Maintenance & Repair | 0 (0.0%) | 0 (0.0%) |
| Total (Category) | 13 (100.0%) | 0 (0.0%) |
| Total (Overall) | 65 (41.4%) | 92 (58.6%) |
Production, Transportation and Moving Occupations
The most common Production, Transportation and Moving occupations in Wheeler are Production (9 | 5.7%), and Material Moving (2 | 1.3%).
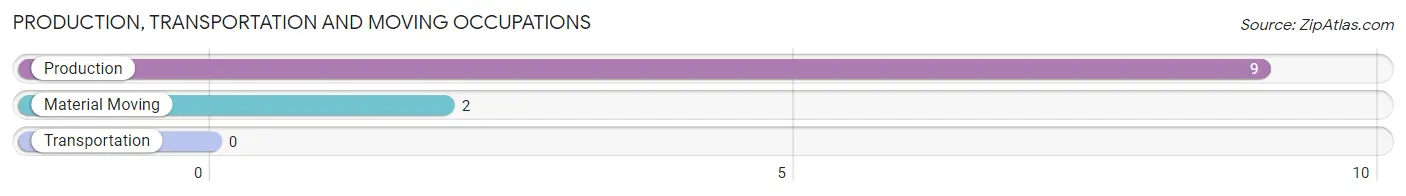
Production, Transportation and Moving Occupations by Sex
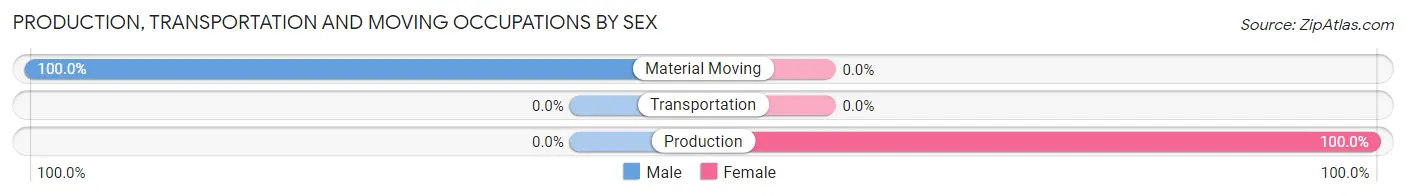
| Occupation | Male | Female |
| Production | 0 (0.0%) | 9 (100.0%) |
| Transportation | 0 (0.0%) | 0 (0.0%) |
| Material Moving | 2 (100.0%) | 0 (0.0%) |
| Total (Category) | 2 (18.2%) | 9 (81.8%) |
| Total (Overall) | 65 (41.4%) | 92 (58.6%) |
Employment Industries by Sex in Wheeler
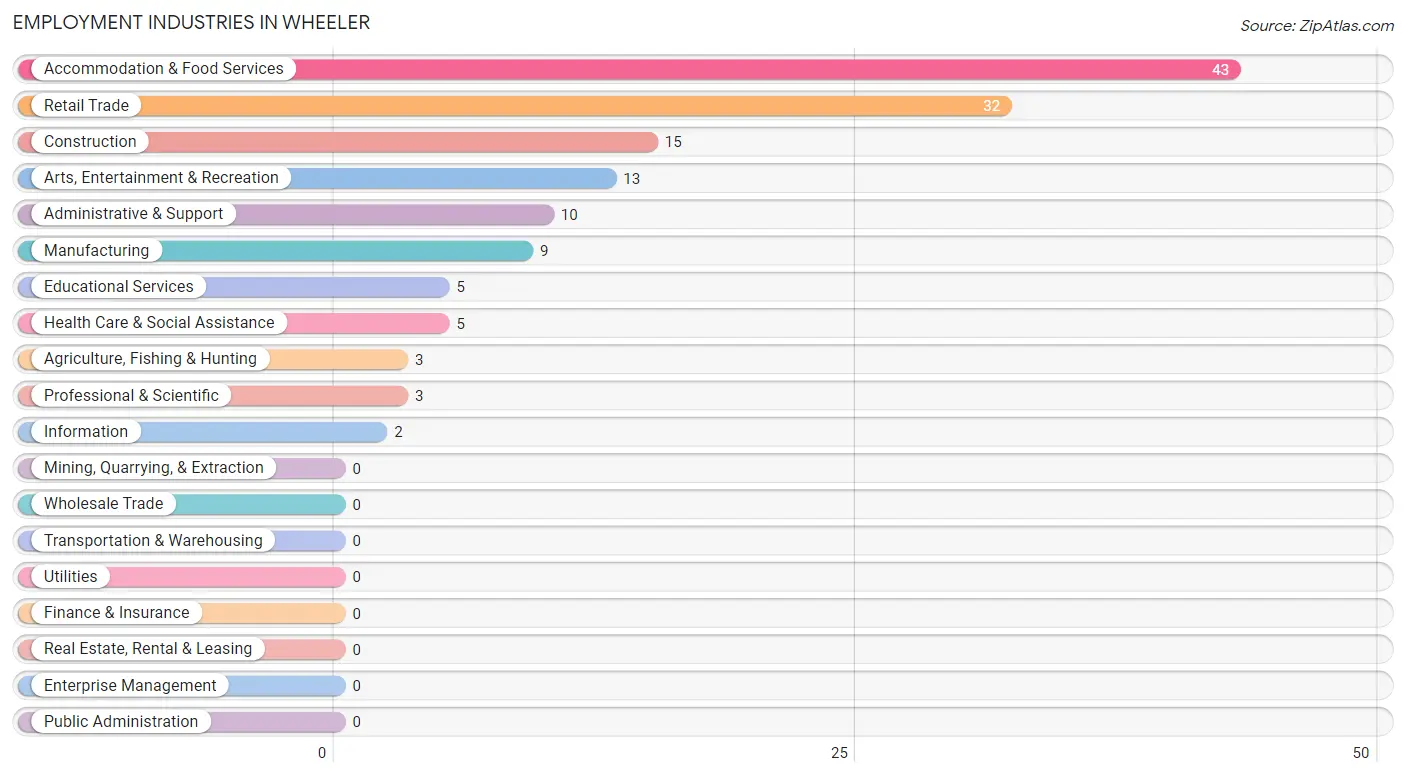
Employment Industries in Wheeler
The major employment industries in Wheeler include Accommodation & Food Services (43 | 27.4%), Retail Trade (32 | 20.4%), Construction (15 | 9.6%), Arts, Entertainment & Recreation (13 | 8.3%), and Administrative & Support (10 | 6.4%).
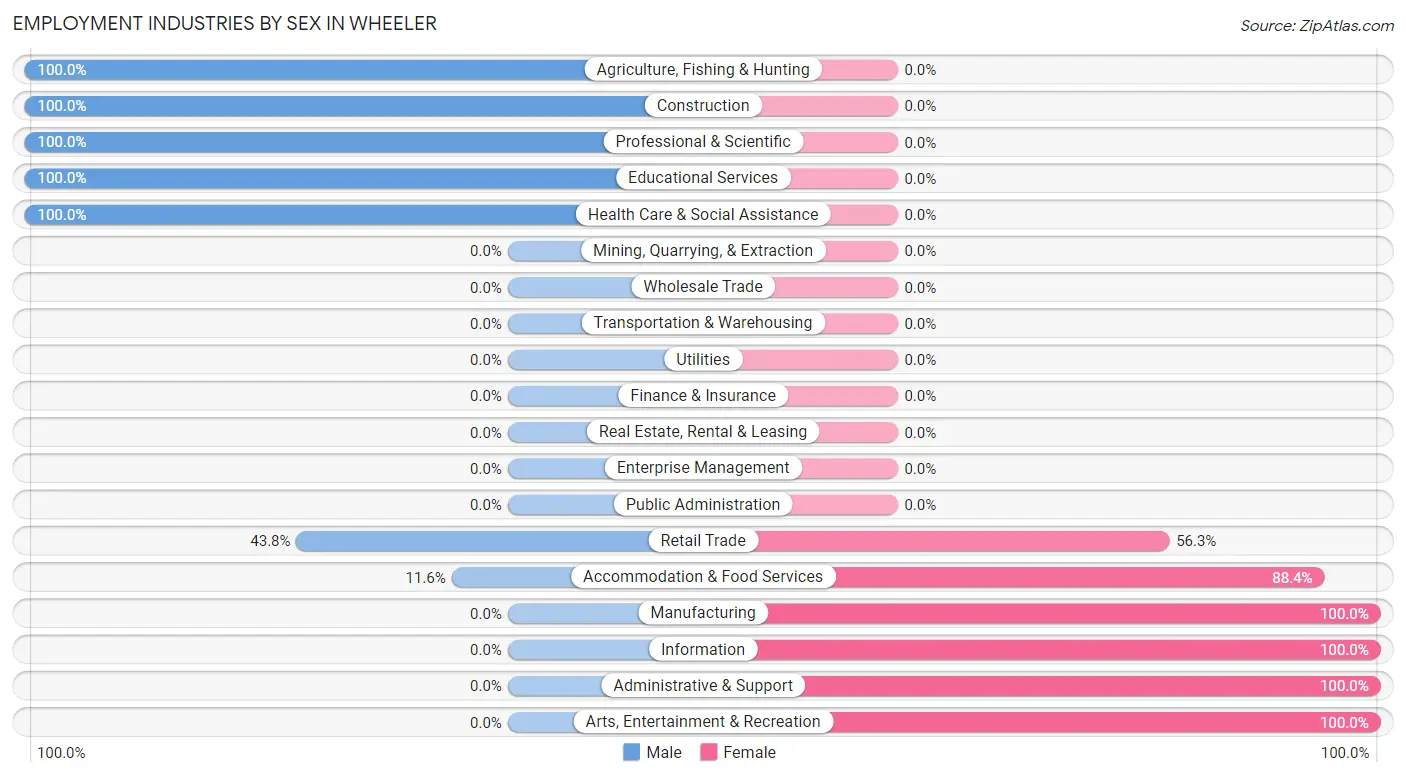
Employment Industries by Sex in Wheeler
The Wheeler industries that see more men than women are Agriculture, Fishing & Hunting (100.0%), Construction (100.0%), and Professional & Scientific (100.0%), whereas the industries that tend to have a higher number of women are Manufacturing (100.0%), Information (100.0%), and Administrative & Support (100.0%).
| Industry | Male | Female |
| Agriculture, Fishing & Hunting | 3 (100.0%) | 0 (0.0%) |
| Mining, Quarrying, & Extraction | 0 (0.0%) | 0 (0.0%) |
| Construction | 15 (100.0%) | 0 (0.0%) |
| Manufacturing | 0 (0.0%) | 9 (100.0%) |
| Wholesale Trade | 0 (0.0%) | 0 (0.0%) |
| Retail Trade | 14 (43.8%) | 18 (56.2%) |
| Transportation & Warehousing | 0 (0.0%) | 0 (0.0%) |
| Utilities | 0 (0.0%) | 0 (0.0%) |
| Information | 0 (0.0%) | 2 (100.0%) |
| Finance & Insurance | 0 (0.0%) | 0 (0.0%) |
| Real Estate, Rental & Leasing | 0 (0.0%) | 0 (0.0%) |
| Professional & Scientific | 3 (100.0%) | 0 (0.0%) |
| Enterprise Management | 0 (0.0%) | 0 (0.0%) |
| Administrative & Support | 0 (0.0%) | 10 (100.0%) |
| Educational Services | 5 (100.0%) | 0 (0.0%) |
| Health Care & Social Assistance | 5 (100.0%) | 0 (0.0%) |
| Arts, Entertainment & Recreation | 0 (0.0%) | 13 (100.0%) |
| Accommodation & Food Services | 5 (11.6%) | 38 (88.4%) |
| Public Administration | 0 (0.0%) | 0 (0.0%) |
| Total | 65 (41.4%) | 92 (58.6%) |
Education in Wheeler
School Enrollment in Wheeler
The most common levels of schooling among the 59 students in Wheeler are elementary school (23 | 39.0%), high school (20 | 33.9%), and middle school (16 | 27.1%).
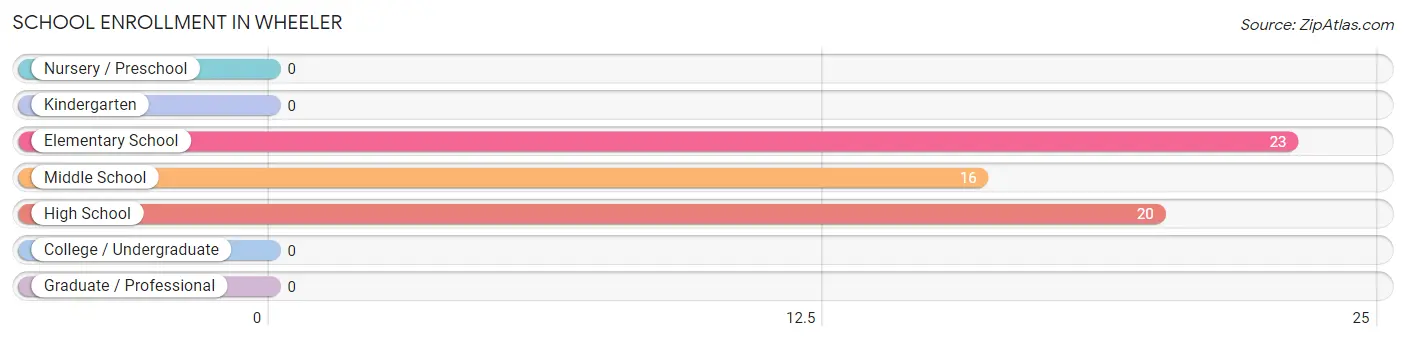
| School Level | # Students | % Students |
| Nursery / Preschool | 0 | 0.0% |
| Kindergarten | 0 | 0.0% |
| Elementary School | 23 | 39.0% |
| Middle School | 16 | 27.1% |
| High School | 20 | 33.9% |
| College / Undergraduate | 0 | 0.0% |
| Graduate / Professional | 0 | 0.0% |
| Total | 59 | 100.0% |
School Enrollment by Age by Funding Source in Wheeler
Out of a total of 59 students who are enrolled in schools in Wheeler, 13 (22.0%) attend a private institution, while the remaining 46 (78.0%) are enrolled in public schools. The age group of 5 to 9 year old has the highest likelihood of being enrolled in private schools, with 13 (100.0% in the age bracket) enrolled. Conversely, the age group of 10 to 14 year olds has the lowest likelihood of being enrolled in a private school, with 26 (100.0% in the age bracket) attending a public institution.
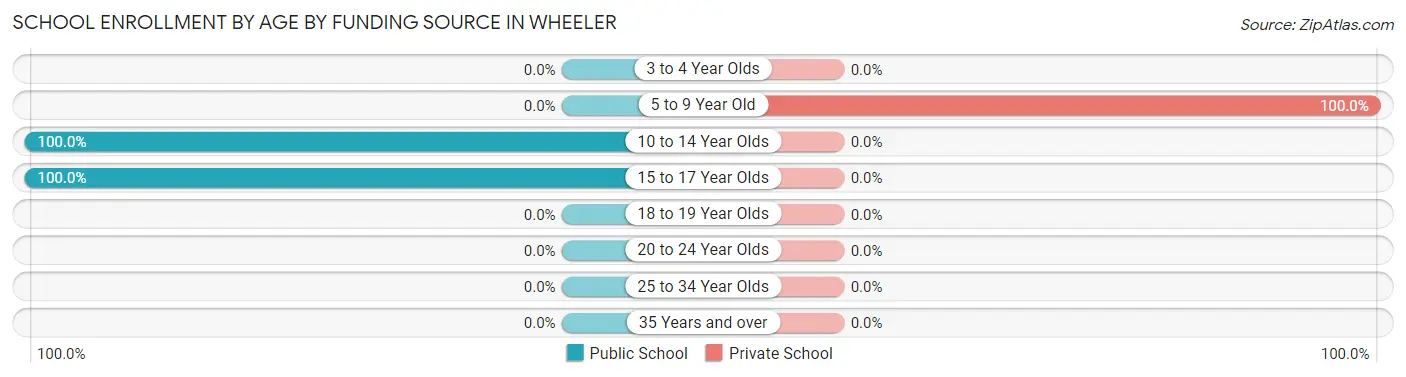
| Age Bracket | Public School | Private School |
| 3 to 4 Year Olds | 0 (0.0%) | 0 (0.0%) |
| 5 to 9 Year Old | 0 (0.0%) | 13 (100.0%) |
| 10 to 14 Year Olds | 26 (100.0%) | 0 (0.0%) |
| 15 to 17 Year Olds | 20 (100.0%) | 0 (0.0%) |
| 18 to 19 Year Olds | 0 (0.0%) | 0 (0.0%) |
| 20 to 24 Year Olds | 0 (0.0%) | 0 (0.0%) |
| 25 to 34 Year Olds | 0 (0.0%) | 0 (0.0%) |
| 35 Years and over | 0 (0.0%) | 0 (0.0%) |
| Total | 46 (78.0%) | 13 (22.0%) |
Educational Attainment by Field of Study in Wheeler
Social sciences (27 | 16.2%), liberal arts & history (25 | 15.0%), visual & performing arts (24 | 14.4%), business (20 | 12.0%), and literature & languages (16 | 9.6%) are the most common fields of study among 167 individuals in Wheeler who have obtained a bachelor's degree or higher.
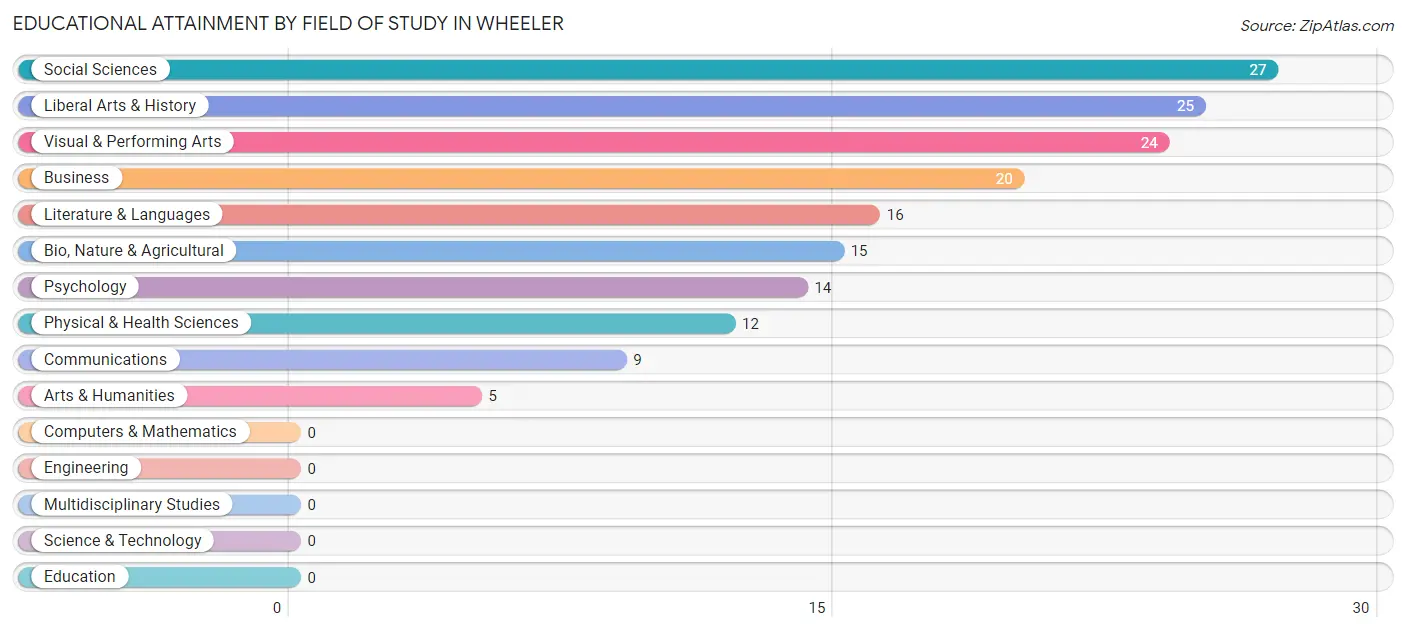
| Field of Study | # Graduates | % Graduates |
| Computers & Mathematics | 0 | 0.0% |
| Bio, Nature & Agricultural | 15 | 9.0% |
| Physical & Health Sciences | 12 | 7.2% |
| Psychology | 14 | 8.4% |
| Social Sciences | 27 | 16.2% |
| Engineering | 0 | 0.0% |
| Multidisciplinary Studies | 0 | 0.0% |
| Science & Technology | 0 | 0.0% |
| Business | 20 | 12.0% |
| Education | 0 | 0.0% |
| Literature & Languages | 16 | 9.6% |
| Liberal Arts & History | 25 | 15.0% |
| Visual & Performing Arts | 24 | 14.4% |
| Communications | 9 | 5.4% |
| Arts & Humanities | 5 | 3.0% |
| Total | 167 | 100.0% |
Transportation & Commute in Wheeler
Vehicle Availability by Sex in Wheeler
The most prevalent vehicle ownership categories in Wheeler are males with 3 vehicles (21, accounting for 32.3%) and females with 3 vehicles (22, making up 22.8%).
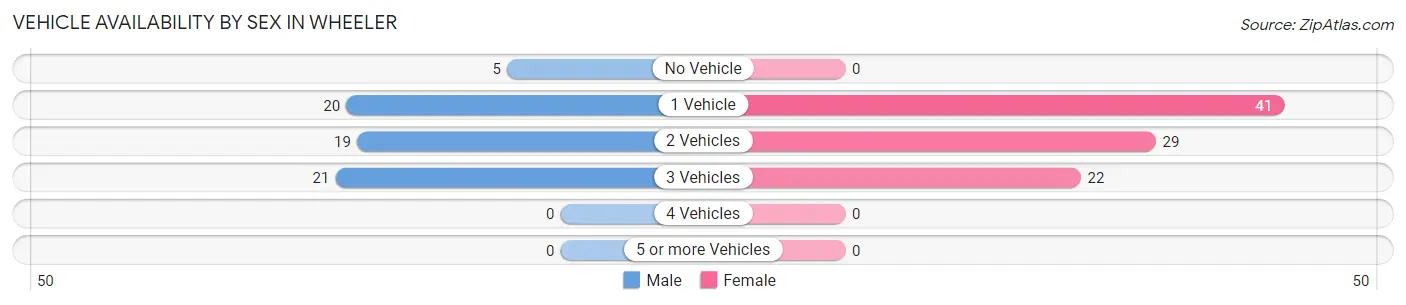
| Vehicles Available | Male | Female |
| No Vehicle | 5 (7.7%) | 0 (0.0%) |
| 1 Vehicle | 20 (30.8%) | 41 (44.6%) |
| 2 Vehicles | 19 (29.2%) | 29 (31.5%) |
| 3 Vehicles | 21 (32.3%) | 22 (23.9%) |
| 4 Vehicles | 0 (0.0%) | 0 (0.0%) |
| 5 or more Vehicles | 0 (0.0%) | 0 (0.0%) |
| Total | 65 (100.0%) | 92 (100.0%) |
Commute Time in Wheeler
The most frequently occuring commute durations in Wheeler are 30 to 34 minutes (30 commuters, 20.8%), less than 5 minutes (24 commuters, 16.7%), and 10 to 14 minutes (22 commuters, 15.3%).
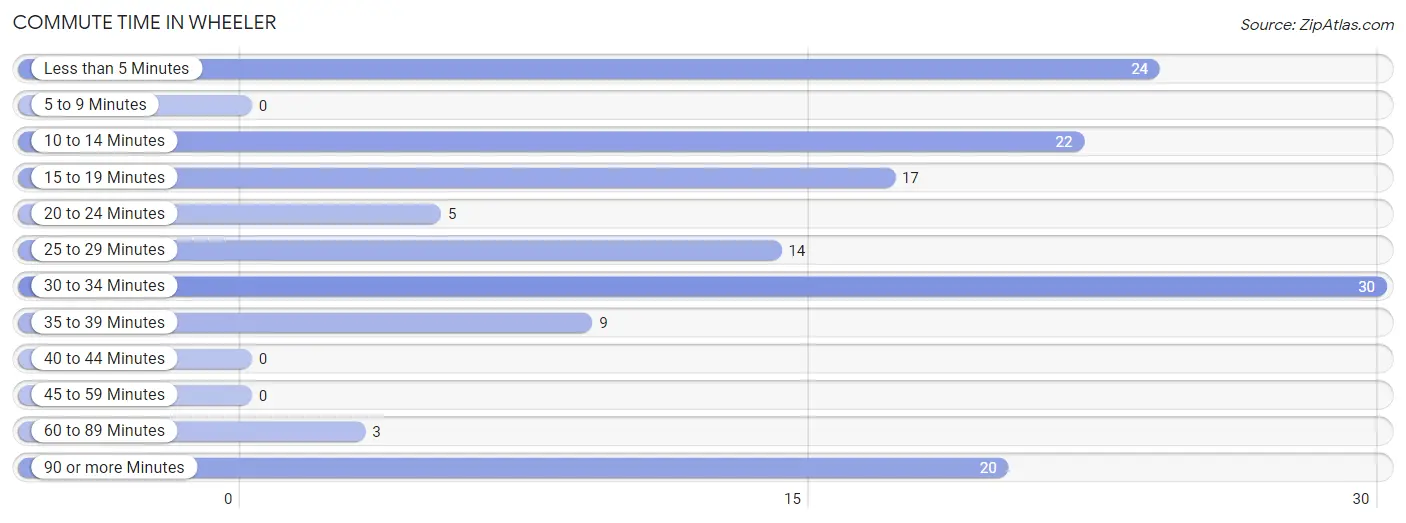
| Commute Time | # Commuters | % Commuters |
| Less than 5 Minutes | 24 | 16.7% |
| 5 to 9 Minutes | 0 | 0.0% |
| 10 to 14 Minutes | 22 | 15.3% |
| 15 to 19 Minutes | 17 | 11.8% |
| 20 to 24 Minutes | 5 | 3.5% |
| 25 to 29 Minutes | 14 | 9.7% |
| 30 to 34 Minutes | 30 | 20.8% |
| 35 to 39 Minutes | 9 | 6.2% |
| 40 to 44 Minutes | 0 | 0.0% |
| 45 to 59 Minutes | 0 | 0.0% |
| 60 to 89 Minutes | 3 | 2.1% |
| 90 or more Minutes | 20 | 13.9% |
Commute Time by Sex in Wheeler
The most common commute times in Wheeler are 90 or more minutes (20 commuters, 33.9%) for males and 30 to 34 minutes (25 commuters, 29.4%) for females.
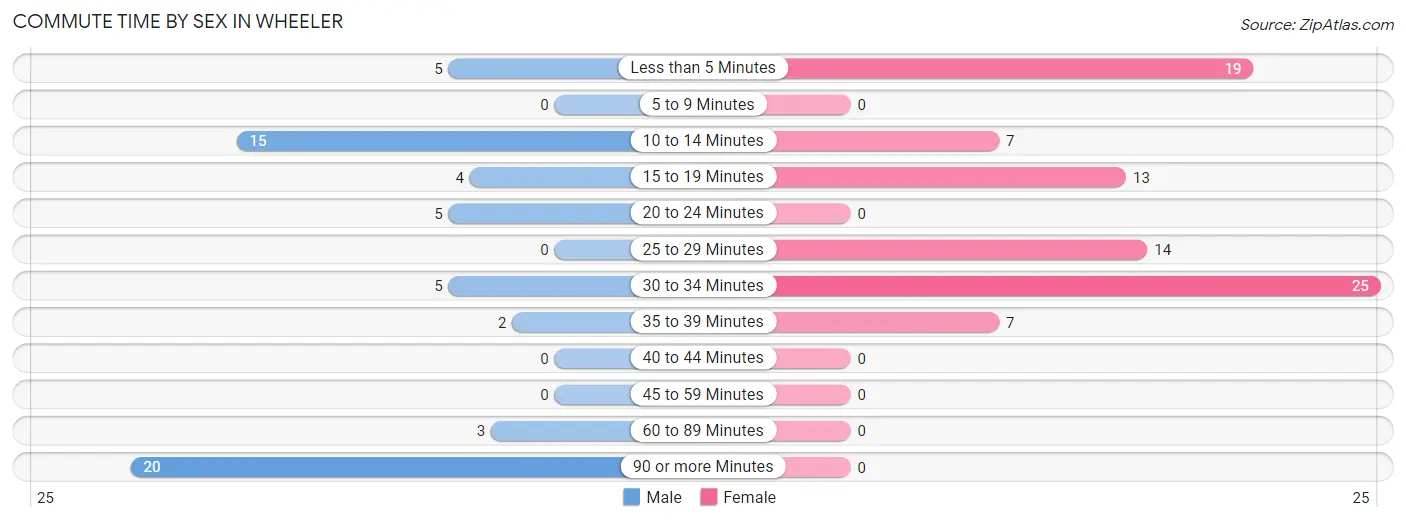
| Commute Time | Male | Female |
| Less than 5 Minutes | 5 (8.5%) | 19 (22.4%) |
| 5 to 9 Minutes | 0 (0.0%) | 0 (0.0%) |
| 10 to 14 Minutes | 15 (25.4%) | 7 (8.2%) |
| 15 to 19 Minutes | 4 (6.8%) | 13 (15.3%) |
| 20 to 24 Minutes | 5 (8.5%) | 0 (0.0%) |
| 25 to 29 Minutes | 0 (0.0%) | 14 (16.5%) |
| 30 to 34 Minutes | 5 (8.5%) | 25 (29.4%) |
| 35 to 39 Minutes | 2 (3.4%) | 7 (8.2%) |
| 40 to 44 Minutes | 0 (0.0%) | 0 (0.0%) |
| 45 to 59 Minutes | 0 (0.0%) | 0 (0.0%) |
| 60 to 89 Minutes | 3 (5.1%) | 0 (0.0%) |
| 90 or more Minutes | 20 (33.9%) | 0 (0.0%) |
Time of Departure to Work by Sex in Wheeler
The most frequent times of departure to work in Wheeler are 7:00 AM to 7:29 AM (14, 23.7%) for males and 11:00 AM to 11:59 AM (23, 27.1%) for females.
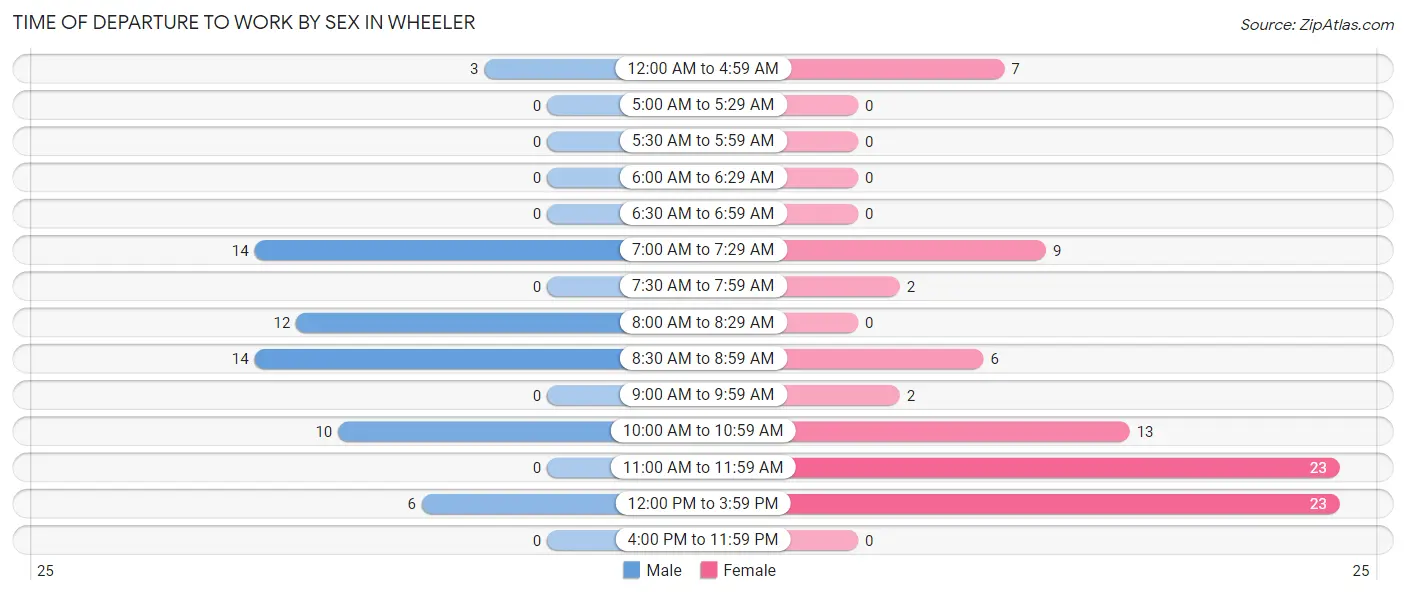
| Time of Departure | Male | Female |
| 12:00 AM to 4:59 AM | 3 (5.1%) | 7 (8.2%) |
| 5:00 AM to 5:29 AM | 0 (0.0%) | 0 (0.0%) |
| 5:30 AM to 5:59 AM | 0 (0.0%) | 0 (0.0%) |
| 6:00 AM to 6:29 AM | 0 (0.0%) | 0 (0.0%) |
| 6:30 AM to 6:59 AM | 0 (0.0%) | 0 (0.0%) |
| 7:00 AM to 7:29 AM | 14 (23.7%) | 9 (10.6%) |
| 7:30 AM to 7:59 AM | 0 (0.0%) | 2 (2.4%) |
| 8:00 AM to 8:29 AM | 12 (20.3%) | 0 (0.0%) |
| 8:30 AM to 8:59 AM | 14 (23.7%) | 6 (7.1%) |
| 9:00 AM to 9:59 AM | 0 (0.0%) | 2 (2.4%) |
| 10:00 AM to 10:59 AM | 10 (17.0%) | 13 (15.3%) |
| 11:00 AM to 11:59 AM | 0 (0.0%) | 23 (27.1%) |
| 12:00 PM to 3:59 PM | 6 (10.2%) | 23 (27.1%) |
| 4:00 PM to 11:59 PM | 0 (0.0%) | 0 (0.0%) |
| Total | 59 (100.0%) | 85 (100.0%) |
Housing Occupancy in Wheeler
Occupancy by Ownership in Wheeler
Of the total 219 dwellings in Wheeler, owner-occupied units account for 106 (48.4%), while renter-occupied units make up 113 (51.6%).
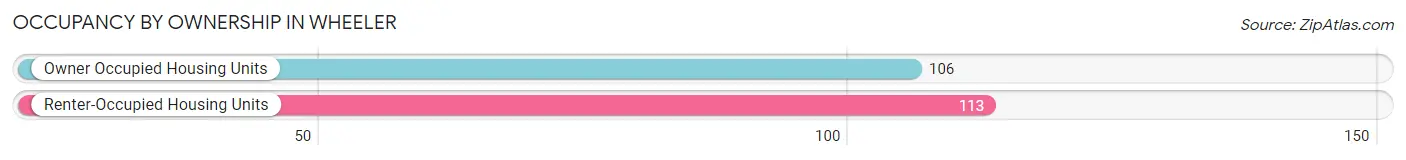
| Occupancy | # Housing Units | % Housing Units |
| Owner Occupied Housing Units | 106 | 48.4% |
| Renter-Occupied Housing Units | 113 | 51.6% |
| Total Occupied Housing Units | 219 | 100.0% |
Occupancy by Household Size in Wheeler
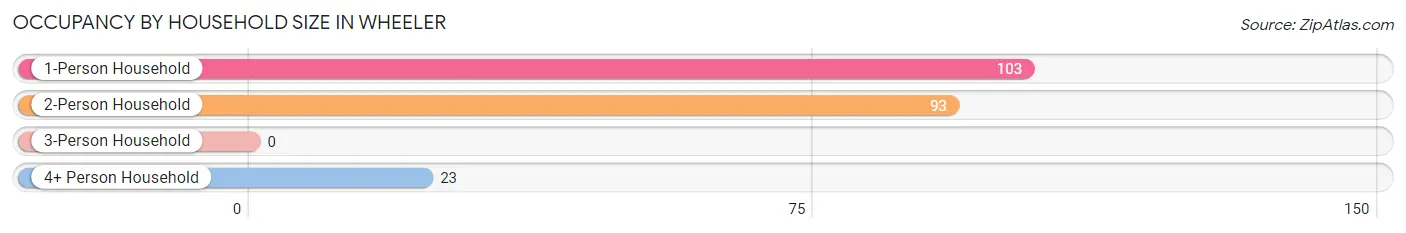
| Household Size | # Housing Units | % Housing Units |
| 1-Person Household | 103 | 47.0% |
| 2-Person Household | 93 | 42.5% |
| 3-Person Household | 0 | 0.0% |
| 4+ Person Household | 23 | 10.5% |
| Total Housing Units | 219 | 100.0% |
Occupancy by Ownership by Household Size in Wheeler
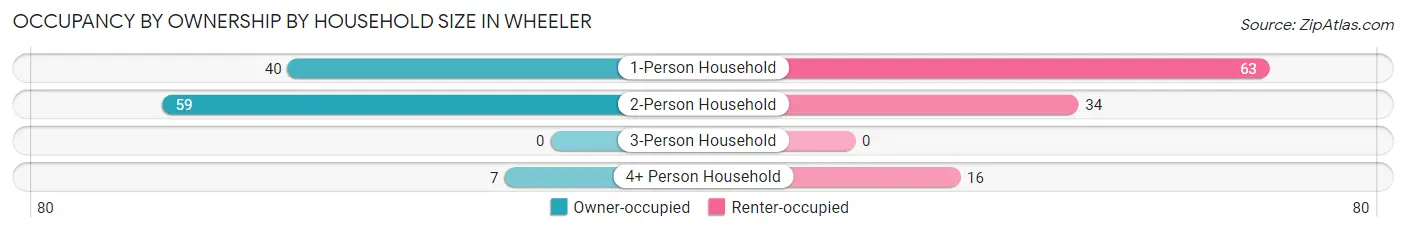
| Household Size | Owner-occupied | Renter-occupied |
| 1-Person Household | 40 (38.8%) | 63 (61.2%) |
| 2-Person Household | 59 (63.4%) | 34 (36.6%) |
| 3-Person Household | 0 (0.0%) | 0 (0.0%) |
| 4+ Person Household | 7 (30.4%) | 16 (69.6%) |
| Total Housing Units | 106 (48.4%) | 113 (51.6%) |
Occupancy by Educational Attainment in Wheeler
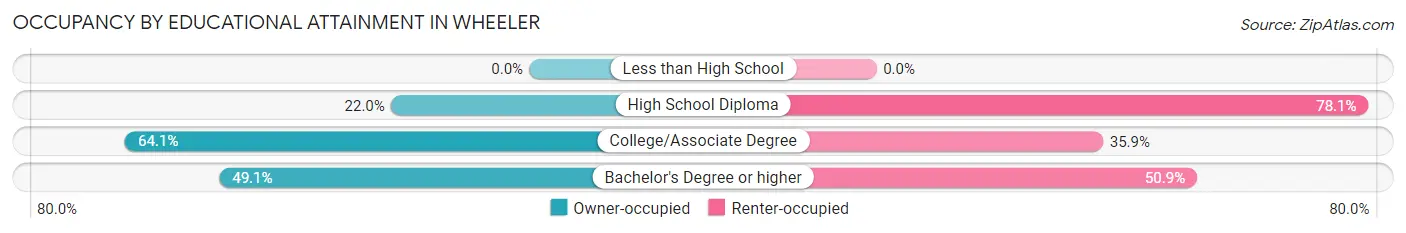
| Household Size | Owner-occupied | Renter-occupied |
| Less than High School | 0 (0.0%) | 0 (0.0%) |
| High School Diploma | 9 (22.0%) | 32 (78.0%) |
| College/Associate Degree | 41 (64.1%) | 23 (35.9%) |
| Bachelor's Degree or higher | 56 (49.1%) | 58 (50.9%) |
Occupancy by Age of Householder in Wheeler
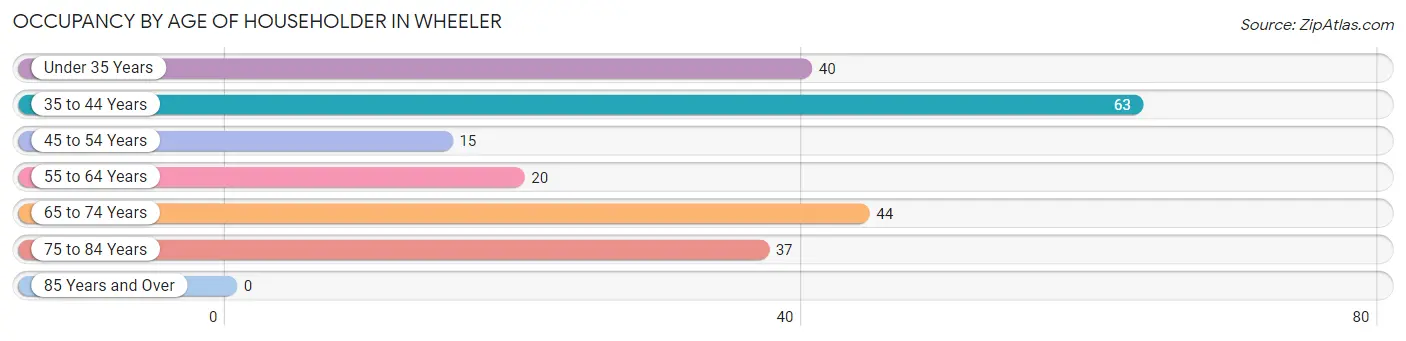
| Age Bracket | # Households | % Households |
| Under 35 Years | 40 | 18.3% |
| 35 to 44 Years | 63 | 28.8% |
| 45 to 54 Years | 15 | 6.9% |
| 55 to 64 Years | 20 | 9.1% |
| 65 to 74 Years | 44 | 20.1% |
| 75 to 84 Years | 37 | 16.9% |
| 85 Years and Over | 0 | 0.0% |
| Total | 219 | 100.0% |
Housing Finances in Wheeler
Median Income by Occupancy in Wheeler
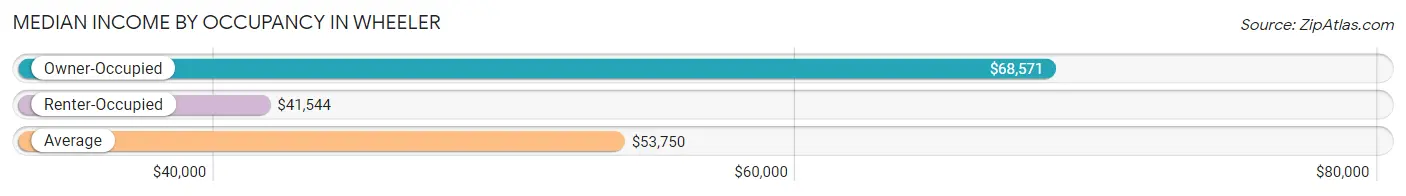
| Occupancy Type | # Households | Median Income |
| Owner-Occupied | 106 (48.4%) | $68,571 |
| Renter-Occupied | 113 (51.6%) | $41,544 |
| Average | 219 (100.0%) | $53,750 |
Occupancy by Householder Income Bracket in Wheeler
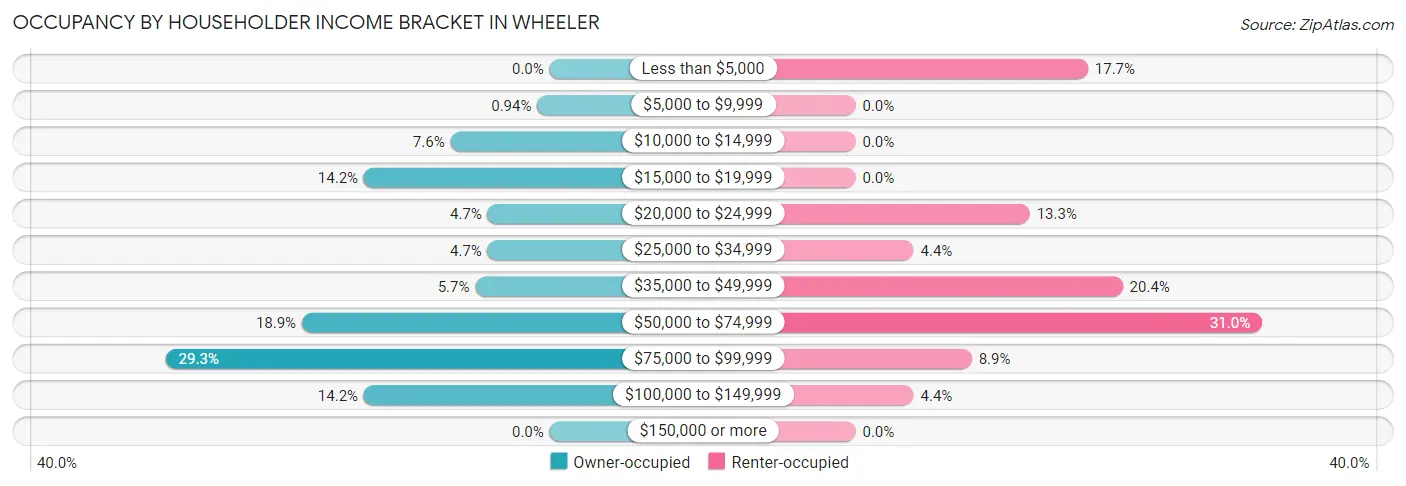
| Income Bracket | Owner-occupied | Renter-occupied |
| Less than $5,000 | 0 (0.0%) | 20 (17.7%) |
| $5,000 to $9,999 | 1 (0.9%) | 0 (0.0%) |
| $10,000 to $14,999 | 8 (7.5%) | 0 (0.0%) |
| $15,000 to $19,999 | 15 (14.1%) | 0 (0.0%) |
| $20,000 to $24,999 | 5 (4.7%) | 15 (13.3%) |
| $25,000 to $34,999 | 5 (4.7%) | 5 (4.4%) |
| $35,000 to $49,999 | 6 (5.7%) | 23 (20.3%) |
| $50,000 to $74,999 | 20 (18.9%) | 35 (31.0%) |
| $75,000 to $99,999 | 31 (29.2%) | 10 (8.8%) |
| $100,000 to $149,999 | 15 (14.1%) | 5 (4.4%) |
| $150,000 or more | 0 (0.0%) | 0 (0.0%) |
| Total | 106 (100.0%) | 113 (100.0%) |
Monthly Housing Cost Tiers in Wheeler
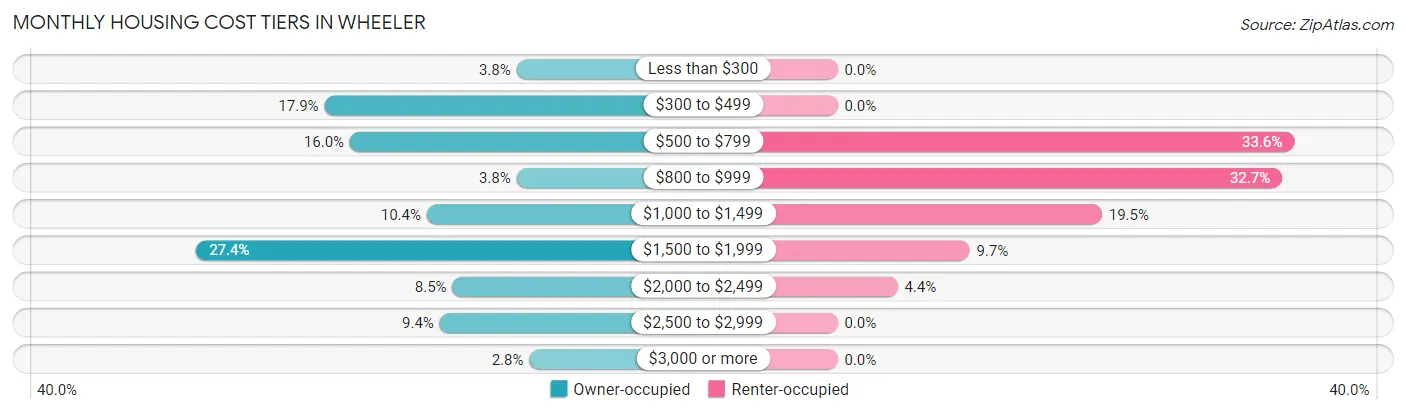
| Monthly Cost | Owner-occupied | Renter-occupied |
| Less than $300 | 4 (3.8%) | 0 (0.0%) |
| $300 to $499 | 19 (17.9%) | 0 (0.0%) |
| $500 to $799 | 17 (16.0%) | 38 (33.6%) |
| $800 to $999 | 4 (3.8%) | 37 (32.7%) |
| $1,000 to $1,499 | 11 (10.4%) | 22 (19.5%) |
| $1,500 to $1,999 | 29 (27.4%) | 11 (9.7%) |
| $2,000 to $2,499 | 9 (8.5%) | 5 (4.4%) |
| $2,500 to $2,999 | 10 (9.4%) | 0 (0.0%) |
| $3,000 or more | 3 (2.8%) | 0 (0.0%) |
| Total | 106 (100.0%) | 113 (100.0%) |
Physical Housing Characteristics in Wheeler
Housing Structures in Wheeler
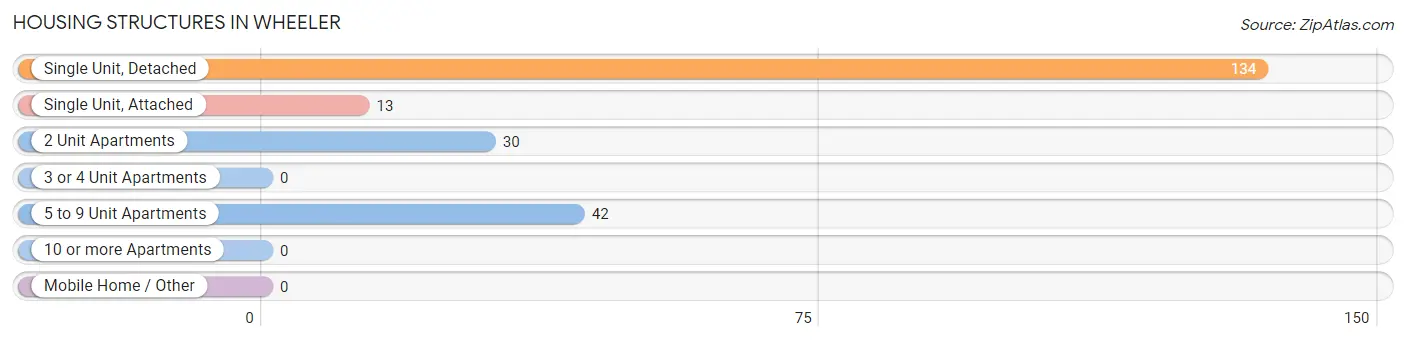
| Structure Type | # Housing Units | % Housing Units |
| Single Unit, Detached | 134 | 61.2% |
| Single Unit, Attached | 13 | 5.9% |
| 2 Unit Apartments | 30 | 13.7% |
| 3 or 4 Unit Apartments | 0 | 0.0% |
| 5 to 9 Unit Apartments | 42 | 19.2% |
| 10 or more Apartments | 0 | 0.0% |
| Mobile Home / Other | 0 | 0.0% |
| Total | 219 | 100.0% |
Housing Structures by Occupancy in Wheeler
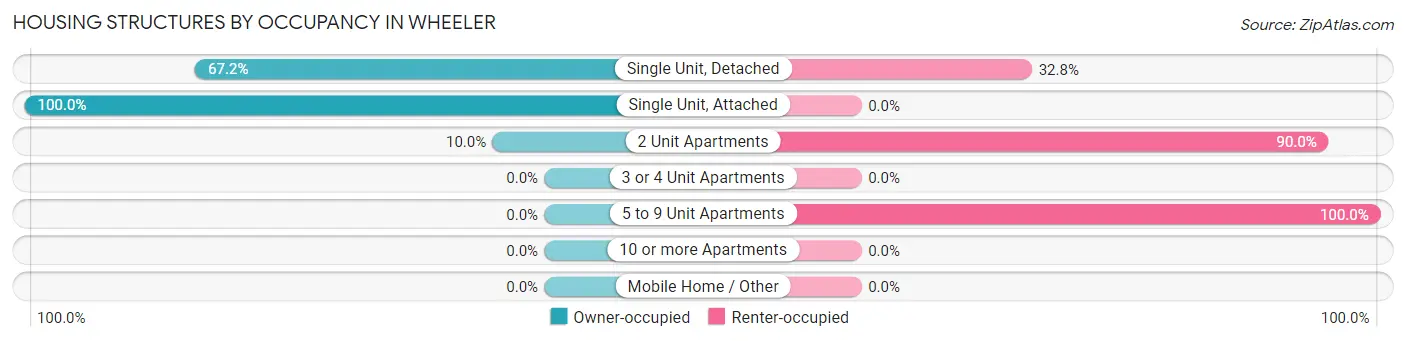
| Structure Type | Owner-occupied | Renter-occupied |
| Single Unit, Detached | 90 (67.2%) | 44 (32.8%) |
| Single Unit, Attached | 13 (100.0%) | 0 (0.0%) |
| 2 Unit Apartments | 3 (10.0%) | 27 (90.0%) |
| 3 or 4 Unit Apartments | 0 (0.0%) | 0 (0.0%) |
| 5 to 9 Unit Apartments | 0 (0.0%) | 42 (100.0%) |
| 10 or more Apartments | 0 (0.0%) | 0 (0.0%) |
| Mobile Home / Other | 0 (0.0%) | 0 (0.0%) |
| Total | 106 (48.4%) | 113 (51.6%) |
Housing Structures by Number of Rooms in Wheeler
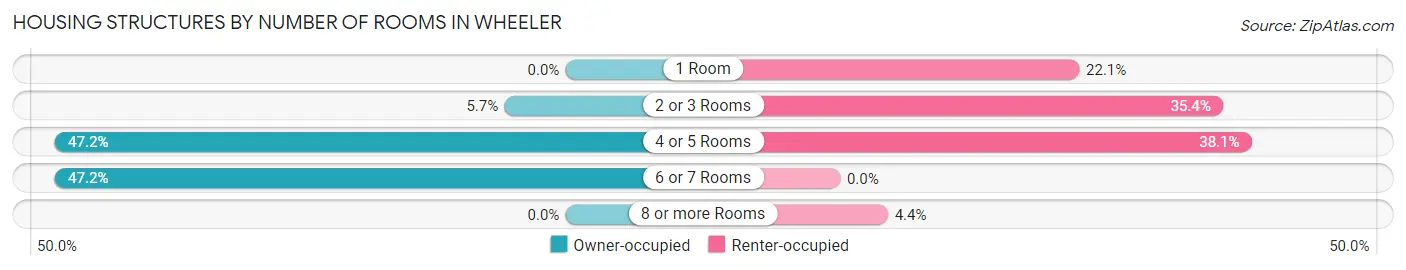
| Number of Rooms | Owner-occupied | Renter-occupied |
| 1 Room | 0 (0.0%) | 25 (22.1%) |
| 2 or 3 Rooms | 6 (5.7%) | 40 (35.4%) |
| 4 or 5 Rooms | 50 (47.2%) | 43 (38.1%) |
| 6 or 7 Rooms | 50 (47.2%) | 0 (0.0%) |
| 8 or more Rooms | 0 (0.0%) | 5 (4.4%) |
| Total | 106 (100.0%) | 113 (100.0%) |
Housing Structure by Heating Type in Wheeler
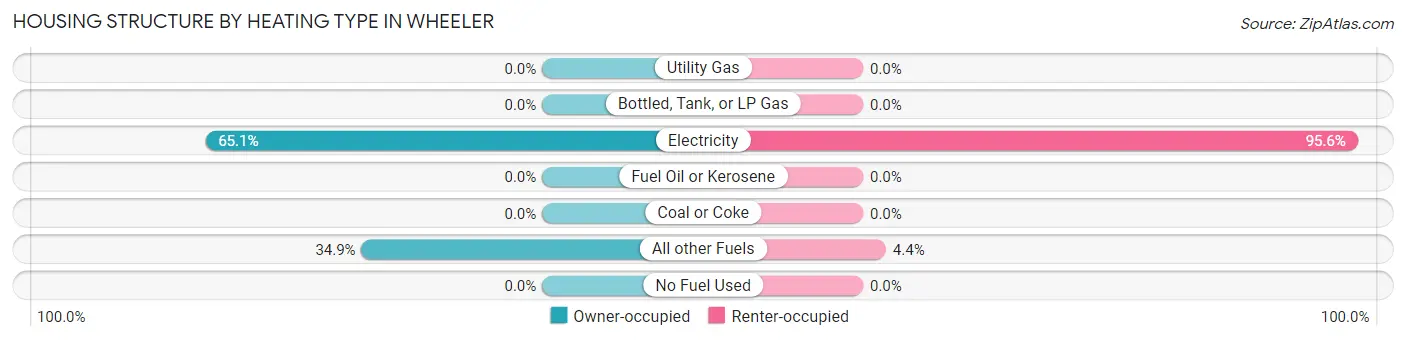
| Heating Type | Owner-occupied | Renter-occupied |
| Utility Gas | 0 (0.0%) | 0 (0.0%) |
| Bottled, Tank, or LP Gas | 0 (0.0%) | 0 (0.0%) |
| Electricity | 69 (65.1%) | 108 (95.6%) |
| Fuel Oil or Kerosene | 0 (0.0%) | 0 (0.0%) |
| Coal or Coke | 0 (0.0%) | 0 (0.0%) |
| All other Fuels | 37 (34.9%) | 5 (4.4%) |
| No Fuel Used | 0 (0.0%) | 0 (0.0%) |
| Total | 106 (100.0%) | 113 (100.0%) |
Household Vehicle Usage in Wheeler
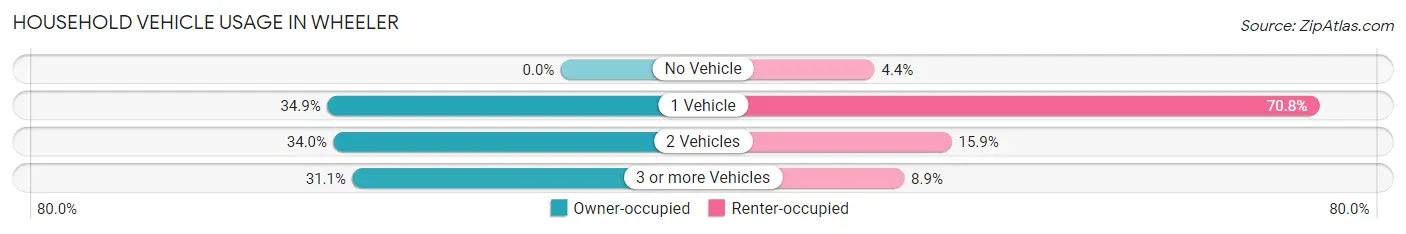
| Vehicles per Household | Owner-occupied | Renter-occupied |
| No Vehicle | 0 (0.0%) | 5 (4.4%) |
| 1 Vehicle | 37 (34.9%) | 80 (70.8%) |
| 2 Vehicles | 36 (34.0%) | 18 (15.9%) |
| 3 or more Vehicles | 33 (31.1%) | 10 (8.8%) |
| Total | 106 (100.0%) | 113 (100.0%) |
Real Estate & Mortgages in Wheeler
Real Estate and Mortgage Overview in Wheeler
| Characteristic | Without Mortgage | With Mortgage |
| Housing Units | 40 | 66 |
| Median Property Value | $368,800 | $345,800 |
| Median Household Income | $23,500 | $0 |
| Monthly Housing Costs | $463 | $3 |
| Real Estate Taxes | $2,167 | $0 |
Property Value by Mortgage Status in Wheeler
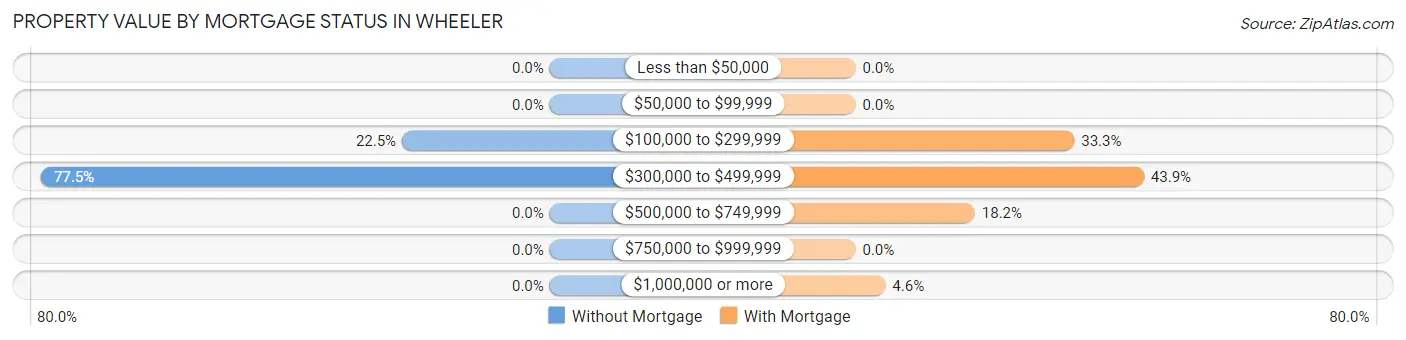
| Property Value | Without Mortgage | With Mortgage |
| Less than $50,000 | 0 (0.0%) | 0 (0.0%) |
| $50,000 to $99,999 | 0 (0.0%) | 0 (0.0%) |
| $100,000 to $299,999 | 9 (22.5%) | 22 (33.3%) |
| $300,000 to $499,999 | 31 (77.5%) | 29 (43.9%) |
| $500,000 to $749,999 | 0 (0.0%) | 12 (18.2%) |
| $750,000 to $999,999 | 0 (0.0%) | 0 (0.0%) |
| $1,000,000 or more | 0 (0.0%) | 3 (4.5%) |
| Total | 40 (100.0%) | 66 (100.0%) |
Household Income by Mortgage Status in Wheeler
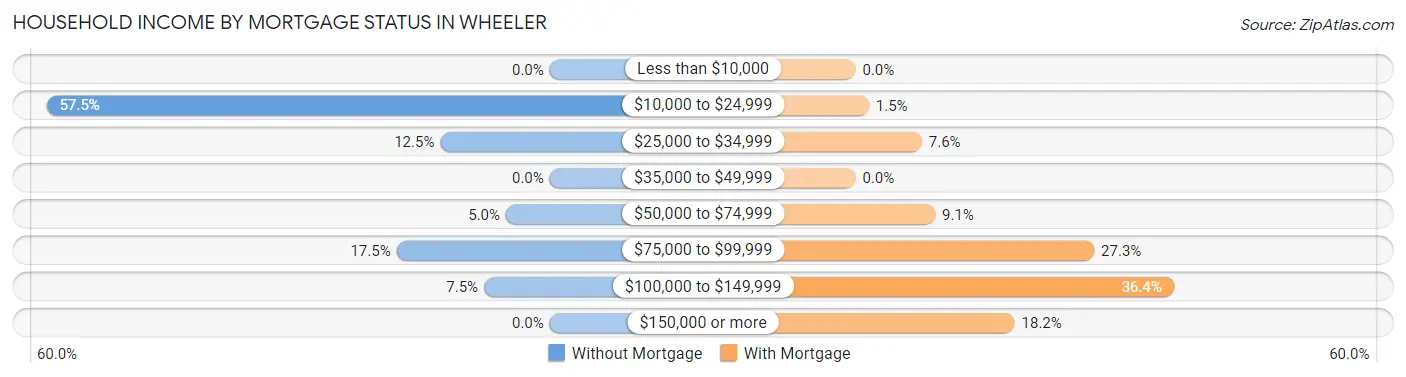
| Household Income | Without Mortgage | With Mortgage |
| Less than $10,000 | 0 (0.0%) | 0 (0.0%) |
| $10,000 to $24,999 | 23 (57.5%) | 1 (1.5%) |
| $25,000 to $34,999 | 5 (12.5%) | 5 (7.6%) |
| $35,000 to $49,999 | 0 (0.0%) | 0 (0.0%) |
| $50,000 to $74,999 | 2 (5.0%) | 6 (9.1%) |
| $75,000 to $99,999 | 7 (17.5%) | 18 (27.3%) |
| $100,000 to $149,999 | 3 (7.5%) | 24 (36.4%) |
| $150,000 or more | 0 (0.0%) | 12 (18.2%) |
| Total | 40 (100.0%) | 66 (100.0%) |
Property Value to Household Income Ratio in Wheeler
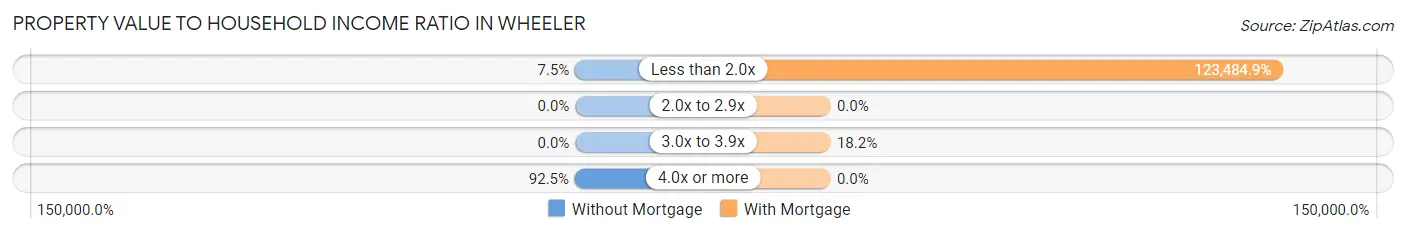
| Value-to-Income Ratio | Without Mortgage | With Mortgage |
| Less than 2.0x | 3 (7.5%) | 81,500 (123,484.9%) |
| 2.0x to 2.9x | 0 (0.0%) | 0 (0.0%) |
| 3.0x to 3.9x | 0 (0.0%) | 12 (18.2%) |
| 4.0x or more | 37 (92.5%) | 0 (0.0%) |
| Total | 40 (100.0%) | 66 (100.0%) |
Real Estate Taxes by Mortgage Status in Wheeler
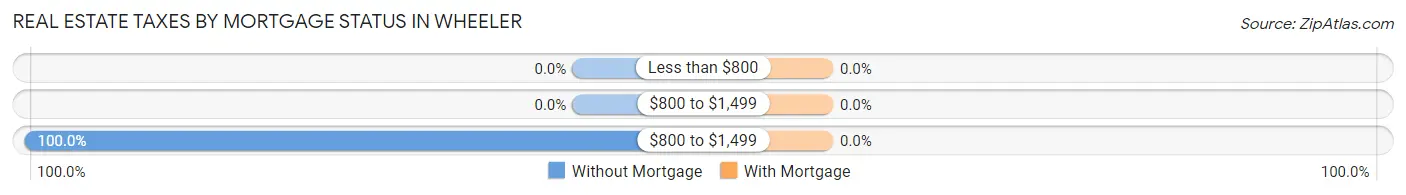
| Property Taxes | Without Mortgage | With Mortgage |
| Less than $800 | 0 (0.0%) | 0 (0.0%) |
| $800 to $1,499 | 0 (0.0%) | 0 (0.0%) |
| $800 to $1,499 | 40 (100.0%) | 0 (0.0%) |
| Total | 40 (100.0%) | 66 (100.0%) |
Health & Disability in Wheeler
Health Insurance Coverage by Age in Wheeler
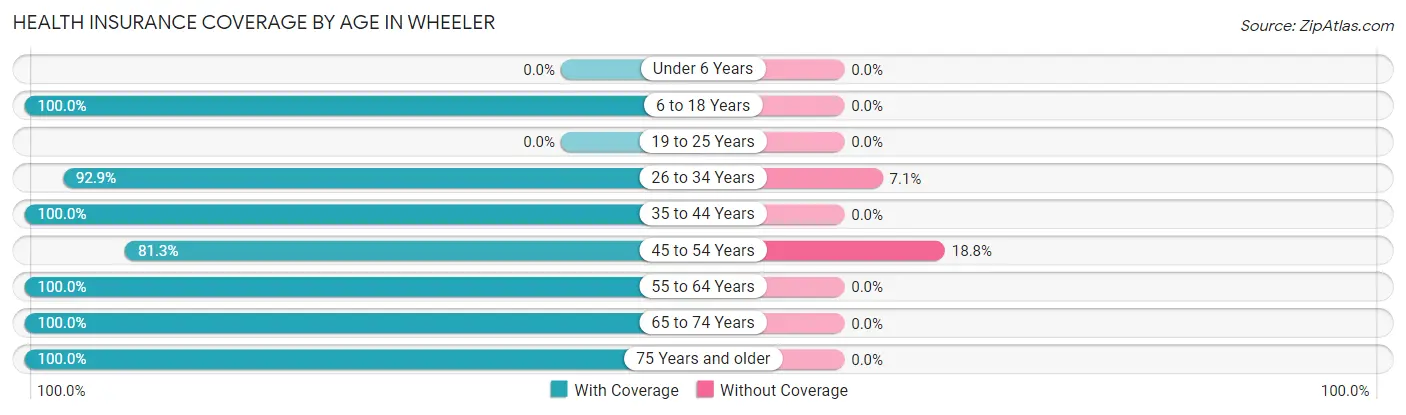
| Age Bracket | With Coverage | Without Coverage |
| Under 6 Years | 0 (0.0%) | 0 (0.0%) |
| 6 to 18 Years | 59 (100.0%) | 0 (0.0%) |
| 19 to 25 Years | 0 (0.0%) | 0 (0.0%) |
| 26 to 34 Years | 65 (92.9%) | 5 (7.1%) |
| 35 to 44 Years | 71 (100.0%) | 0 (0.0%) |
| 45 to 54 Years | 26 (81.2%) | 6 (18.8%) |
| 55 to 64 Years | 34 (100.0%) | 0 (0.0%) |
| 65 to 74 Years | 80 (100.0%) | 0 (0.0%) |
| 75 Years and older | 37 (100.0%) | 0 (0.0%) |
| Total | 372 (97.1%) | 11 (2.9%) |
Health Insurance Coverage by Citizenship Status in Wheeler
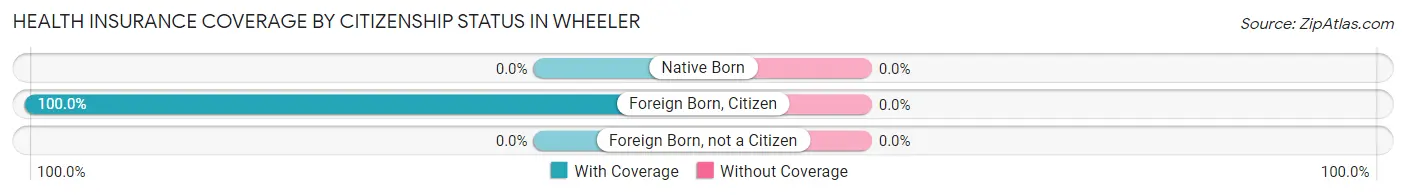
| Citizenship Status | With Coverage | Without Coverage |
| Native Born | 0 (0.0%) | 0 (0.0%) |
| Foreign Born, Citizen | 59 (100.0%) | 0 (0.0%) |
| Foreign Born, not a Citizen | 0 (0.0%) | 0 (0.0%) |
Health Insurance Coverage by Household Income in Wheeler
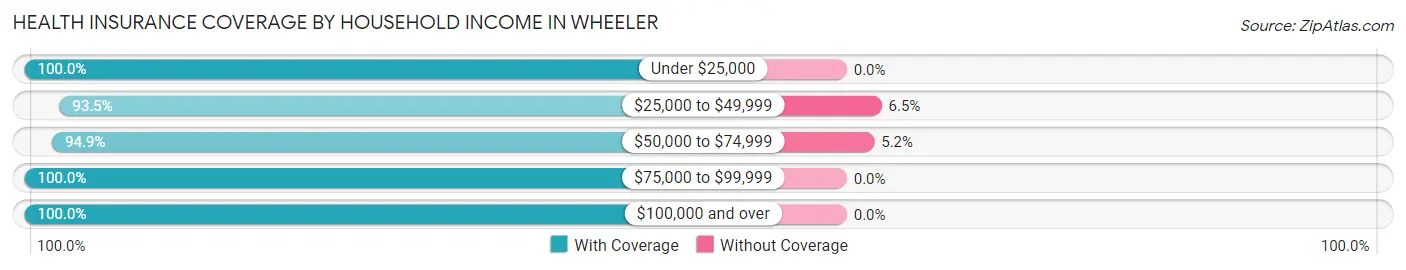
| Household Income | With Coverage | Without Coverage |
| Under $25,000 | 71 (100.0%) | 0 (0.0%) |
| $25,000 to $49,999 | 86 (93.5%) | 6 (6.5%) |
| $50,000 to $74,999 | 92 (94.9%) | 5 (5.1%) |
| $75,000 to $99,999 | 85 (100.0%) | 0 (0.0%) |
| $100,000 and over | 33 (100.0%) | 0 (0.0%) |
Public vs Private Health Insurance Coverage by Age in Wheeler
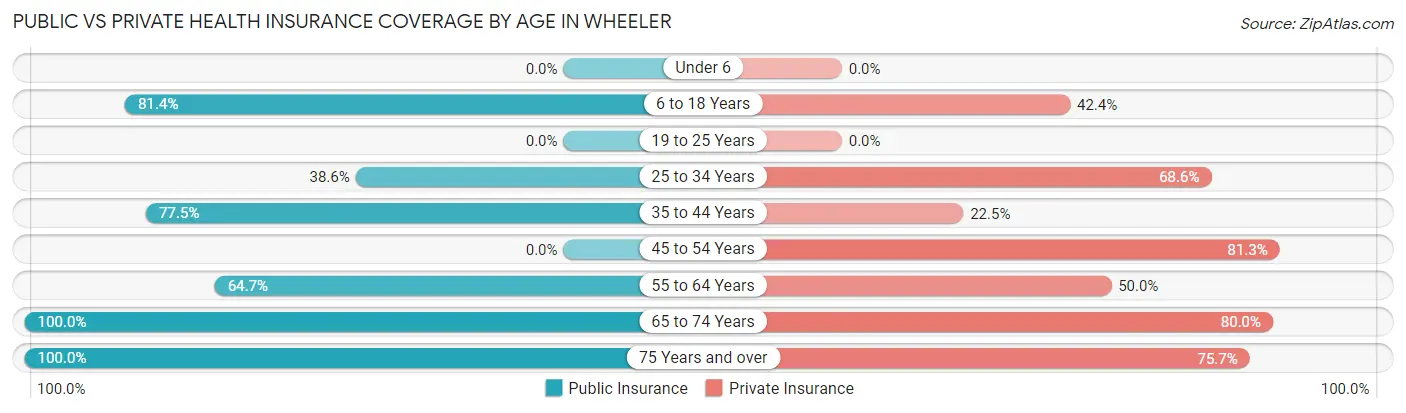
| Age Bracket | Public Insurance | Private Insurance |
| Under 6 | 0 (0.0%) | 0 (0.0%) |
| 6 to 18 Years | 48 (81.4%) | 25 (42.4%) |
| 19 to 25 Years | 0 (0.0%) | 0 (0.0%) |
| 25 to 34 Years | 27 (38.6%) | 48 (68.6%) |
| 35 to 44 Years | 55 (77.5%) | 16 (22.5%) |
| 45 to 54 Years | 0 (0.0%) | 26 (81.2%) |
| 55 to 64 Years | 22 (64.7%) | 17 (50.0%) |
| 65 to 74 Years | 80 (100.0%) | 64 (80.0%) |
| 75 Years and over | 37 (100.0%) | 28 (75.7%) |
| Total | 269 (70.2%) | 224 (58.5%) |
Disability Status by Sex by Age in Wheeler
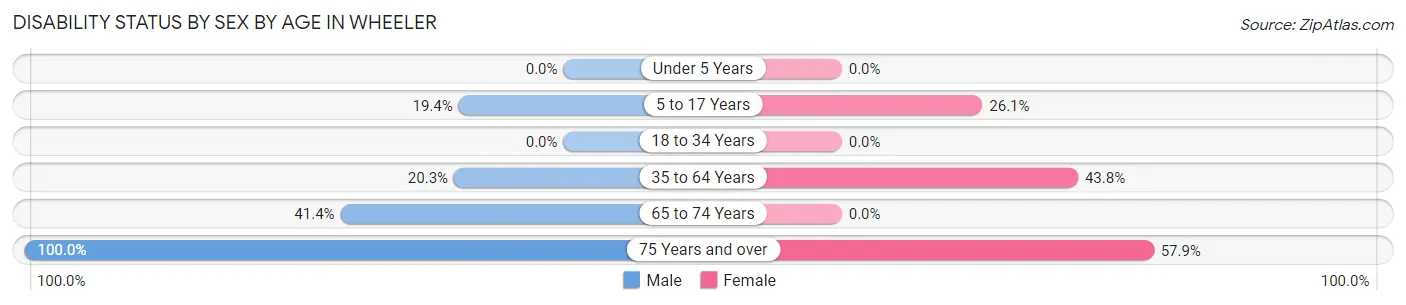
| Age Bracket | Male | Female |
| Under 5 Years | 0 (0.0%) | 0 (0.0%) |
| 5 to 17 Years | 7 (19.4%) | 6 (26.1%) |
| 18 to 34 Years | 0 (0.0%) | 0 (0.0%) |
| 35 to 64 Years | 13 (20.3%) | 32 (43.8%) |
| 65 to 74 Years | 12 (41.4%) | 0 (0.0%) |
| 75 Years and over | 18 (100.0%) | 11 (57.9%) |
Disability Class by Sex by Age in Wheeler
Disability Class: Hearing Difficulty
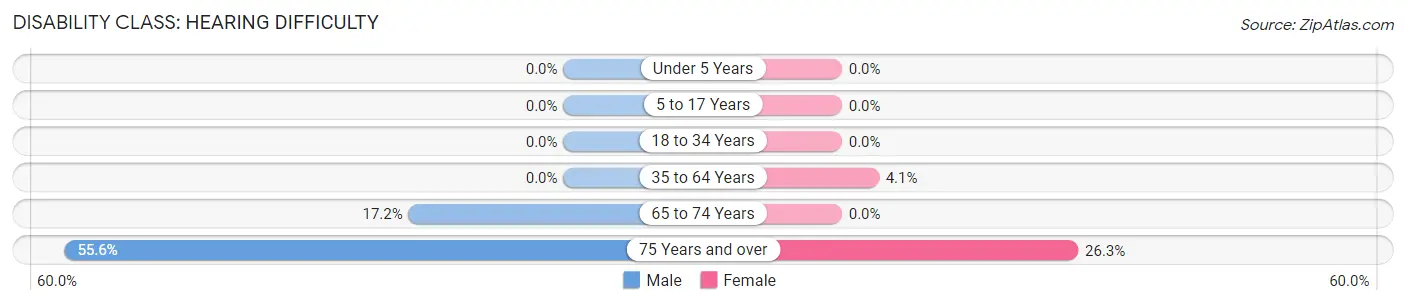
| Age Bracket | Male | Female |
| Under 5 Years | 0 (0.0%) | 0 (0.0%) |
| 5 to 17 Years | 0 (0.0%) | 0 (0.0%) |
| 18 to 34 Years | 0 (0.0%) | 0 (0.0%) |
| 35 to 64 Years | 0 (0.0%) | 3 (4.1%) |
| 65 to 74 Years | 5 (17.2%) | 0 (0.0%) |
| 75 Years and over | 10 (55.6%) | 5 (26.3%) |
Disability Class: Vision Difficulty
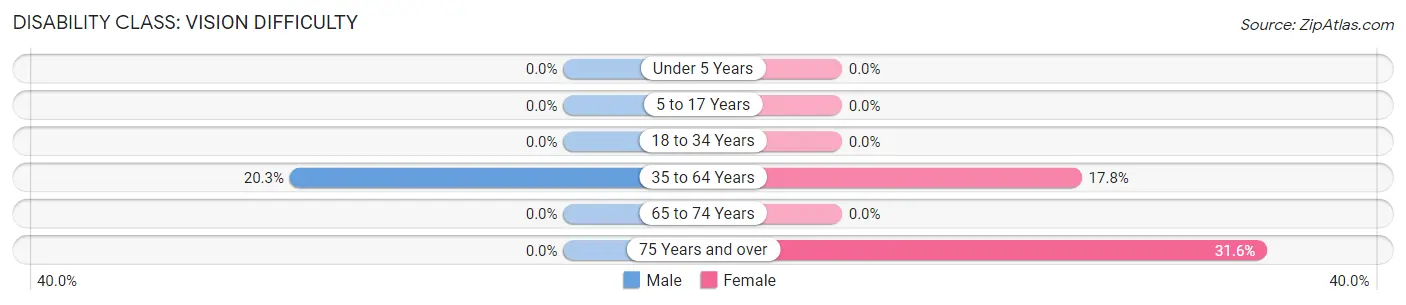
| Age Bracket | Male | Female |
| Under 5 Years | 0 (0.0%) | 0 (0.0%) |
| 5 to 17 Years | 0 (0.0%) | 0 (0.0%) |
| 18 to 34 Years | 0 (0.0%) | 0 (0.0%) |
| 35 to 64 Years | 13 (20.3%) | 13 (17.8%) |
| 65 to 74 Years | 0 (0.0%) | 0 (0.0%) |
| 75 Years and over | 0 (0.0%) | 6 (31.6%) |
Disability Class: Cognitive Difficulty
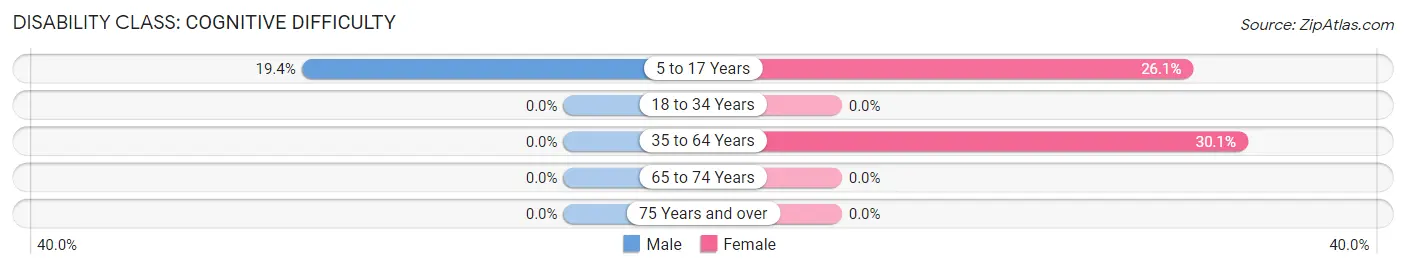
| Age Bracket | Male | Female |
| 5 to 17 Years | 7 (19.4%) | 6 (26.1%) |
| 18 to 34 Years | 0 (0.0%) | 0 (0.0%) |
| 35 to 64 Years | 0 (0.0%) | 22 (30.1%) |
| 65 to 74 Years | 0 (0.0%) | 0 (0.0%) |
| 75 Years and over | 0 (0.0%) | 0 (0.0%) |
Disability Class: Ambulatory Difficulty
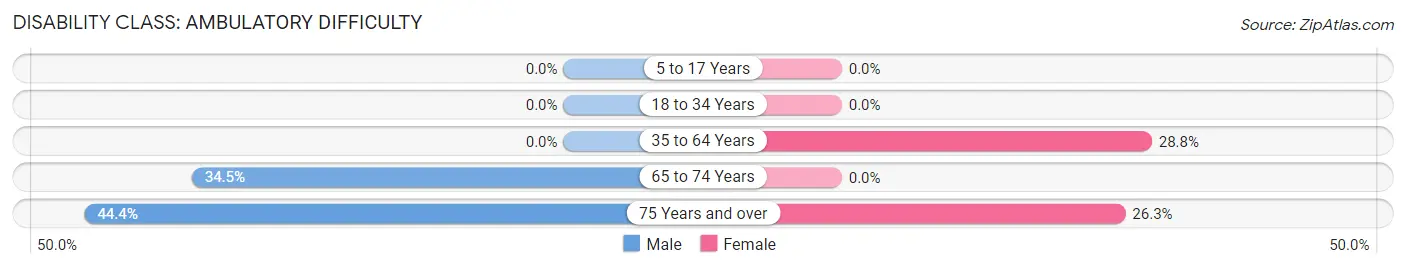
| Age Bracket | Male | Female |
| 5 to 17 Years | 0 (0.0%) | 0 (0.0%) |
| 18 to 34 Years | 0 (0.0%) | 0 (0.0%) |
| 35 to 64 Years | 0 (0.0%) | 21 (28.8%) |
| 65 to 74 Years | 10 (34.5%) | 0 (0.0%) |
| 75 Years and over | 8 (44.4%) | 5 (26.3%) |
Disability Class: Self-Care Difficulty
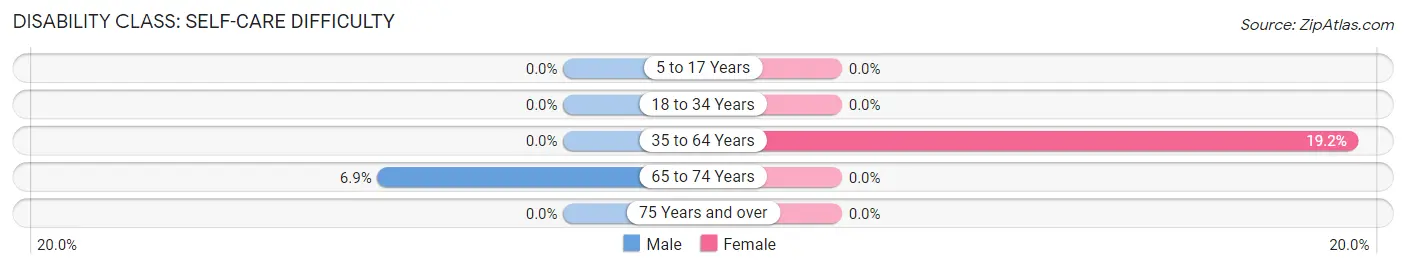
| Age Bracket | Male | Female |
| 5 to 17 Years | 0 (0.0%) | 0 (0.0%) |
| 18 to 34 Years | 0 (0.0%) | 0 (0.0%) |
| 35 to 64 Years | 0 (0.0%) | 14 (19.2%) |
| 65 to 74 Years | 2 (6.9%) | 0 (0.0%) |
| 75 Years and over | 0 (0.0%) | 0 (0.0%) |
Technology Access in Wheeler
Computing Device Access in Wheeler
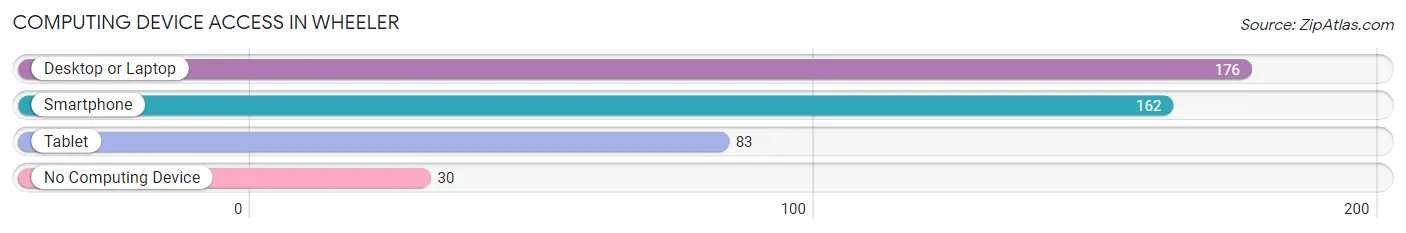
| Device Type | # Households | % Households |
| Desktop or Laptop | 176 | 80.4% |
| Smartphone | 162 | 74.0% |
| Tablet | 83 | 37.9% |
| No Computing Device | 30 | 13.7% |
| Total | 219 | 100.0% |
Internet Access in Wheeler
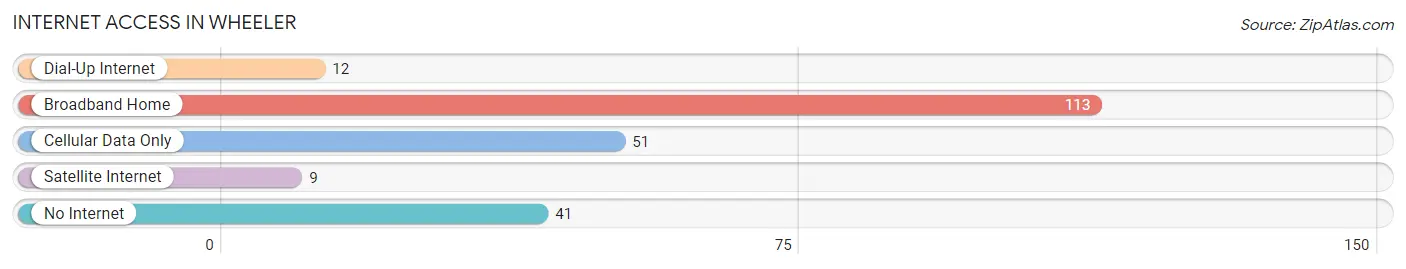
| Internet Type | # Households | % Households |
| Dial-Up Internet | 12 | 5.5% |
| Broadband Home | 113 | 51.6% |
| Cellular Data Only | 51 | 23.3% |
| Satellite Internet | 9 | 4.1% |
| No Internet | 41 | 18.7% |
| Total | 219 | 100.0% |
Wheeler Summary
Wheeler is a small city located in the state of Oregon, in the United States. It is situated in the northern part of the state, in the foothills of the Cascade Mountains. The city is located in Wheeler County, and is the county seat. The population of Wheeler was estimated to be 1,093 in 2019.
History
The area that is now Wheeler was first inhabited by Native American tribes, including the Kalapuya, Molalla, and Chinook. The first European settlers arrived in the area in the early 1800s, and the first permanent settlement was established in 1851. The settlement was named Wheeler, after the first postmaster, George Wheeler.
In 1854, the Oregon Territorial Legislature created Wheeler County, and Wheeler was designated as the county seat. The city was incorporated in 1891.
Geography
Wheeler is located in the northern part of Oregon, in the foothills of the Cascade Mountains. The city is situated at an elevation of 1,845 feet (562 meters). The city is located in Wheeler County, and is bordered by the cities of Fossil, Spray, and Mitchell.
The climate in Wheeler is generally mild, with warm summers and cool winters. The average annual temperature is around 50°F (10°C). The average annual precipitation is around 25 inches (63.5 cm).
Economy
The economy of Wheeler is largely based on agriculture and tourism. The city is home to several farms, which produce a variety of crops, including wheat, hay, and potatoes. The city is also home to several wineries, which produce a variety of wines.
Tourism is an important part of the economy of Wheeler. The city is home to several attractions, including the Wheeler County Museum, the Wheeler County Historical Society, and the Wheeler County Fairgrounds. The city is also home to several outdoor recreation areas, including the Deschutes National Forest and the John Day Fossil Beds National Monument.
Demographics
The population of Wheeler was estimated to be 1,093 in 2019. The racial makeup of the city is 94.3% White, 0.7% African American, 0.7% Native American, 0.7% Asian, 0.7% Pacific Islander, and 2.7% from other races. The median household income in Wheeler is $41,250, and the median age is 44.
Wheeler is a small city with a rich history and a vibrant economy. The city is home to several attractions, and is a popular destination for tourists. The city is also home to several farms and wineries, which provide a variety of products to the local economy. The population of Wheeler is diverse, and the city is a great place to live and work.
Common Questions
What is the Total Population of Wheeler?
Total Population of Wheeler is 429.
What is the Total Male Population of Wheeler?
Total Male Population of Wheeler is 174.
What is the Total Female Population of Wheeler?
Total Female Population of Wheeler is 255.
What is the Ratio of Males per 100 Females in Wheeler?
There are 68.24 Males per 100 Females in Wheeler.
What is the Ratio of Females per 100 Males in Wheeler?
There are 146.55 Females per 100 Males in Wheeler.
What is the Median Population Age in Wheeler?
Median Population Age in Wheeler is 49.5 Years.
What is the Average Family Size in Wheeler
Average Family Size in Wheeler is 2.5 People.
What is the Average Household Size in Wheeler
Average Household Size in Wheeler is 1.7 People.
What is Per Capita Income in Wheeler?
Per Capita income in Wheeler is $29,846.
What is the Median Family Income in Wheeler?
Median Family Income in Wheeler is $86,250.
What is the Median Household income in Wheeler?
Median Household Income in Wheeler is $53,750.
What is Income or Wage Gap in Wheeler?
Income or Wage Gap in Wheeler is 55.1%.
Women in Wheeler earn 44.9 cents for every dollar earned by a man.
What is Inequality or Gini Index in Wheeler?
Inequality or Gini Index in Wheeler is 0.37.
How Large is the Labor Force in Wheeler?
There are 169 People in the Labor Forcein in Wheeler.
What is the Percentage of People in the Labor Force in Wheeler?
44.4% of People are in the Labor Force in Wheeler.
What is the Unemployment Rate in Wheeler?
Unemployment Rate in Wheeler is 7.1%.