Boardman, OR
Boardman Map

Boardman Overview
3,830
TOTAL POPULATION
2,068
MALE POPULATION
1,762
FEMALE POPULATION
117.37
MALES / 100 FEMALES
85.20
FEMALES / 100 MALES
29.0
MEDIAN AGE
3.8
AVG FAMILY SIZE
3.4
AVG HOUSEHOLD SIZE
$21,888
PER CAPITA INCOME
$66,131
AVG FAMILY INCOME
$60,694
AVG HOUSEHOLD INCOME
0.2%
WAGE / INCOME GAP [ % ]
99.8¢/ $1
WAGE / INCOME GAP [ $ ]
0.39
INEQUALITY / GINI INDEX
1,803
LABOR FORCE [ PEOPLE ]
66.1%
PERCENT IN LABOR FORCE
1.8%
UNEMPLOYMENT RATE
Boardman Zip Codes
Boardman Area Codes
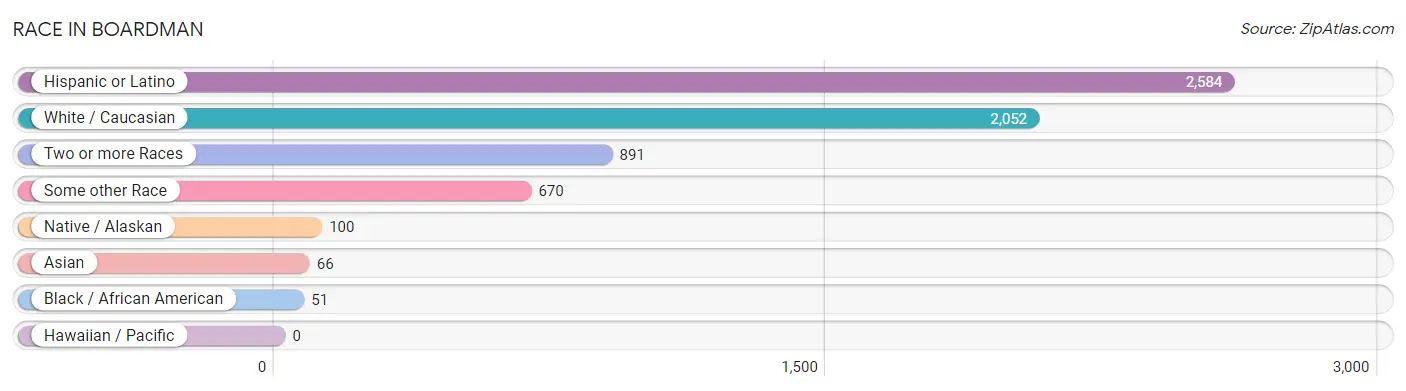
Race in Boardman
The most populous races in Boardman are Hispanic or Latino (2,584 | 67.5%), White / Caucasian (2,052 | 53.6%), and Two or more Races (891 | 23.3%).
| Race | # Population | % Population |
| Asian | 66 | 1.7% |
| Black / African American | 51 | 1.3% |
| Hawaiian / Pacific | 0 | 0.0% |
| Hispanic or Latino | 2,584 | 67.5% |
| Native / Alaskan | 100 | 2.6% |
| White / Caucasian | 2,052 | 53.6% |
| Two or more Races | 891 | 23.3% |
| Some other Race | 670 | 17.5% |
| Total | 3,830 | 100.0% |
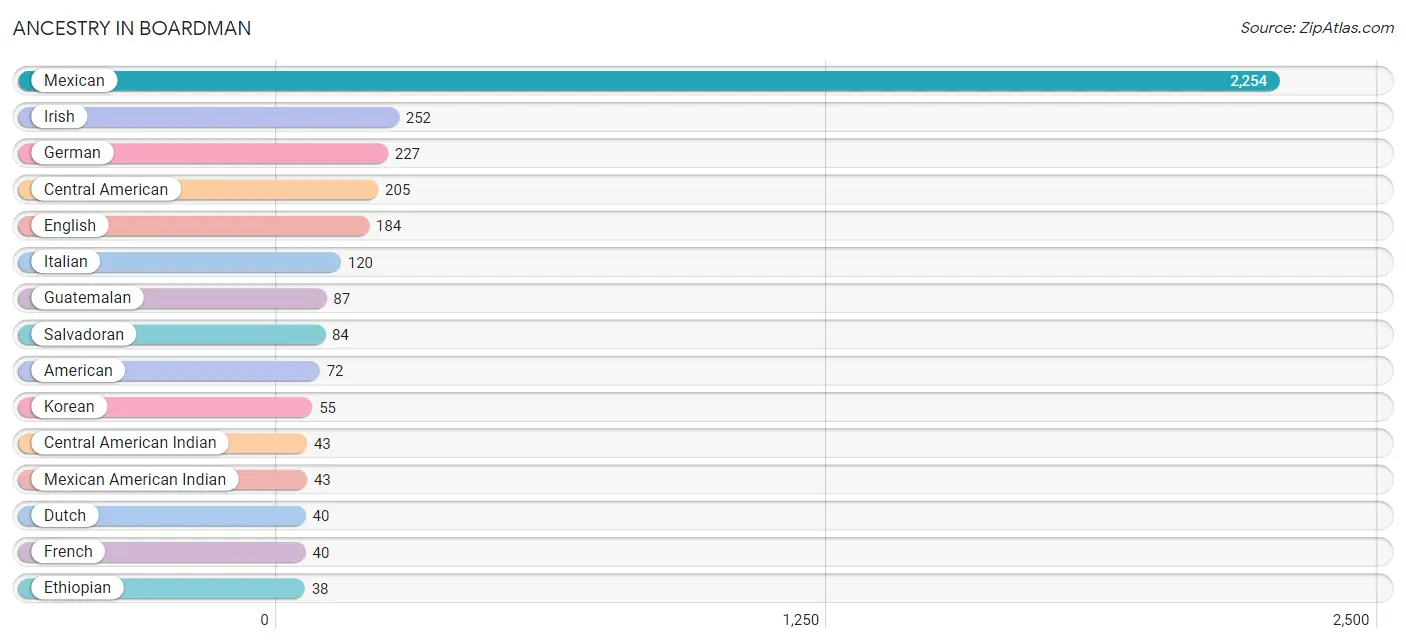
Ancestry in Boardman
The most populous ancestries reported in Boardman are Mexican (2,254 | 58.9%), Irish (252 | 6.6%), German (227 | 5.9%), Central American (205 | 5.3%), and English (184 | 4.8%), together accounting for 81.5% of all Boardman residents.
| Ancestry | # Population | % Population |
| American | 72 | 1.9% |
| British | 3 | 0.1% |
| Central American | 205 | 5.3% |
| Central American Indian | 43 | 1.1% |
| Czech | 28 | 0.7% |
| Danish | 9 | 0.2% |
| Dutch | 40 | 1.0% |
| English | 184 | 4.8% |
| Ethiopian | 38 | 1.0% |
| European | 22 | 0.6% |
| French | 40 | 1.0% |
| German | 227 | 5.9% |
| Guatemalan | 87 | 2.3% |
| Irish | 252 | 6.6% |
| Italian | 120 | 3.1% |
| Korean | 55 | 1.4% |
| Mexican | 2,254 | 58.9% |
| Mexican American Indian | 43 | 1.1% |
| Northern European | 3 | 0.1% |
| Norwegian | 31 | 0.8% |
| Panamanian | 34 | 0.9% |
| Peruvian | 3 | 0.1% |
| Portuguese | 36 | 0.9% |
| Puerto Rican | 35 | 0.9% |
| Salvadoran | 84 | 2.2% |
| Scandinavian | 35 | 0.9% |
| Scotch-Irish | 12 | 0.3% |
| Scottish | 30 | 0.8% |
| South American | 3 | 0.1% |
| South American Indian | 3 | 0.1% |
| Sri Lankan | 16 | 0.4% |
| Subsaharan African | 38 | 1.0% |
| Thai | 3 | 0.1% |
| Welsh | 10 | 0.3% | View All 34 Rows |
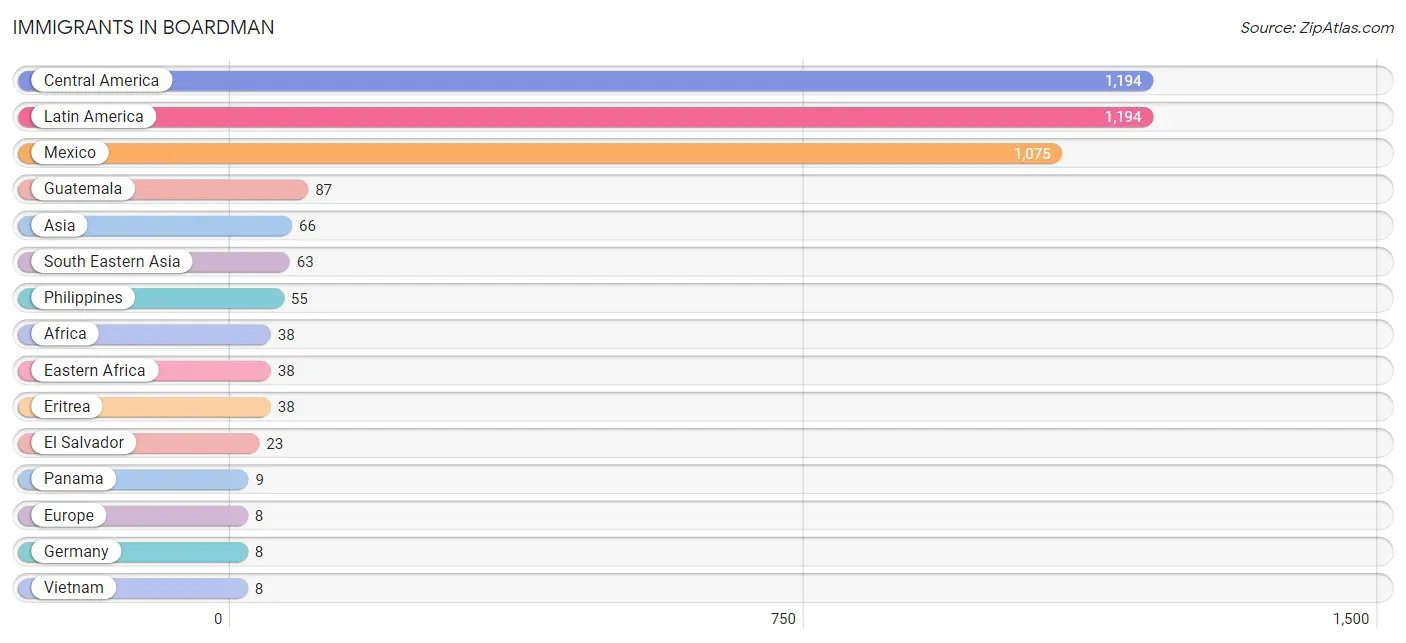
Immigrants in Boardman
The most numerous immigrant groups reported in Boardman came from Central America (1,194 | 31.2%), Latin America (1,194 | 31.2%), Mexico (1,075 | 28.1%), Guatemala (87 | 2.3%), and Asia (66 | 1.7%), together accounting for 94.4% of all Boardman residents.
| Immigration Origin | # Population | % Population |
| Africa | 38 | 1.0% |
| Asia | 66 | 1.7% |
| Central America | 1,194 | 31.2% |
| Eastern Africa | 38 | 1.0% |
| El Salvador | 23 | 0.6% |
| Eritrea | 38 | 1.0% |
| Europe | 8 | 0.2% |
| Germany | 8 | 0.2% |
| Guatemala | 87 | 2.3% |
| India | 3 | 0.1% |
| Latin America | 1,194 | 31.2% |
| Mexico | 1,075 | 28.1% |
| Panama | 9 | 0.2% |
| Philippines | 55 | 1.4% |
| South Central Asia | 3 | 0.1% |
| South Eastern Asia | 63 | 1.6% |
| Vietnam | 8 | 0.2% |
| Western Europe | 8 | 0.2% | View All 18 Rows |
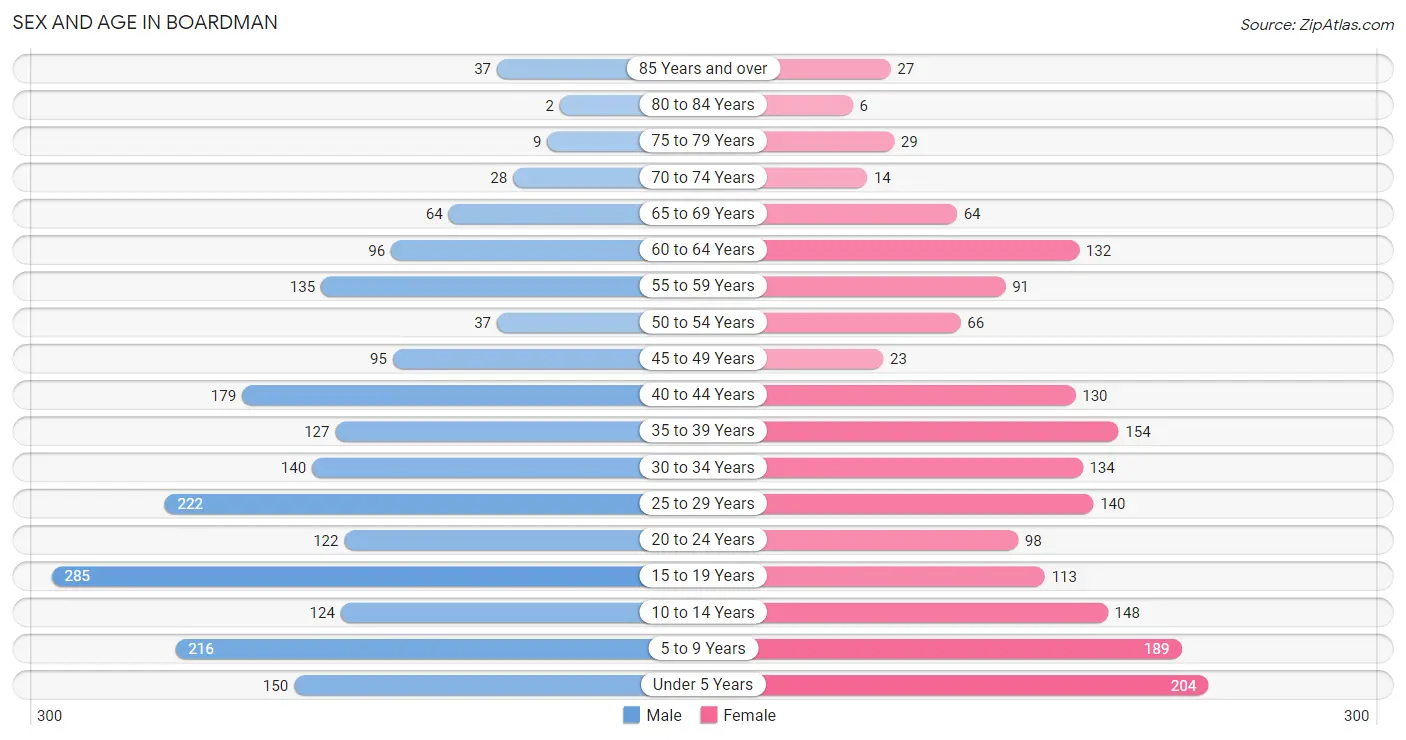
Sex and Age in Boardman
Sex and Age in Boardman
The most populous age groups in Boardman are 15 to 19 Years (285 | 13.8%) for men and Under 5 Years (204 | 11.6%) for women.
| Age Bracket | Male | Female |
| Under 5 Years | 150 (7.2%) | 204 (11.6%) |
| 5 to 9 Years | 216 (10.4%) | 189 (10.7%) |
| 10 to 14 Years | 124 (6.0%) | 148 (8.4%) |
| 15 to 19 Years | 285 (13.8%) | 113 (6.4%) |
| 20 to 24 Years | 122 (5.9%) | 98 (5.6%) |
| 25 to 29 Years | 222 (10.7%) | 140 (8.0%) |
| 30 to 34 Years | 140 (6.8%) | 134 (7.6%) |
| 35 to 39 Years | 127 (6.1%) | 154 (8.7%) |
| 40 to 44 Years | 179 (8.7%) | 130 (7.4%) |
| 45 to 49 Years | 95 (4.6%) | 23 (1.3%) |
| 50 to 54 Years | 37 (1.8%) | 66 (3.7%) |
| 55 to 59 Years | 135 (6.5%) | 91 (5.2%) |
| 60 to 64 Years | 96 (4.6%) | 132 (7.5%) |
| 65 to 69 Years | 64 (3.1%) | 64 (3.6%) |
| 70 to 74 Years | 28 (1.3%) | 14 (0.8%) |
| 75 to 79 Years | 9 (0.4%) | 29 (1.7%) |
| 80 to 84 Years | 2 (0.1%) | 6 (0.3%) |
| 85 Years and over | 37 (1.8%) | 27 (1.5%) |
| Total | 2,068 (100.0%) | 1,762 (100.0%) |
Families and Households in Boardman
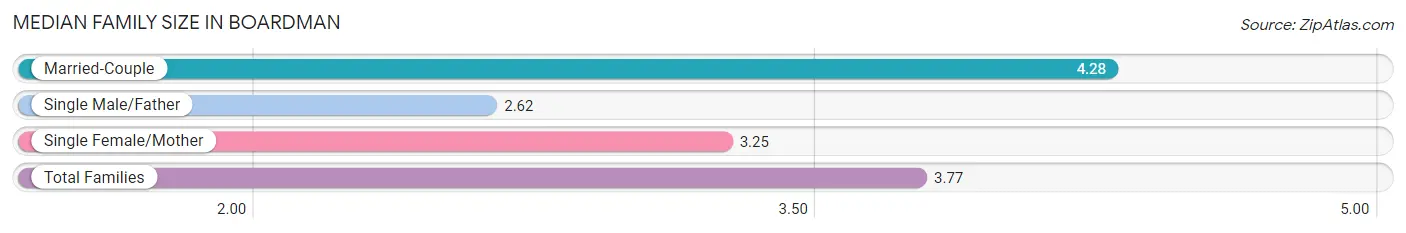
Median Family Size in Boardman
The median family size in Boardman is 3.77 persons per family, with married-couple families (532 | 59.3%) accounting for the largest median family size of 4.28 persons per family. On the other hand, single male/father families (130 | 14.5%) represent the smallest median family size with 2.62 persons per family.
| Family Type | # Families | Family Size |
| Married-Couple | 532 (59.3%) | 4.28 |
| Single Male/Father | 130 (14.5%) | 2.62 |
| Single Female/Mother | 235 (26.2%) | 3.25 |
| Total Families | 897 (100.0%) | 3.77 |
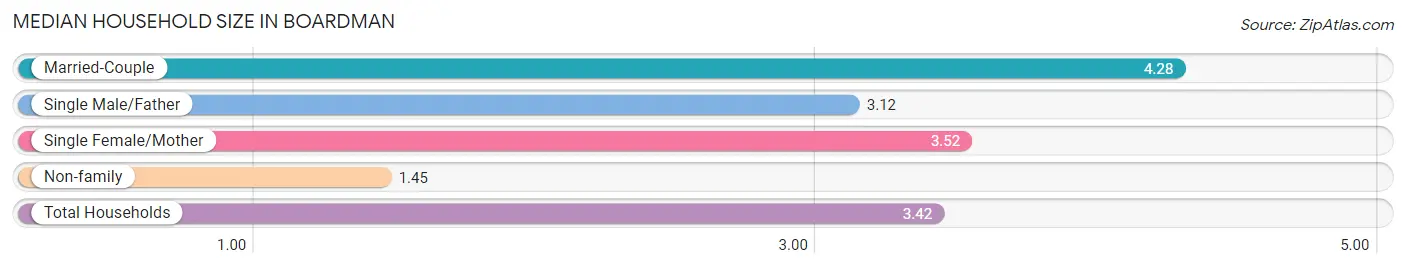
Median Household Size in Boardman
The median household size in Boardman is 3.42 persons per household, with married-couple households (532 | 47.5%) accounting for the largest median household size of 4.28 persons per household. non-family households (222 | 19.8%) represent the smallest median household size with 1.45 persons per household.
| Household Type | # Households | Household Size |
| Married-Couple | 532 (47.5%) | 4.28 |
| Single Male/Father | 130 (11.6%) | 3.12 |
| Single Female/Mother | 235 (21.0%) | 3.52 |
| Non-family | 222 (19.8%) | 1.45 |
| Total Households | 1,119 (100.0%) | 3.42 |
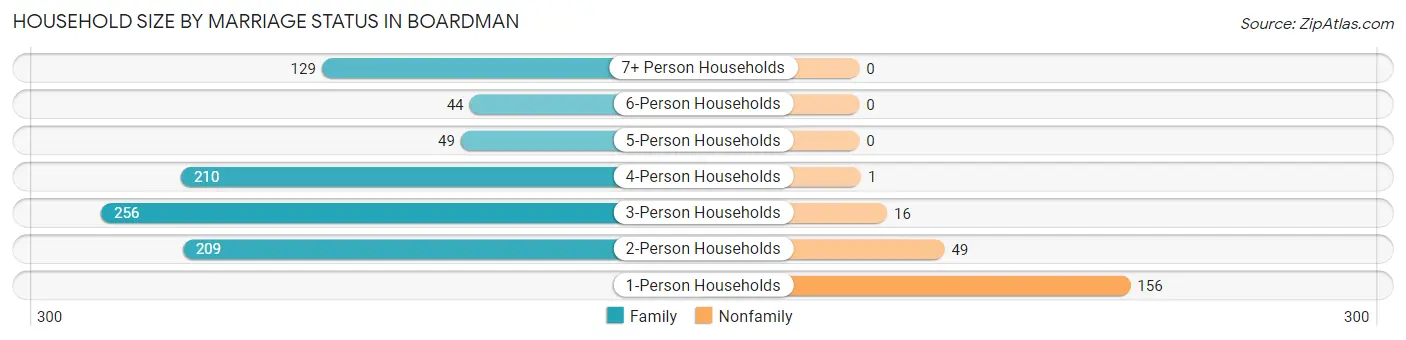
Household Size by Marriage Status in Boardman
Out of a total of 1,119 households in Boardman, 897 (80.2%) are family households, while 222 (19.8%) are nonfamily households. The most numerous type of family households are 3-person households, comprising 256, and the most common type of nonfamily households are 1-person households, comprising 156.
| Household Size | Family Households | Nonfamily Households |
| 1-Person Households | - | 156 (13.9%) |
| 2-Person Households | 209 (18.7%) | 49 (4.4%) |
| 3-Person Households | 256 (22.9%) | 16 (1.4%) |
| 4-Person Households | 210 (18.8%) | 1 (0.1%) |
| 5-Person Households | 49 (4.4%) | 0 (0.0%) |
| 6-Person Households | 44 (3.9%) | 0 (0.0%) |
| 7+ Person Households | 129 (11.5%) | 0 (0.0%) |
| Total | 897 (80.2%) | 222 (19.8%) |
Female Fertility in Boardman
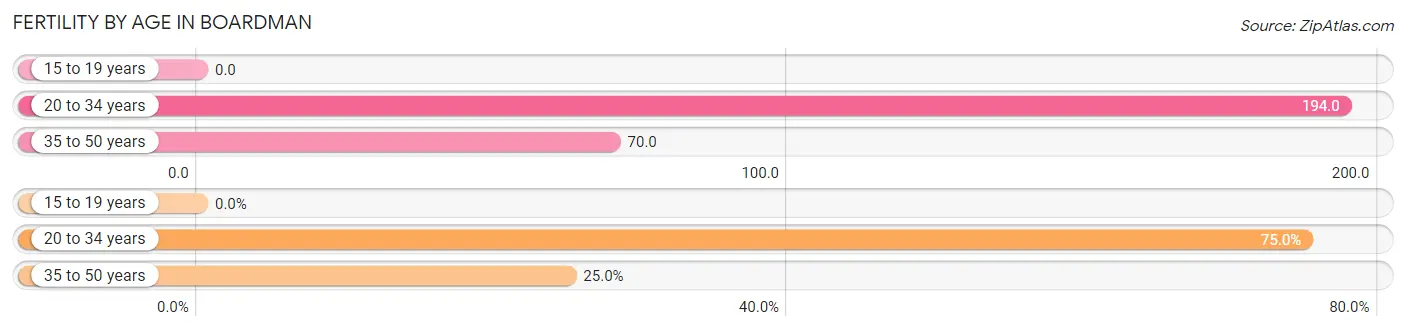
Fertility by Age in Boardman
Average fertility rate in Boardman is 116.0 births per 1,000 women. Women in the age bracket of 20 to 34 years have the highest fertility rate with 194.0 births per 1,000 women. Women in the age bracket of 20 to 34 years acount for 75.0% of all women with births.
| Age Bracket | Women with Births | Births / 1,000 Women |
| 15 to 19 years | 0 (0.0%) | 0.0 |
| 20 to 34 years | 72 (75.0%) | 194.0 |
| 35 to 50 years | 24 (25.0%) | 70.0 |
| Total | 96 (100.0%) | 116.0 |
Fertility by Age by Marriage Status in Boardman
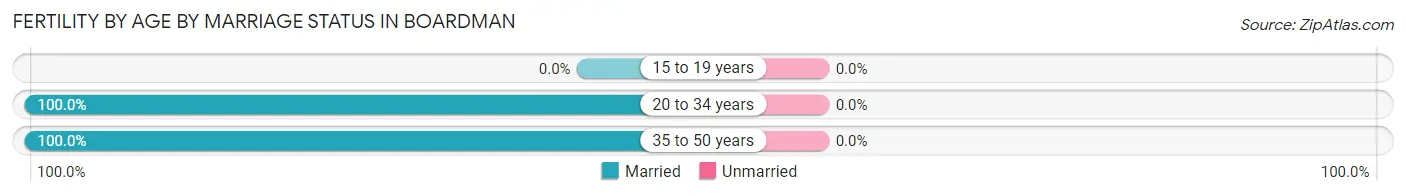
| Age Bracket | Married | Unmarried |
| 15 to 19 years | 0 (0.0%) | 0 (0.0%) |
| 20 to 34 years | 72 (100.0%) | 0 (0.0%) |
| 35 to 50 years | 24 (100.0%) | 0 (0.0%) |
| Total | 96 (100.0%) | 0 (0.0%) |
Fertility by Education in Boardman
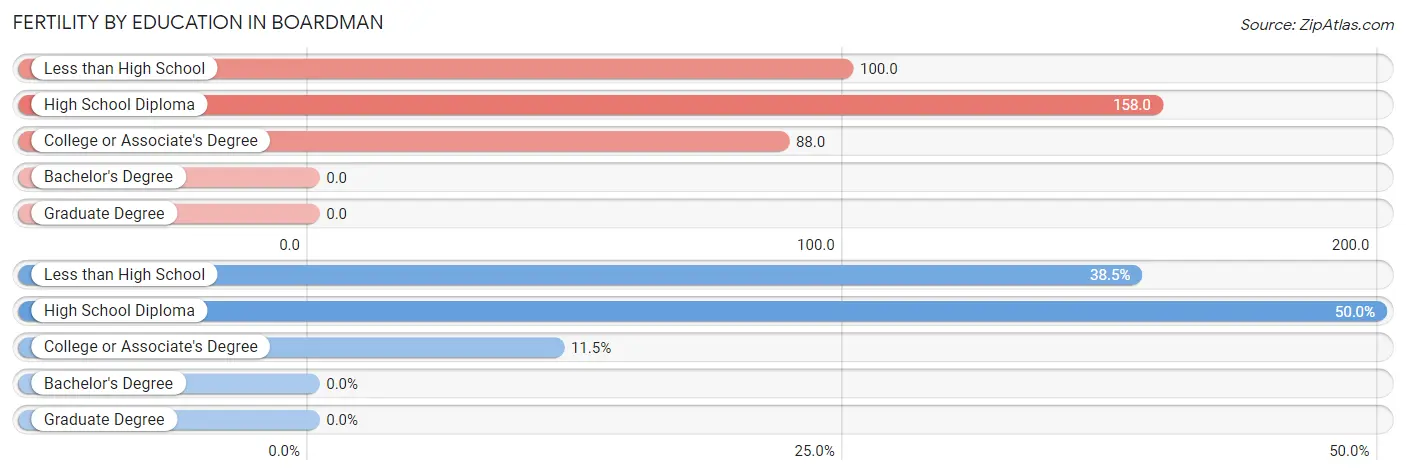
| Educational Attainment | Women with Births | Births / 1,000 Women |
| Less than High School | 37 (38.5%) | 100.0 |
| High School Diploma | 48 (50.0%) | 158.0 |
| College or Associate's Degree | 11 (11.5%) | 88.0 |
| Bachelor's Degree | 0 (0.0%) | 0.0 |
| Graduate Degree | 0 (0.0%) | 0.0 |
| Total | 96 (100.0%) | 116.0 |
Fertility by Education by Marriage Status in Boardman
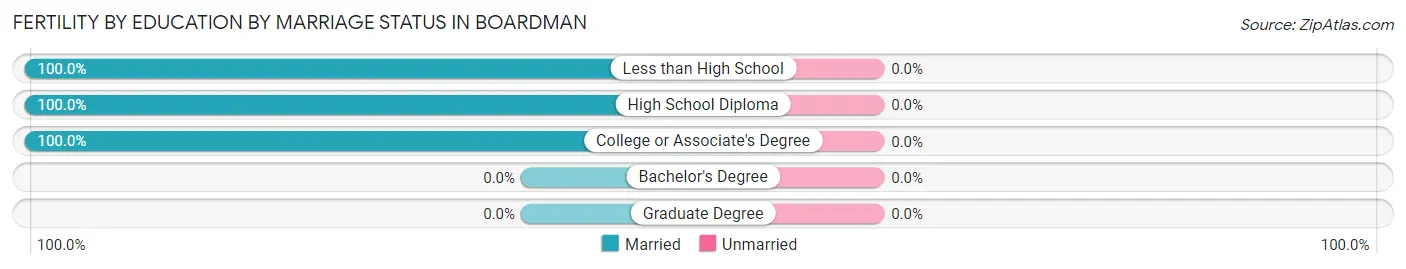
| Educational Attainment | Married | Unmarried |
| Less than High School | 37 (100.0%) | 0 (0.0%) |
| High School Diploma | 48 (100.0%) | 0 (0.0%) |
| College or Associate's Degree | 11 (100.0%) | 0 (0.0%) |
| Bachelor's Degree | 0 (0.0%) | 0 (0.0%) |
| Graduate Degree | 0 (0.0%) | 0 (0.0%) |
| Total | 96 (100.0%) | 0 (0.0%) |
Income in Boardman
Income Overview in Boardman
Per Capita Income in Boardman is $21,888, while median incomes of families and households are $66,131 and $60,694 respectively.
| Characteristic | Number | Measure |
| Per Capita Income | 3,830 | $21,888 |
| Median Family Income | 897 | $66,131 |
| Mean Family Income | 897 | $73,231 |
| Median Household Income | 1,119 | $60,694 |
| Mean Household Income | 1,119 | $69,522 |
| Income Deficit | 897 | $0 |
| Wage / Income Gap (%) | 3,830 | 0.24% |
| Wage / Income Gap ($) | 3,830 | 99.76¢ per $1 |
| Gini / Inequality Index | 3,830 | 0.39 |
Earnings by Sex in Boardman
Average Earnings in Boardman are $33,217, $33,269 for men and $33,189 for women, a difference of 0.2%.
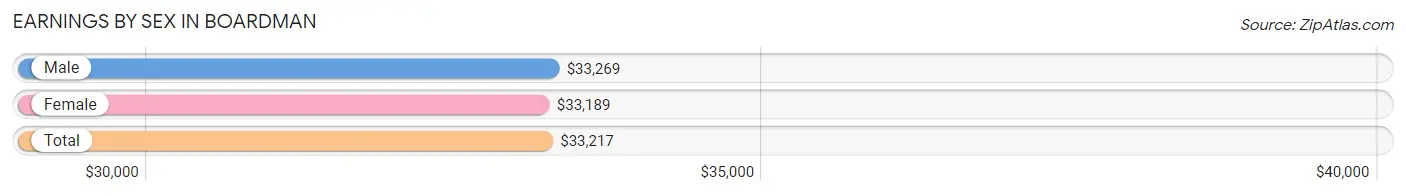
| Sex | Number | Average Earnings |
| Male | 1,162 (60.7%) | $33,269 |
| Female | 753 (39.3%) | $33,189 |
| Total | 1,915 (100.0%) | $33,217 |
Earnings by Sex by Income Bracket in Boardman
The most common earnings brackets in Boardman are $15,000 to $17,499 for men (137 | 11.8%) and $12,500 to $14,999 for women (68 | 9.0%).
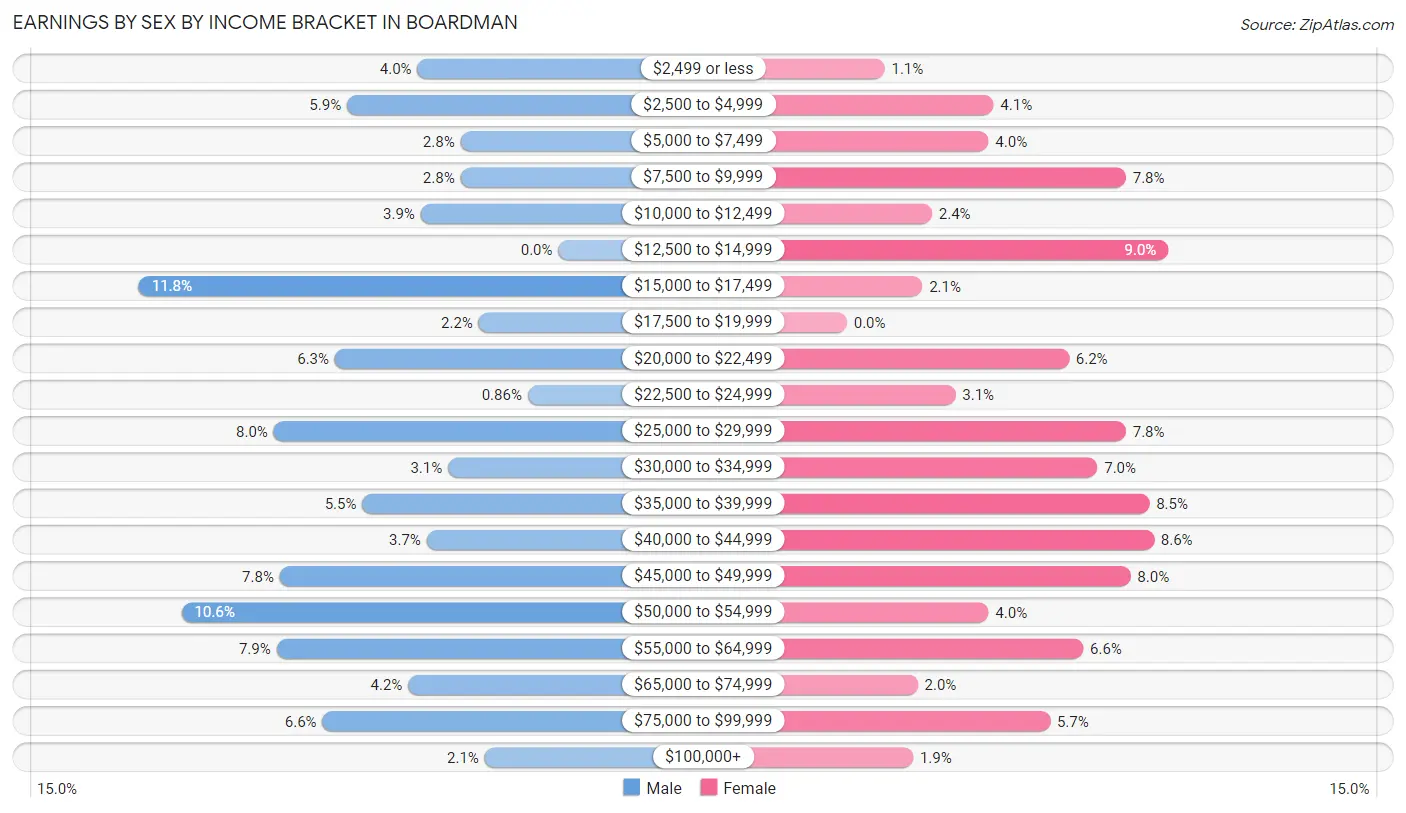
| Income | Male | Female |
| $2,499 or less | 46 (4.0%) | 8 (1.1%) |
| $2,500 to $4,999 | 69 (5.9%) | 31 (4.1%) |
| $5,000 to $7,499 | 32 (2.8%) | 30 (4.0%) |
| $7,500 to $9,999 | 32 (2.8%) | 59 (7.8%) |
| $10,000 to $12,499 | 45 (3.9%) | 18 (2.4%) |
| $12,500 to $14,999 | 0 (0.0%) | 68 (9.0%) |
| $15,000 to $17,499 | 137 (11.8%) | 16 (2.1%) |
| $17,500 to $19,999 | 26 (2.2%) | 0 (0.0%) |
| $20,000 to $22,499 | 73 (6.3%) | 47 (6.2%) |
| $22,500 to $24,999 | 10 (0.9%) | 23 (3.0%) |
| $25,000 to $29,999 | 93 (8.0%) | 59 (7.8%) |
| $30,000 to $34,999 | 36 (3.1%) | 53 (7.0%) |
| $35,000 to $39,999 | 64 (5.5%) | 64 (8.5%) |
| $40,000 to $44,999 | 43 (3.7%) | 65 (8.6%) |
| $45,000 to $49,999 | 91 (7.8%) | 60 (8.0%) |
| $50,000 to $54,999 | 123 (10.6%) | 30 (4.0%) |
| $55,000 to $64,999 | 92 (7.9%) | 50 (6.6%) |
| $65,000 to $74,999 | 49 (4.2%) | 15 (2.0%) |
| $75,000 to $99,999 | 77 (6.6%) | 43 (5.7%) |
| $100,000+ | 24 (2.1%) | 14 (1.9%) |
| Total | 1,162 (100.0%) | 753 (100.0%) |
Earnings by Sex by Educational Attainment in Boardman
Average earnings in Boardman are $40,719 for men and $34,005 for women, a difference of 16.5%. Men with an educational attainment of bachelor's degree enjoy the highest average annual earnings of $65,313, while those with college or associate's degree education earn the least with $35,096. Women with an educational attainment of graduate degree earn the most with the average annual earnings of $77,857, while those with high school diploma education have the smallest earnings of $24,402.
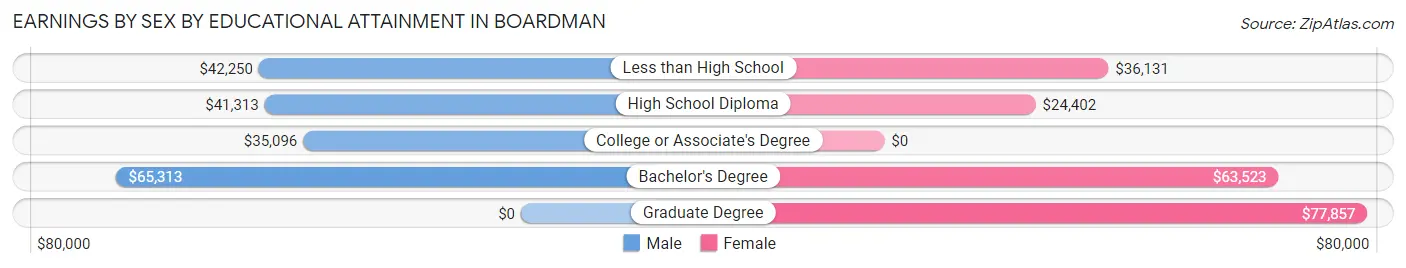
| Educational Attainment | Male Income | Female Income |
| Less than High School | $42,250 | $36,131 |
| High School Diploma | $41,313 | $24,402 |
| College or Associate's Degree | $35,096 | $0 |
| Bachelor's Degree | $65,313 | $63,523 |
| Graduate Degree | - | - |
| Total | $40,719 | $34,005 |
Family Income in Boardman
Family Income Brackets in Boardman
According to the Boardman family income data, there are 176 families falling into the $50,000 to $74,999 income range, which is the most common income bracket and makes up 19.6% of all families. Conversely, the $10,000 to $14,999 income bracket is the least frequent group with only 31 families (3.5%) belonging to this category.
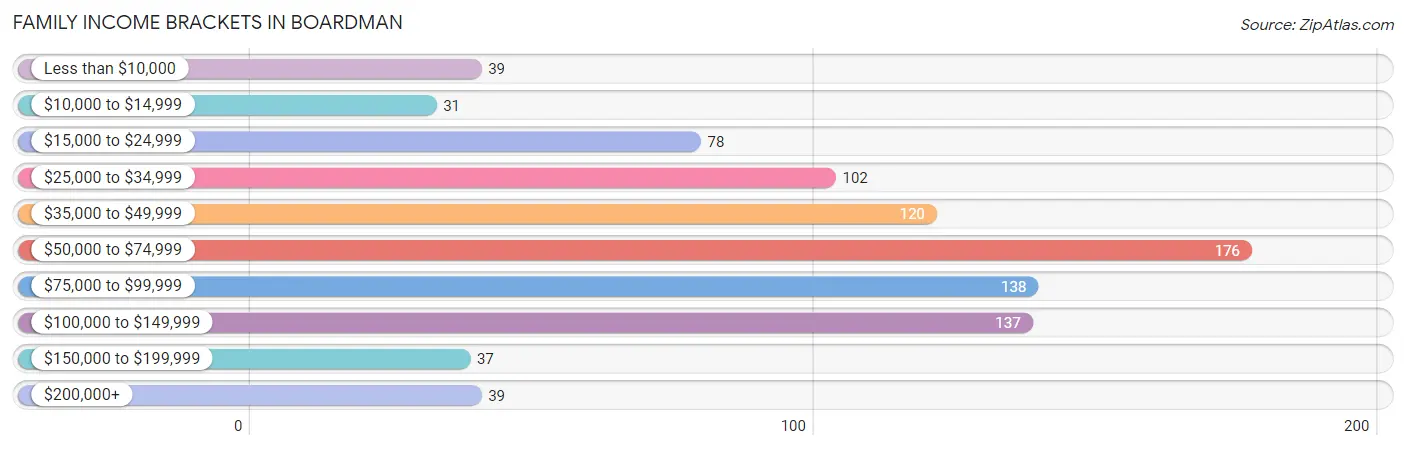
| Income Bracket | # Families | % Families |
| Less than $10,000 | 39 | 4.3% |
| $10,000 to $14,999 | 31 | 3.5% |
| $15,000 to $24,999 | 78 | 8.7% |
| $25,000 to $34,999 | 102 | 11.4% |
| $35,000 to $49,999 | 120 | 13.4% |
| $50,000 to $74,999 | 176 | 19.6% |
| $75,000 to $99,999 | 138 | 15.4% |
| $100,000 to $149,999 | 137 | 15.3% |
| $150,000 to $199,999 | 37 | 4.1% |
| $200,000+ | 39 | 4.3% |
Family Income by Famaliy Size in Boardman
5-person families (31 | 3.5%) account for the highest median family income in Boardman with $191,583 per family, while 5-person families (31 | 3.5%) have the highest median income of $38,317 per family member.
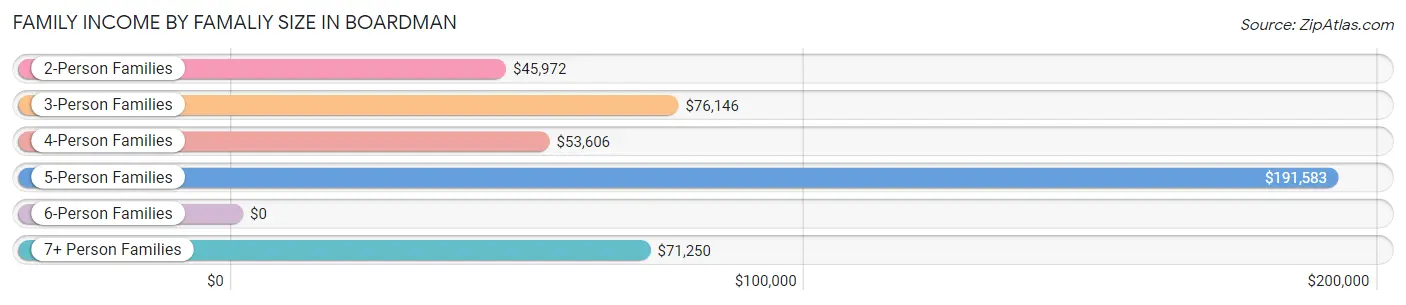
| Income Bracket | # Families | Median Income |
| 2-Person Families | 288 (32.1%) | $45,972 |
| 3-Person Families | 194 (21.6%) | $76,146 |
| 4-Person Families | 211 (23.5%) | $53,606 |
| 5-Person Families | 31 (3.5%) | $191,583 |
| 6-Person Families | 57 (6.4%) | $0 |
| 7+ Person Families | 116 (12.9%) | $71,250 |
| Total | 897 (100.0%) | $66,131 |
Family Income by Number of Earners in Boardman
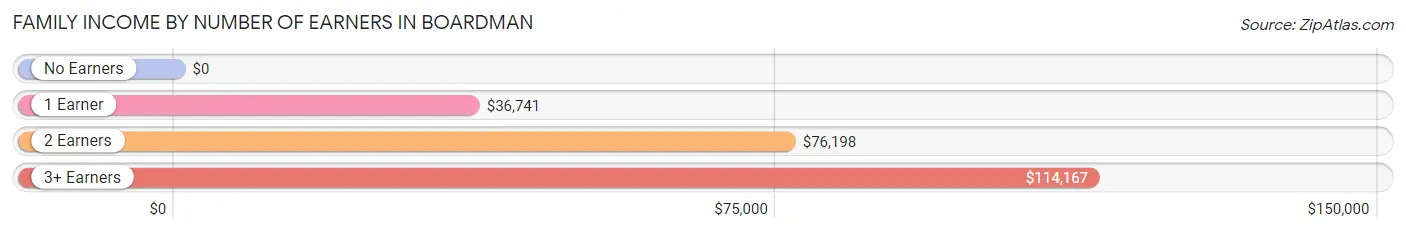
| Number of Earners | # Families | Median Income |
| No Earners | 71 (7.9%) | $0 |
| 1 Earner | 379 (42.2%) | $36,741 |
| 2 Earners | 321 (35.8%) | $76,198 |
| 3+ Earners | 126 (14.1%) | $114,167 |
| Total | 897 (100.0%) | $66,131 |
Household Income in Boardman
Household Income Brackets in Boardman
With 204 households falling in the category, the $50,000 to $74,999 income range is the most frequent in Boardman, accounting for 18.2% of all households. In contrast, only 4 households (0.4%) fall into the $10,000 to $14,999 income bracket, making it the least populous group.
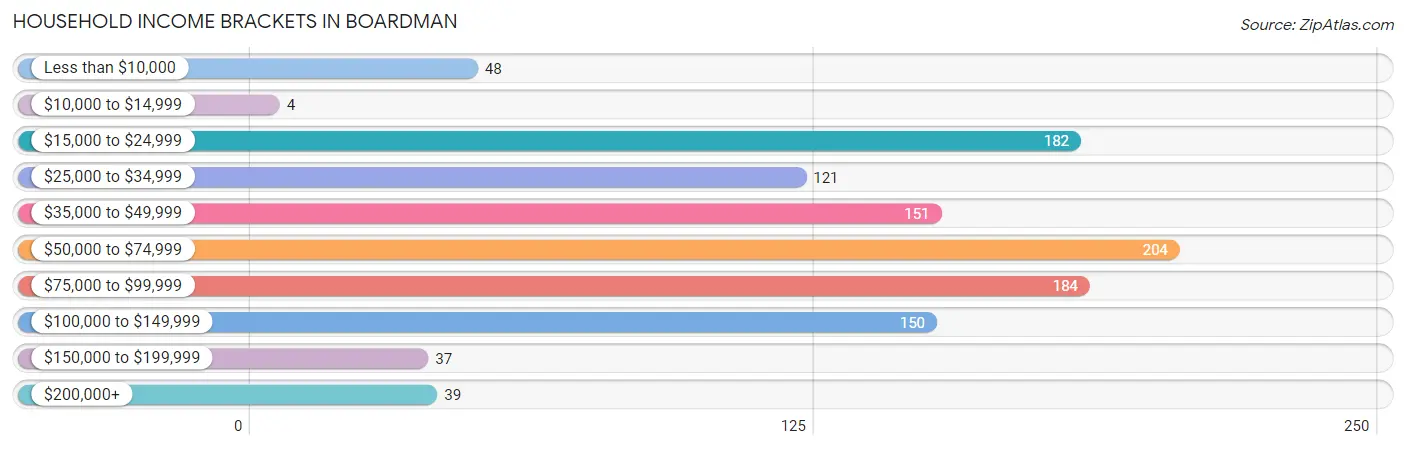
| Income Bracket | # Households | % Households |
| Less than $10,000 | 48 | 4.3% |
| $10,000 to $14,999 | 4 | 0.4% |
| $15,000 to $24,999 | 182 | 16.3% |
| $25,000 to $34,999 | 121 | 10.8% |
| $35,000 to $49,999 | 151 | 13.5% |
| $50,000 to $74,999 | 204 | 18.2% |
| $75,000 to $99,999 | 184 | 16.4% |
| $100,000 to $149,999 | 150 | 13.4% |
| $150,000 to $199,999 | 37 | 3.3% |
| $200,000+ | 39 | 3.5% |
Household Income by Householder Age in Boardman
The median household income in Boardman is $60,694, with the highest median household income of $93,164 found in the 65+ years age bracket for the primary householder. A total of 155 households (13.9%) fall into this category. Meanwhile, the 15 to 24 years age bracket for the primary householder has the lowest median household income of $0, with 51 households (4.6%) in this group.
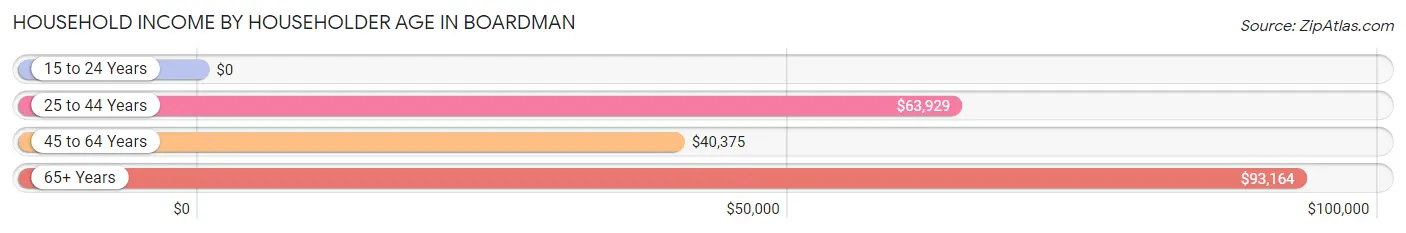
| Income Bracket | # Households | Median Income |
| 15 to 24 Years | 51 (4.6%) | $0 |
| 25 to 44 Years | 612 (54.7%) | $63,929 |
| 45 to 64 Years | 301 (26.9%) | $40,375 |
| 65+ Years | 155 (13.9%) | $93,164 |
| Total | 1,119 (100.0%) | $60,694 |
Poverty in Boardman
Income Below Poverty by Sex and Age in Boardman
With 22.4% poverty level for males and 19.1% for females among the residents of Boardman, 15 year old males and 35 to 44 year old females are the most vulnerable to poverty, with 48 males (77.4%) and 102 females (35.9%) in their respective age groups living below the poverty level.
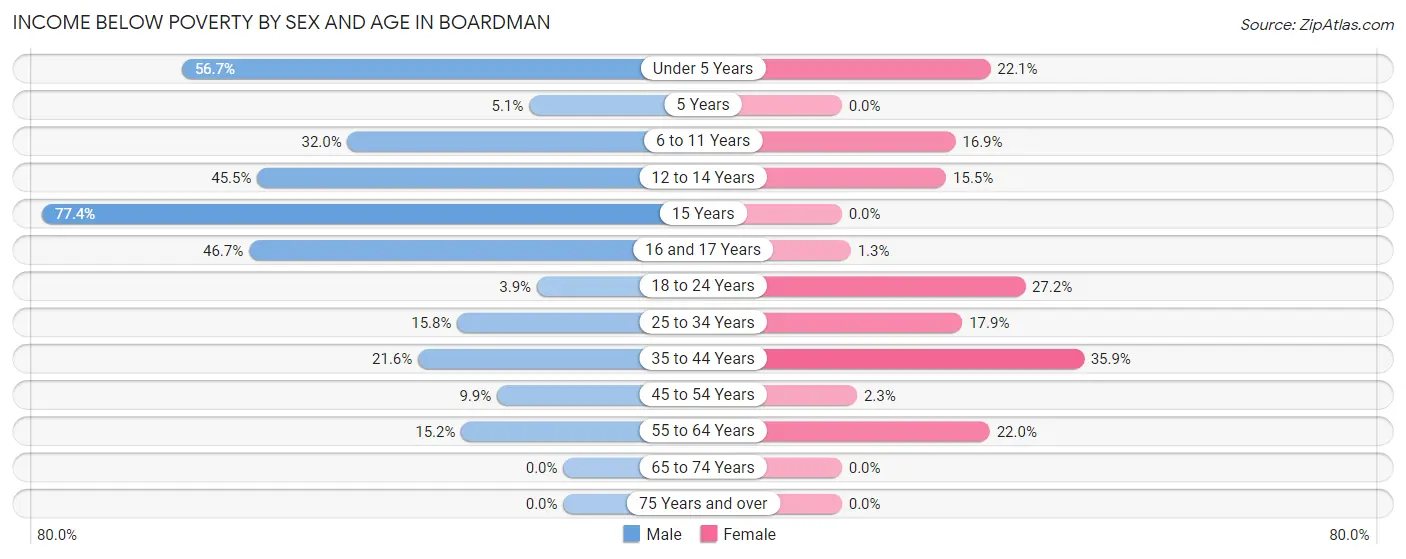
| Age Bracket | Male | Female |
| Under 5 Years | 85 (56.7%) | 45 (22.1%) |
| 5 Years | 3 (5.1%) | 0 (0.0%) |
| 6 to 11 Years | 58 (32.0%) | 44 (16.9%) |
| 12 to 14 Years | 45 (45.5%) | 11 (15.5%) |
| 15 Years | 48 (77.4%) | 0 (0.0%) |
| 16 and 17 Years | 42 (46.7%) | 1 (1.3%) |
| 18 to 24 Years | 10 (3.9%) | 34 (27.2%) |
| 25 to 34 Years | 57 (15.8%) | 49 (17.9%) |
| 35 to 44 Years | 66 (21.6%) | 102 (35.9%) |
| 45 to 54 Years | 13 (9.9%) | 2 (2.2%) |
| 55 to 64 Years | 35 (15.1%) | 49 (22.0%) |
| 65 to 74 Years | 0 (0.0%) | 0 (0.0%) |
| 75 Years and over | 0 (0.0%) | 0 (0.0%) |
| Total | 462 (22.4%) | 337 (19.1%) |
Income Above Poverty by Sex and Age in Boardman
According to the poverty statistics in Boardman, males aged 65 to 74 years and females aged 5 years are the age groups that are most secure financially, with 100.0% of males and 100.0% of females in these age groups living above the poverty line.
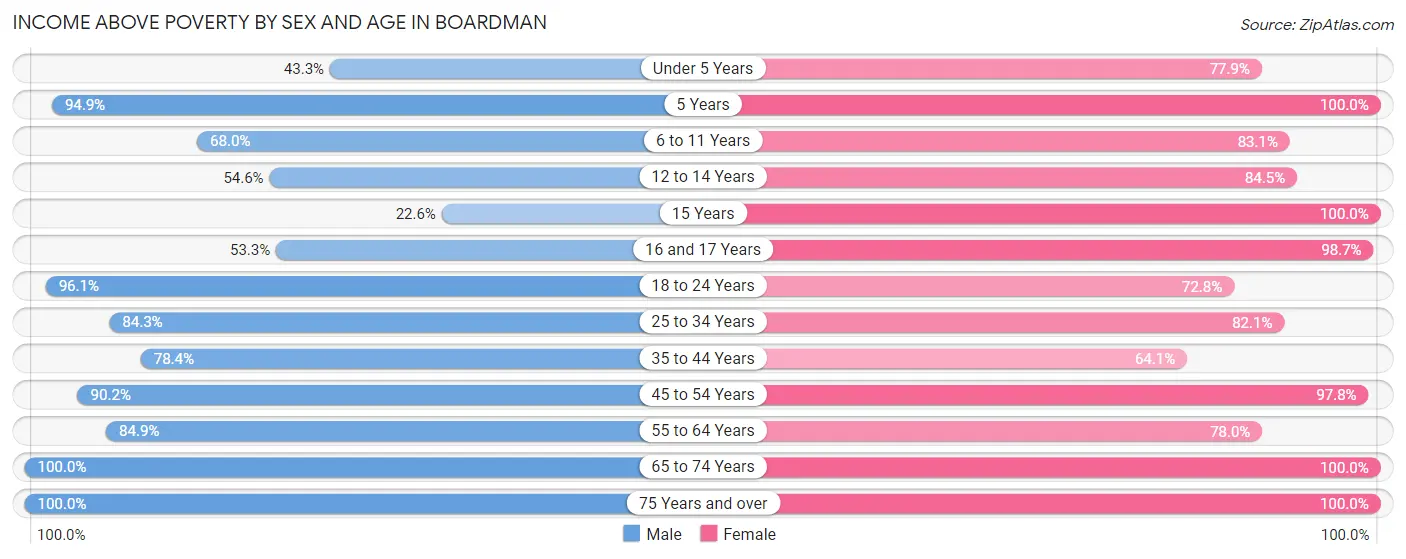
| Age Bracket | Male | Female |
| Under 5 Years | 65 (43.3%) | 159 (77.9%) |
| 5 Years | 56 (94.9%) | 5 (100.0%) |
| 6 to 11 Years | 123 (68.0%) | 217 (83.1%) |
| 12 to 14 Years | 54 (54.5%) | 60 (84.5%) |
| 15 Years | 14 (22.6%) | 10 (100.0%) |
| 16 and 17 Years | 48 (53.3%) | 75 (98.7%) |
| 18 to 24 Years | 245 (96.1%) | 91 (72.8%) |
| 25 to 34 Years | 305 (84.3%) | 225 (82.1%) |
| 35 to 44 Years | 240 (78.4%) | 182 (64.1%) |
| 45 to 54 Years | 119 (90.1%) | 87 (97.8%) |
| 55 to 64 Years | 196 (84.9%) | 174 (78.0%) |
| 65 to 74 Years | 92 (100.0%) | 78 (100.0%) |
| 75 Years and over | 48 (100.0%) | 62 (100.0%) |
| Total | 1,605 (77.6%) | 1,425 (80.9%) |
Income Below Poverty Among Married-Couple Families in Boardman
The poverty statistics for married-couple families in Boardman show that 5.1% or 27 of the total 532 families live below the poverty line. Families with 3 or 4 children have the highest poverty rate of 29.3%, comprising of 27 families. On the other hand, families with no children have the lowest poverty rate of 0.0%, which includes 0 families.
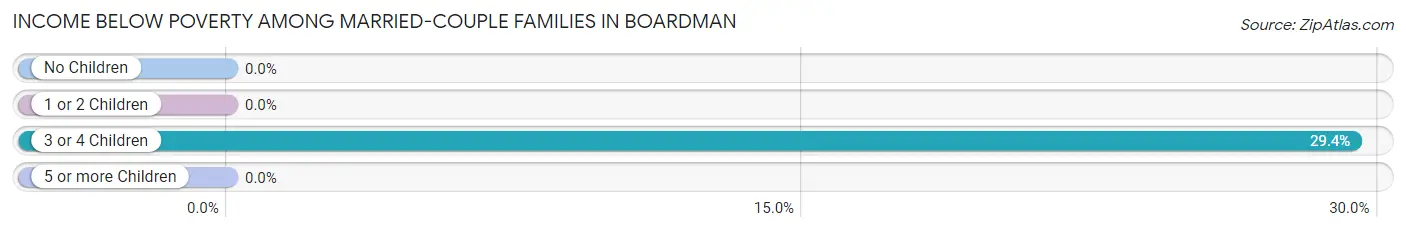
| Children | Above Poverty | Below Poverty |
| No Children | 161 (100.0%) | 0 (0.0%) |
| 1 or 2 Children | 207 (100.0%) | 0 (0.0%) |
| 3 or 4 Children | 65 (70.7%) | 27 (29.3%) |
| 5 or more Children | 72 (100.0%) | 0 (0.0%) |
| Total | 505 (94.9%) | 27 (5.1%) |
Income Below Poverty Among Single-Parent Households in Boardman
According to the poverty data in Boardman, 33.9% or 44 single-father households and 51.5% or 121 single-mother households are living below the poverty line. Among single-father households, those with 3 or 4 children have the highest poverty rate, with 22 households (100.0%) experiencing poverty. Likewise, among single-mother households, those with 3 or 4 children have the highest poverty rate, with 68 households (80.0%) falling below the poverty line.
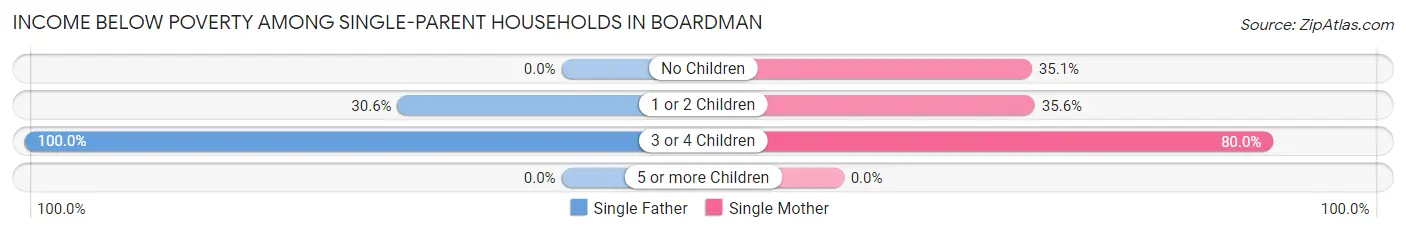
| Children | Single Father | Single Mother |
| No Children | 0 (0.0%) | 27 (35.1%) |
| 1 or 2 Children | 22 (30.6%) | 26 (35.6%) |
| 3 or 4 Children | 22 (100.0%) | 68 (80.0%) |
| 5 or more Children | 0 (0.0%) | 0 (0.0%) |
| Total | 44 (33.9%) | 121 (51.5%) |
Income Below Poverty Among Married-Couple vs Single-Parent Households in Boardman
The poverty data for Boardman shows that 27 of the married-couple family households (5.1%) and 165 of the single-parent households (45.2%) are living below the poverty level. Within the married-couple family households, those with 3 or 4 children have the highest poverty rate, with 27 households (29.3%) falling below the poverty line. Among the single-parent households, those with 3 or 4 children have the highest poverty rate, with 90 household (84.1%) living below poverty.
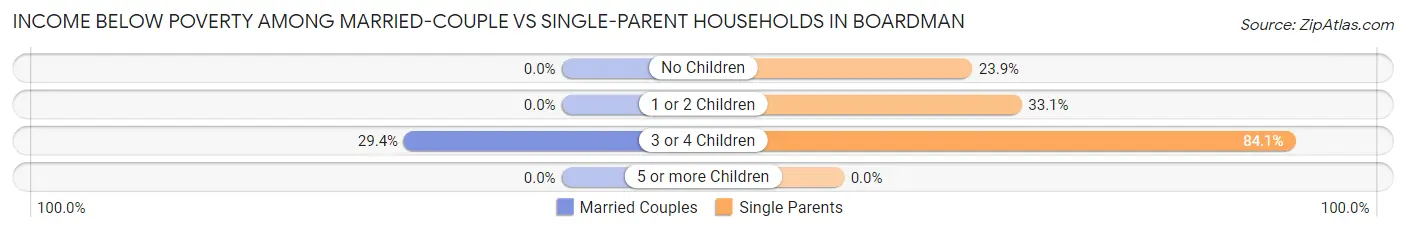
| Children | Married-Couple Families | Single-Parent Households |
| No Children | 0 (0.0%) | 27 (23.9%) |
| 1 or 2 Children | 0 (0.0%) | 48 (33.1%) |
| 3 or 4 Children | 27 (29.3%) | 90 (84.1%) |
| 5 or more Children | 0 (0.0%) | 0 (0.0%) |
| Total | 27 (5.1%) | 165 (45.2%) |
Employment Characteristics in Boardman
Employment by Class of Employer in Boardman
Among the 1,657 employed individuals in Boardman, private company employees (1,303 | 78.6%), local government employees (93 | 5.6%), and not-for-profit organizations (84 | 5.1%) make up the most common classes of employment.
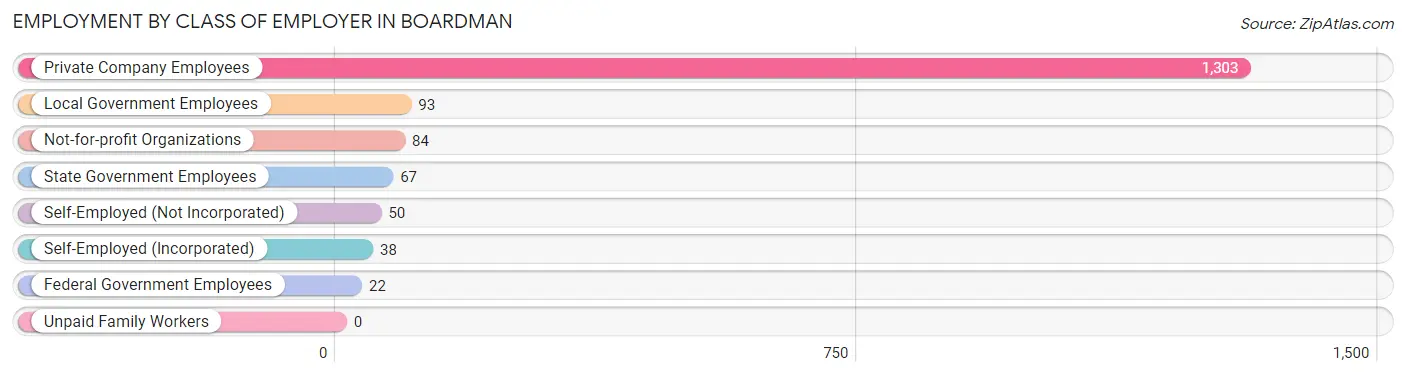
| Employer Class | # Employees | % Employees |
| Private Company Employees | 1,303 | 78.6% |
| Self-Employed (Incorporated) | 38 | 2.3% |
| Self-Employed (Not Incorporated) | 50 | 3.0% |
| Not-for-profit Organizations | 84 | 5.1% |
| Local Government Employees | 93 | 5.6% |
| State Government Employees | 67 | 4.0% |
| Federal Government Employees | 22 | 1.3% |
| Unpaid Family Workers | 0 | 0.0% |
| Total | 1,657 | 100.0% |
Employment Status by Age in Boardman
According to the labor force statistics for Boardman, out of the total population over 16 years of age (2,727), 66.1% or 1,803 individuals are in the labor force, with 1.8% or 32 of them unemployed. The age group with the highest labor force participation rate is 45 to 54 years, with 94.1% or 208 individuals in the labor force. Within the labor force, the 25 to 29 years age range has the highest percentage of unemployed individuals, with 5.7% or 17 of them being unemployed.
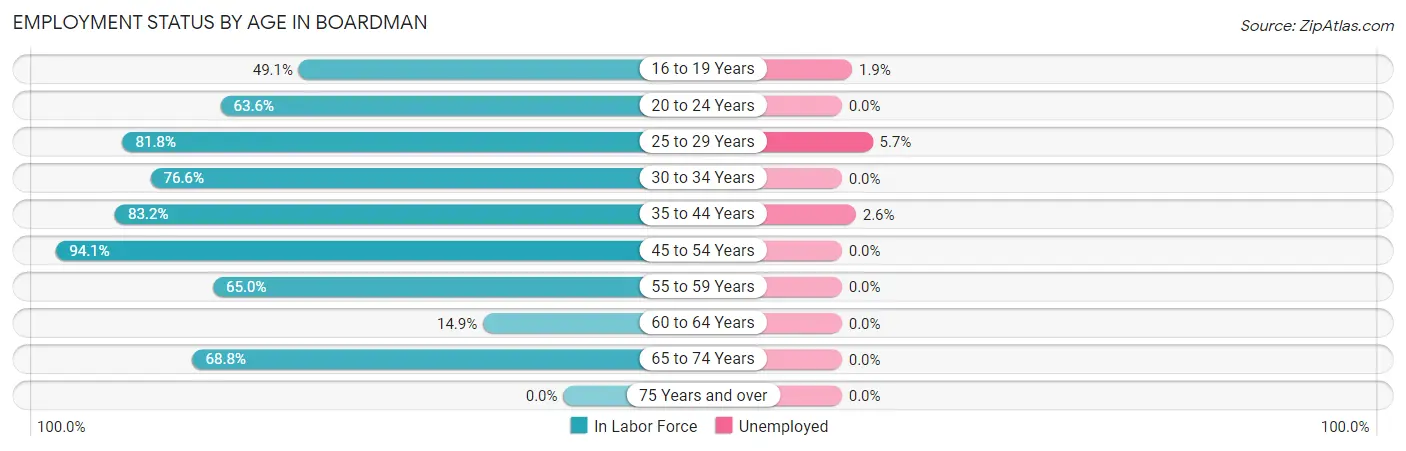
| Age Bracket | In Labor Force | Unemployed |
| 16 to 19 Years | 160 (49.1%) | 3 (1.9%) |
| 20 to 24 Years | 140 (63.6%) | 0 (0.0%) |
| 25 to 29 Years | 296 (81.8%) | 17 (5.7%) |
| 30 to 34 Years | 210 (76.6%) | 0 (0.0%) |
| 35 to 44 Years | 491 (83.2%) | 13 (2.6%) |
| 45 to 54 Years | 208 (94.1%) | 0 (0.0%) |
| 55 to 59 Years | 147 (65.0%) | 0 (0.0%) |
| 60 to 64 Years | 34 (14.9%) | 0 (0.0%) |
| 65 to 74 Years | 117 (68.8%) | 0 (0.0%) |
| 75 Years and over | 0 (0.0%) | 0 (0.0%) |
| Total | 1,803 (66.1%) | 32 (1.8%) |
Employment Status by Educational Attainment in Boardman
According to labor force statistics for Boardman, 72.9% of individuals (1,386) out of the total population between 25 and 64 years of age (1,901) are in the labor force, with 2.2% or 30 of them being unemployed. The group with the highest labor force participation rate are those with the educational attainment of less than high school, with 82.9% or 655 individuals in the labor force. Within the labor force, individuals with college / associate degree education have the highest percentage of unemployment, with 4.0% or 13 of them being unemployed.
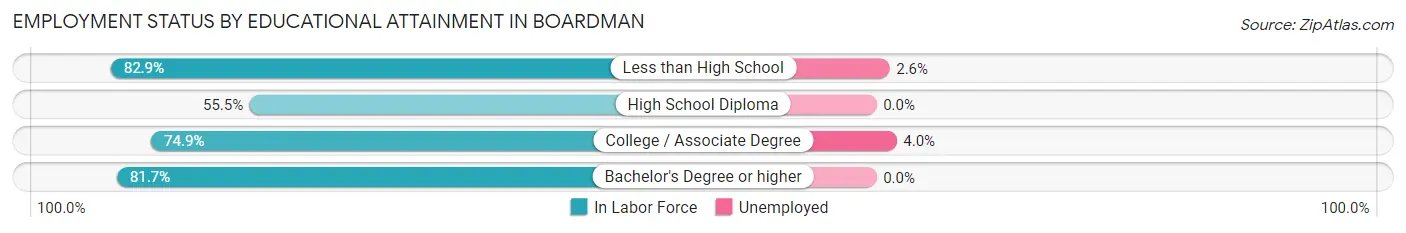
| Educational Attainment | In Labor Force | Unemployed |
| Less than High School | 655 (82.9%) | 21 (2.6%) |
| High School Diploma | 312 (55.5%) | 0 (0.0%) |
| College / Associate Degree | 325 (74.9%) | 17 (4.0%) |
| Bachelor's Degree or higher | 94 (81.7%) | 0 (0.0%) |
| Total | 1,386 (72.9%) | 42 (2.2%) |
Employment Occupations by Sex in Boardman
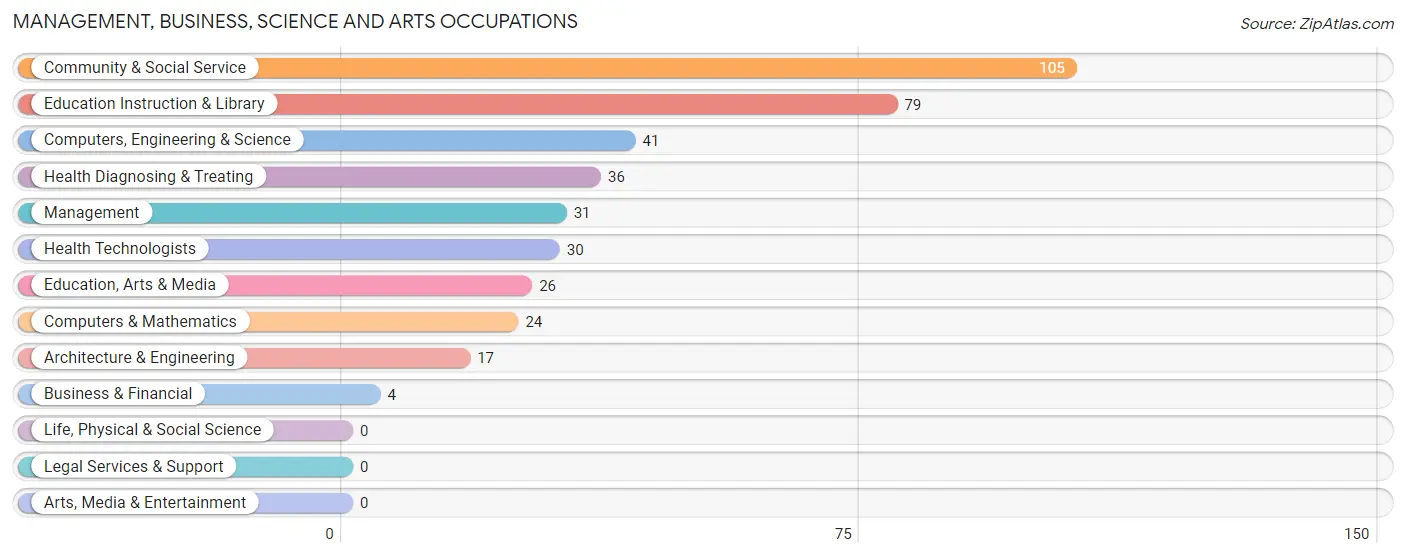
Management, Business, Science and Arts Occupations
The most common Management, Business, Science and Arts occupations in Boardman are Community & Social Service (105 | 5.9%), Education Instruction & Library (79 | 4.5%), Computers, Engineering & Science (41 | 2.3%), Health Diagnosing & Treating (36 | 2.0%), and Management (31 | 1.8%).
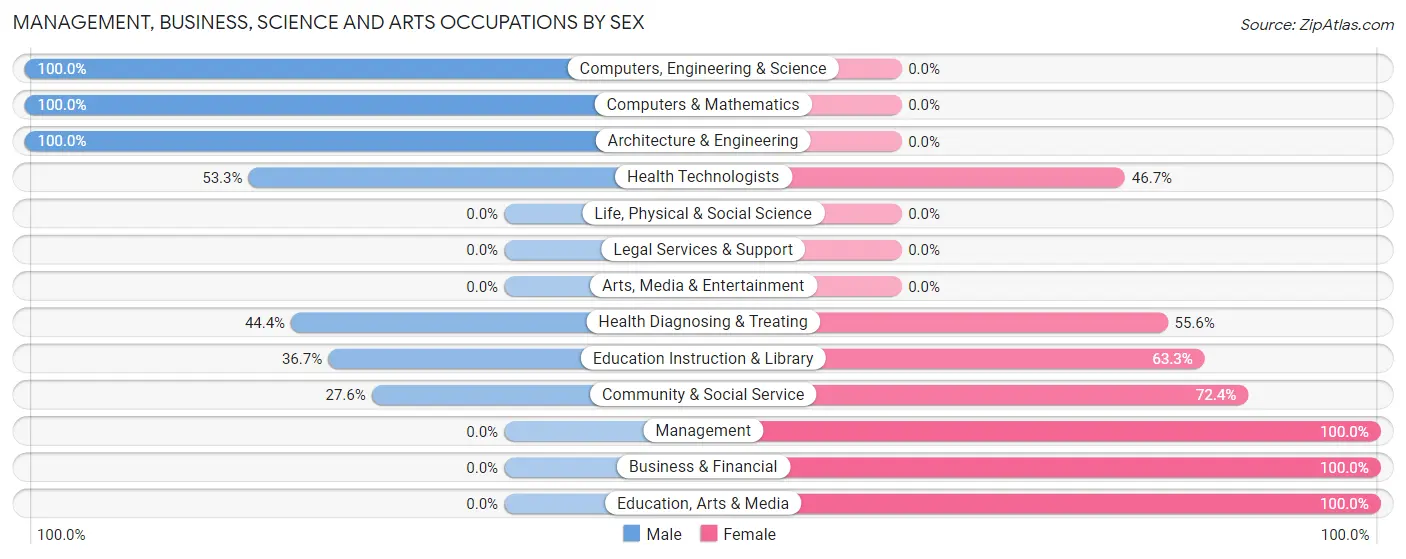
Management, Business, Science and Arts Occupations by Sex
Within the Management, Business, Science and Arts occupations in Boardman, the most male-oriented occupations are Computers, Engineering & Science (100.0%), Computers & Mathematics (100.0%), and Architecture & Engineering (100.0%), while the most female-oriented occupations are Management (100.0%), Business & Financial (100.0%), and Education, Arts & Media (100.0%).
| Occupation | Male | Female |
| Management | 0 (0.0%) | 31 (100.0%) |
| Business & Financial | 0 (0.0%) | 4 (100.0%) |
| Computers, Engineering & Science | 41 (100.0%) | 0 (0.0%) |
| Computers & Mathematics | 24 (100.0%) | 0 (0.0%) |
| Architecture & Engineering | 17 (100.0%) | 0 (0.0%) |
| Life, Physical & Social Science | 0 (0.0%) | 0 (0.0%) |
| Community & Social Service | 29 (27.6%) | 76 (72.4%) |
| Education, Arts & Media | 0 (0.0%) | 26 (100.0%) |
| Legal Services & Support | 0 (0.0%) | 0 (0.0%) |
| Education Instruction & Library | 29 (36.7%) | 50 (63.3%) |
| Arts, Media & Entertainment | 0 (0.0%) | 0 (0.0%) |
| Health Diagnosing & Treating | 16 (44.4%) | 20 (55.6%) |
| Health Technologists | 16 (53.3%) | 14 (46.7%) |
| Total (Category) | 86 (39.6%) | 131 (60.4%) |
| Total (Overall) | 1,073 (60.6%) | 697 (39.4%) |
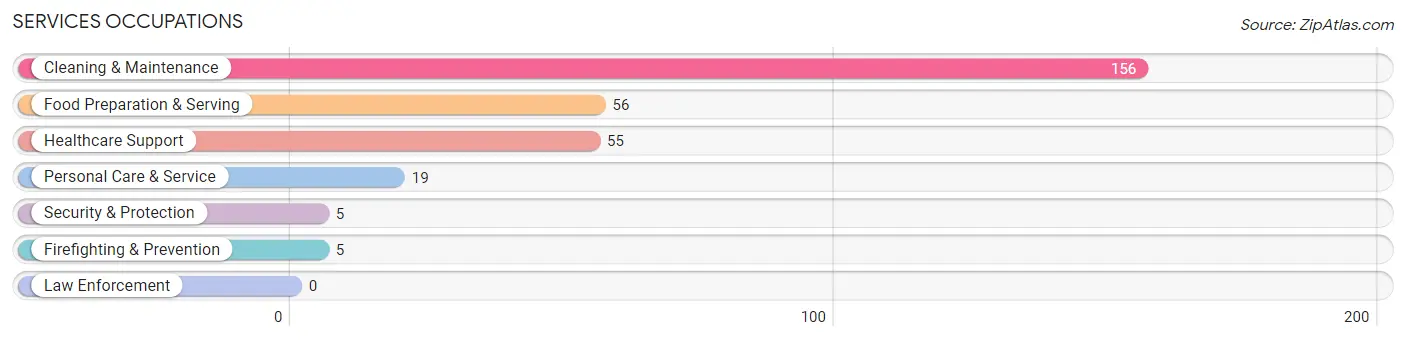
Services Occupations
The most common Services occupations in Boardman are Cleaning & Maintenance (156 | 8.8%), Food Preparation & Serving (56 | 3.2%), Healthcare Support (55 | 3.1%), Personal Care & Service (19 | 1.1%), and Security & Protection (5 | 0.3%).
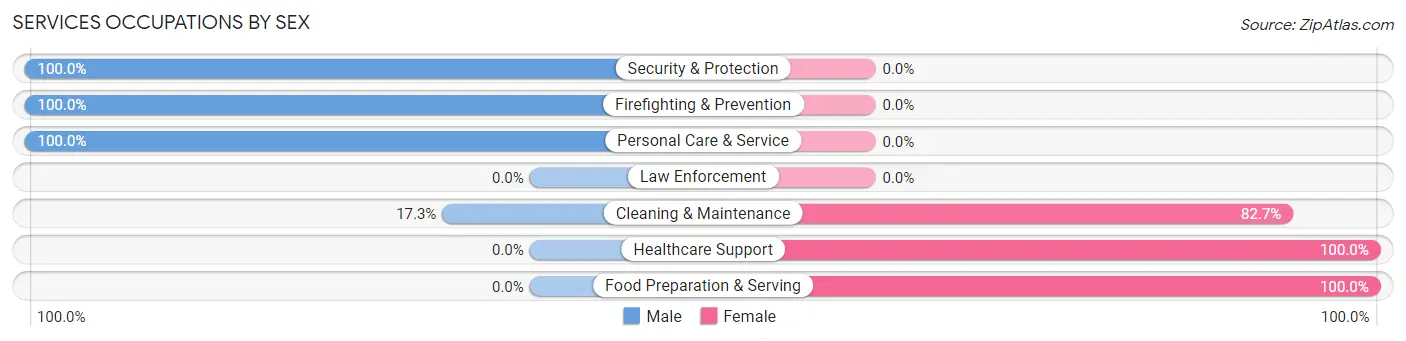
Services Occupations by Sex
Within the Services occupations in Boardman, the most male-oriented occupations are Security & Protection (100.0%), Firefighting & Prevention (100.0%), and Personal Care & Service (100.0%), while the most female-oriented occupations are Healthcare Support (100.0%), Food Preparation & Serving (100.0%), and Cleaning & Maintenance (82.7%).
| Occupation | Male | Female |
| Healthcare Support | 0 (0.0%) | 55 (100.0%) |
| Security & Protection | 5 (100.0%) | 0 (0.0%) |
| Firefighting & Prevention | 5 (100.0%) | 0 (0.0%) |
| Law Enforcement | 0 (0.0%) | 0 (0.0%) |
| Food Preparation & Serving | 0 (0.0%) | 56 (100.0%) |
| Cleaning & Maintenance | 27 (17.3%) | 129 (82.7%) |
| Personal Care & Service | 19 (100.0%) | 0 (0.0%) |
| Total (Category) | 51 (17.5%) | 240 (82.5%) |
| Total (Overall) | 1,073 (60.6%) | 697 (39.4%) |
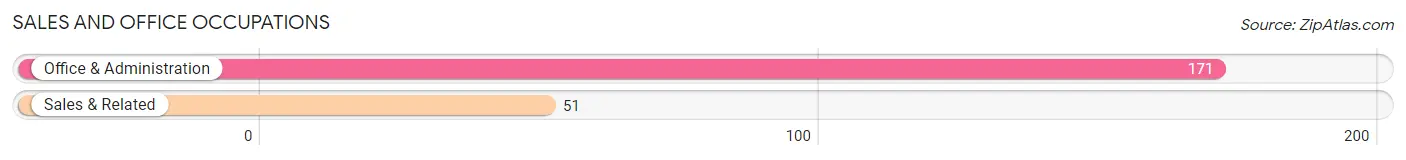
Sales and Office Occupations
The most common Sales and Office occupations in Boardman are Office & Administration (171 | 9.7%), and Sales & Related (51 | 2.9%).
Sales and Office Occupations by Sex
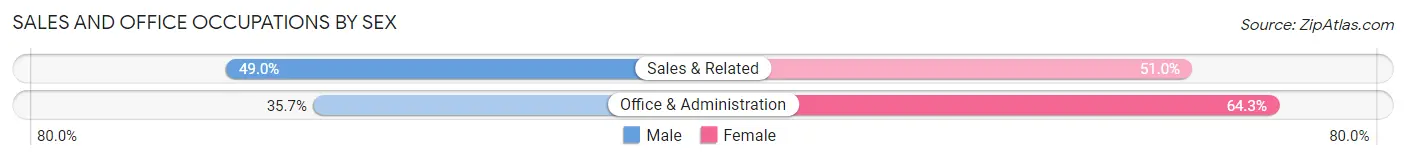
| Occupation | Male | Female |
| Sales & Related | 25 (49.0%) | 26 (51.0%) |
| Office & Administration | 61 (35.7%) | 110 (64.3%) |
| Total (Category) | 86 (38.7%) | 136 (61.3%) |
| Total (Overall) | 1,073 (60.6%) | 697 (39.4%) |
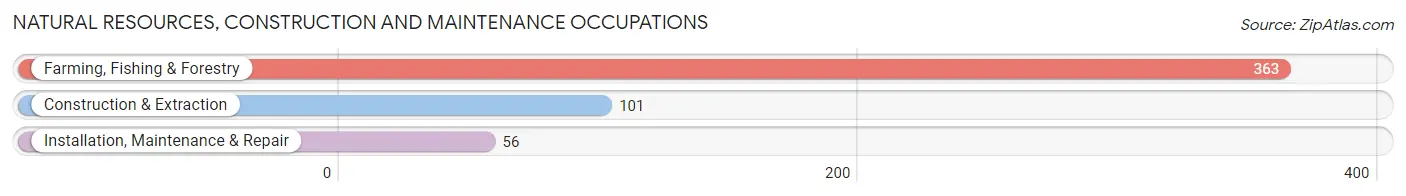
Natural Resources, Construction and Maintenance Occupations
The most common Natural Resources, Construction and Maintenance occupations in Boardman are Farming, Fishing & Forestry (363 | 20.5%), Construction & Extraction (101 | 5.7%), and Installation, Maintenance & Repair (56 | 3.2%).
Natural Resources, Construction and Maintenance Occupations by Sex
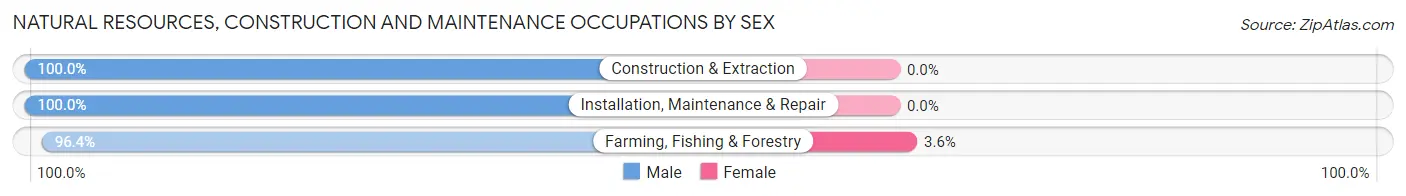
| Occupation | Male | Female |
| Farming, Fishing & Forestry | 350 (96.4%) | 13 (3.6%) |
| Construction & Extraction | 101 (100.0%) | 0 (0.0%) |
| Installation, Maintenance & Repair | 56 (100.0%) | 0 (0.0%) |
| Total (Category) | 507 (97.5%) | 13 (2.5%) |
| Total (Overall) | 1,073 (60.6%) | 697 (39.4%) |
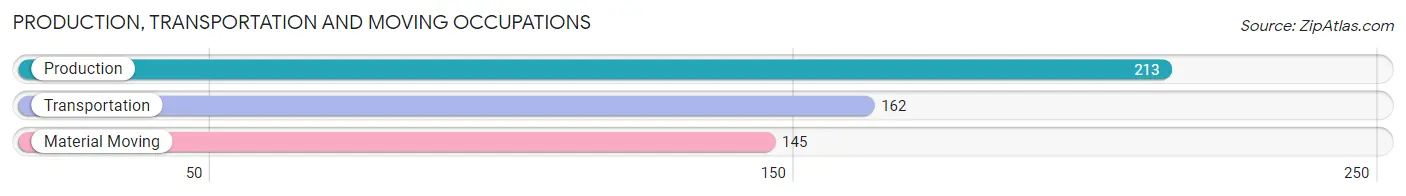
Production, Transportation and Moving Occupations
The most common Production, Transportation and Moving occupations in Boardman are Production (213 | 12.0%), Transportation (162 | 9.1%), and Material Moving (145 | 8.2%).
Production, Transportation and Moving Occupations by Sex
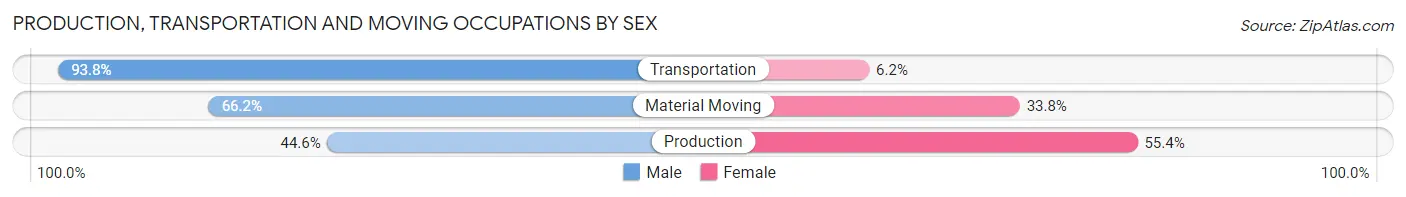
| Occupation | Male | Female |
| Production | 95 (44.6%) | 118 (55.4%) |
| Transportation | 152 (93.8%) | 10 (6.2%) |
| Material Moving | 96 (66.2%) | 49 (33.8%) |
| Total (Category) | 343 (66.0%) | 177 (34.0%) |
| Total (Overall) | 1,073 (60.6%) | 697 (39.4%) |
Employment Industries by Sex in Boardman
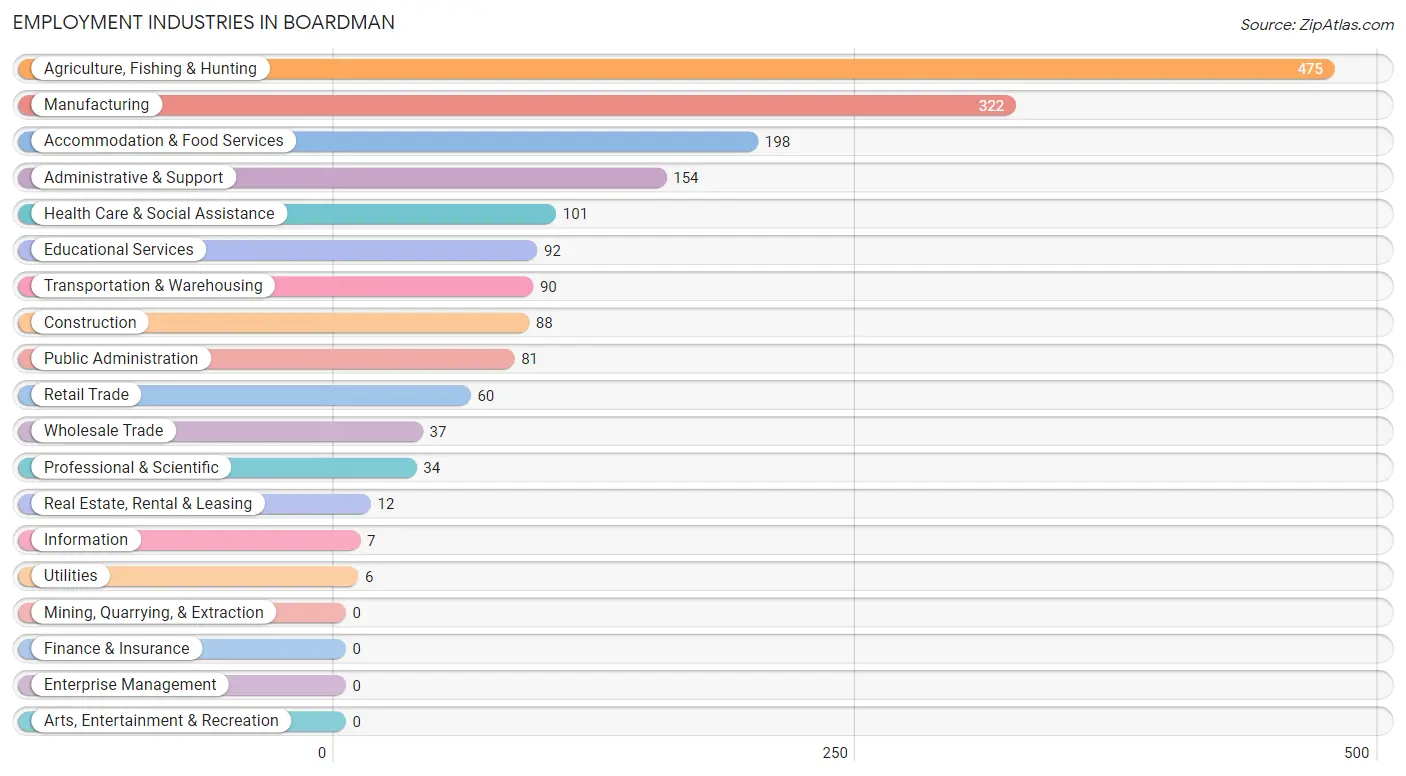
Employment Industries in Boardman
The major employment industries in Boardman include Agriculture, Fishing & Hunting (475 | 26.8%), Manufacturing (322 | 18.2%), Accommodation & Food Services (198 | 11.2%), Administrative & Support (154 | 8.7%), and Health Care & Social Assistance (101 | 5.7%).
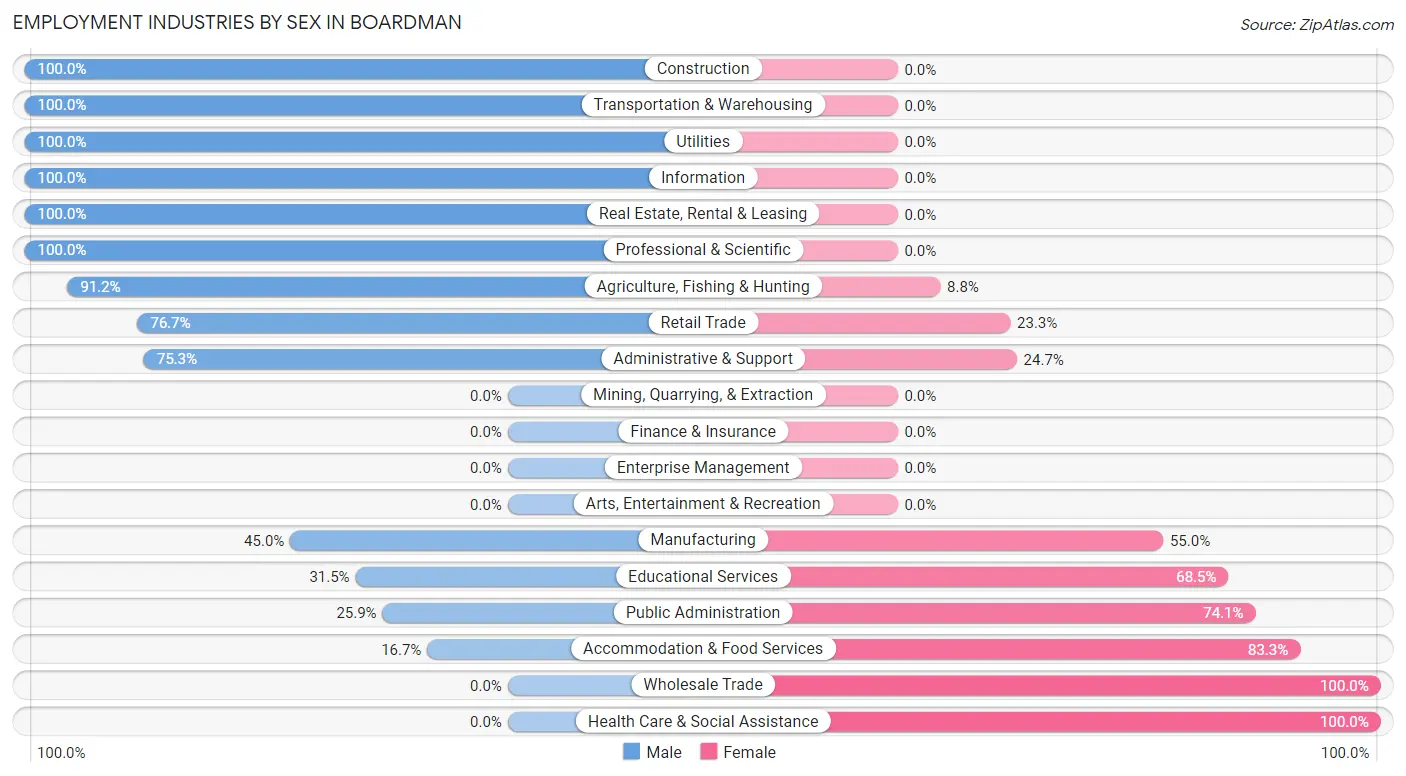
Employment Industries by Sex in Boardman
The Boardman industries that see more men than women are Construction (100.0%), Transportation & Warehousing (100.0%), and Utilities (100.0%), whereas the industries that tend to have a higher number of women are Wholesale Trade (100.0%), Health Care & Social Assistance (100.0%), and Accommodation & Food Services (83.3%).
| Industry | Male | Female |
| Agriculture, Fishing & Hunting | 433 (91.2%) | 42 (8.8%) |
| Mining, Quarrying, & Extraction | 0 (0.0%) | 0 (0.0%) |
| Construction | 88 (100.0%) | 0 (0.0%) |
| Manufacturing | 145 (45.0%) | 177 (55.0%) |
| Wholesale Trade | 0 (0.0%) | 37 (100.0%) |
| Retail Trade | 46 (76.7%) | 14 (23.3%) |
| Transportation & Warehousing | 90 (100.0%) | 0 (0.0%) |
| Utilities | 6 (100.0%) | 0 (0.0%) |
| Information | 7 (100.0%) | 0 (0.0%) |
| Finance & Insurance | 0 (0.0%) | 0 (0.0%) |
| Real Estate, Rental & Leasing | 12 (100.0%) | 0 (0.0%) |
| Professional & Scientific | 34 (100.0%) | 0 (0.0%) |
| Enterprise Management | 0 (0.0%) | 0 (0.0%) |
| Administrative & Support | 116 (75.3%) | 38 (24.7%) |
| Educational Services | 29 (31.5%) | 63 (68.5%) |
| Health Care & Social Assistance | 0 (0.0%) | 101 (100.0%) |
| Arts, Entertainment & Recreation | 0 (0.0%) | 0 (0.0%) |
| Accommodation & Food Services | 33 (16.7%) | 165 (83.3%) |
| Public Administration | 21 (25.9%) | 60 (74.1%) |
| Total | 1,073 (60.6%) | 697 (39.4%) |
Education in Boardman
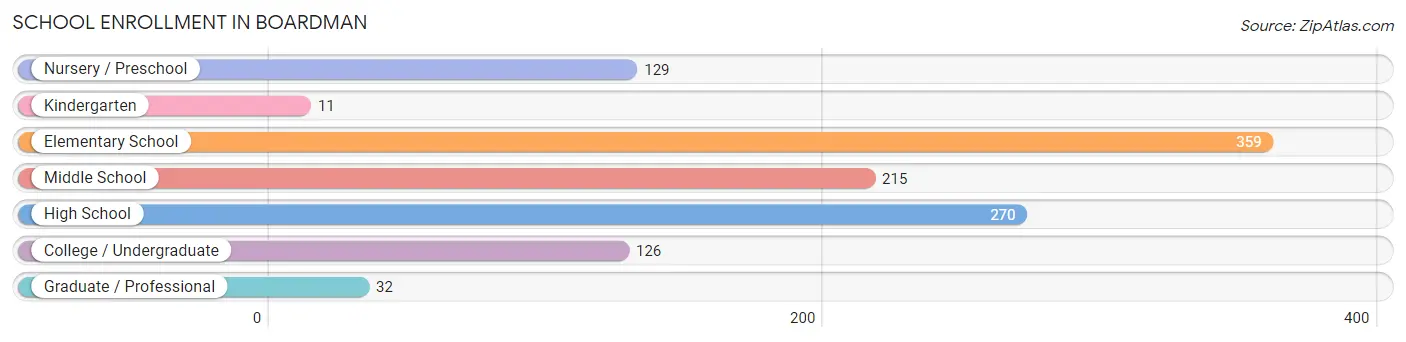
School Enrollment in Boardman
The most common levels of schooling among the 1,142 students in Boardman are elementary school (359 | 31.4%), high school (270 | 23.6%), and middle school (215 | 18.8%).
| School Level | # Students | % Students |
| Nursery / Preschool | 129 | 11.3% |
| Kindergarten | 11 | 1.0% |
| Elementary School | 359 | 31.4% |
| Middle School | 215 | 18.8% |
| High School | 270 | 23.6% |
| College / Undergraduate | 126 | 11.0% |
| Graduate / Professional | 32 | 2.8% |
| Total | 1,142 | 100.0% |
School Enrollment by Age by Funding Source in Boardman
Out of a total of 1,142 students who are enrolled in schools in Boardman, 56 (4.9%) attend a private institution, while the remaining 1,086 (95.1%) are enrolled in public schools. The age group of 35 years and over has the highest likelihood of being enrolled in private schools, with 32 (88.9% in the age bracket) enrolled. Conversely, the age group of 3 to 4 year olds has the lowest likelihood of being enrolled in a private school, with 69 (100.0% in the age bracket) attending a public institution.
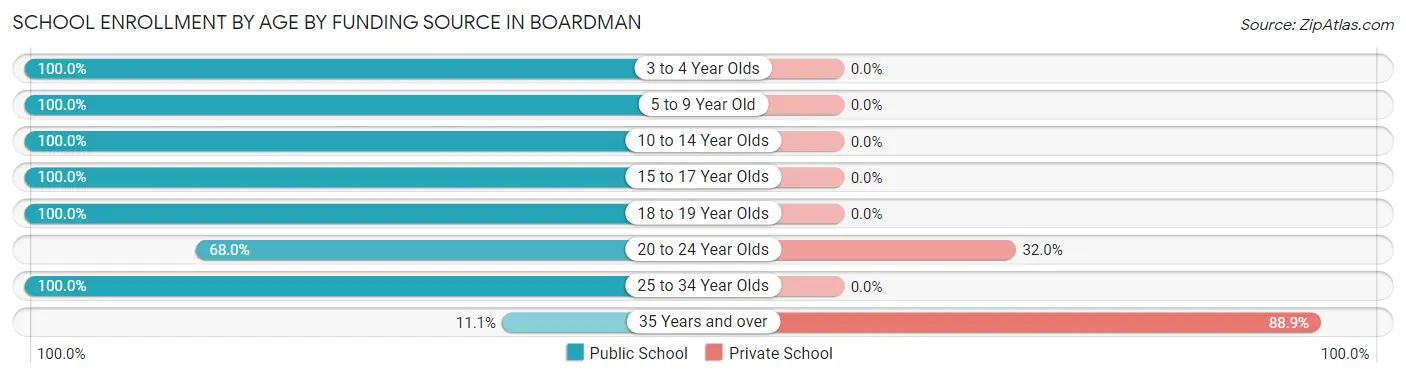
| Age Bracket | Public School | Private School |
| 3 to 4 Year Olds | 69 (100.0%) | 0 (0.0%) |
| 5 to 9 Year Old | 394 (100.0%) | 0 (0.0%) |
| 10 to 14 Year Olds | 270 (100.0%) | 0 (0.0%) |
| 15 to 17 Year Olds | 238 (100.0%) | 0 (0.0%) |
| 18 to 19 Year Olds | 27 (100.0%) | 0 (0.0%) |
| 20 to 24 Year Olds | 51 (68.0%) | 24 (32.0%) |
| 25 to 34 Year Olds | 33 (100.0%) | 0 (0.0%) |
| 35 Years and over | 4 (11.1%) | 32 (88.9%) |
| Total | 1,086 (95.1%) | 56 (4.9%) |
Educational Attainment by Field of Study in Boardman
Education (45 | 22.4%), liberal arts & history (40 | 19.9%), science & technology (35 | 17.4%), business (19 | 9.5%), and psychology (14 | 7.0%) are the most common fields of study among 201 individuals in Boardman who have obtained a bachelor's degree or higher.
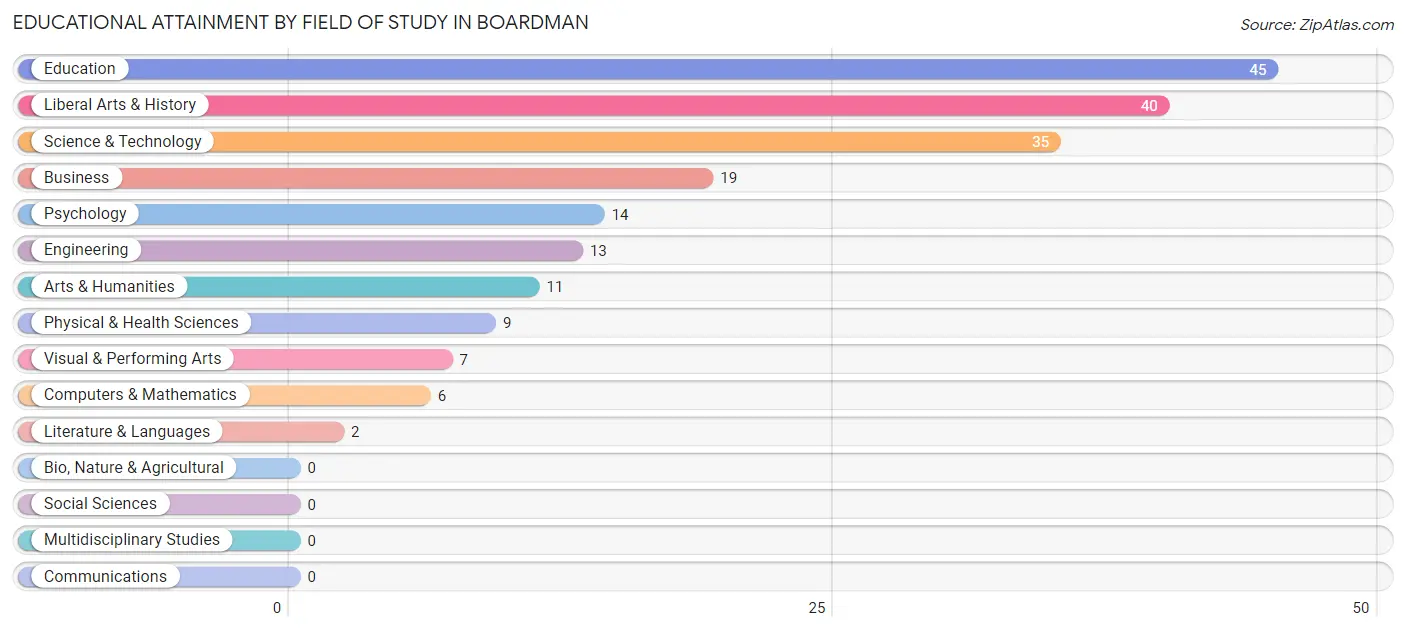
| Field of Study | # Graduates | % Graduates |
| Computers & Mathematics | 6 | 3.0% |
| Bio, Nature & Agricultural | 0 | 0.0% |
| Physical & Health Sciences | 9 | 4.5% |
| Psychology | 14 | 7.0% |
| Social Sciences | 0 | 0.0% |
| Engineering | 13 | 6.5% |
| Multidisciplinary Studies | 0 | 0.0% |
| Science & Technology | 35 | 17.4% |
| Business | 19 | 9.5% |
| Education | 45 | 22.4% |
| Literature & Languages | 2 | 1.0% |
| Liberal Arts & History | 40 | 19.9% |
| Visual & Performing Arts | 7 | 3.5% |
| Communications | 0 | 0.0% |
| Arts & Humanities | 11 | 5.5% |
| Total | 201 | 100.0% |
Transportation & Commute in Boardman
Vehicle Availability by Sex in Boardman
The most prevalent vehicle ownership categories in Boardman are males with 2 vehicles (370, accounting for 36.1%) and females with 2 vehicles (225, making up 58.5%).
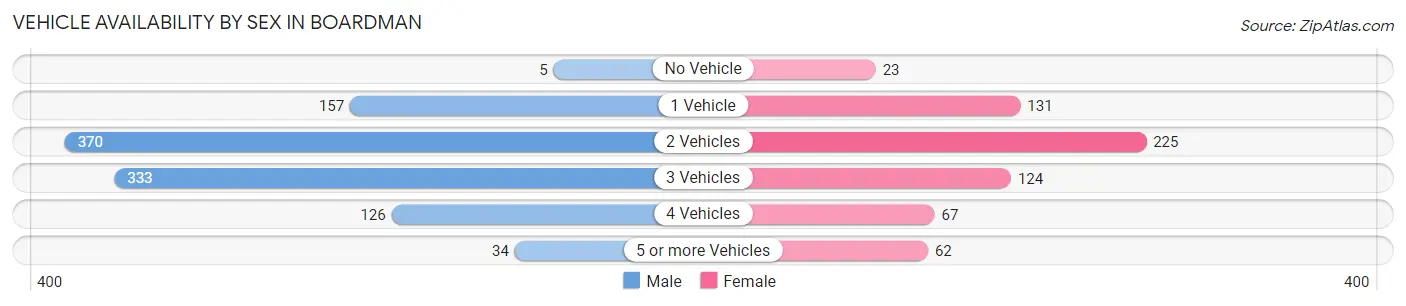
| Vehicles Available | Male | Female |
| No Vehicle | 5 (0.5%) | 23 (3.6%) |
| 1 Vehicle | 157 (15.3%) | 131 (20.7%) |
| 2 Vehicles | 370 (36.1%) | 225 (35.6%) |
| 3 Vehicles | 333 (32.5%) | 124 (19.6%) |
| 4 Vehicles | 126 (12.3%) | 67 (10.6%) |
| 5 or more Vehicles | 34 (3.3%) | 62 (9.8%) |
| Total | 1,025 (100.0%) | 632 (100.0%) |
Commute Time in Boardman
The most frequently occuring commute durations in Boardman are 5 to 9 minutes (354 commuters, 21.4%), 30 to 34 minutes (353 commuters, 21.4%), and 10 to 14 minutes (239 commuters, 14.5%).
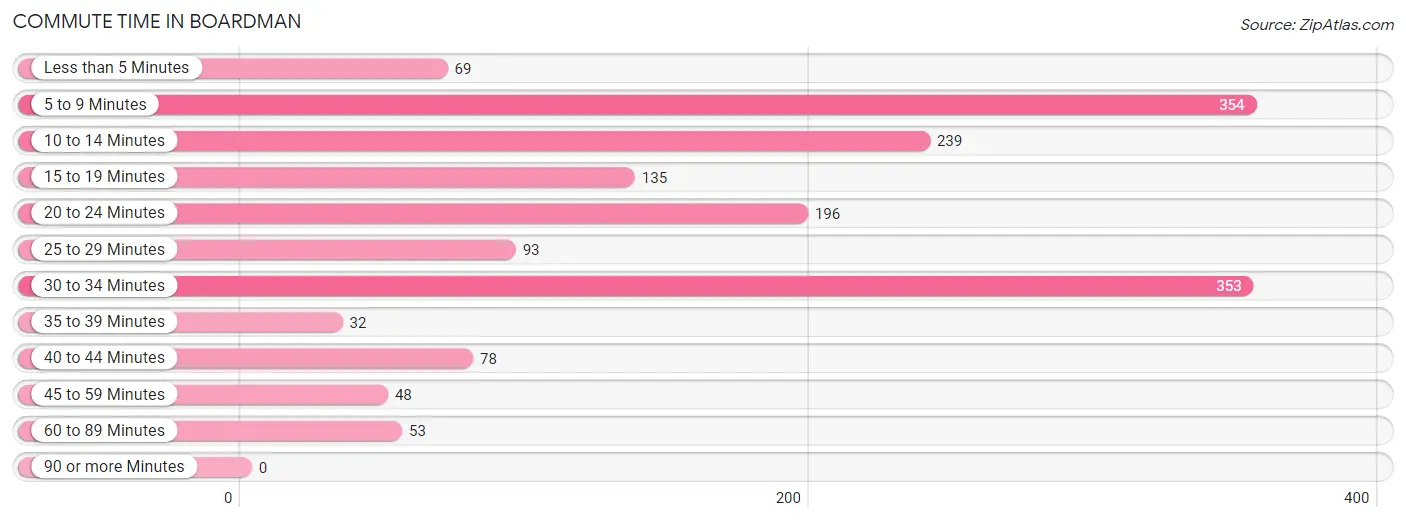
| Commute Time | # Commuters | % Commuters |
| Less than 5 Minutes | 69 | 4.2% |
| 5 to 9 Minutes | 354 | 21.4% |
| 10 to 14 Minutes | 239 | 14.5% |
| 15 to 19 Minutes | 135 | 8.2% |
| 20 to 24 Minutes | 196 | 11.9% |
| 25 to 29 Minutes | 93 | 5.6% |
| 30 to 34 Minutes | 353 | 21.4% |
| 35 to 39 Minutes | 32 | 1.9% |
| 40 to 44 Minutes | 78 | 4.7% |
| 45 to 59 Minutes | 48 | 2.9% |
| 60 to 89 Minutes | 53 | 3.2% |
| 90 or more Minutes | 0 | 0.0% |
Commute Time by Sex in Boardman
The most common commute times in Boardman are 30 to 34 minutes (325 commuters, 31.7%) for males and 5 to 9 minutes (202 commuters, 32.3%) for females.
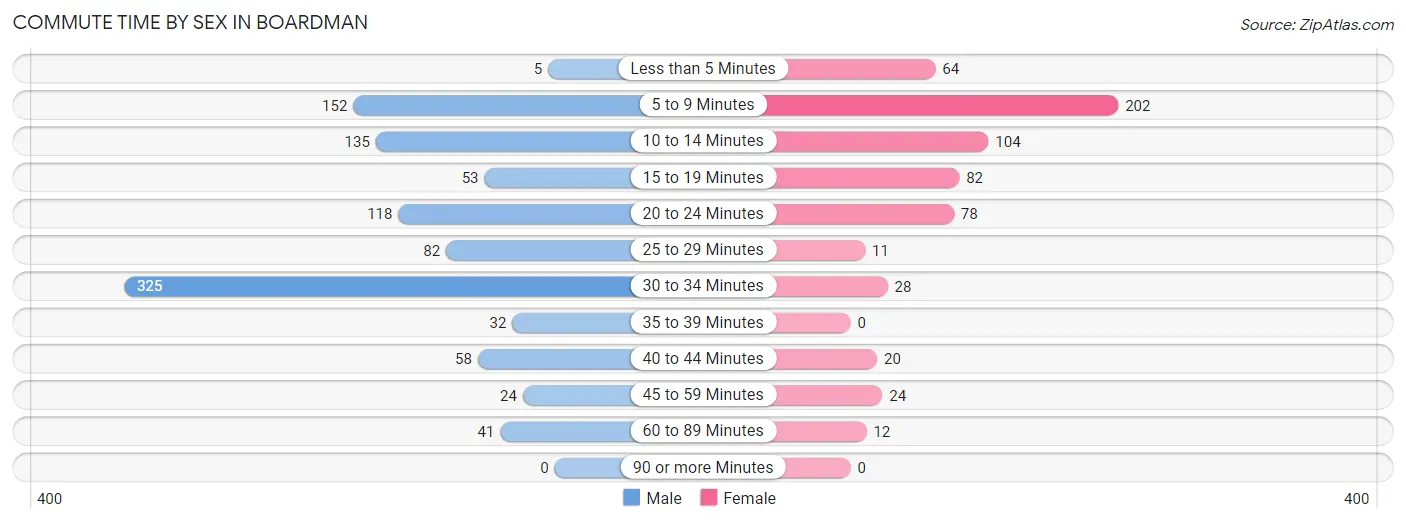
| Commute Time | Male | Female |
| Less than 5 Minutes | 5 (0.5%) | 64 (10.2%) |
| 5 to 9 Minutes | 152 (14.8%) | 202 (32.3%) |
| 10 to 14 Minutes | 135 (13.2%) | 104 (16.6%) |
| 15 to 19 Minutes | 53 (5.2%) | 82 (13.1%) |
| 20 to 24 Minutes | 118 (11.5%) | 78 (12.5%) |
| 25 to 29 Minutes | 82 (8.0%) | 11 (1.8%) |
| 30 to 34 Minutes | 325 (31.7%) | 28 (4.5%) |
| 35 to 39 Minutes | 32 (3.1%) | 0 (0.0%) |
| 40 to 44 Minutes | 58 (5.7%) | 20 (3.2%) |
| 45 to 59 Minutes | 24 (2.3%) | 24 (3.8%) |
| 60 to 89 Minutes | 41 (4.0%) | 12 (1.9%) |
| 90 or more Minutes | 0 (0.0%) | 0 (0.0%) |
Time of Departure to Work by Sex in Boardman
The most frequent times of departure to work in Boardman are 5:00 AM to 5:29 AM (341, 33.3%) for males and 12:00 PM to 3:59 PM (104, 16.6%) for females.
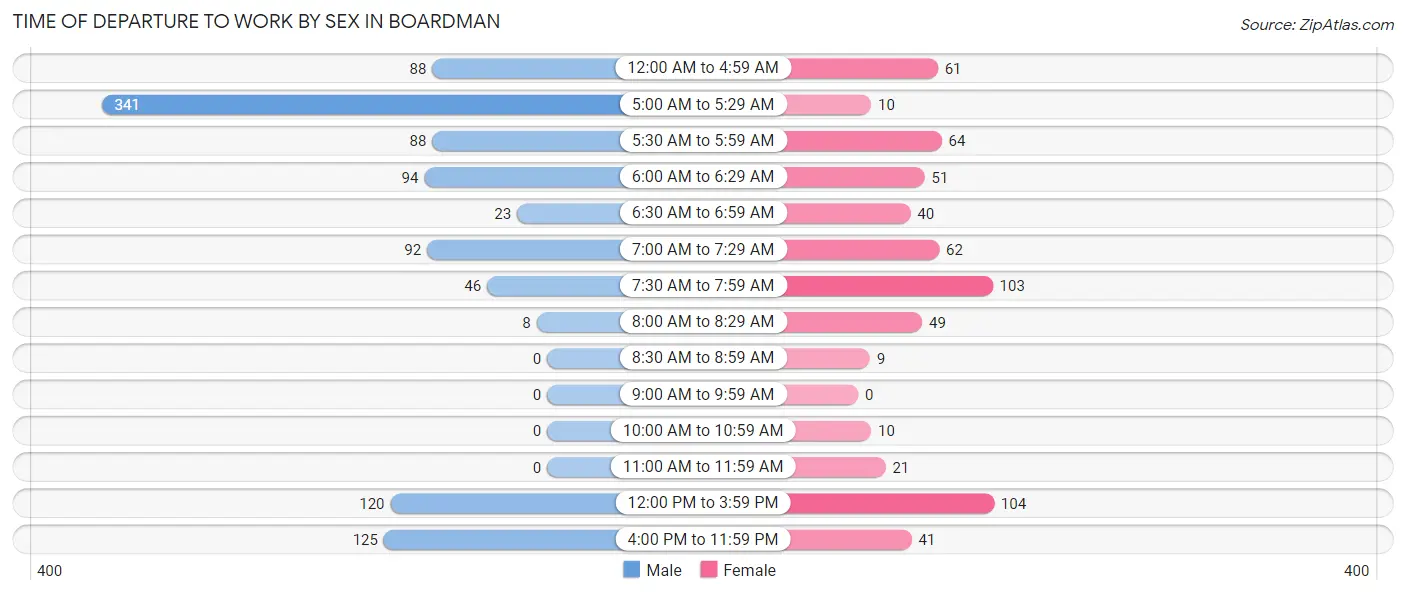
| Time of Departure | Male | Female |
| 12:00 AM to 4:59 AM | 88 (8.6%) | 61 (9.8%) |
| 5:00 AM to 5:29 AM | 341 (33.3%) | 10 (1.6%) |
| 5:30 AM to 5:59 AM | 88 (8.6%) | 64 (10.2%) |
| 6:00 AM to 6:29 AM | 94 (9.2%) | 51 (8.2%) |
| 6:30 AM to 6:59 AM | 23 (2.2%) | 40 (6.4%) |
| 7:00 AM to 7:29 AM | 92 (9.0%) | 62 (9.9%) |
| 7:30 AM to 7:59 AM | 46 (4.5%) | 103 (16.5%) |
| 8:00 AM to 8:29 AM | 8 (0.8%) | 49 (7.8%) |
| 8:30 AM to 8:59 AM | 0 (0.0%) | 9 (1.4%) |
| 9:00 AM to 9:59 AM | 0 (0.0%) | 0 (0.0%) |
| 10:00 AM to 10:59 AM | 0 (0.0%) | 10 (1.6%) |
| 11:00 AM to 11:59 AM | 0 (0.0%) | 21 (3.4%) |
| 12:00 PM to 3:59 PM | 120 (11.7%) | 104 (16.6%) |
| 4:00 PM to 11:59 PM | 125 (12.2%) | 41 (6.6%) |
| Total | 1,025 (100.0%) | 625 (100.0%) |
Housing Occupancy in Boardman
Occupancy by Ownership in Boardman
Of the total 1,119 dwellings in Boardman, owner-occupied units account for 596 (53.3%), while renter-occupied units make up 523 (46.7%).
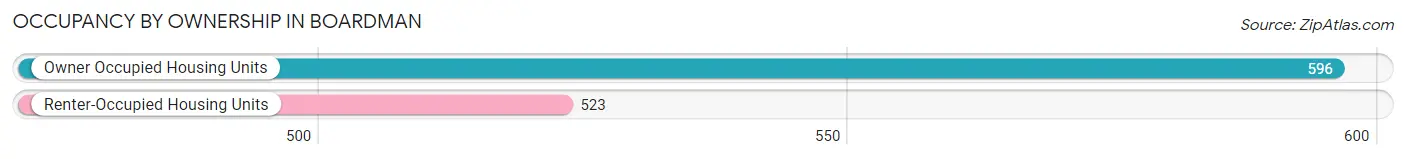
| Occupancy | # Housing Units | % Housing Units |
| Owner Occupied Housing Units | 596 | 53.3% |
| Renter-Occupied Housing Units | 523 | 46.7% |
| Total Occupied Housing Units | 1,119 | 100.0% |
Occupancy by Household Size in Boardman
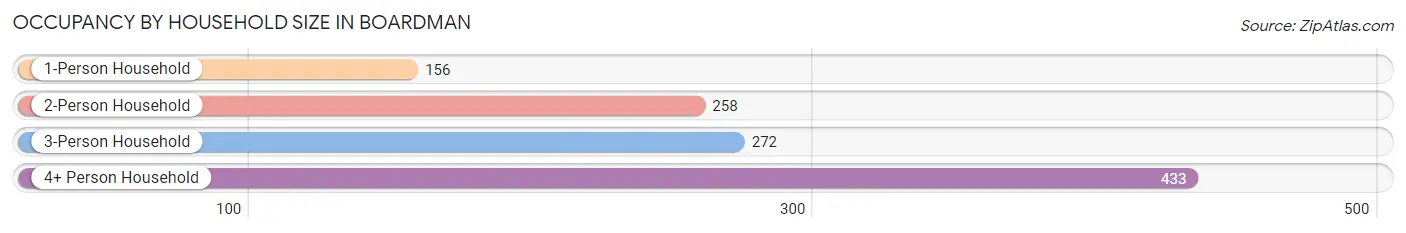
| Household Size | # Housing Units | % Housing Units |
| 1-Person Household | 156 | 13.9% |
| 2-Person Household | 258 | 23.1% |
| 3-Person Household | 272 | 24.3% |
| 4+ Person Household | 433 | 38.7% |
| Total Housing Units | 1,119 | 100.0% |
Occupancy by Ownership by Household Size in Boardman
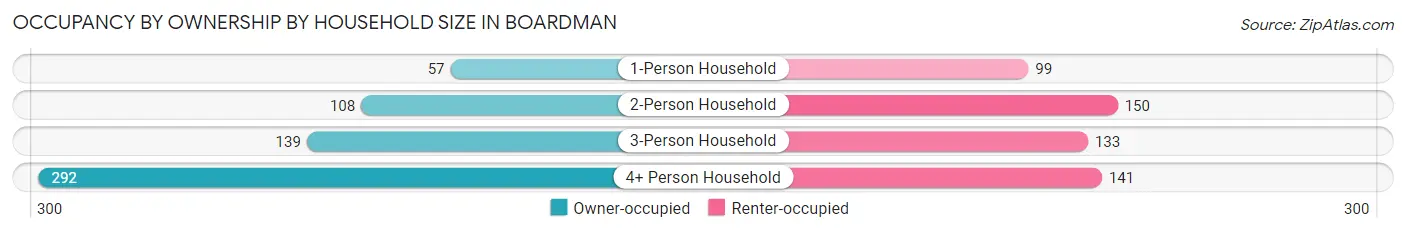
| Household Size | Owner-occupied | Renter-occupied |
| 1-Person Household | 57 (36.5%) | 99 (63.5%) |
| 2-Person Household | 108 (41.9%) | 150 (58.1%) |
| 3-Person Household | 139 (51.1%) | 133 (48.9%) |
| 4+ Person Household | 292 (67.4%) | 141 (32.6%) |
| Total Housing Units | 596 (53.3%) | 523 (46.7%) |
Occupancy by Educational Attainment in Boardman
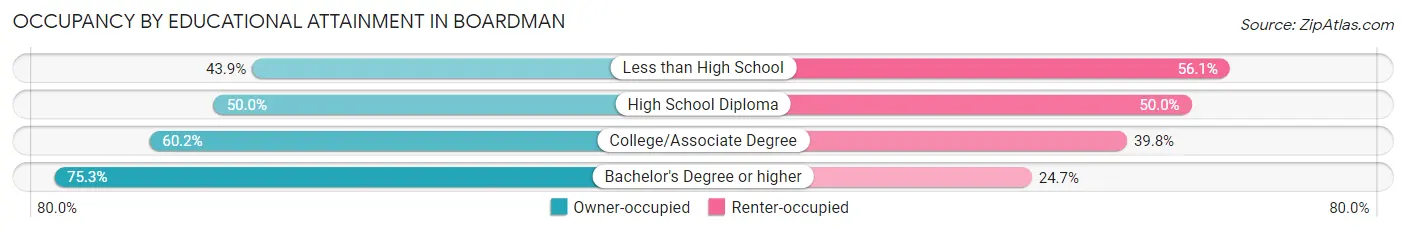
| Household Size | Owner-occupied | Renter-occupied |
| Less than High School | 152 (43.9%) | 194 (56.1%) |
| High School Diploma | 162 (50.0%) | 162 (50.0%) |
| College/Associate Degree | 224 (60.2%) | 148 (39.8%) |
| Bachelor's Degree or higher | 58 (75.3%) | 19 (24.7%) |
Occupancy by Age of Householder in Boardman
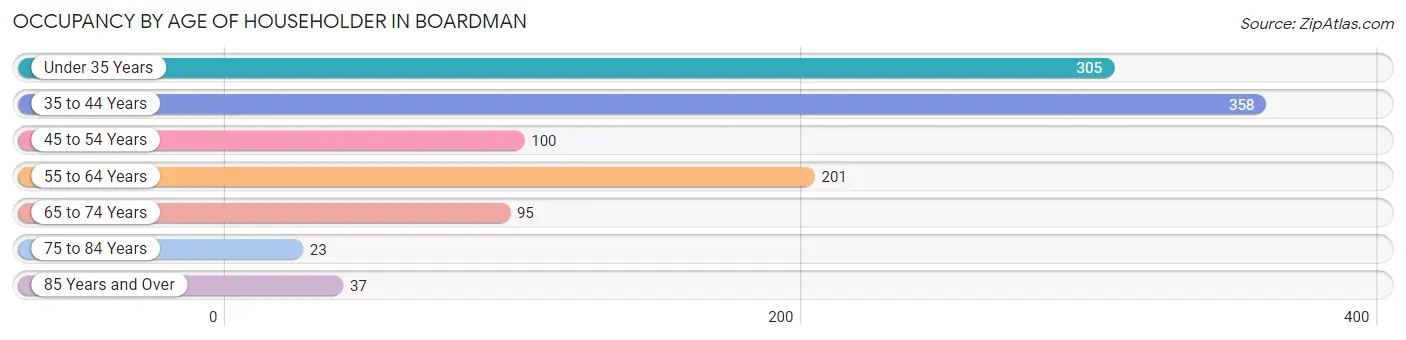
| Age Bracket | # Households | % Households |
| Under 35 Years | 305 | 27.3% |
| 35 to 44 Years | 358 | 32.0% |
| 45 to 54 Years | 100 | 8.9% |
| 55 to 64 Years | 201 | 18.0% |
| 65 to 74 Years | 95 | 8.5% |
| 75 to 84 Years | 23 | 2.1% |
| 85 Years and Over | 37 | 3.3% |
| Total | 1,119 | 100.0% |
Housing Finances in Boardman
Median Income by Occupancy in Boardman
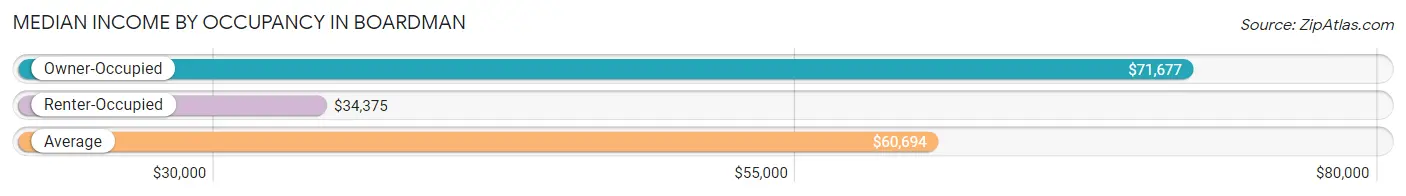
| Occupancy Type | # Households | Median Income |
| Owner-Occupied | 596 (53.3%) | $71,677 |
| Renter-Occupied | 523 (46.7%) | $34,375 |
| Average | 1,119 (100.0%) | $60,694 |
Occupancy by Householder Income Bracket in Boardman
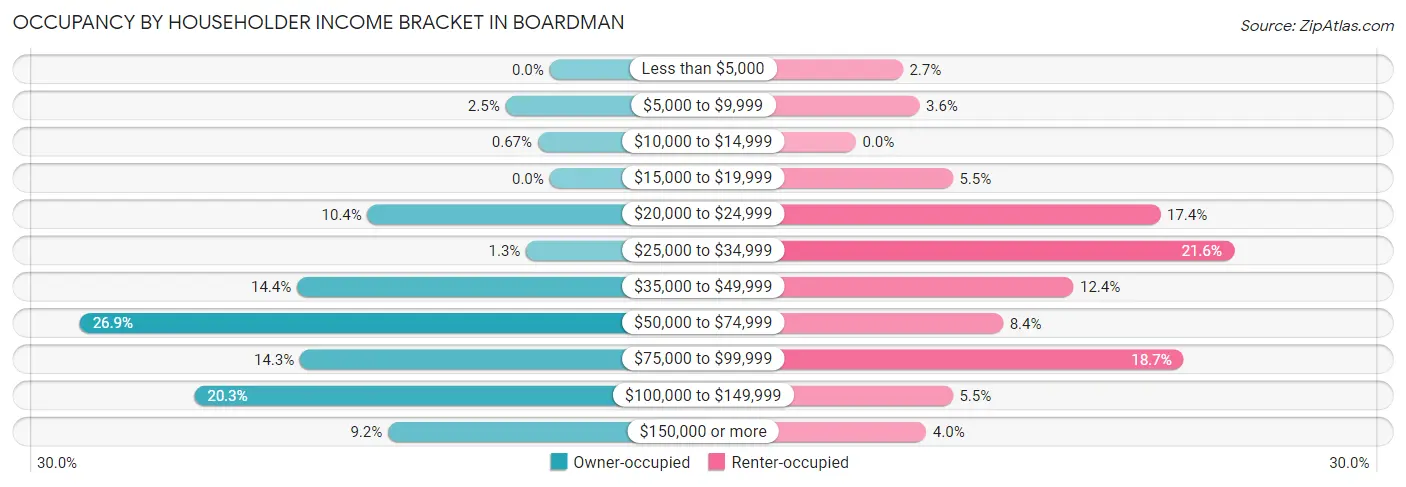
| Income Bracket | Owner-occupied | Renter-occupied |
| Less than $5,000 | 0 (0.0%) | 14 (2.7%) |
| $5,000 to $9,999 | 15 (2.5%) | 19 (3.6%) |
| $10,000 to $14,999 | 4 (0.7%) | 0 (0.0%) |
| $15,000 to $19,999 | 0 (0.0%) | 29 (5.5%) |
| $20,000 to $24,999 | 62 (10.4%) | 91 (17.4%) |
| $25,000 to $34,999 | 8 (1.3%) | 113 (21.6%) |
| $35,000 to $49,999 | 86 (14.4%) | 65 (12.4%) |
| $50,000 to $74,999 | 160 (26.9%) | 44 (8.4%) |
| $75,000 to $99,999 | 85 (14.3%) | 98 (18.7%) |
| $100,000 to $149,999 | 121 (20.3%) | 29 (5.5%) |
| $150,000 or more | 55 (9.2%) | 21 (4.0%) |
| Total | 596 (100.0%) | 523 (100.0%) |
Monthly Housing Cost Tiers in Boardman
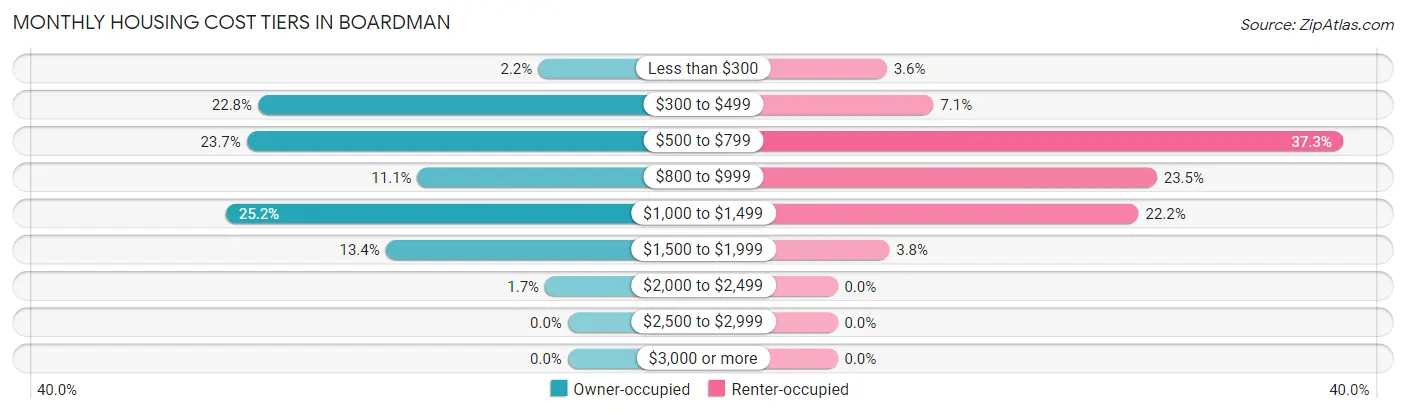
| Monthly Cost | Owner-occupied | Renter-occupied |
| Less than $300 | 13 (2.2%) | 19 (3.6%) |
| $300 to $499 | 136 (22.8%) | 37 (7.1%) |
| $500 to $799 | 141 (23.7%) | 195 (37.3%) |
| $800 to $999 | 66 (11.1%) | 123 (23.5%) |
| $1,000 to $1,499 | 150 (25.2%) | 116 (22.2%) |
| $1,500 to $1,999 | 80 (13.4%) | 20 (3.8%) |
| $2,000 to $2,499 | 10 (1.7%) | 0 (0.0%) |
| $2,500 to $2,999 | 0 (0.0%) | 0 (0.0%) |
| $3,000 or more | 0 (0.0%) | 0 (0.0%) |
| Total | 596 (100.0%) | 523 (100.0%) |
Physical Housing Characteristics in Boardman
Housing Structures in Boardman
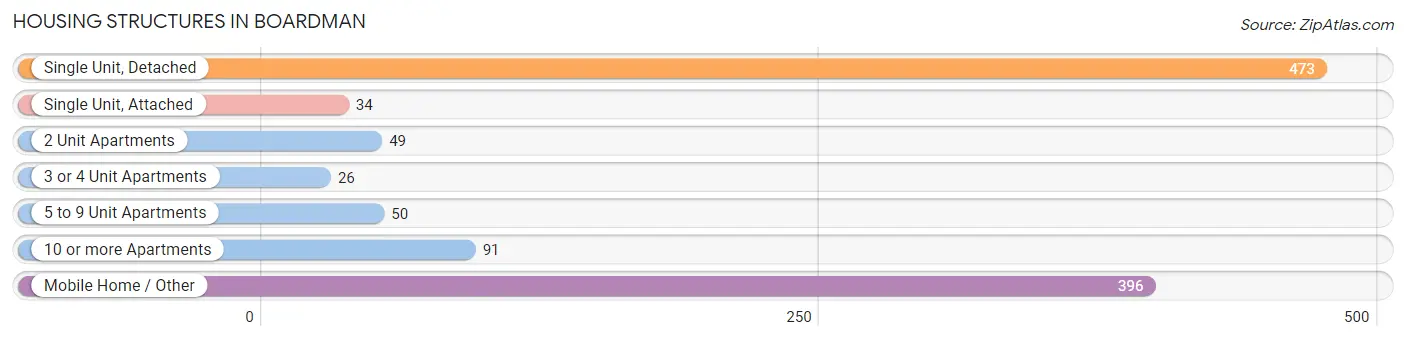
| Structure Type | # Housing Units | % Housing Units |
| Single Unit, Detached | 473 | 42.3% |
| Single Unit, Attached | 34 | 3.0% |
| 2 Unit Apartments | 49 | 4.4% |
| 3 or 4 Unit Apartments | 26 | 2.3% |
| 5 to 9 Unit Apartments | 50 | 4.5% |
| 10 or more Apartments | 91 | 8.1% |
| Mobile Home / Other | 396 | 35.4% |
| Total | 1,119 | 100.0% |
Housing Structures by Occupancy in Boardman
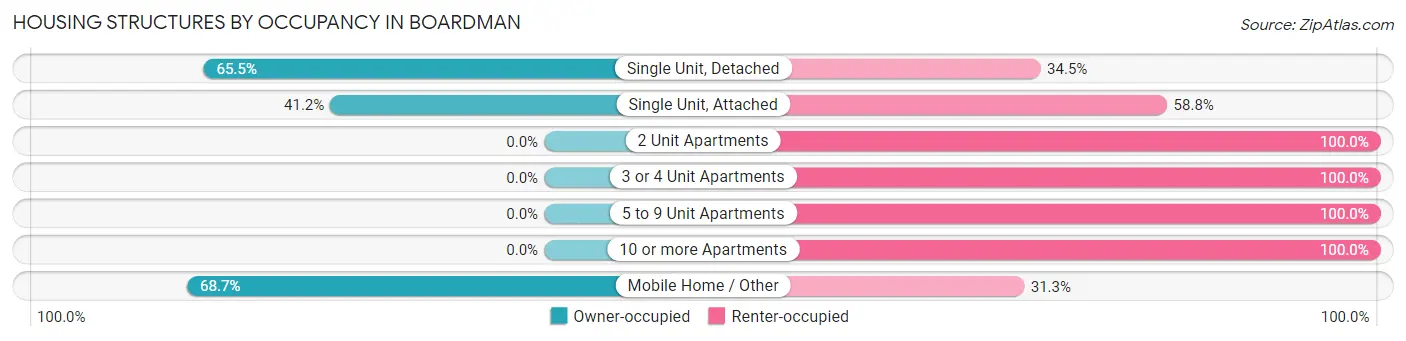
| Structure Type | Owner-occupied | Renter-occupied |
| Single Unit, Detached | 310 (65.5%) | 163 (34.5%) |
| Single Unit, Attached | 14 (41.2%) | 20 (58.8%) |
| 2 Unit Apartments | 0 (0.0%) | 49 (100.0%) |
| 3 or 4 Unit Apartments | 0 (0.0%) | 26 (100.0%) |
| 5 to 9 Unit Apartments | 0 (0.0%) | 50 (100.0%) |
| 10 or more Apartments | 0 (0.0%) | 91 (100.0%) |
| Mobile Home / Other | 272 (68.7%) | 124 (31.3%) |
| Total | 596 (53.3%) | 523 (46.7%) |
Housing Structures by Number of Rooms in Boardman
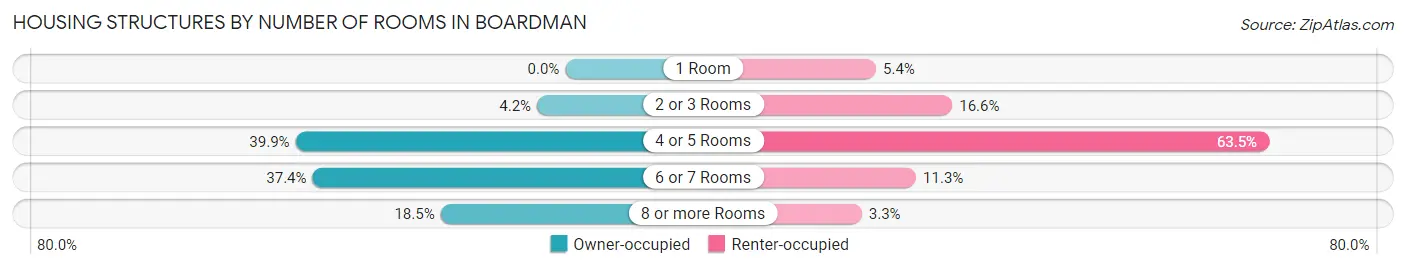
| Number of Rooms | Owner-occupied | Renter-occupied |
| 1 Room | 0 (0.0%) | 28 (5.3%) |
| 2 or 3 Rooms | 25 (4.2%) | 87 (16.6%) |
| 4 or 5 Rooms | 238 (39.9%) | 332 (63.5%) |
| 6 or 7 Rooms | 223 (37.4%) | 59 (11.3%) |
| 8 or more Rooms | 110 (18.5%) | 17 (3.3%) |
| Total | 596 (100.0%) | 523 (100.0%) |
Housing Structure by Heating Type in Boardman
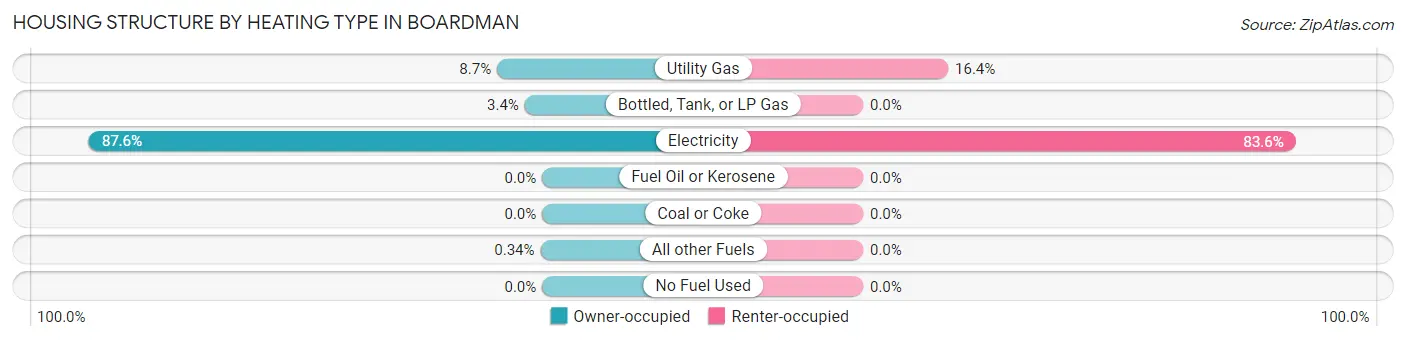
| Heating Type | Owner-occupied | Renter-occupied |
| Utility Gas | 52 (8.7%) | 86 (16.4%) |
| Bottled, Tank, or LP Gas | 20 (3.4%) | 0 (0.0%) |
| Electricity | 522 (87.6%) | 437 (83.6%) |
| Fuel Oil or Kerosene | 0 (0.0%) | 0 (0.0%) |
| Coal or Coke | 0 (0.0%) | 0 (0.0%) |
| All other Fuels | 2 (0.3%) | 0 (0.0%) |
| No Fuel Used | 0 (0.0%) | 0 (0.0%) |
| Total | 596 (100.0%) | 523 (100.0%) |
Household Vehicle Usage in Boardman
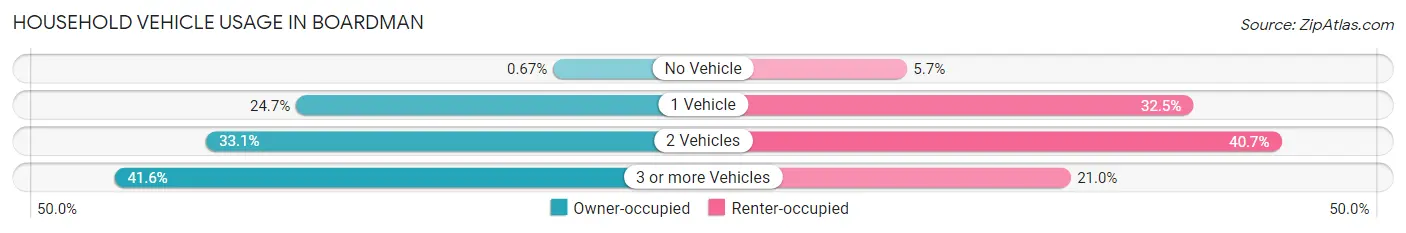
| Vehicles per Household | Owner-occupied | Renter-occupied |
| No Vehicle | 4 (0.7%) | 30 (5.7%) |
| 1 Vehicle | 147 (24.7%) | 170 (32.5%) |
| 2 Vehicles | 197 (33.1%) | 213 (40.7%) |
| 3 or more Vehicles | 248 (41.6%) | 110 (21.0%) |
| Total | 596 (100.0%) | 523 (100.0%) |
Real Estate & Mortgages in Boardman
Real Estate and Mortgage Overview in Boardman
| Characteristic | Without Mortgage | With Mortgage |
| Housing Units | 266 | 330 |
| Median Property Value | - | - |
| Median Household Income | $52,981 | $32 |
| Monthly Housing Costs | $477 | $0 |
| Real Estate Taxes | $1,471 | $0 |
Property Value by Mortgage Status in Boardman
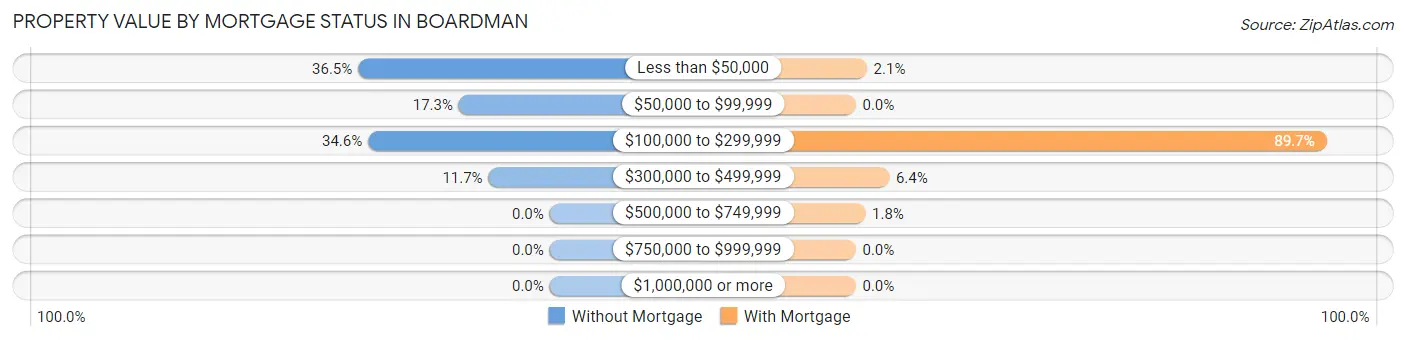
| Property Value | Without Mortgage | With Mortgage |
| Less than $50,000 | 97 (36.5%) | 7 (2.1%) |
| $50,000 to $99,999 | 46 (17.3%) | 0 (0.0%) |
| $100,000 to $299,999 | 92 (34.6%) | 296 (89.7%) |
| $300,000 to $499,999 | 31 (11.7%) | 21 (6.4%) |
| $500,000 to $749,999 | 0 (0.0%) | 6 (1.8%) |
| $750,000 to $999,999 | 0 (0.0%) | 0 (0.0%) |
| $1,000,000 or more | 0 (0.0%) | 0 (0.0%) |
| Total | 266 (100.0%) | 330 (100.0%) |
Household Income by Mortgage Status in Boardman
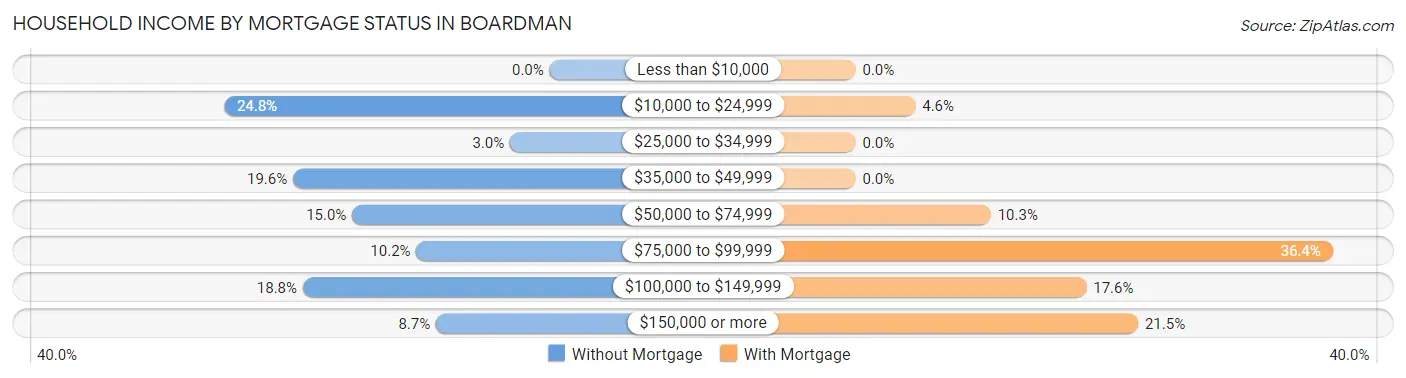
| Household Income | Without Mortgage | With Mortgage |
| Less than $10,000 | 0 (0.0%) | 0 (0.0%) |
| $10,000 to $24,999 | 66 (24.8%) | 15 (4.5%) |
| $25,000 to $34,999 | 8 (3.0%) | 0 (0.0%) |
| $35,000 to $49,999 | 52 (19.6%) | 0 (0.0%) |
| $50,000 to $74,999 | 40 (15.0%) | 34 (10.3%) |
| $75,000 to $99,999 | 27 (10.2%) | 120 (36.4%) |
| $100,000 to $149,999 | 50 (18.8%) | 58 (17.6%) |
| $150,000 or more | 23 (8.6%) | 71 (21.5%) |
| Total | 266 (100.0%) | 330 (100.0%) |
Property Value to Household Income Ratio in Boardman
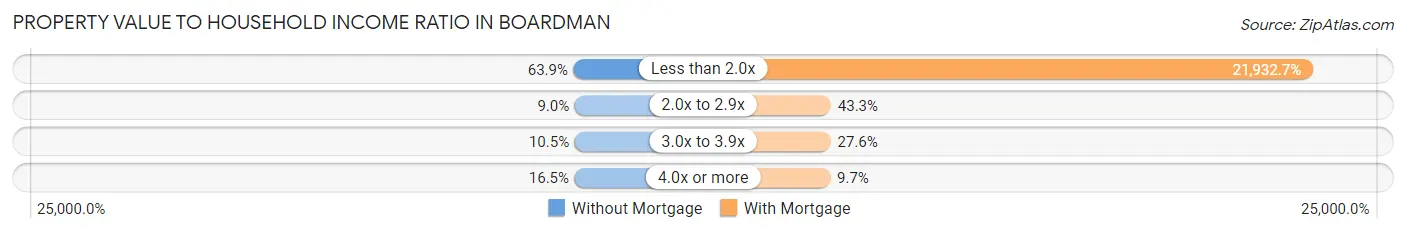
| Value-to-Income Ratio | Without Mortgage | With Mortgage |
| Less than 2.0x | 170 (63.9%) | 72,378 (21,932.7%) |
| 2.0x to 2.9x | 24 (9.0%) | 143 (43.3%) |
| 3.0x to 3.9x | 28 (10.5%) | 91 (27.6%) |
| 4.0x or more | 44 (16.5%) | 32 (9.7%) |
| Total | 266 (100.0%) | 330 (100.0%) |
Real Estate Taxes by Mortgage Status in Boardman
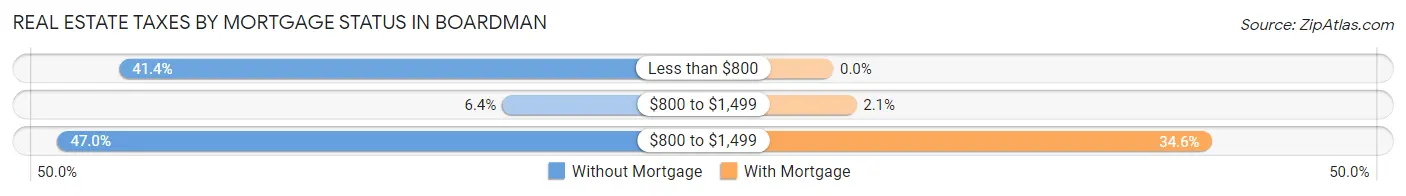
| Property Taxes | Without Mortgage | With Mortgage |
| Less than $800 | 110 (41.3%) | 0 (0.0%) |
| $800 to $1,499 | 17 (6.4%) | 7 (2.1%) |
| $800 to $1,499 | 125 (47.0%) | 114 (34.5%) |
| Total | 266 (100.0%) | 330 (100.0%) |
Health & Disability in Boardman
Health Insurance Coverage by Age in Boardman
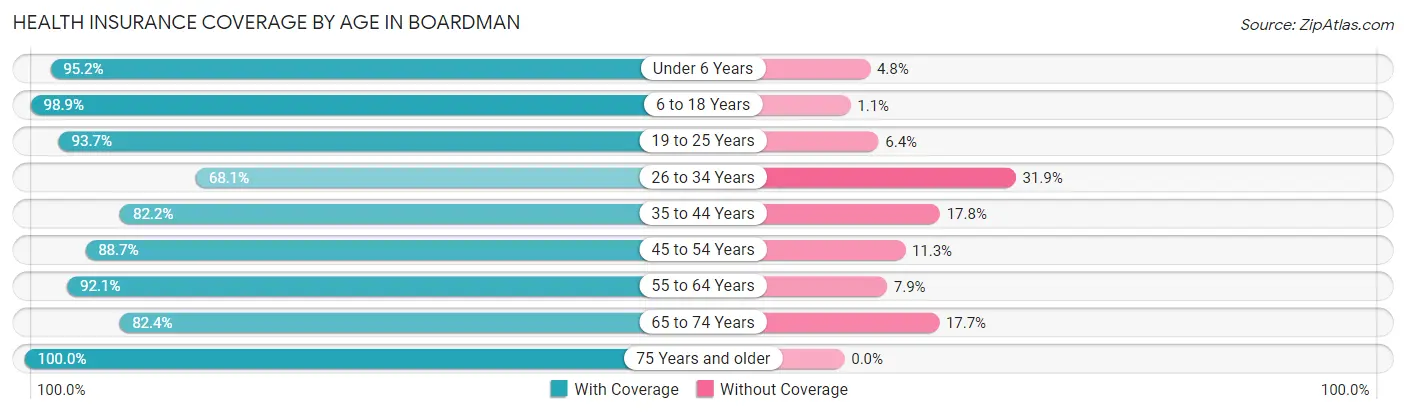
| Age Bracket | With Coverage | Without Coverage |
| Under 6 Years | 398 (95.2%) | 20 (4.8%) |
| 6 to 18 Years | 962 (98.9%) | 11 (1.1%) |
| 19 to 25 Years | 280 (93.6%) | 19 (6.4%) |
| 26 to 34 Years | 405 (68.1%) | 190 (31.9%) |
| 35 to 44 Years | 485 (82.2%) | 105 (17.8%) |
| 45 to 54 Years | 196 (88.7%) | 25 (11.3%) |
| 55 to 64 Years | 418 (92.1%) | 36 (7.9%) |
| 65 to 74 Years | 140 (82.4%) | 30 (17.6%) |
| 75 Years and older | 110 (100.0%) | 0 (0.0%) |
| Total | 3,394 (88.6%) | 436 (11.4%) |
Health Insurance Coverage by Citizenship Status in Boardman
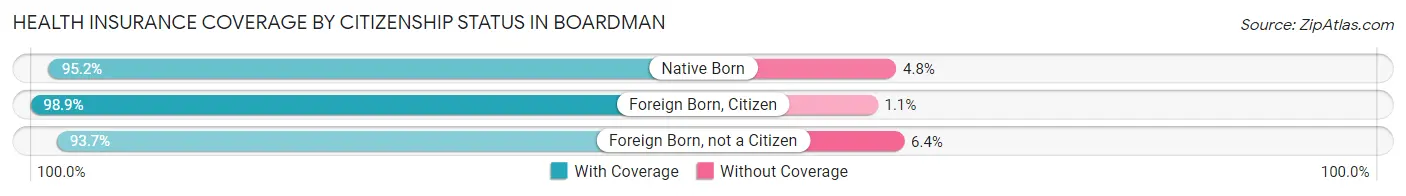
| Citizenship Status | With Coverage | Without Coverage |
| Native Born | 398 (95.2%) | 20 (4.8%) |
| Foreign Born, Citizen | 962 (98.9%) | 11 (1.1%) |
| Foreign Born, not a Citizen | 280 (93.6%) | 19 (6.4%) |
Health Insurance Coverage by Household Income in Boardman
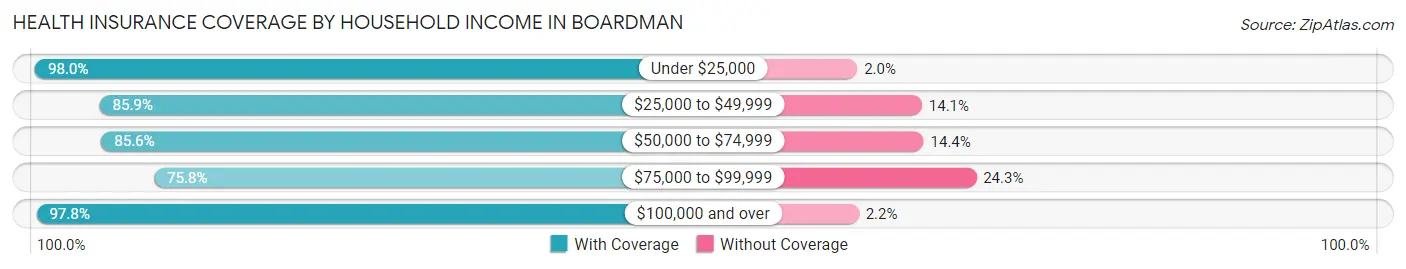
| Household Income | With Coverage | Without Coverage |
| Under $25,000 | 450 (98.0%) | 9 (2.0%) |
| $25,000 to $49,999 | 721 (85.9%) | 118 (14.1%) |
| $50,000 to $74,999 | 845 (85.6%) | 142 (14.4%) |
| $75,000 to $99,999 | 456 (75.7%) | 146 (24.2%) |
| $100,000 and over | 922 (97.8%) | 21 (2.2%) |
Public vs Private Health Insurance Coverage by Age in Boardman
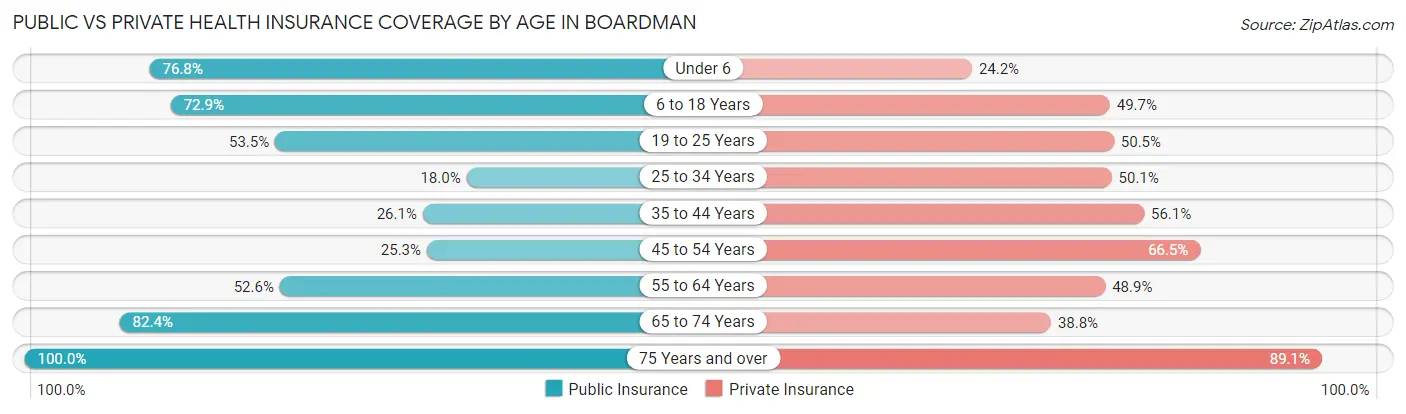
| Age Bracket | Public Insurance | Private Insurance |
| Under 6 | 321 (76.8%) | 101 (24.2%) |
| 6 to 18 Years | 709 (72.9%) | 484 (49.7%) |
| 19 to 25 Years | 160 (53.5%) | 151 (50.5%) |
| 25 to 34 Years | 107 (18.0%) | 298 (50.1%) |
| 35 to 44 Years | 154 (26.1%) | 331 (56.1%) |
| 45 to 54 Years | 56 (25.3%) | 147 (66.5%) |
| 55 to 64 Years | 239 (52.6%) | 222 (48.9%) |
| 65 to 74 Years | 140 (82.4%) | 66 (38.8%) |
| 75 Years and over | 110 (100.0%) | 98 (89.1%) |
| Total | 1,996 (52.1%) | 1,898 (49.6%) |
Disability Status by Sex by Age in Boardman
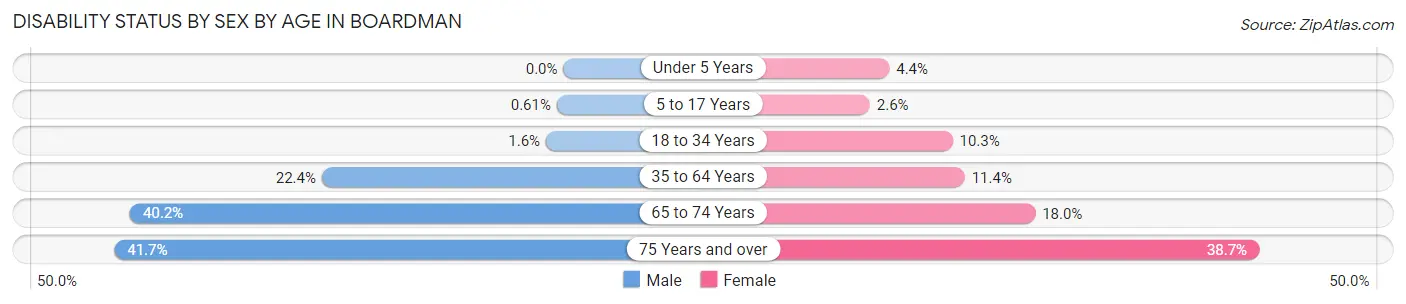
| Age Bracket | Male | Female |
| Under 5 Years | 0 (0.0%) | 9 (4.4%) |
| 5 to 17 Years | 3 (0.6%) | 11 (2.6%) |
| 18 to 34 Years | 10 (1.6%) | 41 (10.3%) |
| 35 to 64 Years | 150 (22.4%) | 68 (11.4%) |
| 65 to 74 Years | 37 (40.2%) | 14 (17.9%) |
| 75 Years and over | 20 (41.7%) | 24 (38.7%) |
Disability Class by Sex by Age in Boardman
Disability Class: Hearing Difficulty
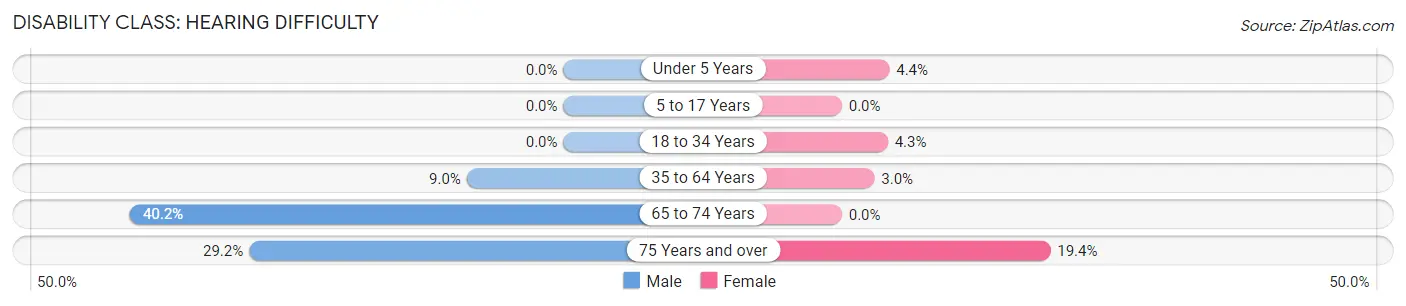
| Age Bracket | Male | Female |
| Under 5 Years | 0 (0.0%) | 9 (4.4%) |
| 5 to 17 Years | 0 (0.0%) | 0 (0.0%) |
| 18 to 34 Years | 0 (0.0%) | 17 (4.3%) |
| 35 to 64 Years | 60 (9.0%) | 18 (3.0%) |
| 65 to 74 Years | 37 (40.2%) | 0 (0.0%) |
| 75 Years and over | 14 (29.2%) | 12 (19.4%) |
Disability Class: Vision Difficulty
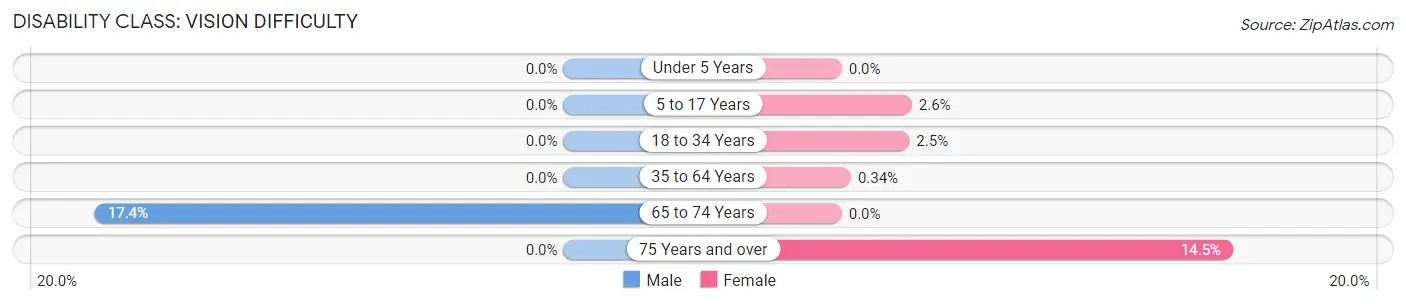
| Age Bracket | Male | Female |
| Under 5 Years | 0 (0.0%) | 0 (0.0%) |
| 5 to 17 Years | 0 (0.0%) | 11 (2.6%) |
| 18 to 34 Years | 0 (0.0%) | 10 (2.5%) |
| 35 to 64 Years | 0 (0.0%) | 2 (0.3%) |
| 65 to 74 Years | 16 (17.4%) | 0 (0.0%) |
| 75 Years and over | 0 (0.0%) | 9 (14.5%) |
Disability Class: Cognitive Difficulty
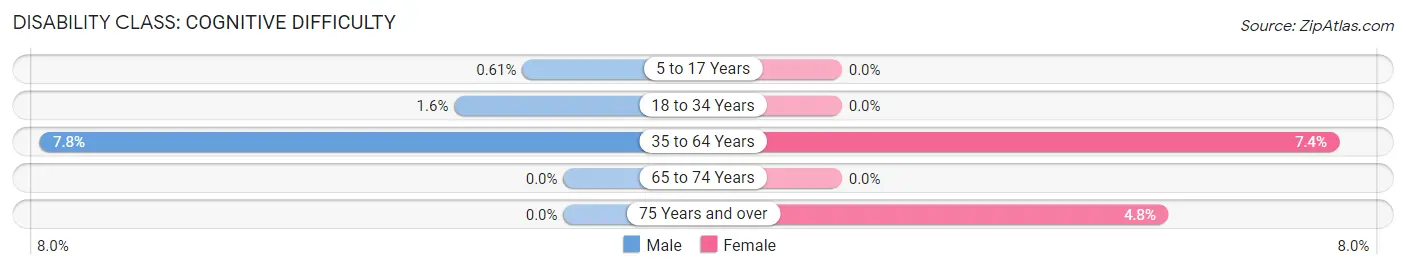
| Age Bracket | Male | Female |
| 5 to 17 Years | 3 (0.6%) | 0 (0.0%) |
| 18 to 34 Years | 10 (1.6%) | 0 (0.0%) |
| 35 to 64 Years | 52 (7.8%) | 44 (7.4%) |
| 65 to 74 Years | 0 (0.0%) | 0 (0.0%) |
| 75 Years and over | 0 (0.0%) | 3 (4.8%) |
Disability Class: Ambulatory Difficulty
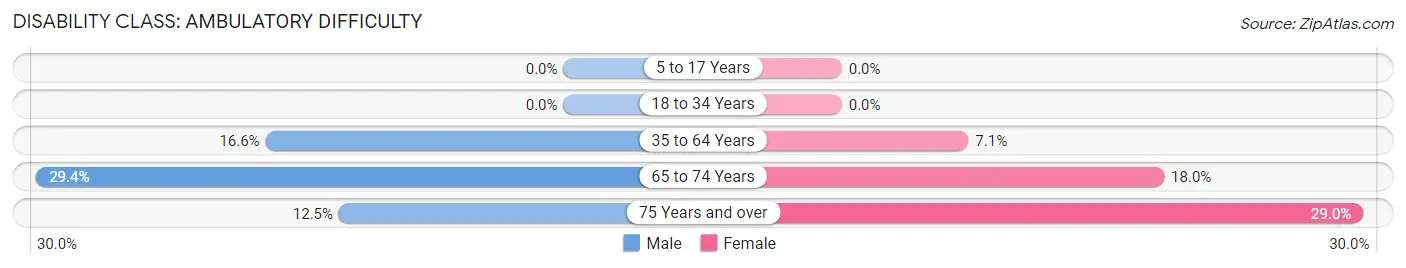
| Age Bracket | Male | Female |
| 5 to 17 Years | 0 (0.0%) | 0 (0.0%) |
| 18 to 34 Years | 0 (0.0%) | 0 (0.0%) |
| 35 to 64 Years | 111 (16.6%) | 42 (7.0%) |
| 65 to 74 Years | 27 (29.3%) | 14 (17.9%) |
| 75 Years and over | 6 (12.5%) | 18 (29.0%) |
Disability Class: Self-Care Difficulty
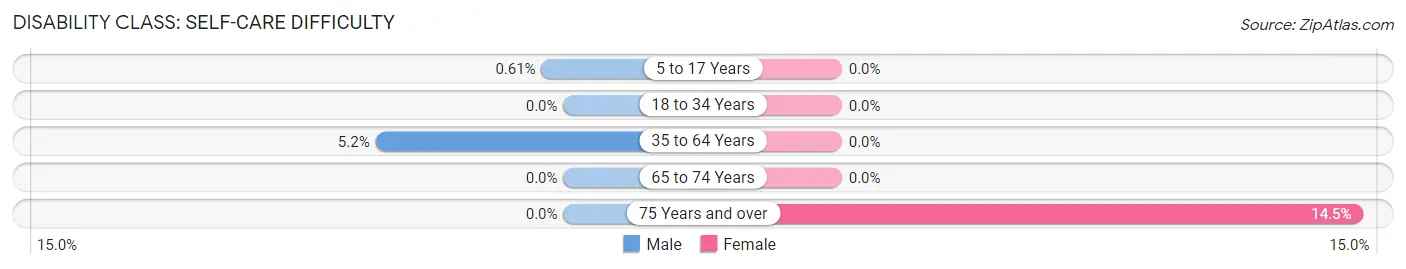
| Age Bracket | Male | Female |
| 5 to 17 Years | 3 (0.6%) | 0 (0.0%) |
| 18 to 34 Years | 0 (0.0%) | 0 (0.0%) |
| 35 to 64 Years | 35 (5.2%) | 0 (0.0%) |
| 65 to 74 Years | 0 (0.0%) | 0 (0.0%) |
| 75 Years and over | 0 (0.0%) | 9 (14.5%) |
Technology Access in Boardman
Computing Device Access in Boardman
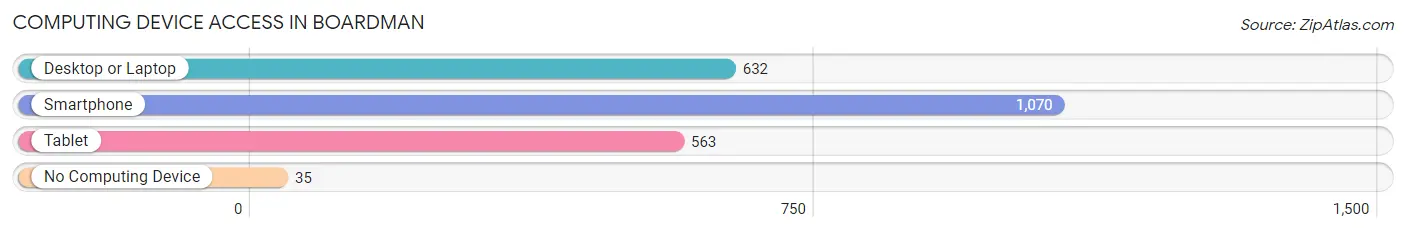
| Device Type | # Households | % Households |
| Desktop or Laptop | 632 | 56.5% |
| Smartphone | 1,070 | 95.6% |
| Tablet | 563 | 50.3% |
| No Computing Device | 35 | 3.1% |
| Total | 1,119 | 100.0% |
Internet Access in Boardman
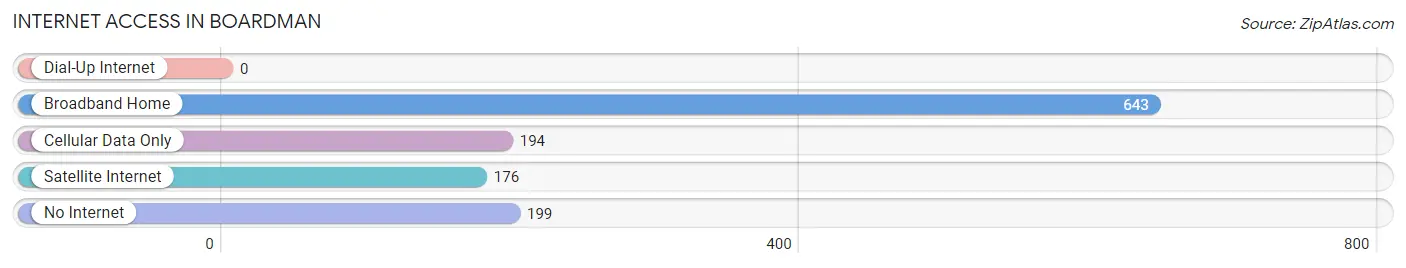
| Internet Type | # Households | % Households |
| Dial-Up Internet | 0 | 0.0% |
| Broadband Home | 643 | 57.5% |
| Cellular Data Only | 194 | 17.3% |
| Satellite Internet | 176 | 15.7% |
| No Internet | 199 | 17.8% |
| Total | 1,119 | 100.0% |
Boardman Summary
Boardman, Oregon is a small city located in the northeastern corner of the state, in Morrow County. It is situated along the Columbia River, and is part of the Hermiston-Pendleton-Boardman metropolitan area. The city has a population of 2,737, according to the 2010 census, and is the largest city in Morrow County.
History
Boardman was founded in 1881 by the Oregon Railway and Navigation Company, which was looking to build a rail line along the Columbia River. The town was named after the company's president, William Boardman. The town was incorporated in 1911, and the first post office was established in 1912.
The town grew slowly, but steadily, over the years, and by the 1950s, Boardman had become a major agricultural center. The town was home to several grain elevators, and the area was known for its wheat and barley production.
In the late 1960s, the town began to experience a period of rapid growth, as the nearby Hanford Nuclear Reservation began to expand. This brought an influx of new residents to the area, and Boardman's population grew from 1,000 in 1960 to over 2,000 by the 1980s.
Geography
Boardman is located in the northeastern corner of Oregon, in Morrow County. It is situated along the Columbia River, and is part of the Hermiston-Pendleton-Boardman metropolitan area. The city has a total area of 2.2 square miles, all of which is land.
The city is located in a semi-arid climate zone, with hot summers and cold winters. The average annual temperature is around 50 degrees Fahrenheit, and the average annual precipitation is around 10 inches.
Economy
Boardman's economy is largely based on agriculture and food processing. The area is known for its wheat and barley production, and the town is home to several grain elevators. The town is also home to several food processing plants, including a potato processing plant and a frozen food plant.
The town is also home to several manufacturing companies, including a plastics manufacturer and a metal fabrication plant. The town is also home to a number of retail stores, restaurants, and other businesses.
Demographics
According to the 2010 census, Boardman has a population of 2,737. The racial makeup of the city is 87.3% White, 0.7% African American, 0.7% Native American, 0.7% Asian, 0.2% Pacific Islander, 8.2% from other races, and 2.2% from two or more races. Hispanic or Latino of any race were 15.2% of the population.
The median household income in Boardman is $37,917, and the median family income is $45,938. The per capita income in Boardman is $17,945. The town has a poverty rate of 17.3%.
Conclusion
Boardman, Oregon is a small city located in the northeastern corner of the state, in Morrow County. It is situated along the Columbia River, and is part of the Hermiston-Pendleton-Boardman metropolitan area. The city has a population of 2,737, according to the 2010 census, and is the largest city in Morrow County. Boardman's economy is largely based on agriculture and food processing, and the town is home to several grain elevators, food processing plants, and manufacturing companies. The racial makeup of the city is 87.3% White, 0.7% African American, 0.7% Native American, 0.7% Asian, 0.2% Pacific Islander, 8.2% from other races, and 2.2% from two or more races. The median household income in Boardman is $37,917, and the median family income is $45,938. The per capita income in Boardman is $17,945. The town has a poverty rate of 17.3%.
Common Questions
What is the Total Population of Boardman?
Total Population of Boardman is 3,830.
What is the Total Male Population of Boardman?
Total Male Population of Boardman is 2,068.
What is the Total Female Population of Boardman?
Total Female Population of Boardman is 1,762.
What is the Ratio of Males per 100 Females in Boardman?
There are 117.37 Males per 100 Females in Boardman.
What is the Ratio of Females per 100 Males in Boardman?
There are 85.20 Females per 100 Males in Boardman.
What is the Median Population Age in Boardman?
Median Population Age in Boardman is 29.0 Years.
What is the Average Family Size in Boardman
Average Family Size in Boardman is 3.8 People.
What is the Average Household Size in Boardman
Average Household Size in Boardman is 3.4 People.
What is Per Capita Income in Boardman?
Per Capita income in Boardman is $21,888.
What is the Median Family Income in Boardman?
Median Family Income in Boardman is $66,131.
What is the Median Household income in Boardman?
Median Household Income in Boardman is $60,694.
What is Income or Wage Gap in Boardman?
Income or Wage Gap in Boardman is 0.2%.
Women in Boardman earn 99.8 cents for every dollar earned by a man.
What is Inequality or Gini Index in Boardman?
Inequality or Gini Index in Boardman is 0.39.
How Large is the Labor Force in Boardman?
There are 1,803 People in the Labor Forcein in Boardman.
What is the Percentage of People in the Labor Force in Boardman?
66.1% of People are in the Labor Force in Boardman.
What is the Unemployment Rate in Boardman?
Unemployment Rate in Boardman is 1.8%.