Cities with the Lowest Percentage of Births to Unmarried Women in Oregon
RELATED REPORTS & OPTIONS
Lowest Illegitimacy | All Women
Oregon
Compare Cities
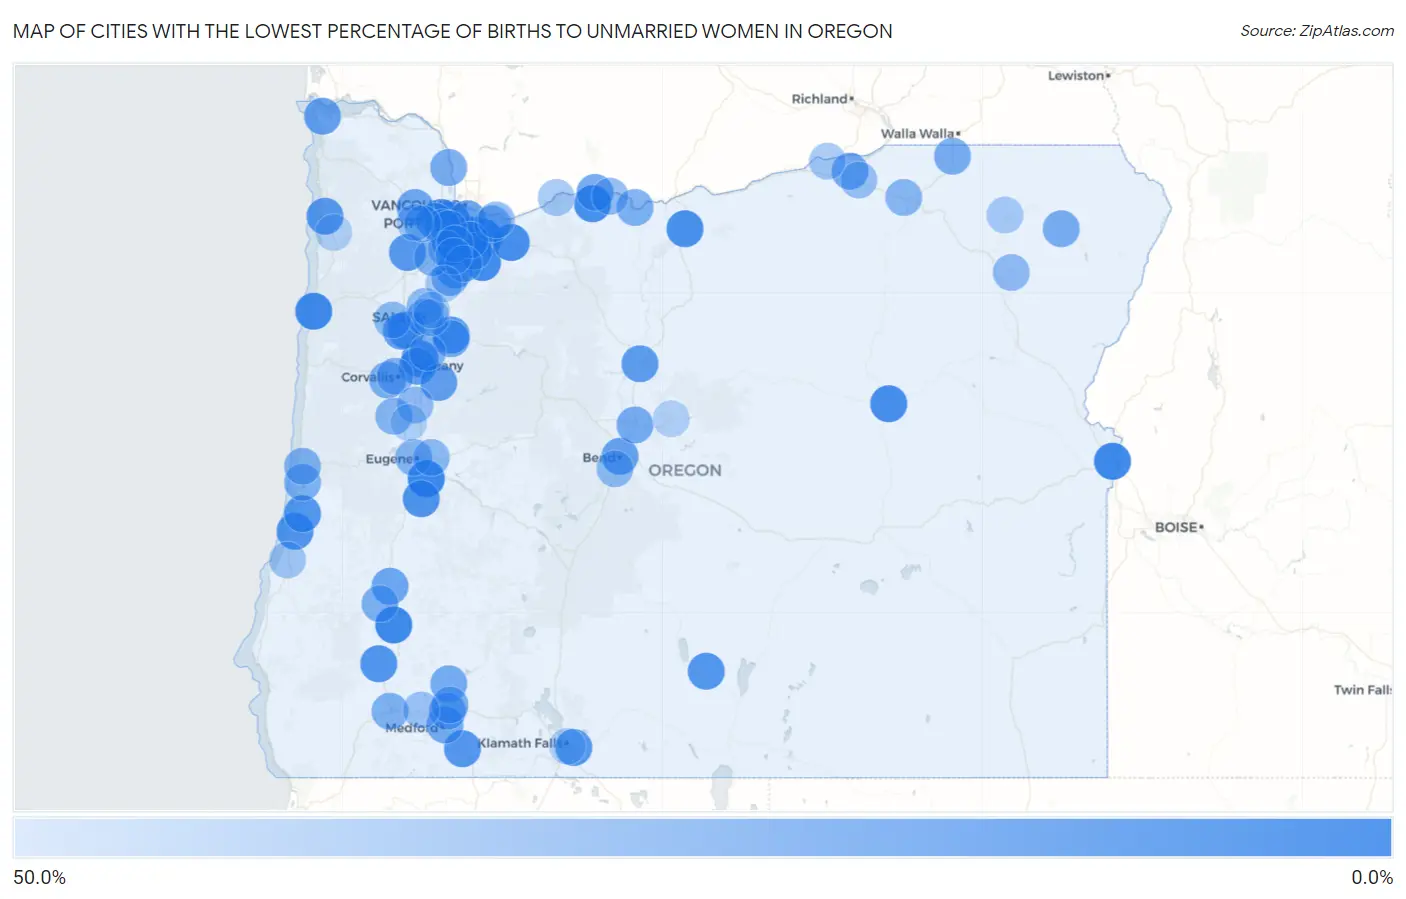
Map of Cities with the Lowest Percentage of Births to Unmarried Women in Oregon
50.0%
0.0%
Cities with the Lowest Percentage of Births to Unmarried Women in Oregon
| City | % Unmarried | vs State | vs National | |
| 1. | Lake Oswego | 1.6% | 23.4%(-21.8)#1 | 32.1%(-30.5)#44 |
| 2. | Happy Valley | 2.0% | 23.4%(-21.4)#2 | 32.1%(-30.1)#60 |
| 3. | Creswell | 2.9% | 23.4%(-20.5)#3 | 32.1%(-29.2)#124 |
| 4. | Ontario | 4.1% | 23.4%(-19.3)#4 | 32.1%(-28.0)#190 |
| 5. | Tri City | 4.3% | 23.4%(-19.1)#5 | 32.1%(-27.8)#206 |
| 6. | Lincoln City | 4.9% | 23.4%(-18.5)#6 | 32.1%(-27.2)#260 |
| 7. | Beavercreek | 5.3% | 23.4%(-18.1)#7 | 32.1%(-26.8)#294 |
| 8. | Milwaukie | 6.4% | 23.4%(-17.0)#8 | 32.1%(-25.7)#389 |
| 9. | Odell | 6.5% | 23.4%(-16.9)#9 | 32.1%(-25.6)#399 |
| 10. | Sandy | 6.9% | 23.4%(-16.5)#10 | 32.1%(-25.2)#433 |
| 11. | Canyon City | 7.1% | 23.4%(-16.3)#11 | 32.1%(-25.0)#461 |
| 12. | Tualatin | 8.0% | 23.4%(-15.4)#12 | 32.1%(-24.1)#554 |
| 13. | Cedar Mill | 8.2% | 23.4%(-15.2)#13 | 32.1%(-23.9)#570 |
| 14. | Moro | 8.3% | 23.4%(-15.1)#14 | 32.1%(-23.8)#603 |
| 15. | Oatfield | 9.0% | 23.4%(-14.4)#15 | 32.1%(-23.1)#665 |
| 16. | Millersburg | 9.4% | 23.4%(-14.0)#16 | 32.1%(-22.7)#724 |
| 17. | Cottage Grove | 10.1% | 23.4%(-13.3)#17 | 32.1%(-22.0)#807 |
| 18. | Lakeside | 10.7% | 23.4%(-12.7)#18 | 32.1%(-21.4)#873 |
| 19. | Glendale | 11.1% | 23.4%(-12.3)#19 | 32.1%(-21.0)#921 |
| 20. | Reedsport | 11.8% | 23.4%(-11.6)#20 | 32.1%(-20.3)#1,008 |
| 21. | Paisley | 11.8% | 23.4%(-11.6)#21 | 32.1%(-20.3)#1,015 |
| 22. | Ashland | 12.8% | 23.4%(-10.6)#22 | 32.1%(-19.3)#1,145 |
| 23. | Yamhill | 13.0% | 23.4%(-10.4)#23 | 32.1%(-19.1)#1,183 |
| 24. | Garibaldi | 13.0% | 23.4%(-10.4)#24 | 32.1%(-19.1)#1,184 |
| 25. | Rockcreek | 13.1% | 23.4%(-10.3)#25 | 32.1%(-19.0)#1,191 |
| 26. | Altamont | 13.5% | 23.4%(-9.90)#26 | 32.1%(-18.6)#1,236 |
| 27. | Sublimity | 13.9% | 23.4%(-9.50)#27 | 32.1%(-18.2)#1,287 |
| 28. | Albany | 15.5% | 23.4%(-7.90)#28 | 32.1%(-16.6)#1,500 |
| 29. | Independence | 15.7% | 23.4%(-7.70)#29 | 32.1%(-16.4)#1,535 |
| 30. | Madras | 16.0% | 23.4%(-7.40)#30 | 32.1%(-16.1)#1,577 |
| 31. | Lebanon | 16.1% | 23.4%(-7.30)#31 | 32.1%(-16.0)#1,588 |
| 32. | Hillsboro | 17.4% | 23.4%(-6.00)#32 | 32.1%(-14.7)#1,770 |
| 33. | Tigard | 17.8% | 23.4%(-5.60)#33 | 32.1%(-14.3)#1,829 |
| 34. | Bend | 18.7% | 23.4%(-4.70)#34 | 32.1%(-13.4)#1,948 |
| 35. | Aurora | 18.8% | 23.4%(-4.60)#35 | 32.1%(-13.3)#1,980 |
| 36. | Warrenton | 19.0% | 23.4%(-4.40)#36 | 32.1%(-13.1)#2,008 |
| 37. | Monmouth | 19.1% | 23.4%(-4.30)#37 | 32.1%(-13.0)#2,022 |
| 38. | Portland | 19.9% | 23.4%(-3.50)#38 | 32.1%(-12.2)#2,110 |
| 39. | Oregon City | 20.3% | 23.4%(-3.10)#39 | 32.1%(-11.8)#2,215 |
| 40. | Roseburg | 21.0% | 23.4%(-2.40)#40 | 32.1%(-11.1)#2,294 |
| 41. | Banks | 22.0% | 23.4%(-1.40)#41 | 32.1%(-10.1)#2,439 |
| 42. | Hood River | 22.7% | 23.4%(-0.700)#42 | 32.1%(-9.40)#2,538 |
| 43. | Hermiston | 23.1% | 23.4%(-0.300)#43 | 32.1%(-9.00)#2,585 |
| 44. | Medford | 23.6% | 23.4%(+0.200)#44 | 32.1%(-8.50)#2,662 |
| 45. | Salem | 24.1% | 23.4%(+0.700)#45 | 32.1%(-8.00)#2,725 |
| 46. | Shady Cove | 24.1% | 23.4%(+0.700)#46 | 32.1%(-8.00)#2,733 |
| 47. | White City | 24.5% | 23.4%(+1.10)#47 | 32.1%(-7.60)#2,764 |
| 48. | Redmond | 24.6% | 23.4%(+1.20)#48 | 32.1%(-7.50)#2,772 |
| 49. | Stayton | 24.6% | 23.4%(+1.20)#49 | 32.1%(-7.50)#2,776 |
| 50. | St Helens | 24.8% | 23.4%(+1.40)#50 | 32.1%(-7.30)#2,788 |
| 51. | Milton Freewater | 25.0% | 23.4%(+1.60)#51 | 32.1%(-7.10)#2,810 |
| 52. | Lostine | 25.0% | 23.4%(+1.60)#52 | 32.1%(-7.10)#2,883 |
| 53. | Philomath | 25.5% | 23.4%(+2.10)#53 | 32.1%(-6.60)#2,948 |
| 54. | Hubbard | 25.8% | 23.4%(+2.40)#54 | 32.1%(-6.30)#2,983 |
| 55. | The Dalles | 26.3% | 23.4%(+2.90)#55 | 32.1%(-5.80)#3,043 |
| 56. | Winston | 26.9% | 23.4%(+3.50)#56 | 32.1%(-5.20)#3,146 |
| 57. | Newberg | 27.1% | 23.4%(+3.70)#57 | 32.1%(-5.00)#3,176 |
| 58. | Dunes City | 27.3% | 23.4%(+3.90)#58 | 32.1%(-4.80)#3,211 |
| 59. | Eagle Point | 27.4% | 23.4%(+4.00)#59 | 32.1%(-4.70)#3,237 |
| 60. | Grants Pass | 27.7% | 23.4%(+4.30)#60 | 32.1%(-4.40)#3,274 |
| 61. | Florence | 28.3% | 23.4%(+4.90)#61 | 32.1%(-3.80)#3,365 |
| 62. | Corvallis | 28.8% | 23.4%(+5.40)#62 | 32.1%(-3.30)#3,453 |
| 63. | Jefferson | 29.2% | 23.4%(+5.80)#63 | 32.1%(-2.90)#3,500 |
| 64. | Gresham | 29.4% | 23.4%(+6.00)#64 | 32.1%(-2.70)#3,519 |
| 65. | King City | 30.2% | 23.4%(+6.80)#65 | 32.1%(-1.90)#3,662 |
| 66. | Aloha | 30.4% | 23.4%(+7.00)#66 | 32.1%(-1.70)#3,679 |
| 67. | Oak Grove | 30.6% | 23.4%(+7.20)#67 | 32.1%(-1.50)#3,718 |
| 68. | Eugene | 30.7% | 23.4%(+7.30)#68 | 32.1%(-1.40)#3,725 |
| 69. | Monroe | 30.8% | 23.4%(+7.40)#69 | 32.1%(-1.30)#3,756 |
| 70. | Beaverton | 31.0% | 23.4%(+7.60)#70 | 32.1%(-1.10)#3,773 |
| 71. | Sherwood | 31.1% | 23.4%(+7.70)#71 | 32.1%(-1.00)#3,794 |
| 72. | Pendleton | 31.1% | 23.4%(+7.70)#72 | 32.1%(-1.00)#3,795 |
| 73. | Cornelius | 31.8% | 23.4%(+8.40)#73 | 32.1%(-0.300)#3,895 |
| 74. | Dallas | 32.6% | 23.4%(+9.20)#74 | 32.1%(+0.500)#3,988 |
| 75. | Deschutes River Woods | 32.6% | 23.4%(+9.20)#75 | 32.1%(+0.500)#3,991 |
| 76. | Springfield | 33.1% | 23.4%(+9.70)#76 | 32.1%(+1.00)#4,045 |
| 77. | Union | 33.3% | 23.4%(+9.90)#77 | 32.1%(+1.20)#4,113 |
| 78. | Durham | 33.3% | 23.4%(+9.90)#78 | 32.1%(+1.20)#4,119 |
| 79. | Halsey | 33.3% | 23.4%(+9.90)#79 | 32.1%(+1.20)#4,135 |
| 80. | Mosier | 33.3% | 23.4%(+9.90)#80 | 32.1%(+1.20)#4,194 |
| 81. | Troutdale | 34.2% | 23.4%(+10.8)#81 | 32.1%(+2.10)#4,328 |
| 82. | Keizer | 34.5% | 23.4%(+11.1)#82 | 32.1%(+2.40)#4,358 |
| 83. | Stanfield | 36.6% | 23.4%(+13.2)#83 | 32.1%(+4.50)#4,637 |
| 84. | Canby | 37.3% | 23.4%(+13.9)#84 | 32.1%(+5.20)#4,719 |
| 85. | Gold Hill | 37.5% | 23.4%(+14.1)#85 | 32.1%(+5.40)#4,763 |
| 86. | Four Corners | 39.1% | 23.4%(+15.7)#86 | 32.1%(+7.00)#4,973 |
| 87. | Forest Grove | 39.6% | 23.4%(+16.2)#87 | 32.1%(+7.50)#5,029 |
| 88. | North Bend | 39.6% | 23.4%(+16.2)#88 | 32.1%(+7.50)#5,031 |
| 89. | Irrigon | 40.0% | 23.4%(+16.6)#89 | 32.1%(+7.90)#5,087 |
| 90. | Cascade Locks | 40.0% | 23.4%(+16.6)#90 | 32.1%(+7.90)#5,092 |
| 91. | Wilsonville | 41.3% | 23.4%(+17.9)#91 | 32.1%(+9.20)#5,297 |
| 92. | Elgin | 42.3% | 23.4%(+18.9)#92 | 32.1%(+10.2)#5,435 |
| 93. | Woodburn | 42.9% | 23.4%(+19.5)#93 | 32.1%(+10.8)#5,483 |
| 94. | Hayesville | 44.7% | 23.4%(+21.3)#94 | 32.1%(+12.6)#5,738 |
| 95. | Harrisburg | 45.1% | 23.4%(+21.7)#95 | 32.1%(+13.0)#5,781 |
| 96. | Klamath Falls | 45.7% | 23.4%(+22.3)#96 | 32.1%(+13.6)#5,855 |
| 97. | Tillamook | 45.7% | 23.4%(+22.3)#97 | 32.1%(+13.6)#5,860 |
| 98. | Prineville | 46.3% | 23.4%(+22.9)#98 | 32.1%(+14.2)#5,929 |
| 99. | River Road | 47.4% | 23.4%(+24.0)#99 | 32.1%(+15.3)#6,081 |
| 100. | Santa Clara | 48.4% | 23.4%(+25.0)#100 | 32.1%(+16.3)#6,193 |
Common Questions
What are the Top 10 Cities with the Lowest Percentage of Births to Unmarried Women in Oregon?
Top 10 Cities with the Lowest Percentage of Births to Unmarried Women in Oregon are:
#1
1.6%
#2
2.0%
#3
2.9%
#4
4.1%
#5
4.3%
#6
4.9%
#7
5.3%
#8
6.4%
#9
6.5%
#10
6.9%
What city has the Lowest Percentage of Births to Unmarried Women in Oregon?
Lake Oswego has the Lowest Percentage of Births to Unmarried Women in Oregon with 1.6%.
What is the Percentage of Births to Unmarried Women in the State of Oregon?
Percentage of Births to Unmarried Women in Oregon is 23.4%.
What is the Percentage of Births to Unmarried Women in the United States?
Percentage of Births to Unmarried Women in the United States is 32.1%.