Cities with the Highest Percentage of Immigrants from Australia in Oregon

RELATED REPORTS & OPTIONS

Australia
Population
Families and Households
Female Fertility
Female Fertility (Unmarried)
Race (Community Size)
Race (Percentage)
Ancestry (Community Size)
AfghanAfricanAlaska NativeAlaskan AthabascanAlbanianAleutAlsatianAmericanApacheArabArapahoArgentineanArmenianAssyrian / Chaldean / SyriacAustralianAustrianBahamianBangladeshiBarbadianBasqueBelgianBelizeanBermudanBhutaneseBlackfeetBolivianBrazilianBritishBritish West IndianBulgarianBurmeseCajunCambodianCanadianCape VerdeanCarpatho RusynCelticCentral AmericanCentral American IndianCherokeeCheyenneChickasawChileanChineseChippewaChoctawColombianColvilleComancheCosta RicanCreeCreekCroatianCrowCubanCypriotCzechCzechoslovakianDanishDelawareDominicanDutchDutch West IndianEastern EuropeanEcuadorianEgyptianEnglishEstonianEthiopianEuropeanFijianFilipinoFinnishFrenchFrench American IndianFrench CanadianGermanGerman RussianGhanaianGreekGuamanian / ChamorroGuatemalanGuyaneseHaitianHmongHonduranHopiHoumaHungarianIcelanderIndian (Asian)IndonesianInupiatIranianIraqiIrishIroquoisIsraeliItalianJamaicanJapaneseJordanianKenyanKiowaKoreanLaotianLatvianLebaneseLiberianLithuanianLumbeeLuxembourgerMacedonianMalaysianMalteseMarshalleseMenomineeMexicanMexican American IndianMongolianMoroccanNative HawaiianNavajoNepaleseNew ZealanderNicaraguanNigerianNorthern EuropeanNorwegianOkinawanOsageOttawaPaiutePakistaniPalestinianPanamanianParaguayanPennsylvania GermanPeruvianPimaPolishPortuguesePotawatomiPuebloPuerto RicanPuget Sound SalishRomanianRussianSalvadoranSamoanScandinavianScotch-IrishScottishSeminoleSenegaleseSerbianShoshoneSierra LeoneanSiouxSlavicSlovakSloveneSomaliSouth AfricanSouth AmericanSouth American IndianSoviet UnionSpaniardSpanishSpanish AmericanSpanish American IndianSri LankanSubsaharan AfricanSudaneseSwedishSwissSyrianTaiwaneseThaiTlingit-HaidaTohono O'OdhamTonganTrinidadian and TobagonianTsimshianTurkishU.S. Virgin IslanderUgandanUkrainianUruguayanUteVenezuelanVietnameseWelshWest IndianYakamaYaquiYugoslavianYumanYup'ikZimbabwean
Ancestry (Percentage)
AfghanAfricanAlaska NativeAlaskan AthabascanAlbanianAleutAlsatianAmericanApacheArabArapahoArgentineanArmenianAssyrian / Chaldean / SyriacAustralianAustrianBahamianBangladeshiBarbadianBasqueBelgianBelizeanBermudanBhutaneseBlackfeetBolivianBrazilianBritishBritish West IndianBulgarianBurmeseCajunCambodianCanadianCape VerdeanCarpatho RusynCelticCentral AmericanCentral American IndianCherokeeCheyenneChickasawChileanChineseChippewaChoctawColombianColvilleComancheCosta RicanCreeCreekCroatianCrowCubanCypriotCzechCzechoslovakianDanishDelawareDominicanDutchDutch West IndianEastern EuropeanEcuadorianEgyptianEnglishEstonianEthiopianEuropeanFijianFilipinoFinnishFrenchFrench American IndianFrench CanadianGermanGerman RussianGhanaianGreekGuamanian / ChamorroGuatemalanGuyaneseHaitianHmongHonduranHopiHoumaHungarianIcelanderIndian (Asian)IndonesianInupiatIranianIraqiIrishIroquoisIsraeliItalianJamaicanJapaneseJordanianKenyanKiowaKoreanLaotianLatvianLebaneseLiberianLithuanianLumbeeLuxembourgerMacedonianMalaysianMalteseMarshalleseMenomineeMexicanMexican American IndianMongolianMoroccanNative HawaiianNavajoNepaleseNew ZealanderNicaraguanNigerianNorthern EuropeanNorwegianOkinawanOsageOttawaPaiutePakistaniPalestinianPanamanianParaguayanPennsylvania GermanPeruvianPimaPolishPortuguesePotawatomiPuebloPuerto RicanPuget Sound SalishRomanianRussianSalvadoranSamoanScandinavianScotch-IrishScottishSeminoleSenegaleseSerbianShoshoneSierra LeoneanSiouxSlavicSlovakSloveneSomaliSouth AfricanSouth AmericanSouth American IndianSoviet UnionSpaniardSpanishSpanish AmericanSpanish American IndianSri LankanSubsaharan AfricanSudaneseSwedishSwissSyrianTaiwaneseThaiTlingit-HaidaTohono O'OdhamTonganTrinidadian and TobagonianTsimshianTurkishU.S. Virgin IslanderUgandanUkrainianUruguayanUteVenezuelanVietnameseWelshWest IndianYakamaYaquiYugoslavianYumanYup'ikZimbabwean
Immigrant Origin (Total)
AfghanistanAfricaAlbaniaArgentinaArmeniaAsiaAustraliaAustriaAzoresBahamasBangladeshBarbadosBelarusBelgiumBelizeBoliviaBosnia and HerzegovinaBrazilBulgariaBurma / MyanmarCabo VerdeCambodiaCameroonCanadaCaribbeanCentral AmericaChileChinaColombiaCongoCosta RicaCroatiaCubaCzechoslovakiaDenmarkDominicaDominican RepublicEastern AfricaEastern AsiaEastern EuropeEcuadorEgyptEl SalvadorEnglandEritreaEthiopiaEuropeFijiFranceGermanyGhanaGreeceGrenadaGuatemalaGuyanaHaitiHondurasHong KongHungaryIndiaIndonesiaIranIraqIrelandIsraelItalyJamaicaJapanJordanKazakhstanKenyaKoreaKuwaitLaosLatin AmericaLatviaLebanonLiberiaLithuaniaMalaysiaMexicoMicronesiaMiddle AfricaMoldovaMoroccoNepalNetherlandsNicaraguaNigeriaNorth MacedoniaNorthern AfricaNorthern EuropeNorwayOceaniaPakistanPanamaPeruPhilippinesPolandPortugalRomaniaRussiaSaudi ArabiaScotlandSenegalSerbiaSierra LeoneSingaporeSomaliaSouth AfricaSouth AmericaSouth Central AsiaSouth Eastern AsiaSouthern EuropeSpainSri LankaSt. Vincent and the GrenadinesSudanSwedenSwitzerlandSyriaTaiwanThailandTrinidad and TobagoTurkeyUgandaUkraineUruguayUzbekistanVenezuelaVietnamWest IndiesWestern AfricaWestern AsiaWestern EuropeYemenZaireZimbabwe
Immigrant Origin (Percentage)
AfghanistanAfricaAlbaniaArgentinaArmeniaAsiaAustraliaAustriaAzoresBahamasBangladeshBarbadosBelarusBelgiumBelizeBoliviaBosnia and HerzegovinaBrazilBulgariaBurma / MyanmarCabo VerdeCambodiaCameroonCanadaCaribbeanCentral AmericaChileChinaColombiaCongoCosta RicaCroatiaCubaCzechoslovakiaDenmarkDominicaDominican RepublicEastern AfricaEastern AsiaEastern EuropeEcuadorEgyptEl SalvadorEnglandEritreaEthiopiaEuropeFijiFranceGermanyGhanaGreeceGrenadaGuatemalaGuyanaHaitiHondurasHong KongHungaryIndiaIndonesiaIranIraqIrelandIsraelItalyJamaicaJapanJordanKazakhstanKenyaKoreaKuwaitLaosLatin AmericaLatviaLebanonLiberiaLithuaniaMalaysiaMexicoMicronesiaMiddle AfricaMoldovaMoroccoNepalNetherlandsNicaraguaNigeriaNorth MacedoniaNorthern AfricaNorthern EuropeNorwayOceaniaPakistanPanamaPeruPhilippinesPolandPortugalRomaniaRussiaSaudi ArabiaScotlandSenegalSerbiaSierra LeoneSingaporeSomaliaSouth AfricaSouth AmericaSouth Central AsiaSouth Eastern AsiaSouthern EuropeSpainSri LankaSt. Vincent and the GrenadinesSudanSwedenSwitzerlandSyriaTaiwanThailandTrinidad and TobagoTurkeyUgandaUkraineUruguayUzbekistanVenezuelaVietnamWest IndiesWestern AfricaWestern AsiaWestern EuropeYemenZaireZimbabwe
Income
Income (Families)
Income (Households)
Poverty
Poverty (Families)
Unemployment
Employment Occupations
Employment Industries
Employer Class
Commute Time
Commute Means
School Enrollment
Education by Degree Field
Occupancy
Finances
Physical Characteristics
Oregon
Compare Cities
Comparison Subject

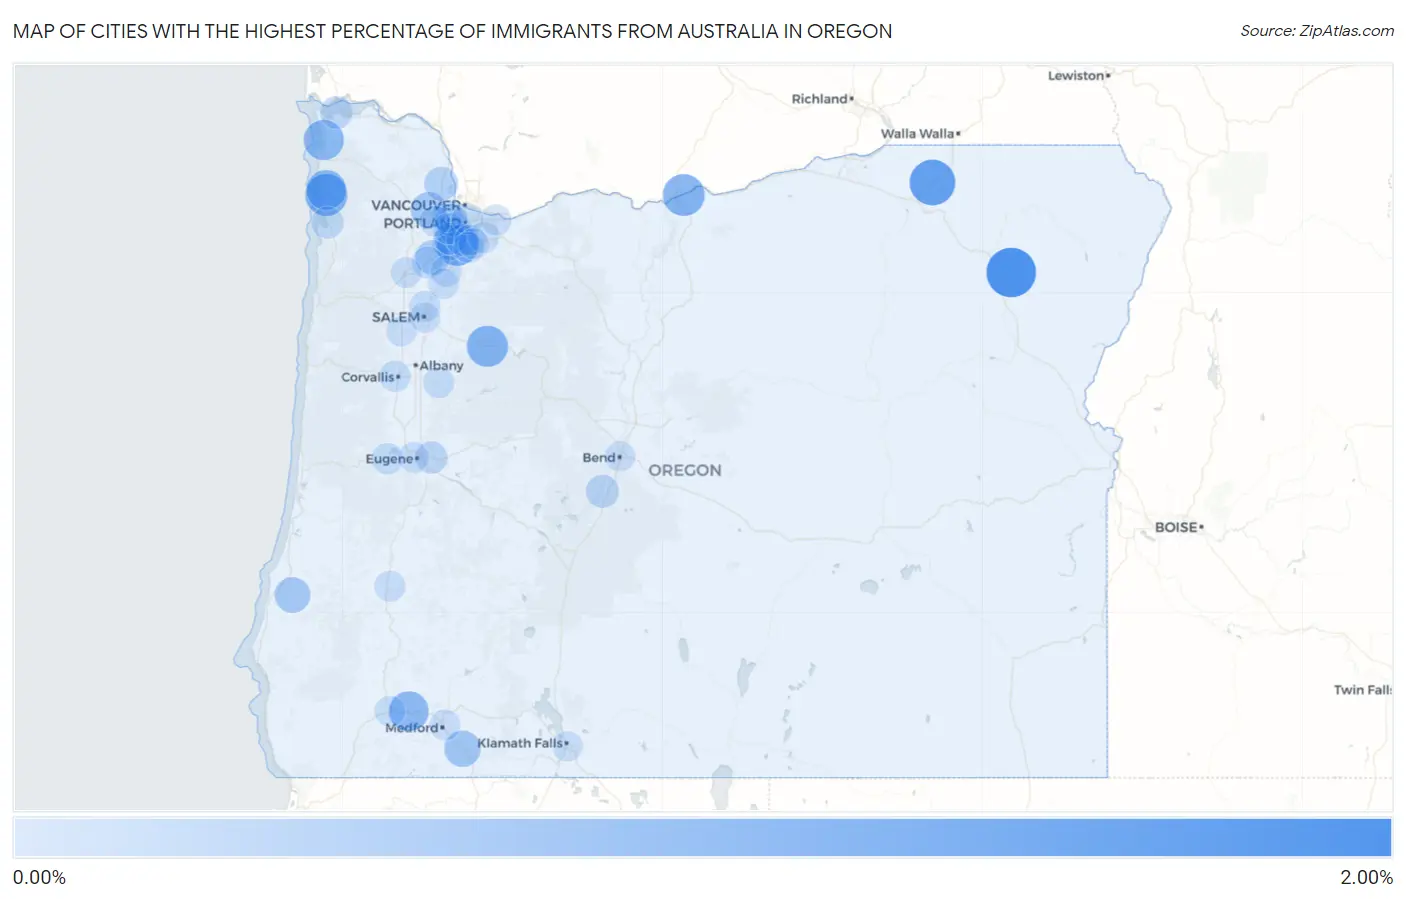
Map of Cities with the Highest Percentage of Immigrants from Australia in Oregon

0.00%
2.00%
Cities with the Highest Percentage of Immigrants from Australia in Oregon Map

Cities with the Highest Percentage of Immigrants from Australia in Oregon

City Australia vs State vs National
1.Union1.54%0.050%(+1.49)#-10.030%(+1.51)#0
2.Adams1.22%0.050%(+1.17)#00.030%(+1.19)#1
3.Wheeler0.93%0.050%(+0.883)#10.030%(+0.903)#2
4.Rufus0.91%0.050%(+0.860)#20.030%(+0.879)#3
5.Rivergrove0.90%0.050%(+0.846)#30.030%(+0.866)#4
6.Mill City0.85%0.050%(+0.803)#40.030%(+0.823)#5
7.Gearhart0.78%0.050%(+0.727)#50.030%(+0.747)#6
8.Rogue River0.75%0.050%(+0.702)#60.030%(+0.721)#7
9.Nehalem0.74%0.050%(+0.694)#70.030%(+0.714)#8
10.Ashland0.49%0.050%(+0.436)#80.030%(+0.456)#9
11.North Plains0.45%0.050%(+0.396)#90.030%(+0.416)#10
12.Coquille0.42%0.050%(+0.374)#100.030%(+0.394)#11
13.King City0.36%0.050%(+0.306)#110.030%(+0.326)#12
14.Newberg0.32%0.050%(+0.274)#120.030%(+0.293)#13
15.Scappoose0.29%0.050%(+0.238)#130.030%(+0.258)#14
16.Dunthorpe0.23%0.050%(+0.177)#140.030%(+0.197)#15
17.Three Rivers0.21%0.050%(+0.163)#150.030%(+0.183)#16
18.Raleigh Hills0.19%0.050%(+0.143)#160.030%(+0.163)#17
19.Astoria0.18%0.050%(+0.127)#170.030%(+0.147)#18
20.Springfield0.16%0.050%(+0.112)#180.030%(+0.132)#2,120
21.Cedar Mill0.16%0.050%(+0.112)#190.030%(+0.132)#2,121
22.Bay City0.13%0.050%(+0.085)#200.030%(+0.105)#2,122
23.Tigard0.13%0.050%(+0.081)#210.030%(+0.101)#2,123
24.Bethany0.13%0.050%(+0.080)#220.030%(+0.099)#2,124
25.Lake Oswego0.13%0.050%(+0.077)#230.030%(+0.096)#2,125
26.Dundee0.12%0.050%(+0.075)#240.030%(+0.094)#2,126
27.Santa Clara0.088%0.050%(+0.038)#250.030%(+0.058)#2,127
28.Beaverton0.087%0.050%(+0.038)#260.030%(+0.057)#2,128
29.Donald0.087%0.050%(+0.037)#270.030%(+0.057)#2,129
30.Portland0.086%0.050%(+0.036)#280.030%(+0.056)#2,130
31.Corvallis0.083%0.050%(+0.034)#290.030%(+0.054)#2,131
32.Veneta0.077%0.050%(+0.028)#300.030%(+0.048)#2,132
33.Keizer0.066%0.050%(+0.017)#310.030%(+0.037)#2,133
34.Lebanon0.065%0.050%(+0.015)#320.030%(+0.035)#2,134
35.Oak Grove0.057%0.050%(+0.007)#330.030%(+0.027)#2,135
36.Grants Pass0.051%0.050%(+0.002)#340.030%(+0.021)#2,136
37.Roseburg0.051%0.050%(+0.001)#350.030%(+0.021)#2,137
38.Eugene0.050%0.050%(+0.001)#360.030%(+0.021)#2,138
39.Happy Valley0.049%0.050%(-0.000)#370.030%(+0.020)#2,139
40.Medford0.048%0.050%(-0.002)#380.030%(+0.018)#2,140
41.Mcminnville0.044%0.050%(-0.006)#390.030%(+0.014)#2,141
42.Troutdale0.043%0.050%(-0.006)#400.030%(+0.014)#2,142
43.Hillsboro0.043%0.050%(-0.006)#410.030%(+0.013)#2,143
44.West Linn0.040%0.050%(-0.009)#420.030%(+0.011)#2,144
45.Woodburn0.038%0.050%(-0.011)#430.030%(+0.008)#2,145
46.Gladstone0.033%0.050%(-0.016)#440.030%(+0.004)#2,146
47.Monmouth0.027%0.050%(-0.022)#450.030%(-0.003)#2,147
48.Bend0.024%0.050%(-0.025)#460.030%(-0.006)#2,148
49.Klamath Falls0.023%0.050%(-0.027)#470.030%(-0.007)#2,149
50.Salem0.020%0.050%(-0.030)#480.030%(-0.010)#2,150

Common Questions

What are the Top 10 Cities with the Highest Percentage of Immigrants from Australia in Oregon?
Top 10 Cities with the Highest Percentage of Immigrants from Australia in Oregon are:
#1
1.54%
#2
1.22%
#3
0.93%
#4
0.91%
#5
0.90%
#6
0.85%
#7
0.78%
#8
0.75%
#9
0.74%
#10
0.49%
What city has the Highest Percentage of Immigrants from Australia in Oregon?
Union has the Highest Percentage of Immigrants from Australia in Oregon with 1.54%.
What is the Percentage of Immigrants from Australia in the State of Oregon?
Percentage of Immigrants from Australia in Oregon is 0.050%.
What is the Percentage of Immigrants from Australia in the United States?
Percentage of Immigrants from Australia in the United States is 0.030%.