South Lebanon, OR
South Lebanon Map
South Lebanon Overview
1,084
TOTAL POPULATION
493
MALE POPULATION
591
FEMALE POPULATION
83.42
MALES / 100 FEMALES
119.88
FEMALES / 100 MALES
46.5
MEDIAN AGE
3.0
AVG FAMILY SIZE
2.6
AVG HOUSEHOLD SIZE
$26,399
PER CAPITA INCOME
$60,313
AVG FAMILY INCOME
$54,507
AVG HOUSEHOLD INCOME
0.39
INEQUALITY / GINI INDEX
521
LABOR FORCE [ PEOPLE ]
58.3%
PERCENT IN LABOR FORCE
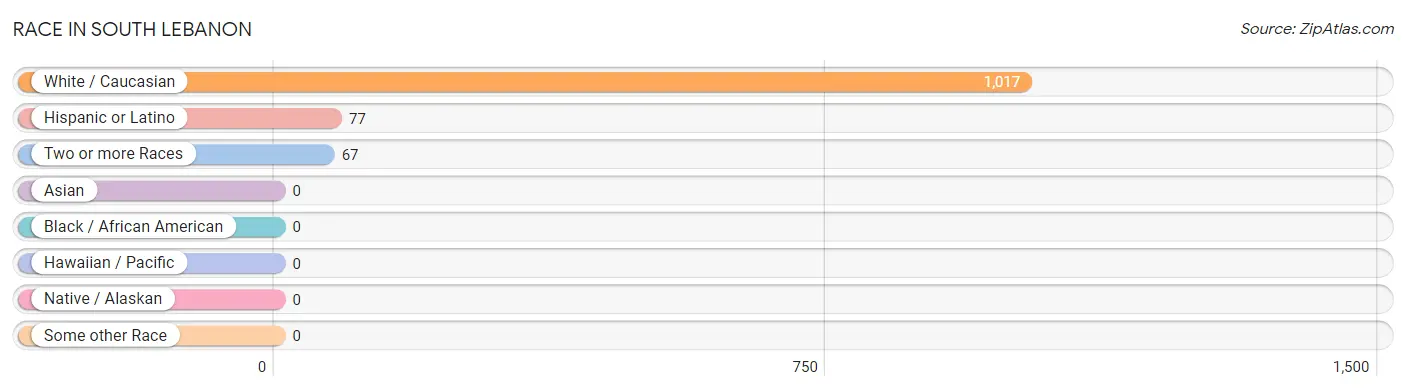
Race in South Lebanon
The most populous races in South Lebanon are White / Caucasian (1,017 | 93.8%), Hispanic or Latino (77 | 7.1%), and Two or more Races (67 | 6.2%).
| Race | # Population | % Population |
| Asian | 0 | 0.0% |
| Black / African American | 0 | 0.0% |
| Hawaiian / Pacific | 0 | 0.0% |
| Hispanic or Latino | 77 | 7.1% |
| Native / Alaskan | 0 | 0.0% |
| White / Caucasian | 1,017 | 93.8% |
| Two or more Races | 67 | 6.2% |
| Some other Race | 0 | 0.0% |
| Total | 1,084 | 100.0% |
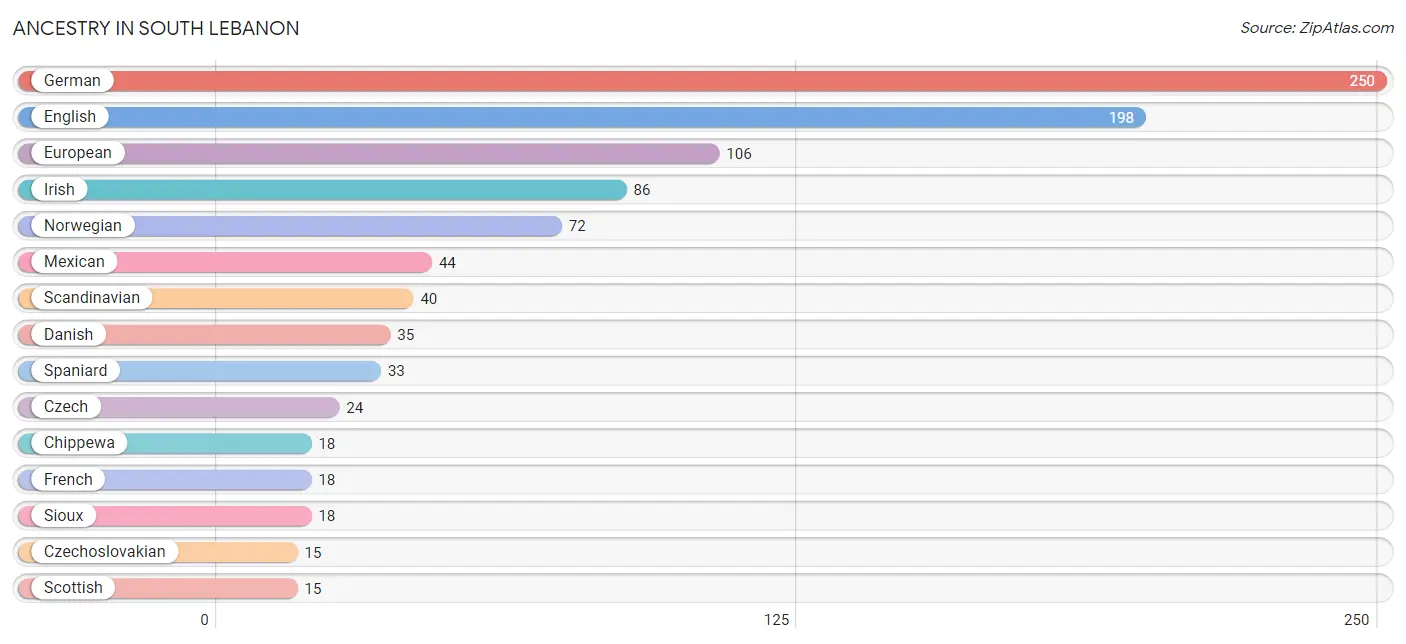
Ancestry in South Lebanon
The most populous ancestries reported in South Lebanon are German (250 | 23.1%), English (198 | 18.3%), European (106 | 9.8%), Irish (86 | 7.9%), and Norwegian (72 | 6.6%), together accounting for 65.7% of all South Lebanon residents.
| Ancestry | # Population | % Population |
| American | 4 | 0.4% |
| Austrian | 10 | 0.9% |
| Canadian | 4 | 0.4% |
| Cherokee | 11 | 1.0% |
| Chippewa | 18 | 1.7% |
| Czech | 24 | 2.2% |
| Czechoslovakian | 15 | 1.4% |
| Danish | 35 | 3.2% |
| English | 198 | 18.3% |
| European | 106 | 9.8% |
| French | 18 | 1.7% |
| German | 250 | 23.1% |
| Irish | 86 | 7.9% |
| Italian | 8 | 0.7% |
| Mexican | 44 | 4.1% |
| Norwegian | 72 | 6.6% |
| Paiute | 5 | 0.5% |
| Scandinavian | 40 | 3.7% |
| Scotch-Irish | 11 | 1.0% |
| Scottish | 15 | 1.4% |
| Sioux | 18 | 1.7% |
| Spaniard | 33 | 3.0% |
| Swedish | 11 | 1.0% | View All 23 Rows |
Immigrants in South Lebanon

| Immigration Origin | # Population | % Population | View All 0 Rows |
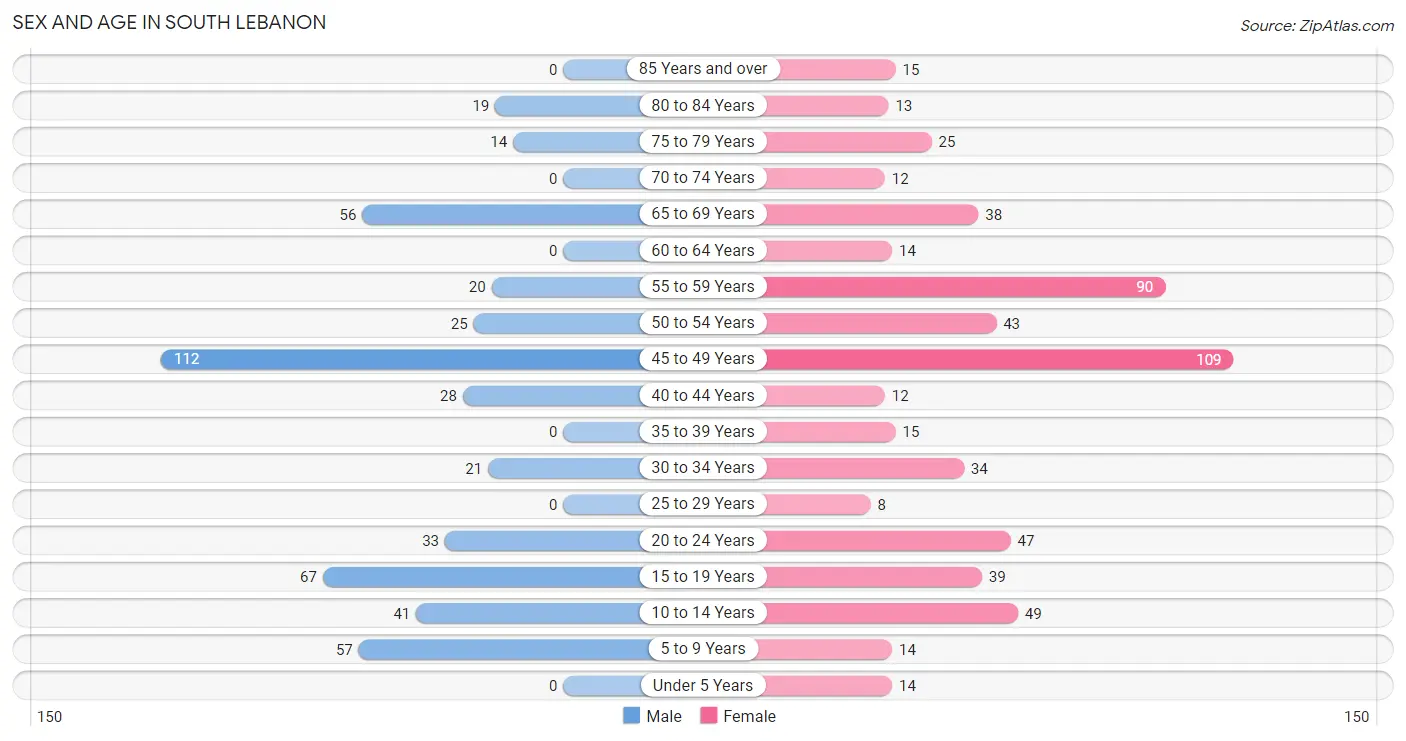
Sex and Age in South Lebanon
Sex and Age in South Lebanon
The most populous age groups in South Lebanon are 45 to 49 Years (112 | 22.7%) for men and 45 to 49 Years (109 | 18.4%) for women.
| Age Bracket | Male | Female |
| Under 5 Years | 0 (0.0%) | 14 (2.4%) |
| 5 to 9 Years | 57 (11.6%) | 14 (2.4%) |
| 10 to 14 Years | 41 (8.3%) | 49 (8.3%) |
| 15 to 19 Years | 67 (13.6%) | 39 (6.6%) |
| 20 to 24 Years | 33 (6.7%) | 47 (8.0%) |
| 25 to 29 Years | 0 (0.0%) | 8 (1.3%) |
| 30 to 34 Years | 21 (4.3%) | 34 (5.8%) |
| 35 to 39 Years | 0 (0.0%) | 15 (2.5%) |
| 40 to 44 Years | 28 (5.7%) | 12 (2.0%) |
| 45 to 49 Years | 112 (22.7%) | 109 (18.4%) |
| 50 to 54 Years | 25 (5.1%) | 43 (7.3%) |
| 55 to 59 Years | 20 (4.1%) | 90 (15.2%) |
| 60 to 64 Years | 0 (0.0%) | 14 (2.4%) |
| 65 to 69 Years | 56 (11.4%) | 38 (6.4%) |
| 70 to 74 Years | 0 (0.0%) | 12 (2.0%) |
| 75 to 79 Years | 14 (2.8%) | 25 (4.2%) |
| 80 to 84 Years | 19 (3.8%) | 13 (2.2%) |
| 85 Years and over | 0 (0.0%) | 15 (2.5%) |
| Total | 493 (100.0%) | 591 (100.0%) |
Families and Households in South Lebanon
Median Family Size in South Lebanon
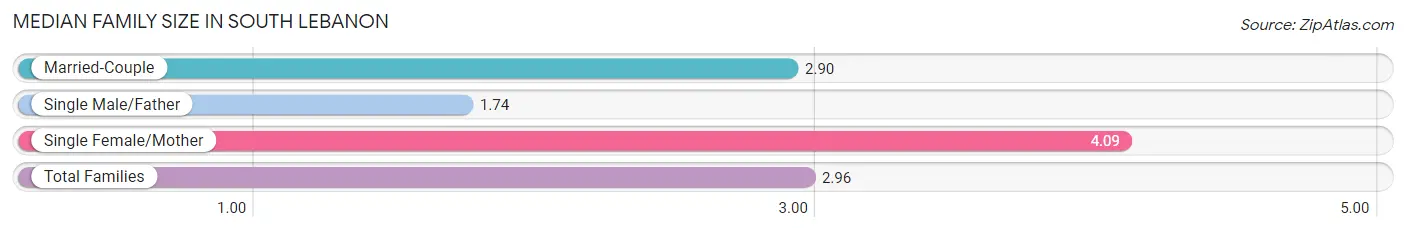
The median family size in South Lebanon is 2.96 persons per family, with single female/mother families (46 | 14.6%) accounting for the largest median family size of 4.09 persons per family. On the other hand, single male/father families (31 | 9.9%) represent the smallest median family size with 1.74 persons per family.
| Family Type | # Families | Family Size |
| Married-Couple | 237 (75.5%) | 2.90 |
| Single Male/Father | 31 (9.9%) | 1.74 |
| Single Female/Mother | 46 (14.6%) | 4.09 |
| Total Families | 314 (100.0%) | 2.96 |
Median Household Size in South Lebanon
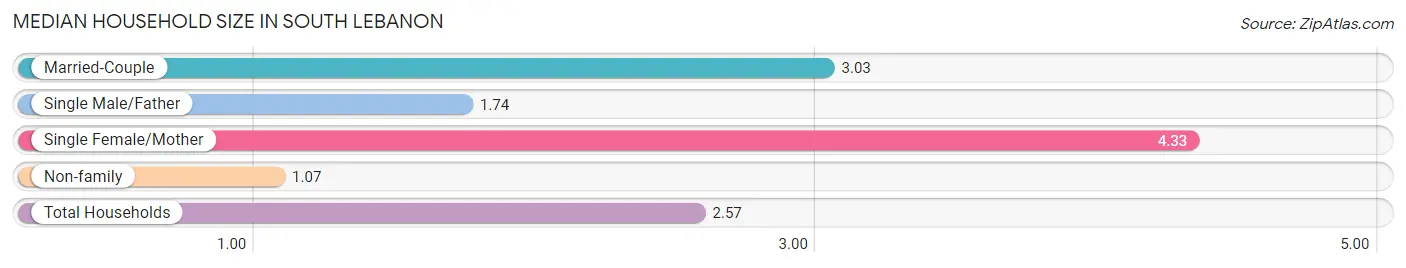
The median household size in South Lebanon is 2.57 persons per household, with single female/mother households (46 | 10.9%) accounting for the largest median household size of 4.33 persons per household. non-family households (107 | 25.4%) represent the smallest median household size with 1.07 persons per household.
| Household Type | # Households | Household Size |
| Married-Couple | 237 (56.3%) | 3.03 |
| Single Male/Father | 31 (7.4%) | 1.74 |
| Single Female/Mother | 46 (10.9%) | 4.33 |
| Non-family | 107 (25.4%) | 1.07 |
| Total Households | 421 (100.0%) | 2.57 |
Household Size by Marriage Status in South Lebanon
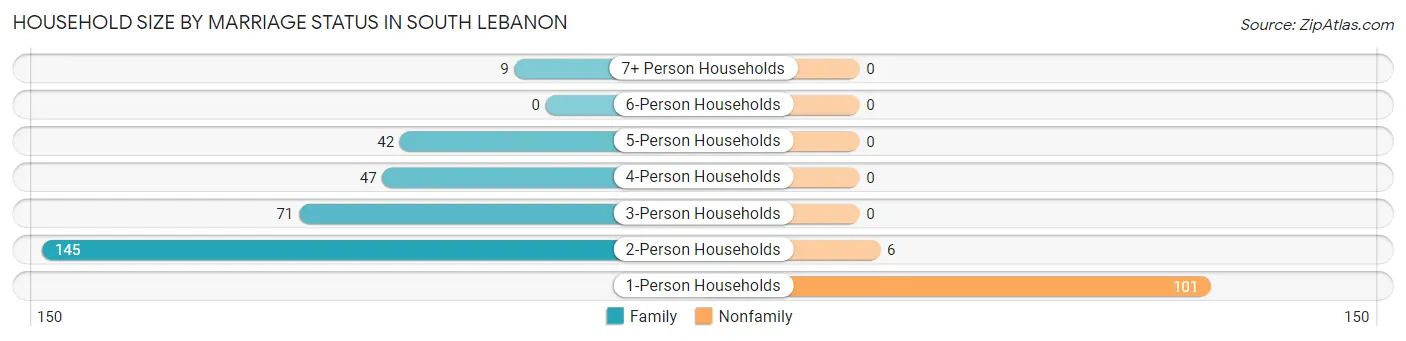
Out of a total of 421 households in South Lebanon, 314 (74.6%) are family households, while 107 (25.4%) are nonfamily households. The most numerous type of family households are 2-person households, comprising 145, and the most common type of nonfamily households are 1-person households, comprising 101.
| Household Size | Family Households | Nonfamily Households |
| 1-Person Households | - | 101 (24.0%) |
| 2-Person Households | 145 (34.4%) | 6 (1.4%) |
| 3-Person Households | 71 (16.9%) | 0 (0.0%) |
| 4-Person Households | 47 (11.2%) | 0 (0.0%) |
| 5-Person Households | 42 (10.0%) | 0 (0.0%) |
| 6-Person Households | 0 (0.0%) | 0 (0.0%) |
| 7+ Person Households | 9 (2.1%) | 0 (0.0%) |
| Total | 314 (74.6%) | 107 (25.4%) |
Female Fertility in South Lebanon
Fertility by Age in South Lebanon
| Age Bracket | Women with Births | Births / 1,000 Women |
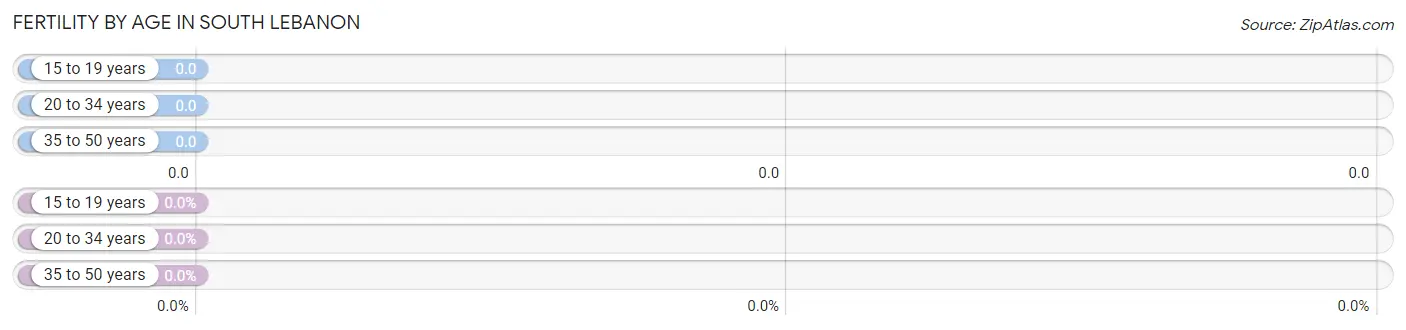
| 15 to 19 years | 0 (0.0%) | 0.0 |
| 20 to 34 years | 0 (0.0%) | 0.0 |
| 35 to 50 years | 0 (0.0%) | 0.0 |
| Total | 0 (0.0%) | 0.0 |
Fertility by Age by Marriage Status in South Lebanon
| Age Bracket | Married | Unmarried |
| 15 to 19 years | 0 (0.0%) | 0 (0.0%) |
| 20 to 34 years | 0 (0.0%) | 0 (0.0%) |
| 35 to 50 years | 0 (0.0%) | 0 (0.0%) |
| Total | 0 (0.0%) | 0 (0.0%) |
Fertility by Education in South Lebanon
| Educational Attainment | Women with Births | Births / 1,000 Women |
| Less than High School | 0 (0.0%) | 0.0 |
| High School Diploma | 0 (0.0%) | 0.0 |
| College or Associate's Degree | 0 (0.0%) | 0.0 |
| Bachelor's Degree | 0 (0.0%) | 0.0 |
| Graduate Degree | 0 (0.0%) | 0.0 |
| Total | 0 (0.0%) | 0.0 |
Fertility by Education by Marriage Status in South Lebanon
| Educational Attainment | Married | Unmarried |
| Less than High School | 0 (0.0%) | 0 (0.0%) |
| High School Diploma | 0 (0.0%) | 0 (0.0%) |
| College or Associate's Degree | 0 (0.0%) | 0 (0.0%) |
| Bachelor's Degree | 0 (0.0%) | 0 (0.0%) |
| Graduate Degree | 0 (0.0%) | 0 (0.0%) |
| Total | 0 (0.0%) | 0 (0.0%) |
Income in South Lebanon
Income Overview in South Lebanon
Per Capita Income in South Lebanon is $26,399, while median incomes of families and households are $60,313 and $54,507 respectively.
| Characteristic | Number | Measure |
| Per Capita Income | 1,084 | $26,399 |
| Median Family Income | 314 | $60,313 |
| Mean Family Income | 314 | $81,875 |
| Median Household Income | 421 | $54,507 |
| Mean Household Income | 421 | $67,305 |
| Income Deficit | 314 | $0 |
| Wage / Income Gap (%) | 1,084 | 0.00% |
| Wage / Income Gap ($) | 1,084 | 100.00¢ per $1 |
| Gini / Inequality Index | 1,084 | 0.39 |
Earnings by Sex in South Lebanon
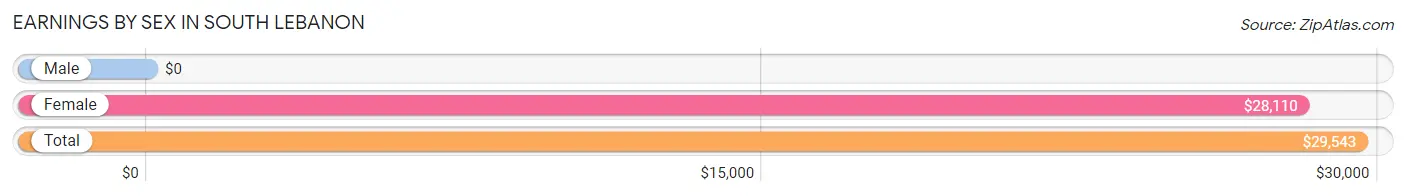
| Sex | Number | Average Earnings |
| Male | 217 (38.7%) | $0 |
| Female | 344 (61.3%) | $28,110 |
| Total | 561 (100.0%) | $29,543 |
Earnings by Sex by Income Bracket in South Lebanon
The most common earnings brackets in South Lebanon are $65,000 to $74,999 for men (50 | 23.0%) and $35,000 to $39,999 for women (114 | 33.1%).
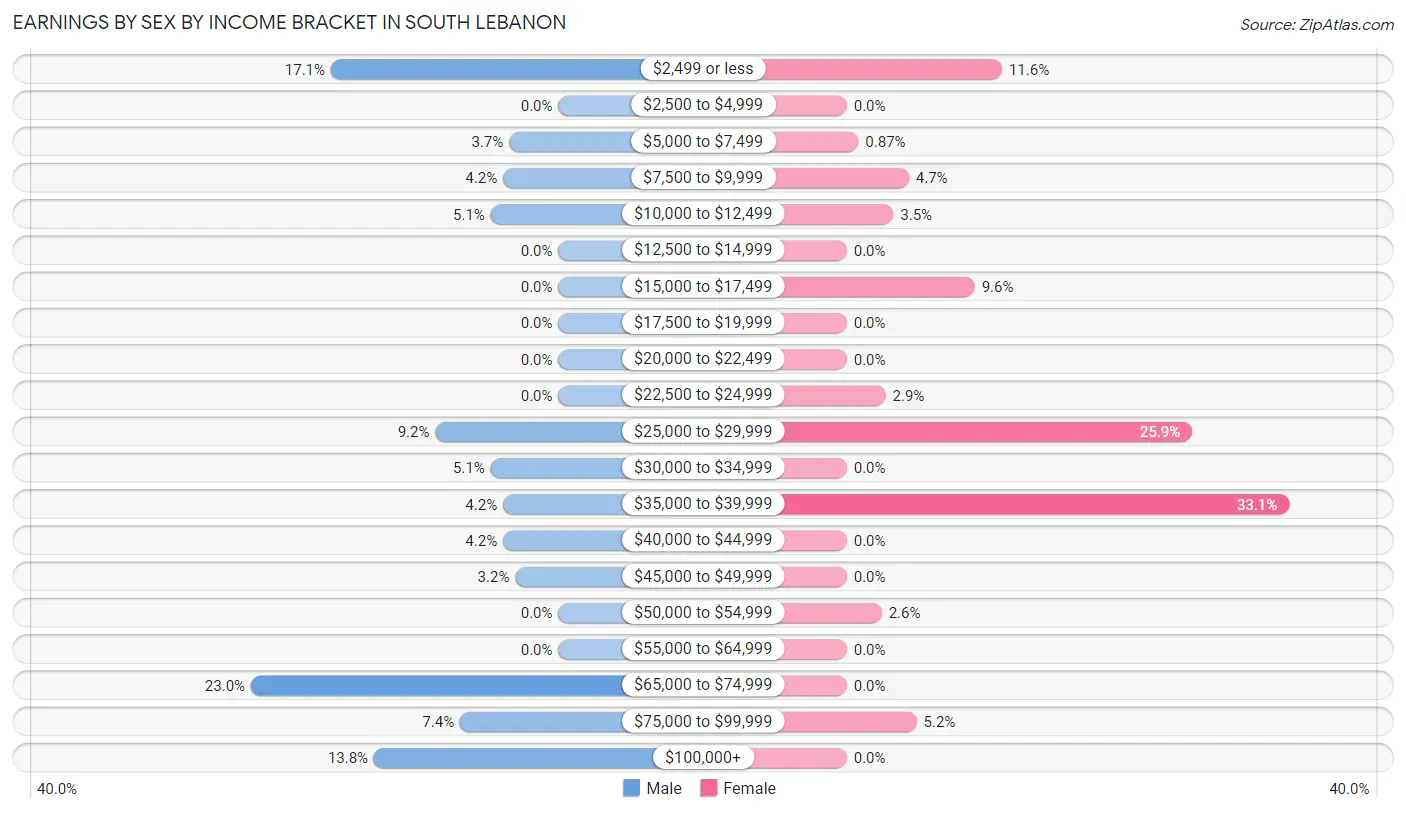
| Income | Male | Female |
| $2,499 or less | 37 (17.1%) | 40 (11.6%) |
| $2,500 to $4,999 | 0 (0.0%) | 0 (0.0%) |
| $5,000 to $7,499 | 8 (3.7%) | 3 (0.9%) |
| $7,500 to $9,999 | 9 (4.2%) | 16 (4.6%) |
| $10,000 to $12,499 | 11 (5.1%) | 12 (3.5%) |
| $12,500 to $14,999 | 0 (0.0%) | 0 (0.0%) |
| $15,000 to $17,499 | 0 (0.0%) | 33 (9.6%) |
| $17,500 to $19,999 | 0 (0.0%) | 0 (0.0%) |
| $20,000 to $22,499 | 0 (0.0%) | 0 (0.0%) |
| $22,500 to $24,999 | 0 (0.0%) | 10 (2.9%) |
| $25,000 to $29,999 | 20 (9.2%) | 89 (25.9%) |
| $30,000 to $34,999 | 11 (5.1%) | 0 (0.0%) |
| $35,000 to $39,999 | 9 (4.2%) | 114 (33.1%) |
| $40,000 to $44,999 | 9 (4.2%) | 0 (0.0%) |
| $45,000 to $49,999 | 7 (3.2%) | 0 (0.0%) |
| $50,000 to $54,999 | 0 (0.0%) | 9 (2.6%) |
| $55,000 to $64,999 | 0 (0.0%) | 0 (0.0%) |
| $65,000 to $74,999 | 50 (23.0%) | 0 (0.0%) |
| $75,000 to $99,999 | 16 (7.4%) | 18 (5.2%) |
| $100,000+ | 30 (13.8%) | 0 (0.0%) |
| Total | 217 (100.0%) | 344 (100.0%) |
Earnings by Sex by Educational Attainment in South Lebanon
Average earnings in South Lebanon are $70,925 for men and $29,482 for women, a difference of 58.4%. Men with an educational attainment of college or associate's degree enjoy the highest average annual earnings of $110,469, while those with college or associate's degree education earn the least with $110,469. Women with an educational attainment of bachelor's degree earn the most with the average annual earnings of $36,541, while those with high school diploma education have the smallest earnings of $25,221.
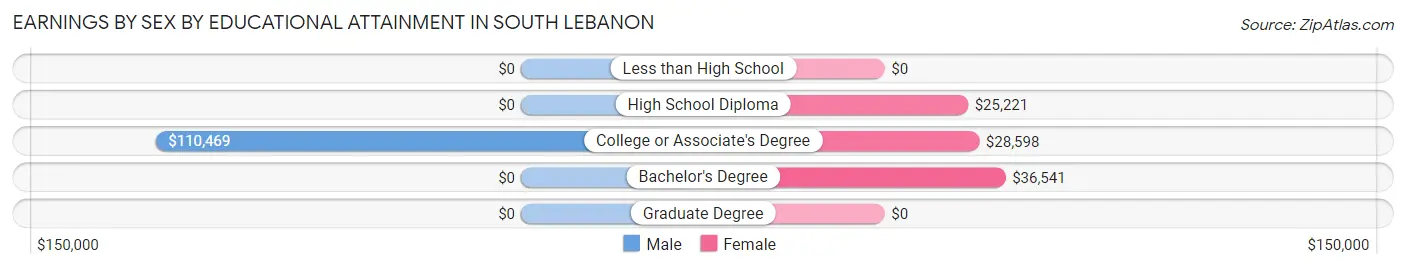
| Educational Attainment | Male Income | Female Income |
| Less than High School | - | - |
| High School Diploma | - | - |
| College or Associate's Degree | $110,469 | $28,598 |
| Bachelor's Degree | - | - |
| Graduate Degree | - | - |
| Total | $70,925 | $29,482 |
Family Income in South Lebanon
Family Income Brackets in South Lebanon
According to the South Lebanon family income data, there are 128 families falling into the $50,000 to $74,999 income range, which is the most common income bracket and makes up 40.8% of all families.
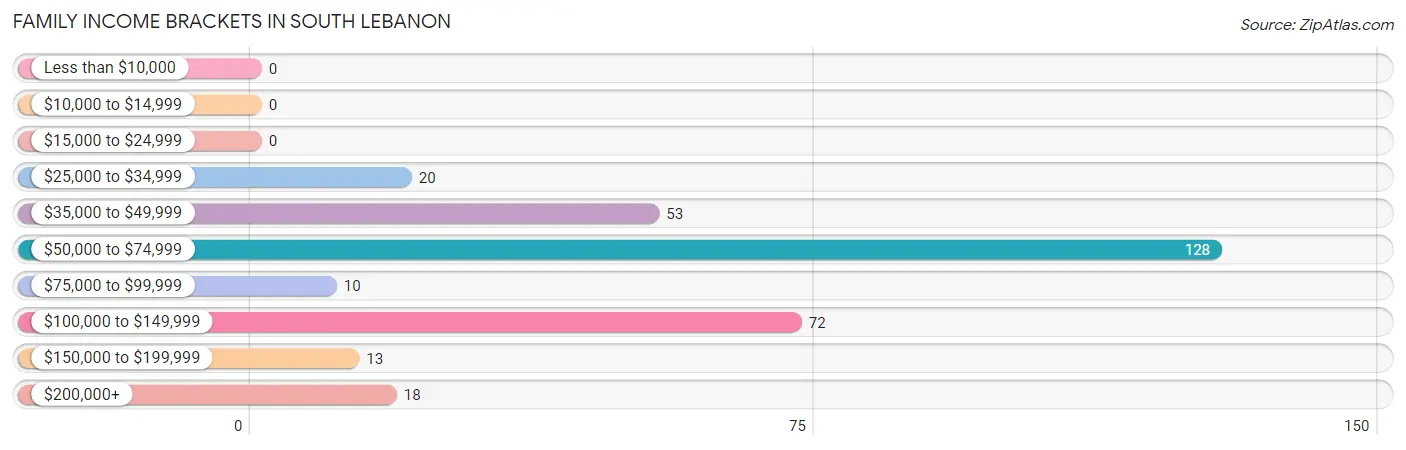
| Income Bracket | # Families | % Families |
| Less than $10,000 | 0 | 0.0% |
| $10,000 to $14,999 | 0 | 0.0% |
| $15,000 to $24,999 | 0 | 0.0% |
| $25,000 to $34,999 | 20 | 6.4% |
| $35,000 to $49,999 | 53 | 16.9% |
| $50,000 to $74,999 | 128 | 40.8% |
| $75,000 to $99,999 | 10 | 3.2% |
| $100,000 to $149,999 | 72 | 22.9% |
| $150,000 to $199,999 | 13 | 4.1% |
| $200,000+ | 18 | 5.7% |
Family Income by Famaliy Size in South Lebanon
5-person families (30 | 9.6%) account for the highest median family income in South Lebanon with $122,794 per family, while 2-person families (176 | 56.0%) have the highest median income of $29,078 per family member.
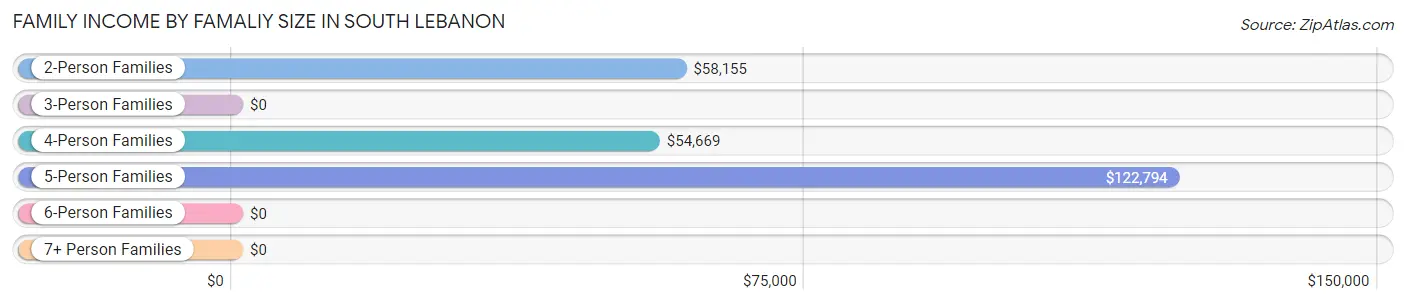
| Income Bracket | # Families | Median Income |
| 2-Person Families | 176 (56.0%) | $58,155 |
| 3-Person Families | 40 (12.7%) | $0 |
| 4-Person Families | 59 (18.8%) | $54,669 |
| 5-Person Families | 30 (9.6%) | $122,794 |
| 6-Person Families | 0 (0.0%) | $0 |
| 7+ Person Families | 9 (2.9%) | $0 |
| Total | 314 (100.0%) | $60,313 |
Family Income by Number of Earners in South Lebanon
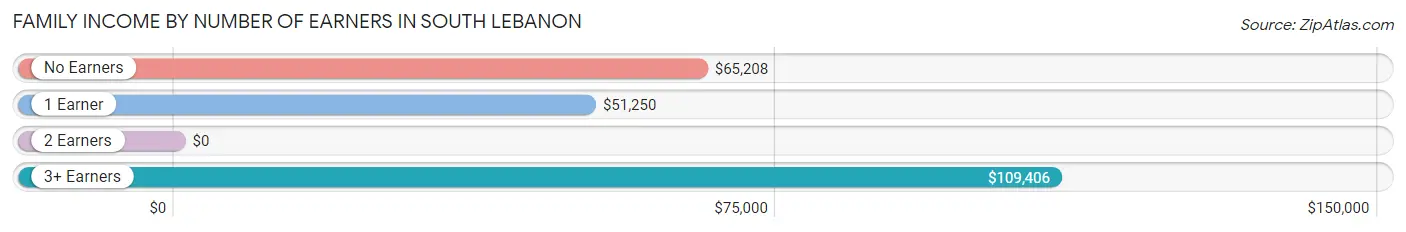
| Number of Earners | # Families | Median Income |
| No Earners | 42 (13.4%) | $65,208 |
| 1 Earner | 124 (39.5%) | $51,250 |
| 2 Earners | 69 (22.0%) | $0 |
| 3+ Earners | 79 (25.2%) | $109,406 |
| Total | 314 (100.0%) | $60,313 |
Household Income in South Lebanon
Household Income Brackets in South Lebanon
With 116 households falling in the category, the $50,000 to $74,999 income range is the most frequent in South Lebanon, accounting for 27.6% of all households.
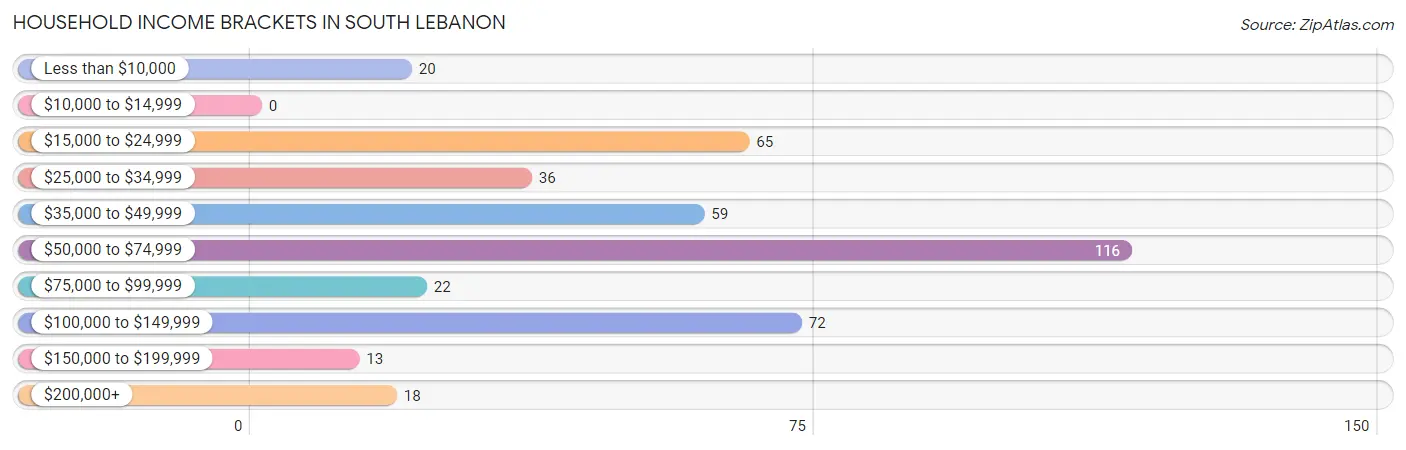
| Income Bracket | # Households | % Households |
| Less than $10,000 | 20 | 4.8% |
| $10,000 to $14,999 | 0 | 0.0% |
| $15,000 to $24,999 | 65 | 15.4% |
| $25,000 to $34,999 | 36 | 8.6% |
| $35,000 to $49,999 | 59 | 14.0% |
| $50,000 to $74,999 | 116 | 27.6% |
| $75,000 to $99,999 | 22 | 5.2% |
| $100,000 to $149,999 | 72 | 17.1% |
| $150,000 to $199,999 | 13 | 3.1% |
| $200,000+ | 18 | 4.3% |
Household Income by Householder Age in South Lebanon
The median household income in South Lebanon is $54,507, with the highest median household income of $58,185 found in the 65+ years age bracket for the primary householder. A total of 127 households (30.2%) fall into this category. Meanwhile, the 15 to 24 years age bracket for the primary householder has the lowest median household income of $0, with 6 households (1.4%) in this group.
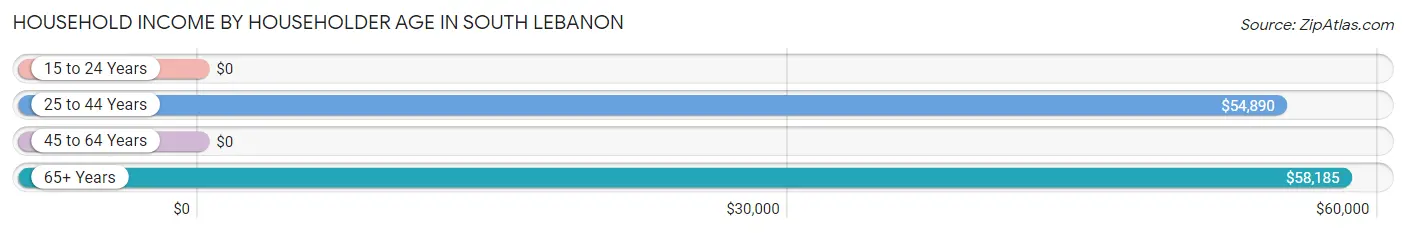
| Income Bracket | # Households | Median Income |
| 15 to 24 Years | 6 (1.4%) | $0 |
| 25 to 44 Years | 87 (20.7%) | $54,890 |
| 45 to 64 Years | 201 (47.7%) | $0 |
| 65+ Years | 127 (30.2%) | $58,185 |
| Total | 421 (100.0%) | $54,507 |
Poverty in South Lebanon
Income Below Poverty by Sex and Age in South Lebanon
With 4.1% poverty level for males and 4.9% for females among the residents of South Lebanon, 55 to 64 year old males and 18 to 24 year old females are the most vulnerable to poverty, with 20 males (100.0%) and 29 females (34.9%) in their respective age groups living below the poverty level.
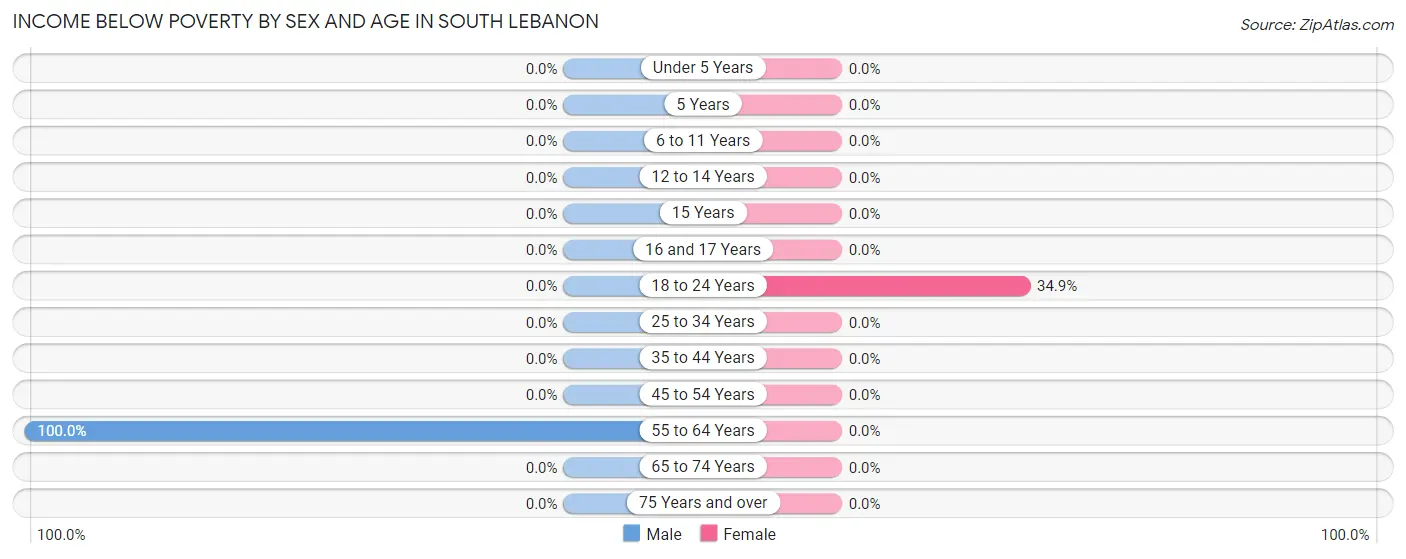
| Age Bracket | Male | Female |
| Under 5 Years | 0 (0.0%) | 0 (0.0%) |
| 5 Years | 0 (0.0%) | 0 (0.0%) |
| 6 to 11 Years | 0 (0.0%) | 0 (0.0%) |
| 12 to 14 Years | 0 (0.0%) | 0 (0.0%) |
| 15 Years | 0 (0.0%) | 0 (0.0%) |
| 16 and 17 Years | 0 (0.0%) | 0 (0.0%) |
| 18 to 24 Years | 0 (0.0%) | 29 (34.9%) |
| 25 to 34 Years | 0 (0.0%) | 0 (0.0%) |
| 35 to 44 Years | 0 (0.0%) | 0 (0.0%) |
| 45 to 54 Years | 0 (0.0%) | 0 (0.0%) |
| 55 to 64 Years | 20 (100.0%) | 0 (0.0%) |
| 65 to 74 Years | 0 (0.0%) | 0 (0.0%) |
| 75 Years and over | 0 (0.0%) | 0 (0.0%) |
| Total | 20 (4.1%) | 29 (4.9%) |
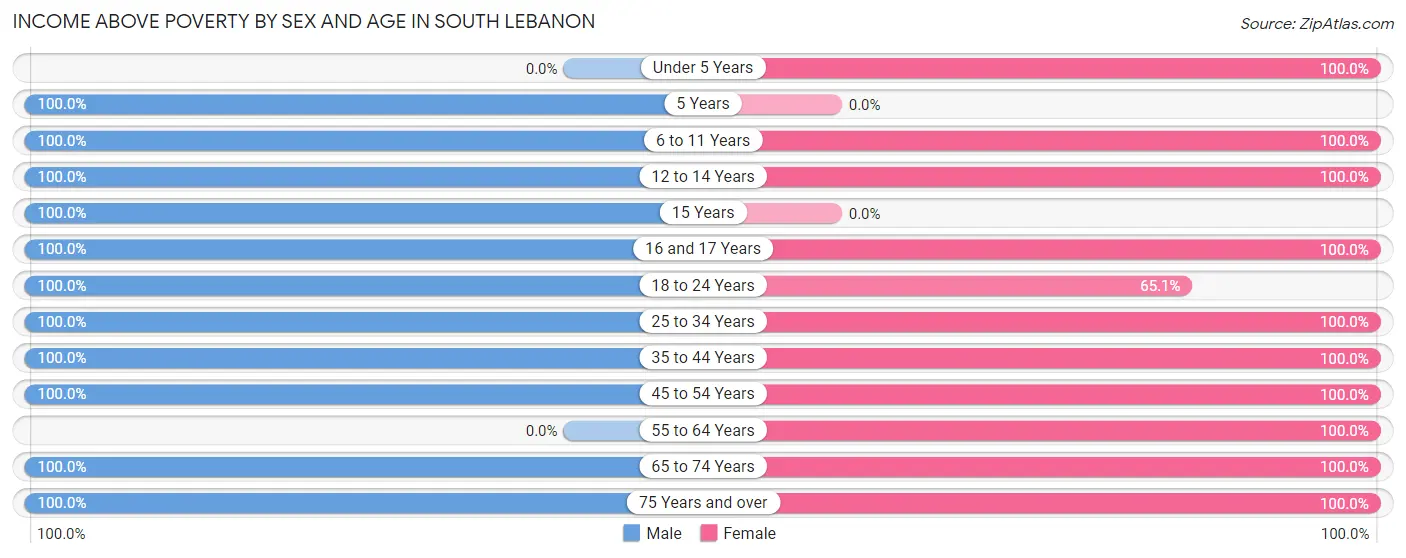
Income Above Poverty by Sex and Age in South Lebanon
According to the poverty statistics in South Lebanon, males aged 5 years and females aged under 5 years are the age groups that are most secure financially, with 100.0% of males and 100.0% of females in these age groups living above the poverty line.
| Age Bracket | Male | Female |
| Under 5 Years | 0 (0.0%) | 14 (100.0%) |
| 5 Years | 18 (100.0%) | 0 (0.0%) |
| 6 to 11 Years | 50 (100.0%) | 54 (100.0%) |
| 12 to 14 Years | 30 (100.0%) | 9 (100.0%) |
| 15 Years | 15 (100.0%) | 0 (0.0%) |
| 16 and 17 Years | 23 (100.0%) | 3 (100.0%) |
| 18 to 24 Years | 62 (100.0%) | 54 (65.1%) |
| 25 to 34 Years | 21 (100.0%) | 42 (100.0%) |
| 35 to 44 Years | 28 (100.0%) | 27 (100.0%) |
| 45 to 54 Years | 137 (100.0%) | 152 (100.0%) |
| 55 to 64 Years | 0 (0.0%) | 104 (100.0%) |
| 65 to 74 Years | 56 (100.0%) | 50 (100.0%) |
| 75 Years and over | 33 (100.0%) | 53 (100.0%) |
| Total | 473 (95.9%) | 562 (95.1%) |
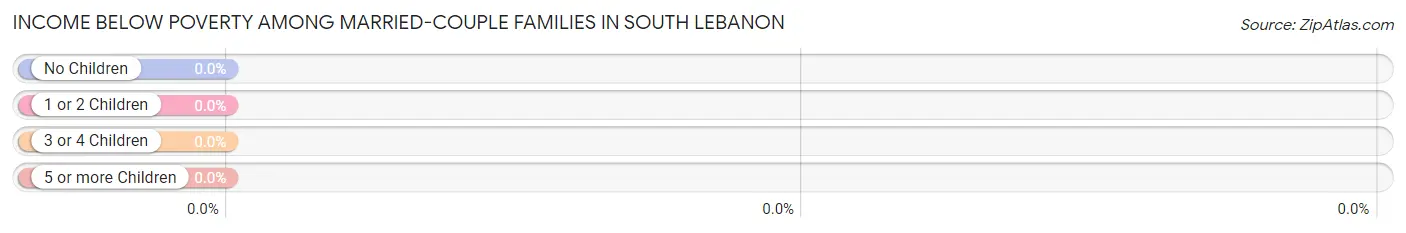
Income Below Poverty Among Married-Couple Families in South Lebanon
| Children | Above Poverty | Below Poverty |
| No Children | 185 (100.0%) | 0 (0.0%) |
| 1 or 2 Children | 39 (100.0%) | 0 (0.0%) |
| 3 or 4 Children | 13 (100.0%) | 0 (0.0%) |
| 5 or more Children | 0 (0.0%) | 0 (0.0%) |
| Total | 237 (100.0%) | 0 (0.0%) |
Income Below Poverty Among Single-Parent Households in South Lebanon

| Children | Single Father | Single Mother |
| No Children | 0 (0.0%) | 0 (0.0%) |
| 1 or 2 Children | 0 (0.0%) | 0 (0.0%) |
| 3 or 4 Children | 0 (0.0%) | 0 (0.0%) |
| 5 or more Children | 0 (0.0%) | 0 (0.0%) |
| Total | 0 (0.0%) | 0 (0.0%) |
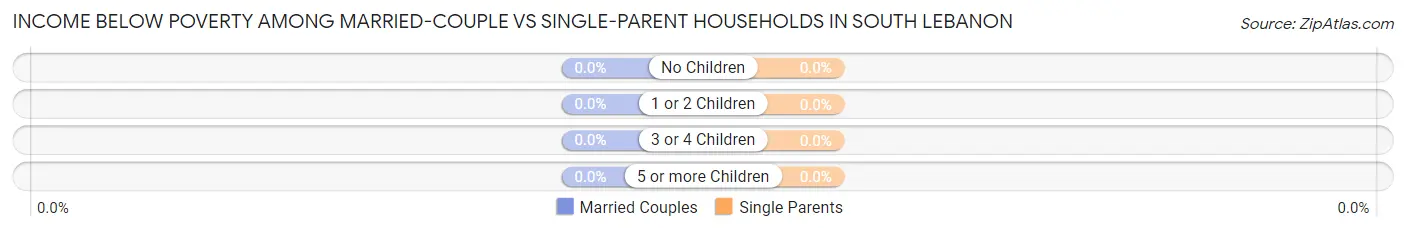
Income Below Poverty Among Married-Couple vs Single-Parent Households in South Lebanon
| Children | Married-Couple Families | Single-Parent Households |
| No Children | 0 (0.0%) | 0 (0.0%) |
| 1 or 2 Children | 0 (0.0%) | 0 (0.0%) |
| 3 or 4 Children | 0 (0.0%) | 0 (0.0%) |
| 5 or more Children | 0 (0.0%) | 0 (0.0%) |
| Total | 0 (0.0%) | 0 (0.0%) |
Employment Characteristics in South Lebanon
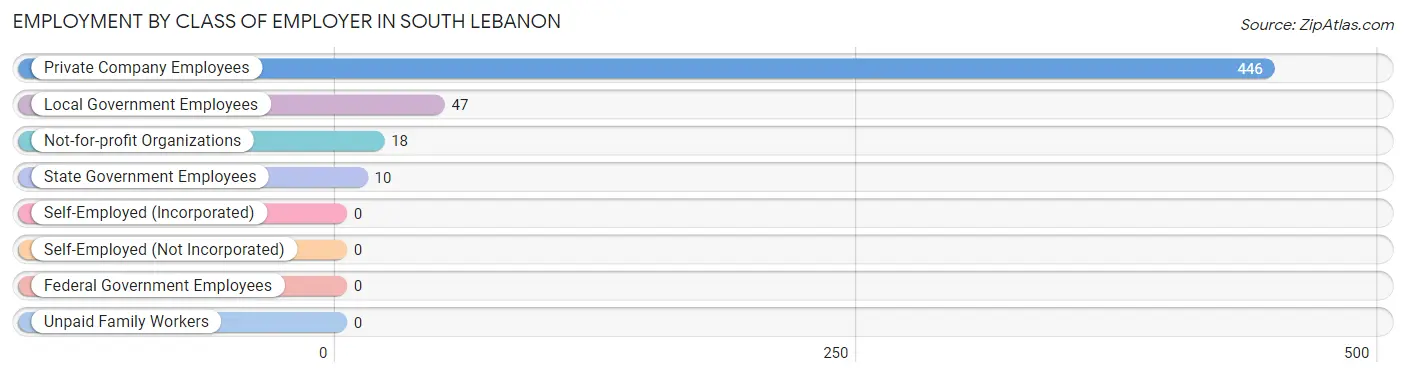
Employment by Class of Employer in South Lebanon
Among the 521 employed individuals in South Lebanon, private company employees (446 | 85.6%), local government employees (47 | 9.0%), and not-for-profit organizations (18 | 3.5%) make up the most common classes of employment.
| Employer Class | # Employees | % Employees |
| Private Company Employees | 446 | 85.6% |
| Self-Employed (Incorporated) | 0 | 0.0% |
| Self-Employed (Not Incorporated) | 0 | 0.0% |
| Not-for-profit Organizations | 18 | 3.5% |
| Local Government Employees | 47 | 9.0% |
| State Government Employees | 10 | 1.9% |
| Federal Government Employees | 0 | 0.0% |
| Unpaid Family Workers | 0 | 0.0% |
| Total | 521 | 100.0% |
Employment Status by Age in South Lebanon
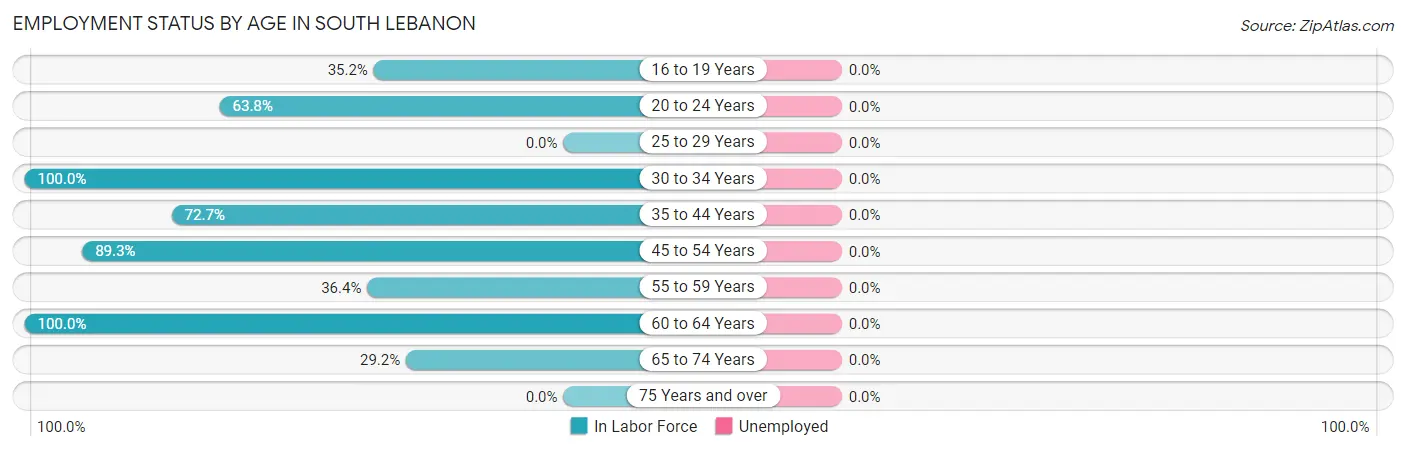
| Age Bracket | In Labor Force | Unemployed |
| 16 to 19 Years | 32 (35.2%) | 0 (0.0%) |
| 20 to 24 Years | 51 (63.8%) | 0 (0.0%) |
| 25 to 29 Years | 0 (0.0%) | 0 (0.0%) |
| 30 to 34 Years | 55 (100.0%) | 0 (0.0%) |
| 35 to 44 Years | 40 (72.7%) | 0 (0.0%) |
| 45 to 54 Years | 258 (89.3%) | 0 (0.0%) |
| 55 to 59 Years | 40 (36.4%) | 0 (0.0%) |
| 60 to 64 Years | 14 (100.0%) | 0 (0.0%) |
| 65 to 74 Years | 31 (29.2%) | 0 (0.0%) |
| 75 Years and over | 0 (0.0%) | 0 (0.0%) |
| Total | 521 (58.3%) | 0 (0.0%) |
Employment Status by Educational Attainment in South Lebanon
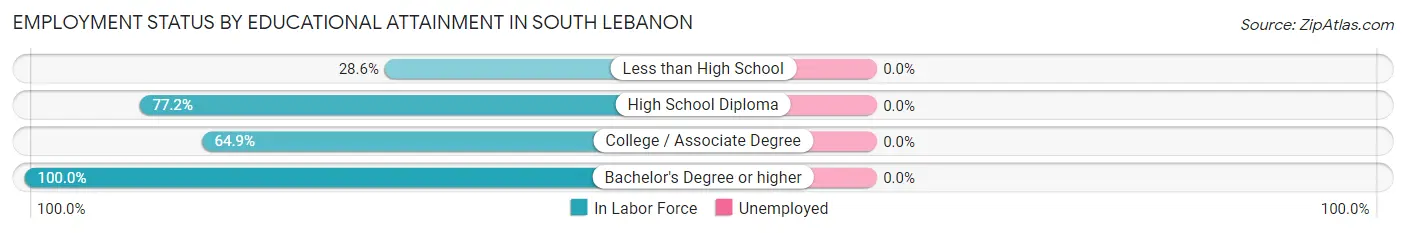
| Educational Attainment | In Labor Force | Unemployed |
| Less than High School | 8 (28.6%) | 0 (0.0%) |
| High School Diploma | 169 (77.2%) | 0 (0.0%) |
| College / Associate Degree | 100 (64.9%) | 0 (0.0%) |
| Bachelor's Degree or higher | 130 (100.0%) | 0 (0.0%) |
| Total | 407 (76.6%) | 0 (0.0%) |
Employment Occupations by Sex in South Lebanon
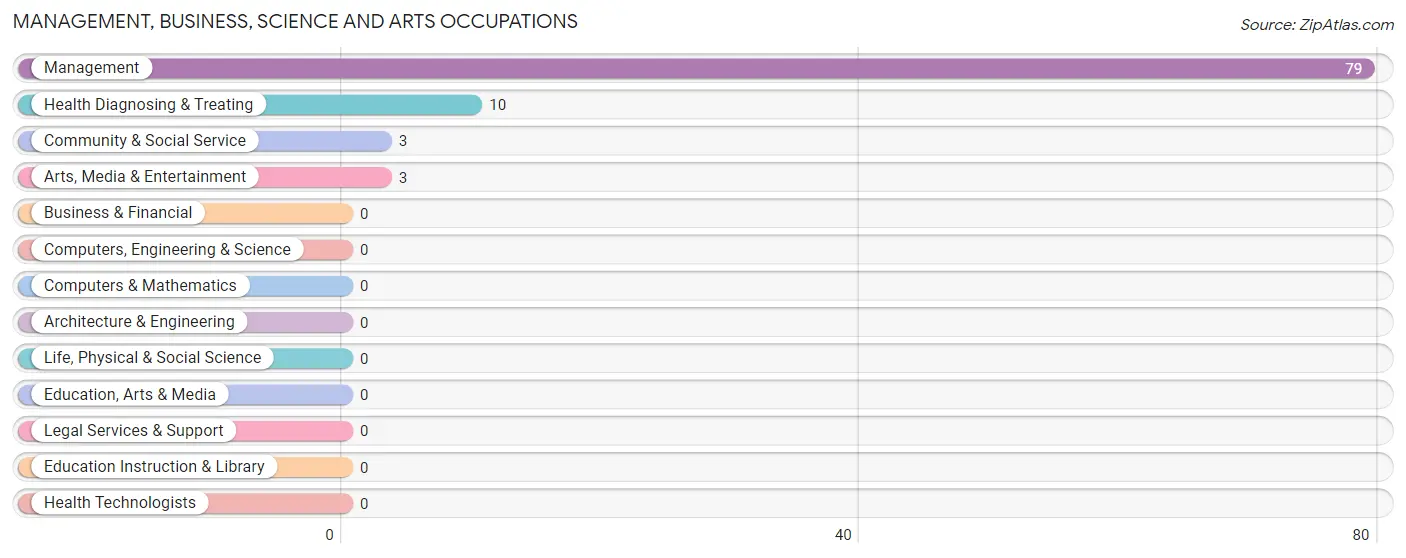
Management, Business, Science and Arts Occupations
The most common Management, Business, Science and Arts occupations in South Lebanon are Management (79 | 15.2%), Health Diagnosing & Treating (10 | 1.9%), Community & Social Service (3 | 0.6%), and Arts, Media & Entertainment (3 | 0.6%).
Management, Business, Science and Arts Occupations by Sex
Within the Management, Business, Science and Arts occupations in South Lebanon, the most male-oriented occupations are Health Diagnosing & Treating (100.0%), and Management (25.3%), while the most female-oriented occupations are Community & Social Service (100.0%), Arts, Media & Entertainment (100.0%), and Management (74.7%).
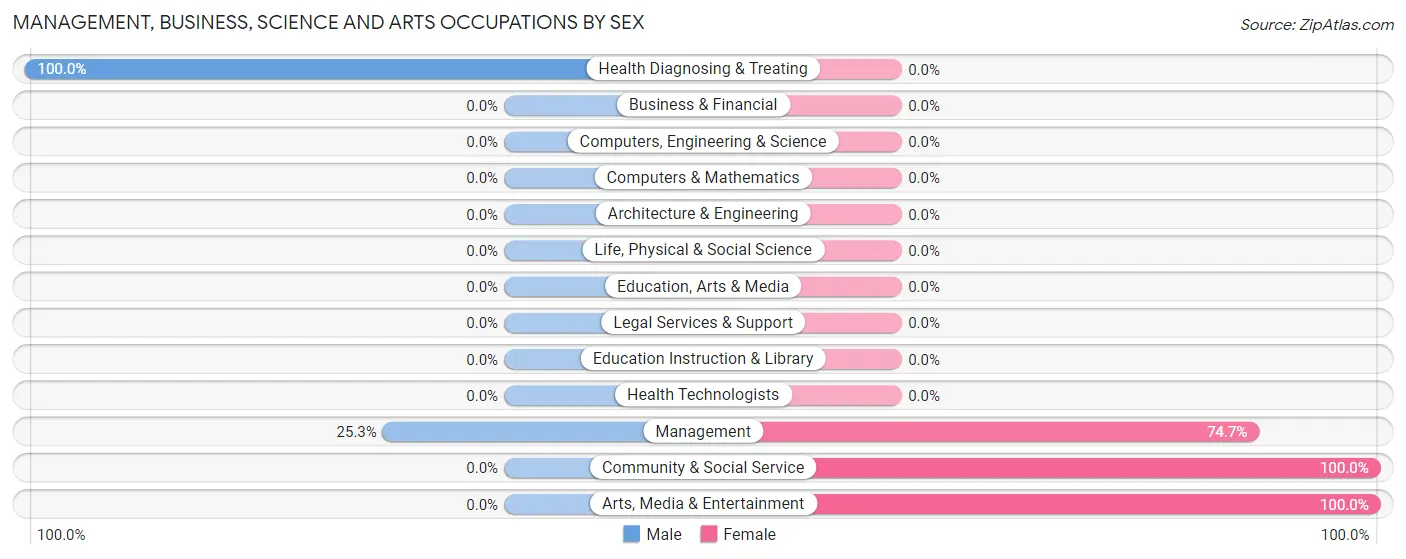
| Occupation | Male | Female |
| Management | 20 (25.3%) | 59 (74.7%) |
| Business & Financial | 0 (0.0%) | 0 (0.0%) |
| Computers, Engineering & Science | 0 (0.0%) | 0 (0.0%) |
| Computers & Mathematics | 0 (0.0%) | 0 (0.0%) |
| Architecture & Engineering | 0 (0.0%) | 0 (0.0%) |
| Life, Physical & Social Science | 0 (0.0%) | 0 (0.0%) |
| Community & Social Service | 0 (0.0%) | 3 (100.0%) |
| Education, Arts & Media | 0 (0.0%) | 0 (0.0%) |
| Legal Services & Support | 0 (0.0%) | 0 (0.0%) |
| Education Instruction & Library | 0 (0.0%) | 0 (0.0%) |
| Arts, Media & Entertainment | 0 (0.0%) | 3 (100.0%) |
| Health Diagnosing & Treating | 10 (100.0%) | 0 (0.0%) |
| Health Technologists | 0 (0.0%) | 0 (0.0%) |
| Total (Category) | 30 (32.6%) | 62 (67.4%) |
| Total (Overall) | 217 (41.6%) | 304 (58.4%) |
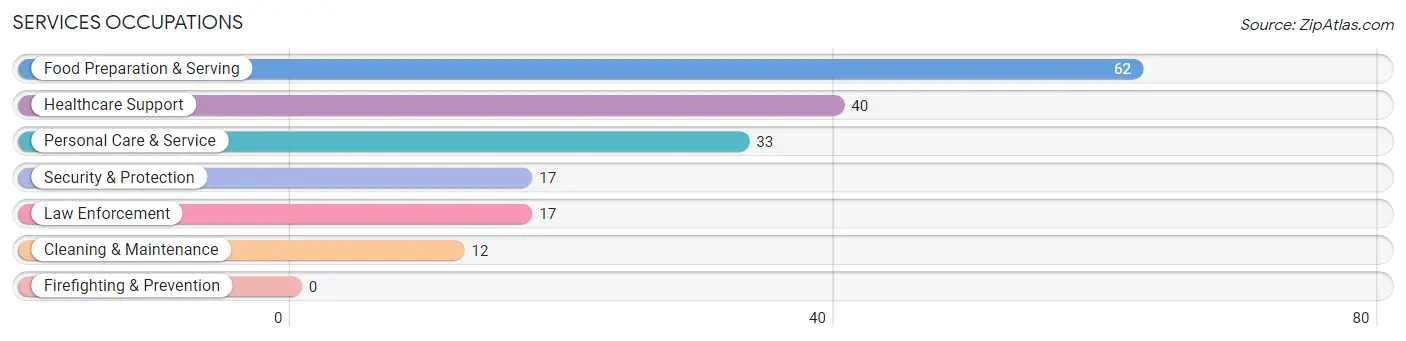
Services Occupations
The most common Services occupations in South Lebanon are Food Preparation & Serving (62 | 11.9%), Healthcare Support (40 | 7.7%), Personal Care & Service (33 | 6.3%), Security & Protection (17 | 3.3%), and Law Enforcement (17 | 3.3%).
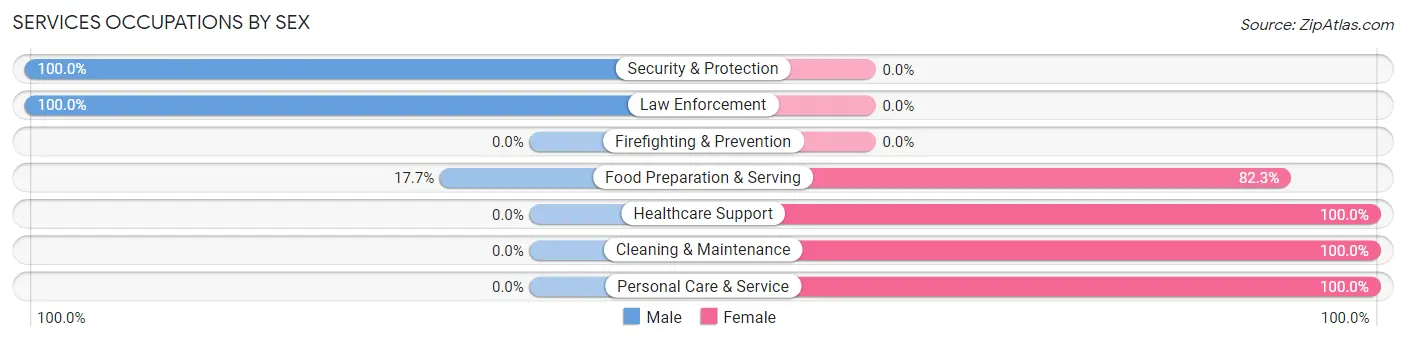
Services Occupations by Sex
Within the Services occupations in South Lebanon, the most male-oriented occupations are Security & Protection (100.0%), Law Enforcement (100.0%), and Food Preparation & Serving (17.7%), while the most female-oriented occupations are Healthcare Support (100.0%), Cleaning & Maintenance (100.0%), and Personal Care & Service (100.0%).
| Occupation | Male | Female |
| Healthcare Support | 0 (0.0%) | 40 (100.0%) |
| Security & Protection | 17 (100.0%) | 0 (0.0%) |
| Firefighting & Prevention | 0 (0.0%) | 0 (0.0%) |
| Law Enforcement | 17 (100.0%) | 0 (0.0%) |
| Food Preparation & Serving | 11 (17.7%) | 51 (82.3%) |
| Cleaning & Maintenance | 0 (0.0%) | 12 (100.0%) |
| Personal Care & Service | 0 (0.0%) | 33 (100.0%) |
| Total (Category) | 28 (17.1%) | 136 (82.9%) |
| Total (Overall) | 217 (41.6%) | 304 (58.4%) |
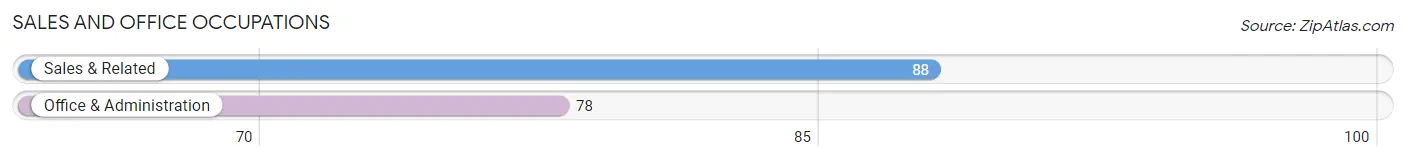
Sales and Office Occupations
The most common Sales and Office occupations in South Lebanon are Sales & Related (88 | 16.9%), and Office & Administration (78 | 15.0%).
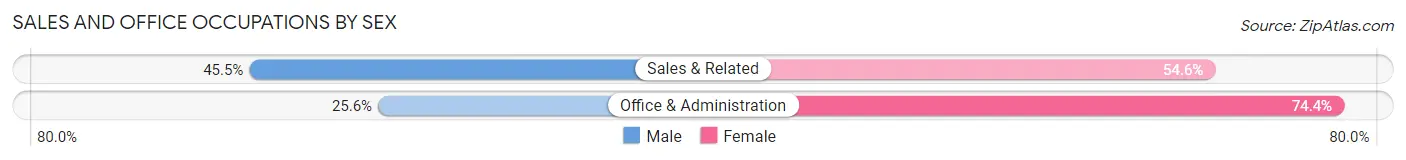
Sales and Office Occupations by Sex
| Occupation | Male | Female |
| Sales & Related | 40 (45.5%) | 48 (54.5%) |
| Office & Administration | 20 (25.6%) | 58 (74.4%) |
| Total (Category) | 60 (36.1%) | 106 (63.9%) |
| Total (Overall) | 217 (41.6%) | 304 (58.4%) |
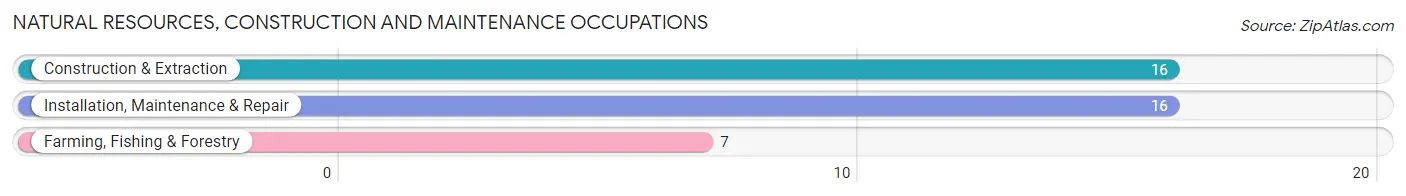
Natural Resources, Construction and Maintenance Occupations
The most common Natural Resources, Construction and Maintenance occupations in South Lebanon are Construction & Extraction (16 | 3.1%), Installation, Maintenance & Repair (16 | 3.1%), and Farming, Fishing & Forestry (7 | 1.3%).
Natural Resources, Construction and Maintenance Occupations by Sex
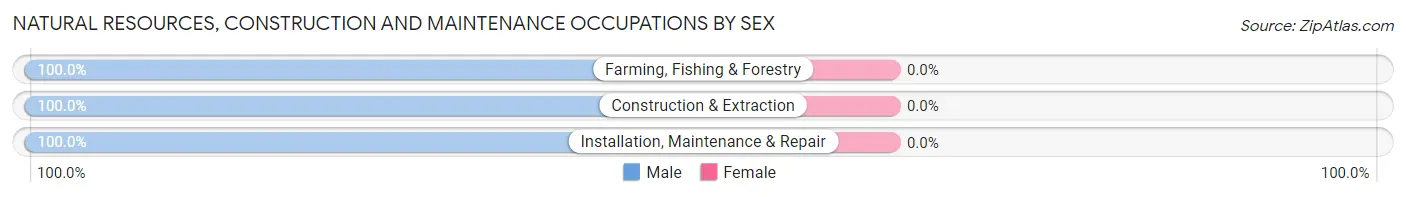
| Occupation | Male | Female |
| Farming, Fishing & Forestry | 7 (100.0%) | 0 (0.0%) |
| Construction & Extraction | 16 (100.0%) | 0 (0.0%) |
| Installation, Maintenance & Repair | 16 (100.0%) | 0 (0.0%) |
| Total (Category) | 39 (100.0%) | 0 (0.0%) |
| Total (Overall) | 217 (41.6%) | 304 (58.4%) |
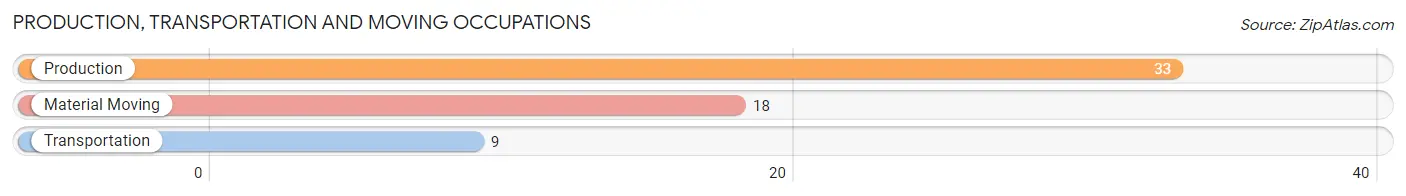
Production, Transportation and Moving Occupations
The most common Production, Transportation and Moving occupations in South Lebanon are Production (33 | 6.3%), Material Moving (18 | 3.5%), and Transportation (9 | 1.7%).
Production, Transportation and Moving Occupations by Sex
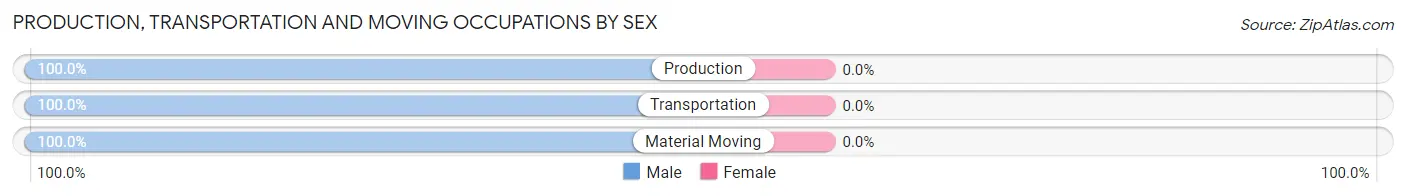
| Occupation | Male | Female |
| Production | 33 (100.0%) | 0 (0.0%) |
| Transportation | 9 (100.0%) | 0 (0.0%) |
| Material Moving | 18 (100.0%) | 0 (0.0%) |
| Total (Category) | 60 (100.0%) | 0 (0.0%) |
| Total (Overall) | 217 (41.6%) | 304 (58.4%) |
Employment Industries by Sex in South Lebanon
Employment Industries in South Lebanon
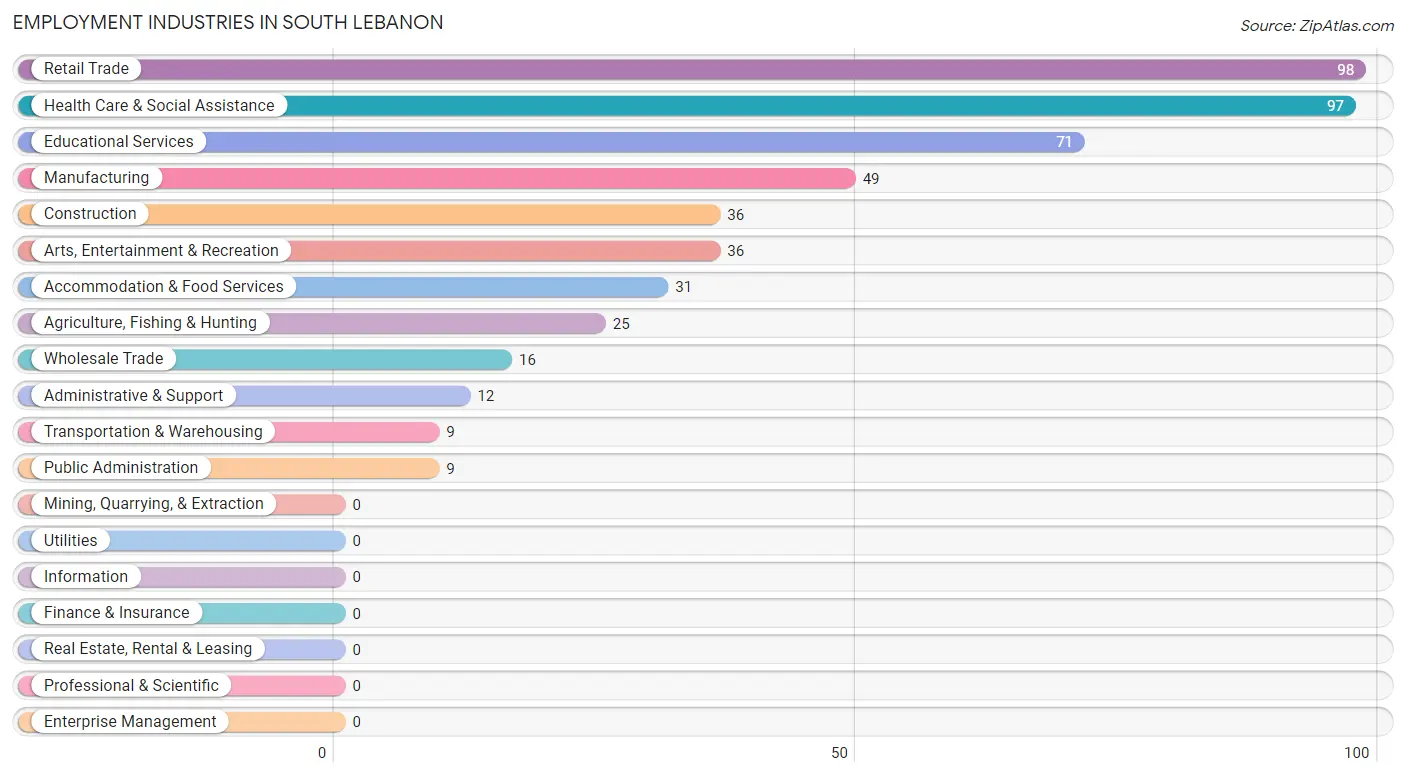
The major employment industries in South Lebanon include Retail Trade (98 | 18.8%), Health Care & Social Assistance (97 | 18.6%), Educational Services (71 | 13.6%), Manufacturing (49 | 9.4%), and Construction (36 | 6.9%).
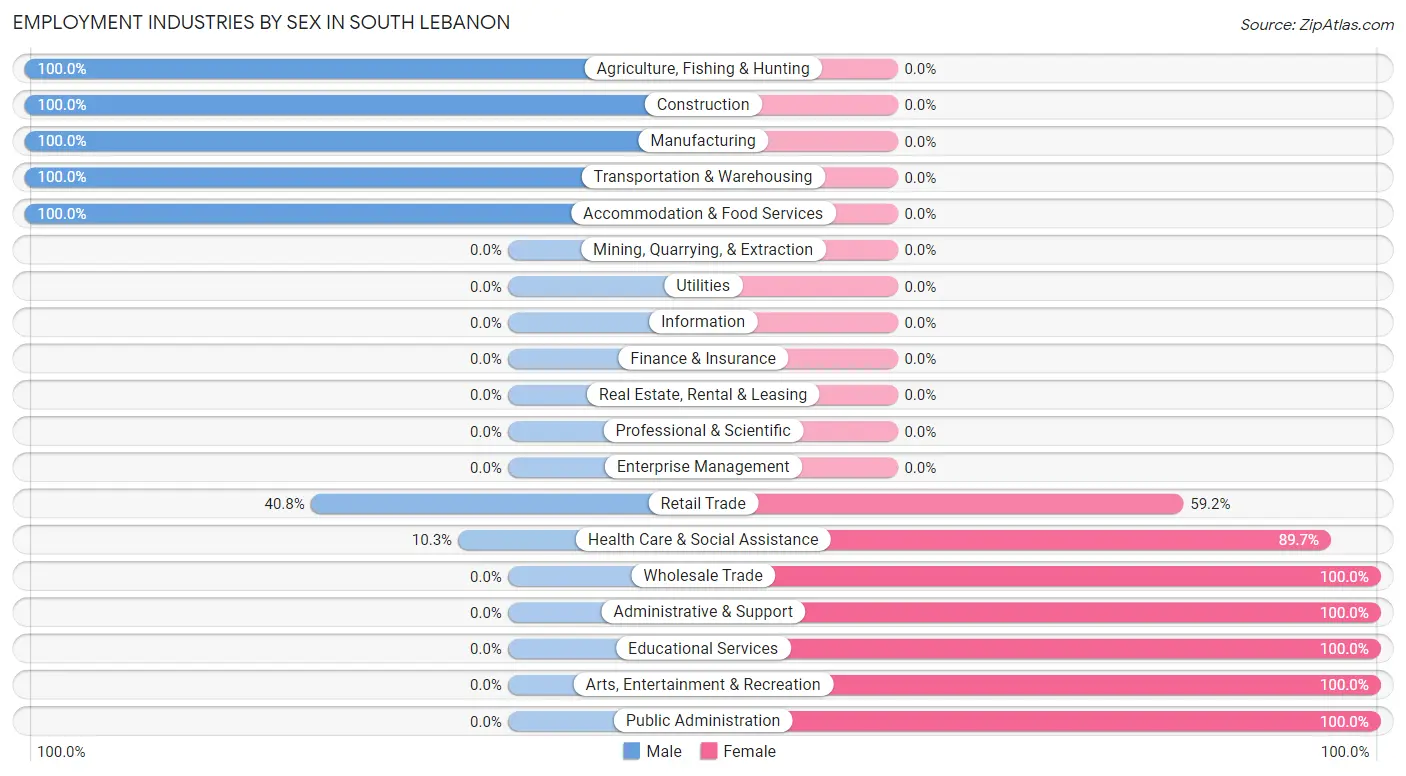
Employment Industries by Sex in South Lebanon
The South Lebanon industries that see more men than women are Agriculture, Fishing & Hunting (100.0%), Construction (100.0%), and Manufacturing (100.0%), whereas the industries that tend to have a higher number of women are Wholesale Trade (100.0%), Administrative & Support (100.0%), and Educational Services (100.0%).
| Industry | Male | Female |
| Agriculture, Fishing & Hunting | 25 (100.0%) | 0 (0.0%) |
| Mining, Quarrying, & Extraction | 0 (0.0%) | 0 (0.0%) |
| Construction | 36 (100.0%) | 0 (0.0%) |
| Manufacturing | 49 (100.0%) | 0 (0.0%) |
| Wholesale Trade | 0 (0.0%) | 16 (100.0%) |
| Retail Trade | 40 (40.8%) | 58 (59.2%) |
| Transportation & Warehousing | 9 (100.0%) | 0 (0.0%) |
| Utilities | 0 (0.0%) | 0 (0.0%) |
| Information | 0 (0.0%) | 0 (0.0%) |
| Finance & Insurance | 0 (0.0%) | 0 (0.0%) |
| Real Estate, Rental & Leasing | 0 (0.0%) | 0 (0.0%) |
| Professional & Scientific | 0 (0.0%) | 0 (0.0%) |
| Enterprise Management | 0 (0.0%) | 0 (0.0%) |
| Administrative & Support | 0 (0.0%) | 12 (100.0%) |
| Educational Services | 0 (0.0%) | 71 (100.0%) |
| Health Care & Social Assistance | 10 (10.3%) | 87 (89.7%) |
| Arts, Entertainment & Recreation | 0 (0.0%) | 36 (100.0%) |
| Accommodation & Food Services | 31 (100.0%) | 0 (0.0%) |
| Public Administration | 0 (0.0%) | 9 (100.0%) |
| Total | 217 (41.6%) | 304 (58.4%) |
Education in South Lebanon
School Enrollment in South Lebanon
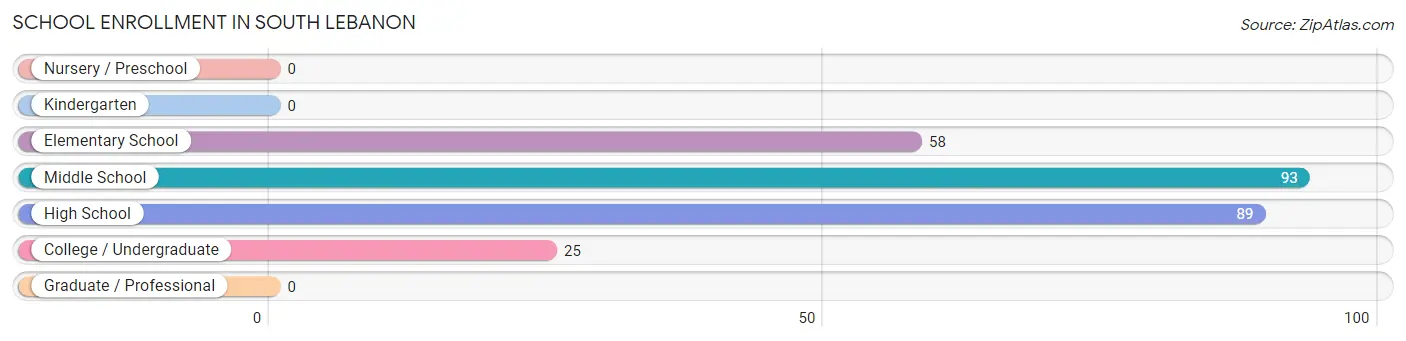
The most common levels of schooling among the 265 students in South Lebanon are middle school (93 | 35.1%), high school (89 | 33.6%), and elementary school (58 | 21.9%).
| School Level | # Students | % Students |
| Nursery / Preschool | 0 | 0.0% |
| Kindergarten | 0 | 0.0% |
| Elementary School | 58 | 21.9% |
| Middle School | 93 | 35.1% |
| High School | 89 | 33.6% |
| College / Undergraduate | 25 | 9.4% |
| Graduate / Professional | 0 | 0.0% |
| Total | 265 | 100.0% |
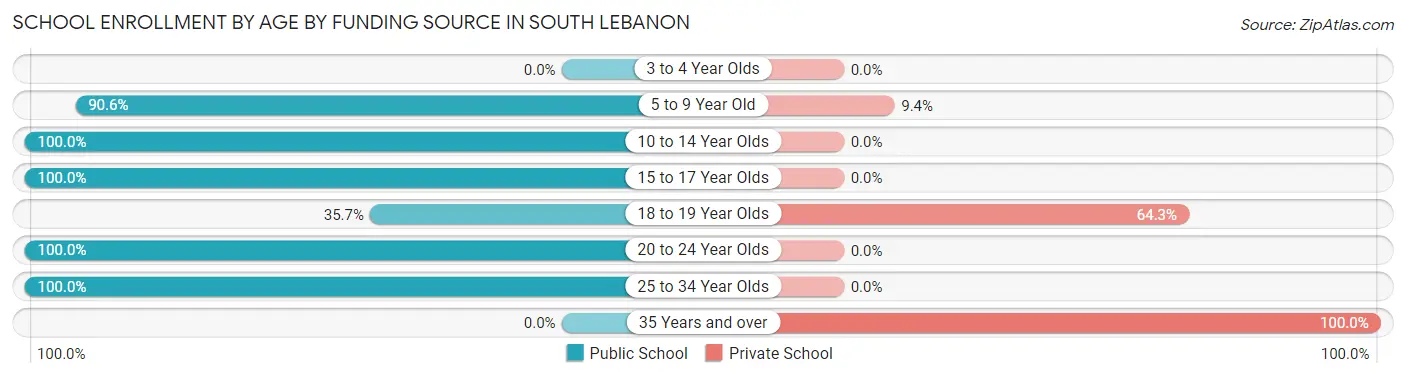
School Enrollment by Age by Funding Source in South Lebanon
Out of a total of 265 students who are enrolled in schools in South Lebanon, 49 (18.5%) attend a private institution, while the remaining 216 (81.5%) are enrolled in public schools. The age group of 35 years and over has the highest likelihood of being enrolled in private schools, with 8 (100.0% in the age bracket) enrolled. Conversely, the age group of 10 to 14 year olds has the lowest likelihood of being enrolled in a private school, with 90 (100.0% in the age bracket) attending a public institution.
| Age Bracket | Public School | Private School |
| 3 to 4 Year Olds | 0 (0.0%) | 0 (0.0%) |
| 5 to 9 Year Old | 48 (90.6%) | 5 (9.4%) |
| 10 to 14 Year Olds | 90 (100.0%) | 0 (0.0%) |
| 15 to 17 Year Olds | 33 (100.0%) | 0 (0.0%) |
| 18 to 19 Year Olds | 20 (35.7%) | 36 (64.3%) |
| 20 to 24 Year Olds | 17 (100.0%) | 0 (0.0%) |
| 25 to 34 Year Olds | 8 (100.0%) | 0 (0.0%) |
| 35 Years and over | 0 (0.0%) | 8 (100.0%) |
| Total | 216 (81.5%) | 49 (18.5%) |
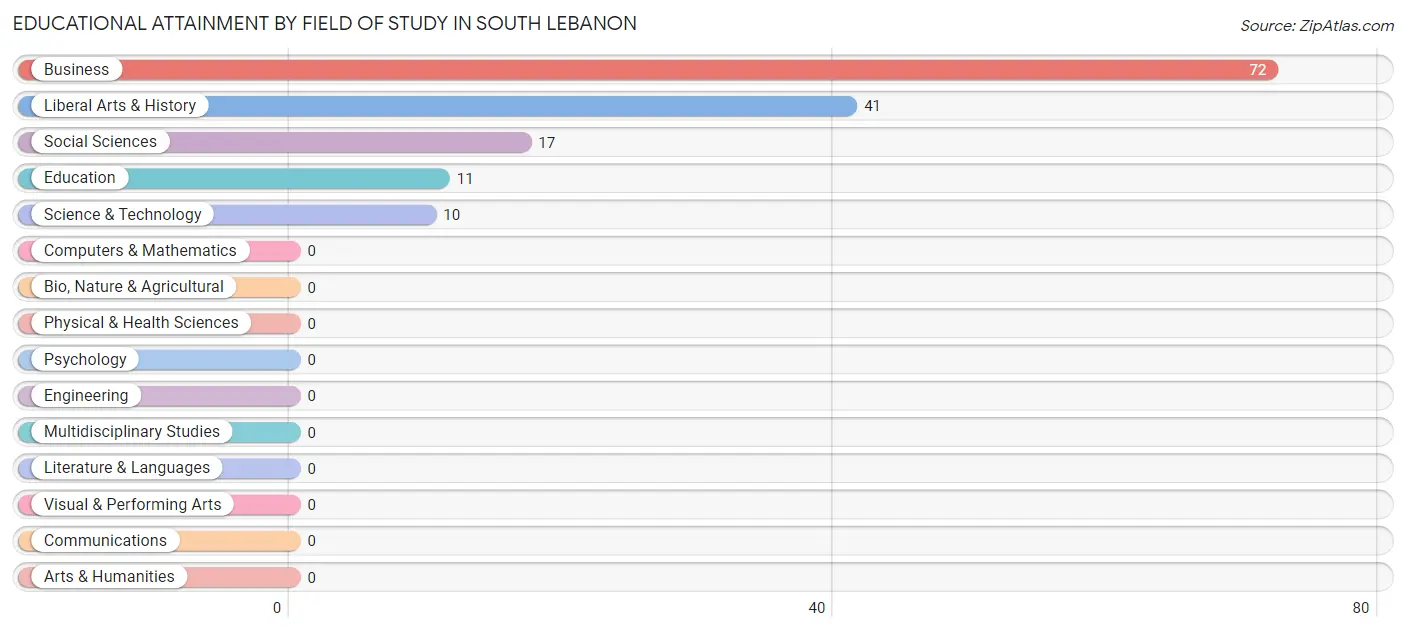
Educational Attainment by Field of Study in South Lebanon
Business (72 | 47.7%), liberal arts & history (41 | 27.2%), social sciences (17 | 11.3%), education (11 | 7.3%), and science & technology (10 | 6.6%) are the most common fields of study among 151 individuals in South Lebanon who have obtained a bachelor's degree or higher.
| Field of Study | # Graduates | % Graduates |
| Computers & Mathematics | 0 | 0.0% |
| Bio, Nature & Agricultural | 0 | 0.0% |
| Physical & Health Sciences | 0 | 0.0% |
| Psychology | 0 | 0.0% |
| Social Sciences | 17 | 11.3% |
| Engineering | 0 | 0.0% |
| Multidisciplinary Studies | 0 | 0.0% |
| Science & Technology | 10 | 6.6% |
| Business | 72 | 47.7% |
| Education | 11 | 7.3% |
| Literature & Languages | 0 | 0.0% |
| Liberal Arts & History | 41 | 27.2% |
| Visual & Performing Arts | 0 | 0.0% |
| Communications | 0 | 0.0% |
| Arts & Humanities | 0 | 0.0% |
| Total | 151 | 100.0% |
Transportation & Commute in South Lebanon
Vehicle Availability by Sex in South Lebanon
The most prevalent vehicle ownership categories in South Lebanon are males with 2 vehicles (67, accounting for 30.9%) and females with 2 vehicles (88, making up 22.0%).

| Vehicles Available | Male | Female |
| No Vehicle | 0 (0.0%) | 0 (0.0%) |
| 1 Vehicle | 20 (9.2%) | 24 (7.9%) |
| 2 Vehicles | 67 (30.9%) | 88 (28.9%) |
| 3 Vehicles | 38 (17.5%) | 105 (34.5%) |
| 4 Vehicles | 53 (24.4%) | 50 (16.5%) |
| 5 or more Vehicles | 39 (18.0%) | 37 (12.2%) |
| Total | 217 (100.0%) | 304 (100.0%) |
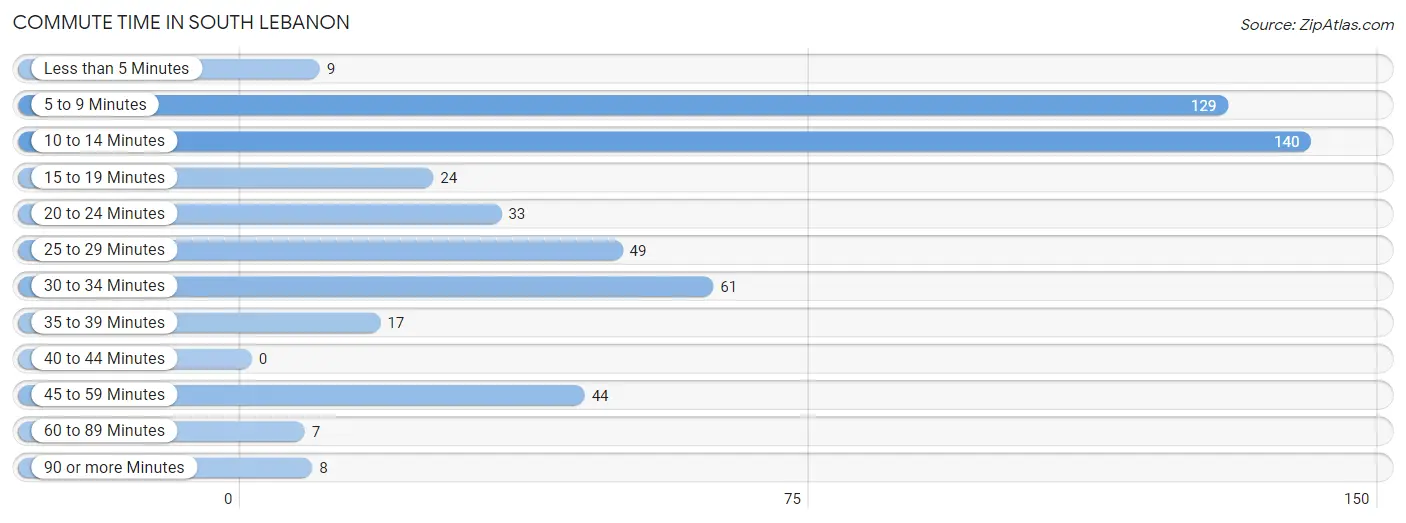
Commute Time in South Lebanon
The most frequently occuring commute durations in South Lebanon are 10 to 14 minutes (140 commuters, 26.9%), 5 to 9 minutes (129 commuters, 24.8%), and 30 to 34 minutes (61 commuters, 11.7%).
| Commute Time | # Commuters | % Commuters |
| Less than 5 Minutes | 9 | 1.7% |
| 5 to 9 Minutes | 129 | 24.8% |
| 10 to 14 Minutes | 140 | 26.9% |
| 15 to 19 Minutes | 24 | 4.6% |
| 20 to 24 Minutes | 33 | 6.3% |
| 25 to 29 Minutes | 49 | 9.4% |
| 30 to 34 Minutes | 61 | 11.7% |
| 35 to 39 Minutes | 17 | 3.3% |
| 40 to 44 Minutes | 0 | 0.0% |
| 45 to 59 Minutes | 44 | 8.5% |
| 60 to 89 Minutes | 7 | 1.3% |
| 90 or more Minutes | 8 | 1.5% |
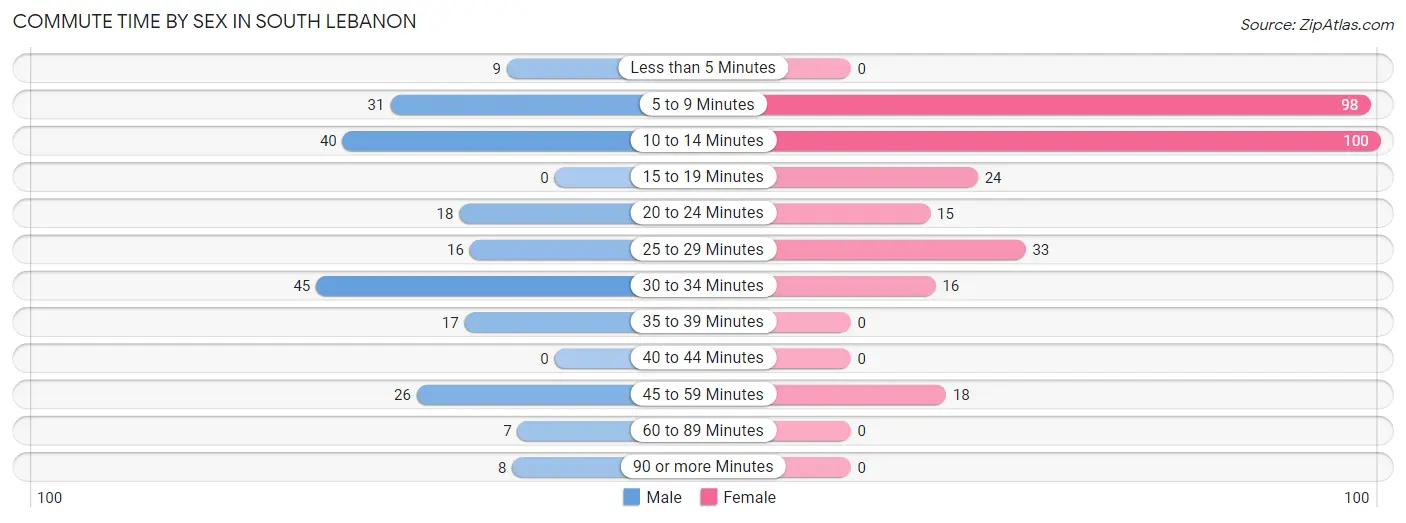
Commute Time by Sex in South Lebanon
The most common commute times in South Lebanon are 30 to 34 minutes (45 commuters, 20.7%) for males and 10 to 14 minutes (100 commuters, 32.9%) for females.
| Commute Time | Male | Female |
| Less than 5 Minutes | 9 (4.2%) | 0 (0.0%) |
| 5 to 9 Minutes | 31 (14.3%) | 98 (32.2%) |
| 10 to 14 Minutes | 40 (18.4%) | 100 (32.9%) |
| 15 to 19 Minutes | 0 (0.0%) | 24 (7.9%) |
| 20 to 24 Minutes | 18 (8.3%) | 15 (4.9%) |
| 25 to 29 Minutes | 16 (7.4%) | 33 (10.9%) |
| 30 to 34 Minutes | 45 (20.7%) | 16 (5.3%) |
| 35 to 39 Minutes | 17 (7.8%) | 0 (0.0%) |
| 40 to 44 Minutes | 0 (0.0%) | 0 (0.0%) |
| 45 to 59 Minutes | 26 (12.0%) | 18 (5.9%) |
| 60 to 89 Minutes | 7 (3.2%) | 0 (0.0%) |
| 90 or more Minutes | 8 (3.7%) | 0 (0.0%) |
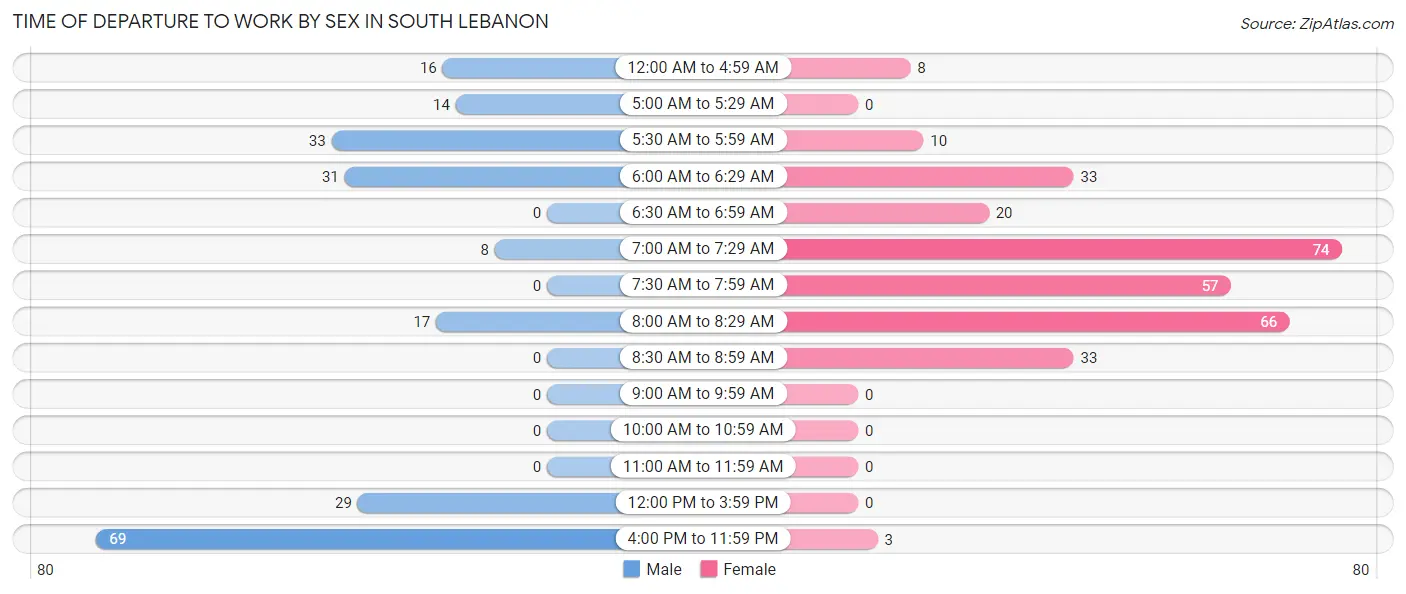
Time of Departure to Work by Sex in South Lebanon
The most frequent times of departure to work in South Lebanon are 4:00 PM to 11:59 PM (69, 31.8%) for males and 7:00 AM to 7:29 AM (74, 24.3%) for females.
| Time of Departure | Male | Female |
| 12:00 AM to 4:59 AM | 16 (7.4%) | 8 (2.6%) |
| 5:00 AM to 5:29 AM | 14 (6.5%) | 0 (0.0%) |
| 5:30 AM to 5:59 AM | 33 (15.2%) | 10 (3.3%) |
| 6:00 AM to 6:29 AM | 31 (14.3%) | 33 (10.9%) |
| 6:30 AM to 6:59 AM | 0 (0.0%) | 20 (6.6%) |
| 7:00 AM to 7:29 AM | 8 (3.7%) | 74 (24.3%) |
| 7:30 AM to 7:59 AM | 0 (0.0%) | 57 (18.8%) |
| 8:00 AM to 8:29 AM | 17 (7.8%) | 66 (21.7%) |
| 8:30 AM to 8:59 AM | 0 (0.0%) | 33 (10.9%) |
| 9:00 AM to 9:59 AM | 0 (0.0%) | 0 (0.0%) |
| 10:00 AM to 10:59 AM | 0 (0.0%) | 0 (0.0%) |
| 11:00 AM to 11:59 AM | 0 (0.0%) | 0 (0.0%) |
| 12:00 PM to 3:59 PM | 29 (13.4%) | 0 (0.0%) |
| 4:00 PM to 11:59 PM | 69 (31.8%) | 3 (1.0%) |
| Total | 217 (100.0%) | 304 (100.0%) |
Housing Occupancy in South Lebanon
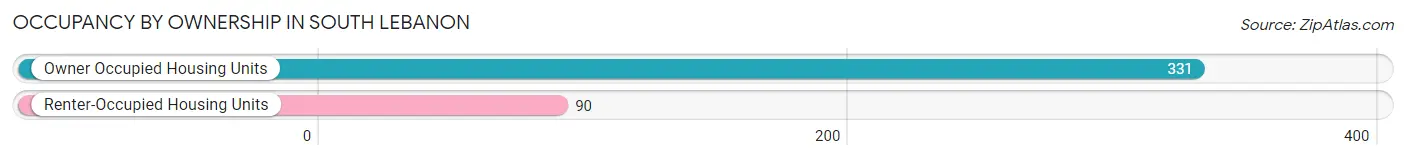
Occupancy by Ownership in South Lebanon
Of the total 421 dwellings in South Lebanon, owner-occupied units account for 331 (78.6%), while renter-occupied units make up 90 (21.4%).
| Occupancy | # Housing Units | % Housing Units |
| Owner Occupied Housing Units | 331 | 78.6% |
| Renter-Occupied Housing Units | 90 | 21.4% |
| Total Occupied Housing Units | 421 | 100.0% |
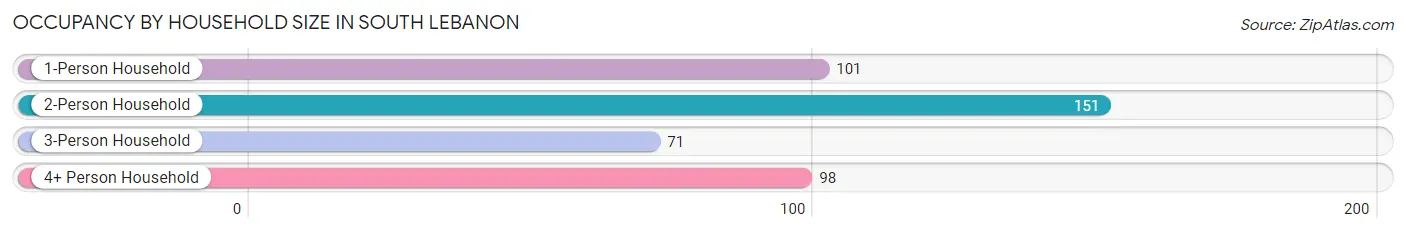
Occupancy by Household Size in South Lebanon
| Household Size | # Housing Units | % Housing Units |
| 1-Person Household | 101 | 24.0% |
| 2-Person Household | 151 | 35.9% |
| 3-Person Household | 71 | 16.9% |
| 4+ Person Household | 98 | 23.3% |
| Total Housing Units | 421 | 100.0% |
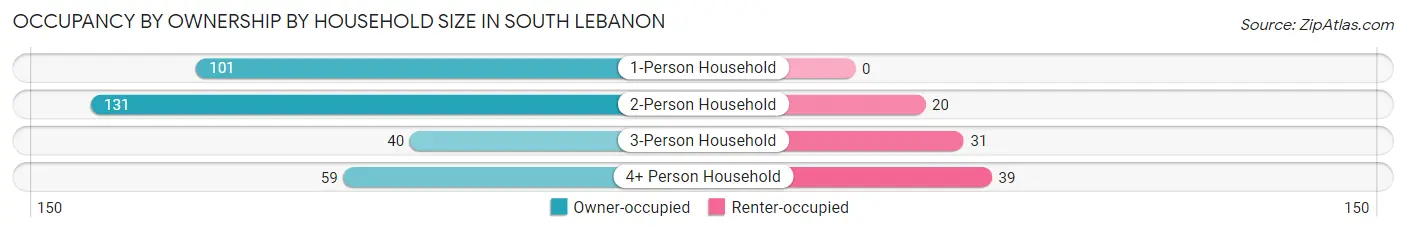
Occupancy by Ownership by Household Size in South Lebanon
| Household Size | Owner-occupied | Renter-occupied |
| 1-Person Household | 101 (100.0%) | 0 (0.0%) |
| 2-Person Household | 131 (86.8%) | 20 (13.3%) |
| 3-Person Household | 40 (56.3%) | 31 (43.7%) |
| 4+ Person Household | 59 (60.2%) | 39 (39.8%) |
| Total Housing Units | 331 (78.6%) | 90 (21.4%) |
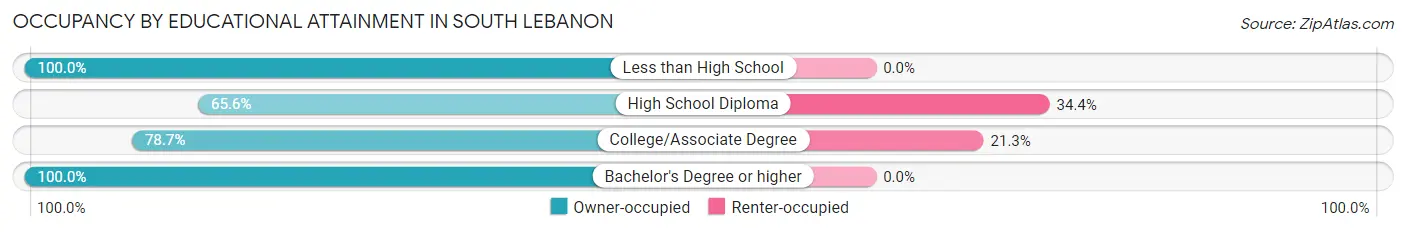
Occupancy by Educational Attainment in South Lebanon
| Household Size | Owner-occupied | Renter-occupied |
| Less than High School | 28 (100.0%) | 0 (0.0%) |
| High School Diploma | 103 (65.6%) | 54 (34.4%) |
| College/Associate Degree | 133 (78.7%) | 36 (21.3%) |
| Bachelor's Degree or higher | 67 (100.0%) | 0 (0.0%) |
Occupancy by Age of Householder in South Lebanon
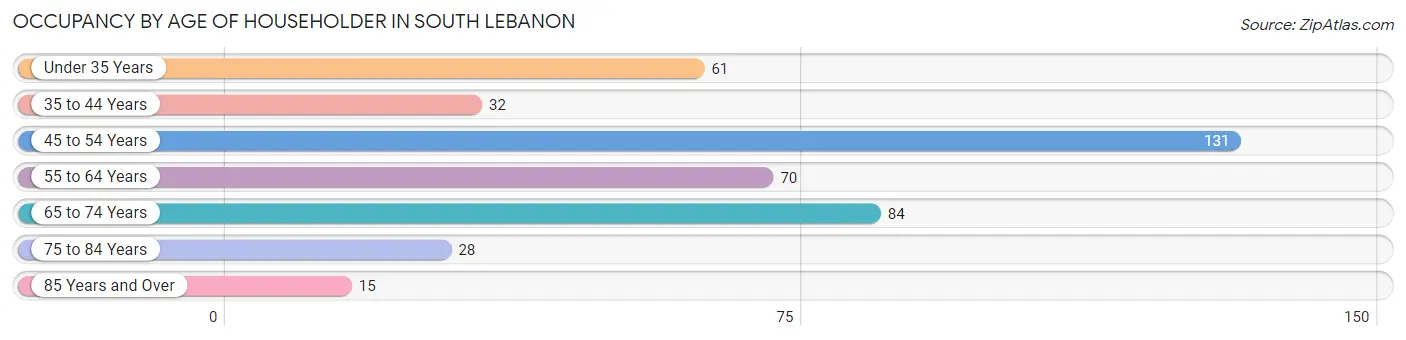
| Age Bracket | # Households | % Households |
| Under 35 Years | 61 | 14.5% |
| 35 to 44 Years | 32 | 7.6% |
| 45 to 54 Years | 131 | 31.1% |
| 55 to 64 Years | 70 | 16.6% |
| 65 to 74 Years | 84 | 20.0% |
| 75 to 84 Years | 28 | 6.7% |
| 85 Years and Over | 15 | 3.6% |
| Total | 421 | 100.0% |
Housing Finances in South Lebanon
Median Income by Occupancy in South Lebanon
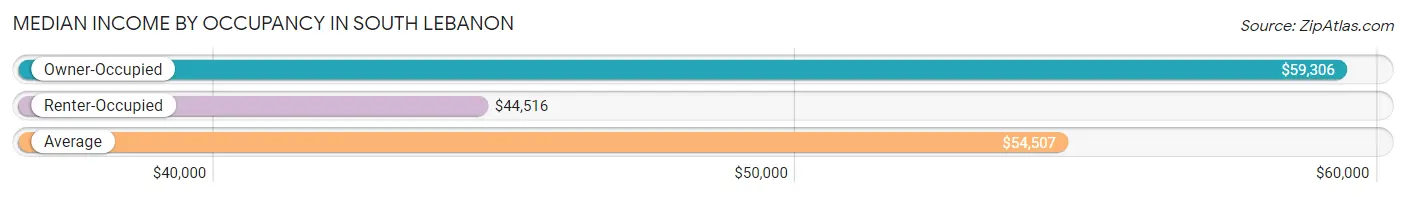
| Occupancy Type | # Households | Median Income |
| Owner-Occupied | 331 (78.6%) | $59,306 |
| Renter-Occupied | 90 (21.4%) | $44,516 |
| Average | 421 (100.0%) | $54,507 |
Occupancy by Householder Income Bracket in South Lebanon
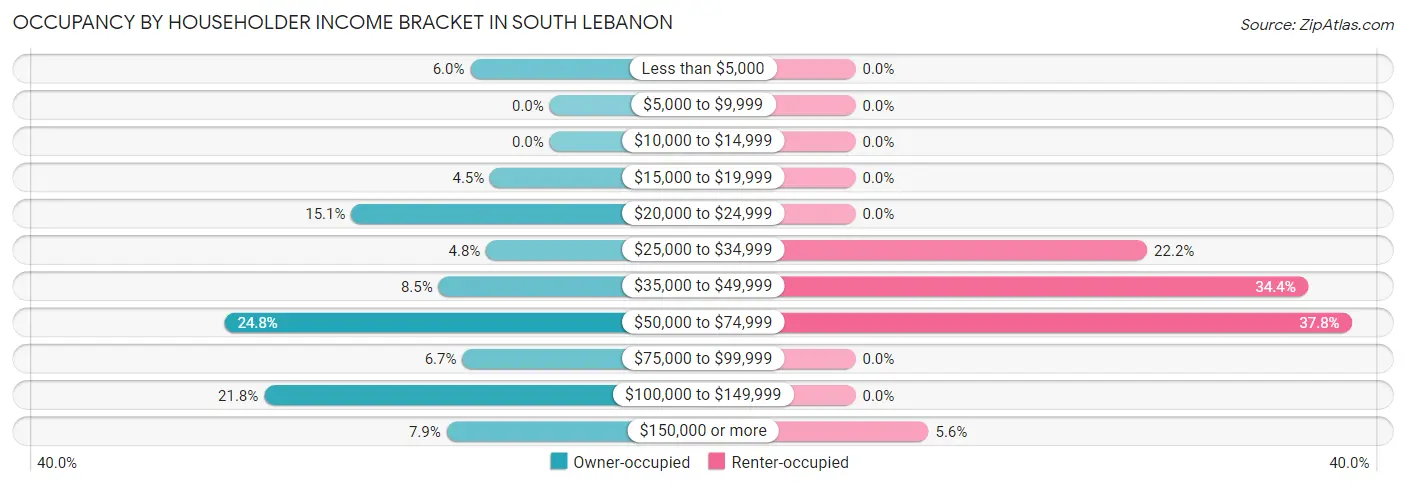
| Income Bracket | Owner-occupied | Renter-occupied |
| Less than $5,000 | 20 (6.0%) | 0 (0.0%) |
| $5,000 to $9,999 | 0 (0.0%) | 0 (0.0%) |
| $10,000 to $14,999 | 0 (0.0%) | 0 (0.0%) |
| $15,000 to $19,999 | 15 (4.5%) | 0 (0.0%) |
| $20,000 to $24,999 | 50 (15.1%) | 0 (0.0%) |
| $25,000 to $34,999 | 16 (4.8%) | 20 (22.2%) |
| $35,000 to $49,999 | 28 (8.5%) | 31 (34.4%) |
| $50,000 to $74,999 | 82 (24.8%) | 34 (37.8%) |
| $75,000 to $99,999 | 22 (6.7%) | 0 (0.0%) |
| $100,000 to $149,999 | 72 (21.7%) | 0 (0.0%) |
| $150,000 or more | 26 (7.9%) | 5 (5.6%) |
| Total | 331 (100.0%) | 90 (100.0%) |
Monthly Housing Cost Tiers in South Lebanon
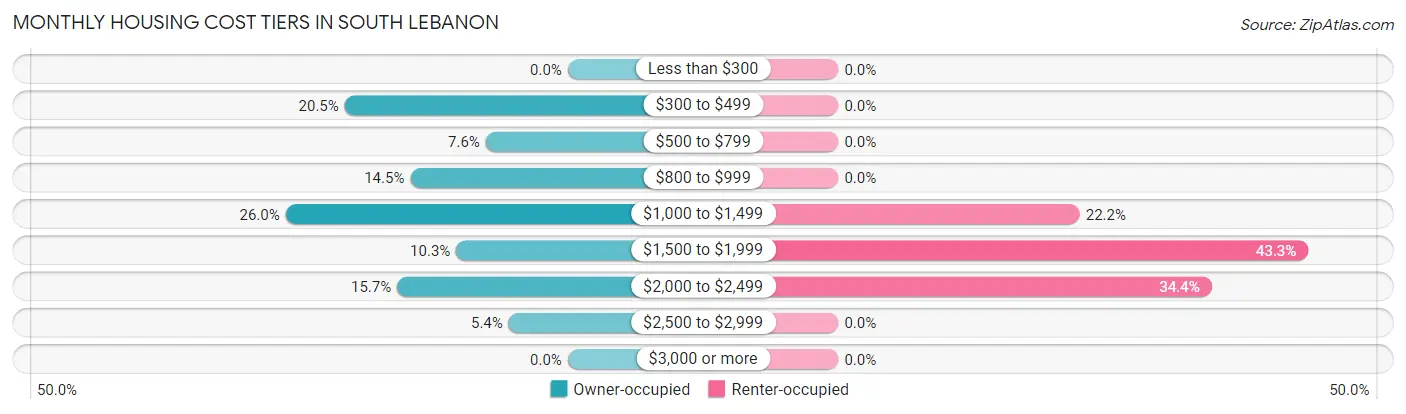
| Monthly Cost | Owner-occupied | Renter-occupied |
| Less than $300 | 0 (0.0%) | 0 (0.0%) |
| $300 to $499 | 68 (20.5%) | 0 (0.0%) |
| $500 to $799 | 25 (7.5%) | 0 (0.0%) |
| $800 to $999 | 48 (14.5%) | 0 (0.0%) |
| $1,000 to $1,499 | 86 (26.0%) | 20 (22.2%) |
| $1,500 to $1,999 | 34 (10.3%) | 39 (43.3%) |
| $2,000 to $2,499 | 52 (15.7%) | 31 (34.4%) |
| $2,500 to $2,999 | 18 (5.4%) | 0 (0.0%) |
| $3,000 or more | 0 (0.0%) | 0 (0.0%) |
| Total | 331 (100.0%) | 90 (100.0%) |
Physical Housing Characteristics in South Lebanon
Housing Structures in South Lebanon
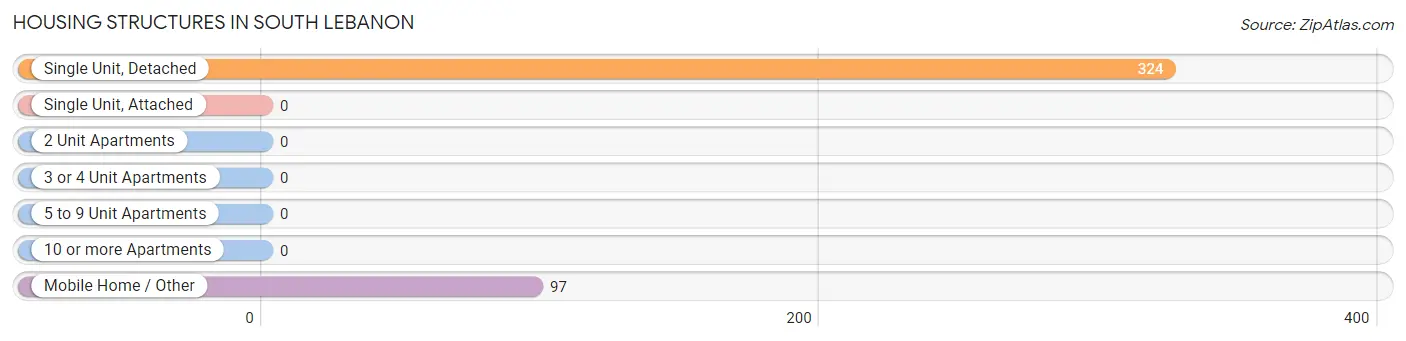
| Structure Type | # Housing Units | % Housing Units |
| Single Unit, Detached | 324 | 77.0% |
| Single Unit, Attached | 0 | 0.0% |
| 2 Unit Apartments | 0 | 0.0% |
| 3 or 4 Unit Apartments | 0 | 0.0% |
| 5 to 9 Unit Apartments | 0 | 0.0% |
| 10 or more Apartments | 0 | 0.0% |
| Mobile Home / Other | 97 | 23.0% |
| Total | 421 | 100.0% |
Housing Structures by Occupancy in South Lebanon
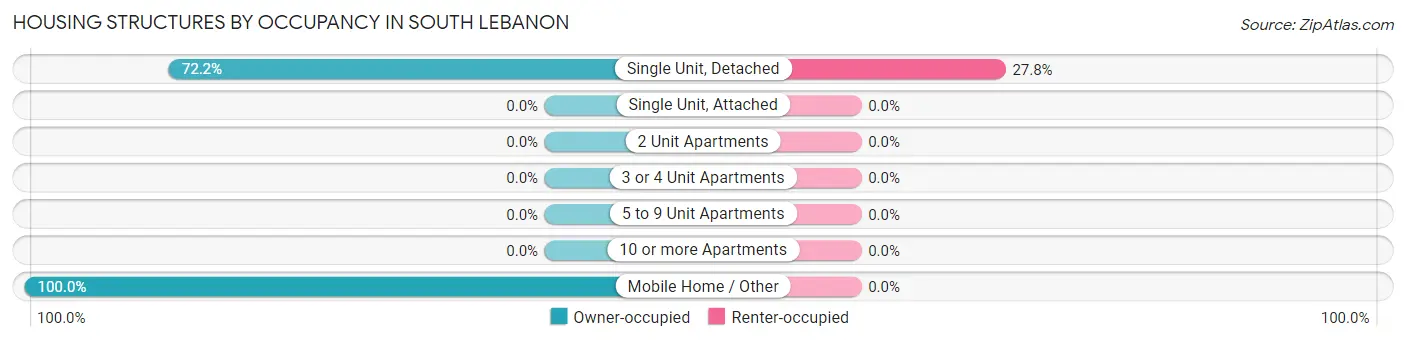
| Structure Type | Owner-occupied | Renter-occupied |
| Single Unit, Detached | 234 (72.2%) | 90 (27.8%) |
| Single Unit, Attached | 0 (0.0%) | 0 (0.0%) |
| 2 Unit Apartments | 0 (0.0%) | 0 (0.0%) |
| 3 or 4 Unit Apartments | 0 (0.0%) | 0 (0.0%) |
| 5 to 9 Unit Apartments | 0 (0.0%) | 0 (0.0%) |
| 10 or more Apartments | 0 (0.0%) | 0 (0.0%) |
| Mobile Home / Other | 97 (100.0%) | 0 (0.0%) |
| Total | 331 (78.6%) | 90 (21.4%) |
Housing Structures by Number of Rooms in South Lebanon
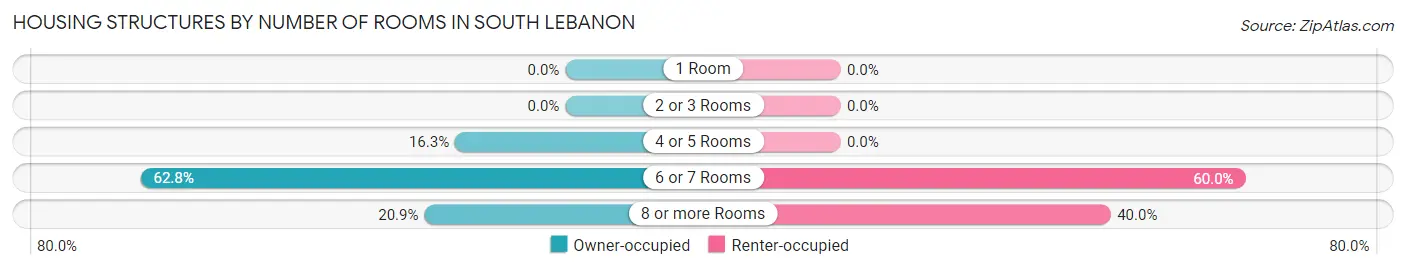
| Number of Rooms | Owner-occupied | Renter-occupied |
| 1 Room | 0 (0.0%) | 0 (0.0%) |
| 2 or 3 Rooms | 0 (0.0%) | 0 (0.0%) |
| 4 or 5 Rooms | 54 (16.3%) | 0 (0.0%) |
| 6 or 7 Rooms | 208 (62.8%) | 54 (60.0%) |
| 8 or more Rooms | 69 (20.8%) | 36 (40.0%) |
| Total | 331 (100.0%) | 90 (100.0%) |
Housing Structure by Heating Type in South Lebanon
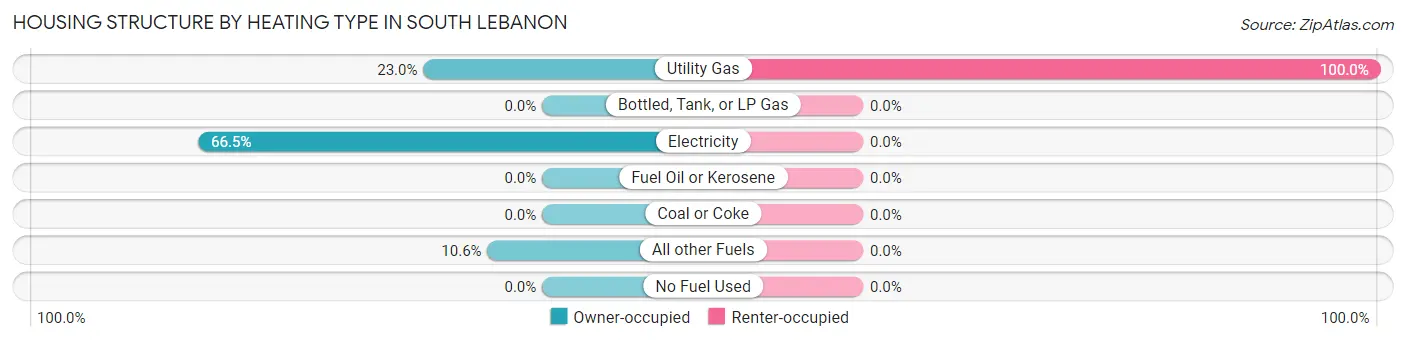
| Heating Type | Owner-occupied | Renter-occupied |
| Utility Gas | 76 (23.0%) | 90 (100.0%) |
| Bottled, Tank, or LP Gas | 0 (0.0%) | 0 (0.0%) |
| Electricity | 220 (66.5%) | 0 (0.0%) |
| Fuel Oil or Kerosene | 0 (0.0%) | 0 (0.0%) |
| Coal or Coke | 0 (0.0%) | 0 (0.0%) |
| All other Fuels | 35 (10.6%) | 0 (0.0%) |
| No Fuel Used | 0 (0.0%) | 0 (0.0%) |
| Total | 331 (100.0%) | 90 (100.0%) |
Household Vehicle Usage in South Lebanon
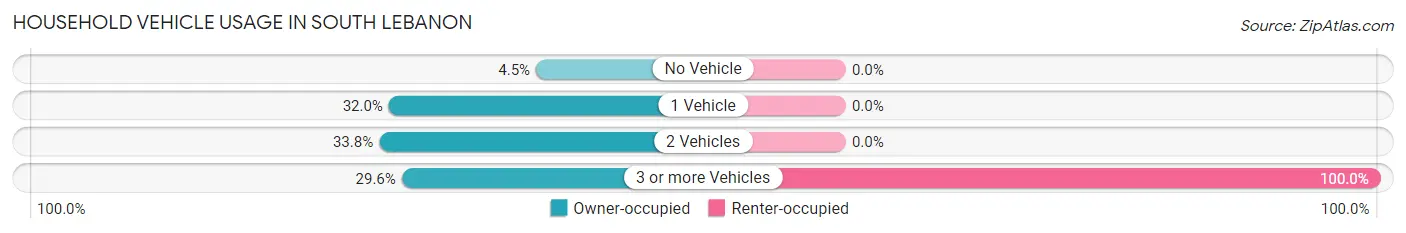
| Vehicles per Household | Owner-occupied | Renter-occupied |
| No Vehicle | 15 (4.5%) | 0 (0.0%) |
| 1 Vehicle | 106 (32.0%) | 0 (0.0%) |
| 2 Vehicles | 112 (33.8%) | 0 (0.0%) |
| 3 or more Vehicles | 98 (29.6%) | 90 (100.0%) |
| Total | 331 (100.0%) | 90 (100.0%) |
Real Estate & Mortgages in South Lebanon
Real Estate and Mortgage Overview in South Lebanon
| Characteristic | Without Mortgage | With Mortgage |
| Housing Units | 93 | 238 |
| Median Property Value | $271,000 | $314,800 |
| Median Household Income | $46,875 | $26 |
| Monthly Housing Costs | $466 | $0 |
| Real Estate Taxes | $2,345 | $20 |
Property Value by Mortgage Status in South Lebanon
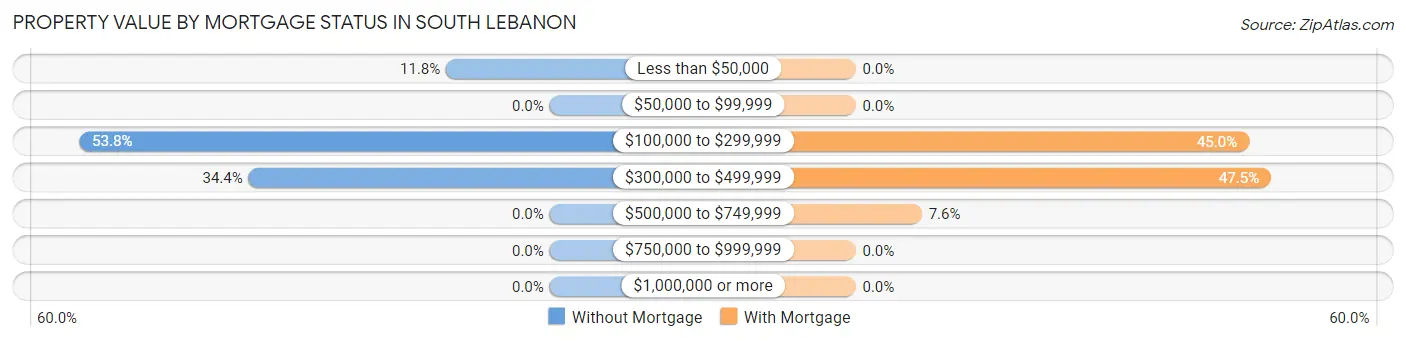
| Property Value | Without Mortgage | With Mortgage |
| Less than $50,000 | 11 (11.8%) | 0 (0.0%) |
| $50,000 to $99,999 | 0 (0.0%) | 0 (0.0%) |
| $100,000 to $299,999 | 50 (53.8%) | 107 (45.0%) |
| $300,000 to $499,999 | 32 (34.4%) | 113 (47.5%) |
| $500,000 to $749,999 | 0 (0.0%) | 18 (7.6%) |
| $750,000 to $999,999 | 0 (0.0%) | 0 (0.0%) |
| $1,000,000 or more | 0 (0.0%) | 0 (0.0%) |
| Total | 93 (100.0%) | 238 (100.0%) |
Household Income by Mortgage Status in South Lebanon
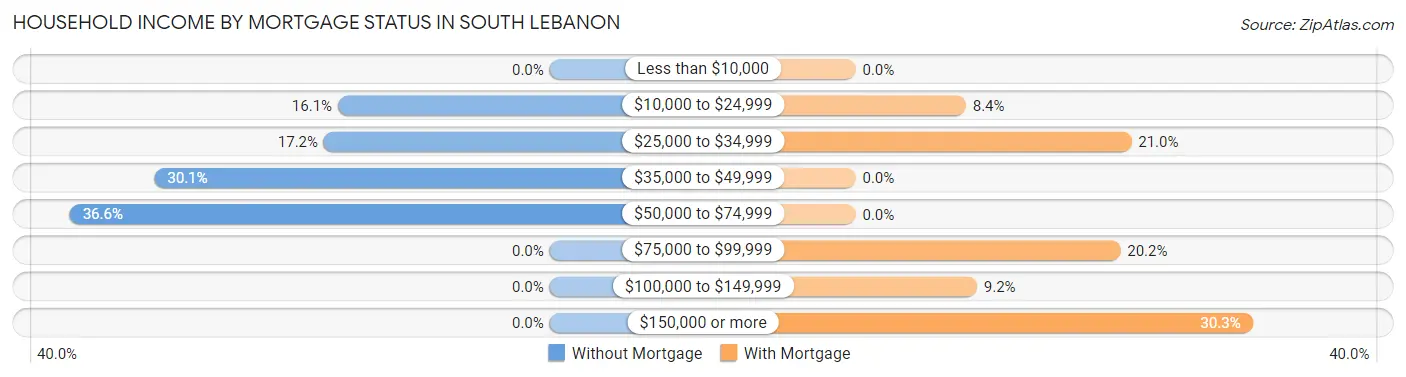
| Household Income | Without Mortgage | With Mortgage |
| Less than $10,000 | 0 (0.0%) | 0 (0.0%) |
| $10,000 to $24,999 | 15 (16.1%) | 20 (8.4%) |
| $25,000 to $34,999 | 16 (17.2%) | 50 (21.0%) |
| $35,000 to $49,999 | 28 (30.1%) | 0 (0.0%) |
| $50,000 to $74,999 | 34 (36.6%) | 0 (0.0%) |
| $75,000 to $99,999 | 0 (0.0%) | 48 (20.2%) |
| $100,000 to $149,999 | 0 (0.0%) | 22 (9.2%) |
| $150,000 or more | 0 (0.0%) | 72 (30.2%) |
| Total | 93 (100.0%) | 238 (100.0%) |
Property Value to Household Income Ratio in South Lebanon
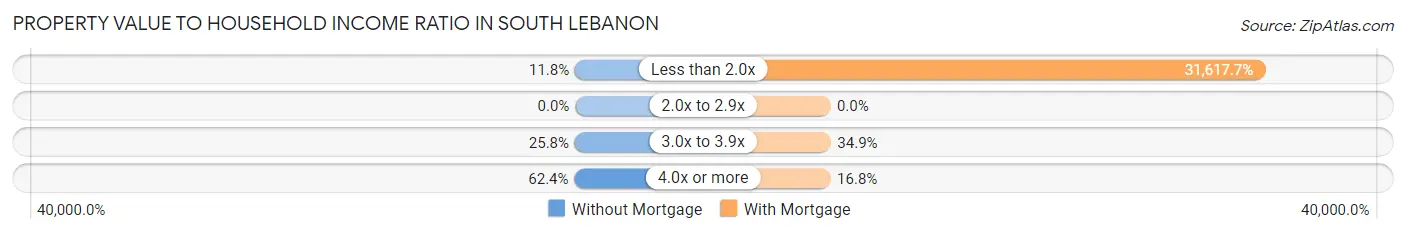
| Value-to-Income Ratio | Without Mortgage | With Mortgage |
| Less than 2.0x | 11 (11.8%) | 75,250 (31,617.6%) |
| 2.0x to 2.9x | 0 (0.0%) | 0 (0.0%) |
| 3.0x to 3.9x | 24 (25.8%) | 83 (34.9%) |
| 4.0x or more | 58 (62.4%) | 40 (16.8%) |
| Total | 93 (100.0%) | 238 (100.0%) |
Real Estate Taxes by Mortgage Status in South Lebanon
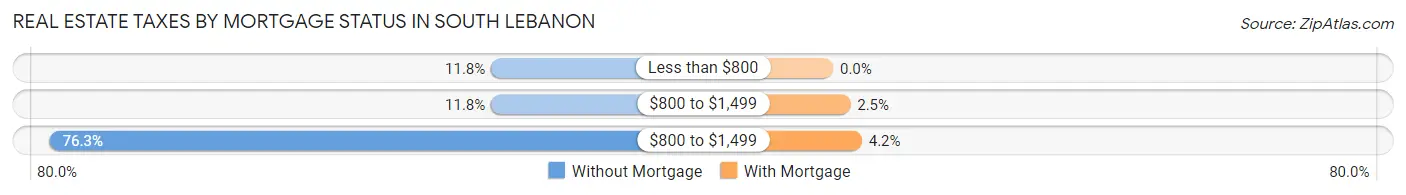
| Property Taxes | Without Mortgage | With Mortgage |
| Less than $800 | 11 (11.8%) | 0 (0.0%) |
| $800 to $1,499 | 11 (11.8%) | 6 (2.5%) |
| $800 to $1,499 | 71 (76.3%) | 10 (4.2%) |
| Total | 93 (100.0%) | 238 (100.0%) |
Health & Disability in South Lebanon
Health Insurance Coverage by Age in South Lebanon
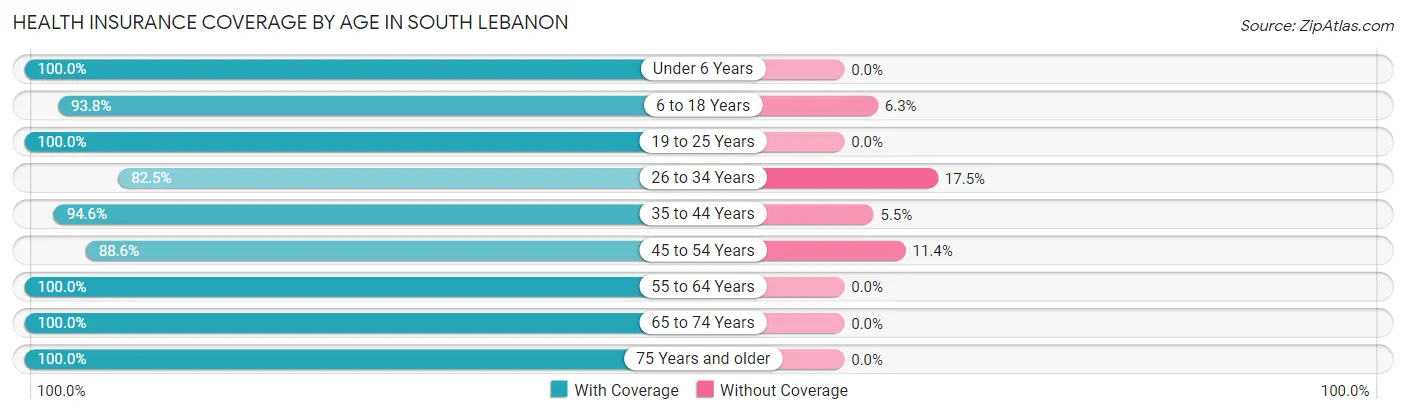
| Age Bracket | With Coverage | Without Coverage |
| Under 6 Years | 32 (100.0%) | 0 (0.0%) |
| 6 to 18 Years | 225 (93.8%) | 15 (6.2%) |
| 19 to 25 Years | 89 (100.0%) | 0 (0.0%) |
| 26 to 34 Years | 52 (82.5%) | 11 (17.5%) |
| 35 to 44 Years | 52 (94.6%) | 3 (5.4%) |
| 45 to 54 Years | 256 (88.6%) | 33 (11.4%) |
| 55 to 64 Years | 124 (100.0%) | 0 (0.0%) |
| 65 to 74 Years | 106 (100.0%) | 0 (0.0%) |
| 75 Years and older | 86 (100.0%) | 0 (0.0%) |
| Total | 1,022 (94.3%) | 62 (5.7%) |
Health Insurance Coverage by Citizenship Status in South Lebanon
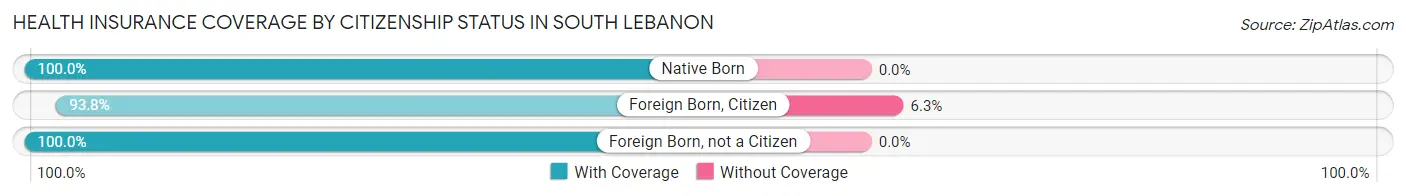
| Citizenship Status | With Coverage | Without Coverage |
| Native Born | 32 (100.0%) | 0 (0.0%) |
| Foreign Born, Citizen | 225 (93.8%) | 15 (6.2%) |
| Foreign Born, not a Citizen | 89 (100.0%) | 0 (0.0%) |
Health Insurance Coverage by Household Income in South Lebanon

| Household Income | With Coverage | Without Coverage |
| Under $25,000 | 85 (100.0%) | 0 (0.0%) |
| $25,000 to $49,999 | 142 (70.7%) | 59 (29.3%) |
| $50,000 to $74,999 | 326 (99.1%) | 3 (0.9%) |
| $75,000 to $99,999 | 103 (100.0%) | 0 (0.0%) |
| $100,000 and over | 366 (100.0%) | 0 (0.0%) |
Public vs Private Health Insurance Coverage by Age in South Lebanon
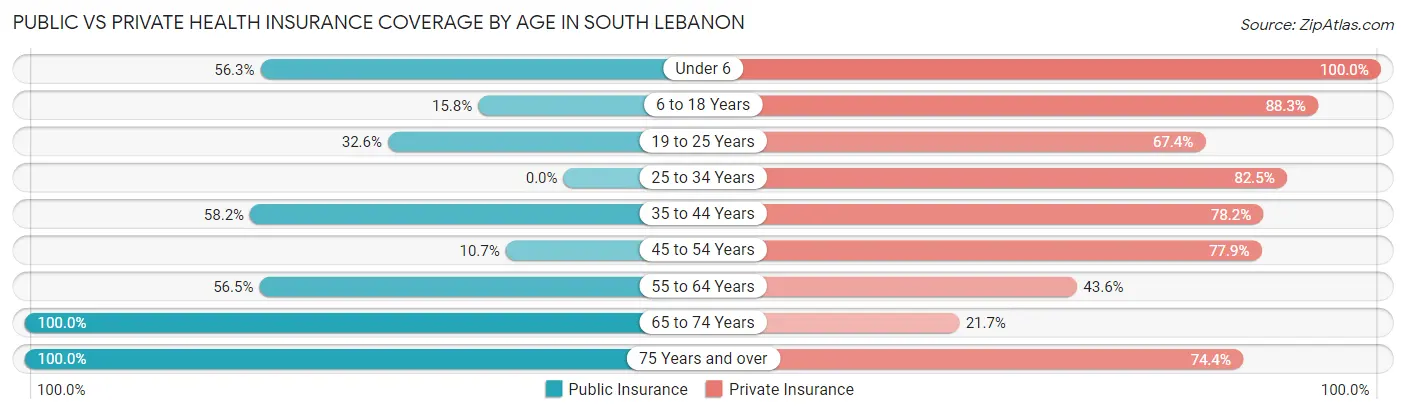
| Age Bracket | Public Insurance | Private Insurance |
| Under 6 | 18 (56.2%) | 32 (100.0%) |
| 6 to 18 Years | 38 (15.8%) | 212 (88.3%) |
| 19 to 25 Years | 29 (32.6%) | 60 (67.4%) |
| 25 to 34 Years | 0 (0.0%) | 52 (82.5%) |
| 35 to 44 Years | 32 (58.2%) | 43 (78.2%) |
| 45 to 54 Years | 31 (10.7%) | 225 (77.8%) |
| 55 to 64 Years | 70 (56.5%) | 54 (43.5%) |
| 65 to 74 Years | 106 (100.0%) | 23 (21.7%) |
| 75 Years and over | 86 (100.0%) | 64 (74.4%) |
| Total | 410 (37.8%) | 765 (70.6%) |
Disability Status by Sex by Age in South Lebanon
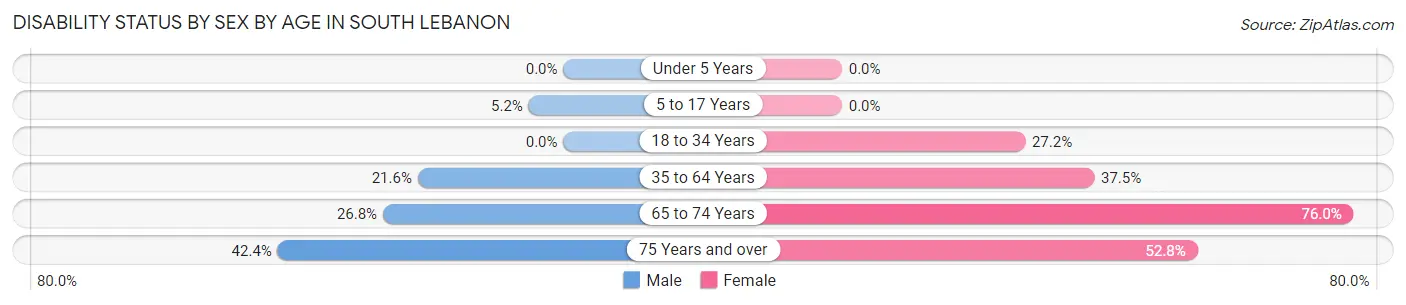
| Age Bracket | Male | Female |
| Under 5 Years | 0 (0.0%) | 0 (0.0%) |
| 5 to 17 Years | 7 (5.1%) | 0 (0.0%) |
| 18 to 34 Years | 0 (0.0%) | 34 (27.2%) |
| 35 to 64 Years | 40 (21.6%) | 106 (37.5%) |
| 65 to 74 Years | 15 (26.8%) | 38 (76.0%) |
| 75 Years and over | 14 (42.4%) | 28 (52.8%) |
Disability Class by Sex by Age in South Lebanon
Disability Class: Hearing Difficulty
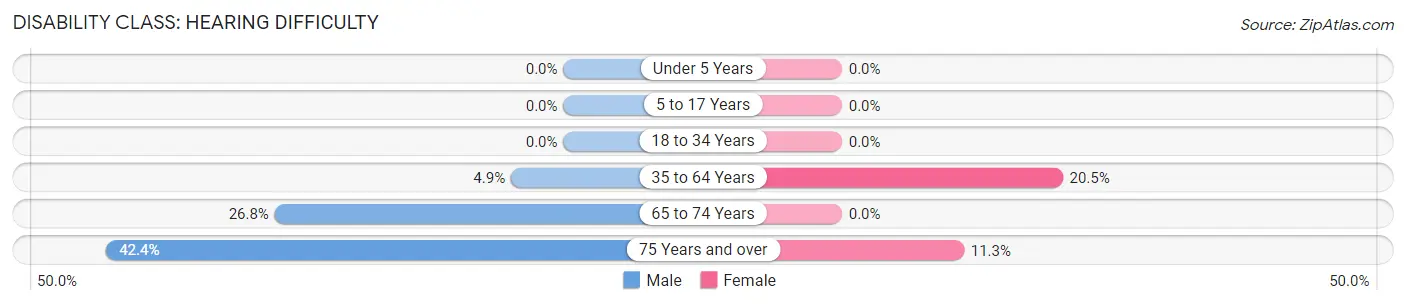
| Age Bracket | Male | Female |
| Under 5 Years | 0 (0.0%) | 0 (0.0%) |
| 5 to 17 Years | 0 (0.0%) | 0 (0.0%) |
| 18 to 34 Years | 0 (0.0%) | 0 (0.0%) |
| 35 to 64 Years | 9 (4.9%) | 58 (20.5%) |
| 65 to 74 Years | 15 (26.8%) | 0 (0.0%) |
| 75 Years and over | 14 (42.4%) | 6 (11.3%) |
Disability Class: Vision Difficulty
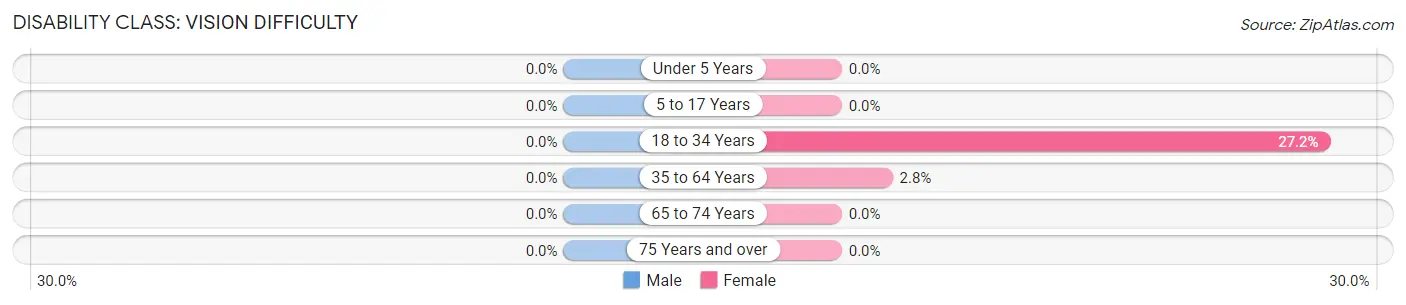
| Age Bracket | Male | Female |
| Under 5 Years | 0 (0.0%) | 0 (0.0%) |
| 5 to 17 Years | 0 (0.0%) | 0 (0.0%) |
| 18 to 34 Years | 0 (0.0%) | 34 (27.2%) |
| 35 to 64 Years | 0 (0.0%) | 8 (2.8%) |
| 65 to 74 Years | 0 (0.0%) | 0 (0.0%) |
| 75 Years and over | 0 (0.0%) | 0 (0.0%) |
Disability Class: Cognitive Difficulty
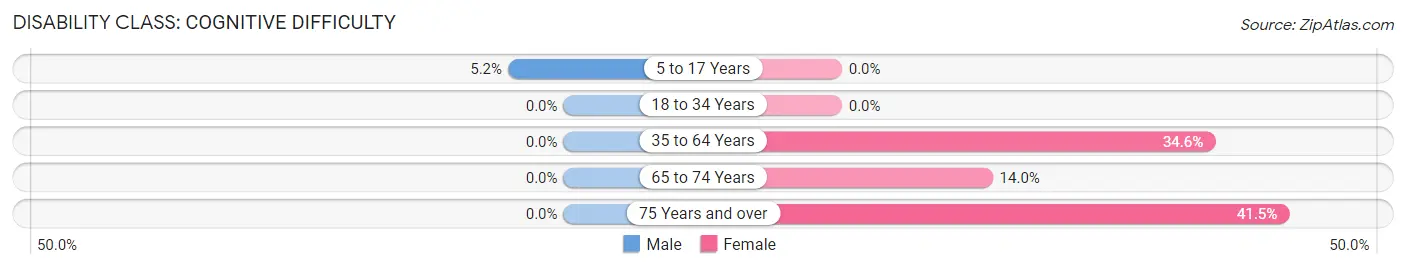
| Age Bracket | Male | Female |
| 5 to 17 Years | 7 (5.1%) | 0 (0.0%) |
| 18 to 34 Years | 0 (0.0%) | 0 (0.0%) |
| 35 to 64 Years | 0 (0.0%) | 98 (34.6%) |
| 65 to 74 Years | 0 (0.0%) | 7 (14.0%) |
| 75 Years and over | 0 (0.0%) | 22 (41.5%) |
Disability Class: Ambulatory Difficulty
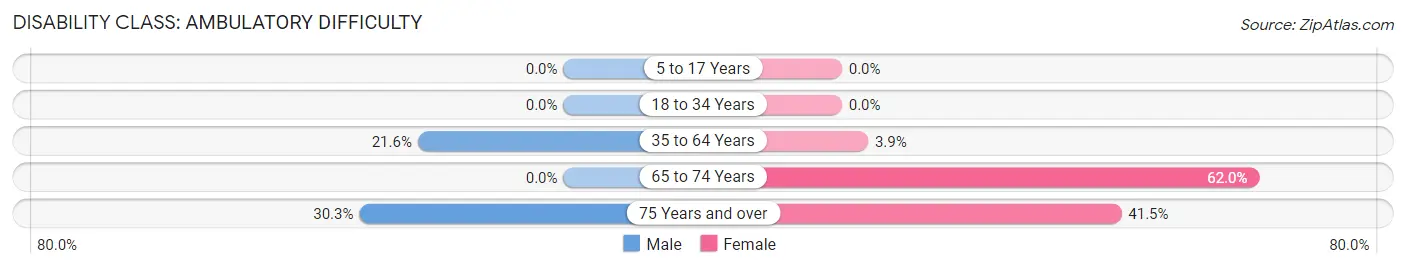
| Age Bracket | Male | Female |
| 5 to 17 Years | 0 (0.0%) | 0 (0.0%) |
| 18 to 34 Years | 0 (0.0%) | 0 (0.0%) |
| 35 to 64 Years | 40 (21.6%) | 11 (3.9%) |
| 65 to 74 Years | 0 (0.0%) | 31 (62.0%) |
| 75 Years and over | 10 (30.3%) | 22 (41.5%) |
Disability Class: Self-Care Difficulty
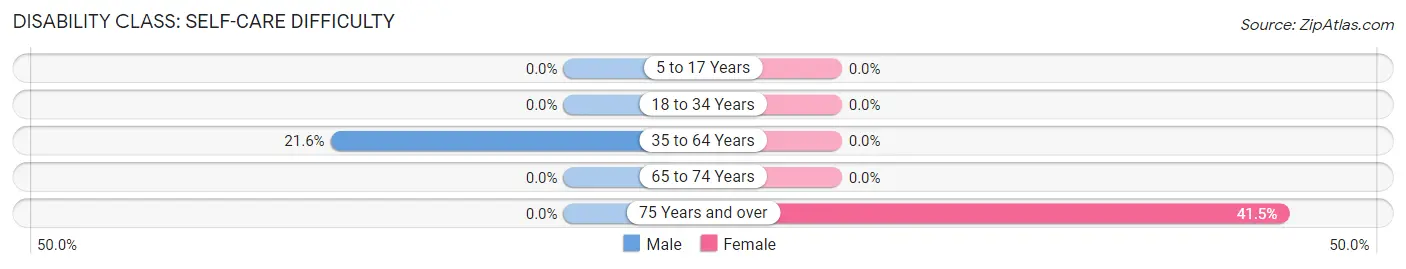
| Age Bracket | Male | Female |
| 5 to 17 Years | 0 (0.0%) | 0 (0.0%) |
| 18 to 34 Years | 0 (0.0%) | 0 (0.0%) |
| 35 to 64 Years | 40 (21.6%) | 0 (0.0%) |
| 65 to 74 Years | 0 (0.0%) | 0 (0.0%) |
| 75 Years and over | 0 (0.0%) | 22 (41.5%) |
Technology Access in South Lebanon
Computing Device Access in South Lebanon
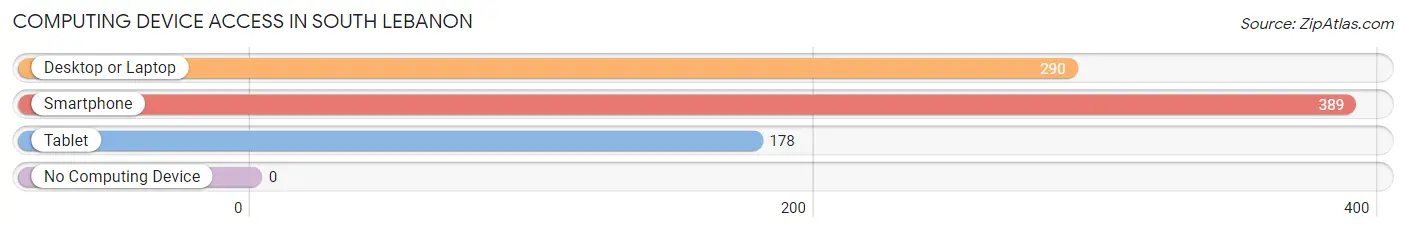
| Device Type | # Households | % Households |
| Desktop or Laptop | 290 | 68.9% |
| Smartphone | 389 | 92.4% |
| Tablet | 178 | 42.3% |
| No Computing Device | 0 | 0.0% |
| Total | 421 | 100.0% |
Internet Access in South Lebanon
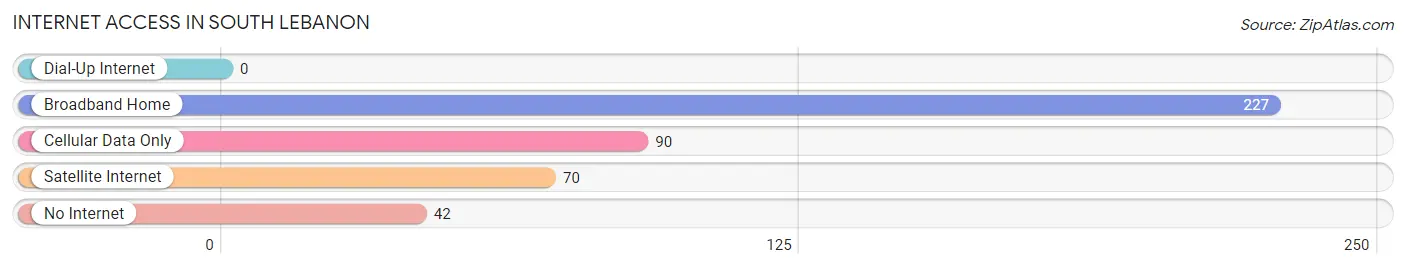
| Internet Type | # Households | % Households |
| Dial-Up Internet | 0 | 0.0% |
| Broadband Home | 227 | 53.9% |
| Cellular Data Only | 90 | 21.4% |
| Satellite Internet | 70 | 16.6% |
| No Internet | 42 | 10.0% |
| Total | 421 | 100.0% |
South Lebanon Summary
Introduction
South Lebanon is a small city located in Linn County, Oregon, United States. It is situated on the banks of the Willamette River, about 10 miles south of the city of Albany. The city has a population of approximately 4,000 people and is part of the Albany-Lebanon metropolitan area. South Lebanon is known for its small-town charm and its proximity to the Willamette Valley, which is home to some of the best wineries in the state.
History
South Lebanon was founded in 1851 by a group of settlers from the Midwest. The settlers were looking for a place to settle and farm, and they chose the area because of its fertile soil and abundant water supply. The town was originally called "Lebanon," but the name was changed to "South Lebanon" in 1853 to avoid confusion with the nearby town of Lebanon.
The town grew slowly but steadily over the years, and by the early 1900s, it had become a thriving agricultural community. The town was home to several large farms, as well as a number of small businesses. In the 1920s, the town began to experience a population boom, as many people moved to the area to take advantage of the fertile soil and abundant water supply.
Geography
South Lebanon is located in the Willamette Valley, which is a large valley in western Oregon. The valley is bordered by the Cascade Mountains to the east and the Coast Range to the west. The city is situated on the banks of the Willamette River, which is the largest river in the state. The city is also located near several other rivers, including the Santiam, Luckiamute, and Calapooia.
The city has a total area of 2.2 square miles, all of which is land. The city is located at an elevation of approximately 500 feet above sea level. The climate in South Lebanon is mild and temperate, with warm summers and cool winters.
Economy
South Lebanon's economy is largely based on agriculture. The city is home to several large farms, as well as a number of small businesses. The city is also home to several wineries, which produce some of the best wines in the state.
The city is also home to several manufacturing companies, including a paper mill and a wood products plant. The city is also home to several retail stores, including a grocery store, a hardware store, and a variety of other shops.
Demographics
As of the 2010 census, South Lebanon had a population of 4,000 people. The racial makeup of the city was 94.3% White, 0.7% African American, 0.3% Native American, 0.7% Asian, 0.1% Pacific Islander, 1.2% from other races, and 2.1% from two or more races. Hispanic or Latino of any race were 3.3% of the population.
The median income for a household in the city was $41,250, and the median income for a family was $50,000. The per capita income for the city was $20,845. About 11.2% of families and 14.2% of the population were below the poverty line, including 18.2% of those under age 18 and 8.3% of those age 65 or over.
Conclusion
South Lebanon is a small city located in Linn County, Oregon, United States. It is situated on the banks of the Willamette River, about 10 miles south of the city of Albany. The city has a population of approximately 4,000 people and is part of the Albany-Lebanon metropolitan area. South Lebanon is known for its small-town charm and its proximity to the Willamette Valley, which is home to some of the best wineries in the state. The city's economy is largely based on agriculture, and it is also home to several manufacturing companies and retail stores. The city has a diverse population, with a median income of $41,250 and a poverty rate of 11.2%.
Common Questions
What is the Total Population of South Lebanon?
Total Population of South Lebanon is 1,084.
What is the Total Male Population of South Lebanon?
Total Male Population of South Lebanon is 493.
What is the Total Female Population of South Lebanon?
Total Female Population of South Lebanon is 591.
What is the Ratio of Males per 100 Females in South Lebanon?
There are 83.42 Males per 100 Females in South Lebanon.
What is the Ratio of Females per 100 Males in South Lebanon?
There are 119.88 Females per 100 Males in South Lebanon.
What is the Median Population Age in South Lebanon?
Median Population Age in South Lebanon is 46.5 Years.
What is the Average Family Size in South Lebanon
Average Family Size in South Lebanon is 3.0 People.
What is the Average Household Size in South Lebanon
Average Household Size in South Lebanon is 2.6 People.
What is Per Capita Income in South Lebanon?
Per Capita income in South Lebanon is $26,399.
What is the Median Family Income in South Lebanon?
Median Family Income in South Lebanon is $60,313.
What is the Median Household income in South Lebanon?
Median Household Income in South Lebanon is $54,507.
What is Inequality or Gini Index in South Lebanon?
Inequality or Gini Index in South Lebanon is 0.39.
How Large is the Labor Force in South Lebanon?
There are 521 People in the Labor Forcein in South Lebanon.
What is the Percentage of People in the Labor Force in South Lebanon?
58.3% of People are in the Labor Force in South Lebanon.