Oceanside, OR
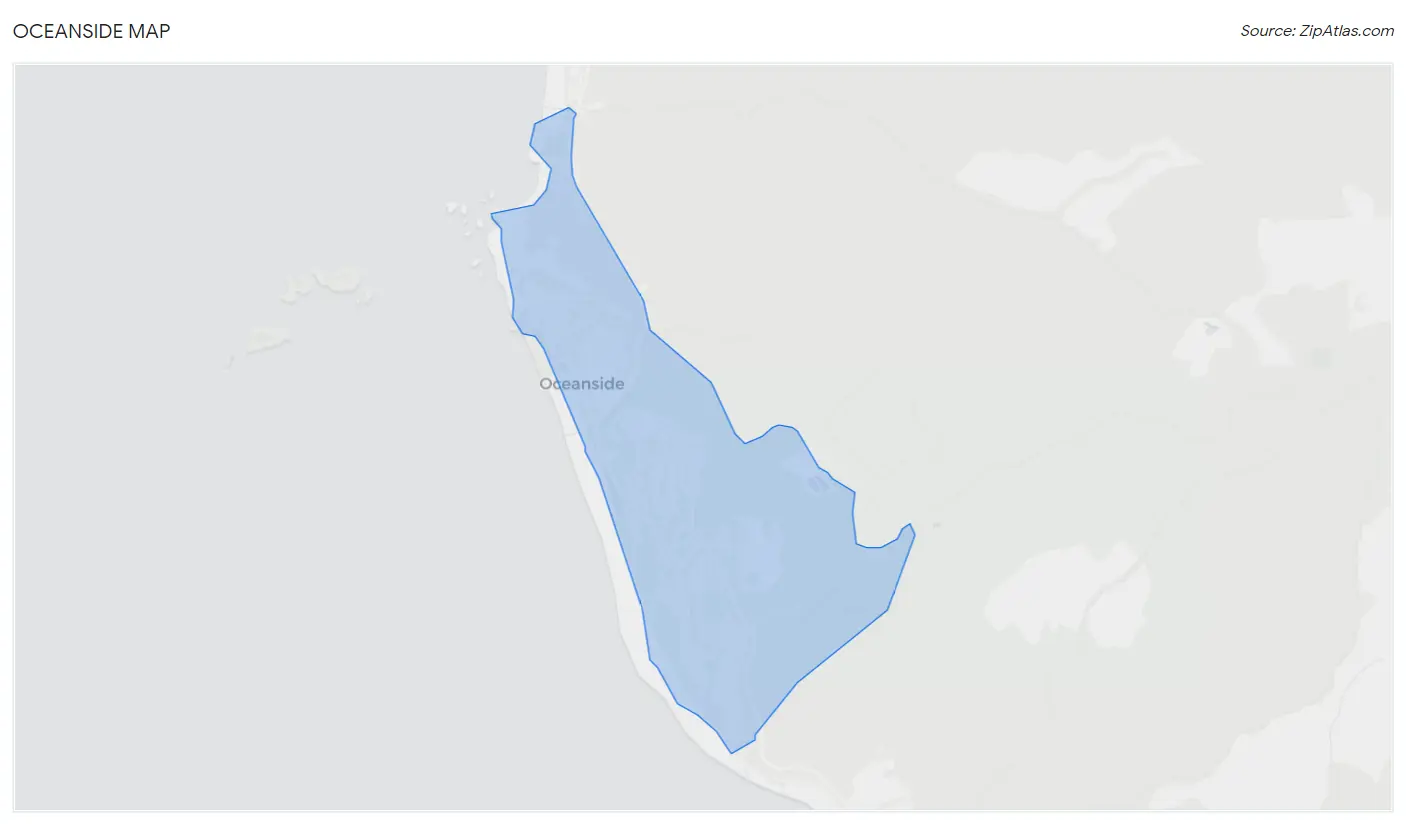
Oceanside Map
Oceanside Overview
472
TOTAL POPULATION
266
MALE POPULATION
206
FEMALE POPULATION
129.13
MALES / 100 FEMALES
77.44
FEMALES / 100 MALES
64.2
MEDIAN AGE
2.4
AVG FAMILY SIZE
1.9
AVG HOUSEHOLD SIZE
$55,149
PER CAPITA INCOME
$77,379
AVG FAMILY INCOME
$76,532
AVG HOUSEHOLD INCOME
0.36
INEQUALITY / GINI INDEX
158
LABOR FORCE [ PEOPLE ]
35.5%
PERCENT IN LABOR FORCE
Oceanside Zip Codes
Oceanside Area Codes
Race in Oceanside
The most populous races in Oceanside are , and White / Caucasian (472 | 100.0%).
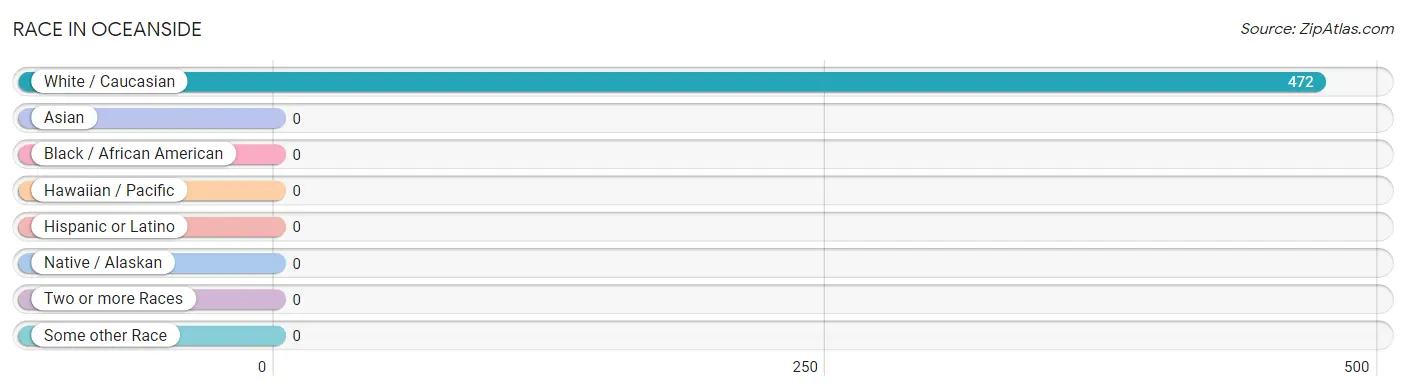
| Race | # Population | % Population |
| Asian | 0 | 0.0% |
| Black / African American | 0 | 0.0% |
| Hawaiian / Pacific | 0 | 0.0% |
| Hispanic or Latino | 0 | 0.0% |
| Native / Alaskan | 0 | 0.0% |
| White / Caucasian | 472 | 100.0% |
| Two or more Races | 0 | 0.0% |
| Some other Race | 0 | 0.0% |
| Total | 472 | 100.0% |
Ancestry in Oceanside
The most populous ancestries reported in Oceanside are English (200 | 42.4%), Irish (164 | 34.7%), German (61 | 12.9%), European (53 | 11.2%), and Scottish (27 | 5.7%), together accounting for 107.0% of all Oceanside residents.
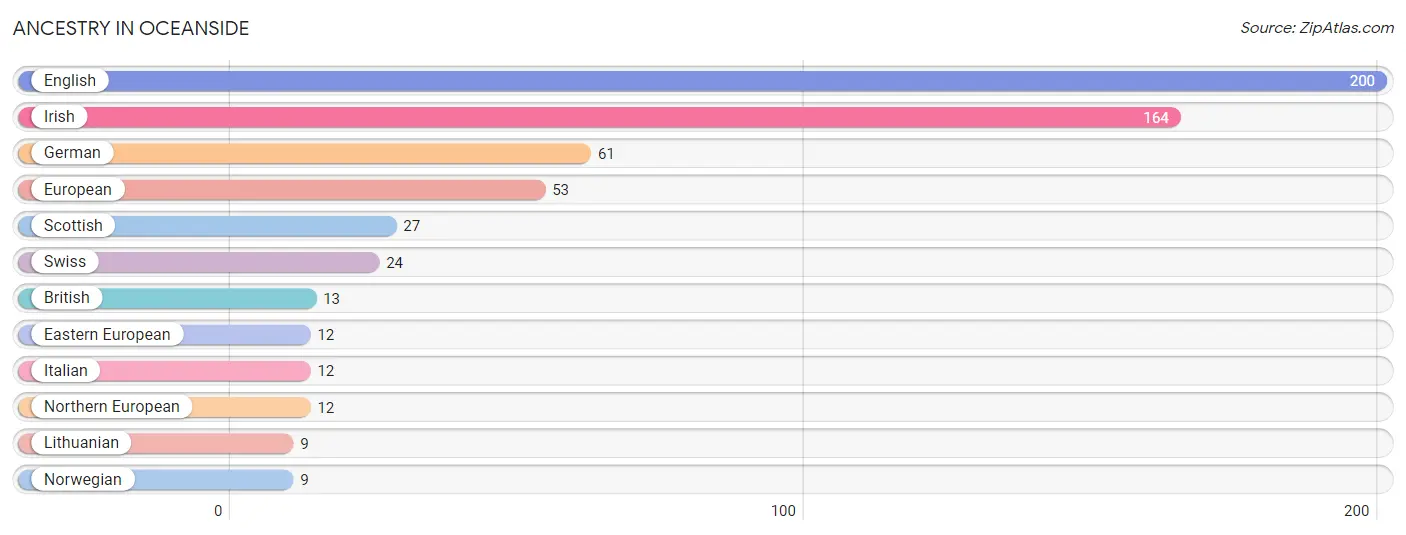
| Ancestry | # Population | % Population |
| British | 13 | 2.8% |
| Eastern European | 12 | 2.5% |
| English | 200 | 42.4% |
| European | 53 | 11.2% |
| German | 61 | 12.9% |
| Irish | 164 | 34.7% |
| Italian | 12 | 2.5% |
| Lithuanian | 9 | 1.9% |
| Northern European | 12 | 2.5% |
| Norwegian | 9 | 1.9% |
| Scottish | 27 | 5.7% |
| Swiss | 24 | 5.1% | View All 12 Rows |
Immigrants in Oceanside

| Immigration Origin | # Population | % Population | View All 0 Rows |
Sex and Age in Oceanside
Sex and Age in Oceanside
The most populous age groups in Oceanside are 60 to 64 Years (84 | 31.6%) for men and 60 to 64 Years (72 | 34.9%) for women.
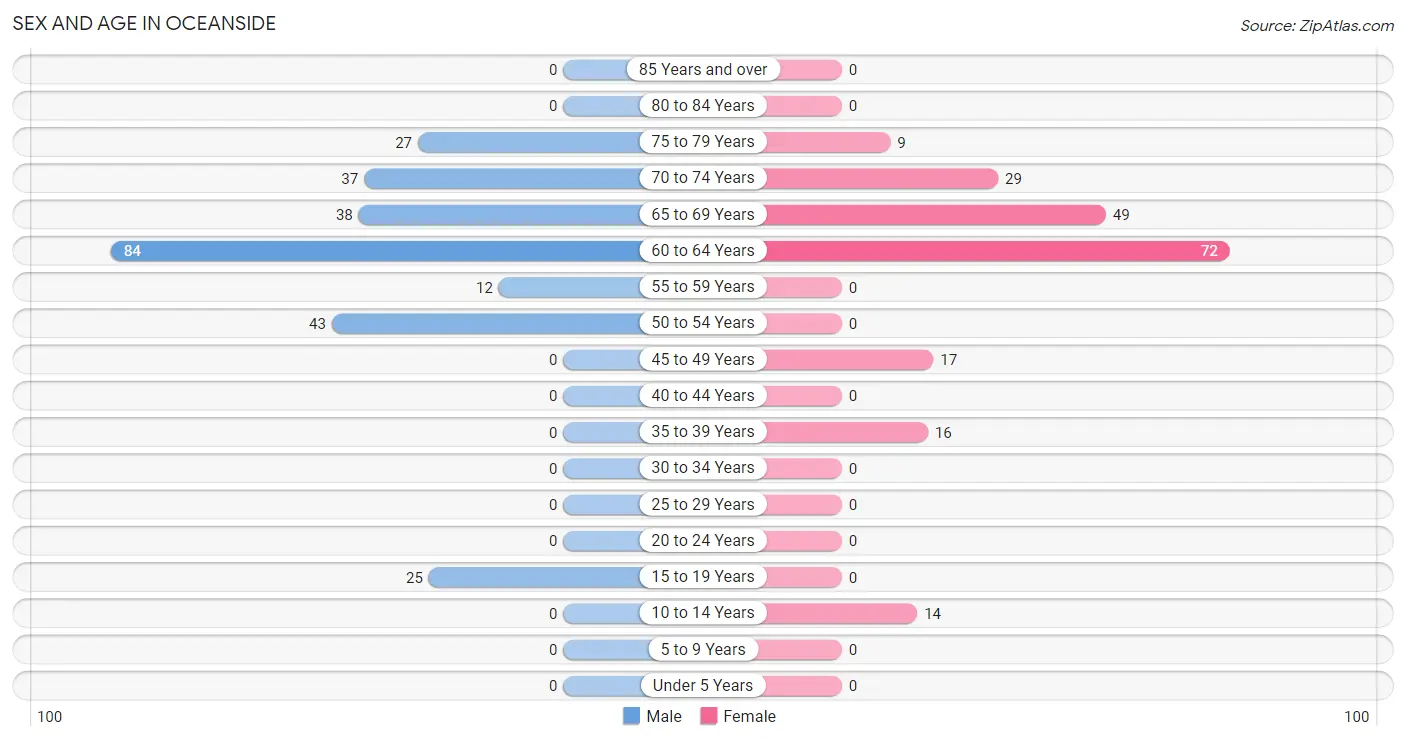
| Age Bracket | Male | Female |
| Under 5 Years | 0 (0.0%) | 0 (0.0%) |
| 5 to 9 Years | 0 (0.0%) | 0 (0.0%) |
| 10 to 14 Years | 0 (0.0%) | 14 (6.8%) |
| 15 to 19 Years | 25 (9.4%) | 0 (0.0%) |
| 20 to 24 Years | 0 (0.0%) | 0 (0.0%) |
| 25 to 29 Years | 0 (0.0%) | 0 (0.0%) |
| 30 to 34 Years | 0 (0.0%) | 0 (0.0%) |
| 35 to 39 Years | 0 (0.0%) | 16 (7.8%) |
| 40 to 44 Years | 0 (0.0%) | 0 (0.0%) |
| 45 to 49 Years | 0 (0.0%) | 17 (8.3%) |
| 50 to 54 Years | 43 (16.2%) | 0 (0.0%) |
| 55 to 59 Years | 12 (4.5%) | 0 (0.0%) |
| 60 to 64 Years | 84 (31.6%) | 72 (34.9%) |
| 65 to 69 Years | 38 (14.3%) | 49 (23.8%) |
| 70 to 74 Years | 37 (13.9%) | 29 (14.1%) |
| 75 to 79 Years | 27 (10.2%) | 9 (4.4%) |
| 80 to 84 Years | 0 (0.0%) | 0 (0.0%) |
| 85 Years and over | 0 (0.0%) | 0 (0.0%) |
| Total | 266 (100.0%) | 206 (100.0%) |
Families and Households in Oceanside
Median Family Size in Oceanside
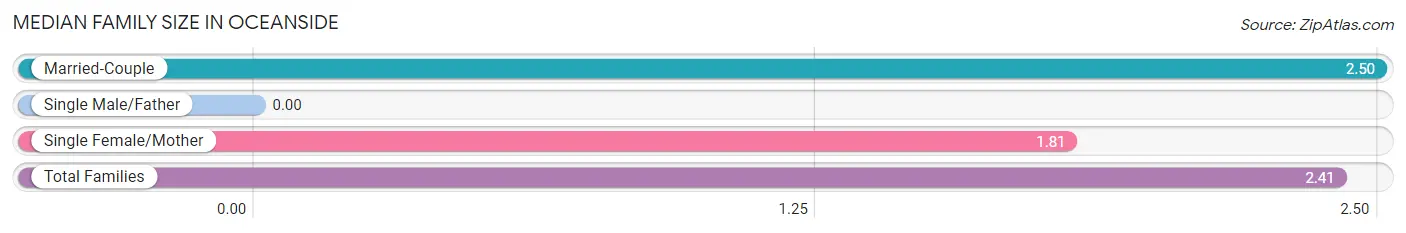
| Family Type | # Families | Family Size |
| Married-Couple | 101 (86.3%) | 2.50 |
| Single Male/Father | 0 (0.0%) | - |
| Single Female/Mother | 16 (13.7%) | 1.81 |
| Total Families | 117 (100.0%) | 2.41 |
Median Household Size in Oceanside
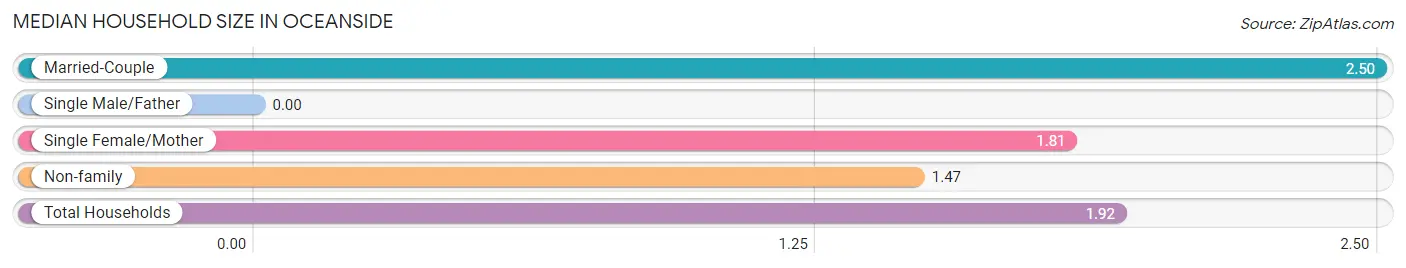
| Household Type | # Households | Household Size |
| Married-Couple | 101 (41.1%) | 2.50 |
| Single Male/Father | 0 (0.0%) | - |
| Single Female/Mother | 16 (6.5%) | 1.81 |
| Non-family | 129 (52.4%) | 1.47 |
| Total Households | 246 (100.0%) | 1.92 |
Household Size by Marriage Status in Oceanside
Out of a total of 246 households in Oceanside, 117 (47.6%) are family households, while 129 (52.4%) are nonfamily households. The most numerous type of family households are 2-person households, comprising 105, and the most common type of nonfamily households are 2-person households, comprising 67.
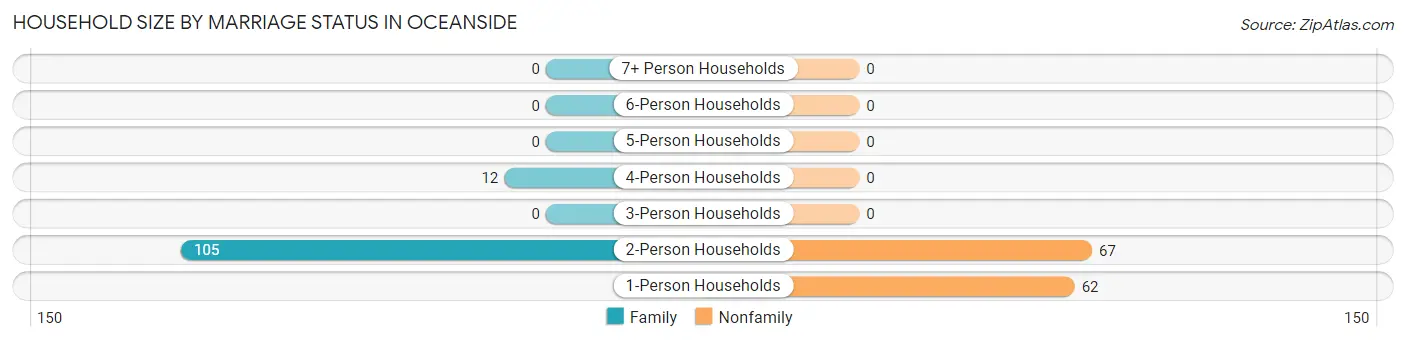
| Household Size | Family Households | Nonfamily Households |
| 1-Person Households | - | 62 (25.2%) |
| 2-Person Households | 105 (42.7%) | 67 (27.2%) |
| 3-Person Households | 0 (0.0%) | 0 (0.0%) |
| 4-Person Households | 12 (4.9%) | 0 (0.0%) |
| 5-Person Households | 0 (0.0%) | 0 (0.0%) |
| 6-Person Households | 0 (0.0%) | 0 (0.0%) |
| 7+ Person Households | 0 (0.0%) | 0 (0.0%) |
| Total | 117 (47.6%) | 129 (52.4%) |
Female Fertility in Oceanside
Fertility by Age in Oceanside
| Age Bracket | Women with Births | Births / 1,000 Women |
| 15 to 19 years | 0 (0.0%) | 0.0 |
| 20 to 34 years | 0 (0.0%) | 0.0 |
| 35 to 50 years | 0 (0.0%) | 0.0 |
| Total | 0 (0.0%) | 0.0 |
Fertility by Age by Marriage Status in Oceanside
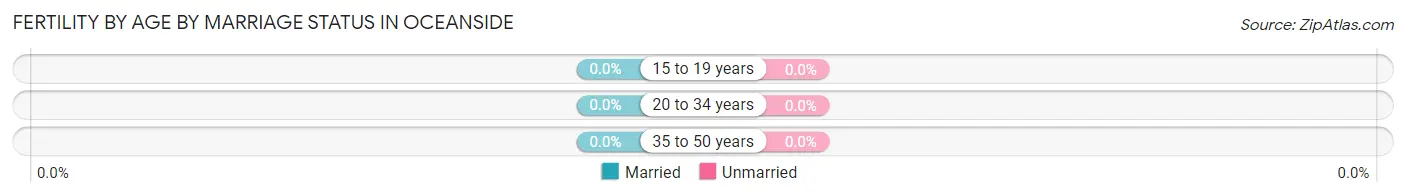
| Age Bracket | Married | Unmarried |
| 15 to 19 years | 0 (0.0%) | 0 (0.0%) |
| 20 to 34 years | 0 (0.0%) | 0 (0.0%) |
| 35 to 50 years | 0 (0.0%) | 0 (0.0%) |
| Total | 0 (0.0%) | 0 (0.0%) |
Fertility by Education in Oceanside
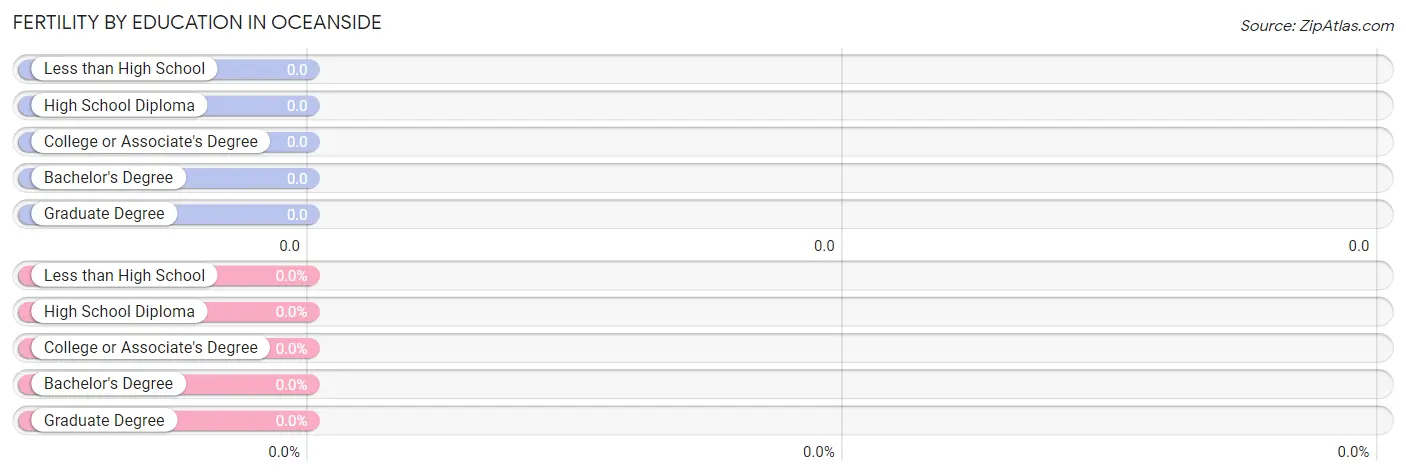
| Educational Attainment | Women with Births | Births / 1,000 Women |
| Less than High School | 0 (0.0%) | 0.0 |
| High School Diploma | 0 (0.0%) | 0.0 |
| College or Associate's Degree | 0 (0.0%) | 0.0 |
| Bachelor's Degree | 0 (0.0%) | 0.0 |
| Graduate Degree | 0 (0.0%) | 0.0 |
| Total | 0 (0.0%) | 0.0 |
Fertility by Education by Marriage Status in Oceanside
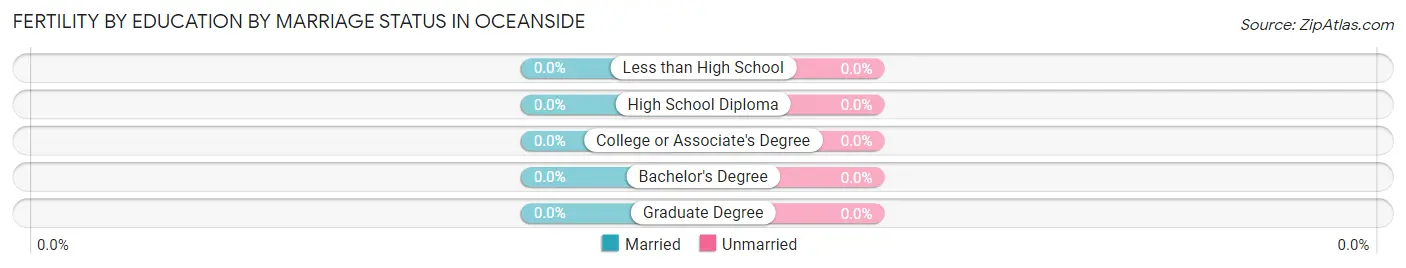
| Educational Attainment | Married | Unmarried |
| Less than High School | 0 (0.0%) | 0 (0.0%) |
| High School Diploma | 0 (0.0%) | 0 (0.0%) |
| College or Associate's Degree | 0 (0.0%) | 0 (0.0%) |
| Bachelor's Degree | 0 (0.0%) | 0 (0.0%) |
| Graduate Degree | 0 (0.0%) | 0 (0.0%) |
| Total | 0 (0.0%) | 0 (0.0%) |
Income in Oceanside
Income Overview in Oceanside
Per Capita Income in Oceanside is $55,149, while median incomes of families and households are $77,379 and $76,532 respectively.
| Characteristic | Number | Measure |
| Per Capita Income | 472 | $55,149 |
| Median Family Income | 117 | $77,379 |
| Mean Family Income | 117 | $104,898 |
| Median Household Income | 246 | $76,532 |
| Mean Household Income | 246 | $99,169 |
| Income Deficit | 117 | $0 |
| Wage / Income Gap (%) | 472 | 0.00% |
| Wage / Income Gap ($) | 472 | 100.00¢ per $1 |
| Gini / Inequality Index | 472 | 0.36 |
Earnings by Sex in Oceanside
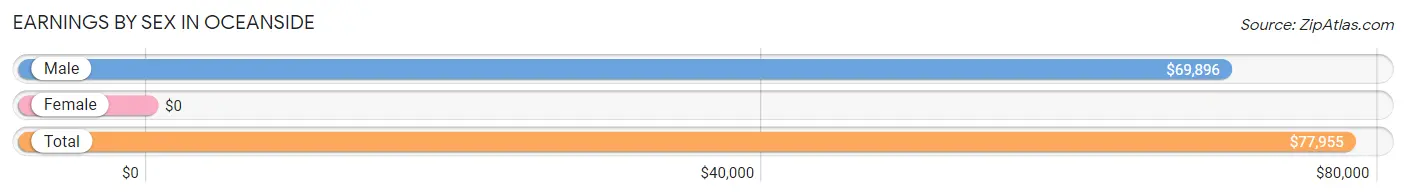
| Sex | Number | Average Earnings |
| Male | 71 (44.9%) | $69,896 |
| Female | 87 (55.1%) | $0 |
| Total | 158 (100.0%) | $77,955 |
Earnings by Sex by Income Bracket in Oceanside
The most common earnings brackets in Oceanside are $75,000 to $99,999 for men (22 | 31.0%) and $100,000+ for women (33 | 37.9%).
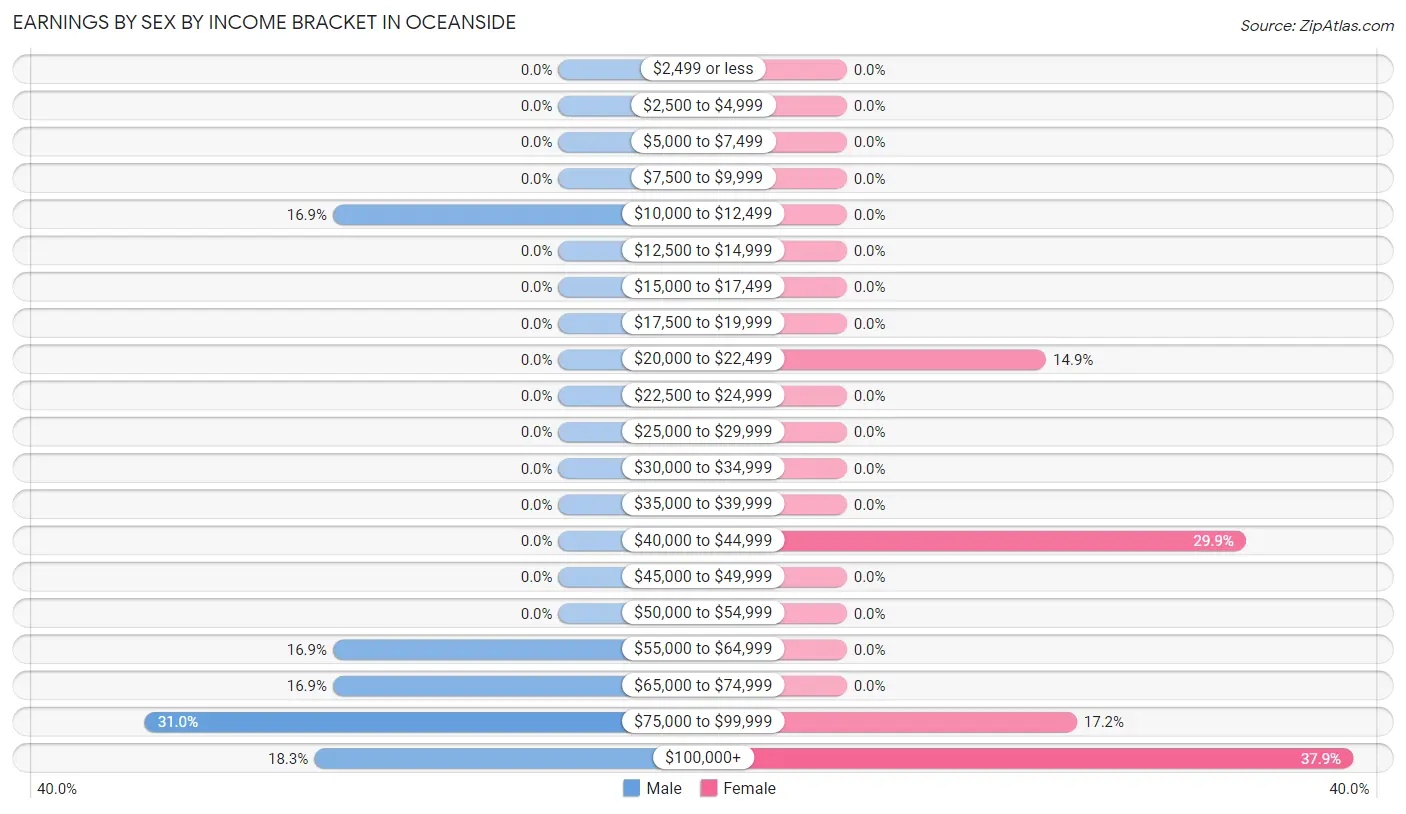
| Income | Male | Female |
| $2,499 or less | 0 (0.0%) | 0 (0.0%) |
| $2,500 to $4,999 | 0 (0.0%) | 0 (0.0%) |
| $5,000 to $7,499 | 0 (0.0%) | 0 (0.0%) |
| $7,500 to $9,999 | 0 (0.0%) | 0 (0.0%) |
| $10,000 to $12,499 | 12 (16.9%) | 0 (0.0%) |
| $12,500 to $14,999 | 0 (0.0%) | 0 (0.0%) |
| $15,000 to $17,499 | 0 (0.0%) | 0 (0.0%) |
| $17,500 to $19,999 | 0 (0.0%) | 0 (0.0%) |
| $20,000 to $22,499 | 0 (0.0%) | 13 (14.9%) |
| $22,500 to $24,999 | 0 (0.0%) | 0 (0.0%) |
| $25,000 to $29,999 | 0 (0.0%) | 0 (0.0%) |
| $30,000 to $34,999 | 0 (0.0%) | 0 (0.0%) |
| $35,000 to $39,999 | 0 (0.0%) | 0 (0.0%) |
| $40,000 to $44,999 | 0 (0.0%) | 26 (29.9%) |
| $45,000 to $49,999 | 0 (0.0%) | 0 (0.0%) |
| $50,000 to $54,999 | 0 (0.0%) | 0 (0.0%) |
| $55,000 to $64,999 | 12 (16.9%) | 0 (0.0%) |
| $65,000 to $74,999 | 12 (16.9%) | 0 (0.0%) |
| $75,000 to $99,999 | 22 (31.0%) | 15 (17.2%) |
| $100,000+ | 13 (18.3%) | 33 (37.9%) |
| Total | 71 (100.0%) | 87 (100.0%) |
Earnings by Sex by Educational Attainment in Oceanside
| Educational Attainment | Male Income | Female Income |
| Less than High School | - | - |
| High School Diploma | - | - |
| College or Associate's Degree | - | - |
| Bachelor's Degree | - | - |
| Graduate Degree | - | - |
| Total | $78,125 | $0 |
Family Income in Oceanside
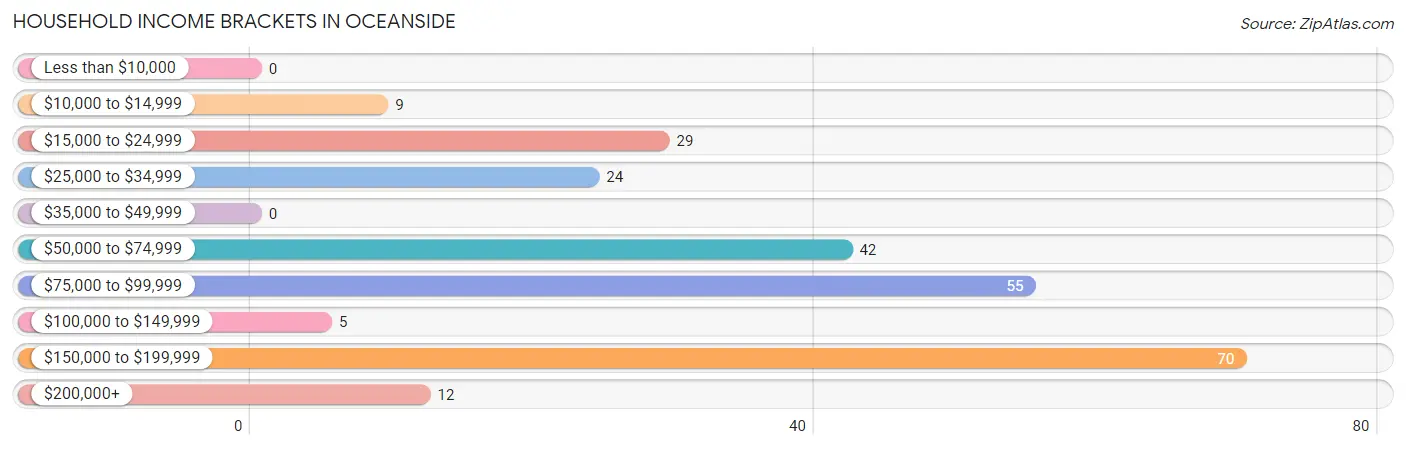
Family Income Brackets in Oceanside
According to the Oceanside family income data, there are 55 families falling into the $75,000 to $99,999 income range, which is the most common income bracket and makes up 47.0% of all families.
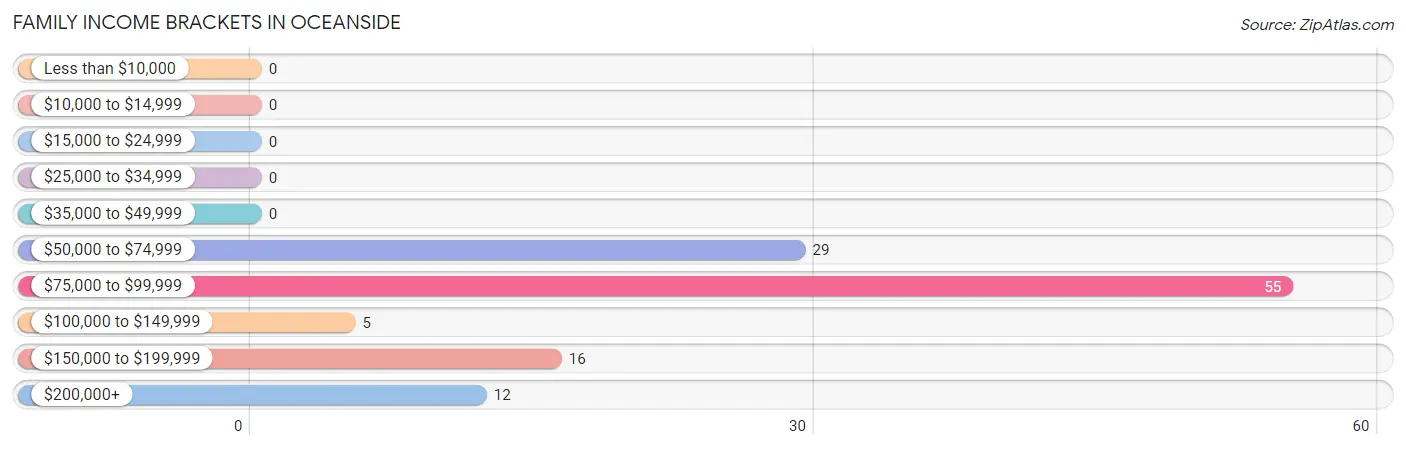
| Income Bracket | # Families | % Families |
| Less than $10,000 | 0 | 0.0% |
| $10,000 to $14,999 | 0 | 0.0% |
| $15,000 to $24,999 | 0 | 0.0% |
| $25,000 to $34,999 | 0 | 0.0% |
| $35,000 to $49,999 | 0 | 0.0% |
| $50,000 to $74,999 | 29 | 24.8% |
| $75,000 to $99,999 | 55 | 47.0% |
| $100,000 to $149,999 | 5 | 4.3% |
| $150,000 to $199,999 | 16 | 13.7% |
| $200,000+ | 12 | 10.3% |
Family Income by Famaliy Size in Oceanside
2-person families (105 | 89.7%) account for the highest median family income in Oceanside with $76,895 per family, while 2-person families (105 | 89.7%) have the highest median income of $38,448 per family member.
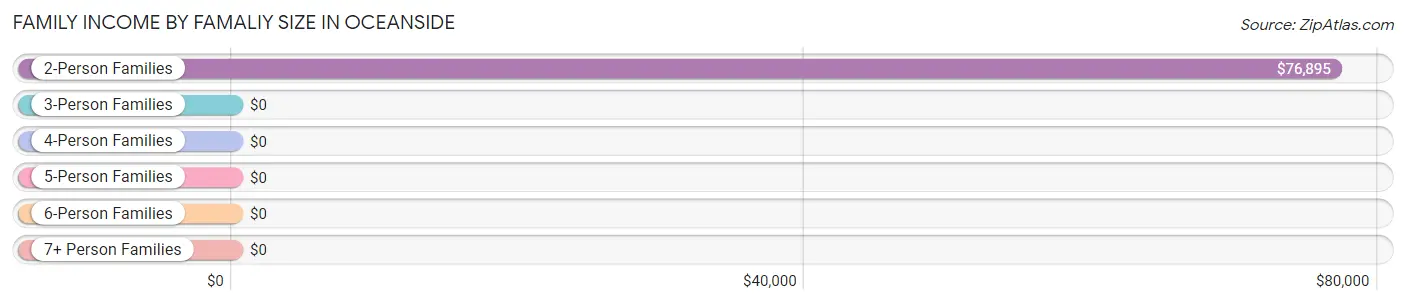
| Income Bracket | # Families | Median Income |
| 2-Person Families | 105 (89.7%) | $76,895 |
| 3-Person Families | 0 (0.0%) | $0 |
| 4-Person Families | 12 (10.3%) | $0 |
| 5-Person Families | 0 (0.0%) | $0 |
| 6-Person Families | 0 (0.0%) | $0 |
| 7+ Person Families | 0 (0.0%) | $0 |
| Total | 117 (100.0%) | $77,379 |
Family Income by Number of Earners in Oceanside
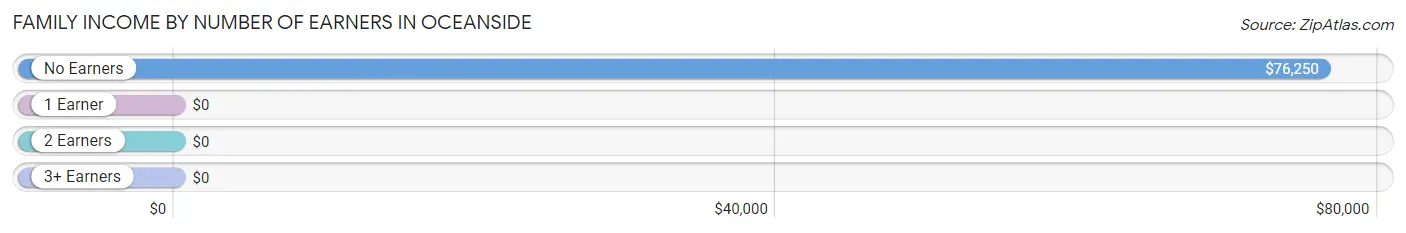
| Number of Earners | # Families | Median Income |
| No Earners | 89 (76.1%) | $76,250 |
| 1 Earner | 16 (13.7%) | $0 |
| 2 Earners | 0 (0.0%) | $0 |
| 3+ Earners | 12 (10.3%) | $0 |
| Total | 117 (100.0%) | $77,379 |
Household Income in Oceanside
Household Income Brackets in Oceanside
With 70 households falling in the category, the $150,000 to $199,999 income range is the most frequent in Oceanside, accounting for 28.5% of all households.
| Income Bracket | # Households | % Households |
| Less than $10,000 | 0 | 0.0% |
| $10,000 to $14,999 | 9 | 3.7% |
| $15,000 to $24,999 | 29 | 11.8% |
| $25,000 to $34,999 | 24 | 9.8% |
| $35,000 to $49,999 | 0 | 0.0% |
| $50,000 to $74,999 | 42 | 17.1% |
| $75,000 to $99,999 | 55 | 22.4% |
| $100,000 to $149,999 | 5 | 2.0% |
| $150,000 to $199,999 | 70 | 28.5% |
| $200,000+ | 12 | 4.9% |
Household Income by Householder Age in Oceanside
| Income Bracket | # Households | Median Income |
| 15 to 24 Years | 0 (0.0%) | $0 |
| 25 to 44 Years | 16 (6.5%) | $0 |
| 45 to 64 Years | 102 (41.5%) | $0 |
| 65+ Years | 128 (52.0%) | $0 |
| Total | 246 (100.0%) | $76,532 |
Poverty in Oceanside
Income Below Poverty by Sex and Age in Oceanside
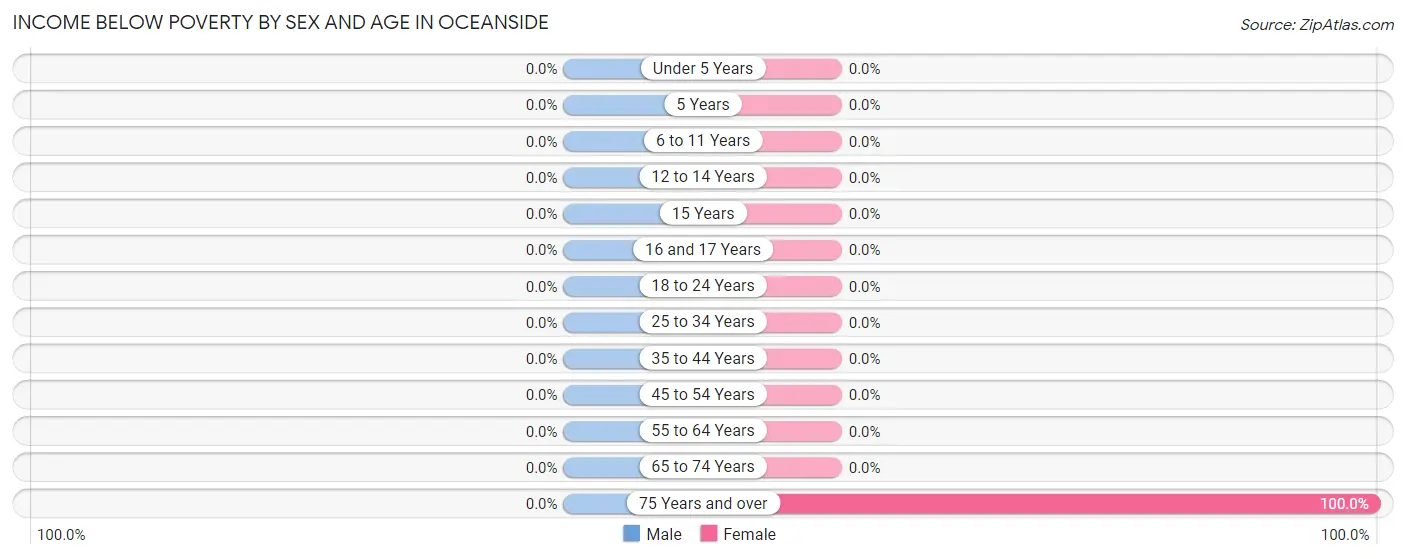
| Age Bracket | Male | Female |
| Under 5 Years | 0 (0.0%) | 0 (0.0%) |
| 5 Years | 0 (0.0%) | 0 (0.0%) |
| 6 to 11 Years | 0 (0.0%) | 0 (0.0%) |
| 12 to 14 Years | 0 (0.0%) | 0 (0.0%) |
| 15 Years | 0 (0.0%) | 0 (0.0%) |
| 16 and 17 Years | 0 (0.0%) | 0 (0.0%) |
| 18 to 24 Years | 0 (0.0%) | 0 (0.0%) |
| 25 to 34 Years | 0 (0.0%) | 0 (0.0%) |
| 35 to 44 Years | 0 (0.0%) | 0 (0.0%) |
| 45 to 54 Years | 0 (0.0%) | 0 (0.0%) |
| 55 to 64 Years | 0 (0.0%) | 0 (0.0%) |
| 65 to 74 Years | 0 (0.0%) | 0 (0.0%) |
| 75 Years and over | 0 (0.0%) | 9 (100.0%) |
| Total | 0 (0.0%) | 9 (4.4%) |
Income Above Poverty by Sex and Age in Oceanside
According to the poverty statistics in Oceanside, males aged 15 years and females aged 12 to 14 years are the age groups that are most secure financially, with 100.0% of males and 100.0% of females in these age groups living above the poverty line.
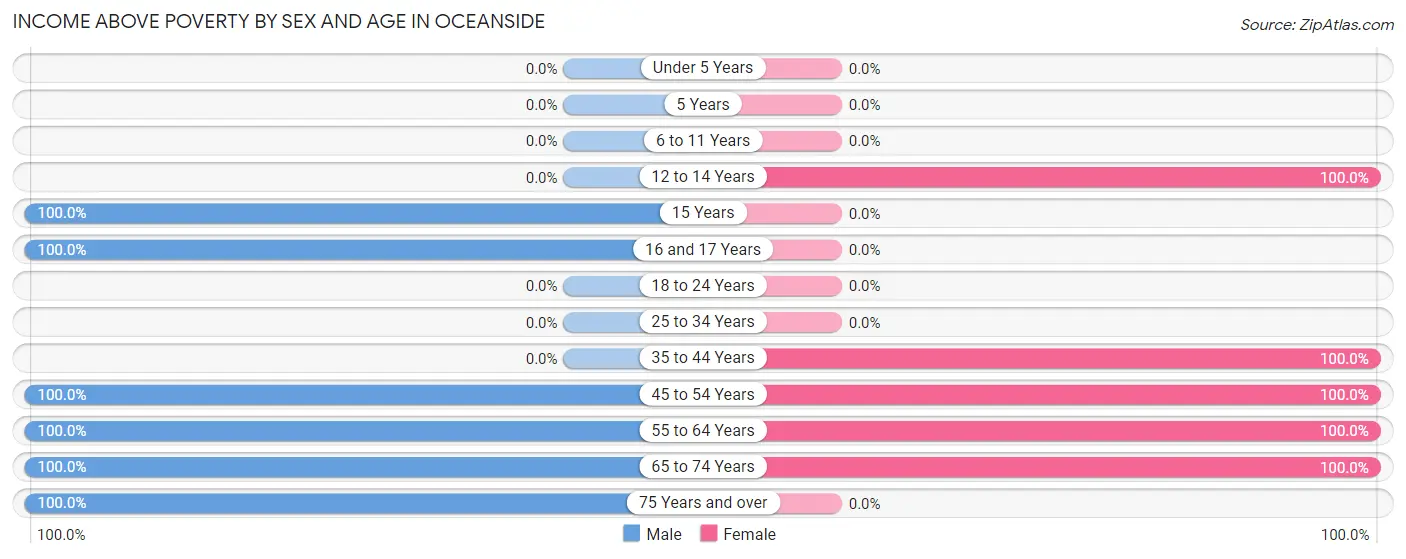
| Age Bracket | Male | Female |
| Under 5 Years | 0 (0.0%) | 0 (0.0%) |
| 5 Years | 0 (0.0%) | 0 (0.0%) |
| 6 to 11 Years | 0 (0.0%) | 0 (0.0%) |
| 12 to 14 Years | 0 (0.0%) | 14 (100.0%) |
| 15 Years | 13 (100.0%) | 0 (0.0%) |
| 16 and 17 Years | 12 (100.0%) | 0 (0.0%) |
| 18 to 24 Years | 0 (0.0%) | 0 (0.0%) |
| 25 to 34 Years | 0 (0.0%) | 0 (0.0%) |
| 35 to 44 Years | 0 (0.0%) | 16 (100.0%) |
| 45 to 54 Years | 43 (100.0%) | 17 (100.0%) |
| 55 to 64 Years | 96 (100.0%) | 72 (100.0%) |
| 65 to 74 Years | 75 (100.0%) | 78 (100.0%) |
| 75 Years and over | 27 (100.0%) | 0 (0.0%) |
| Total | 266 (100.0%) | 197 (95.6%) |
Income Below Poverty Among Married-Couple Families in Oceanside
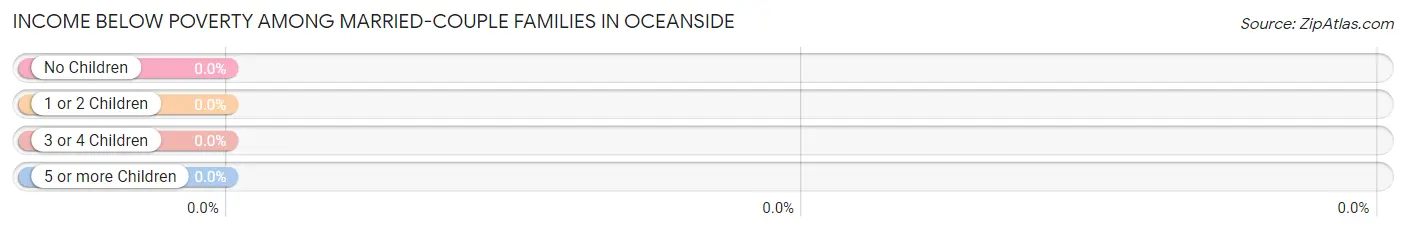
| Children | Above Poverty | Below Poverty |
| No Children | 89 (100.0%) | 0 (0.0%) |
| 1 or 2 Children | 12 (100.0%) | 0 (0.0%) |
| 3 or 4 Children | 0 (0.0%) | 0 (0.0%) |
| 5 or more Children | 0 (0.0%) | 0 (0.0%) |
| Total | 101 (100.0%) | 0 (0.0%) |
Income Below Poverty Among Single-Parent Households in Oceanside
| Children | Single Father | Single Mother |
| No Children | 0 (0.0%) | 0 (0.0%) |
| 1 or 2 Children | 0 (0.0%) | 0 (0.0%) |
| 3 or 4 Children | 0 (0.0%) | 0 (0.0%) |
| 5 or more Children | 0 (0.0%) | 0 (0.0%) |
| Total | 0 (0.0%) | 0 (0.0%) |
Income Below Poverty Among Married-Couple vs Single-Parent Households in Oceanside
| Children | Married-Couple Families | Single-Parent Households |
| No Children | 0 (0.0%) | 0 (0.0%) |
| 1 or 2 Children | 0 (0.0%) | 0 (0.0%) |
| 3 or 4 Children | 0 (0.0%) | 0 (0.0%) |
| 5 or more Children | 0 (0.0%) | 0 (0.0%) |
| Total | 0 (0.0%) | 0 (0.0%) |
Employment Characteristics in Oceanside
Employment by Class of Employer in Oceanside
Among the 145 employed individuals in Oceanside, private company employees (90 | 62.1%), state government employees (29 | 20.0%), and local government employees (26 | 17.9%) make up the most common classes of employment.
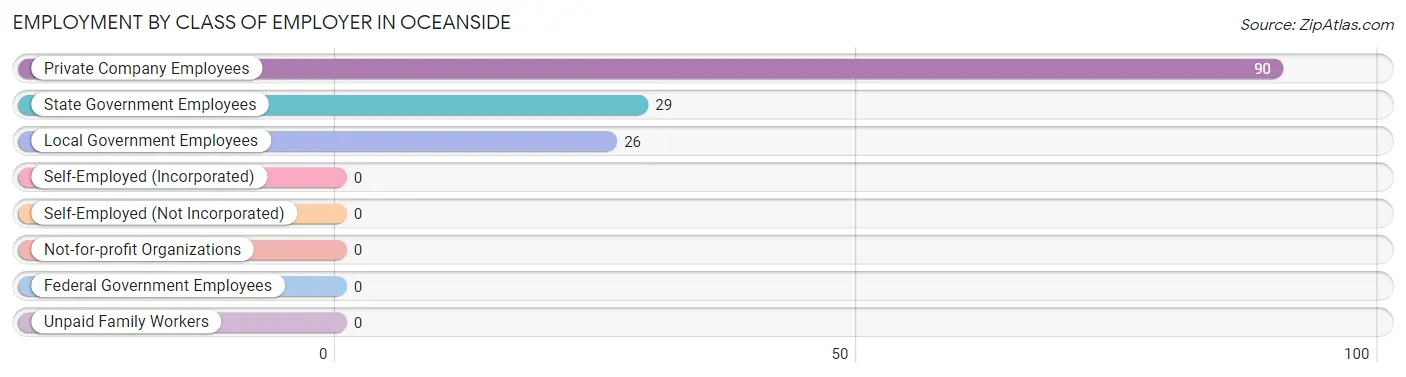
| Employer Class | # Employees | % Employees |
| Private Company Employees | 90 | 62.1% |
| Self-Employed (Incorporated) | 0 | 0.0% |
| Self-Employed (Not Incorporated) | 0 | 0.0% |
| Not-for-profit Organizations | 0 | 0.0% |
| Local Government Employees | 26 | 17.9% |
| State Government Employees | 29 | 20.0% |
| Federal Government Employees | 0 | 0.0% |
| Unpaid Family Workers | 0 | 0.0% |
| Total | 145 | 100.0% |
Employment Status by Age in Oceanside
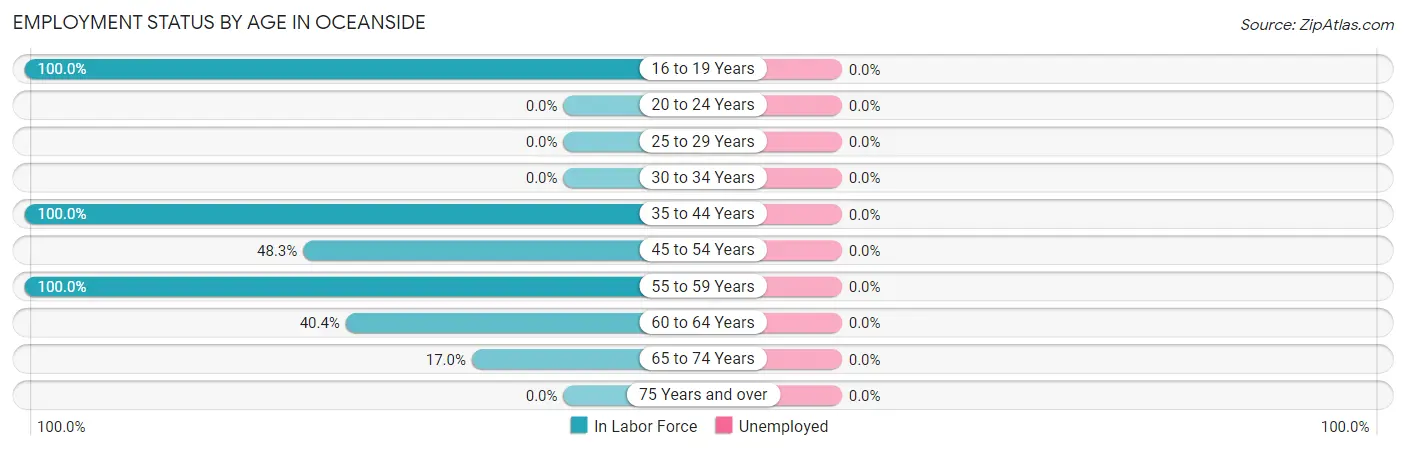
| Age Bracket | In Labor Force | Unemployed |
| 16 to 19 Years | 12 (100.0%) | 0 (0.0%) |
| 20 to 24 Years | 0 (0.0%) | 0 (0.0%) |
| 25 to 29 Years | 0 (0.0%) | 0 (0.0%) |
| 30 to 34 Years | 0 (0.0%) | 0 (0.0%) |
| 35 to 44 Years | 16 (100.0%) | 0 (0.0%) |
| 45 to 54 Years | 29 (48.3%) | 0 (0.0%) |
| 55 to 59 Years | 12 (100.0%) | 0 (0.0%) |
| 60 to 64 Years | 63 (40.4%) | 0 (0.0%) |
| 65 to 74 Years | 26 (17.0%) | 0 (0.0%) |
| 75 Years and over | 0 (0.0%) | 0 (0.0%) |
| Total | 158 (35.5%) | 0 (0.0%) |
Employment Status by Educational Attainment in Oceanside
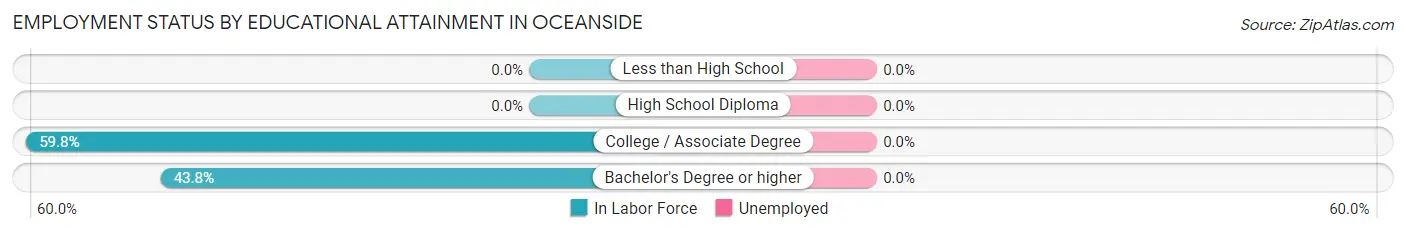
| Educational Attainment | In Labor Force | Unemployed |
| Less than High School | 0 (0.0%) | 0 (0.0%) |
| High School Diploma | 0 (0.0%) | 0 (0.0%) |
| College / Associate Degree | 49 (59.8%) | 0 (0.0%) |
| Bachelor's Degree or higher | 71 (43.8%) | 0 (0.0%) |
| Total | 120 (49.2%) | 0 (0.0%) |
Employment Occupations by Sex in Oceanside
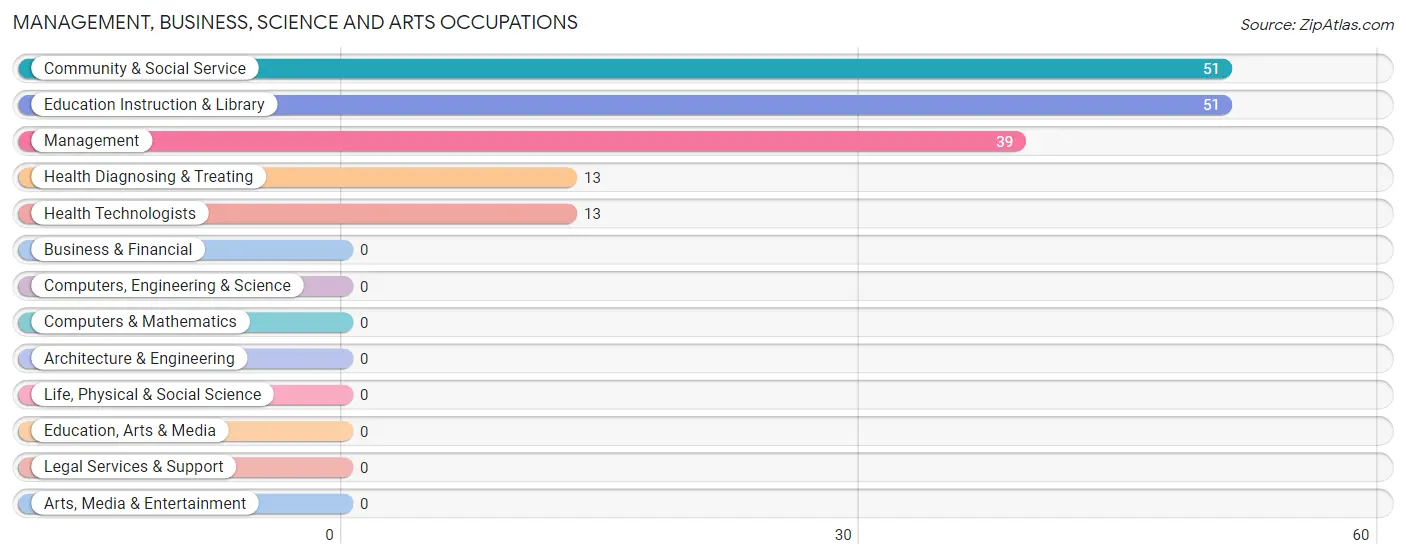
Management, Business, Science and Arts Occupations
The most common Management, Business, Science and Arts occupations in Oceanside are Community & Social Service (51 | 32.3%), Education Instruction & Library (51 | 32.3%), Management (39 | 24.7%), Health Diagnosing & Treating (13 | 8.2%), and Health Technologists (13 | 8.2%).
Management, Business, Science and Arts Occupations by Sex
Within the Management, Business, Science and Arts occupations in Oceanside, the most male-oriented occupations are Management (56.4%), Community & Social Service (49.0%), and Education Instruction & Library (49.0%), while the most female-oriented occupations are Health Diagnosing & Treating (100.0%), Health Technologists (100.0%), and Community & Social Service (51.0%).
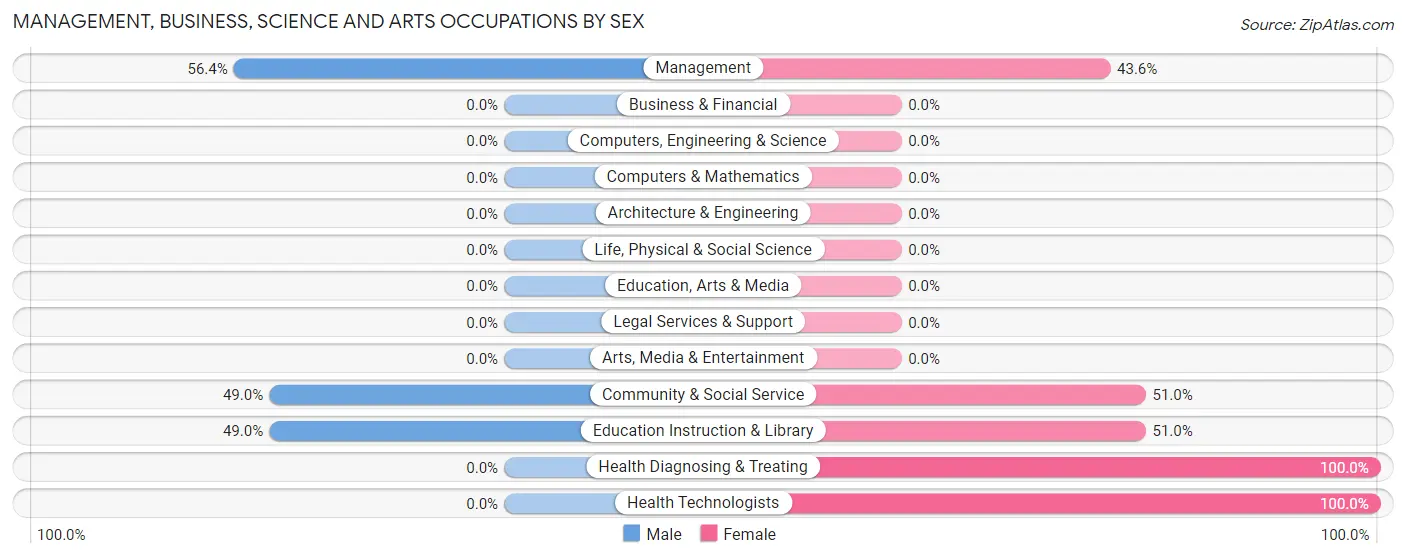
| Occupation | Male | Female |
| Management | 22 (56.4%) | 17 (43.6%) |
| Business & Financial | 0 (0.0%) | 0 (0.0%) |
| Computers, Engineering & Science | 0 (0.0%) | 0 (0.0%) |
| Computers & Mathematics | 0 (0.0%) | 0 (0.0%) |
| Architecture & Engineering | 0 (0.0%) | 0 (0.0%) |
| Life, Physical & Social Science | 0 (0.0%) | 0 (0.0%) |
| Community & Social Service | 25 (49.0%) | 26 (51.0%) |
| Education, Arts & Media | 0 (0.0%) | 0 (0.0%) |
| Legal Services & Support | 0 (0.0%) | 0 (0.0%) |
| Education Instruction & Library | 25 (49.0%) | 26 (51.0%) |
| Arts, Media & Entertainment | 0 (0.0%) | 0 (0.0%) |
| Health Diagnosing & Treating | 0 (0.0%) | 13 (100.0%) |
| Health Technologists | 0 (0.0%) | 13 (100.0%) |
| Total (Category) | 47 (45.6%) | 56 (54.4%) |
| Total (Overall) | 71 (44.9%) | 87 (55.1%) |
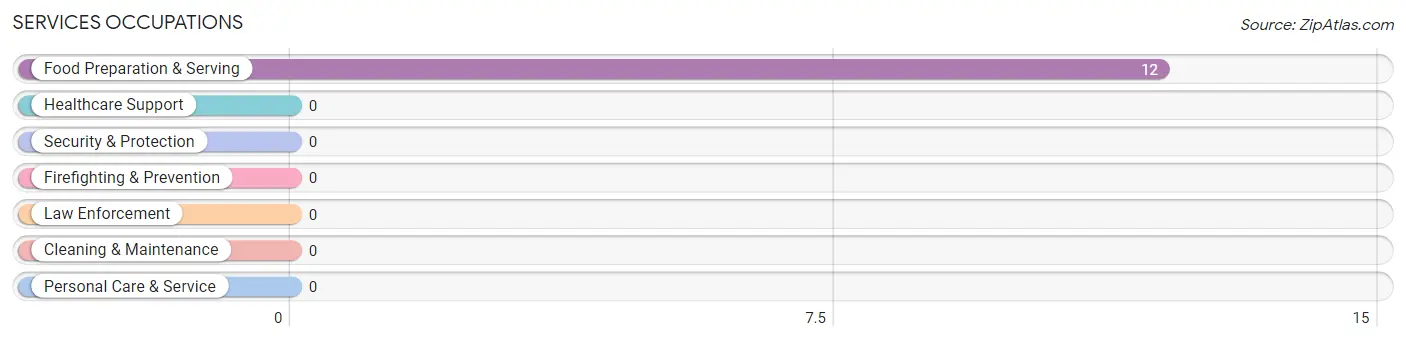
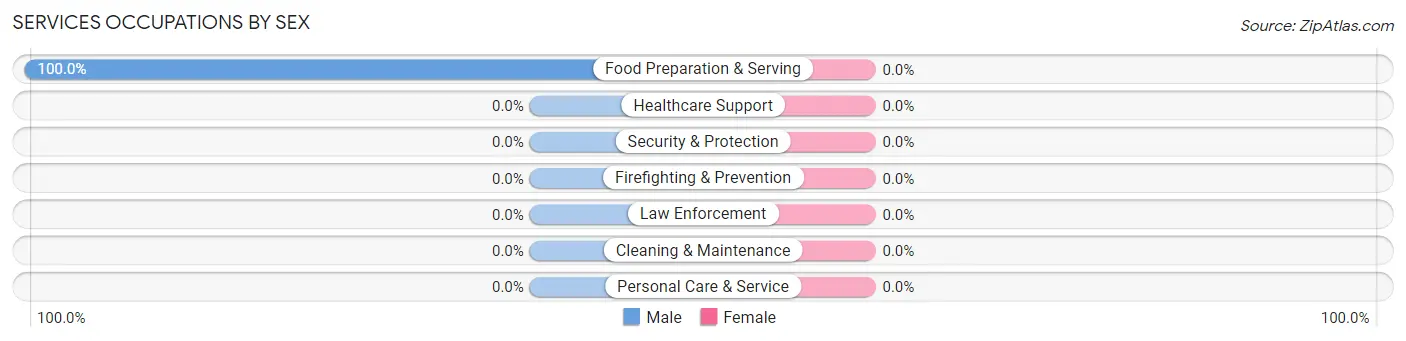
Services Occupations
The most common Services occupations in Oceanside are , and Food Preparation & Serving (12 | 7.6%).
Services Occupations by Sex
| Occupation | Male | Female |
| Healthcare Support | 0 (0.0%) | 0 (0.0%) |
| Security & Protection | 0 (0.0%) | 0 (0.0%) |
| Firefighting & Prevention | 0 (0.0%) | 0 (0.0%) |
| Law Enforcement | 0 (0.0%) | 0 (0.0%) |
| Food Preparation & Serving | 12 (100.0%) | 0 (0.0%) |
| Cleaning & Maintenance | 0 (0.0%) | 0 (0.0%) |
| Personal Care & Service | 0 (0.0%) | 0 (0.0%) |
| Total (Category) | 12 (100.0%) | 0 (0.0%) |
| Total (Overall) | 71 (44.9%) | 87 (55.1%) |
Sales and Office Occupations
The most common Sales and Office occupations in Oceanside are , and Sales & Related (27 | 17.1%).
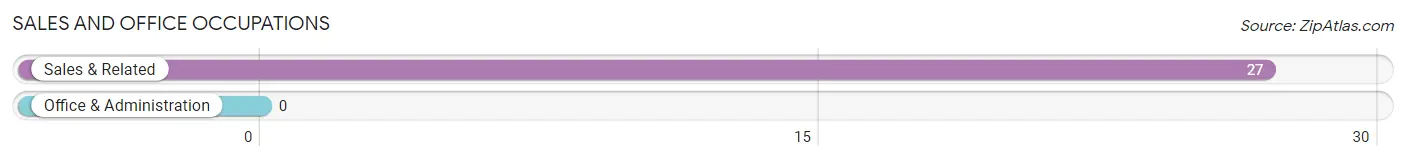
Sales and Office Occupations by Sex
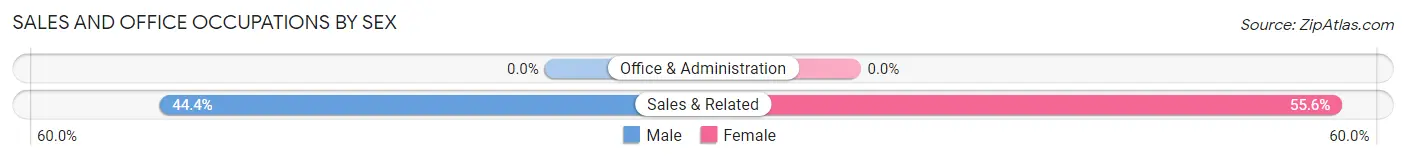
| Occupation | Male | Female |
| Sales & Related | 12 (44.4%) | 15 (55.6%) |
| Office & Administration | 0 (0.0%) | 0 (0.0%) |
| Total (Category) | 12 (44.4%) | 15 (55.6%) |
| Total (Overall) | 71 (44.9%) | 87 (55.1%) |
Natural Resources, Construction and Maintenance Occupations
Natural Resources, Construction and Maintenance Occupations by Sex
| Occupation | Male | Female |
| Farming, Fishing & Forestry | 0 (0.0%) | 0 (0.0%) |
| Construction & Extraction | 0 (0.0%) | 0 (0.0%) |
| Installation, Maintenance & Repair | 0 (0.0%) | 0 (0.0%) |
| Total (Category) | 0 (0.0%) | 0 (0.0%) |
| Total (Overall) | 71 (44.9%) | 87 (55.1%) |
Production, Transportation and Moving Occupations
The most common Production, Transportation and Moving occupations in Oceanside are , and Production (16 | 10.1%).
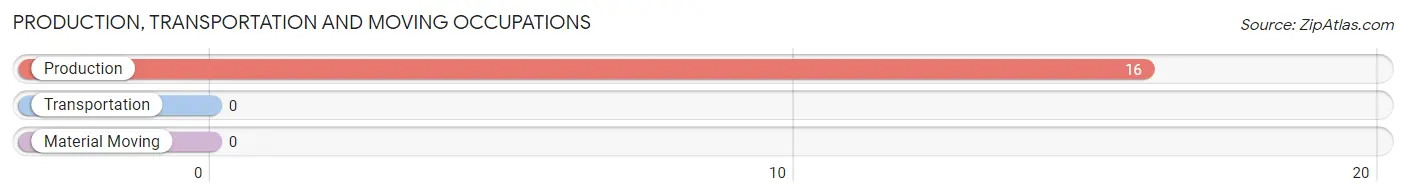
Production, Transportation and Moving Occupations by Sex
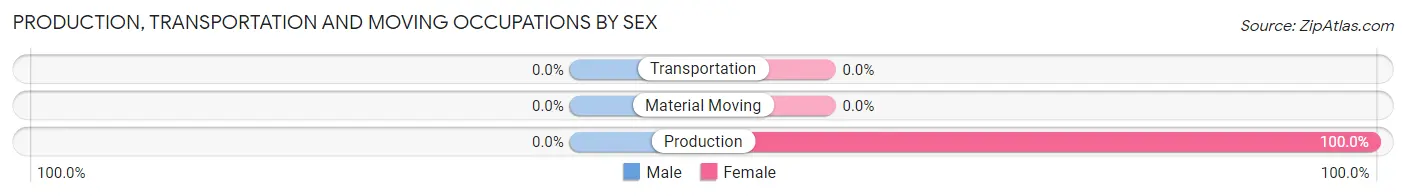
| Occupation | Male | Female |
| Production | 0 (0.0%) | 16 (100.0%) |
| Transportation | 0 (0.0%) | 0 (0.0%) |
| Material Moving | 0 (0.0%) | 0 (0.0%) |
| Total (Category) | 0 (0.0%) | 16 (100.0%) |
| Total (Overall) | 71 (44.9%) | 87 (55.1%) |
Employment Industries by Sex in Oceanside
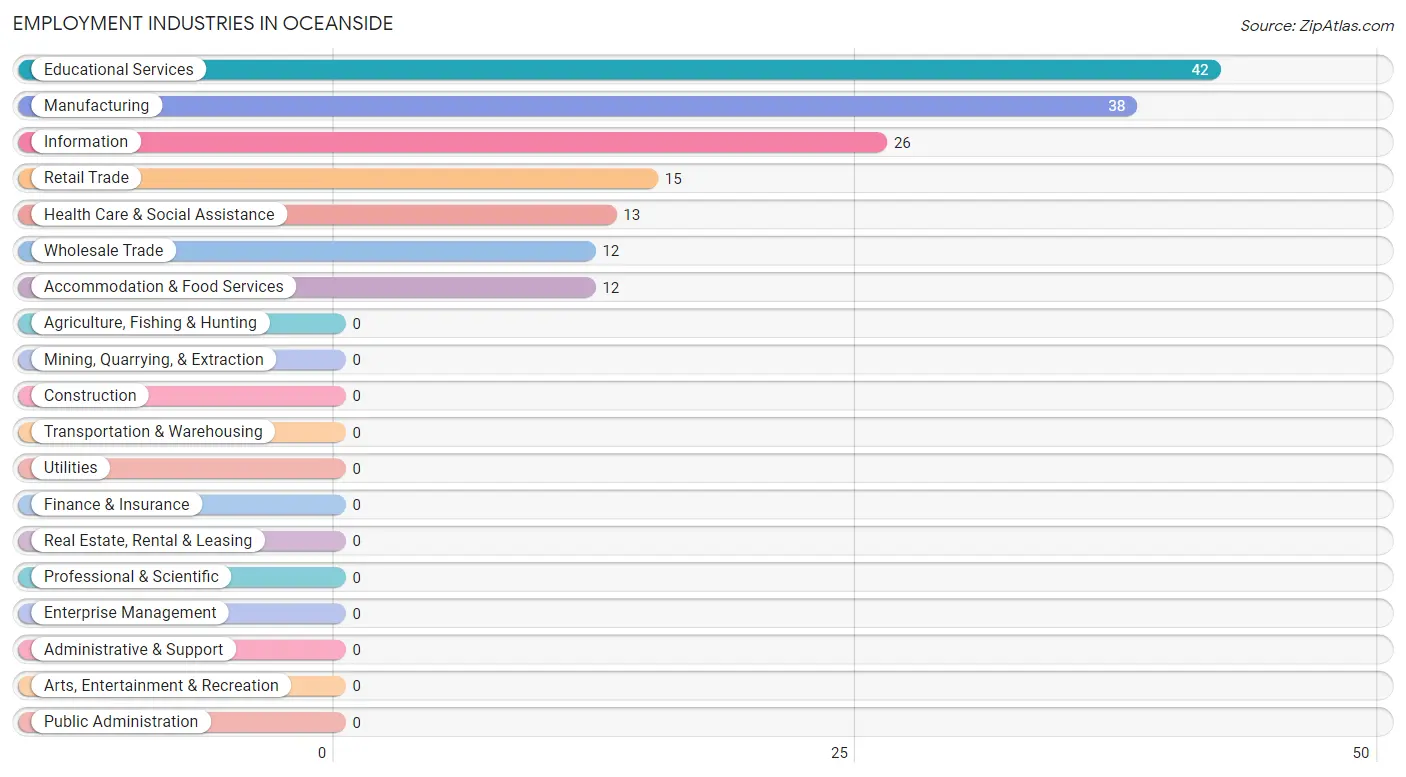
Employment Industries in Oceanside
The major employment industries in Oceanside include Educational Services (42 | 26.6%), Manufacturing (38 | 24.0%), Information (26 | 16.5%), Retail Trade (15 | 9.5%), and Health Care & Social Assistance (13 | 8.2%).
Employment Industries by Sex in Oceanside
The Oceanside industries that see more men than women are Wholesale Trade (100.0%), Accommodation & Food Services (100.0%), and Educational Services (59.5%), whereas the industries that tend to have a higher number of women are Retail Trade (100.0%), Information (100.0%), and Health Care & Social Assistance (100.0%).
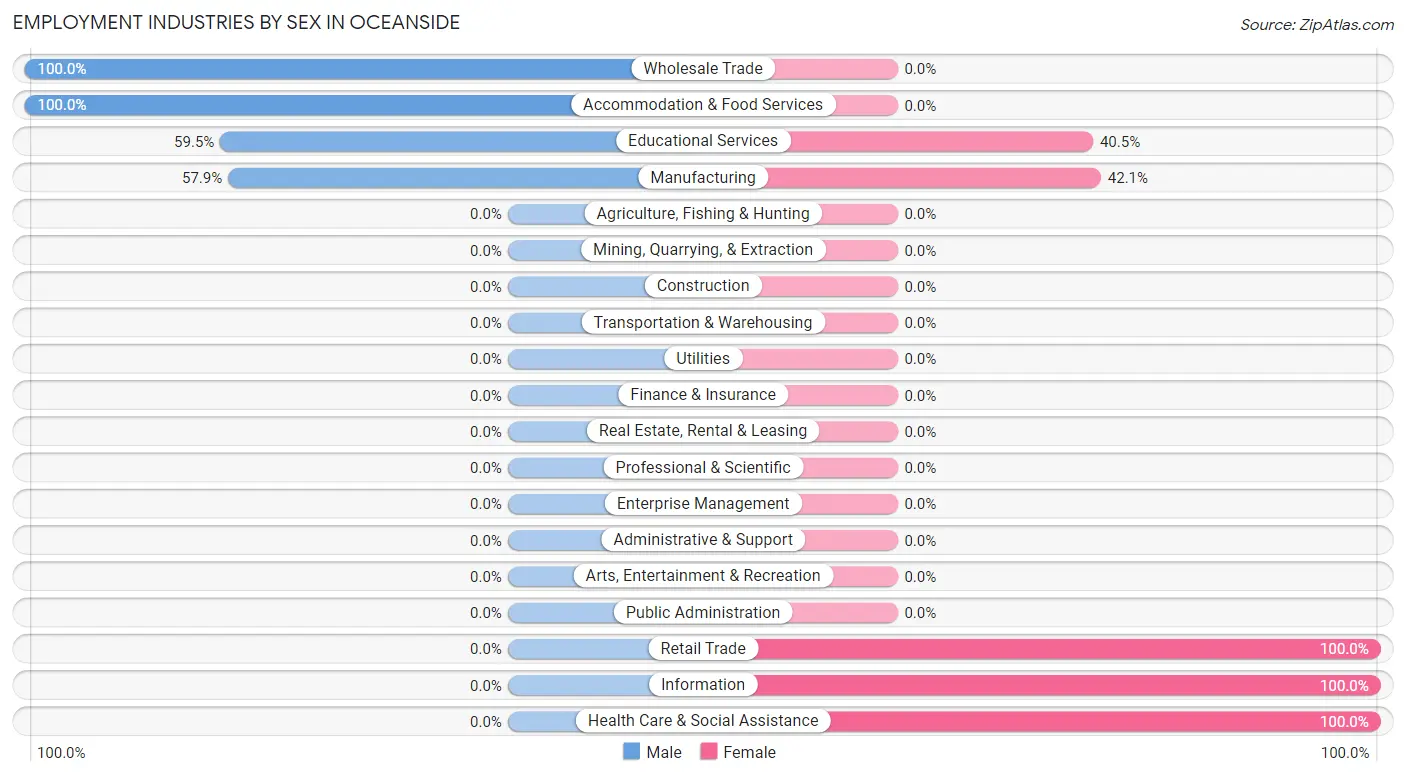
| Industry | Male | Female |
| Agriculture, Fishing & Hunting | 0 (0.0%) | 0 (0.0%) |
| Mining, Quarrying, & Extraction | 0 (0.0%) | 0 (0.0%) |
| Construction | 0 (0.0%) | 0 (0.0%) |
| Manufacturing | 22 (57.9%) | 16 (42.1%) |
| Wholesale Trade | 12 (100.0%) | 0 (0.0%) |
| Retail Trade | 0 (0.0%) | 15 (100.0%) |
| Transportation & Warehousing | 0 (0.0%) | 0 (0.0%) |
| Utilities | 0 (0.0%) | 0 (0.0%) |
| Information | 0 (0.0%) | 26 (100.0%) |
| Finance & Insurance | 0 (0.0%) | 0 (0.0%) |
| Real Estate, Rental & Leasing | 0 (0.0%) | 0 (0.0%) |
| Professional & Scientific | 0 (0.0%) | 0 (0.0%) |
| Enterprise Management | 0 (0.0%) | 0 (0.0%) |
| Administrative & Support | 0 (0.0%) | 0 (0.0%) |
| Educational Services | 25 (59.5%) | 17 (40.5%) |
| Health Care & Social Assistance | 0 (0.0%) | 13 (100.0%) |
| Arts, Entertainment & Recreation | 0 (0.0%) | 0 (0.0%) |
| Accommodation & Food Services | 12 (100.0%) | 0 (0.0%) |
| Public Administration | 0 (0.0%) | 0 (0.0%) |
| Total | 71 (44.9%) | 87 (55.1%) |
Education in Oceanside
School Enrollment in Oceanside
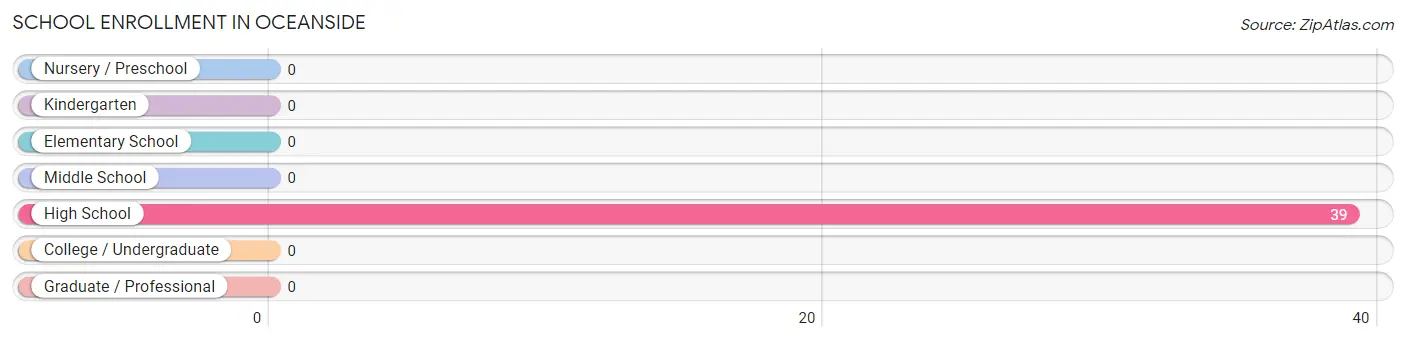
| School Level | # Students | % Students |
| Nursery / Preschool | 0 | 0.0% |
| Kindergarten | 0 | 0.0% |
| Elementary School | 0 | 0.0% |
| Middle School | 0 | 0.0% |
| High School | 39 | 100.0% |
| College / Undergraduate | 0 | 0.0% |
| Graduate / Professional | 0 | 0.0% |
| Total | 39 | 100.0% |
School Enrollment by Age by Funding Source in Oceanside
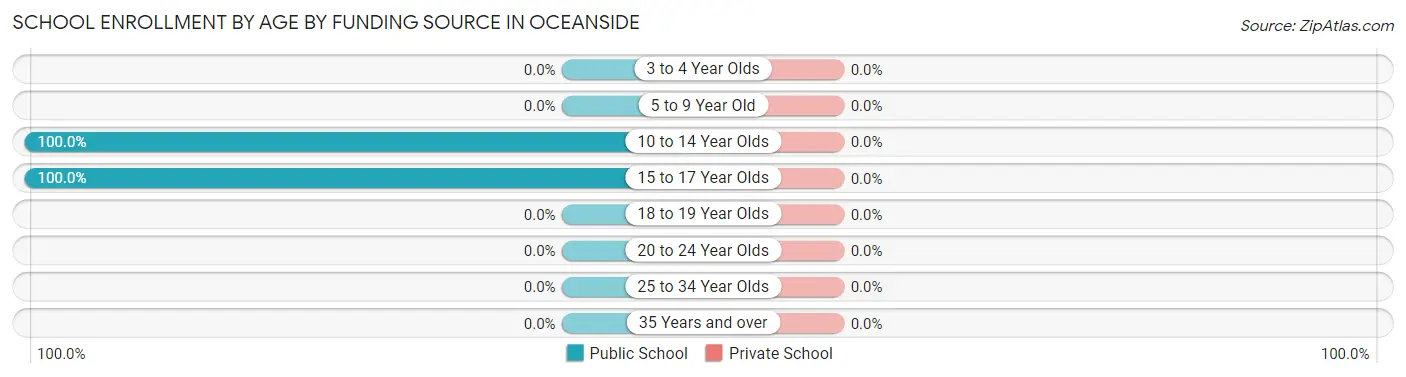
| Age Bracket | Public School | Private School |
| 3 to 4 Year Olds | 0 (0.0%) | 0 (0.0%) |
| 5 to 9 Year Old | 0 (0.0%) | 0 (0.0%) |
| 10 to 14 Year Olds | 14 (100.0%) | 0 (0.0%) |
| 15 to 17 Year Olds | 25 (100.0%) | 0 (0.0%) |
| 18 to 19 Year Olds | 0 (0.0%) | 0 (0.0%) |
| 20 to 24 Year Olds | 0 (0.0%) | 0 (0.0%) |
| 25 to 34 Year Olds | 0 (0.0%) | 0 (0.0%) |
| 35 Years and over | 0 (0.0%) | 0 (0.0%) |
| Total | 39 (100.0%) | 0 (0.0%) |
Educational Attainment by Field of Study in Oceanside
Liberal arts & history (66 | 23.2%), business (60 | 21.1%), communications (47 | 16.6%), literature & languages (31 | 10.9%), and science & technology (26 | 9.1%) are the most common fields of study among 284 individuals in Oceanside who have obtained a bachelor's degree or higher.
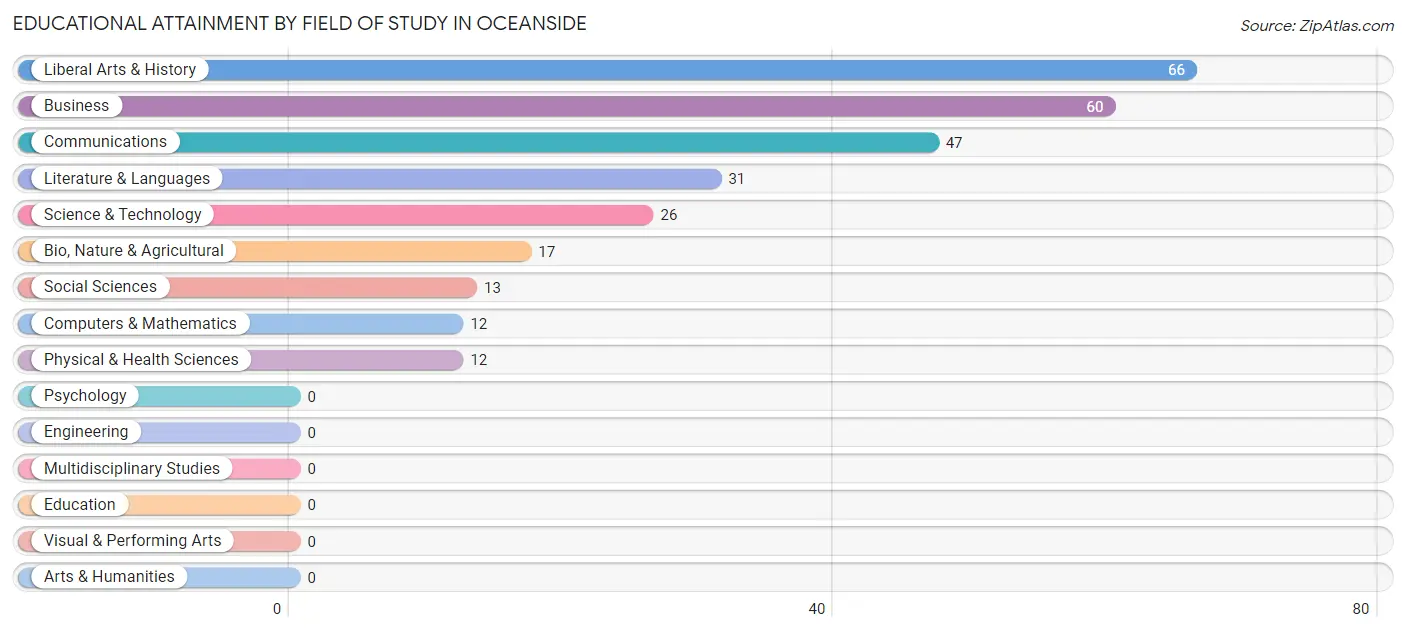
| Field of Study | # Graduates | % Graduates |
| Computers & Mathematics | 12 | 4.2% |
| Bio, Nature & Agricultural | 17 | 6.0% |
| Physical & Health Sciences | 12 | 4.2% |
| Psychology | 0 | 0.0% |
| Social Sciences | 13 | 4.6% |
| Engineering | 0 | 0.0% |
| Multidisciplinary Studies | 0 | 0.0% |
| Science & Technology | 26 | 9.1% |
| Business | 60 | 21.1% |
| Education | 0 | 0.0% |
| Literature & Languages | 31 | 10.9% |
| Liberal Arts & History | 66 | 23.2% |
| Visual & Performing Arts | 0 | 0.0% |
| Communications | 47 | 16.6% |
| Arts & Humanities | 0 | 0.0% |
| Total | 284 | 100.0% |
Transportation & Commute in Oceanside
Vehicle Availability by Sex in Oceanside
The most prevalent vehicle ownership categories in Oceanside are males with 3 vehicles (46, accounting for 79.3%) and females with 3 vehicles (56, making up 52.9%).
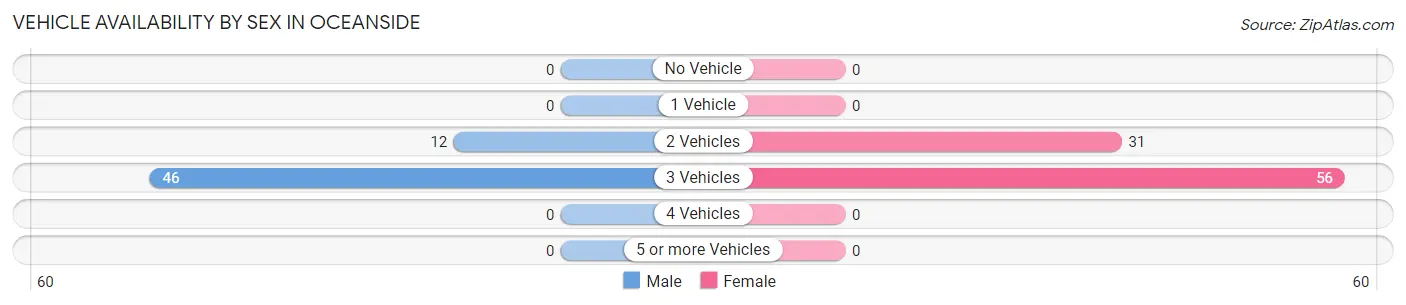
| Vehicles Available | Male | Female |
| No Vehicle | 0 (0.0%) | 0 (0.0%) |
| 1 Vehicle | 0 (0.0%) | 0 (0.0%) |
| 2 Vehicles | 12 (20.7%) | 31 (35.6%) |
| 3 Vehicles | 46 (79.3%) | 56 (64.4%) |
| 4 Vehicles | 0 (0.0%) | 0 (0.0%) |
| 5 or more Vehicles | 0 (0.0%) | 0 (0.0%) |
| Total | 58 (100.0%) | 87 (100.0%) |
Commute Time in Oceanside
The most frequently occuring commute durations in Oceanside are 15 to 19 minutes (89 commuters, 75.4%), 60 to 89 minutes (16 commuters, 13.6%), and 10 to 14 minutes (13 commuters, 11.0%).
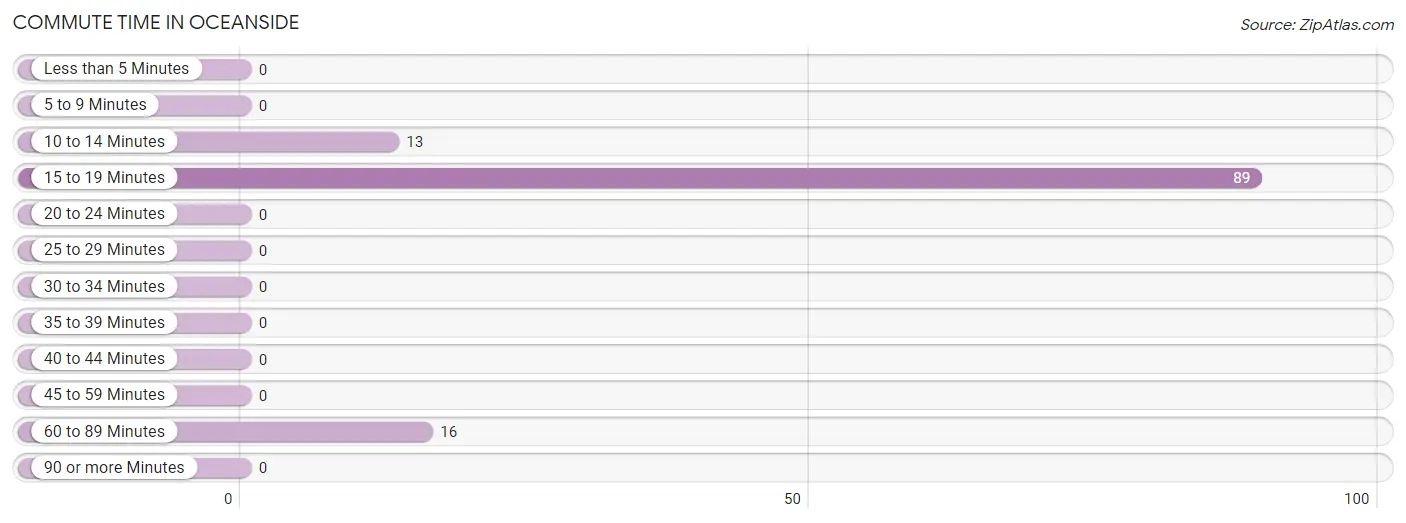
| Commute Time | # Commuters | % Commuters |
| Less than 5 Minutes | 0 | 0.0% |
| 5 to 9 Minutes | 0 | 0.0% |
| 10 to 14 Minutes | 13 | 11.0% |
| 15 to 19 Minutes | 89 | 75.4% |
| 20 to 24 Minutes | 0 | 0.0% |
| 25 to 29 Minutes | 0 | 0.0% |
| 30 to 34 Minutes | 0 | 0.0% |
| 35 to 39 Minutes | 0 | 0.0% |
| 40 to 44 Minutes | 0 | 0.0% |
| 45 to 59 Minutes | 0 | 0.0% |
| 60 to 89 Minutes | 16 | 13.6% |
| 90 or more Minutes | 0 | 0.0% |
Commute Time by Sex in Oceanside
The most common commute times in Oceanside are 15 to 19 minutes (46 commuters, 100.0%) for males and 15 to 19 minutes (43 commuters, 59.7%) for females.
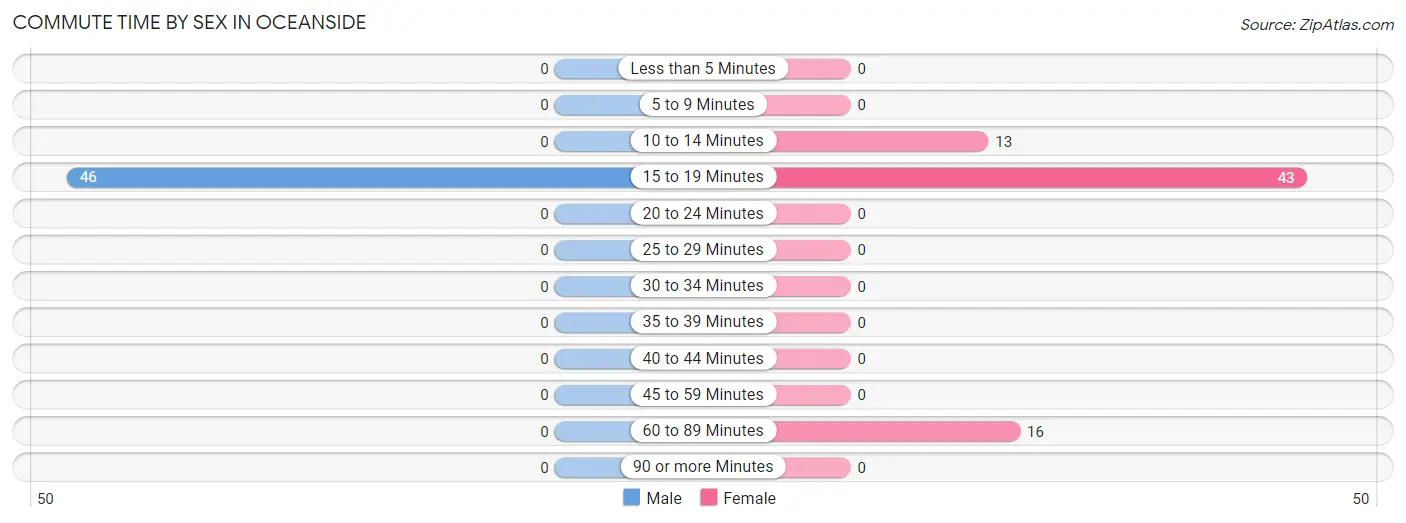
| Commute Time | Male | Female |
| Less than 5 Minutes | 0 (0.0%) | 0 (0.0%) |
| 5 to 9 Minutes | 0 (0.0%) | 0 (0.0%) |
| 10 to 14 Minutes | 0 (0.0%) | 13 (18.1%) |
| 15 to 19 Minutes | 46 (100.0%) | 43 (59.7%) |
| 20 to 24 Minutes | 0 (0.0%) | 0 (0.0%) |
| 25 to 29 Minutes | 0 (0.0%) | 0 (0.0%) |
| 30 to 34 Minutes | 0 (0.0%) | 0 (0.0%) |
| 35 to 39 Minutes | 0 (0.0%) | 0 (0.0%) |
| 40 to 44 Minutes | 0 (0.0%) | 0 (0.0%) |
| 45 to 59 Minutes | 0 (0.0%) | 0 (0.0%) |
| 60 to 89 Minutes | 0 (0.0%) | 16 (22.2%) |
| 90 or more Minutes | 0 (0.0%) | 0 (0.0%) |
Time of Departure to Work by Sex in Oceanside
The most frequent times of departure to work in Oceanside are 7:00 AM to 7:29 AM (22, 47.8%) for males and 8:00 AM to 8:29 AM (39, 54.2%) for females.
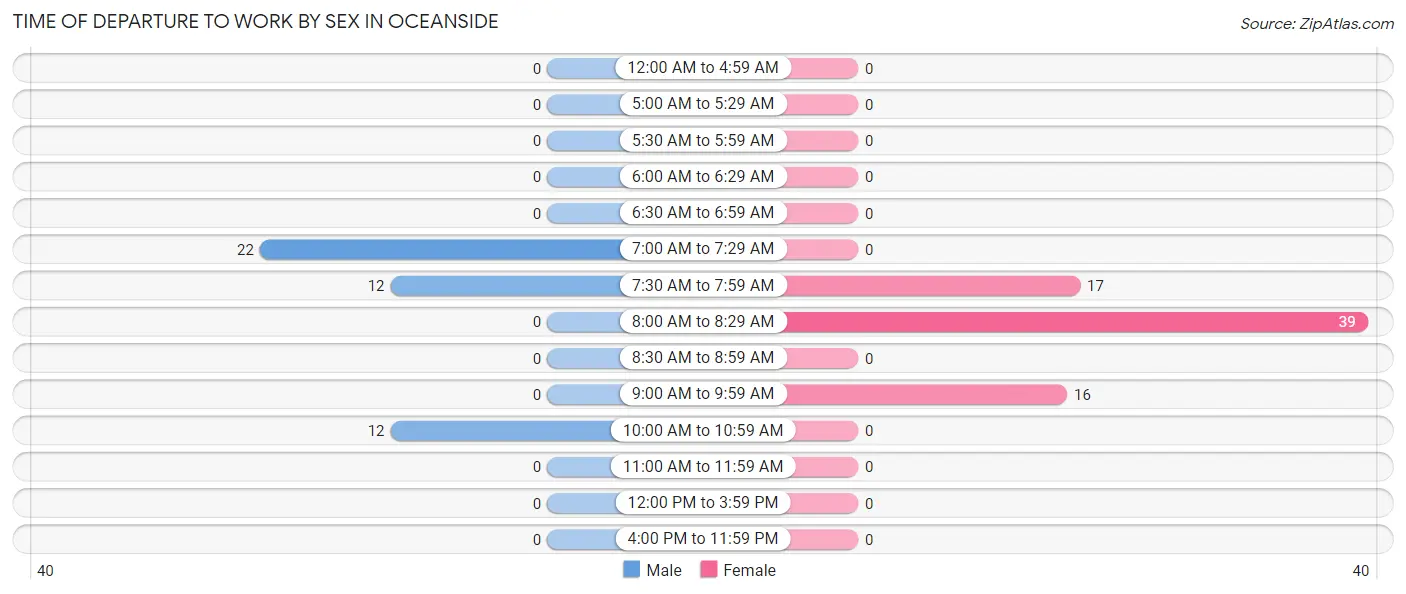
| Time of Departure | Male | Female |
| 12:00 AM to 4:59 AM | 0 (0.0%) | 0 (0.0%) |
| 5:00 AM to 5:29 AM | 0 (0.0%) | 0 (0.0%) |
| 5:30 AM to 5:59 AM | 0 (0.0%) | 0 (0.0%) |
| 6:00 AM to 6:29 AM | 0 (0.0%) | 0 (0.0%) |
| 6:30 AM to 6:59 AM | 0 (0.0%) | 0 (0.0%) |
| 7:00 AM to 7:29 AM | 22 (47.8%) | 0 (0.0%) |
| 7:30 AM to 7:59 AM | 12 (26.1%) | 17 (23.6%) |
| 8:00 AM to 8:29 AM | 0 (0.0%) | 39 (54.2%) |
| 8:30 AM to 8:59 AM | 0 (0.0%) | 0 (0.0%) |
| 9:00 AM to 9:59 AM | 0 (0.0%) | 16 (22.2%) |
| 10:00 AM to 10:59 AM | 12 (26.1%) | 0 (0.0%) |
| 11:00 AM to 11:59 AM | 0 (0.0%) | 0 (0.0%) |
| 12:00 PM to 3:59 PM | 0 (0.0%) | 0 (0.0%) |
| 4:00 PM to 11:59 PM | 0 (0.0%) | 0 (0.0%) |
| Total | 46 (100.0%) | 72 (100.0%) |
Housing Occupancy in Oceanside
Occupancy by Ownership in Oceanside
Of the total 246 dwellings in Oceanside, owner-occupied units account for 231 (93.9%), while renter-occupied units make up 15 (6.1%).
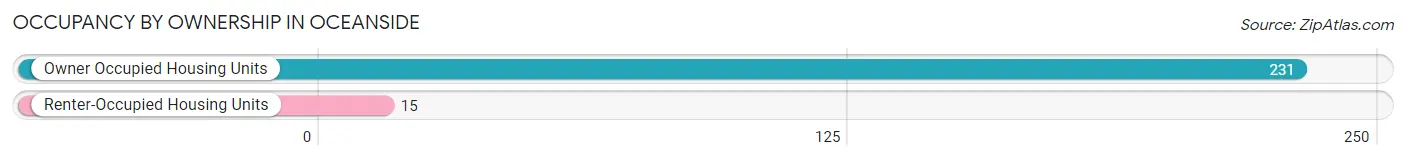
| Occupancy | # Housing Units | % Housing Units |
| Owner Occupied Housing Units | 231 | 93.9% |
| Renter-Occupied Housing Units | 15 | 6.1% |
| Total Occupied Housing Units | 246 | 100.0% |
Occupancy by Household Size in Oceanside
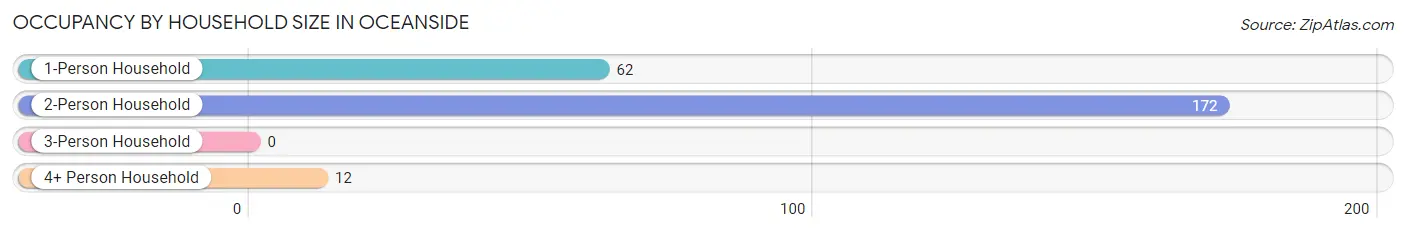
| Household Size | # Housing Units | % Housing Units |
| 1-Person Household | 62 | 25.2% |
| 2-Person Household | 172 | 69.9% |
| 3-Person Household | 0 | 0.0% |
| 4+ Person Household | 12 | 4.9% |
| Total Housing Units | 246 | 100.0% |
Occupancy by Ownership by Household Size in Oceanside
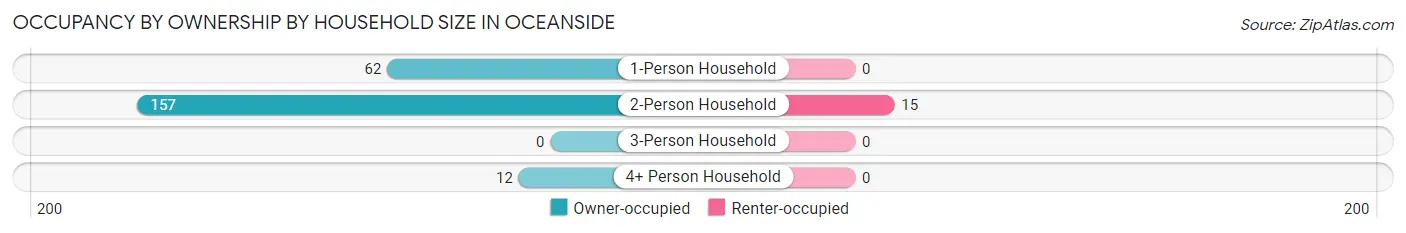
| Household Size | Owner-occupied | Renter-occupied |
| 1-Person Household | 62 (100.0%) | 0 (0.0%) |
| 2-Person Household | 157 (91.3%) | 15 (8.7%) |
| 3-Person Household | 0 (0.0%) | 0 (0.0%) |
| 4+ Person Household | 12 (100.0%) | 0 (0.0%) |
| Total Housing Units | 231 (93.9%) | 15 (6.1%) |
Occupancy by Educational Attainment in Oceanside
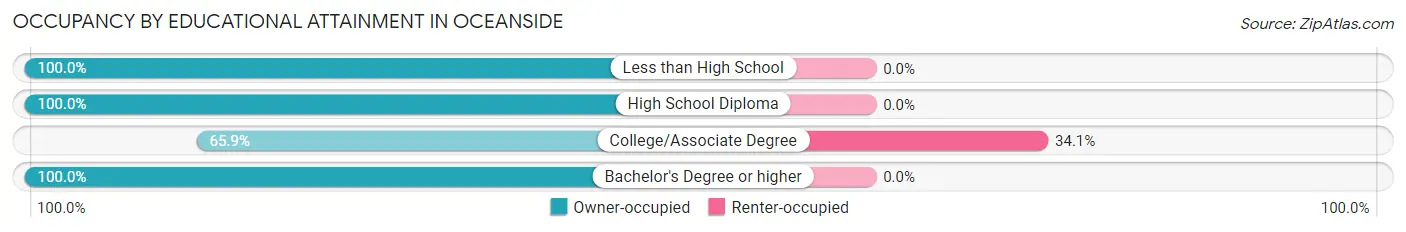
| Household Size | Owner-occupied | Renter-occupied |
| Less than High School | 12 (100.0%) | 0 (0.0%) |
| High School Diploma | 5 (100.0%) | 0 (0.0%) |
| College/Associate Degree | 29 (65.9%) | 15 (34.1%) |
| Bachelor's Degree or higher | 185 (100.0%) | 0 (0.0%) |
Occupancy by Age of Householder in Oceanside
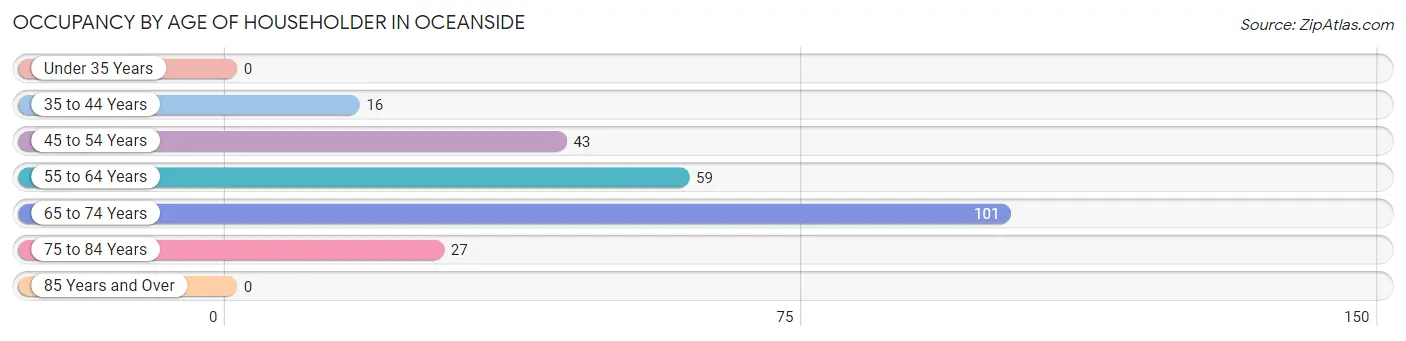
| Age Bracket | # Households | % Households |
| Under 35 Years | 0 | 0.0% |
| 35 to 44 Years | 16 | 6.5% |
| 45 to 54 Years | 43 | 17.5% |
| 55 to 64 Years | 59 | 24.0% |
| 65 to 74 Years | 101 | 41.1% |
| 75 to 84 Years | 27 | 11.0% |
| 85 Years and Over | 0 | 0.0% |
| Total | 246 | 100.0% |
Housing Finances in Oceanside
Median Income by Occupancy in Oceanside
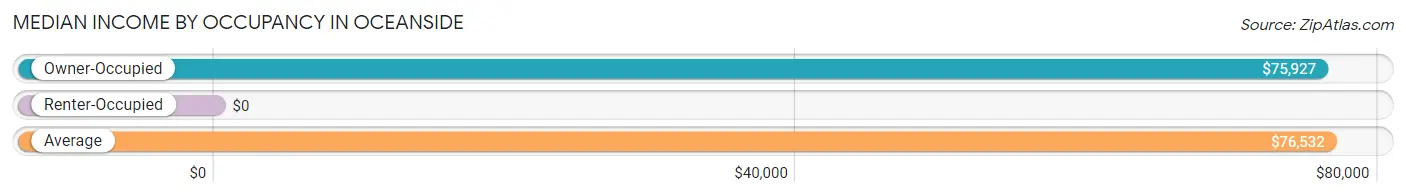
| Occupancy Type | # Households | Median Income |
| Owner-Occupied | 231 (93.9%) | $75,927 |
| Renter-Occupied | 15 (6.1%) | $0 |
| Average | 246 (100.0%) | $76,532 |
Occupancy by Householder Income Bracket in Oceanside
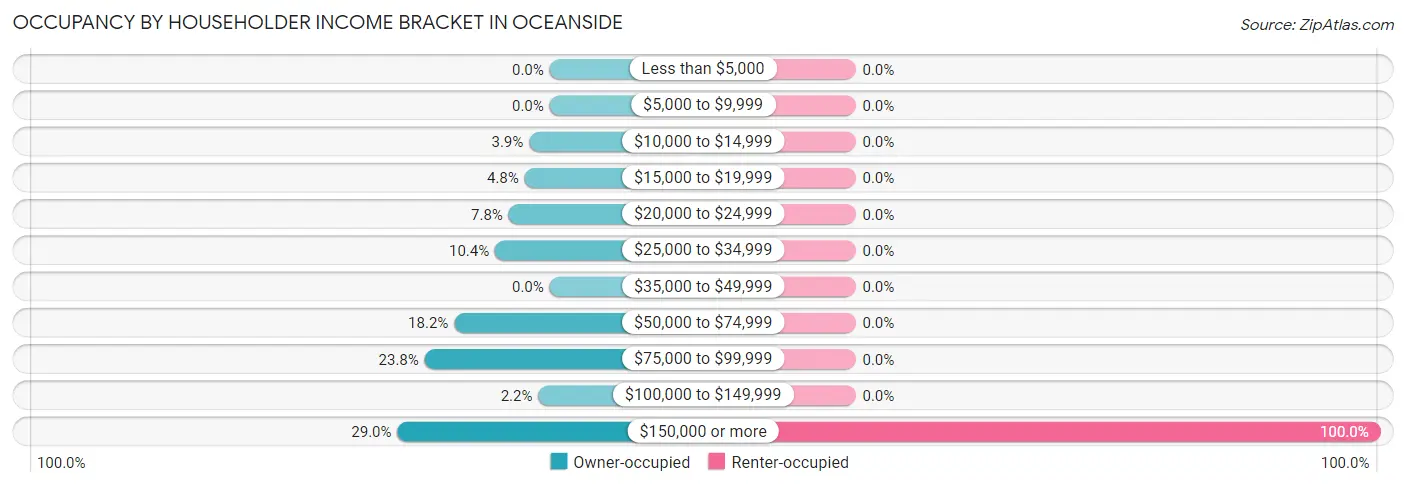
| Income Bracket | Owner-occupied | Renter-occupied |
| Less than $5,000 | 0 (0.0%) | 0 (0.0%) |
| $5,000 to $9,999 | 0 (0.0%) | 0 (0.0%) |
| $10,000 to $14,999 | 9 (3.9%) | 0 (0.0%) |
| $15,000 to $19,999 | 11 (4.8%) | 0 (0.0%) |
| $20,000 to $24,999 | 18 (7.8%) | 0 (0.0%) |
| $25,000 to $34,999 | 24 (10.4%) | 0 (0.0%) |
| $35,000 to $49,999 | 0 (0.0%) | 0 (0.0%) |
| $50,000 to $74,999 | 42 (18.2%) | 0 (0.0%) |
| $75,000 to $99,999 | 55 (23.8%) | 0 (0.0%) |
| $100,000 to $149,999 | 5 (2.2%) | 0 (0.0%) |
| $150,000 or more | 67 (29.0%) | 15 (100.0%) |
| Total | 231 (100.0%) | 15 (100.0%) |
Monthly Housing Cost Tiers in Oceanside
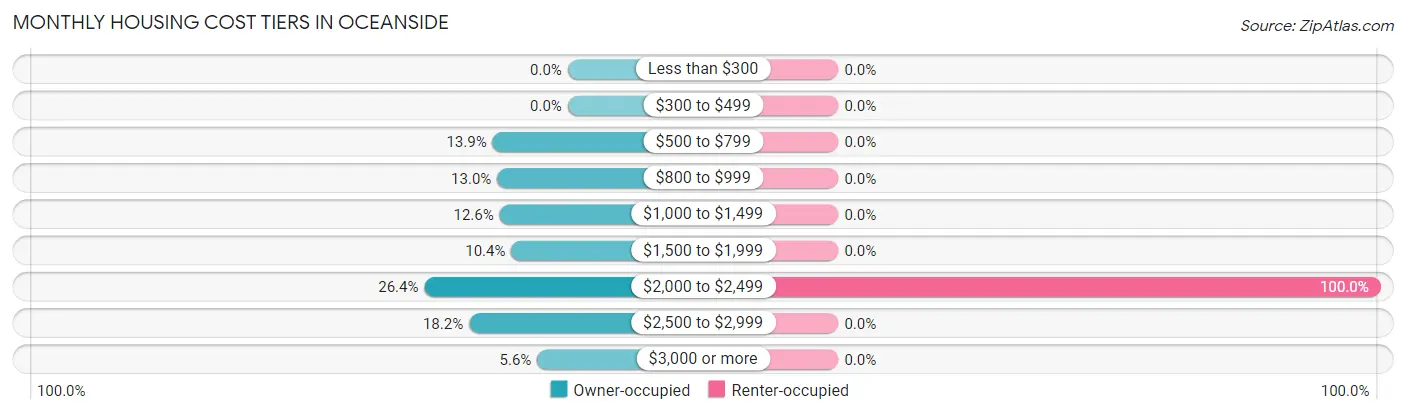
| Monthly Cost | Owner-occupied | Renter-occupied |
| Less than $300 | 0 (0.0%) | 0 (0.0%) |
| $300 to $499 | 0 (0.0%) | 0 (0.0%) |
| $500 to $799 | 32 (13.9%) | 0 (0.0%) |
| $800 to $999 | 30 (13.0%) | 0 (0.0%) |
| $1,000 to $1,499 | 29 (12.6%) | 0 (0.0%) |
| $1,500 to $1,999 | 24 (10.4%) | 0 (0.0%) |
| $2,000 to $2,499 | 61 (26.4%) | 15 (100.0%) |
| $2,500 to $2,999 | 42 (18.2%) | 0 (0.0%) |
| $3,000 or more | 13 (5.6%) | 0 (0.0%) |
| Total | 231 (100.0%) | 15 (100.0%) |
Physical Housing Characteristics in Oceanside
Housing Structures in Oceanside
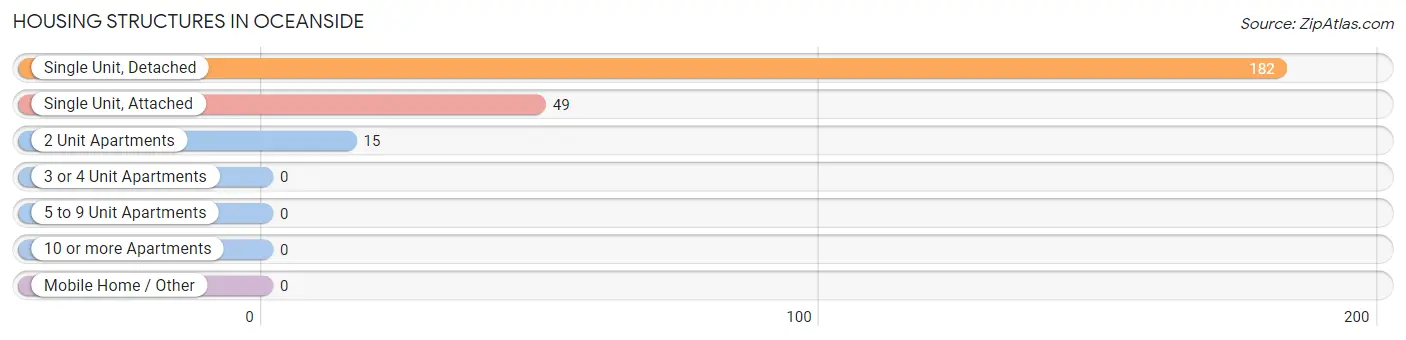
| Structure Type | # Housing Units | % Housing Units |
| Single Unit, Detached | 182 | 74.0% |
| Single Unit, Attached | 49 | 19.9% |
| 2 Unit Apartments | 15 | 6.1% |
| 3 or 4 Unit Apartments | 0 | 0.0% |
| 5 to 9 Unit Apartments | 0 | 0.0% |
| 10 or more Apartments | 0 | 0.0% |
| Mobile Home / Other | 0 | 0.0% |
| Total | 246 | 100.0% |
Housing Structures by Occupancy in Oceanside
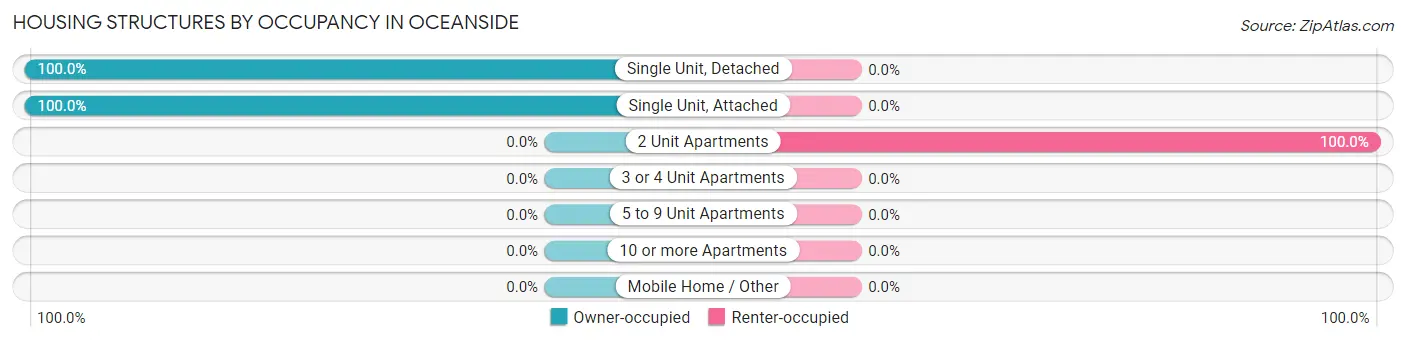
| Structure Type | Owner-occupied | Renter-occupied |
| Single Unit, Detached | 182 (100.0%) | 0 (0.0%) |
| Single Unit, Attached | 49 (100.0%) | 0 (0.0%) |
| 2 Unit Apartments | 0 (0.0%) | 15 (100.0%) |
| 3 or 4 Unit Apartments | 0 (0.0%) | 0 (0.0%) |
| 5 to 9 Unit Apartments | 0 (0.0%) | 0 (0.0%) |
| 10 or more Apartments | 0 (0.0%) | 0 (0.0%) |
| Mobile Home / Other | 0 (0.0%) | 0 (0.0%) |
| Total | 231 (93.9%) | 15 (6.1%) |
Housing Structures by Number of Rooms in Oceanside
| Number of Rooms | Owner-occupied | Renter-occupied |
| 1 Room | 0 (0.0%) | 0 (0.0%) |
| 2 or 3 Rooms | 24 (10.4%) | 0 (0.0%) |
| 4 or 5 Rooms | 36 (15.6%) | 15 (100.0%) |
| 6 or 7 Rooms | 101 (43.7%) | 0 (0.0%) |
| 8 or more Rooms | 70 (30.3%) | 0 (0.0%) |
| Total | 231 (100.0%) | 15 (100.0%) |
Housing Structure by Heating Type in Oceanside
| Heating Type | Owner-occupied | Renter-occupied |
| Utility Gas | 31 (13.4%) | 0 (0.0%) |
| Bottled, Tank, or LP Gas | 0 (0.0%) | 0 (0.0%) |
| Electricity | 183 (79.2%) | 15 (100.0%) |
| Fuel Oil or Kerosene | 5 (2.2%) | 0 (0.0%) |
| Coal or Coke | 0 (0.0%) | 0 (0.0%) |
| All other Fuels | 12 (5.2%) | 0 (0.0%) |
| No Fuel Used | 0 (0.0%) | 0 (0.0%) |
| Total | 231 (100.0%) | 15 (100.0%) |
Household Vehicle Usage in Oceanside
| Vehicles per Household | Owner-occupied | Renter-occupied |
| No Vehicle | 0 (0.0%) | 0 (0.0%) |
| 1 Vehicle | 44 (19.1%) | 0 (0.0%) |
| 2 Vehicles | 136 (58.9%) | 15 (100.0%) |
| 3 or more Vehicles | 51 (22.1%) | 0 (0.0%) |
| Total | 231 (100.0%) | 15 (100.0%) |
Real Estate & Mortgages in Oceanside
Real Estate and Mortgage Overview in Oceanside
| Characteristic | Without Mortgage | With Mortgage |
| Housing Units | 122 | 109 |
| Median Property Value | $675,000 | $552,500 |
| Median Household Income | - | - |
| Monthly Housing Costs | $897 | $13 |
| Real Estate Taxes | $7,917 | $0 |
Property Value by Mortgage Status in Oceanside
| Property Value | Without Mortgage | With Mortgage |
| Less than $50,000 | 0 (0.0%) | 0 (0.0%) |
| $50,000 to $99,999 | 0 (0.0%) | 0 (0.0%) |
| $100,000 to $299,999 | 0 (0.0%) | 0 (0.0%) |
| $300,000 to $499,999 | 33 (27.1%) | 40 (36.7%) |
| $500,000 to $749,999 | 40 (32.8%) | 69 (63.3%) |
| $750,000 to $999,999 | 31 (25.4%) | 0 (0.0%) |
| $1,000,000 or more | 18 (14.7%) | 0 (0.0%) |
| Total | 122 (100.0%) | 109 (100.0%) |
Household Income by Mortgage Status in Oceanside
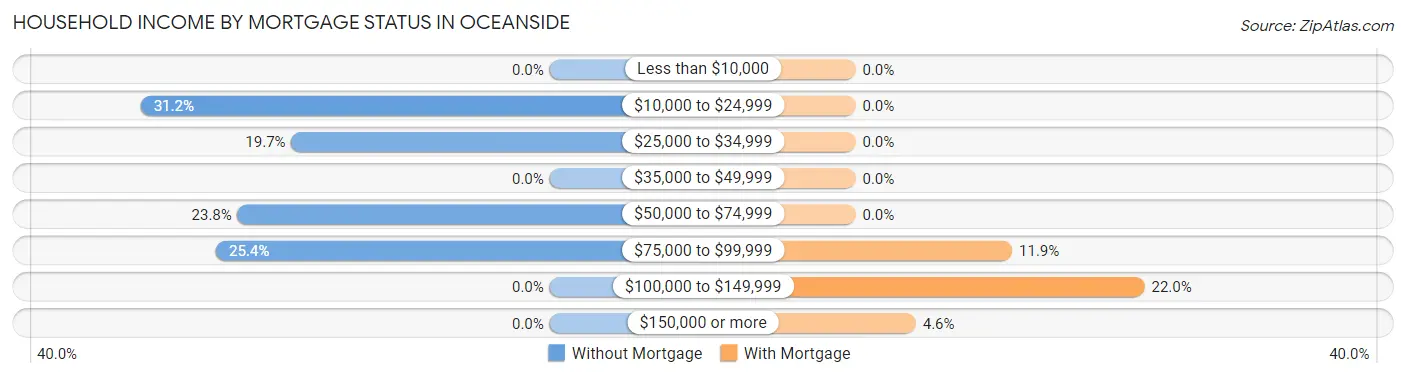
| Household Income | Without Mortgage | With Mortgage |
| Less than $10,000 | 0 (0.0%) | 0 (0.0%) |
| $10,000 to $24,999 | 38 (31.1%) | 0 (0.0%) |
| $25,000 to $34,999 | 24 (19.7%) | 0 (0.0%) |
| $35,000 to $49,999 | 0 (0.0%) | 0 (0.0%) |
| $50,000 to $74,999 | 29 (23.8%) | 0 (0.0%) |
| $75,000 to $99,999 | 31 (25.4%) | 13 (11.9%) |
| $100,000 to $149,999 | 0 (0.0%) | 24 (22.0%) |
| $150,000 or more | 0 (0.0%) | 5 (4.6%) |
| Total | 122 (100.0%) | 109 (100.0%) |
Property Value to Household Income Ratio in Oceanside
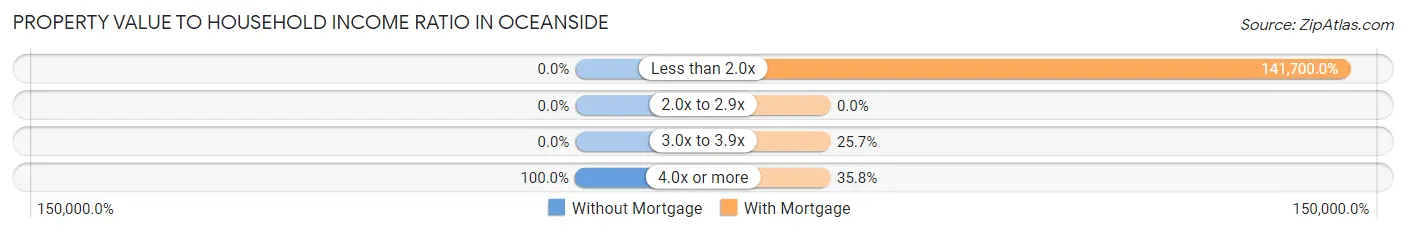
| Value-to-Income Ratio | Without Mortgage | With Mortgage |
| Less than 2.0x | 0 (0.0%) | 154,453 (141,700.0%) |
| 2.0x to 2.9x | 0 (0.0%) | 0 (0.0%) |
| 3.0x to 3.9x | 0 (0.0%) | 28 (25.7%) |
| 4.0x or more | 122 (100.0%) | 39 (35.8%) |
| Total | 122 (100.0%) | 109 (100.0%) |
Real Estate Taxes by Mortgage Status in Oceanside
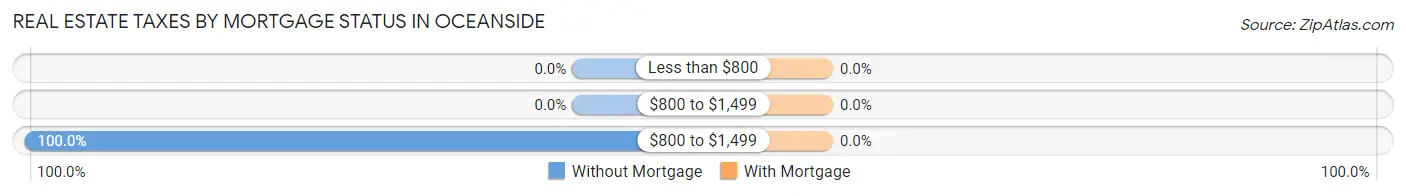
| Property Taxes | Without Mortgage | With Mortgage |
| Less than $800 | 0 (0.0%) | 0 (0.0%) |
| $800 to $1,499 | 0 (0.0%) | 0 (0.0%) |
| $800 to $1,499 | 122 (100.0%) | 0 (0.0%) |
| Total | 122 (100.0%) | 109 (100.0%) |
Health & Disability in Oceanside
Health Insurance Coverage by Age in Oceanside
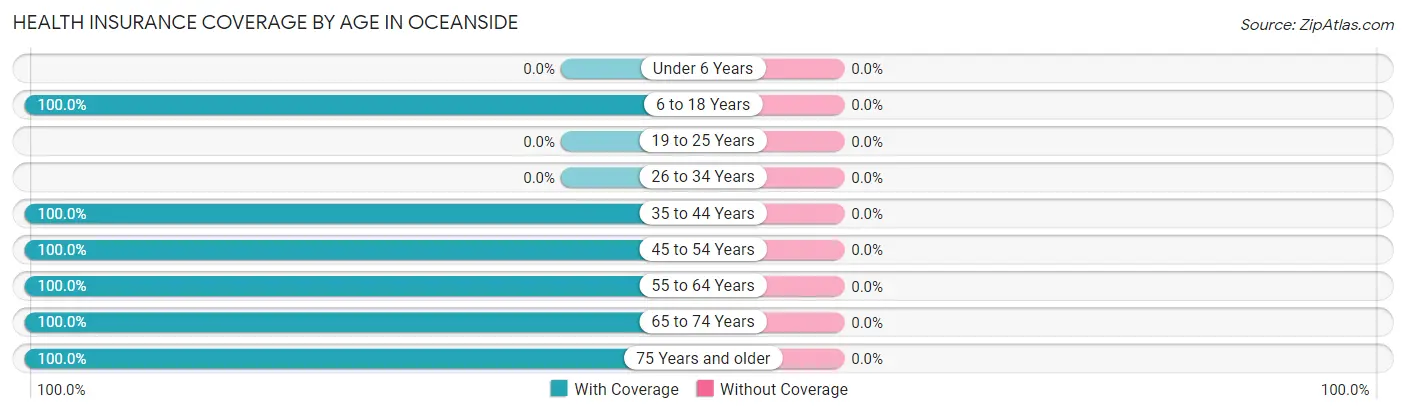
| Age Bracket | With Coverage | Without Coverage |
| Under 6 Years | 0 (0.0%) | 0 (0.0%) |
| 6 to 18 Years | 39 (100.0%) | 0 (0.0%) |
| 19 to 25 Years | 0 (0.0%) | 0 (0.0%) |
| 26 to 34 Years | 0 (0.0%) | 0 (0.0%) |
| 35 to 44 Years | 16 (100.0%) | 0 (0.0%) |
| 45 to 54 Years | 60 (100.0%) | 0 (0.0%) |
| 55 to 64 Years | 168 (100.0%) | 0 (0.0%) |
| 65 to 74 Years | 153 (100.0%) | 0 (0.0%) |
| 75 Years and older | 36 (100.0%) | 0 (0.0%) |
| Total | 472 (100.0%) | 0 (0.0%) |
Health Insurance Coverage by Citizenship Status in Oceanside
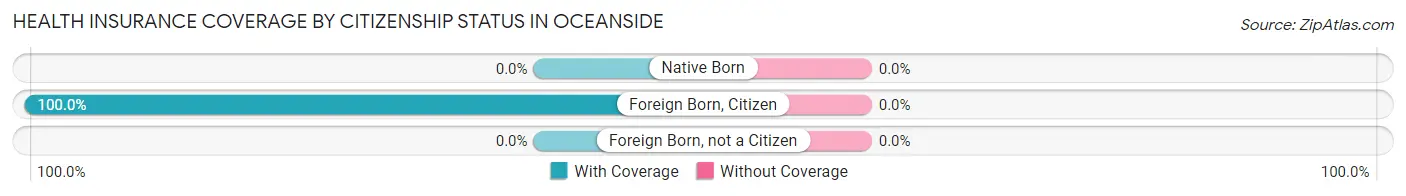
| Citizenship Status | With Coverage | Without Coverage |
| Native Born | 0 (0.0%) | 0 (0.0%) |
| Foreign Born, Citizen | 39 (100.0%) | 0 (0.0%) |
| Foreign Born, not a Citizen | 0 (0.0%) | 0 (0.0%) |
Health Insurance Coverage by Household Income in Oceanside
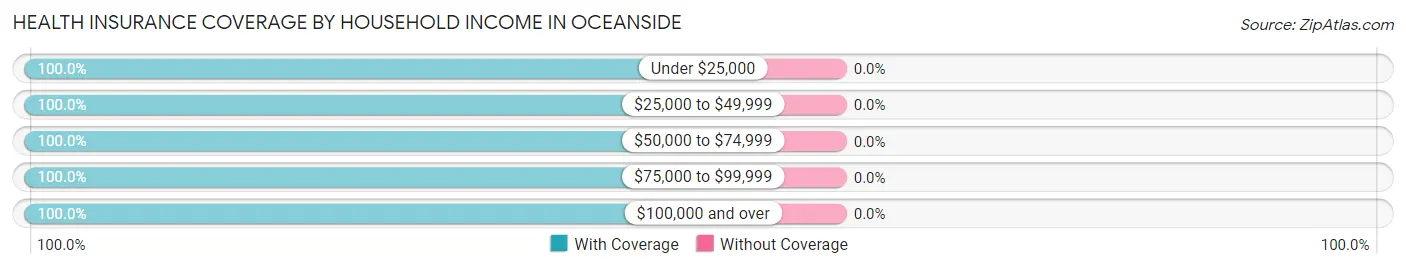
| Household Income | With Coverage | Without Coverage |
| Under $25,000 | 38 (100.0%) | 0 (0.0%) |
| $25,000 to $49,999 | 24 (100.0%) | 0 (0.0%) |
| $50,000 to $74,999 | 84 (100.0%) | 0 (0.0%) |
| $75,000 to $99,999 | 127 (100.0%) | 0 (0.0%) |
| $100,000 and over | 199 (100.0%) | 0 (0.0%) |
Public vs Private Health Insurance Coverage by Age in Oceanside
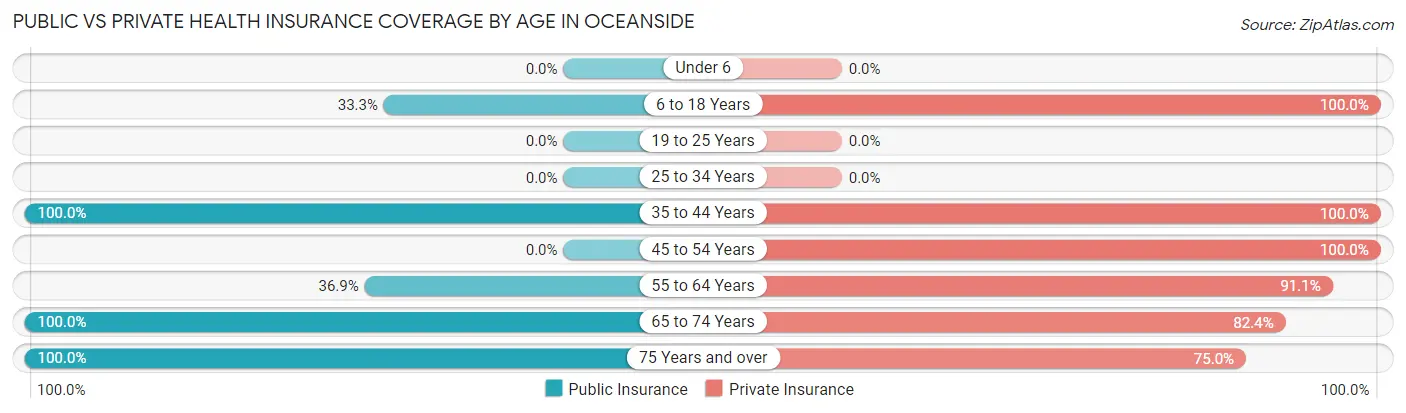
| Age Bracket | Public Insurance | Private Insurance |
| Under 6 | 0 (0.0%) | 0 (0.0%) |
| 6 to 18 Years | 13 (33.3%) | 39 (100.0%) |
| 19 to 25 Years | 0 (0.0%) | 0 (0.0%) |
| 25 to 34 Years | 0 (0.0%) | 0 (0.0%) |
| 35 to 44 Years | 16 (100.0%) | 16 (100.0%) |
| 45 to 54 Years | 0 (0.0%) | 60 (100.0%) |
| 55 to 64 Years | 62 (36.9%) | 153 (91.1%) |
| 65 to 74 Years | 153 (100.0%) | 126 (82.4%) |
| 75 Years and over | 36 (100.0%) | 27 (75.0%) |
| Total | 280 (59.3%) | 421 (89.2%) |
Disability Status by Sex by Age in Oceanside
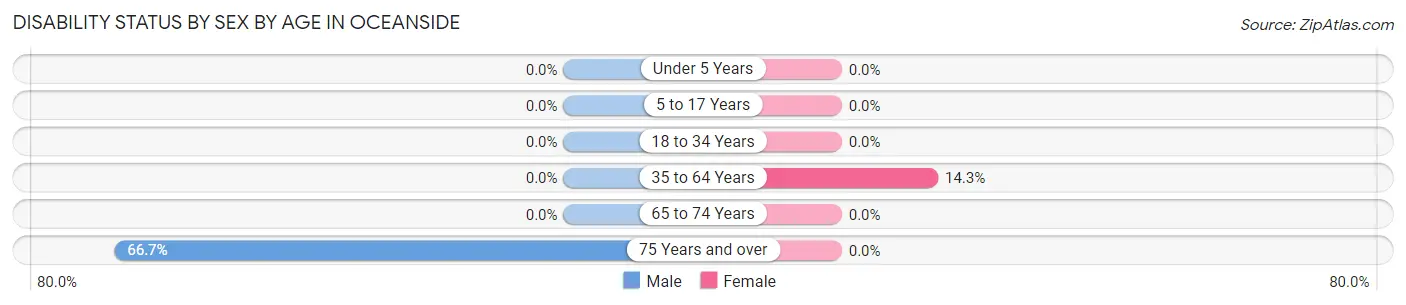
| Age Bracket | Male | Female |
| Under 5 Years | 0 (0.0%) | 0 (0.0%) |
| 5 to 17 Years | 0 (0.0%) | 0 (0.0%) |
| 18 to 34 Years | 0 (0.0%) | 0 (0.0%) |
| 35 to 64 Years | 0 (0.0%) | 15 (14.3%) |
| 65 to 74 Years | 0 (0.0%) | 0 (0.0%) |
| 75 Years and over | 18 (66.7%) | 0 (0.0%) |
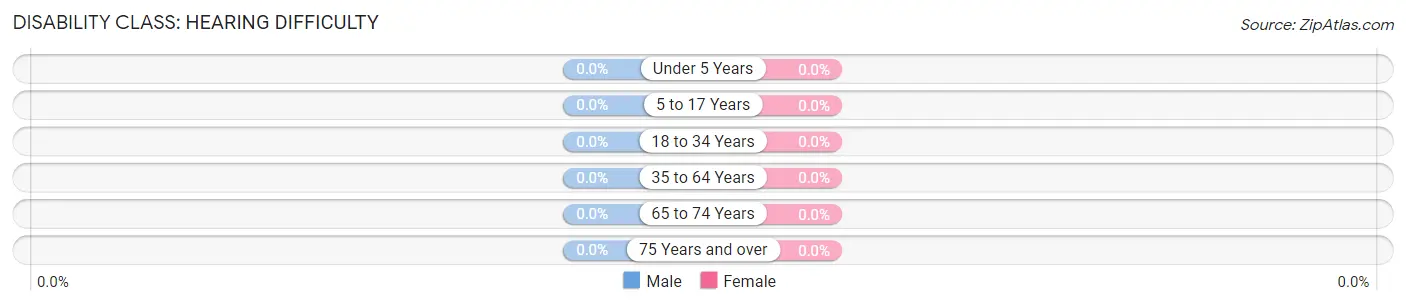
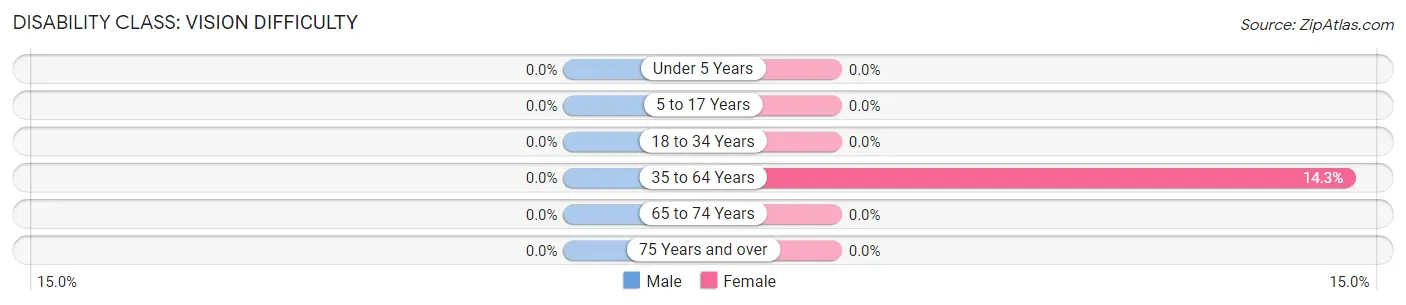
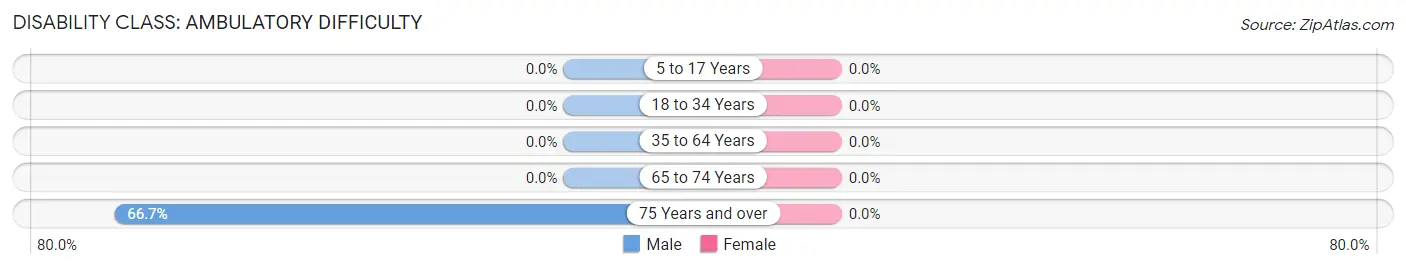
Disability Class by Sex by Age in Oceanside
Disability Class: Hearing Difficulty
| Age Bracket | Male | Female |
| Under 5 Years | 0 (0.0%) | 0 (0.0%) |
| 5 to 17 Years | 0 (0.0%) | 0 (0.0%) |
| 18 to 34 Years | 0 (0.0%) | 0 (0.0%) |
| 35 to 64 Years | 0 (0.0%) | 0 (0.0%) |
| 65 to 74 Years | 0 (0.0%) | 0 (0.0%) |
| 75 Years and over | 0 (0.0%) | 0 (0.0%) |
Disability Class: Vision Difficulty
| Age Bracket | Male | Female |
| Under 5 Years | 0 (0.0%) | 0 (0.0%) |
| 5 to 17 Years | 0 (0.0%) | 0 (0.0%) |
| 18 to 34 Years | 0 (0.0%) | 0 (0.0%) |
| 35 to 64 Years | 0 (0.0%) | 15 (14.3%) |
| 65 to 74 Years | 0 (0.0%) | 0 (0.0%) |
| 75 Years and over | 0 (0.0%) | 0 (0.0%) |
Disability Class: Cognitive Difficulty
| Age Bracket | Male | Female |
| 5 to 17 Years | 0 (0.0%) | 0 (0.0%) |
| 18 to 34 Years | 0 (0.0%) | 0 (0.0%) |
| 35 to 64 Years | 0 (0.0%) | 0 (0.0%) |
| 65 to 74 Years | 0 (0.0%) | 0 (0.0%) |
| 75 Years and over | 0 (0.0%) | 0 (0.0%) |
Disability Class: Ambulatory Difficulty
| Age Bracket | Male | Female |
| 5 to 17 Years | 0 (0.0%) | 0 (0.0%) |
| 18 to 34 Years | 0 (0.0%) | 0 (0.0%) |
| 35 to 64 Years | 0 (0.0%) | 0 (0.0%) |
| 65 to 74 Years | 0 (0.0%) | 0 (0.0%) |
| 75 Years and over | 18 (66.7%) | 0 (0.0%) |
Disability Class: Self-Care Difficulty
| Age Bracket | Male | Female |
| 5 to 17 Years | 0 (0.0%) | 0 (0.0%) |
| 18 to 34 Years | 0 (0.0%) | 0 (0.0%) |
| 35 to 64 Years | 0 (0.0%) | 0 (0.0%) |
| 65 to 74 Years | 0 (0.0%) | 0 (0.0%) |
| 75 Years and over | 0 (0.0%) | 0 (0.0%) |
Technology Access in Oceanside
Computing Device Access in Oceanside
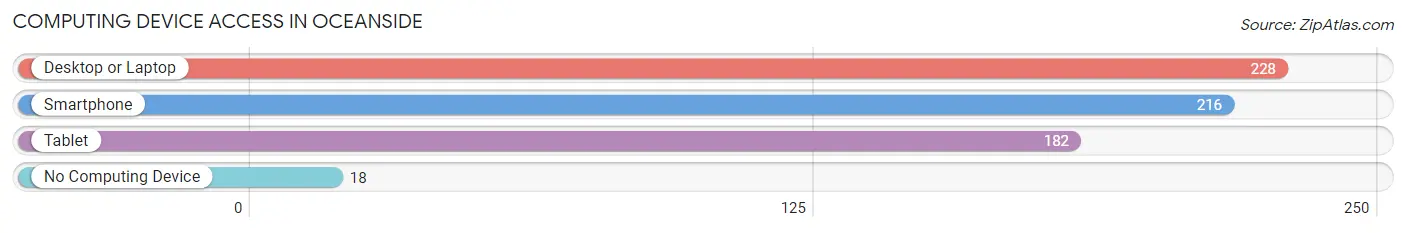
| Device Type | # Households | % Households |
| Desktop or Laptop | 228 | 92.7% |
| Smartphone | 216 | 87.8% |
| Tablet | 182 | 74.0% |
| No Computing Device | 18 | 7.3% |
| Total | 246 | 100.0% |
Internet Access in Oceanside
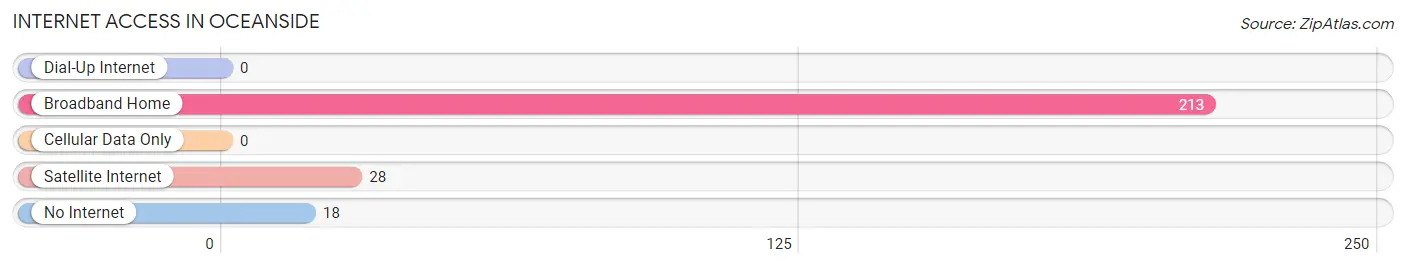
| Internet Type | # Households | % Households |
| Dial-Up Internet | 0 | 0.0% |
| Broadband Home | 213 | 86.6% |
| Cellular Data Only | 0 | 0.0% |
| Satellite Internet | 28 | 11.4% |
| No Internet | 18 | 7.3% |
| Total | 246 | 100.0% |
Oceanside Summary
Oceanside is a small unincorporated community located in Tillamook County, Oregon, United States. It is situated on the Pacific Ocean, approximately 10 miles south of Tillamook and 25 miles north of Lincoln City. The community is located on the Three Capes Scenic Loop, a popular tourist route that winds along the Oregon Coast. Oceanside is a popular destination for beachgoers, hikers, and campers, and is known for its stunning views of the ocean and its rugged coastline.
History
The area now known as Oceanside was first inhabited by the Tillamook people, who lived in the area for thousands of years before the arrival of European settlers. The first European settlers arrived in the area in the late 1800s, and the community was officially established in 1891. The town was named after its location on the Pacific Ocean, and the first post office was established in 1892.
In the early 1900s, Oceanside was a popular destination for tourists, and the town was home to several hotels and resorts. The town was also home to a number of fishing boats, which provided a livelihood for many of the town's residents. In the 1950s, the town began to decline as tourists began to flock to other destinations along the Oregon Coast.
Geography
Oceanside is located in Tillamook County, Oregon, on the Pacific Ocean. The town is situated on the Three Capes Scenic Loop, a popular tourist route that winds along the Oregon Coast. The town is located approximately 10 miles south of Tillamook and 25 miles north of Lincoln City.
The town is situated on a rocky coastline, and is known for its stunning views of the ocean and its rugged coastline. The town is surrounded by the Pacific Ocean to the west, the Three Capes Scenic Loop to the east, and the Nestucca River to the south.
Economy
The economy of Oceanside is largely based on tourism. The town is a popular destination for beachgoers, hikers, and campers, and is known for its stunning views of the ocean and its rugged coastline. The town is also home to a number of restaurants, shops, and lodging establishments, which cater to tourists.
The town is also home to a number of fishing boats, which provide a livelihood for many of the town's residents. The town is also home to a number of small businesses, including a grocery store, a hardware store, and a gas station.
Demographics
As of the 2010 census, the population of Oceanside was 545. The racial makeup of the town was 94.2% White, 0.2% African American, 0.4% Native American, 0.4% Asian, 0.2% Pacific Islander, 0.2% from other races, and 4.4% from two or more races. Hispanic or Latino of any race were 1.3% of the population.
The median household income in Oceanside was $41,250, and the median family income was $45,625. The per capita income for the town was $20,945. About 11.2% of families and 14.2% of the population were below the poverty line, including 18.2% of those under age 18 and 8.3% of those age 65 or over.
Common Questions
What is the Total Population of Oceanside?
Total Population of Oceanside is 472.
What is the Total Male Population of Oceanside?
Total Male Population of Oceanside is 266.
What is the Total Female Population of Oceanside?
Total Female Population of Oceanside is 206.
What is the Ratio of Males per 100 Females in Oceanside?
There are 129.13 Males per 100 Females in Oceanside.
What is the Ratio of Females per 100 Males in Oceanside?
There are 77.44 Females per 100 Males in Oceanside.
What is the Median Population Age in Oceanside?
Median Population Age in Oceanside is 64.2 Years.
What is the Average Family Size in Oceanside
Average Family Size in Oceanside is 2.4 People.
What is the Average Household Size in Oceanside
Average Household Size in Oceanside is 1.9 People.
What is Per Capita Income in Oceanside?
Per Capita income in Oceanside is $55,149.
What is the Median Family Income in Oceanside?
Median Family Income in Oceanside is $77,379.
What is the Median Household income in Oceanside?
Median Household Income in Oceanside is $76,532.
What is Inequality or Gini Index in Oceanside?
Inequality or Gini Index in Oceanside is 0.36.
How Large is the Labor Force in Oceanside?
There are 158 People in the Labor Forcein in Oceanside.
What is the Percentage of People in the Labor Force in Oceanside?
35.5% of People are in the Labor Force in Oceanside.