Cities with the Highest Percentage of Population Employed in Office & Administration in Oregon
RELATED REPORTS & OPTIONS
Office & Administration
Oregon
Compare Cities
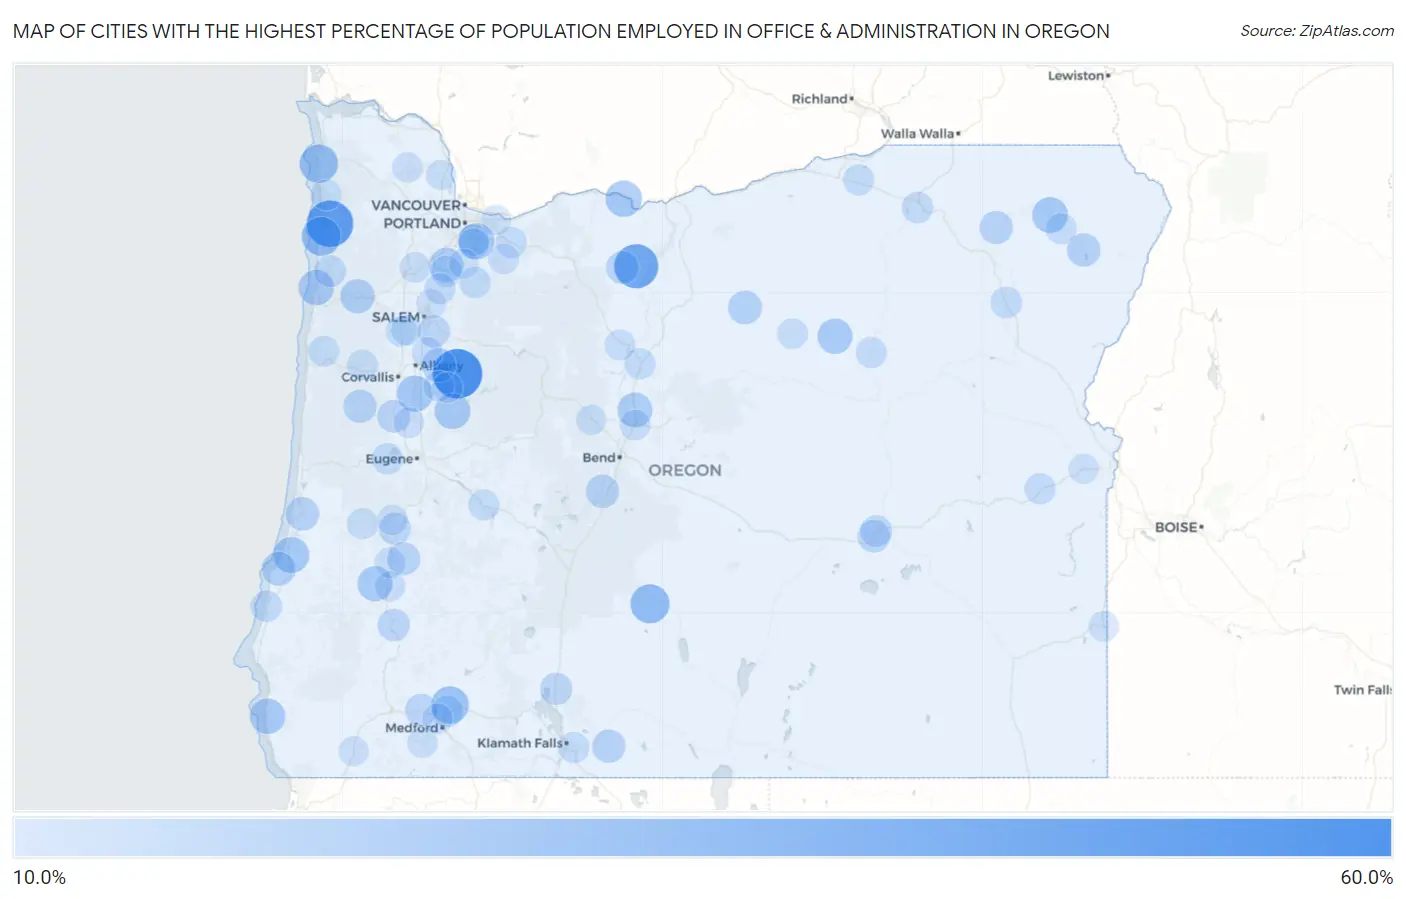
Map of Cities with the Highest Percentage of Population Employed in Office & Administration in Oregon
0.0%
60.0%
Cities with the Highest Percentage of Population Employed in Office & Administration in Oregon
| City | % Employed | vs State | vs National | |
| 1. | Lacomb | 58.3% | 10.7%(+47.6)#1 | 10.9%(+47.5)#134 |
| 2. | Idaville | 51.3% | 10.7%(+40.5)#2 | 10.9%(+40.4)#196 |
| 3. | Rhododendron | 46.0% | 10.7%(+35.3)#3 | 10.9%(+35.1)#273 |
| 4. | Tygh Valley | 45.5% | 10.7%(+34.7)#4 | 10.9%(+34.6)#282 |
| 5. | Silver Lake | 33.6% | 10.7%(+22.8)#5 | 10.9%(+22.7)#633 |
| 6. | Netarts | 33.5% | 10.7%(+22.7)#6 | 10.9%(+22.6)#638 |
| 7. | Cannon Beach | 32.2% | 10.7%(+21.5)#7 | 10.9%(+21.3)#727 |
| 8. | Eagle Point | 29.7% | 10.7%(+18.9)#8 | 10.9%(+18.8)#868 |
| 9. | Rowena | 27.3% | 10.7%(+16.5)#9 | 10.9%(+16.4)#1,079 |
| 10. | Johnson City | 27.2% | 10.7%(+16.4)#10 | 10.9%(+16.3)#1,087 |
| 11. | Shedd | 26.8% | 10.7%(+16.1)#11 | 10.9%(+16.0)#1,121 |
| 12. | Glasgow | 26.3% | 10.7%(+15.6)#12 | 10.9%(+15.4)#1,179 |
| 13. | Wallowa | 25.9% | 10.7%(+15.2)#13 | 10.9%(+15.1)#1,203 |
| 14. | Holley | 25.7% | 10.7%(+15.0)#14 | 10.9%(+14.8)#1,229 |
| 15. | Gold Beach | 25.5% | 10.7%(+14.7)#15 | 10.9%(+14.6)#1,260 |
| 16. | Neskowin | 25.3% | 10.7%(+14.6)#16 | 10.9%(+14.4)#1,274 |
| 17. | Jasper | 24.8% | 10.7%(+14.1)#17 | 10.9%(+13.9)#1,351 |
| 18. | Monument | 24.6% | 10.7%(+13.9)#18 | 10.9%(+13.7)#1,377 |
| 19. | Melrose | 24.5% | 10.7%(+13.7)#19 | 10.9%(+13.6)#1,397 |
| 20. | Terrebonne | 24.2% | 10.7%(+13.5)#20 | 10.9%(+13.4)#1,425 |
| 21. | Butteville | 23.4% | 10.7%(+12.6)#21 | 10.9%(+12.5)#1,571 |
| 22. | Dilley | 23.0% | 10.7%(+12.2)#22 | 10.9%(+12.1)#1,638 |
| 23. | Elmira | 22.5% | 10.7%(+11.8)#23 | 10.9%(+11.6)#1,741 |
| 24. | Grand Ronde | 22.5% | 10.7%(+11.8)#24 | 10.9%(+11.6)#1,746 |
| 25. | Barview | 22.1% | 10.7%(+11.3)#25 | 10.9%(+11.2)#1,826 |
| 26. | Crabtree | 21.9% | 10.7%(+11.2)#26 | 10.9%(+11.0)#1,864 |
| 27. | Mapleton | 21.6% | 10.7%(+10.8)#27 | 10.9%(+10.7)#1,943 |
| 28. | Fossil | 21.5% | 10.7%(+10.8)#28 | 10.9%(+10.7)#1,960 |
| 29. | Joseph | 20.8% | 10.7%(+10.1)#29 | 10.9%(+9.97)#2,150 |
| 30. | Reedsport | 20.7% | 10.7%(+9.93)#30 | 10.9%(+9.80)#2,200 |
| 31. | Bonanza | 20.6% | 10.7%(+9.88)#31 | 10.9%(+9.76)#2,217 |
| 32. | Three Rivers | 20.6% | 10.7%(+9.88)#32 | 10.9%(+9.76)#2,218 |
| 33. | Alsea | 20.5% | 10.7%(+9.72)#33 | 10.9%(+9.60)#2,263 |
| 34. | Summerville | 20.3% | 10.7%(+9.61)#34 | 10.9%(+9.48)#2,297 |
| 35. | Keno | 20.1% | 10.7%(+9.32)#35 | 10.9%(+9.19)#2,387 |
| 36. | Fair Oaks | 20.0% | 10.7%(+9.27)#36 | 10.9%(+9.14)#2,414 |
| 37. | Pine Hollow | 19.6% | 10.7%(+8.89)#37 | 10.9%(+8.76)#2,563 |
| 38. | Monroe | 19.3% | 10.7%(+8.55)#38 | 10.9%(+8.42)#2,687 |
| 39. | Beaver Marsh | 19.2% | 10.7%(+8.50)#39 | 10.9%(+8.37)#2,709 |
| 40. | Hines | 19.0% | 10.7%(+8.23)#40 | 10.9%(+8.11)#2,814 |
| 41. | Gold Hill | 18.4% | 10.7%(+7.68)#41 | 10.9%(+7.56)#3,127 |
| 42. | Tri City | 18.3% | 10.7%(+7.57)#42 | 10.9%(+7.45)#3,175 |
| 43. | Chiloquin | 18.3% | 10.7%(+7.52)#43 | 10.9%(+7.40)#3,197 |
| 44. | Turner | 18.2% | 10.7%(+7.46)#44 | 10.9%(+7.33)#3,220 |
| 45. | Yoncalla | 17.8% | 10.7%(+7.09)#45 | 10.9%(+6.96)#3,441 |
| 46. | Santa Clara | 17.4% | 10.7%(+6.68)#46 | 10.9%(+6.55)#3,701 |
| 47. | Burns | 17.4% | 10.7%(+6.63)#47 | 10.9%(+6.51)#3,728 |
| 48. | Hebo | 17.2% | 10.7%(+6.45)#48 | 10.9%(+6.33)#3,845 |
| 49. | Svensen | 17.0% | 10.7%(+6.32)#49 | 10.9%(+6.19)#3,937 |
| 50. | North Powder | 16.8% | 10.7%(+6.07)#50 | 10.9%(+5.95)#4,105 |
| 51. | Tutuilla | 16.8% | 10.7%(+6.02)#51 | 10.9%(+5.89)#4,133 |
| 52. | White City | 16.7% | 10.7%(+6.00)#52 | 10.9%(+5.87)#4,151 |
| 53. | Molalla | 16.6% | 10.7%(+5.84)#53 | 10.9%(+5.72)#4,282 |
| 54. | Bandon | 16.2% | 10.7%(+5.52)#54 | 10.9%(+5.39)#4,555 |
| 55. | Veneta | 16.2% | 10.7%(+5.49)#55 | 10.9%(+5.37)#4,577 |
| 56. | Oatfield | 16.2% | 10.7%(+5.47)#56 | 10.9%(+5.34)#4,598 |
| 57. | Donald | 16.1% | 10.7%(+5.40)#57 | 10.9%(+5.28)#4,649 |
| 58. | Long Creek | 15.9% | 10.7%(+5.18)#58 | 10.9%(+5.05)#4,879 |
| 59. | Madras | 15.8% | 10.7%(+5.10)#59 | 10.9%(+4.97)#4,950 |
| 60. | Altamont | 15.8% | 10.7%(+5.05)#60 | 10.9%(+4.93)#5,005 |
| 61. | Westfir | 15.7% | 10.7%(+5.02)#61 | 10.9%(+4.89)#5,044 |
| 62. | Sandy | 15.7% | 10.7%(+5.01)#62 | 10.9%(+4.89)#5,047 |
| 63. | Harper | 15.7% | 10.7%(+4.98)#63 | 10.9%(+4.86)#5,077 |
| 64. | Stanfield | 15.6% | 10.7%(+4.91)#64 | 10.9%(+4.79)#5,138 |
| 65. | Siletz | 15.6% | 10.7%(+4.85)#65 | 10.9%(+4.73)#5,205 |
| 66. | Lostine | 15.5% | 10.7%(+4.81)#66 | 10.9%(+4.68)#5,252 |
| 67. | Monmouth | 15.5% | 10.7%(+4.76)#67 | 10.9%(+4.64)#5,303 |
| 68. | Gervais | 15.5% | 10.7%(+4.74)#68 | 10.9%(+4.62)#5,330 |
| 69. | Jefferson | 15.4% | 10.7%(+4.68)#69 | 10.9%(+4.55)#5,394 |
| 70. | Elkton | 15.4% | 10.7%(+4.65)#70 | 10.9%(+4.53)#5,438 |
| 71. | Warm Springs | 15.4% | 10.7%(+4.63)#71 | 10.9%(+4.51)#5,468 |
| 72. | Lafayette | 15.3% | 10.7%(+4.56)#72 | 10.9%(+4.44)#5,556 |
| 73. | Wheeler | 15.3% | 10.7%(+4.55)#73 | 10.9%(+4.43)#5,563 |
| 74. | Summit | 15.2% | 10.7%(+4.42)#74 | 10.9%(+4.30)#5,698 |
| 75. | Sutherlin | 15.1% | 10.7%(+4.39)#75 | 10.9%(+4.27)#5,719 |
| 76. | Spray | 15.1% | 10.7%(+4.36)#76 | 10.9%(+4.24)#5,750 |
| 77. | South Lebanon | 15.0% | 10.7%(+4.24)#77 | 10.9%(+4.11)#5,900 |
| 78. | Redmond | 14.8% | 10.7%(+4.10)#78 | 10.9%(+3.98)#6,058 |
| 79. | Gladstone | 14.8% | 10.7%(+4.06)#79 | 10.9%(+3.94)#6,112 |
| 80. | Drain | 14.7% | 10.7%(+3.94)#80 | 10.9%(+3.82)#6,263 |
| 81. | Ruch | 14.7% | 10.7%(+3.93)#81 | 10.9%(+3.80)#6,288 |
| 82. | Estacada | 14.6% | 10.7%(+3.83)#82 | 10.9%(+3.70)#6,435 |
| 83. | Neotsu | 14.5% | 10.7%(+3.75)#83 | 10.9%(+3.63)#6,528 |
| 84. | Roseburg | 14.4% | 10.7%(+3.71)#84 | 10.9%(+3.59)#6,590 |
| 85. | Heceta Beach | 14.4% | 10.7%(+3.71)#85 | 10.9%(+3.59)#6,593 |
| 86. | Harrisburg | 14.4% | 10.7%(+3.70)#86 | 10.9%(+3.58)#6,608 |
| 87. | Waterloo | 14.3% | 10.7%(+3.55)#87 | 10.9%(+3.43)#6,796 |
| 88. | Jordan Valley | 14.3% | 10.7%(+3.55)#88 | 10.9%(+3.43)#6,812 |
| 89. | Independence | 14.2% | 10.7%(+3.45)#89 | 10.9%(+3.33)#6,965 |
| 90. | Warren | 14.1% | 10.7%(+3.41)#90 | 10.9%(+3.28)#7,017 |
| 91. | Central Point | 14.0% | 10.7%(+3.31)#91 | 10.9%(+3.19)#7,141 |
| 92. | Sisters | 14.0% | 10.7%(+3.29)#92 | 10.9%(+3.17)#7,172 |
| 93. | Vernonia | 14.0% | 10.7%(+3.29)#93 | 10.9%(+3.17)#7,180 |
| 94. | Dexter | 14.0% | 10.7%(+3.24)#94 | 10.9%(+3.12)#7,261 |
| 95. | Troutdale | 13.9% | 10.7%(+3.21)#95 | 10.9%(+3.09)#7,302 |
| 96. | Labish Village | 13.9% | 10.7%(+3.14)#96 | 10.9%(+3.01)#7,420 |
| 97. | Cave Junction | 13.8% | 10.7%(+3.08)#97 | 10.9%(+2.95)#7,490 |
| 98. | Vale | 13.8% | 10.7%(+3.05)#98 | 10.9%(+2.92)#7,551 |
| 99. | River Point | 13.7% | 10.7%(+2.97)#99 | 10.9%(+2.84)#7,684 |
| 100. | Canby | 13.6% | 10.7%(+2.87)#100 | 10.9%(+2.75)#7,834 |
Common Questions
What are the Top 10 Cities with the Highest Percentage of Population Employed in Office & Administration in Oregon?
Top 10 Cities with the Highest Percentage of Population Employed in Office & Administration in Oregon are:
#1
58.3%
#2
51.3%
#3
45.5%
#4
33.6%
#5
33.5%
#6
32.2%
#7
29.7%
#8
27.3%
#9
27.2%
#10
26.8%
What city has the Highest Percentage of Population Employed in Office & Administration in Oregon?
Lacomb has the Highest Percentage of Population Employed in Office & Administration in Oregon with 58.3%.
What is the Percentage of Population Employed in Office & Administration in the State of Oregon?
Percentage of Population Employed in Office & Administration in Oregon is 10.7%.
What is the Percentage of Population Employed in Office & Administration in the United States?
Percentage of Population Employed in Office & Administration in the United States is 10.9%.