Cities with the Highest Percentage of Population Employed in Transportation in Oregon
RELATED REPORTS & OPTIONS
Transportation
Oregon
Compare Cities
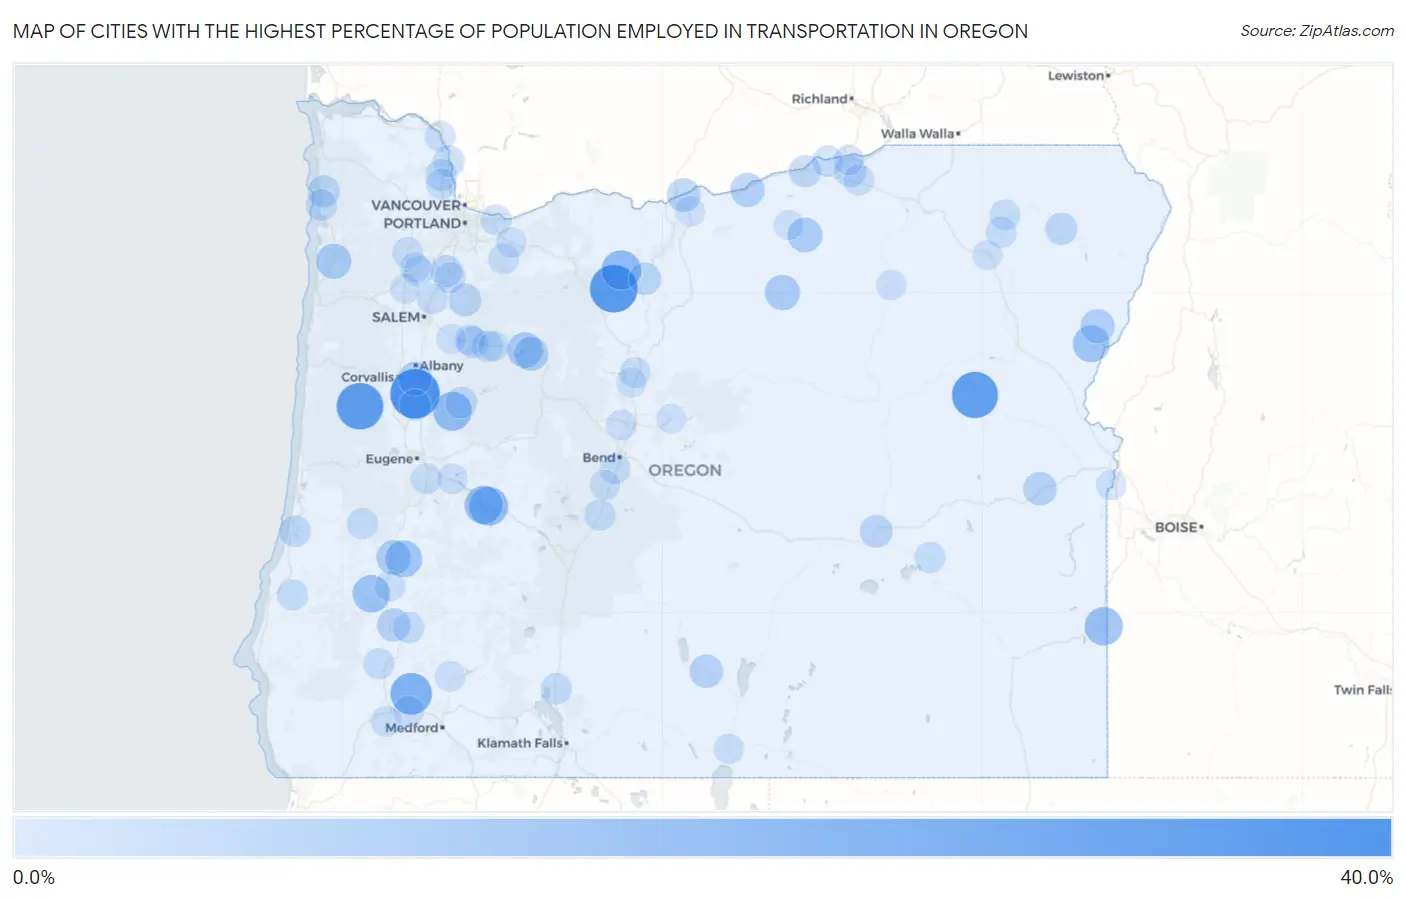
Map of Cities with the Highest Percentage of Population Employed in Transportation in Oregon
0.0%
40.0%
Cities with the Highest Percentage of Population Employed in Transportation in Oregon
| City | % Employed | vs State | vs National | |
| 1. | Shedd | 39.0% | 3.4%(+35.6)#1 | 3.8%(+35.2)#182 |
| 2. | Pine Grove | 35.7% | 3.4%(+32.3)#2 | 3.8%(+31.9)#227 |
| 3. | Marcola | 34.9% | 3.4%(+31.5)#3 | 3.8%(+31.1)#242 |
| 4. | Alsea | 34.1% | 3.4%(+30.7)#4 | 3.8%(+30.3)#259 |
| 5. | Unity | 33.3% | 3.4%(+29.9)#5 | 3.8%(+29.5)#279 |
| 6. | Wimer | 25.2% | 3.4%(+21.8)#6 | 3.8%(+21.4)#487 |
| 7. | Wedderburn | 24.2% | 3.4%(+20.8)#7 | 3.8%(+20.4)#515 |
| 8. | Jasper | 23.5% | 3.4%(+20.1)#8 | 3.8%(+19.7)#546 |
| 9. | Wamic | 21.4% | 3.4%(+18.0)#9 | 3.8%(+17.6)#680 |
| 10. | Crescent | 21.1% | 3.4%(+17.7)#10 | 3.8%(+17.3)#705 |
| 11. | Oakridge | 20.2% | 3.4%(+16.8)#11 | 3.8%(+16.4)#777 |
| 12. | Holley | 20.2% | 3.4%(+16.8)#12 | 3.8%(+16.4)#779 |
| 13. | Westfir | 19.7% | 3.4%(+16.3)#13 | 3.8%(+15.9)#832 |
| 14. | Jordan Valley | 19.5% | 3.4%(+16.1)#14 | 3.8%(+15.7)#842 |
| 15. | Elmira | 18.8% | 3.4%(+15.3)#15 | 3.8%(+14.9)#897 |
| 16. | Oregon Shores | 18.3% | 3.4%(+14.9)#16 | 3.8%(+14.5)#964 |
| 17. | Lookingglass | 17.9% | 3.4%(+14.5)#17 | 3.8%(+14.1)#1,012 |
| 18. | Richland | 17.1% | 3.4%(+13.7)#18 | 3.8%(+13.3)#1,111 |
| 19. | Fair Oaks | 16.9% | 3.4%(+13.5)#19 | 3.8%(+13.1)#1,132 |
| 20. | Detroit | 15.0% | 3.4%(+11.6)#20 | 3.8%(+11.2)#1,431 |
| 21. | Lonerock | 14.3% | 3.4%(+10.9)#21 | 3.8%(+10.5)#1,586 |
| 22. | Beaver | 14.1% | 3.4%(+10.7)#22 | 3.8%(+10.3)#1,618 |
| 23. | Lexington | 13.7% | 3.4%(+10.3)#23 | 3.8%(+9.91)#1,699 |
| 24. | Oakland | 13.5% | 3.4%(+10.1)#24 | 3.8%(+9.73)#1,742 |
| 25. | Saunders Lake | 13.5% | 3.4%(+10.1)#25 | 3.8%(+9.71)#1,743 |
| 26. | Idanha | 12.7% | 3.4%(+9.31)#26 | 3.8%(+8.91)#1,981 |
| 27. | Halfway | 12.7% | 3.4%(+9.28)#27 | 3.8%(+8.88)#1,990 |
| 28. | Arlington | 12.5% | 3.4%(+9.04)#28 | 3.8%(+8.64)#2,071 |
| 29. | Tangent | 11.8% | 3.4%(+8.41)#29 | 3.8%(+8.01)#2,297 |
| 30. | Rufus | 11.7% | 3.4%(+8.27)#30 | 3.8%(+7.87)#2,350 |
| 31. | Paisley | 11.5% | 3.4%(+8.12)#31 | 3.8%(+7.72)#2,411 |
| 32. | Beaver Marsh | 11.5% | 3.4%(+8.12)#32 | 3.8%(+7.72)#2,416 |
| 33. | Harper | 11.4% | 3.4%(+8.01)#33 | 3.8%(+7.61)#2,461 |
| 34. | Tri City | 11.4% | 3.4%(+7.98)#34 | 3.8%(+7.58)#2,476 |
| 35. | Scotts Mills | 10.7% | 3.4%(+7.26)#35 | 3.8%(+6.86)#2,762 |
| 36. | Burns | 10.2% | 3.4%(+6.82)#36 | 3.8%(+6.42)#3,000 |
| 37. | Maupin | 10.2% | 3.4%(+6.74)#37 | 3.8%(+6.34)#3,035 |
| 38. | Donald | 9.8% | 3.4%(+6.34)#38 | 3.8%(+5.93)#3,277 |
| 39. | Dilley | 9.6% | 3.4%(+6.22)#39 | 3.8%(+5.81)#3,360 |
| 40. | Bayside Gardens | 9.5% | 3.4%(+6.06)#40 | 3.8%(+5.66)#3,467 |
| 41. | Lostine | 9.5% | 3.4%(+6.05)#41 | 3.8%(+5.64)#3,477 |
| 42. | Boardman | 9.2% | 3.4%(+5.74)#42 | 3.8%(+5.34)#3,695 |
| 43. | Sweet Home | 8.9% | 3.4%(+5.53)#43 | 3.8%(+5.13)#3,869 |
| 44. | Warren | 8.9% | 3.4%(+5.51)#44 | 3.8%(+5.11)#3,887 |
| 45. | Hermiston | 8.8% | 3.4%(+5.42)#45 | 3.8%(+5.02)#3,955 |
| 46. | Lyons | 8.7% | 3.4%(+5.31)#46 | 3.8%(+4.90)#4,058 |
| 47. | Lakeside | 8.6% | 3.4%(+5.19)#47 | 3.8%(+4.78)#4,167 |
| 48. | Mill City | 8.5% | 3.4%(+5.06)#48 | 3.8%(+4.66)#4,285 |
| 49. | Halsey | 8.4% | 3.4%(+5.00)#49 | 3.8%(+4.59)#4,351 |
| 50. | Falcon Heights | 8.4% | 3.4%(+4.99)#50 | 3.8%(+4.59)#4,356 |
| 51. | Columbia City | 8.4% | 3.4%(+4.98)#51 | 3.8%(+4.58)#4,366 |
| 52. | Chiloquin | 8.3% | 3.4%(+4.92)#52 | 3.8%(+4.52)#4,411 |
| 53. | Pleasant Valley | 8.2% | 3.4%(+4.81)#53 | 3.8%(+4.41)#4,551 |
| 54. | Days Creek | 8.2% | 3.4%(+4.78)#54 | 3.8%(+4.38)#4,585 |
| 55. | Rockaway Beach | 8.2% | 3.4%(+4.78)#55 | 3.8%(+4.37)#4,591 |
| 56. | Boring | 8.1% | 3.4%(+4.68)#56 | 3.8%(+4.28)#4,680 |
| 57. | Irrigon | 7.9% | 3.4%(+4.51)#57 | 3.8%(+4.11)#4,832 |
| 58. | Hubbard | 7.8% | 3.4%(+4.42)#58 | 3.8%(+4.01)#4,922 |
| 59. | Coquille | 7.8% | 3.4%(+4.40)#59 | 3.8%(+4.00)#4,944 |
| 60. | Crane | 7.8% | 3.4%(+4.36)#60 | 3.8%(+3.96)#4,992 |
| 61. | La Pine | 7.7% | 3.4%(+4.31)#61 | 3.8%(+3.91)#5,039 |
| 62. | Elkton | 7.7% | 3.4%(+4.28)#62 | 3.8%(+3.88)#5,099 |
| 63. | Glendale | 7.6% | 3.4%(+4.17)#63 | 3.8%(+3.76)#5,223 |
| 64. | Troutdale | 7.4% | 3.4%(+3.98)#64 | 3.8%(+3.58)#5,450 |
| 65. | Imbler | 7.4% | 3.4%(+3.98)#65 | 3.8%(+3.57)#5,460 |
| 66. | Elgin | 7.3% | 3.4%(+3.93)#66 | 3.8%(+3.53)#5,507 |
| 67. | Stanfield | 7.3% | 3.4%(+3.91)#67 | 3.8%(+3.51)#5,532 |
| 68. | Creswell | 7.3% | 3.4%(+3.91)#68 | 3.8%(+3.50)#5,539 |
| 69. | Rogue River | 7.3% | 3.4%(+3.90)#69 | 3.8%(+3.50)#5,544 |
| 70. | Mehama | 7.3% | 3.4%(+3.90)#70 | 3.8%(+3.50)#5,548 |
| 71. | Yamhill | 7.3% | 3.4%(+3.88)#71 | 3.8%(+3.47)#5,580 |
| 72. | Deschutes River Woods | 7.2% | 3.4%(+3.81)#72 | 3.8%(+3.41)#5,680 |
| 73. | Prescott | 7.1% | 3.4%(+3.73)#73 | 3.8%(+3.33)#5,799 |
| 74. | Estacada | 7.1% | 3.4%(+3.69)#74 | 3.8%(+3.29)#5,848 |
| 75. | New Hope | 7.1% | 3.4%(+3.65)#75 | 3.8%(+3.25)#5,890 |
| 76. | Brooks | 7.1% | 3.4%(+3.65)#76 | 3.8%(+3.25)#5,892 |
| 77. | Dayton | 7.1% | 3.4%(+3.64)#77 | 3.8%(+3.23)#5,911 |
| 78. | Scappoose | 7.0% | 3.4%(+3.57)#78 | 3.8%(+3.17)#5,981 |
| 79. | Metolius | 6.9% | 3.4%(+3.47)#79 | 3.8%(+3.07)#6,136 |
| 80. | Gates | 6.8% | 3.4%(+3.40)#80 | 3.8%(+3.00)#6,241 |
| 81. | Trail | 6.8% | 3.4%(+3.40)#81 | 3.8%(+2.99)#6,254 |
| 82. | Lowell | 6.8% | 3.4%(+3.37)#82 | 3.8%(+2.97)#6,291 |
| 83. | Juniper Canyon | 6.8% | 3.4%(+3.35)#83 | 3.8%(+2.95)#6,315 |
| 84. | Lafayette | 6.7% | 3.4%(+3.32)#84 | 3.8%(+2.92)#6,352 |
| 85. | Roseburg | 6.7% | 3.4%(+3.32)#85 | 3.8%(+2.92)#6,366 |
| 86. | Sunriver | 6.7% | 3.4%(+3.24)#86 | 3.8%(+2.84)#6,505 |
| 87. | Eagle Crest | 6.6% | 3.4%(+3.23)#87 | 3.8%(+2.82)#6,518 |
| 88. | Umatilla | 6.6% | 3.4%(+3.22)#88 | 3.8%(+2.82)#6,529 |
| 89. | Ukiah | 6.5% | 3.4%(+3.11)#89 | 3.8%(+2.70)#6,697 |
| 90. | Sandy | 6.4% | 3.4%(+2.94)#90 | 3.8%(+2.54)#6,963 |
| 91. | Nyssa | 6.3% | 3.4%(+2.93)#91 | 3.8%(+2.52)#6,997 |
| 92. | Lakeview | 6.3% | 3.4%(+2.90)#92 | 3.8%(+2.50)#7,042 |
| 93. | Amity | 6.3% | 3.4%(+2.88)#93 | 3.8%(+2.48)#7,087 |
| 94. | Wasco | 6.2% | 3.4%(+2.84)#94 | 3.8%(+2.43)#7,155 |
| 95. | Cheshire | 6.2% | 3.4%(+2.84)#95 | 3.8%(+2.43)#7,163 |
| 96. | Stayton | 6.2% | 3.4%(+2.78)#96 | 3.8%(+2.37)#7,267 |
| 97. | Culver | 6.1% | 3.4%(+2.73)#97 | 3.8%(+2.33)#7,361 |
| 98. | La Grande | 6.1% | 3.4%(+2.67)#98 | 3.8%(+2.27)#7,452 |
| 99. | Prineville | 6.1% | 3.4%(+2.65)#99 | 3.8%(+2.24)#7,504 |
| 100. | Ione | 6.0% | 3.4%(+2.63)#100 | 3.8%(+2.22)#7,574 |
Common Questions
What are the Top 10 Cities with the Highest Percentage of Population Employed in Transportation in Oregon?
Top 10 Cities with the Highest Percentage of Population Employed in Transportation in Oregon are:
#1
39.0%
#2
35.7%
#3
34.1%
#4
33.3%
#5
25.2%
#6
21.4%
#7
20.2%
#8
20.2%
#9
19.7%
#10
19.5%
What city has the Highest Percentage of Population Employed in Transportation in Oregon?
Shedd has the Highest Percentage of Population Employed in Transportation in Oregon with 39.0%.
What is the Percentage of Population Employed in Transportation in the State of Oregon?
Percentage of Population Employed in Transportation in Oregon is 3.4%.
What is the Percentage of Population Employed in Transportation in the United States?
Percentage of Population Employed in Transportation in the United States is 3.8%.