Sodaville, OR
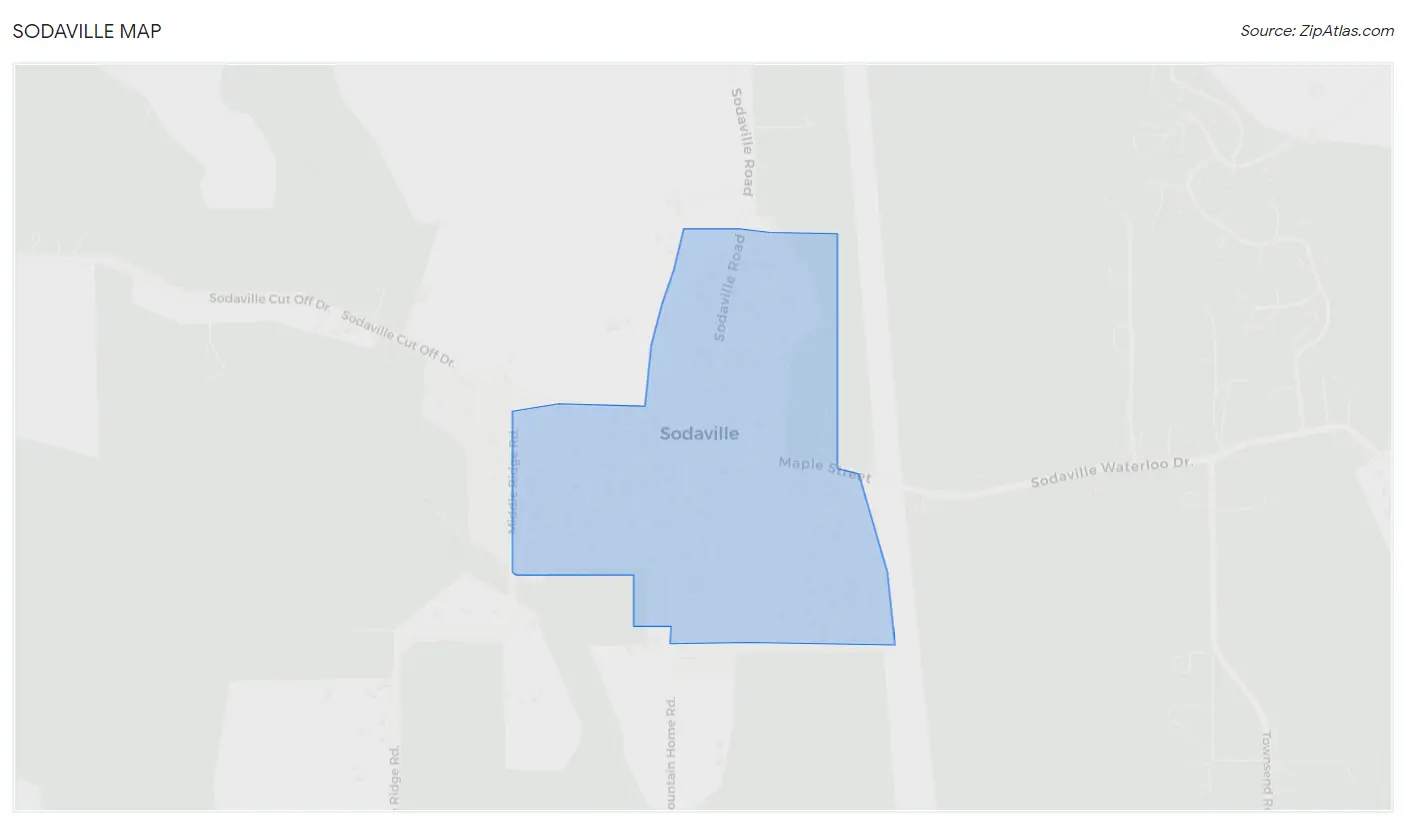
Sodaville Map
Sodaville Overview
364
TOTAL POPULATION
170
MALE POPULATION
194
FEMALE POPULATION
87.63
MALES / 100 FEMALES
114.12
FEMALES / 100 MALES
45.7
MEDIAN AGE
2.8
AVG FAMILY SIZE
2.6
AVG HOUSEHOLD SIZE
$28,423
PER CAPITA INCOME
$54,583
AVG FAMILY INCOME
$53,958
AVG HOUSEHOLD INCOME
45.6%
WAGE / INCOME GAP [ % ]
54.4¢/ $1
WAGE / INCOME GAP [ $ ]
0.41
INEQUALITY / GINI INDEX
152
LABOR FORCE [ PEOPLE ]
50.7%
PERCENT IN LABOR FORCE
5.3%
UNEMPLOYMENT RATE
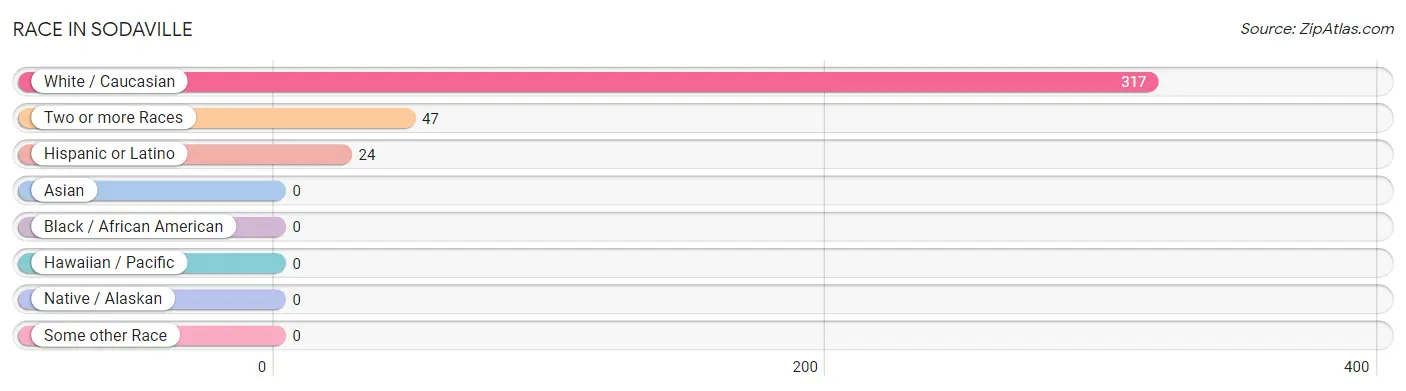
Race in Sodaville
The most populous races in Sodaville are White / Caucasian (317 | 87.1%), Two or more Races (47 | 12.9%), and Hispanic or Latino (24 | 6.6%).
| Race | # Population | % Population |
| Asian | 0 | 0.0% |
| Black / African American | 0 | 0.0% |
| Hawaiian / Pacific | 0 | 0.0% |
| Hispanic or Latino | 24 | 6.6% |
| Native / Alaskan | 0 | 0.0% |
| White / Caucasian | 317 | 87.1% |
| Two or more Races | 47 | 12.9% |
| Some other Race | 0 | 0.0% |
| Total | 364 | 100.0% |
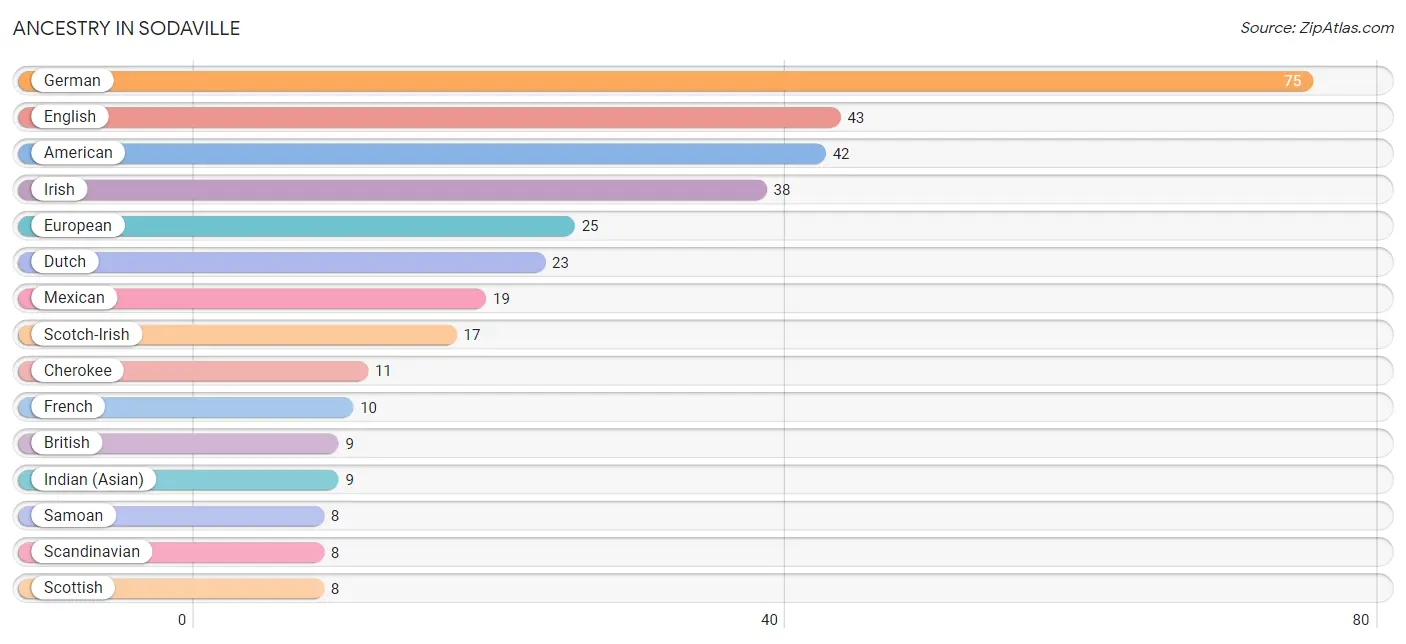
Ancestry in Sodaville
The most populous ancestries reported in Sodaville are German (75 | 20.6%), English (43 | 11.8%), American (42 | 11.5%), Irish (38 | 10.4%), and European (25 | 6.9%), together accounting for 61.3% of all Sodaville residents.
| Ancestry | # Population | % Population |
| American | 42 | 11.5% |
| Austrian | 6 | 1.7% |
| Bolivian | 1 | 0.3% |
| British | 9 | 2.5% |
| Canadian | 3 | 0.8% |
| Cherokee | 11 | 3.0% |
| Chippewa | 1 | 0.3% |
| Dutch | 23 | 6.3% |
| English | 43 | 11.8% |
| European | 25 | 6.9% |
| French | 10 | 2.8% |
| German | 75 | 20.6% |
| Indian (Asian) | 9 | 2.5% |
| Irish | 38 | 10.4% |
| Iroquois | 4 | 1.1% |
| Italian | 4 | 1.1% |
| Korean | 6 | 1.7% |
| Mexican | 19 | 5.2% |
| Norwegian | 3 | 0.8% |
| Samoan | 8 | 2.2% |
| Scandinavian | 8 | 2.2% |
| Scotch-Irish | 17 | 4.7% |
| Scottish | 8 | 2.2% |
| South American | 1 | 0.3% |
| Spanish | 4 | 1.1% |
| Swedish | 8 | 2.2% |
| Swiss | 2 | 0.5% |
| Thai | 2 | 0.5% |
| Welsh | 5 | 1.4% | View All 29 Rows |
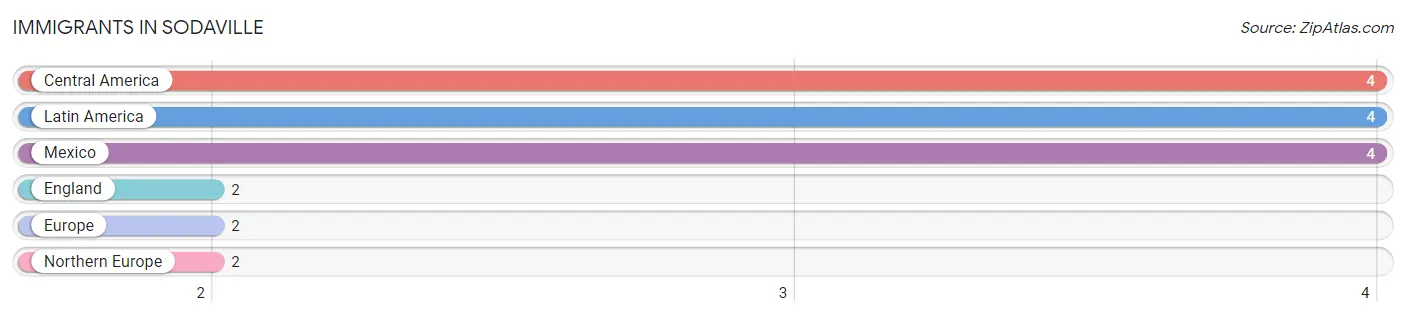
Immigrants in Sodaville
The most numerous immigrant groups reported in Sodaville came from Central America (4 | 1.1%), Latin America (4 | 1.1%), Mexico (4 | 1.1%), England (2 | 0.5%), and Europe (2 | 0.5%), together accounting for 4.4% of all Sodaville residents.
| Immigration Origin | # Population | % Population |
| Central America | 4 | 1.1% |
| England | 2 | 0.5% |
| Europe | 2 | 0.5% |
| Latin America | 4 | 1.1% |
| Mexico | 4 | 1.1% |
| Northern Europe | 2 | 0.5% | View All 6 Rows |
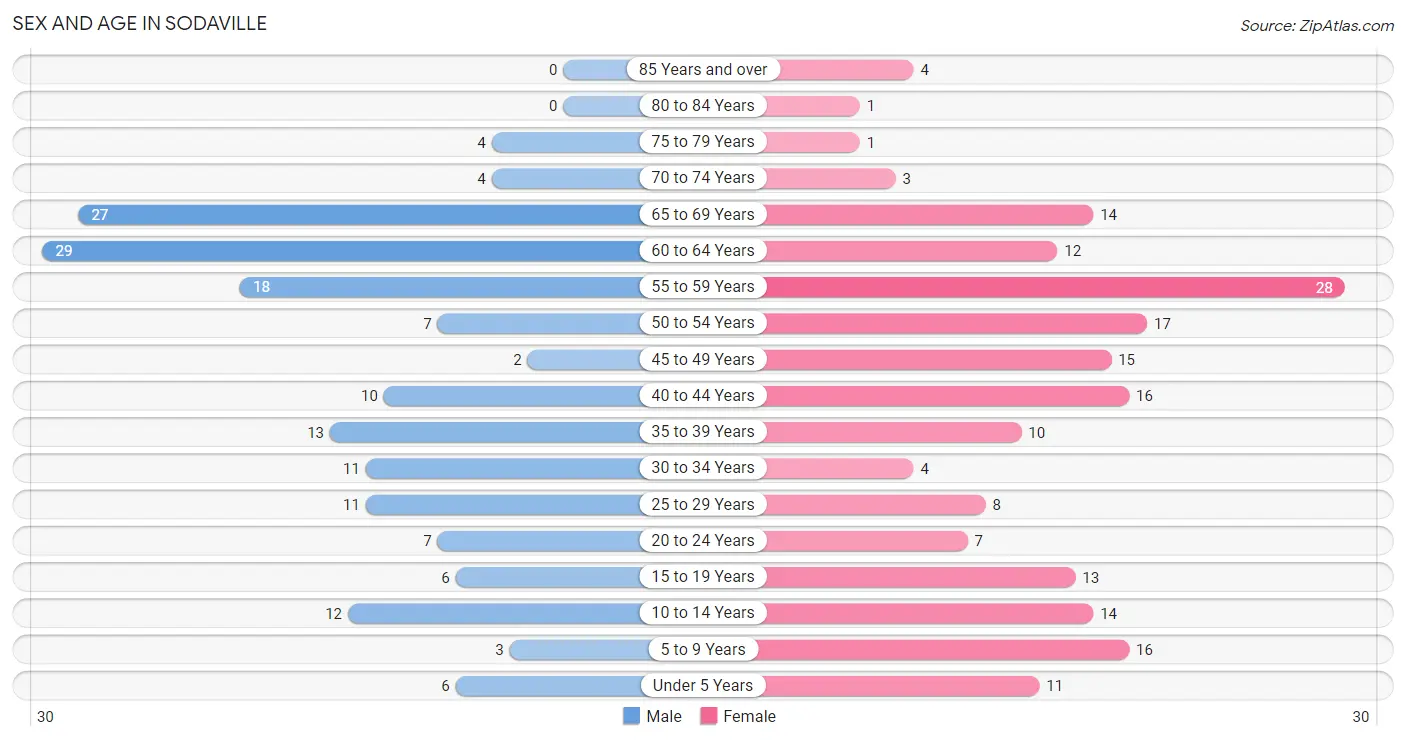
Sex and Age in Sodaville
Sex and Age in Sodaville
The most populous age groups in Sodaville are 60 to 64 Years (29 | 17.1%) for men and 55 to 59 Years (28 | 14.4%) for women.
| Age Bracket | Male | Female |
| Under 5 Years | 6 (3.5%) | 11 (5.7%) |
| 5 to 9 Years | 3 (1.8%) | 16 (8.3%) |
| 10 to 14 Years | 12 (7.1%) | 14 (7.2%) |
| 15 to 19 Years | 6 (3.5%) | 13 (6.7%) |
| 20 to 24 Years | 7 (4.1%) | 7 (3.6%) |
| 25 to 29 Years | 11 (6.5%) | 8 (4.1%) |
| 30 to 34 Years | 11 (6.5%) | 4 (2.1%) |
| 35 to 39 Years | 13 (7.6%) | 10 (5.1%) |
| 40 to 44 Years | 10 (5.9%) | 16 (8.3%) |
| 45 to 49 Years | 2 (1.2%) | 15 (7.7%) |
| 50 to 54 Years | 7 (4.1%) | 17 (8.8%) |
| 55 to 59 Years | 18 (10.6%) | 28 (14.4%) |
| 60 to 64 Years | 29 (17.1%) | 12 (6.2%) |
| 65 to 69 Years | 27 (15.9%) | 14 (7.2%) |
| 70 to 74 Years | 4 (2.4%) | 3 (1.5%) |
| 75 to 79 Years | 4 (2.4%) | 1 (0.5%) |
| 80 to 84 Years | 0 (0.0%) | 1 (0.5%) |
| 85 Years and over | 0 (0.0%) | 4 (2.1%) |
| Total | 170 (100.0%) | 194 (100.0%) |
Families and Households in Sodaville
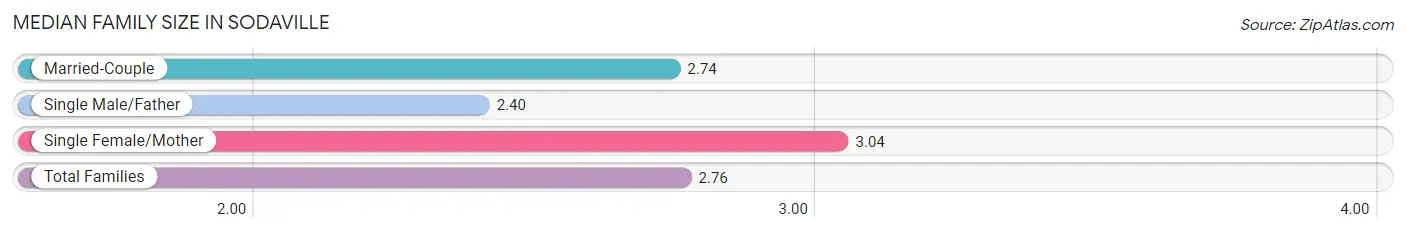
Median Family Size in Sodaville
The median family size in Sodaville is 2.76 persons per family, with single female/mother families (25 | 21.9%) accounting for the largest median family size of 3.04 persons per family. On the other hand, single male/father families (15 | 13.2%) represent the smallest median family size with 2.40 persons per family.
| Family Type | # Families | Family Size |
| Married-Couple | 74 (64.9%) | 2.74 |
| Single Male/Father | 15 (13.2%) | 2.40 |
| Single Female/Mother | 25 (21.9%) | 3.04 |
| Total Families | 114 (100.0%) | 2.76 |
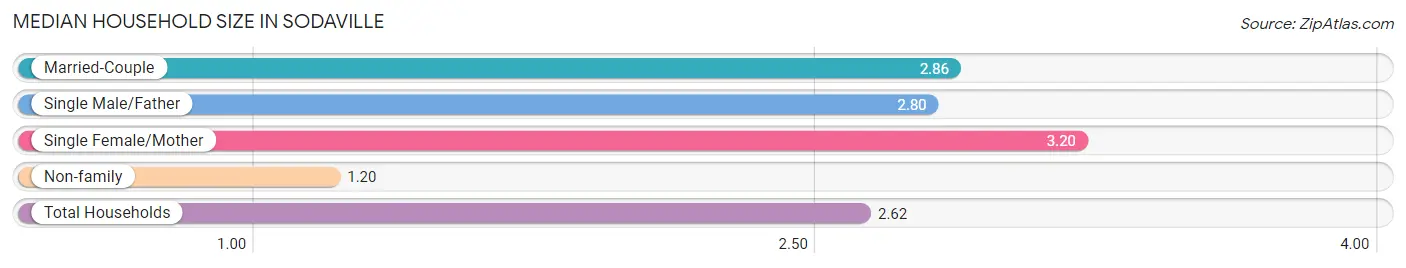
Median Household Size in Sodaville
The median household size in Sodaville is 2.62 persons per household, with single female/mother households (25 | 18.0%) accounting for the largest median household size of 3.2 persons per household. non-family households (25 | 18.0%) represent the smallest median household size with 1.20 persons per household.
| Household Type | # Households | Household Size |
| Married-Couple | 74 (53.2%) | 2.86 |
| Single Male/Father | 15 (10.8%) | 2.80 |
| Single Female/Mother | 25 (18.0%) | 3.20 |
| Non-family | 25 (18.0%) | 1.20 |
| Total Households | 139 (100.0%) | 2.62 |
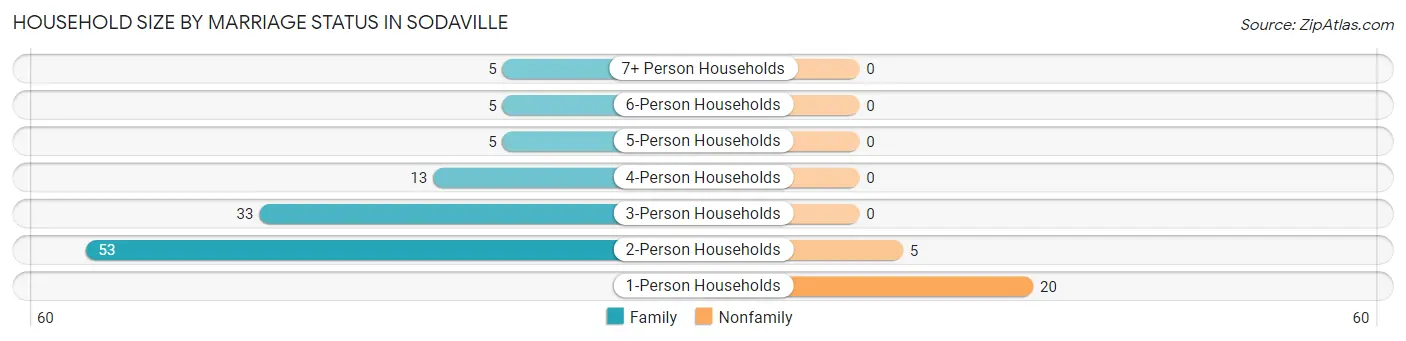
Household Size by Marriage Status in Sodaville
Out of a total of 139 households in Sodaville, 114 (82.0%) are family households, while 25 (18.0%) are nonfamily households. The most numerous type of family households are 2-person households, comprising 53, and the most common type of nonfamily households are 1-person households, comprising 20.
| Household Size | Family Households | Nonfamily Households |
| 1-Person Households | - | 20 (14.4%) |
| 2-Person Households | 53 (38.1%) | 5 (3.6%) |
| 3-Person Households | 33 (23.7%) | 0 (0.0%) |
| 4-Person Households | 13 (9.3%) | 0 (0.0%) |
| 5-Person Households | 5 (3.6%) | 0 (0.0%) |
| 6-Person Households | 5 (3.6%) | 0 (0.0%) |
| 7+ Person Households | 5 (3.6%) | 0 (0.0%) |
| Total | 114 (82.0%) | 25 (18.0%) |
Female Fertility in Sodaville
Fertility by Age in Sodaville
Average fertility rate in Sodaville is 13.0 births per 1,000 women. Women in the age bracket of 35 to 50 years have the highest fertility rate with 22.0 births per 1,000 women. Women in the age bracket of 35 to 50 years acount for 100.0% of all women with births.
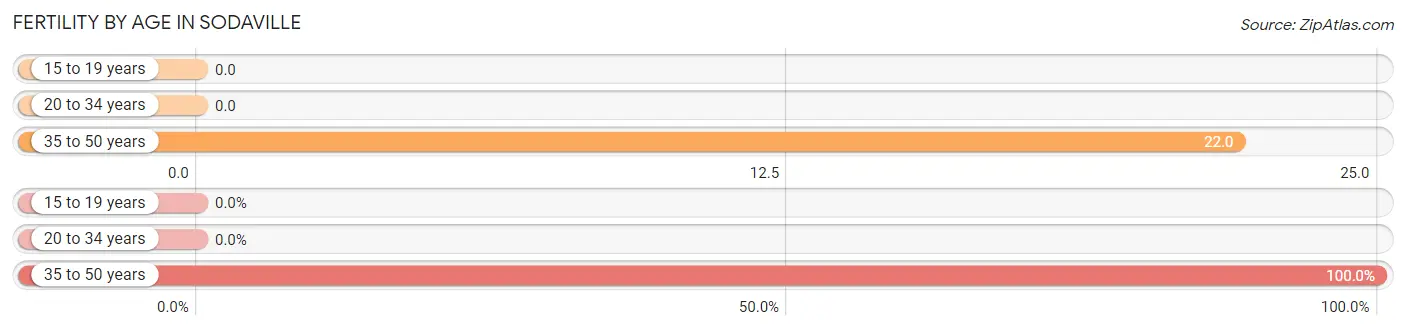
| Age Bracket | Women with Births | Births / 1,000 Women |
| 15 to 19 years | 0 (0.0%) | 0.0 |
| 20 to 34 years | 0 (0.0%) | 0.0 |
| 35 to 50 years | 1 (100.0%) | 22.0 |
| Total | 1 (100.0%) | 13.0 |
Fertility by Age by Marriage Status in Sodaville
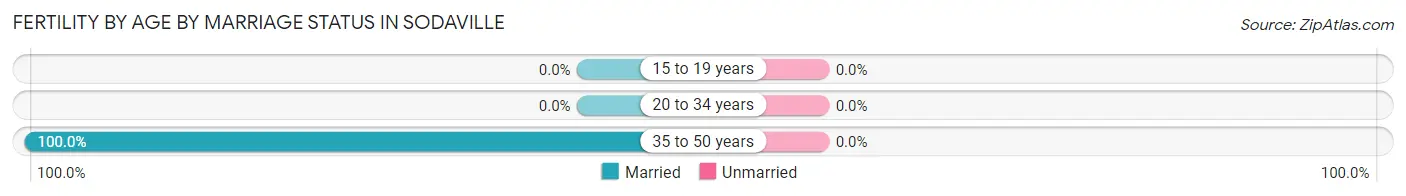
| Age Bracket | Married | Unmarried |
| 15 to 19 years | 0 (0.0%) | 0 (0.0%) |
| 20 to 34 years | 0 (0.0%) | 0 (0.0%) |
| 35 to 50 years | 1 (100.0%) | 0 (0.0%) |
| Total | 1 (100.0%) | 0 (0.0%) |
Fertility by Education in Sodaville
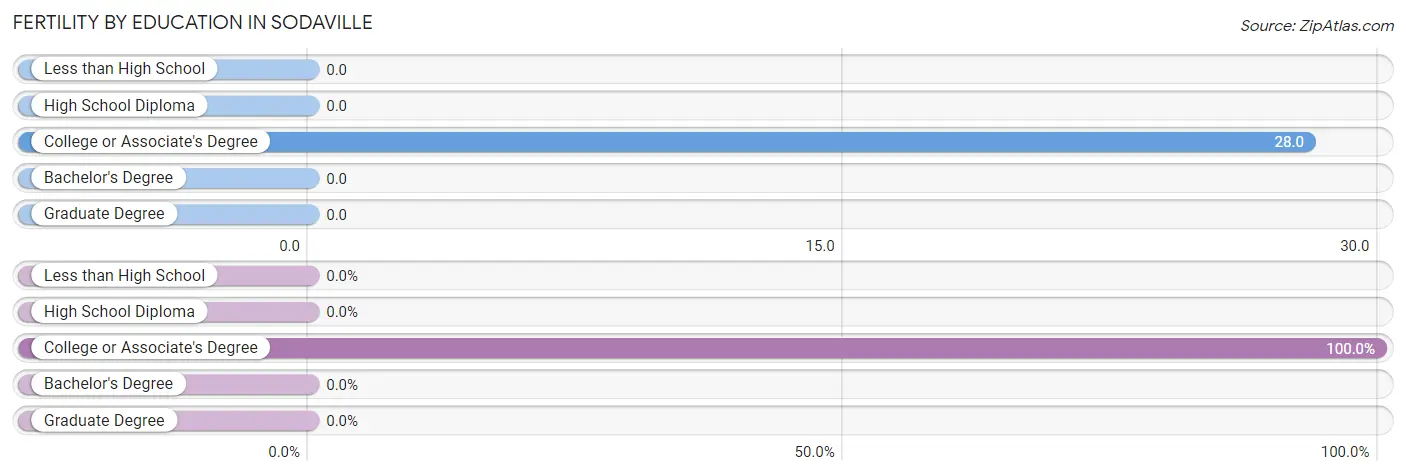
| Educational Attainment | Women with Births | Births / 1,000 Women |
| Less than High School | 0 (0.0%) | 0.0 |
| High School Diploma | 0 (0.0%) | 0.0 |
| College or Associate's Degree | 1 (100.0%) | 28.0 |
| Bachelor's Degree | 0 (0.0%) | 0.0 |
| Graduate Degree | 0 (0.0%) | 0.0 |
| Total | 1 (100.0%) | 13.0 |
Fertility by Education by Marriage Status in Sodaville
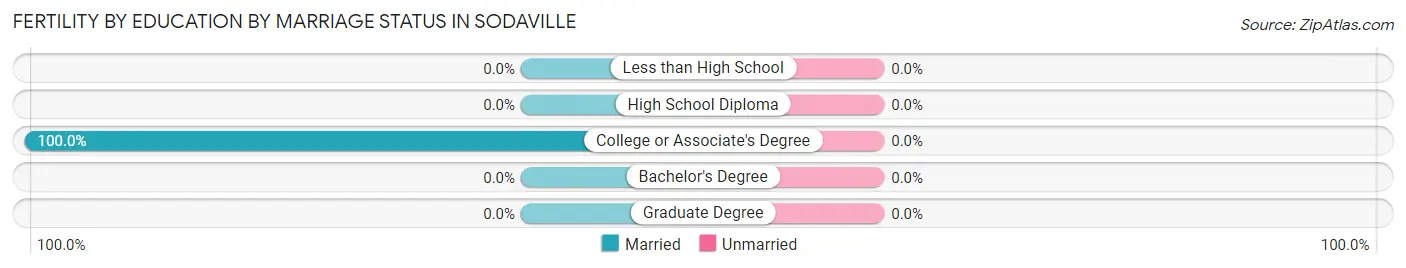
| Educational Attainment | Married | Unmarried |
| Less than High School | 0 (0.0%) | 0 (0.0%) |
| High School Diploma | 0 (0.0%) | 0 (0.0%) |
| College or Associate's Degree | 1 (100.0%) | 0 (0.0%) |
| Bachelor's Degree | 0 (0.0%) | 0 (0.0%) |
| Graduate Degree | 0 (0.0%) | 0 (0.0%) |
| Total | 1 (100.0%) | 0 (0.0%) |
Income in Sodaville
Income Overview in Sodaville
Per Capita Income in Sodaville is $28,423, while median incomes of families and households are $54,583 and $53,958 respectively.
| Characteristic | Number | Measure |
| Per Capita Income | 364 | $28,423 |
| Median Family Income | 114 | $54,583 |
| Mean Family Income | 114 | $77,825 |
| Median Household Income | 139 | $53,958 |
| Mean Household Income | 139 | $73,459 |
| Income Deficit | 114 | $0 |
| Wage / Income Gap (%) | 364 | 45.58% |
| Wage / Income Gap ($) | 364 | 54.42¢ per $1 |
| Gini / Inequality Index | 364 | 0.41 |
Earnings by Sex in Sodaville
Average Earnings in Sodaville are $33,929, $53,250 for men and $28,977 for women, a difference of 45.6%.
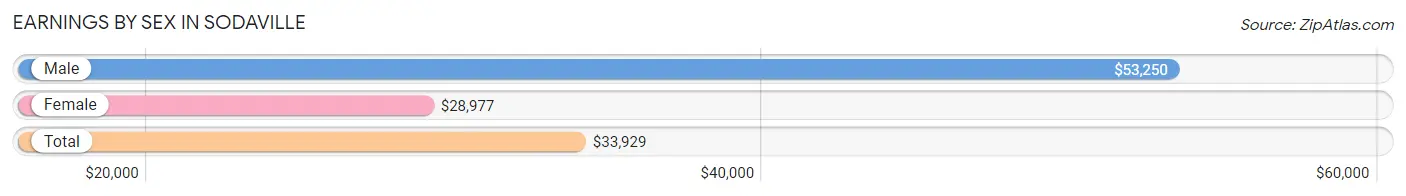
| Sex | Number | Average Earnings |
| Male | 83 (50.0%) | $53,250 |
| Female | 83 (50.0%) | $28,977 |
| Total | 166 (100.0%) | $33,929 |
Earnings by Sex by Income Bracket in Sodaville
The most common earnings brackets in Sodaville are $75,000 to $99,999 for men (14 | 16.9%) and $25,000 to $29,999 for women (15 | 18.1%).
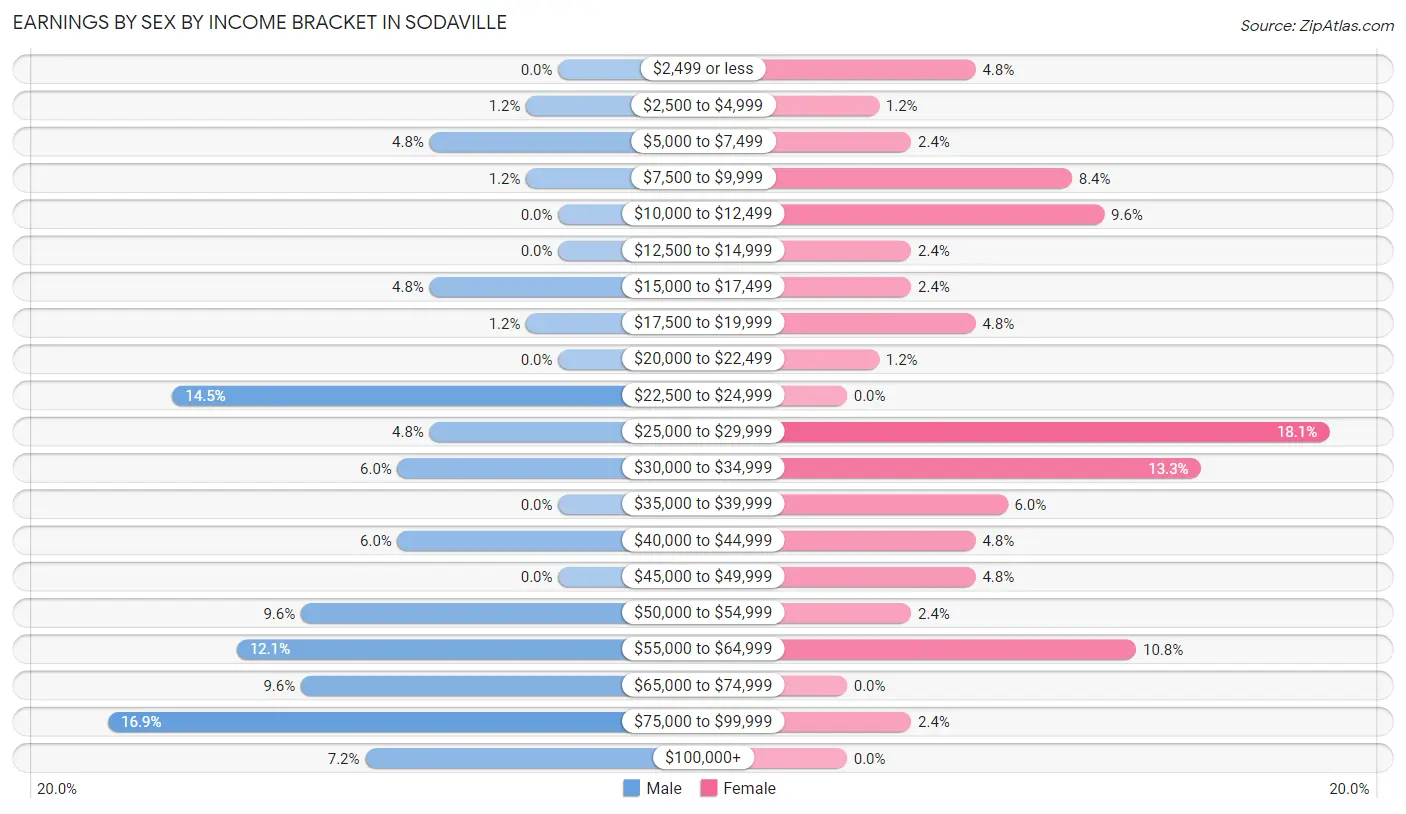
| Income | Male | Female |
| $2,499 or less | 0 (0.0%) | 4 (4.8%) |
| $2,500 to $4,999 | 1 (1.2%) | 1 (1.2%) |
| $5,000 to $7,499 | 4 (4.8%) | 2 (2.4%) |
| $7,500 to $9,999 | 1 (1.2%) | 7 (8.4%) |
| $10,000 to $12,499 | 0 (0.0%) | 8 (9.6%) |
| $12,500 to $14,999 | 0 (0.0%) | 2 (2.4%) |
| $15,000 to $17,499 | 4 (4.8%) | 2 (2.4%) |
| $17,500 to $19,999 | 1 (1.2%) | 4 (4.8%) |
| $20,000 to $22,499 | 0 (0.0%) | 1 (1.2%) |
| $22,500 to $24,999 | 12 (14.5%) | 0 (0.0%) |
| $25,000 to $29,999 | 4 (4.8%) | 15 (18.1%) |
| $30,000 to $34,999 | 5 (6.0%) | 11 (13.3%) |
| $35,000 to $39,999 | 0 (0.0%) | 5 (6.0%) |
| $40,000 to $44,999 | 5 (6.0%) | 4 (4.8%) |
| $45,000 to $49,999 | 0 (0.0%) | 4 (4.8%) |
| $50,000 to $54,999 | 8 (9.6%) | 2 (2.4%) |
| $55,000 to $64,999 | 10 (12.0%) | 9 (10.8%) |
| $65,000 to $74,999 | 8 (9.6%) | 0 (0.0%) |
| $75,000 to $99,999 | 14 (16.9%) | 2 (2.4%) |
| $100,000+ | 6 (7.2%) | 0 (0.0%) |
| Total | 83 (100.0%) | 83 (100.0%) |
Earnings by Sex by Educational Attainment in Sodaville
Average earnings in Sodaville are $54,750 for men and $32,614 for women, a difference of 40.4%. Men with an educational attainment of less than high school enjoy the highest average annual earnings of $98,500, while those with high school diploma education earn the least with $41,250. Women with an educational attainment of college or associate's degree earn the most with the average annual earnings of $34,107, while those with high school diploma education have the smallest earnings of $29,375.
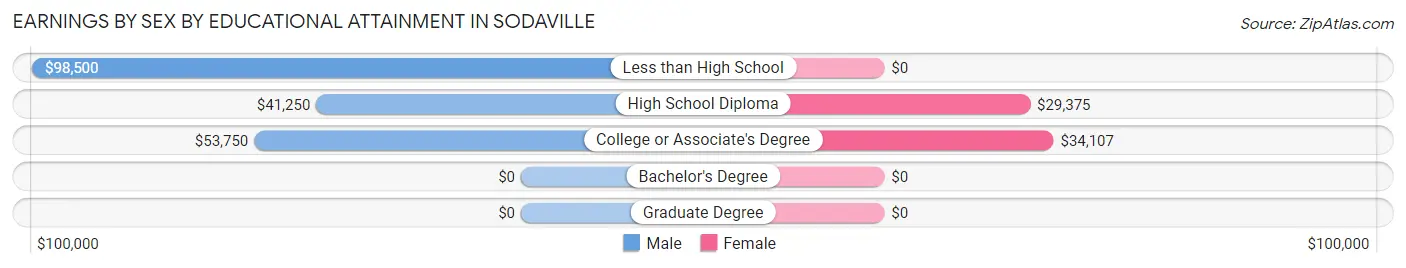
| Educational Attainment | Male Income | Female Income |
| Less than High School | $98,500 | $0 |
| High School Diploma | $41,250 | $29,375 |
| College or Associate's Degree | $53,750 | $34,107 |
| Bachelor's Degree | - | - |
| Graduate Degree | - | - |
| Total | $54,750 | $32,614 |
Family Income in Sodaville
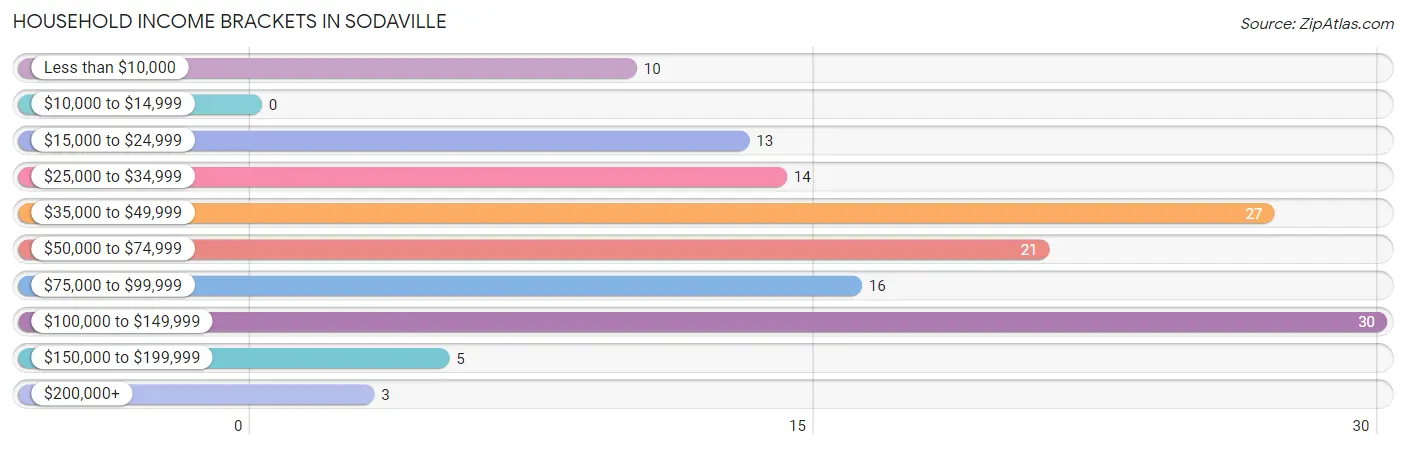
Family Income Brackets in Sodaville
According to the Sodaville family income data, there are 30 families falling into the $35,000 to $49,999 income range, which is the most common income bracket and makes up 26.3% of all families. Conversely, the $10,000 to $14,999 income bracket is the least frequent group with only 2 families (1.8%) belonging to this category.
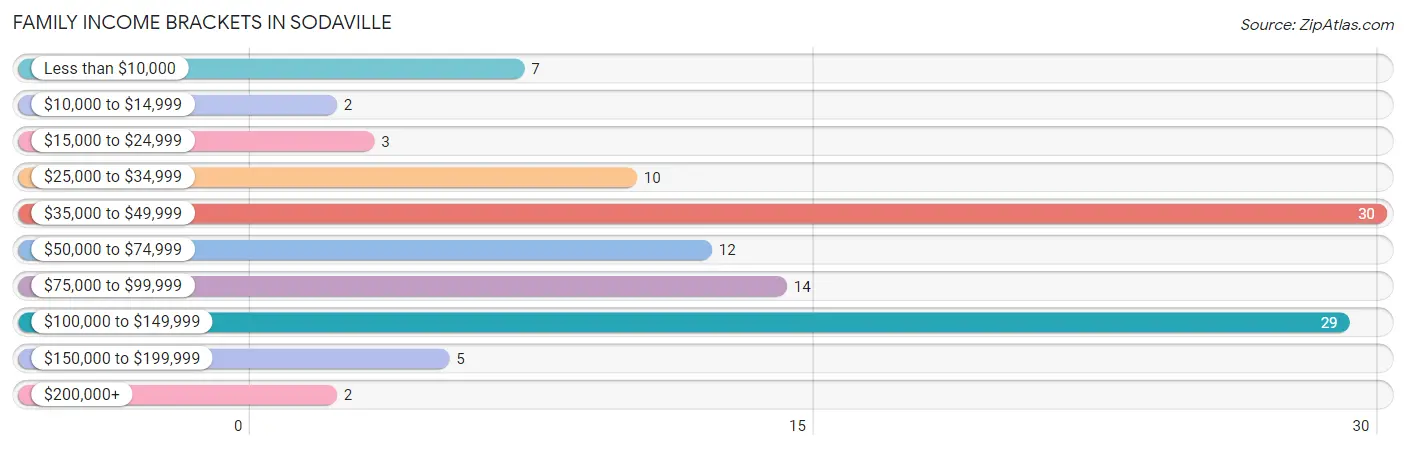
| Income Bracket | # Families | % Families |
| Less than $10,000 | 7 | 6.1% |
| $10,000 to $14,999 | 2 | 1.8% |
| $15,000 to $24,999 | 3 | 2.6% |
| $25,000 to $34,999 | 10 | 8.8% |
| $35,000 to $49,999 | 30 | 26.3% |
| $50,000 to $74,999 | 12 | 10.5% |
| $75,000 to $99,999 | 14 | 12.3% |
| $100,000 to $149,999 | 29 | 25.4% |
| $150,000 to $199,999 | 5 | 4.4% |
| $200,000+ | 2 | 1.8% |
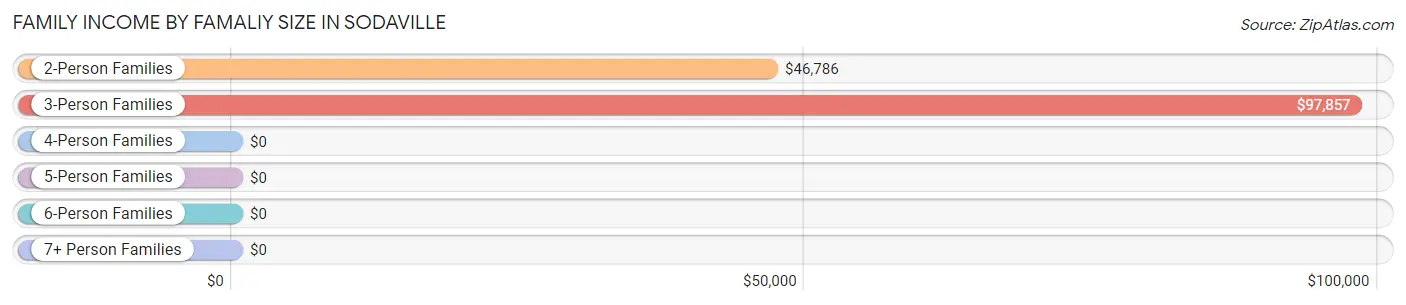
Family Income by Famaliy Size in Sodaville
3-person families (22 | 19.3%) account for the highest median family income in Sodaville with $97,857 per family, while 3-person families (22 | 19.3%) have the highest median income of $32,619 per family member.
| Income Bracket | # Families | Median Income |
| 2-Person Families | 66 (57.9%) | $46,786 |
| 3-Person Families | 22 (19.3%) | $97,857 |
| 4-Person Families | 12 (10.5%) | $0 |
| 5-Person Families | 6 (5.3%) | $0 |
| 6-Person Families | 5 (4.4%) | $0 |
| 7+ Person Families | 3 (2.6%) | $0 |
| Total | 114 (100.0%) | $54,583 |
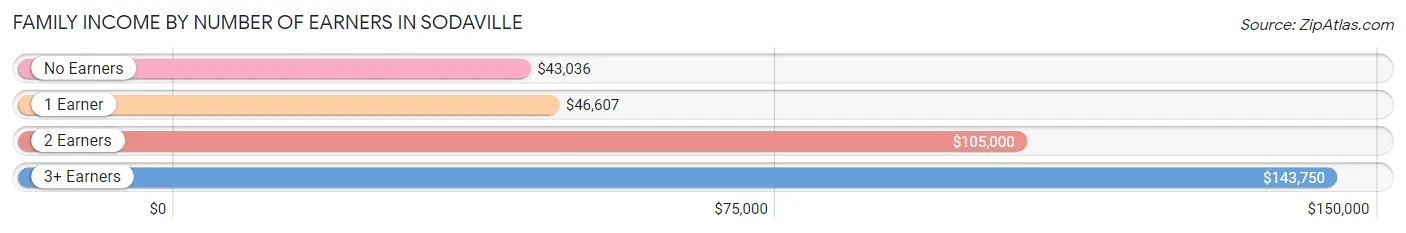
Family Income by Number of Earners in Sodaville
The median family income in Sodaville is $54,583, with families comprising 3+ earners (10) having the highest median family income of $143,750, while families with no earners (29) have the lowest median family income of $43,036, accounting for 8.8% and 25.4% of families, respectively.
| Number of Earners | # Families | Median Income |
| No Earners | 29 (25.4%) | $43,036 |
| 1 Earner | 41 (36.0%) | $46,607 |
| 2 Earners | 34 (29.8%) | $105,000 |
| 3+ Earners | 10 (8.8%) | $143,750 |
| Total | 114 (100.0%) | $54,583 |
Household Income in Sodaville
Household Income Brackets in Sodaville
With 30 households falling in the category, the $100,000 to $149,999 income range is the most frequent in Sodaville, accounting for 21.6% of all households.
| Income Bracket | # Households | % Households |
| Less than $10,000 | 10 | 7.2% |
| $10,000 to $14,999 | 0 | 0.0% |
| $15,000 to $24,999 | 13 | 9.4% |
| $25,000 to $34,999 | 14 | 10.1% |
| $35,000 to $49,999 | 27 | 19.4% |
| $50,000 to $74,999 | 21 | 15.1% |
| $75,000 to $99,999 | 16 | 11.5% |
| $100,000 to $149,999 | 30 | 21.6% |
| $150,000 to $199,999 | 5 | 3.6% |
| $200,000+ | 3 | 2.2% |
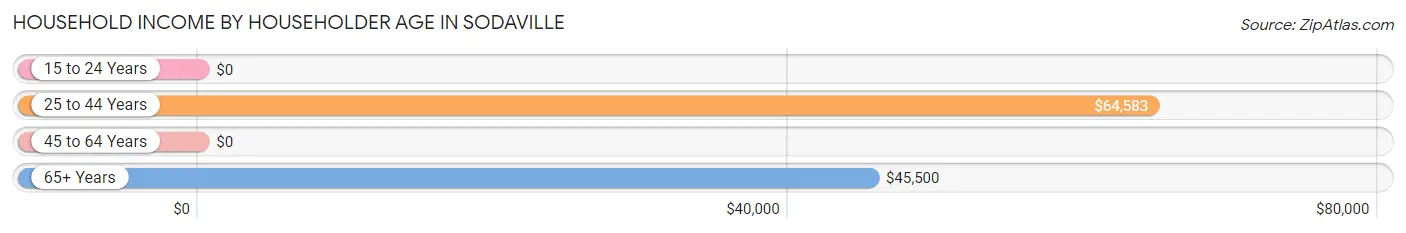
Household Income by Householder Age in Sodaville
The median household income in Sodaville is $53,958, with the highest median household income of $64,583 found in the 25 to 44 years age bracket for the primary householder. A total of 40 households (28.8%) fall into this category. Meanwhile, the 15 to 24 years age bracket for the primary householder has the lowest median household income of $0, with 3 households (2.2%) in this group.
| Income Bracket | # Households | Median Income |
| 15 to 24 Years | 3 (2.2%) | $0 |
| 25 to 44 Years | 40 (28.8%) | $64,583 |
| 45 to 64 Years | 54 (38.9%) | $0 |
| 65+ Years | 42 (30.2%) | $45,500 |
| Total | 139 (100.0%) | $53,958 |
Poverty in Sodaville
Income Below Poverty by Sex and Age in Sodaville
With 16.0% poverty level for males and 12.5% for females among the residents of Sodaville, 12 to 14 year old males and 15 year old females are the most vulnerable to poverty, with 3 males (50.0%) and 1 females (100.0%) in their respective age groups living below the poverty level.
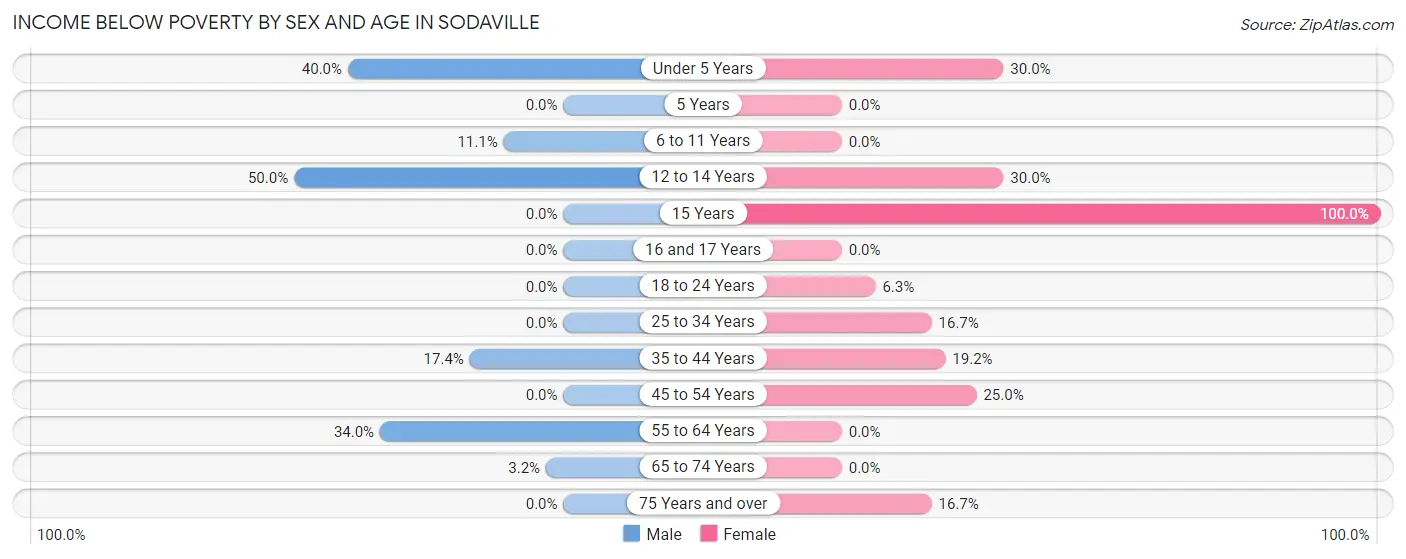
| Age Bracket | Male | Female |
| Under 5 Years | 2 (40.0%) | 3 (30.0%) |
| 5 Years | 0 (0.0%) | 0 (0.0%) |
| 6 to 11 Years | 1 (11.1%) | 0 (0.0%) |
| 12 to 14 Years | 3 (50.0%) | 3 (30.0%) |
| 15 Years | 0 (0.0%) | 1 (100.0%) |
| 16 and 17 Years | 0 (0.0%) | 0 (0.0%) |
| 18 to 24 Years | 0 (0.0%) | 1 (6.2%) |
| 25 to 34 Years | 0 (0.0%) | 2 (16.7%) |
| 35 to 44 Years | 4 (17.4%) | 5 (19.2%) |
| 45 to 54 Years | 0 (0.0%) | 8 (25.0%) |
| 55 to 64 Years | 16 (34.0%) | 0 (0.0%) |
| 65 to 74 Years | 1 (3.2%) | 0 (0.0%) |
| 75 Years and over | 0 (0.0%) | 1 (16.7%) |
| Total | 27 (16.0%) | 24 (12.5%) |
Income Above Poverty by Sex and Age in Sodaville
According to the poverty statistics in Sodaville, males aged 15 years and females aged 6 to 11 years are the age groups that are most secure financially, with 100.0% of males and 100.0% of females in these age groups living above the poverty line.
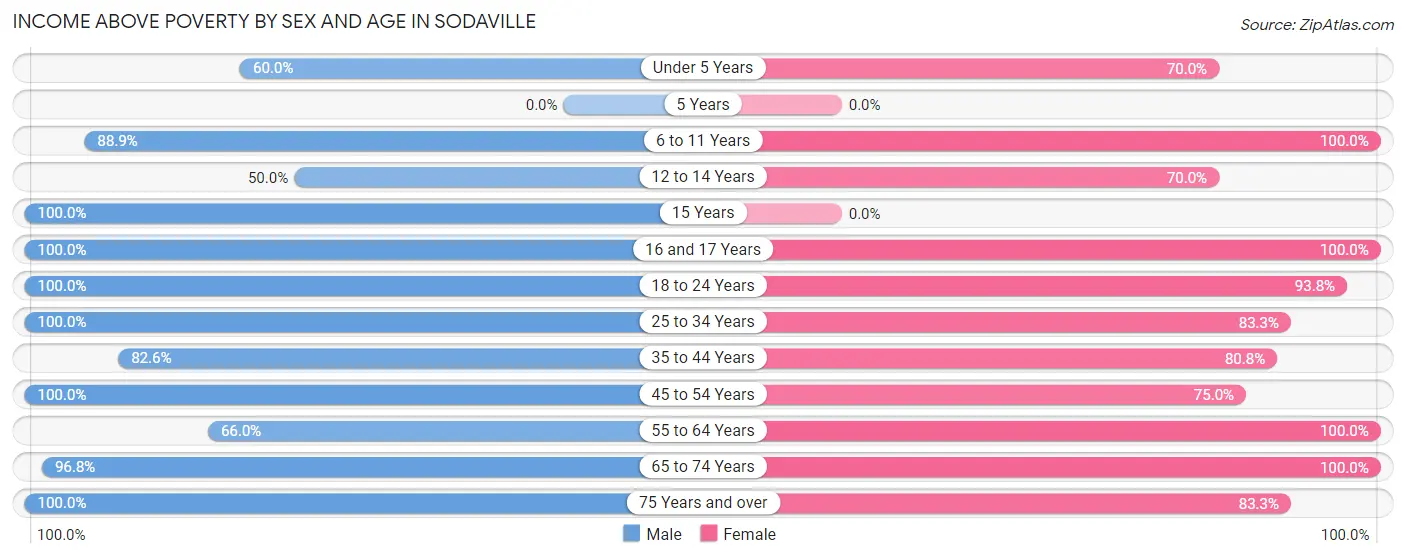
| Age Bracket | Male | Female |
| Under 5 Years | 3 (60.0%) | 7 (70.0%) |
| 5 Years | 0 (0.0%) | 0 (0.0%) |
| 6 to 11 Years | 8 (88.9%) | 19 (100.0%) |
| 12 to 14 Years | 3 (50.0%) | 7 (70.0%) |
| 15 Years | 1 (100.0%) | 0 (0.0%) |
| 16 and 17 Years | 2 (100.0%) | 3 (100.0%) |
| 18 to 24 Years | 10 (100.0%) | 15 (93.8%) |
| 25 to 34 Years | 22 (100.0%) | 10 (83.3%) |
| 35 to 44 Years | 19 (82.6%) | 21 (80.8%) |
| 45 to 54 Years | 9 (100.0%) | 24 (75.0%) |
| 55 to 64 Years | 31 (66.0%) | 40 (100.0%) |
| 65 to 74 Years | 30 (96.8%) | 17 (100.0%) |
| 75 Years and over | 4 (100.0%) | 5 (83.3%) |
| Total | 142 (84.0%) | 168 (87.5%) |
Income Below Poverty Among Married-Couple Families in Sodaville
The poverty statistics for married-couple families in Sodaville show that 6.8% or 5 of the total 74 families live below the poverty line. Families with 3 or 4 children have the highest poverty rate of 75.0%, comprising of 3 families. On the other hand, families with 1 or 2 children have the lowest poverty rate of 0.0%, which includes 0 families.
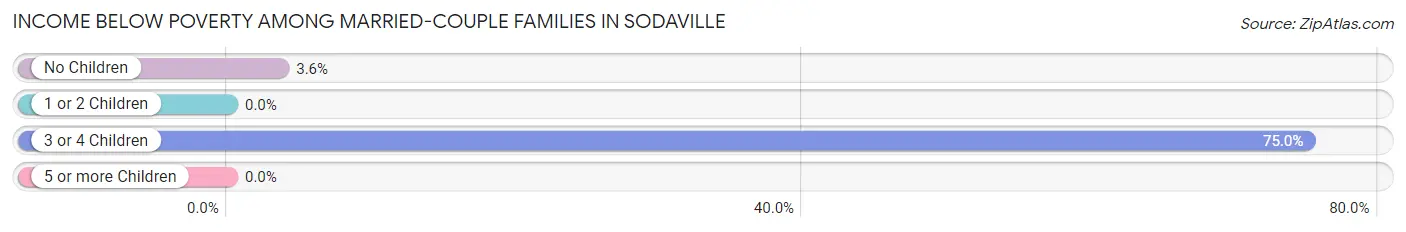
| Children | Above Poverty | Below Poverty |
| No Children | 54 (96.4%) | 2 (3.6%) |
| 1 or 2 Children | 12 (100.0%) | 0 (0.0%) |
| 3 or 4 Children | 1 (25.0%) | 3 (75.0%) |
| 5 or more Children | 2 (100.0%) | 0 (0.0%) |
| Total | 69 (93.2%) | 5 (6.8%) |
Income Below Poverty Among Single-Parent Households in Sodaville
According to the poverty data in Sodaville, 40.0% or 6 single-father households and 12.0% or 3 single-mother households are living below the poverty line. Among single-father households, those with no children have the highest poverty rate, with 6 households (50.0%) experiencing poverty. Likewise, among single-mother households, those with 1 or 2 children have the highest poverty rate, with 3 households (27.3%) falling below the poverty line.
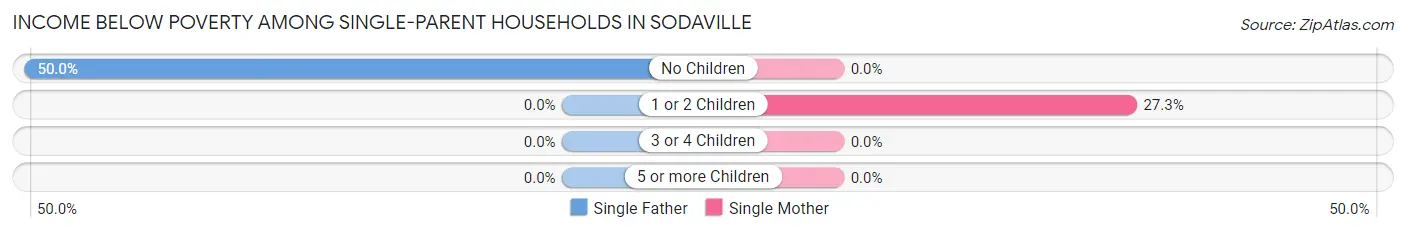
| Children | Single Father | Single Mother |
| No Children | 6 (50.0%) | 0 (0.0%) |
| 1 or 2 Children | 0 (0.0%) | 3 (27.3%) |
| 3 or 4 Children | 0 (0.0%) | 0 (0.0%) |
| 5 or more Children | 0 (0.0%) | 0 (0.0%) |
| Total | 6 (40.0%) | 3 (12.0%) |
Income Below Poverty Among Married-Couple vs Single-Parent Households in Sodaville
The poverty data for Sodaville shows that 5 of the married-couple family households (6.8%) and 9 of the single-parent households (22.5%) are living below the poverty level. Within the married-couple family households, those with 3 or 4 children have the highest poverty rate, with 3 households (75.0%) falling below the poverty line. Among the single-parent households, those with no children have the highest poverty rate, with 6 household (30.0%) living below poverty.
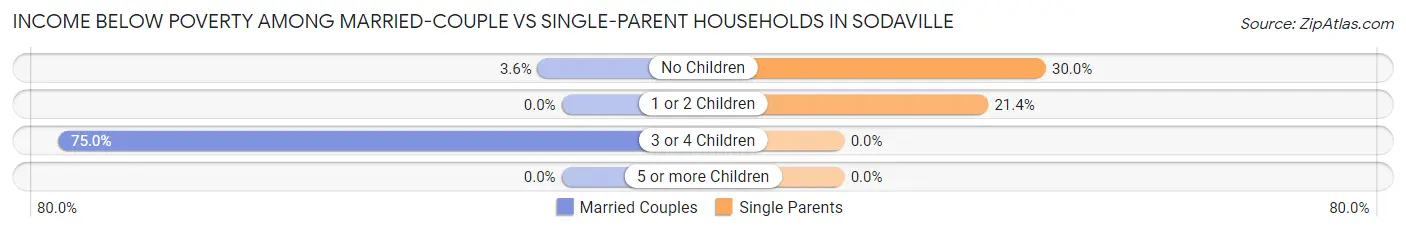
| Children | Married-Couple Families | Single-Parent Households |
| No Children | 2 (3.6%) | 6 (30.0%) |
| 1 or 2 Children | 0 (0.0%) | 3 (21.4%) |
| 3 or 4 Children | 3 (75.0%) | 0 (0.0%) |
| 5 or more Children | 0 (0.0%) | 0 (0.0%) |
| Total | 5 (6.8%) | 9 (22.5%) |
Employment Characteristics in Sodaville
Employment by Class of Employer in Sodaville
Among the 142 employed individuals in Sodaville, private company employees (89 | 62.7%), local government employees (16 | 11.3%), and self-employed (not incorporated) (14 | 9.9%) make up the most common classes of employment.
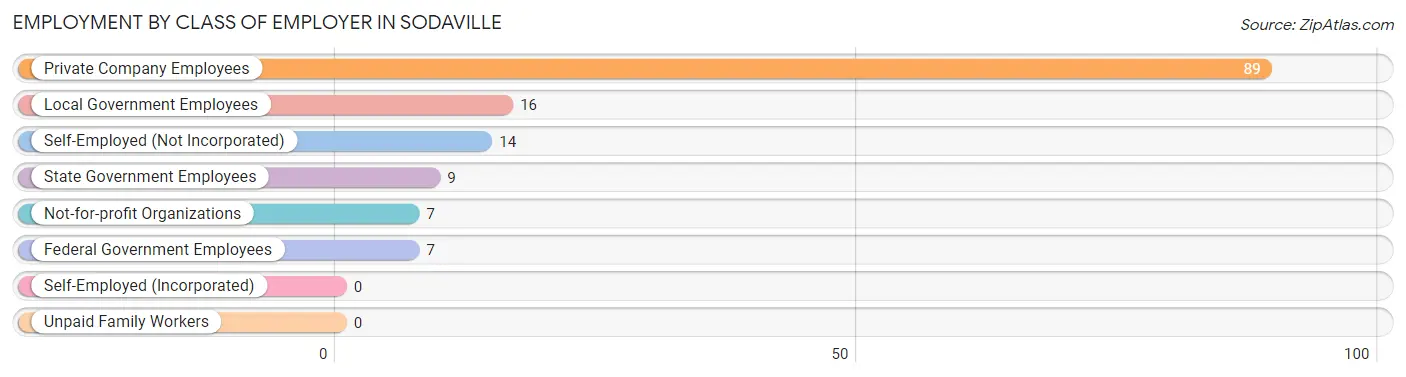
| Employer Class | # Employees | % Employees |
| Private Company Employees | 89 | 62.7% |
| Self-Employed (Incorporated) | 0 | 0.0% |
| Self-Employed (Not Incorporated) | 14 | 9.9% |
| Not-for-profit Organizations | 7 | 4.9% |
| Local Government Employees | 16 | 11.3% |
| State Government Employees | 9 | 6.3% |
| Federal Government Employees | 7 | 4.9% |
| Unpaid Family Workers | 0 | 0.0% |
| Total | 142 | 100.0% |
Employment Status by Age in Sodaville
According to the labor force statistics for Sodaville, out of the total population over 16 years of age (300), 50.7% or 152 individuals are in the labor force, with 5.3% or 8 of them unemployed. The age group with the highest labor force participation rate is 25 to 29 years, with 89.5% or 17 individuals in the labor force. Within the labor force, the 35 to 44 years age range has the highest percentage of unemployed individuals, with 12.5% or 4 of them being unemployed.
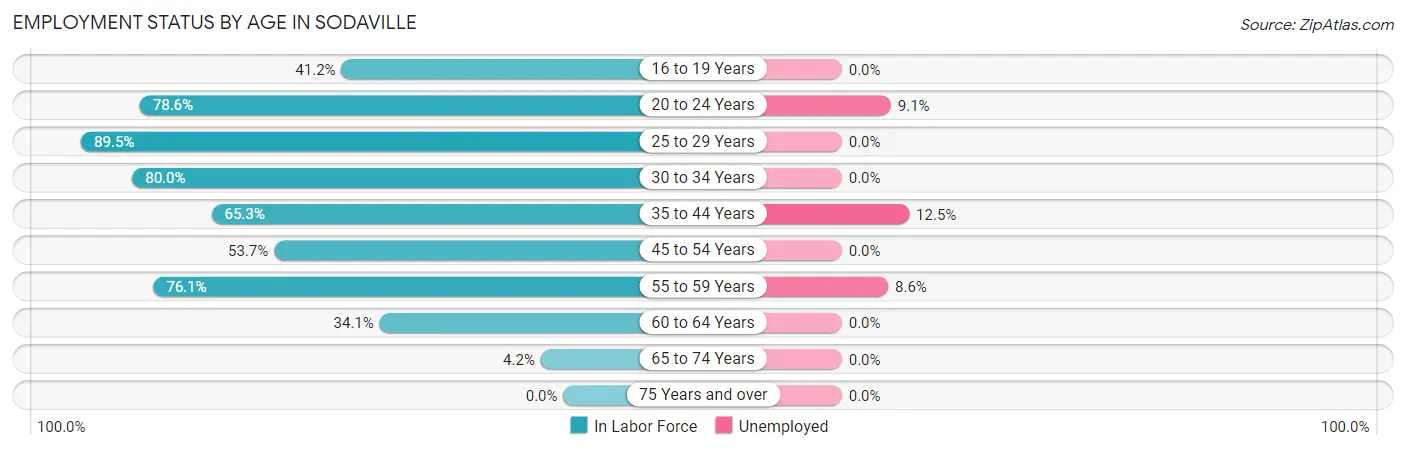
| Age Bracket | In Labor Force | Unemployed |
| 16 to 19 Years | 7 (41.2%) | 0 (0.0%) |
| 20 to 24 Years | 11 (78.6%) | 1 (9.1%) |
| 25 to 29 Years | 17 (89.5%) | 0 (0.0%) |
| 30 to 34 Years | 12 (80.0%) | 0 (0.0%) |
| 35 to 44 Years | 32 (65.3%) | 4 (12.5%) |
| 45 to 54 Years | 22 (53.7%) | 0 (0.0%) |
| 55 to 59 Years | 35 (76.1%) | 3 (8.6%) |
| 60 to 64 Years | 14 (34.1%) | 0 (0.0%) |
| 65 to 74 Years | 2 (4.2%) | 0 (0.0%) |
| 75 Years and over | 0 (0.0%) | 0 (0.0%) |
| Total | 152 (50.7%) | 8 (5.3%) |
Employment Status by Educational Attainment in Sodaville
According to labor force statistics for Sodaville, 62.6% of individuals (132) out of the total population between 25 and 64 years of age (211) are in the labor force, with 5.4% or 7 of them being unemployed. The group with the highest labor force participation rate are those with the educational attainment of college / associate degree, with 73.9% or 68 individuals in the labor force. Within the labor force, individuals with bachelor's degree or higher education have the highest percentage of unemployment, with 12.5% or 1 of them being unemployed.
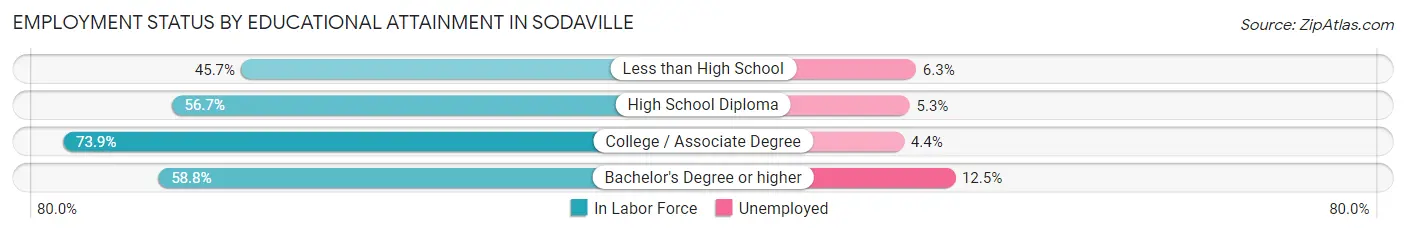
| Educational Attainment | In Labor Force | Unemployed |
| Less than High School | 16 (45.7%) | 2 (6.3%) |
| High School Diploma | 38 (56.7%) | 4 (5.3%) |
| College / Associate Degree | 68 (73.9%) | 4 (4.4%) |
| Bachelor's Degree or higher | 10 (58.8%) | 2 (12.5%) |
| Total | 132 (62.6%) | 11 (5.4%) |
Employment Occupations by Sex in Sodaville
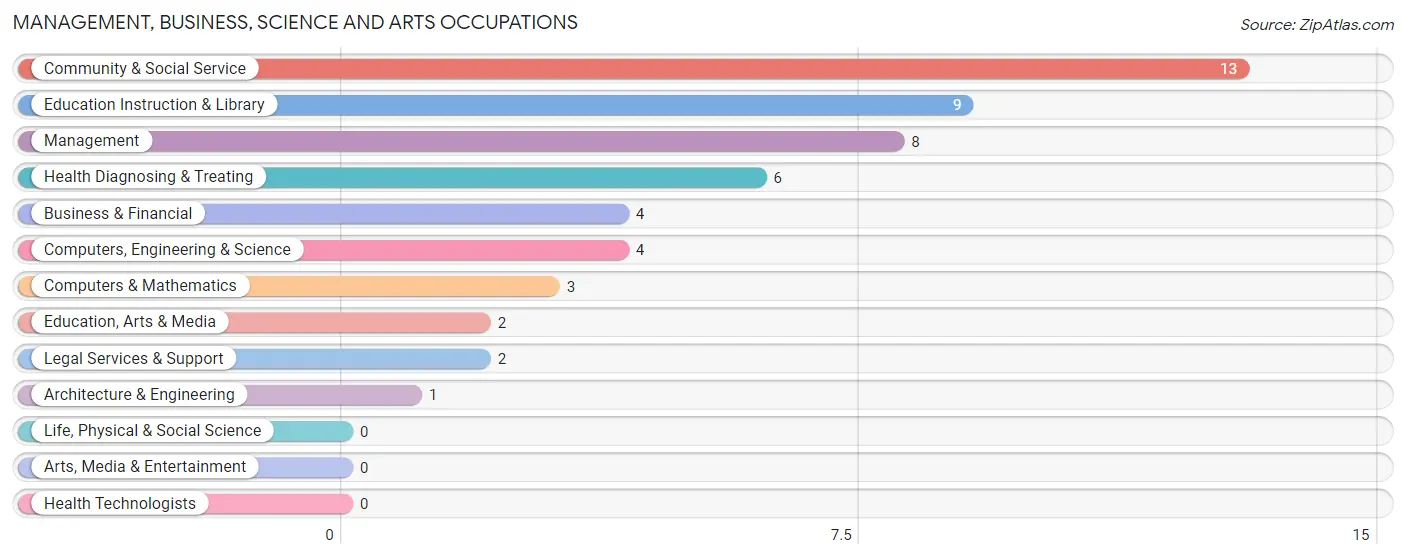
Management, Business, Science and Arts Occupations
The most common Management, Business, Science and Arts occupations in Sodaville are Community & Social Service (13 | 9.1%), Education Instruction & Library (9 | 6.3%), Management (8 | 5.6%), Health Diagnosing & Treating (6 | 4.2%), and Business & Financial (4 | 2.8%).
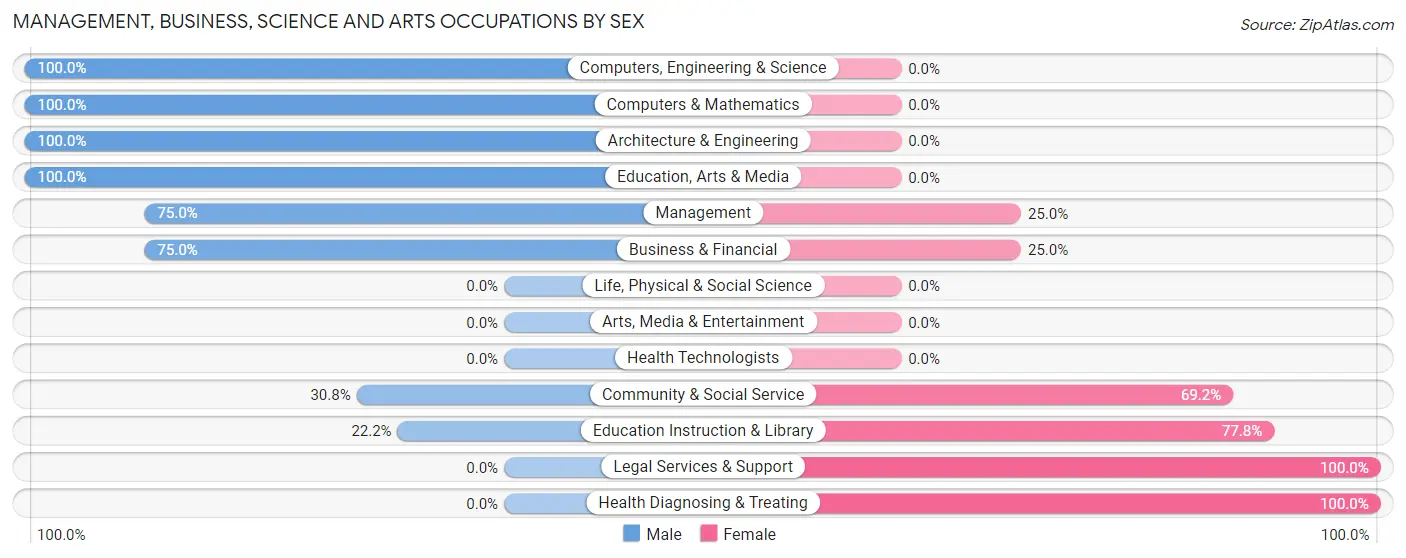
Management, Business, Science and Arts Occupations by Sex
Within the Management, Business, Science and Arts occupations in Sodaville, the most male-oriented occupations are Computers, Engineering & Science (100.0%), Computers & Mathematics (100.0%), and Architecture & Engineering (100.0%), while the most female-oriented occupations are Legal Services & Support (100.0%), Health Diagnosing & Treating (100.0%), and Education Instruction & Library (77.8%).
| Occupation | Male | Female |
| Management | 6 (75.0%) | 2 (25.0%) |
| Business & Financial | 3 (75.0%) | 1 (25.0%) |
| Computers, Engineering & Science | 4 (100.0%) | 0 (0.0%) |
| Computers & Mathematics | 3 (100.0%) | 0 (0.0%) |
| Architecture & Engineering | 1 (100.0%) | 0 (0.0%) |
| Life, Physical & Social Science | 0 (0.0%) | 0 (0.0%) |
| Community & Social Service | 4 (30.8%) | 9 (69.2%) |
| Education, Arts & Media | 2 (100.0%) | 0 (0.0%) |
| Legal Services & Support | 0 (0.0%) | 2 (100.0%) |
| Education Instruction & Library | 2 (22.2%) | 7 (77.8%) |
| Arts, Media & Entertainment | 0 (0.0%) | 0 (0.0%) |
| Health Diagnosing & Treating | 0 (0.0%) | 6 (100.0%) |
| Health Technologists | 0 (0.0%) | 0 (0.0%) |
| Total (Category) | 17 (48.6%) | 18 (51.4%) |
| Total (Overall) | 72 (50.7%) | 70 (49.3%) |
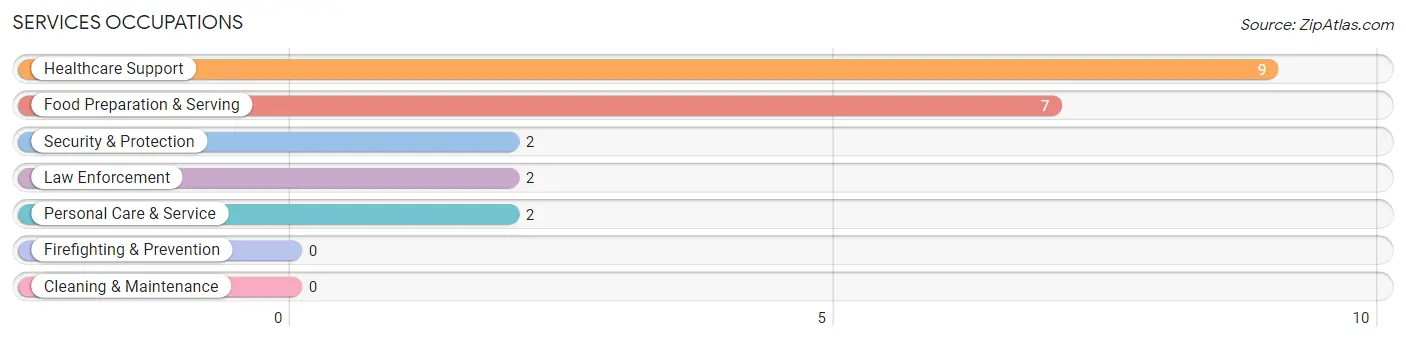
Services Occupations
The most common Services occupations in Sodaville are Healthcare Support (9 | 6.3%), Food Preparation & Serving (7 | 4.9%), Security & Protection (2 | 1.4%), Law Enforcement (2 | 1.4%), and Personal Care & Service (2 | 1.4%).
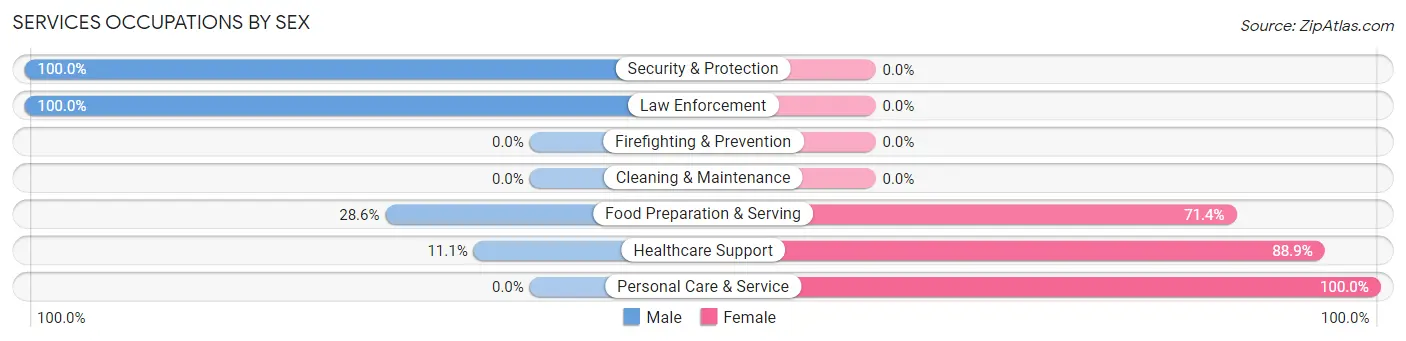
Services Occupations by Sex
Within the Services occupations in Sodaville, the most male-oriented occupations are Security & Protection (100.0%), Law Enforcement (100.0%), and Food Preparation & Serving (28.6%), while the most female-oriented occupations are Personal Care & Service (100.0%), Healthcare Support (88.9%), and Food Preparation & Serving (71.4%).
| Occupation | Male | Female |
| Healthcare Support | 1 (11.1%) | 8 (88.9%) |
| Security & Protection | 2 (100.0%) | 0 (0.0%) |
| Firefighting & Prevention | 0 (0.0%) | 0 (0.0%) |
| Law Enforcement | 2 (100.0%) | 0 (0.0%) |
| Food Preparation & Serving | 2 (28.6%) | 5 (71.4%) |
| Cleaning & Maintenance | 0 (0.0%) | 0 (0.0%) |
| Personal Care & Service | 0 (0.0%) | 2 (100.0%) |
| Total (Category) | 5 (25.0%) | 15 (75.0%) |
| Total (Overall) | 72 (50.7%) | 70 (49.3%) |
Sales and Office Occupations
The most common Sales and Office occupations in Sodaville are Sales & Related (23 | 16.2%), and Office & Administration (19 | 13.4%).
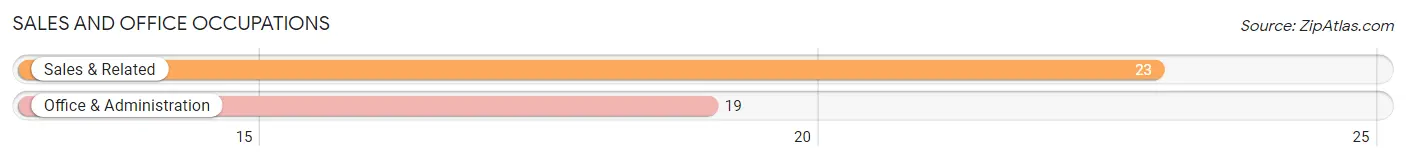
Sales and Office Occupations by Sex
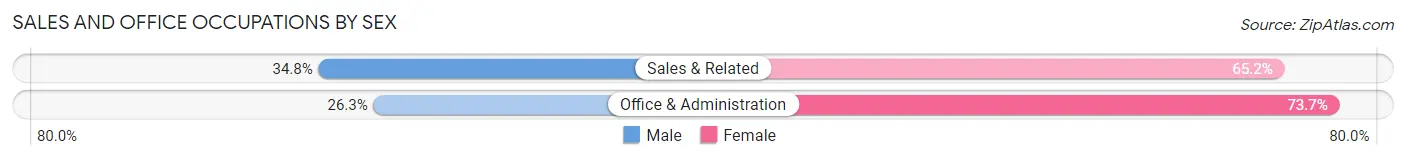
| Occupation | Male | Female |
| Sales & Related | 8 (34.8%) | 15 (65.2%) |
| Office & Administration | 5 (26.3%) | 14 (73.7%) |
| Total (Category) | 13 (30.9%) | 29 (69.1%) |
| Total (Overall) | 72 (50.7%) | 70 (49.3%) |
Natural Resources, Construction and Maintenance Occupations
The most common Natural Resources, Construction and Maintenance occupations in Sodaville are Construction & Extraction (9 | 6.3%), Farming, Fishing & Forestry (7 | 4.9%), and Installation, Maintenance & Repair (3 | 2.1%).
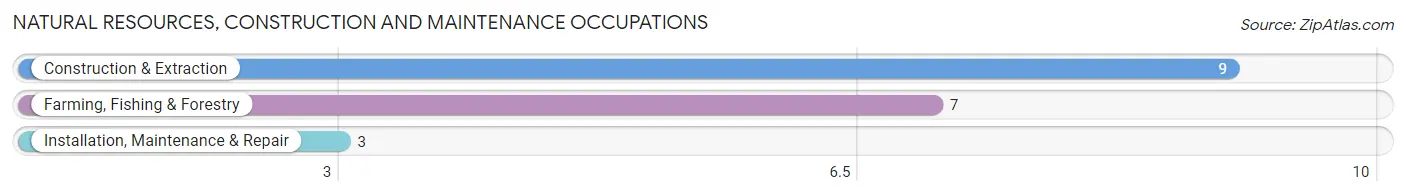
Natural Resources, Construction and Maintenance Occupations by Sex
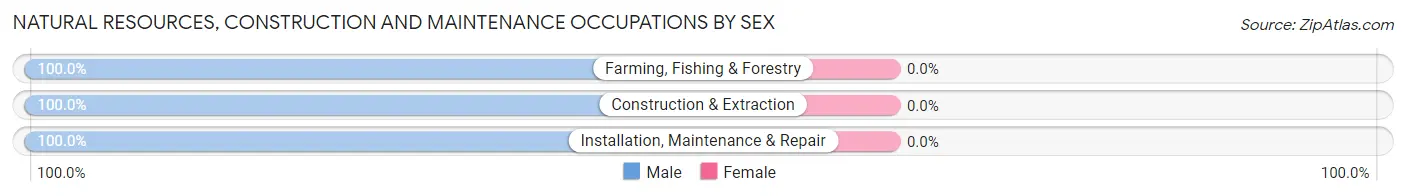
| Occupation | Male | Female |
| Farming, Fishing & Forestry | 7 (100.0%) | 0 (0.0%) |
| Construction & Extraction | 9 (100.0%) | 0 (0.0%) |
| Installation, Maintenance & Repair | 3 (100.0%) | 0 (0.0%) |
| Total (Category) | 19 (100.0%) | 0 (0.0%) |
| Total (Overall) | 72 (50.7%) | 70 (49.3%) |
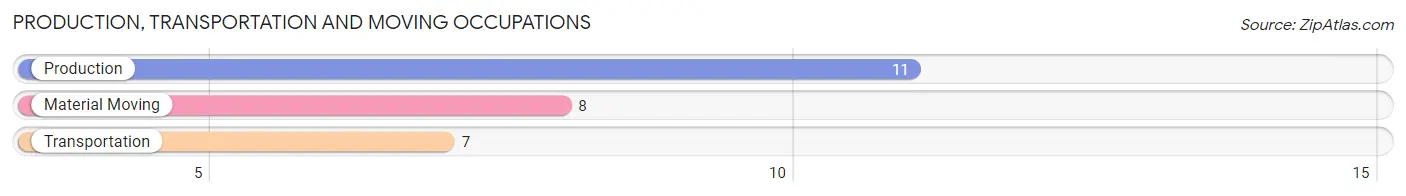
Production, Transportation and Moving Occupations
The most common Production, Transportation and Moving occupations in Sodaville are Production (11 | 7.7%), Material Moving (8 | 5.6%), and Transportation (7 | 4.9%).
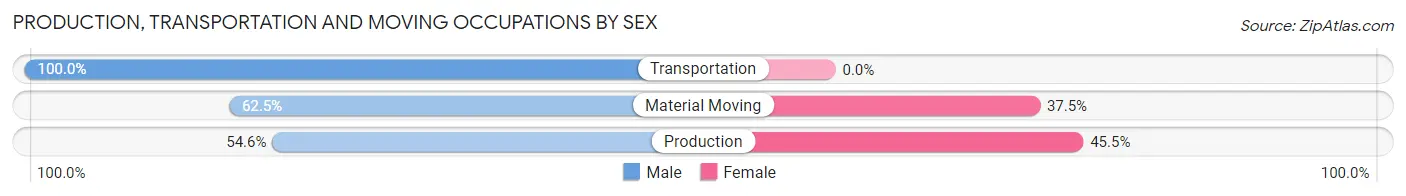
Production, Transportation and Moving Occupations by Sex
| Occupation | Male | Female |
| Production | 6 (54.5%) | 5 (45.5%) |
| Transportation | 7 (100.0%) | 0 (0.0%) |
| Material Moving | 5 (62.5%) | 3 (37.5%) |
| Total (Category) | 18 (69.2%) | 8 (30.8%) |
| Total (Overall) | 72 (50.7%) | 70 (49.3%) |
Employment Industries by Sex in Sodaville
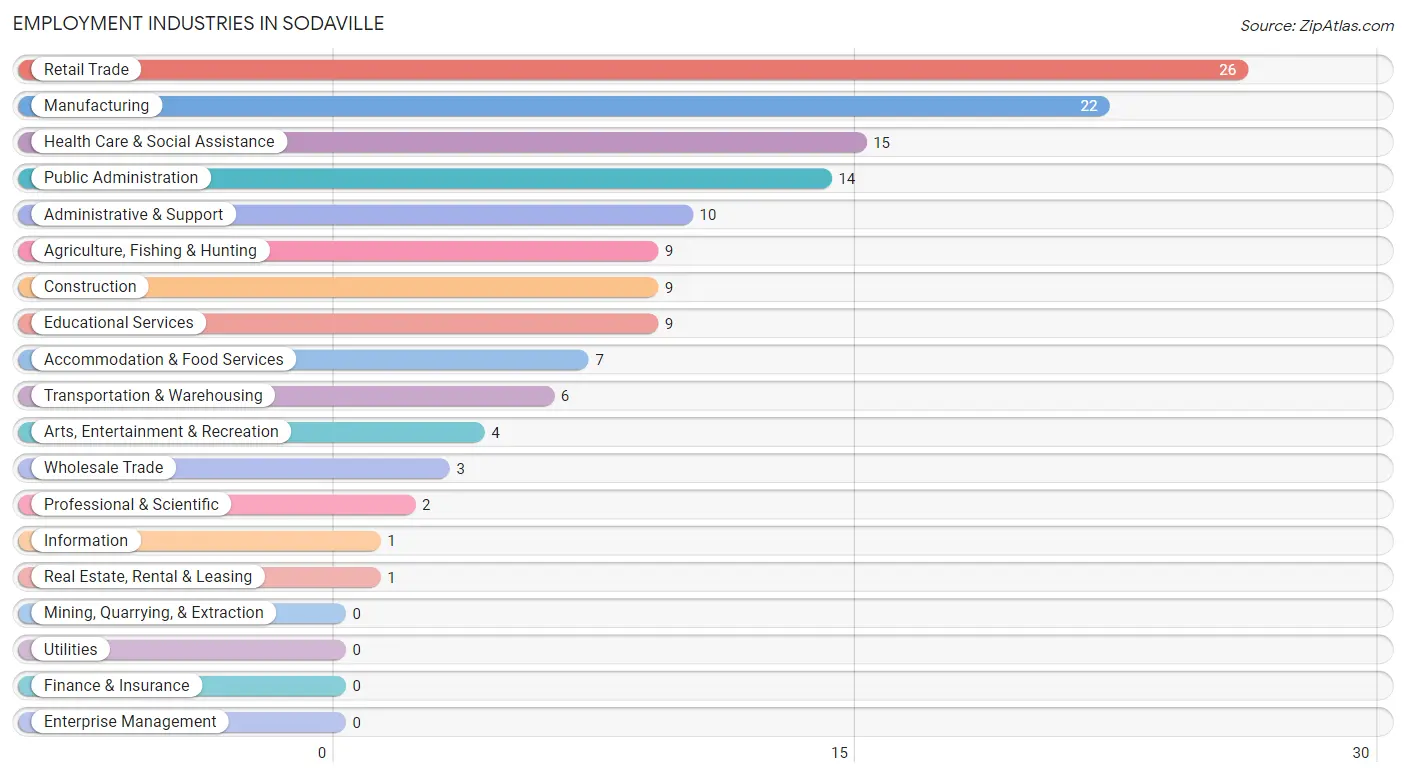
Employment Industries in Sodaville
The major employment industries in Sodaville include Retail Trade (26 | 18.3%), Manufacturing (22 | 15.5%), Health Care & Social Assistance (15 | 10.6%), Public Administration (14 | 9.9%), and Administrative & Support (10 | 7.0%).
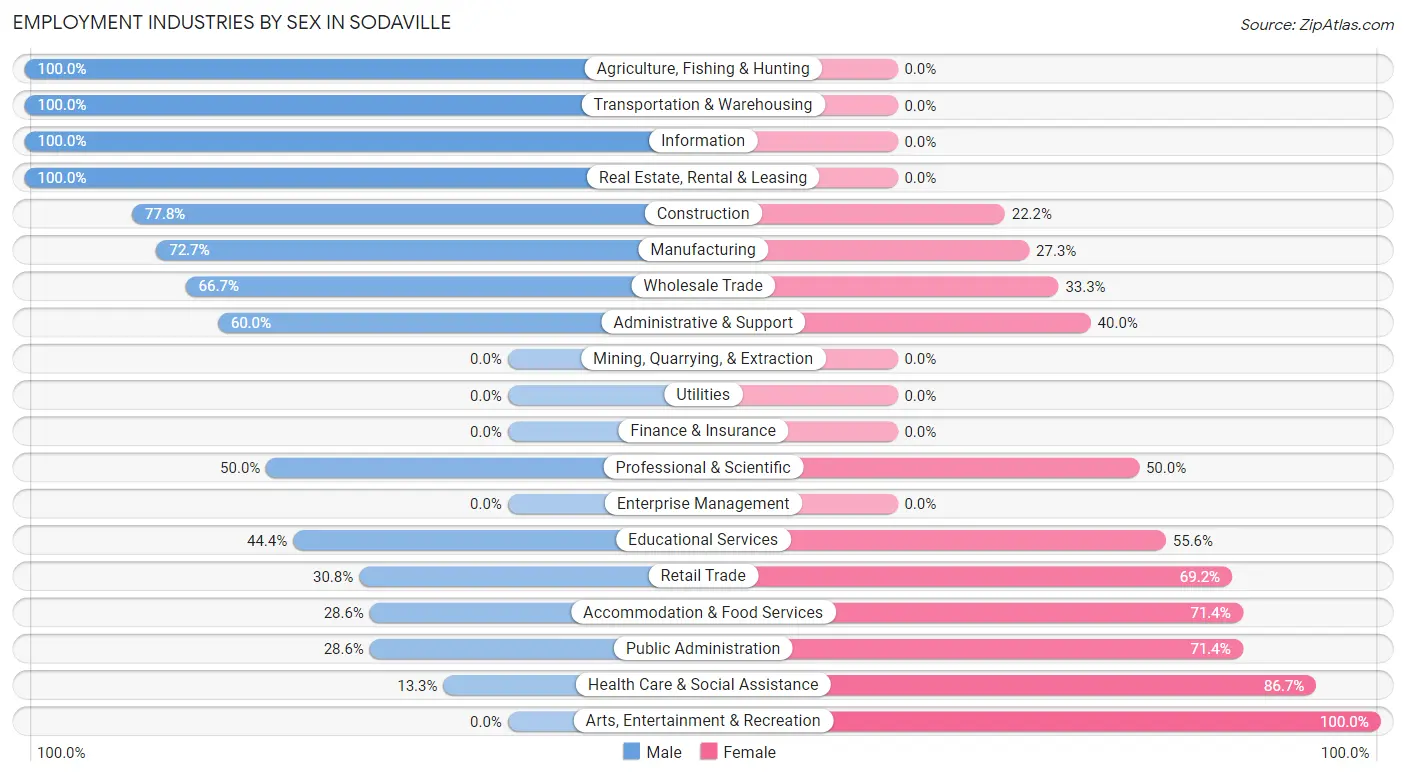
Employment Industries by Sex in Sodaville
The Sodaville industries that see more men than women are Agriculture, Fishing & Hunting (100.0%), Transportation & Warehousing (100.0%), and Information (100.0%), whereas the industries that tend to have a higher number of women are Arts, Entertainment & Recreation (100.0%), Health Care & Social Assistance (86.7%), and Accommodation & Food Services (71.4%).
| Industry | Male | Female |
| Agriculture, Fishing & Hunting | 9 (100.0%) | 0 (0.0%) |
| Mining, Quarrying, & Extraction | 0 (0.0%) | 0 (0.0%) |
| Construction | 7 (77.8%) | 2 (22.2%) |
| Manufacturing | 16 (72.7%) | 6 (27.3%) |
| Wholesale Trade | 2 (66.7%) | 1 (33.3%) |
| Retail Trade | 8 (30.8%) | 18 (69.2%) |
| Transportation & Warehousing | 6 (100.0%) | 0 (0.0%) |
| Utilities | 0 (0.0%) | 0 (0.0%) |
| Information | 1 (100.0%) | 0 (0.0%) |
| Finance & Insurance | 0 (0.0%) | 0 (0.0%) |
| Real Estate, Rental & Leasing | 1 (100.0%) | 0 (0.0%) |
| Professional & Scientific | 1 (50.0%) | 1 (50.0%) |
| Enterprise Management | 0 (0.0%) | 0 (0.0%) |
| Administrative & Support | 6 (60.0%) | 4 (40.0%) |
| Educational Services | 4 (44.4%) | 5 (55.6%) |
| Health Care & Social Assistance | 2 (13.3%) | 13 (86.7%) |
| Arts, Entertainment & Recreation | 0 (0.0%) | 4 (100.0%) |
| Accommodation & Food Services | 2 (28.6%) | 5 (71.4%) |
| Public Administration | 4 (28.6%) | 10 (71.4%) |
| Total | 72 (50.7%) | 70 (49.3%) |
Education in Sodaville
School Enrollment in Sodaville
The most common levels of schooling among the 87 students in Sodaville are middle school (29 | 33.3%), college / undergraduate (20 | 23.0%), and high school (17 | 19.5%).
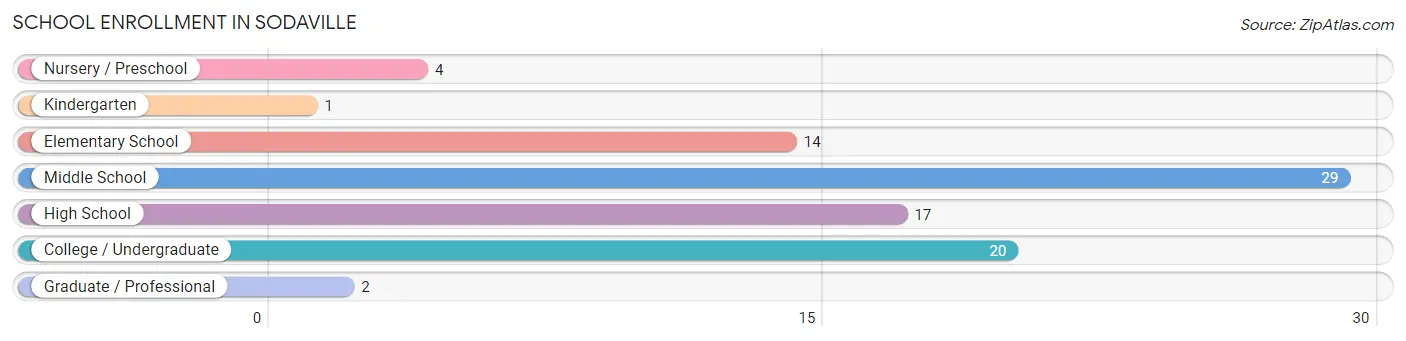
| School Level | # Students | % Students |
| Nursery / Preschool | 4 | 4.6% |
| Kindergarten | 1 | 1.1% |
| Elementary School | 14 | 16.1% |
| Middle School | 29 | 33.3% |
| High School | 17 | 19.5% |
| College / Undergraduate | 20 | 23.0% |
| Graduate / Professional | 2 | 2.3% |
| Total | 87 | 100.0% |
School Enrollment by Age by Funding Source in Sodaville
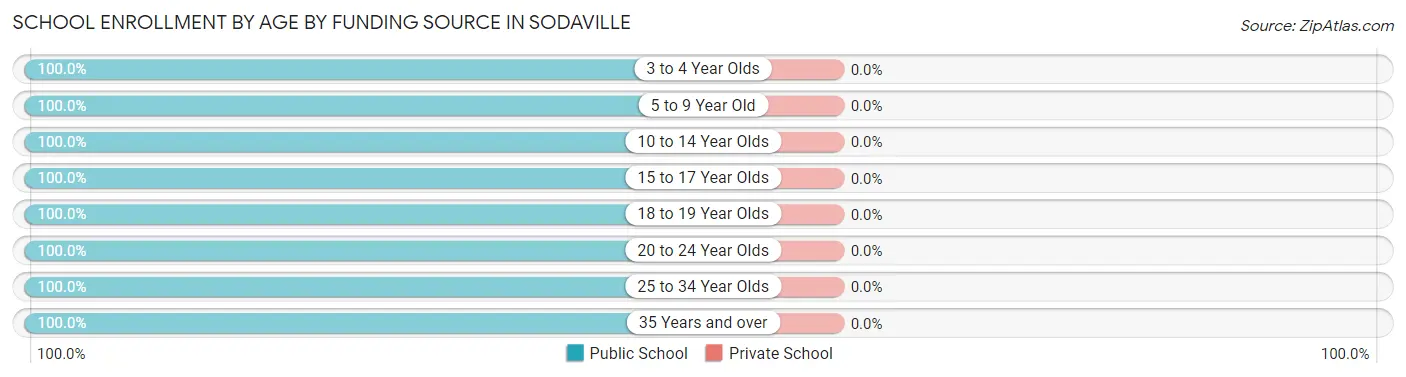
| Age Bracket | Public School | Private School |
| 3 to 4 Year Olds | 5 (100.0%) | 0 (0.0%) |
| 5 to 9 Year Old | 18 (100.0%) | 0 (0.0%) |
| 10 to 14 Year Olds | 26 (100.0%) | 0 (0.0%) |
| 15 to 17 Year Olds | 7 (100.0%) | 0 (0.0%) |
| 18 to 19 Year Olds | 8 (100.0%) | 0 (0.0%) |
| 20 to 24 Year Olds | 7 (100.0%) | 0 (0.0%) |
| 25 to 34 Year Olds | 8 (100.0%) | 0 (0.0%) |
| 35 Years and over | 8 (100.0%) | 0 (0.0%) |
| Total | 87 (100.0%) | 0 (0.0%) |
Educational Attainment by Field of Study in Sodaville
Social sciences (8 | 25.8%), engineering (8 | 25.8%), science & technology (5 | 16.1%), education (5 | 16.1%), and liberal arts & history (3 | 9.7%) are the most common fields of study among 31 individuals in Sodaville who have obtained a bachelor's degree or higher.
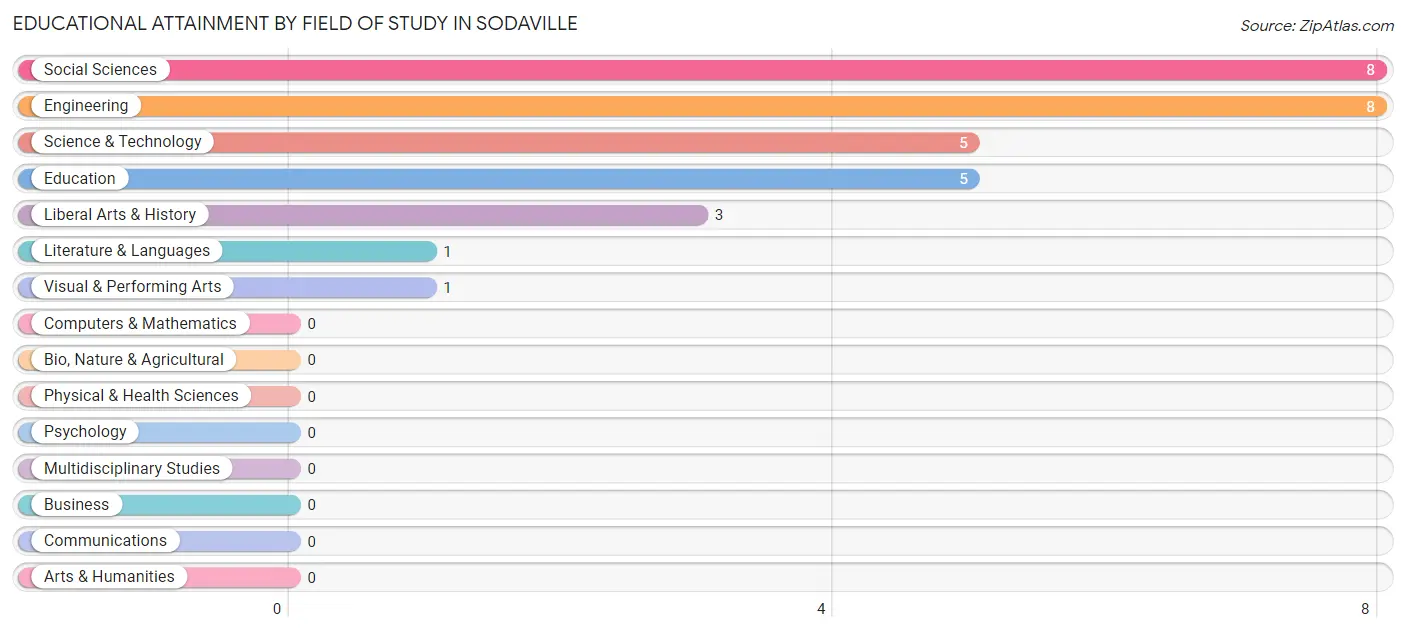
| Field of Study | # Graduates | % Graduates |
| Computers & Mathematics | 0 | 0.0% |
| Bio, Nature & Agricultural | 0 | 0.0% |
| Physical & Health Sciences | 0 | 0.0% |
| Psychology | 0 | 0.0% |
| Social Sciences | 8 | 25.8% |
| Engineering | 8 | 25.8% |
| Multidisciplinary Studies | 0 | 0.0% |
| Science & Technology | 5 | 16.1% |
| Business | 0 | 0.0% |
| Education | 5 | 16.1% |
| Literature & Languages | 1 | 3.2% |
| Liberal Arts & History | 3 | 9.7% |
| Visual & Performing Arts | 1 | 3.2% |
| Communications | 0 | 0.0% |
| Arts & Humanities | 0 | 0.0% |
| Total | 31 | 100.0% |
Transportation & Commute in Sodaville
Vehicle Availability by Sex in Sodaville
The most prevalent vehicle ownership categories in Sodaville are males with 3 vehicles (21, accounting for 29.2%) and females with 3 vehicles (7, making up 30.0%).
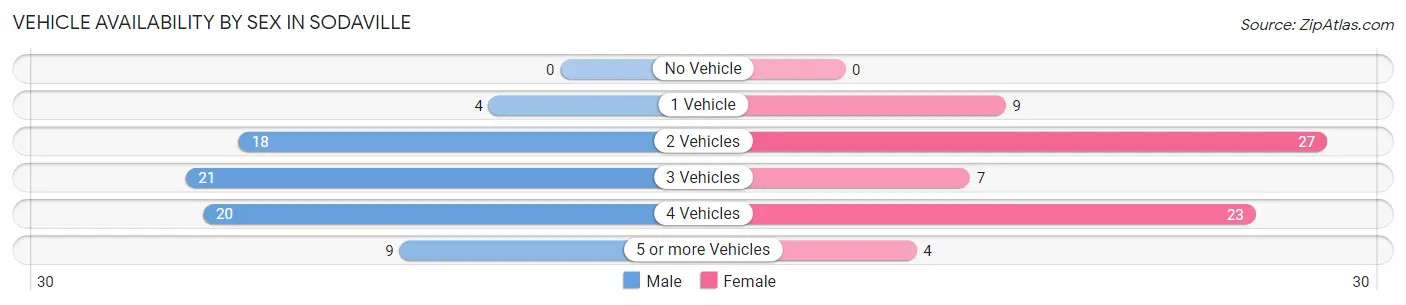
| Vehicles Available | Male | Female |
| No Vehicle | 0 (0.0%) | 0 (0.0%) |
| 1 Vehicle | 4 (5.6%) | 9 (12.9%) |
| 2 Vehicles | 18 (25.0%) | 27 (38.6%) |
| 3 Vehicles | 21 (29.2%) | 7 (10.0%) |
| 4 Vehicles | 20 (27.8%) | 23 (32.9%) |
| 5 or more Vehicles | 9 (12.5%) | 4 (5.7%) |
| Total | 72 (100.0%) | 70 (100.0%) |
Commute Time in Sodaville
The most frequently occuring commute durations in Sodaville are 30 to 34 minutes (26 commuters, 19.0%), 10 to 14 minutes (19 commuters, 13.9%), and 15 to 19 minutes (15 commuters, 11.0%).
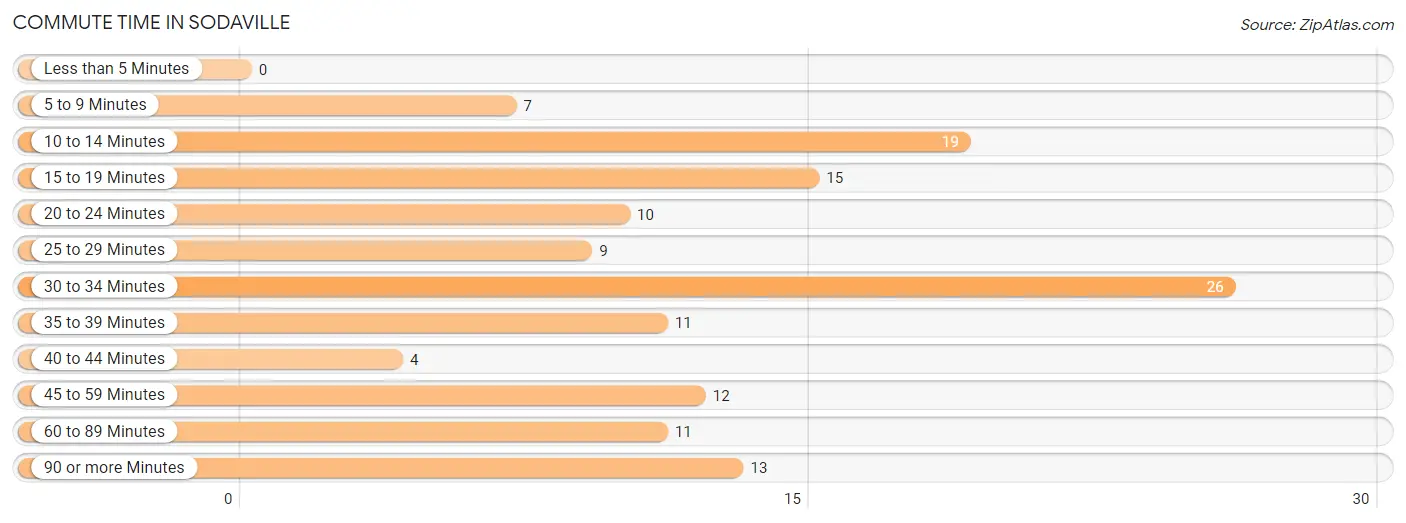
| Commute Time | # Commuters | % Commuters |
| Less than 5 Minutes | 0 | 0.0% |
| 5 to 9 Minutes | 7 | 5.1% |
| 10 to 14 Minutes | 19 | 13.9% |
| 15 to 19 Minutes | 15 | 11.0% |
| 20 to 24 Minutes | 10 | 7.3% |
| 25 to 29 Minutes | 9 | 6.6% |
| 30 to 34 Minutes | 26 | 19.0% |
| 35 to 39 Minutes | 11 | 8.0% |
| 40 to 44 Minutes | 4 | 2.9% |
| 45 to 59 Minutes | 12 | 8.8% |
| 60 to 89 Minutes | 11 | 8.0% |
| 90 or more Minutes | 13 | 9.5% |
Commute Time by Sex in Sodaville
The most common commute times in Sodaville are 30 to 34 minutes (16 commuters, 23.2%) for males and 10 to 14 minutes (13 commuters, 19.1%) for females.
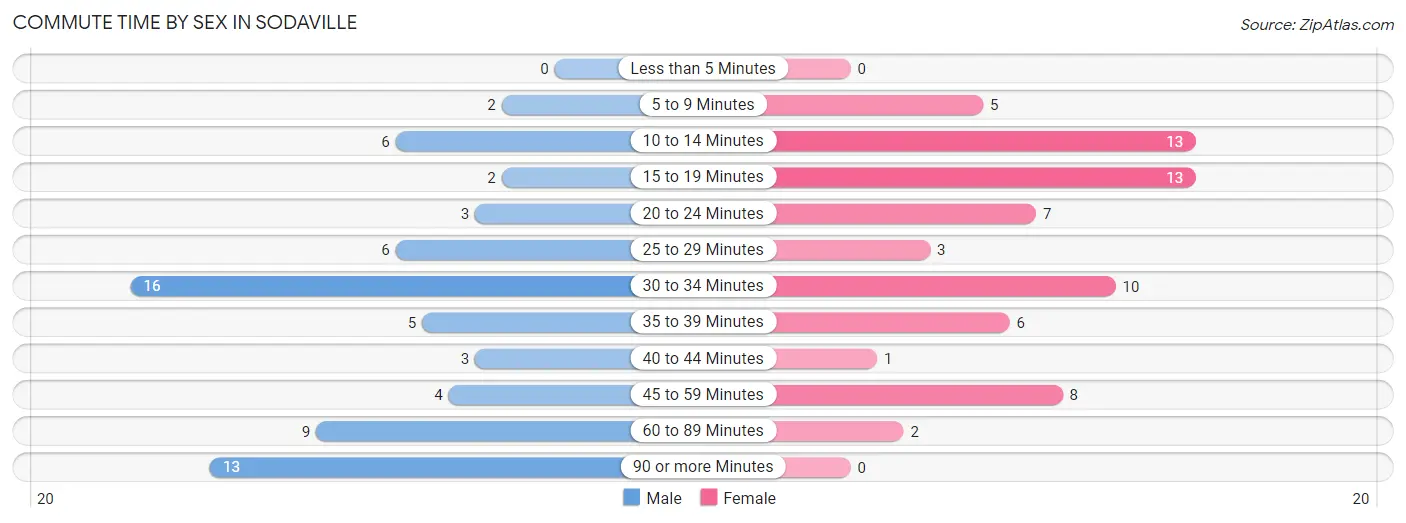
| Commute Time | Male | Female |
| Less than 5 Minutes | 0 (0.0%) | 0 (0.0%) |
| 5 to 9 Minutes | 2 (2.9%) | 5 (7.3%) |
| 10 to 14 Minutes | 6 (8.7%) | 13 (19.1%) |
| 15 to 19 Minutes | 2 (2.9%) | 13 (19.1%) |
| 20 to 24 Minutes | 3 (4.3%) | 7 (10.3%) |
| 25 to 29 Minutes | 6 (8.7%) | 3 (4.4%) |
| 30 to 34 Minutes | 16 (23.2%) | 10 (14.7%) |
| 35 to 39 Minutes | 5 (7.2%) | 6 (8.8%) |
| 40 to 44 Minutes | 3 (4.3%) | 1 (1.5%) |
| 45 to 59 Minutes | 4 (5.8%) | 8 (11.8%) |
| 60 to 89 Minutes | 9 (13.0%) | 2 (2.9%) |
| 90 or more Minutes | 13 (18.8%) | 0 (0.0%) |
Time of Departure to Work by Sex in Sodaville
The most frequent times of departure to work in Sodaville are 7:00 AM to 7:29 AM (19, 27.5%) for males and 7:30 AM to 7:59 AM (18, 26.5%) for females.
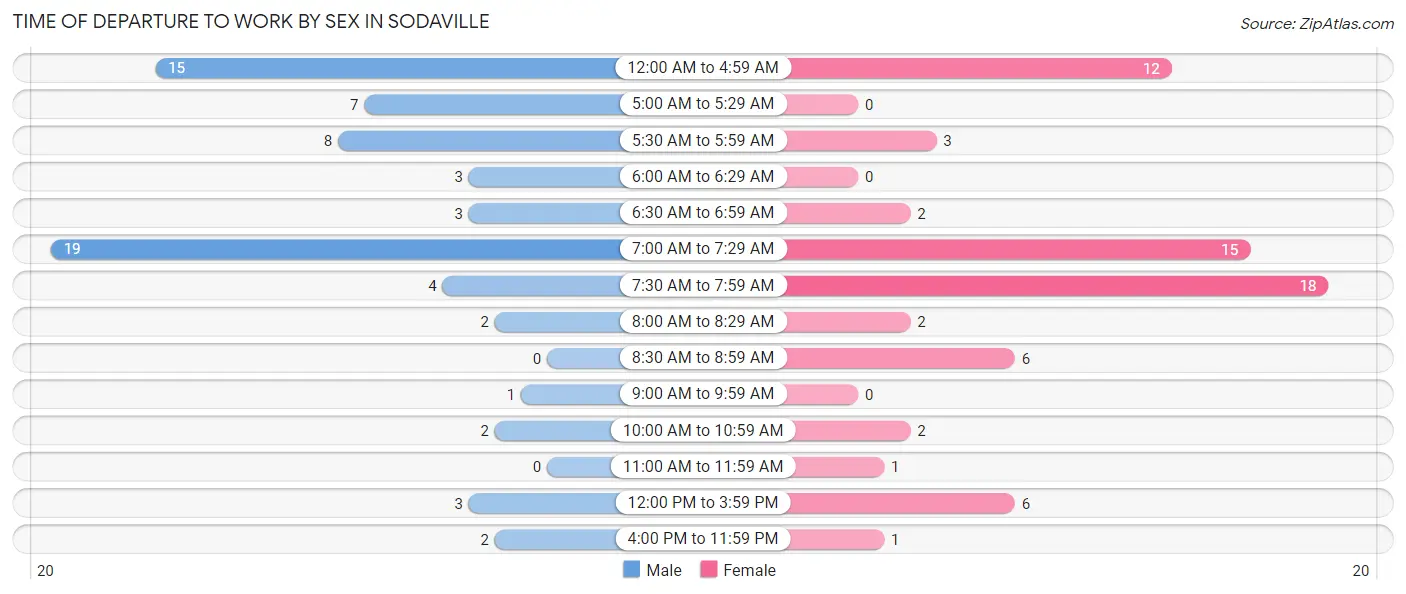
| Time of Departure | Male | Female |
| 12:00 AM to 4:59 AM | 15 (21.7%) | 12 (17.6%) |
| 5:00 AM to 5:29 AM | 7 (10.1%) | 0 (0.0%) |
| 5:30 AM to 5:59 AM | 8 (11.6%) | 3 (4.4%) |
| 6:00 AM to 6:29 AM | 3 (4.3%) | 0 (0.0%) |
| 6:30 AM to 6:59 AM | 3 (4.3%) | 2 (2.9%) |
| 7:00 AM to 7:29 AM | 19 (27.5%) | 15 (22.1%) |
| 7:30 AM to 7:59 AM | 4 (5.8%) | 18 (26.5%) |
| 8:00 AM to 8:29 AM | 2 (2.9%) | 2 (2.9%) |
| 8:30 AM to 8:59 AM | 0 (0.0%) | 6 (8.8%) |
| 9:00 AM to 9:59 AM | 1 (1.5%) | 0 (0.0%) |
| 10:00 AM to 10:59 AM | 2 (2.9%) | 2 (2.9%) |
| 11:00 AM to 11:59 AM | 0 (0.0%) | 1 (1.5%) |
| 12:00 PM to 3:59 PM | 3 (4.3%) | 6 (8.8%) |
| 4:00 PM to 11:59 PM | 2 (2.9%) | 1 (1.5%) |
| Total | 69 (100.0%) | 68 (100.0%) |
Housing Occupancy in Sodaville
Occupancy by Ownership in Sodaville
Of the total 139 dwellings in Sodaville, owner-occupied units account for 114 (82.0%), while renter-occupied units make up 25 (18.0%).
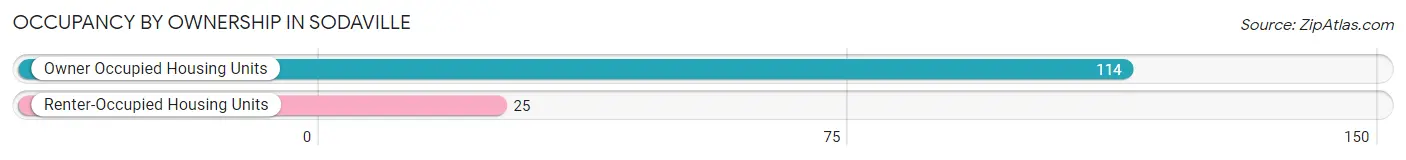
| Occupancy | # Housing Units | % Housing Units |
| Owner Occupied Housing Units | 114 | 82.0% |
| Renter-Occupied Housing Units | 25 | 18.0% |
| Total Occupied Housing Units | 139 | 100.0% |
Occupancy by Household Size in Sodaville
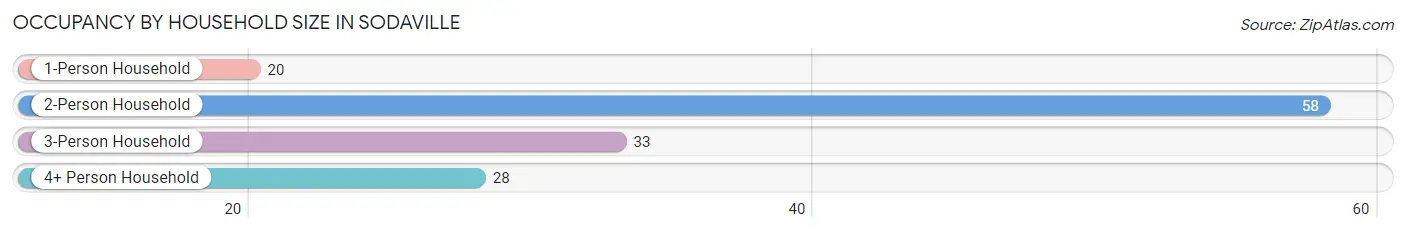
| Household Size | # Housing Units | % Housing Units |
| 1-Person Household | 20 | 14.4% |
| 2-Person Household | 58 | 41.7% |
| 3-Person Household | 33 | 23.7% |
| 4+ Person Household | 28 | 20.1% |
| Total Housing Units | 139 | 100.0% |
Occupancy by Ownership by Household Size in Sodaville
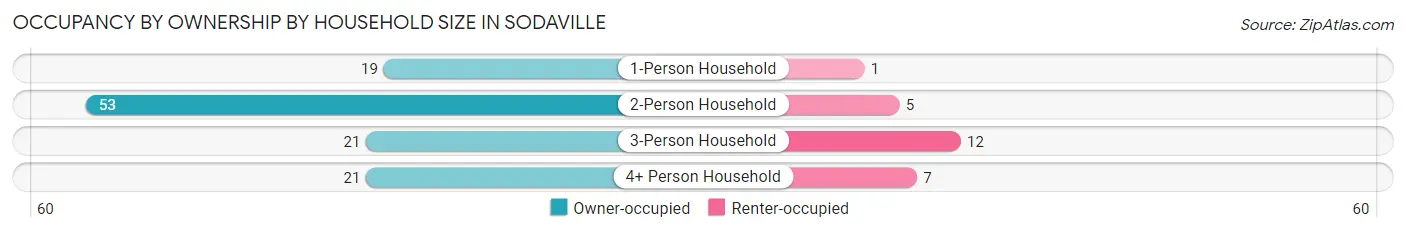
| Household Size | Owner-occupied | Renter-occupied |
| 1-Person Household | 19 (95.0%) | 1 (5.0%) |
| 2-Person Household | 53 (91.4%) | 5 (8.6%) |
| 3-Person Household | 21 (63.6%) | 12 (36.4%) |
| 4+ Person Household | 21 (75.0%) | 7 (25.0%) |
| Total Housing Units | 114 (82.0%) | 25 (18.0%) |
Occupancy by Educational Attainment in Sodaville
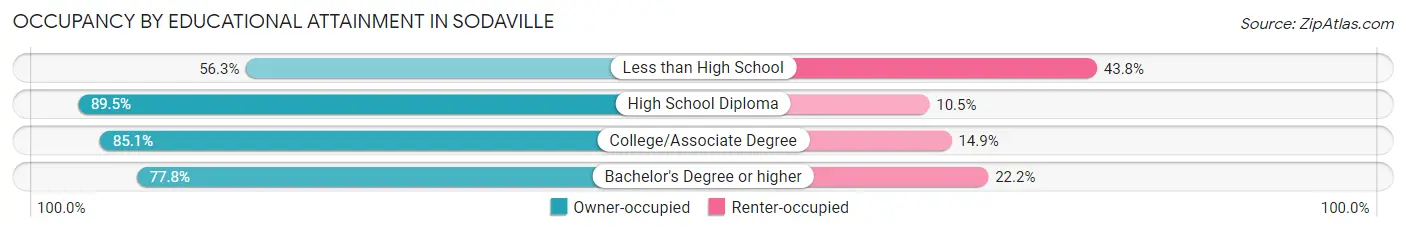
| Household Size | Owner-occupied | Renter-occupied |
| Less than High School | 9 (56.2%) | 7 (43.8%) |
| High School Diploma | 34 (89.5%) | 4 (10.5%) |
| College/Associate Degree | 57 (85.1%) | 10 (14.9%) |
| Bachelor's Degree or higher | 14 (77.8%) | 4 (22.2%) |
Occupancy by Age of Householder in Sodaville
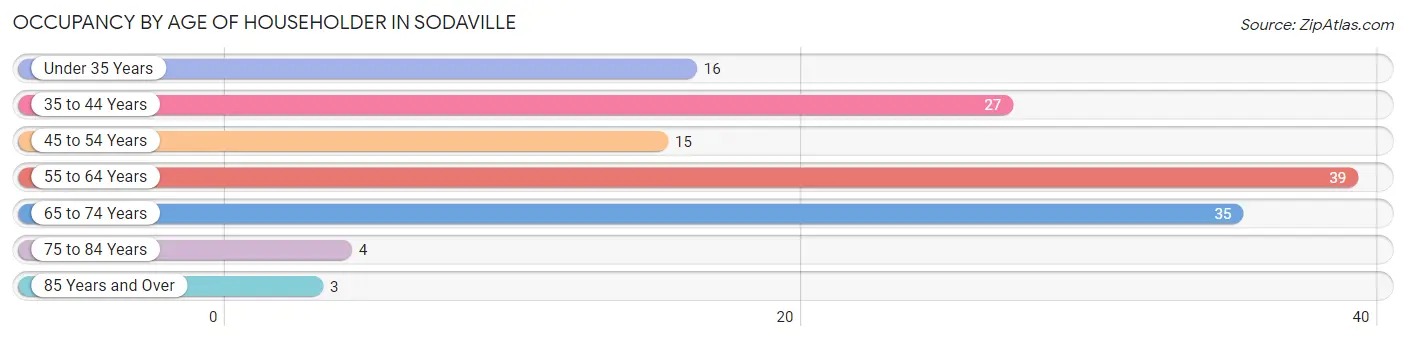
| Age Bracket | # Households | % Households |
| Under 35 Years | 16 | 11.5% |
| 35 to 44 Years | 27 | 19.4% |
| 45 to 54 Years | 15 | 10.8% |
| 55 to 64 Years | 39 | 28.1% |
| 65 to 74 Years | 35 | 25.2% |
| 75 to 84 Years | 4 | 2.9% |
| 85 Years and Over | 3 | 2.2% |
| Total | 139 | 100.0% |
Housing Finances in Sodaville
Median Income by Occupancy in Sodaville
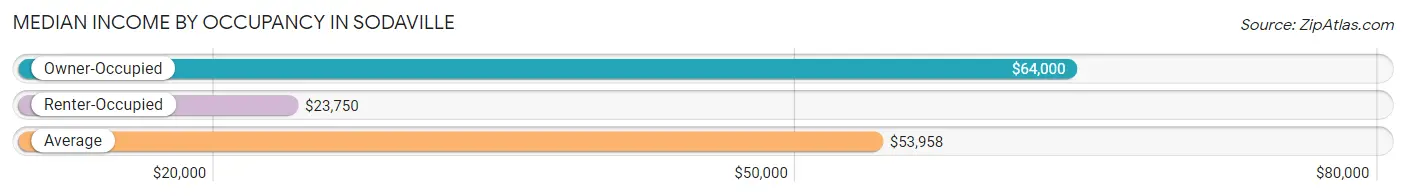
| Occupancy Type | # Households | Median Income |
| Owner-Occupied | 114 (82.0%) | $64,000 |
| Renter-Occupied | 25 (18.0%) | $23,750 |
| Average | 139 (100.0%) | $53,958 |
Occupancy by Householder Income Bracket in Sodaville
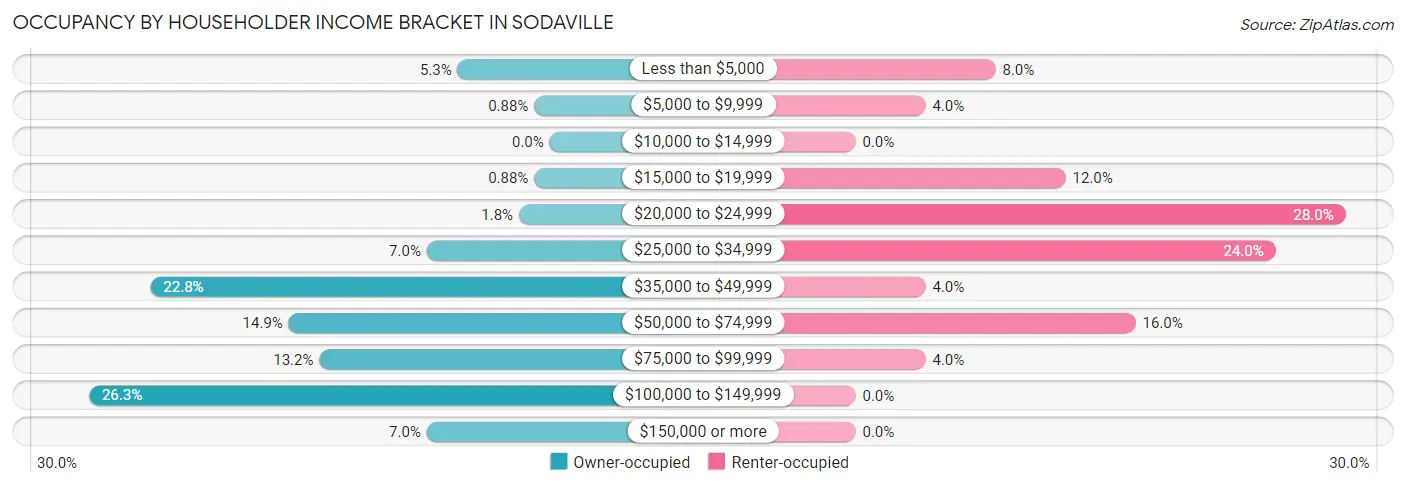
| Income Bracket | Owner-occupied | Renter-occupied |
| Less than $5,000 | 6 (5.3%) | 2 (8.0%) |
| $5,000 to $9,999 | 1 (0.9%) | 1 (4.0%) |
| $10,000 to $14,999 | 0 (0.0%) | 0 (0.0%) |
| $15,000 to $19,999 | 1 (0.9%) | 3 (12.0%) |
| $20,000 to $24,999 | 2 (1.8%) | 7 (28.0%) |
| $25,000 to $34,999 | 8 (7.0%) | 6 (24.0%) |
| $35,000 to $49,999 | 26 (22.8%) | 1 (4.0%) |
| $50,000 to $74,999 | 17 (14.9%) | 4 (16.0%) |
| $75,000 to $99,999 | 15 (13.2%) | 1 (4.0%) |
| $100,000 to $149,999 | 30 (26.3%) | 0 (0.0%) |
| $150,000 or more | 8 (7.0%) | 0 (0.0%) |
| Total | 114 (100.0%) | 25 (100.0%) |
Monthly Housing Cost Tiers in Sodaville
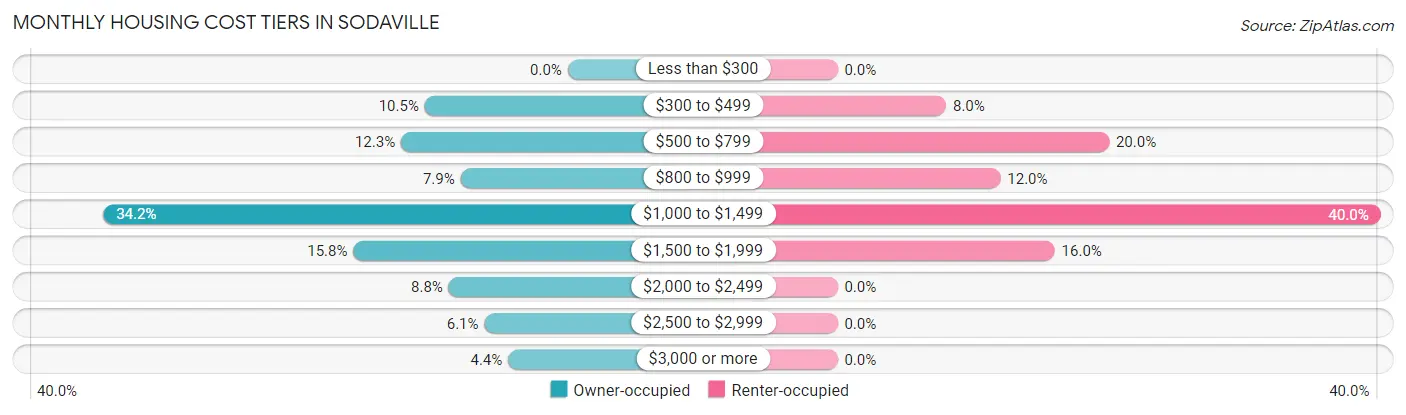
| Monthly Cost | Owner-occupied | Renter-occupied |
| Less than $300 | 0 (0.0%) | 0 (0.0%) |
| $300 to $499 | 12 (10.5%) | 2 (8.0%) |
| $500 to $799 | 14 (12.3%) | 5 (20.0%) |
| $800 to $999 | 9 (7.9%) | 3 (12.0%) |
| $1,000 to $1,499 | 39 (34.2%) | 10 (40.0%) |
| $1,500 to $1,999 | 18 (15.8%) | 4 (16.0%) |
| $2,000 to $2,499 | 10 (8.8%) | 0 (0.0%) |
| $2,500 to $2,999 | 7 (6.1%) | 0 (0.0%) |
| $3,000 or more | 5 (4.4%) | 0 (0.0%) |
| Total | 114 (100.0%) | 25 (100.0%) |
Physical Housing Characteristics in Sodaville
Housing Structures in Sodaville
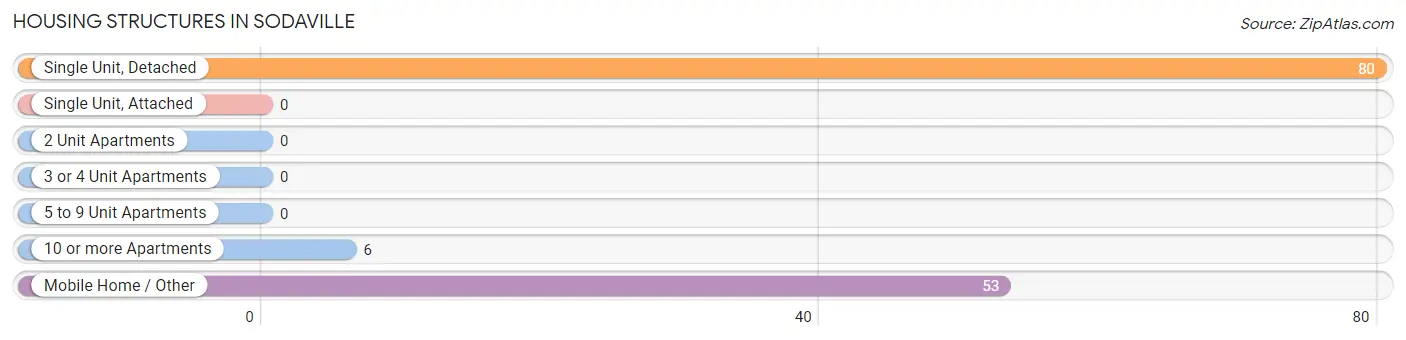
| Structure Type | # Housing Units | % Housing Units |
| Single Unit, Detached | 80 | 57.6% |
| Single Unit, Attached | 0 | 0.0% |
| 2 Unit Apartments | 0 | 0.0% |
| 3 or 4 Unit Apartments | 0 | 0.0% |
| 5 to 9 Unit Apartments | 0 | 0.0% |
| 10 or more Apartments | 6 | 4.3% |
| Mobile Home / Other | 53 | 38.1% |
| Total | 139 | 100.0% |
Housing Structures by Occupancy in Sodaville
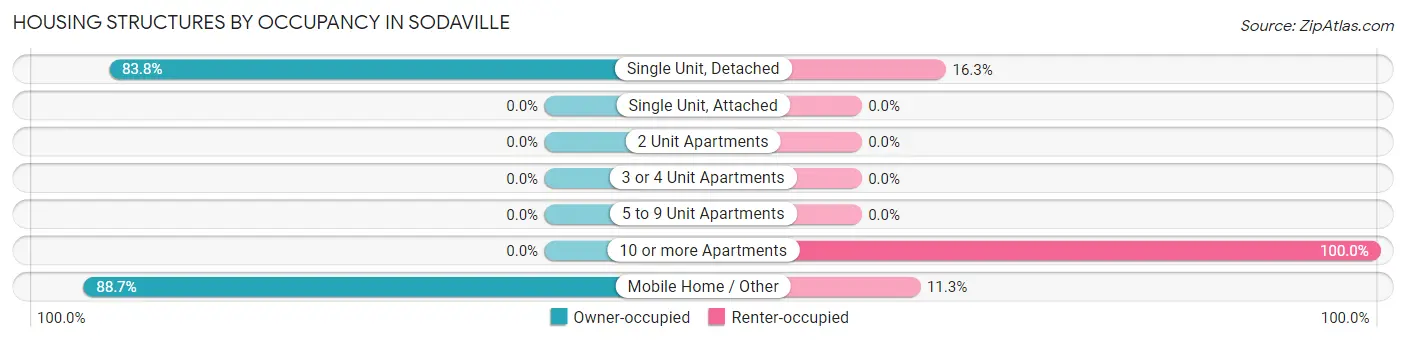
| Structure Type | Owner-occupied | Renter-occupied |
| Single Unit, Detached | 67 (83.8%) | 13 (16.3%) |
| Single Unit, Attached | 0 (0.0%) | 0 (0.0%) |
| 2 Unit Apartments | 0 (0.0%) | 0 (0.0%) |
| 3 or 4 Unit Apartments | 0 (0.0%) | 0 (0.0%) |
| 5 to 9 Unit Apartments | 0 (0.0%) | 0 (0.0%) |
| 10 or more Apartments | 0 (0.0%) | 6 (100.0%) |
| Mobile Home / Other | 47 (88.7%) | 6 (11.3%) |
| Total | 114 (82.0%) | 25 (18.0%) |
Housing Structures by Number of Rooms in Sodaville
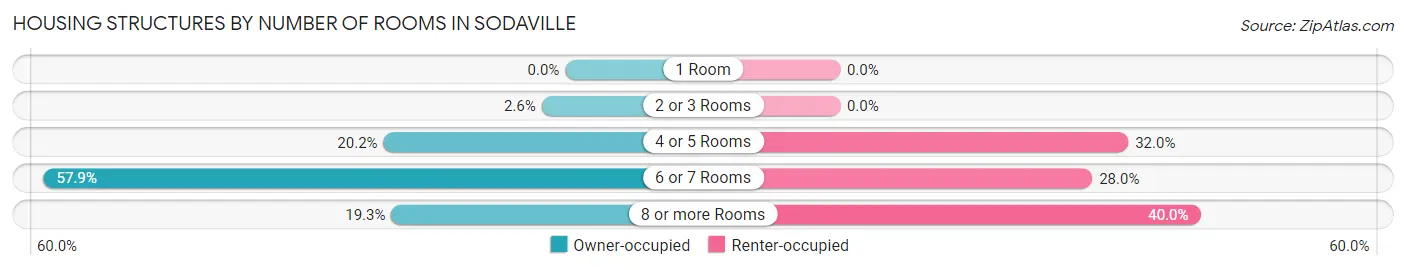
| Number of Rooms | Owner-occupied | Renter-occupied |
| 1 Room | 0 (0.0%) | 0 (0.0%) |
| 2 or 3 Rooms | 3 (2.6%) | 0 (0.0%) |
| 4 or 5 Rooms | 23 (20.2%) | 8 (32.0%) |
| 6 or 7 Rooms | 66 (57.9%) | 7 (28.0%) |
| 8 or more Rooms | 22 (19.3%) | 10 (40.0%) |
| Total | 114 (100.0%) | 25 (100.0%) |
Housing Structure by Heating Type in Sodaville
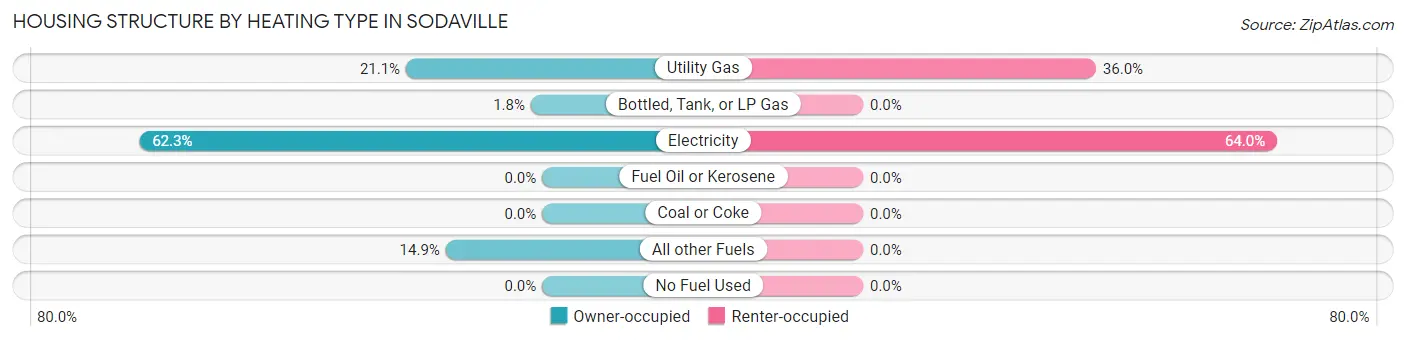
| Heating Type | Owner-occupied | Renter-occupied |
| Utility Gas | 24 (21.0%) | 9 (36.0%) |
| Bottled, Tank, or LP Gas | 2 (1.8%) | 0 (0.0%) |
| Electricity | 71 (62.3%) | 16 (64.0%) |
| Fuel Oil or Kerosene | 0 (0.0%) | 0 (0.0%) |
| Coal or Coke | 0 (0.0%) | 0 (0.0%) |
| All other Fuels | 17 (14.9%) | 0 (0.0%) |
| No Fuel Used | 0 (0.0%) | 0 (0.0%) |
| Total | 114 (100.0%) | 25 (100.0%) |
Household Vehicle Usage in Sodaville
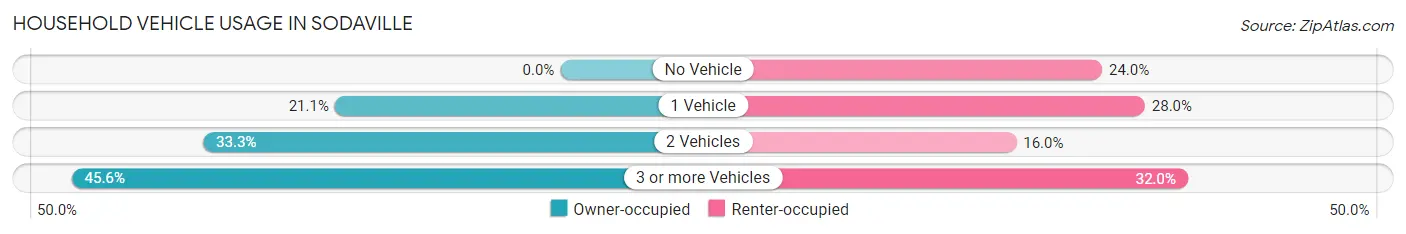
| Vehicles per Household | Owner-occupied | Renter-occupied |
| No Vehicle | 0 (0.0%) | 6 (24.0%) |
| 1 Vehicle | 24 (21.0%) | 7 (28.0%) |
| 2 Vehicles | 38 (33.3%) | 4 (16.0%) |
| 3 or more Vehicles | 52 (45.6%) | 8 (32.0%) |
| Total | 114 (100.0%) | 25 (100.0%) |
Real Estate & Mortgages in Sodaville
Real Estate and Mortgage Overview in Sodaville
| Characteristic | Without Mortgage | With Mortgage |
| Housing Units | 22 | 92 |
| Median Property Value | - | - |
| Median Household Income | $46,250 | $7 |
| Monthly Housing Costs | $480 | $5 |
| Real Estate Taxes | $1,917 | $0 |
Property Value by Mortgage Status in Sodaville
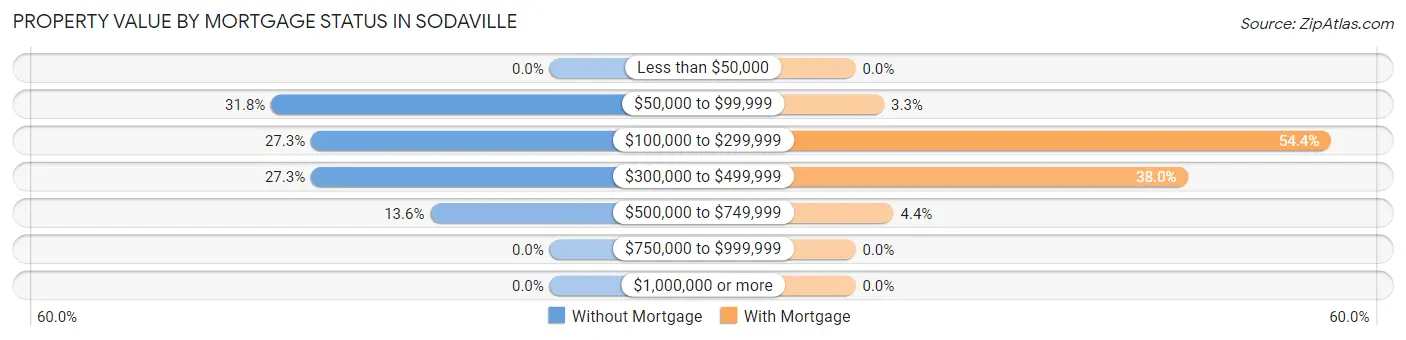
| Property Value | Without Mortgage | With Mortgage |
| Less than $50,000 | 0 (0.0%) | 0 (0.0%) |
| $50,000 to $99,999 | 7 (31.8%) | 3 (3.3%) |
| $100,000 to $299,999 | 6 (27.3%) | 50 (54.3%) |
| $300,000 to $499,999 | 6 (27.3%) | 35 (38.0%) |
| $500,000 to $749,999 | 3 (13.6%) | 4 (4.3%) |
| $750,000 to $999,999 | 0 (0.0%) | 0 (0.0%) |
| $1,000,000 or more | 0 (0.0%) | 0 (0.0%) |
| Total | 22 (100.0%) | 92 (100.0%) |
Household Income by Mortgage Status in Sodaville
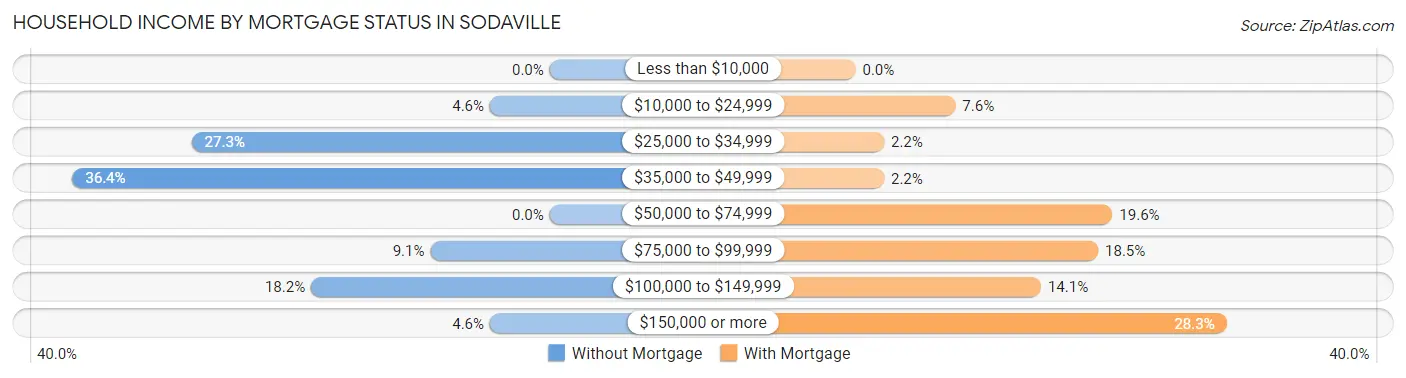
| Household Income | Without Mortgage | With Mortgage |
| Less than $10,000 | 0 (0.0%) | 0 (0.0%) |
| $10,000 to $24,999 | 1 (4.5%) | 7 (7.6%) |
| $25,000 to $34,999 | 6 (27.3%) | 2 (2.2%) |
| $35,000 to $49,999 | 8 (36.4%) | 2 (2.2%) |
| $50,000 to $74,999 | 0 (0.0%) | 18 (19.6%) |
| $75,000 to $99,999 | 2 (9.1%) | 17 (18.5%) |
| $100,000 to $149,999 | 4 (18.2%) | 13 (14.1%) |
| $150,000 or more | 1 (4.5%) | 26 (28.3%) |
| Total | 22 (100.0%) | 92 (100.0%) |
Property Value to Household Income Ratio in Sodaville
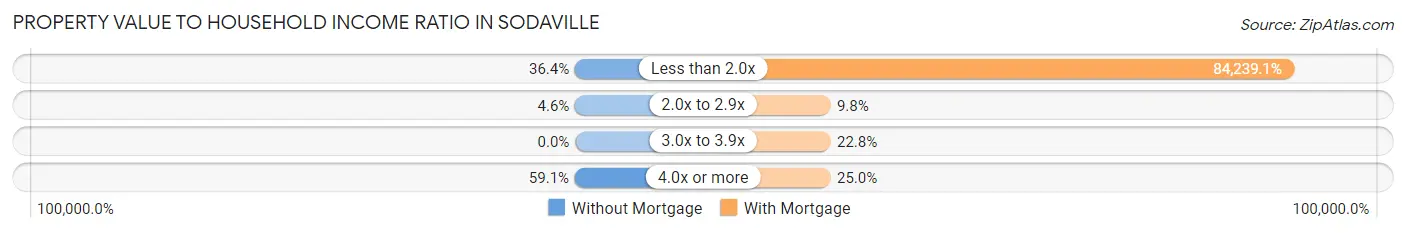
| Value-to-Income Ratio | Without Mortgage | With Mortgage |
| Less than 2.0x | 8 (36.4%) | 77,500 (84,239.1%) |
| 2.0x to 2.9x | 1 (4.5%) | 9 (9.8%) |
| 3.0x to 3.9x | 0 (0.0%) | 21 (22.8%) |
| 4.0x or more | 13 (59.1%) | 23 (25.0%) |
| Total | 22 (100.0%) | 92 (100.0%) |
Real Estate Taxes by Mortgage Status in Sodaville
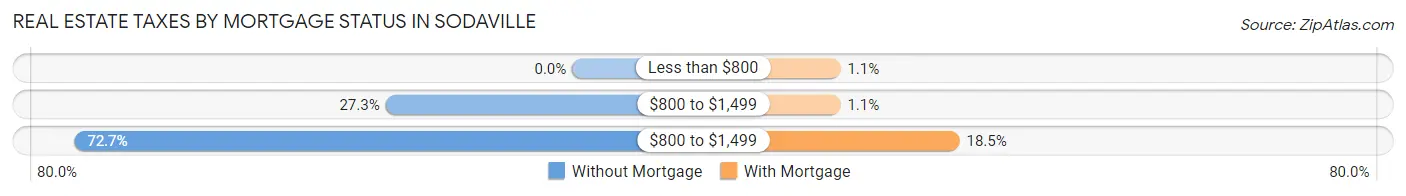
| Property Taxes | Without Mortgage | With Mortgage |
| Less than $800 | 0 (0.0%) | 1 (1.1%) |
| $800 to $1,499 | 6 (27.3%) | 1 (1.1%) |
| $800 to $1,499 | 16 (72.7%) | 17 (18.5%) |
| Total | 22 (100.0%) | 92 (100.0%) |
Health & Disability in Sodaville
Health Insurance Coverage by Age in Sodaville
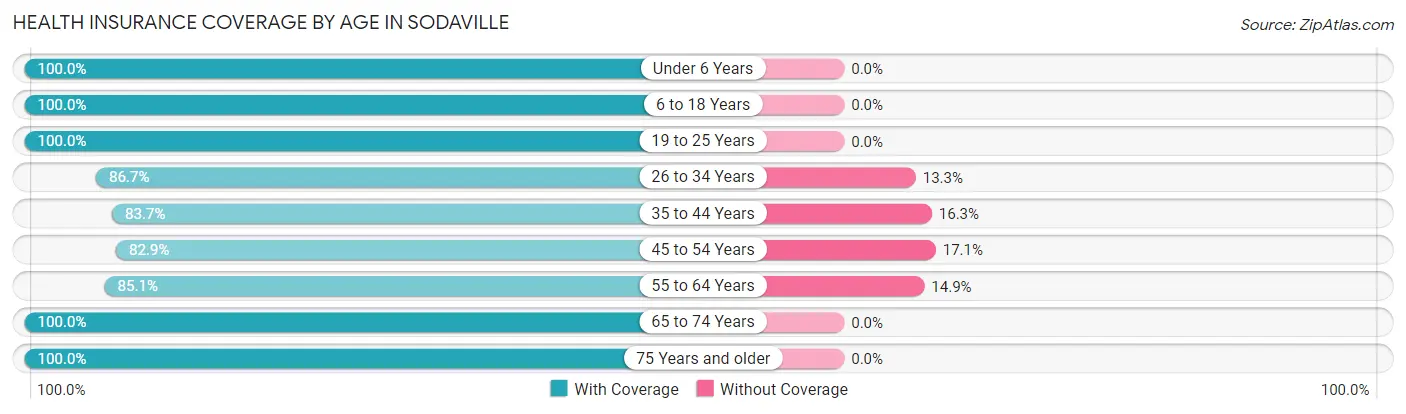
| Age Bracket | With Coverage | Without Coverage |
| Under 6 Years | 18 (100.0%) | 0 (0.0%) |
| 6 to 18 Years | 59 (100.0%) | 0 (0.0%) |
| 19 to 25 Years | 20 (100.0%) | 0 (0.0%) |
| 26 to 34 Years | 26 (86.7%) | 4 (13.3%) |
| 35 to 44 Years | 41 (83.7%) | 8 (16.3%) |
| 45 to 54 Years | 34 (82.9%) | 7 (17.1%) |
| 55 to 64 Years | 74 (85.1%) | 13 (14.9%) |
| 65 to 74 Years | 48 (100.0%) | 0 (0.0%) |
| 75 Years and older | 10 (100.0%) | 0 (0.0%) |
| Total | 330 (91.2%) | 32 (8.8%) |
Health Insurance Coverage by Citizenship Status in Sodaville
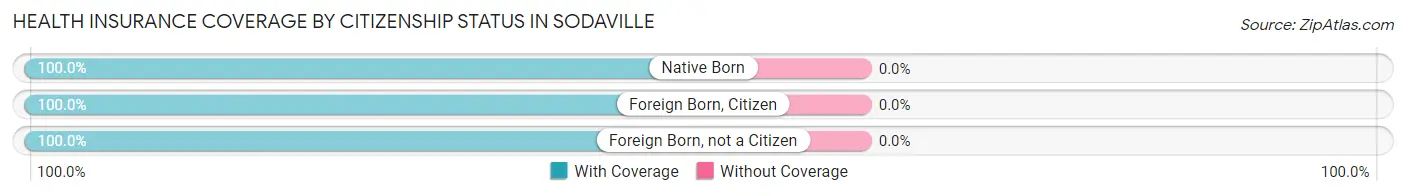
| Citizenship Status | With Coverage | Without Coverage |
| Native Born | 18 (100.0%) | 0 (0.0%) |
| Foreign Born, Citizen | 59 (100.0%) | 0 (0.0%) |
| Foreign Born, not a Citizen | 20 (100.0%) | 0 (0.0%) |
Health Insurance Coverage by Household Income in Sodaville
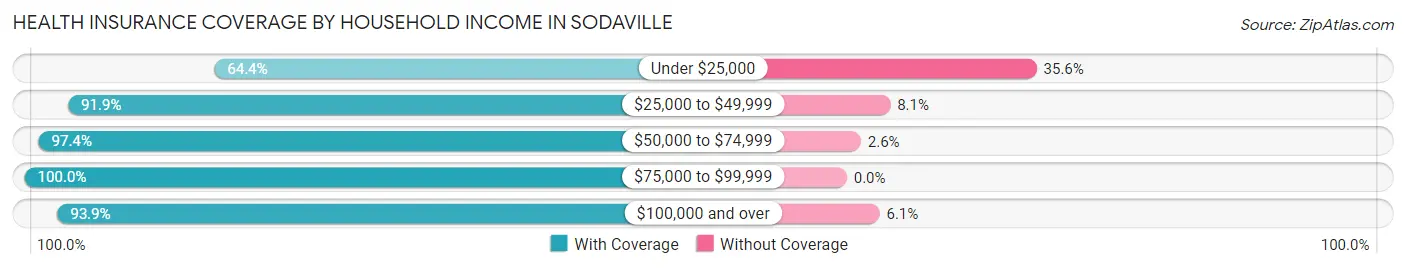
| Household Income | With Coverage | Without Coverage |
| Under $25,000 | 29 (64.4%) | 16 (35.6%) |
| $25,000 to $49,999 | 79 (91.9%) | 7 (8.1%) |
| $50,000 to $74,999 | 74 (97.4%) | 2 (2.6%) |
| $75,000 to $99,999 | 41 (100.0%) | 0 (0.0%) |
| $100,000 and over | 107 (93.9%) | 7 (6.1%) |
Public vs Private Health Insurance Coverage by Age in Sodaville
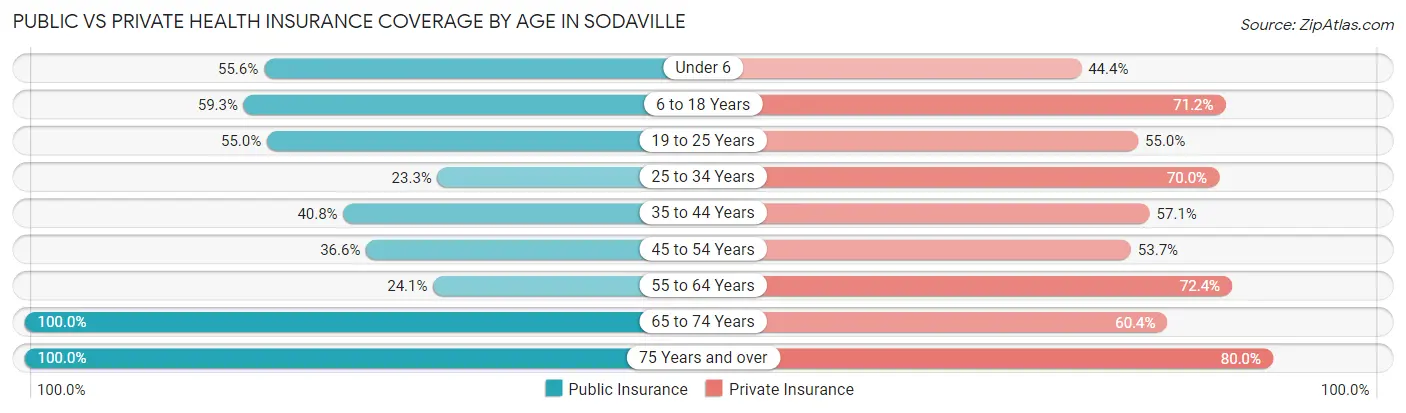
| Age Bracket | Public Insurance | Private Insurance |
| Under 6 | 10 (55.6%) | 8 (44.4%) |
| 6 to 18 Years | 35 (59.3%) | 42 (71.2%) |
| 19 to 25 Years | 11 (55.0%) | 11 (55.0%) |
| 25 to 34 Years | 7 (23.3%) | 21 (70.0%) |
| 35 to 44 Years | 20 (40.8%) | 28 (57.1%) |
| 45 to 54 Years | 15 (36.6%) | 22 (53.7%) |
| 55 to 64 Years | 21 (24.1%) | 63 (72.4%) |
| 65 to 74 Years | 48 (100.0%) | 29 (60.4%) |
| 75 Years and over | 10 (100.0%) | 8 (80.0%) |
| Total | 177 (48.9%) | 232 (64.1%) |
Disability Status by Sex by Age in Sodaville
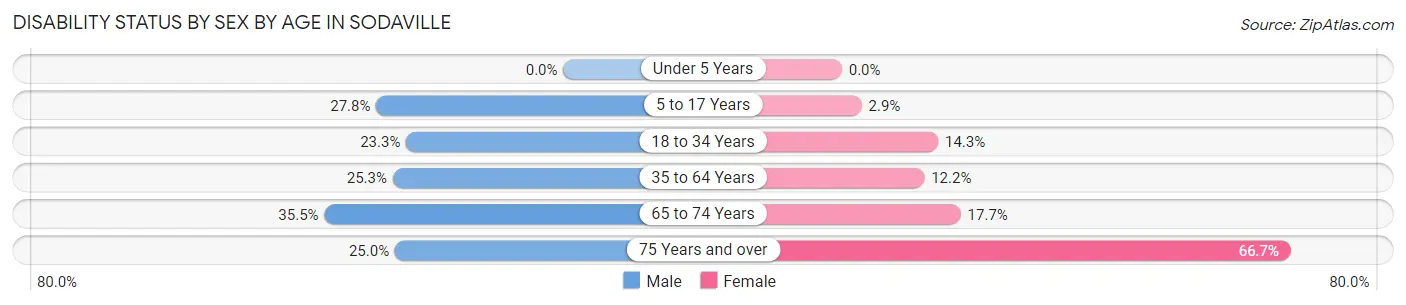
| Age Bracket | Male | Female |
| Under 5 Years | 0 (0.0%) | 0 (0.0%) |
| 5 to 17 Years | 5 (27.8%) | 1 (2.9%) |
| 18 to 34 Years | 7 (23.3%) | 4 (14.3%) |
| 35 to 64 Years | 20 (25.3%) | 12 (12.2%) |
| 65 to 74 Years | 11 (35.5%) | 3 (17.6%) |
| 75 Years and over | 1 (25.0%) | 4 (66.7%) |
Disability Class by Sex by Age in Sodaville
Disability Class: Hearing Difficulty
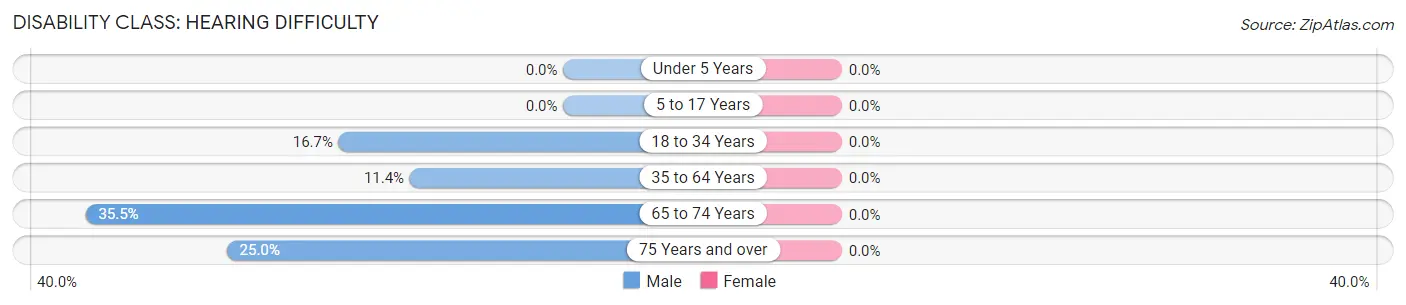
| Age Bracket | Male | Female |
| Under 5 Years | 0 (0.0%) | 0 (0.0%) |
| 5 to 17 Years | 0 (0.0%) | 0 (0.0%) |
| 18 to 34 Years | 5 (16.7%) | 0 (0.0%) |
| 35 to 64 Years | 9 (11.4%) | 0 (0.0%) |
| 65 to 74 Years | 11 (35.5%) | 0 (0.0%) |
| 75 Years and over | 1 (25.0%) | 0 (0.0%) |
Disability Class: Vision Difficulty
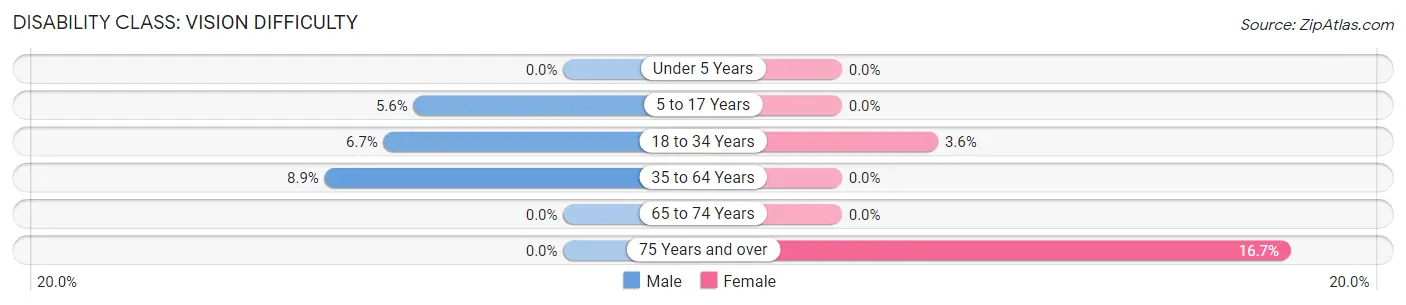
| Age Bracket | Male | Female |
| Under 5 Years | 0 (0.0%) | 0 (0.0%) |
| 5 to 17 Years | 1 (5.6%) | 0 (0.0%) |
| 18 to 34 Years | 2 (6.7%) | 1 (3.6%) |
| 35 to 64 Years | 7 (8.9%) | 0 (0.0%) |
| 65 to 74 Years | 0 (0.0%) | 0 (0.0%) |
| 75 Years and over | 0 (0.0%) | 1 (16.7%) |
Disability Class: Cognitive Difficulty
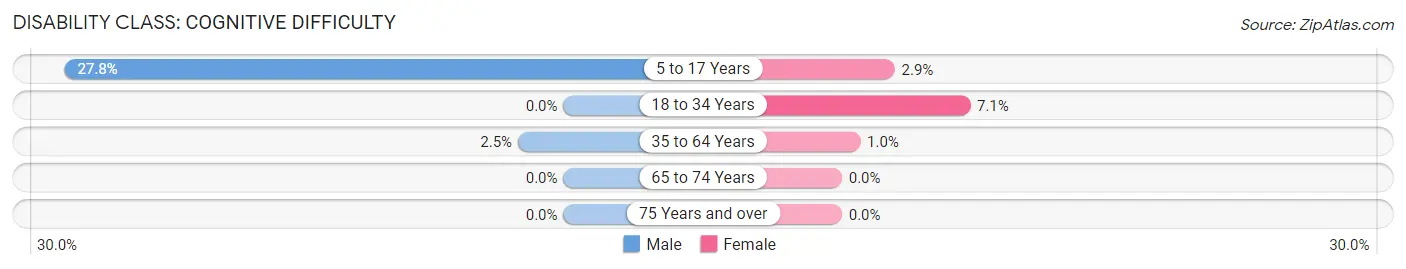
| Age Bracket | Male | Female |
| 5 to 17 Years | 5 (27.8%) | 1 (2.9%) |
| 18 to 34 Years | 0 (0.0%) | 2 (7.1%) |
| 35 to 64 Years | 2 (2.5%) | 1 (1.0%) |
| 65 to 74 Years | 0 (0.0%) | 0 (0.0%) |
| 75 Years and over | 0 (0.0%) | 0 (0.0%) |
Disability Class: Ambulatory Difficulty
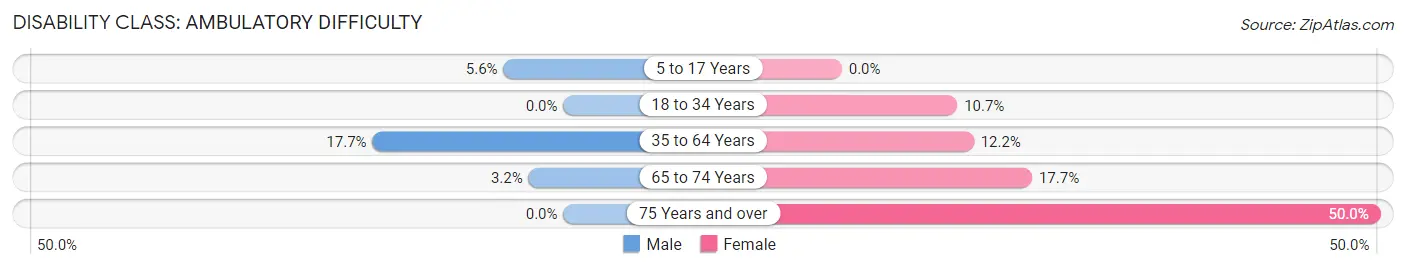
| Age Bracket | Male | Female |
| 5 to 17 Years | 1 (5.6%) | 0 (0.0%) |
| 18 to 34 Years | 0 (0.0%) | 3 (10.7%) |
| 35 to 64 Years | 14 (17.7%) | 12 (12.2%) |
| 65 to 74 Years | 1 (3.2%) | 3 (17.6%) |
| 75 Years and over | 0 (0.0%) | 3 (50.0%) |
Disability Class: Self-Care Difficulty
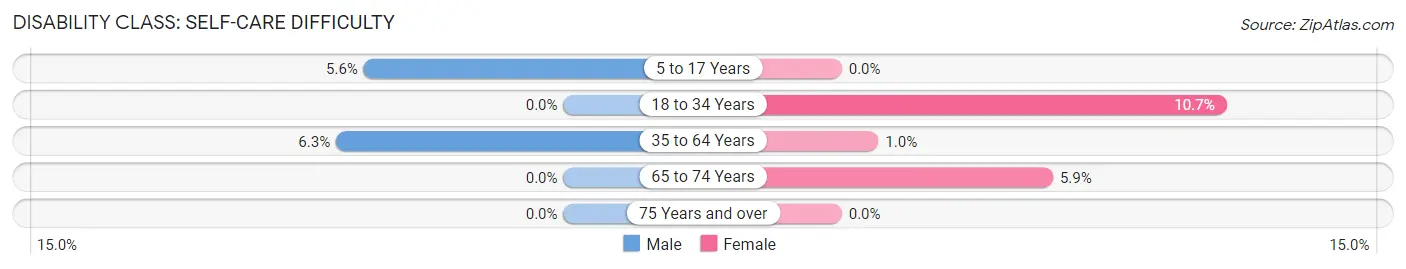
| Age Bracket | Male | Female |
| 5 to 17 Years | 1 (5.6%) | 0 (0.0%) |
| 18 to 34 Years | 0 (0.0%) | 3 (10.7%) |
| 35 to 64 Years | 5 (6.3%) | 1 (1.0%) |
| 65 to 74 Years | 0 (0.0%) | 1 (5.9%) |
| 75 Years and over | 0 (0.0%) | 0 (0.0%) |
Technology Access in Sodaville
Computing Device Access in Sodaville
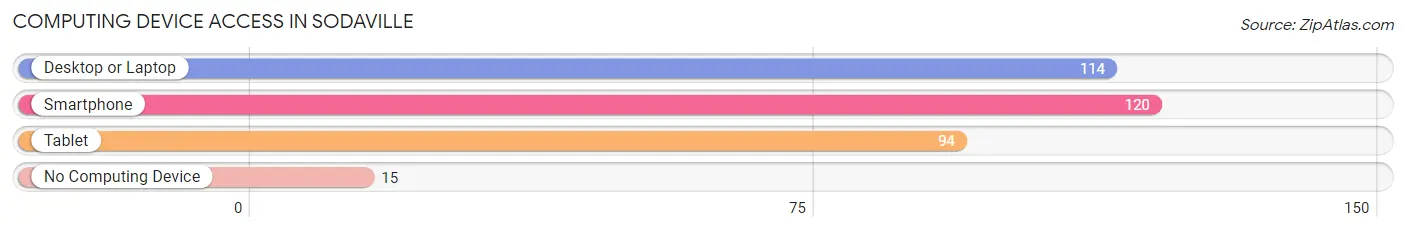
| Device Type | # Households | % Households |
| Desktop or Laptop | 114 | 82.0% |
| Smartphone | 120 | 86.3% |
| Tablet | 94 | 67.6% |
| No Computing Device | 15 | 10.8% |
| Total | 139 | 100.0% |
Internet Access in Sodaville
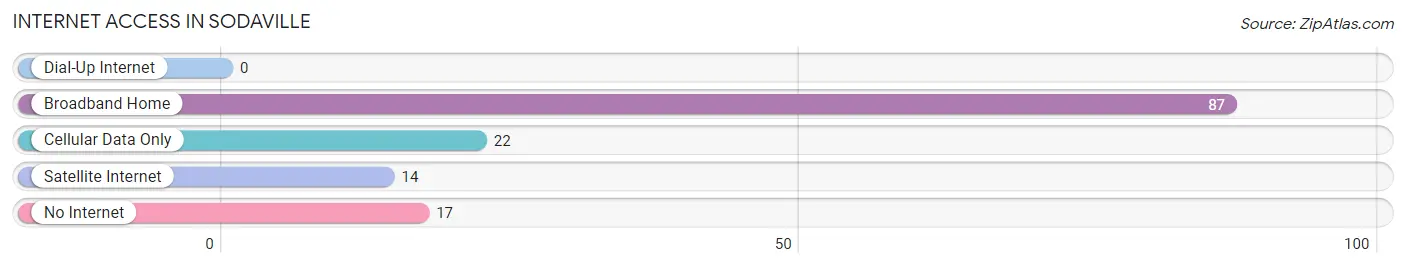
| Internet Type | # Households | % Households |
| Dial-Up Internet | 0 | 0.0% |
| Broadband Home | 87 | 62.6% |
| Cellular Data Only | 22 | 15.8% |
| Satellite Internet | 14 | 10.1% |
| No Internet | 17 | 12.2% |
| Total | 139 | 100.0% |
Sodaville Summary
Sodaville is a small unincorporated community located in the foothills of the Cascade Mountains in Linn County, Oregon. It is situated along the banks of the Calapooia River, approximately 10 miles east of Sweet Home and 25 miles south of Albany. The population of Sodaville was estimated to be around 500 in 2020.
History
Sodaville was founded in 1845 by a group of settlers from the Willamette Valley. The settlers were looking for a place to settle and farm, and they found the area around Sodaville to be ideal. The settlers named the area after the nearby Soda Springs, which were believed to have healing properties. The first post office in Sodaville was established in 1851.
In the late 1800s, Sodaville was a bustling community with a variety of businesses, including a hotel, a general store, a blacksmith shop, and a sawmill. The town also had a school, a church, and a cemetery.
Geography
Sodaville is located in the foothills of the Cascade Mountains in Linn County, Oregon. The town is situated along the banks of the Calapooia River, approximately 10 miles east of Sweet Home and 25 miles south of Albany. The town is surrounded by rolling hills and lush forests. The climate in Sodaville is mild, with temperatures ranging from the mid-30s in the winter to the mid-80s in the summer.
Economy
Sodaville’s economy is largely based on agriculture and timber. The town is home to several farms, which produce a variety of crops, including hay, wheat, and oats. The town also has several sawmills, which produce lumber for the local market.
In addition to agriculture and timber, Sodaville is home to several small businesses, including a grocery store, a hardware store, and a restaurant. The town also has a post office and a library.
Demographics
As of 2020, the population of Sodaville was estimated to be around 500. The town is predominantly white, with a small Hispanic population. The median household income in Sodaville is $45,000, and the median home value is $150,000. The town has a low unemployment rate and a high rate of homeownership.
Conclusion
Sodaville is a small unincorporated community located in the foothills of the Cascade Mountains in Linn County, Oregon. It was founded in 1845 by a group of settlers from the Willamette Valley and has since grown into a bustling community with a variety of businesses and a population of around 500. The town’s economy is largely based on agriculture and timber, and it is home to several small businesses, including a grocery store, a hardware store, and a restaurant. The town is predominantly white, with a small Hispanic population, and the median household income is $45,000. Sodaville is a peaceful and picturesque community with a rich history and a bright future.
Common Questions
What is the Total Population of Sodaville?
Total Population of Sodaville is 364.
What is the Total Male Population of Sodaville?
Total Male Population of Sodaville is 170.
What is the Total Female Population of Sodaville?
Total Female Population of Sodaville is 194.
What is the Ratio of Males per 100 Females in Sodaville?
There are 87.63 Males per 100 Females in Sodaville.
What is the Ratio of Females per 100 Males in Sodaville?
There are 114.12 Females per 100 Males in Sodaville.
What is the Median Population Age in Sodaville?
Median Population Age in Sodaville is 45.7 Years.
What is the Average Family Size in Sodaville
Average Family Size in Sodaville is 2.8 People.
What is the Average Household Size in Sodaville
Average Household Size in Sodaville is 2.6 People.
What is Per Capita Income in Sodaville?
Per Capita income in Sodaville is $28,423.
What is the Median Family Income in Sodaville?
Median Family Income in Sodaville is $54,583.
What is the Median Household income in Sodaville?
Median Household Income in Sodaville is $53,958.
What is Income or Wage Gap in Sodaville?
Income or Wage Gap in Sodaville is 45.6%.
Women in Sodaville earn 54.4 cents for every dollar earned by a man.
What is Inequality or Gini Index in Sodaville?
Inequality or Gini Index in Sodaville is 0.41.
How Large is the Labor Force in Sodaville?
There are 152 People in the Labor Forcein in Sodaville.
What is the Percentage of People in the Labor Force in Sodaville?
50.7% of People are in the Labor Force in Sodaville.
What is the Unemployment Rate in Sodaville?
Unemployment Rate in Sodaville is 5.3%.