Nyssa, OR
Nyssa Map
Nyssa Overview
3,202
TOTAL POPULATION
1,588
MALE POPULATION
1,614
FEMALE POPULATION
98.39
MALES / 100 FEMALES
101.64
FEMALES / 100 MALES
24.5
MEDIAN AGE
3.8
AVG FAMILY SIZE
3.2
AVG HOUSEHOLD SIZE
$19,931
PER CAPITA INCOME
$54,667
AVG FAMILY INCOME
$46,950
AVG HOUSEHOLD INCOME
40.8%
WAGE / INCOME GAP [ % ]
59.2¢/ $1
WAGE / INCOME GAP [ $ ]
0.39
INEQUALITY / GINI INDEX
1,332
LABOR FORCE [ PEOPLE ]
59.8%
PERCENT IN LABOR FORCE
7.4%
UNEMPLOYMENT RATE
Nyssa Zip Codes
Nyssa Area Codes
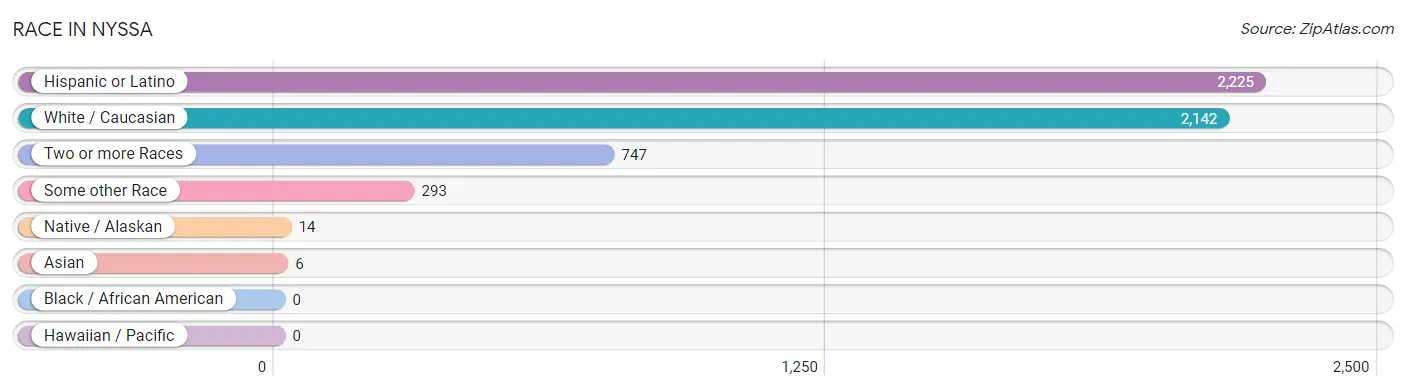
Race in Nyssa
The most populous races in Nyssa are Hispanic or Latino (2,225 | 69.5%), White / Caucasian (2,142 | 66.9%), and Two or more Races (747 | 23.3%).
| Race | # Population | % Population |
| Asian | 6 | 0.2% |
| Black / African American | 0 | 0.0% |
| Hawaiian / Pacific | 0 | 0.0% |
| Hispanic or Latino | 2,225 | 69.5% |
| Native / Alaskan | 14 | 0.4% |
| White / Caucasian | 2,142 | 66.9% |
| Two or more Races | 747 | 23.3% |
| Some other Race | 293 | 9.1% |
| Total | 3,202 | 100.0% |
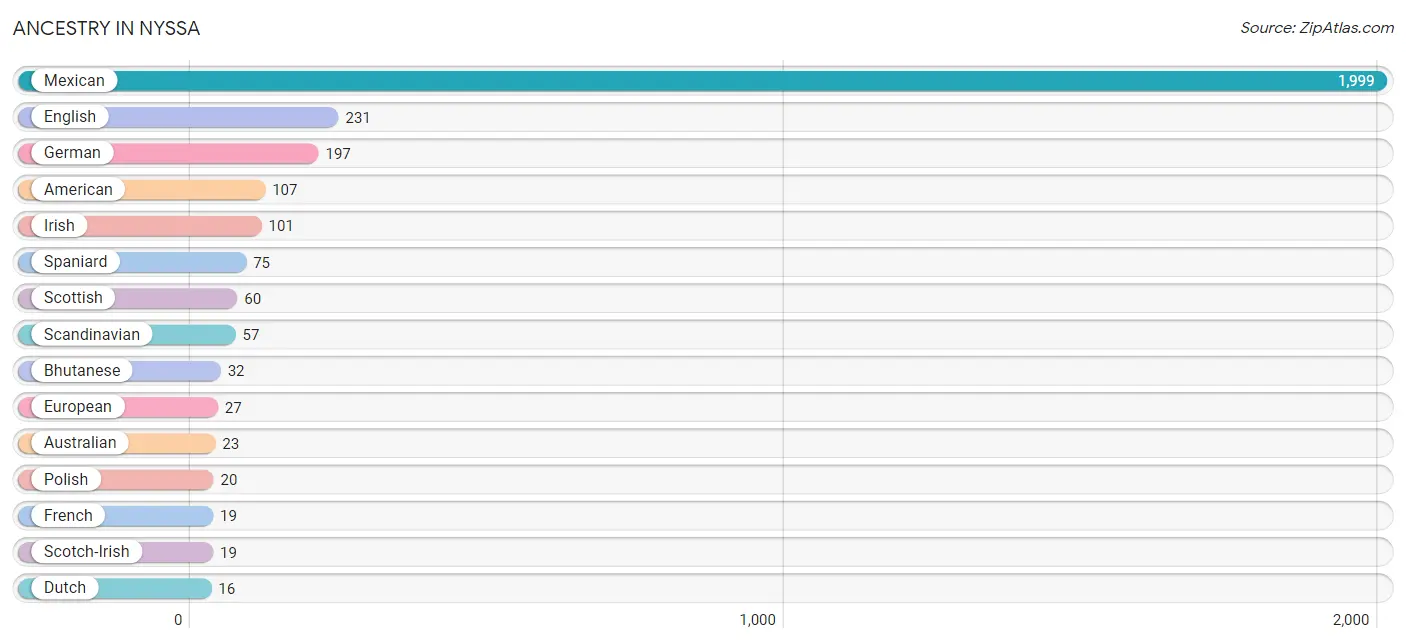
Ancestry in Nyssa
The most populous ancestries reported in Nyssa are Mexican (1,999 | 62.4%), English (231 | 7.2%), German (197 | 6.1%), American (107 | 3.3%), and Irish (101 | 3.2%), together accounting for 82.3% of all Nyssa residents.
| Ancestry | # Population | % Population |
| American | 107 | 3.3% |
| Apache | 12 | 0.4% |
| Australian | 23 | 0.7% |
| Basque | 13 | 0.4% |
| Bhutanese | 32 | 1.0% |
| Blackfeet | 8 | 0.3% |
| British | 5 | 0.2% |
| Canadian | 3 | 0.1% |
| Central American | 7 | 0.2% |
| Cherokee | 12 | 0.4% |
| Chippewa | 12 | 0.4% |
| Dutch | 16 | 0.5% |
| English | 231 | 7.2% |
| European | 27 | 0.8% |
| French | 19 | 0.6% |
| German | 197 | 6.1% |
| Greek | 4 | 0.1% |
| Guatemalan | 7 | 0.2% |
| Irish | 101 | 3.2% |
| Mexican | 1,999 | 62.4% |
| Navajo | 12 | 0.4% |
| New Zealander | 13 | 0.4% |
| Polish | 20 | 0.6% |
| Scandinavian | 57 | 1.8% |
| Scotch-Irish | 19 | 0.6% |
| Scottish | 60 | 1.9% |
| Spaniard | 75 | 2.3% |
| Spanish | 4 | 0.1% |
| Yup'ik | 7 | 0.2% | View All 29 Rows |
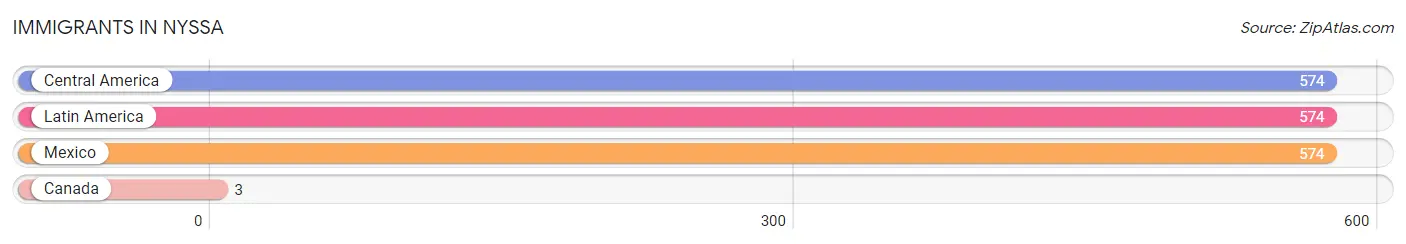
Immigrants in Nyssa
The most numerous immigrant groups reported in Nyssa came from Central America (574 | 17.9%), Latin America (574 | 17.9%), Mexico (574 | 17.9%), and Canada (3 | 0.1%), together accounting for 53.9% of all Nyssa residents.
| Immigration Origin | # Population | % Population |
| Canada | 3 | 0.1% |
| Central America | 574 | 17.9% |
| Latin America | 574 | 17.9% |
| Mexico | 574 | 17.9% | View All 4 Rows |
Sex and Age in Nyssa
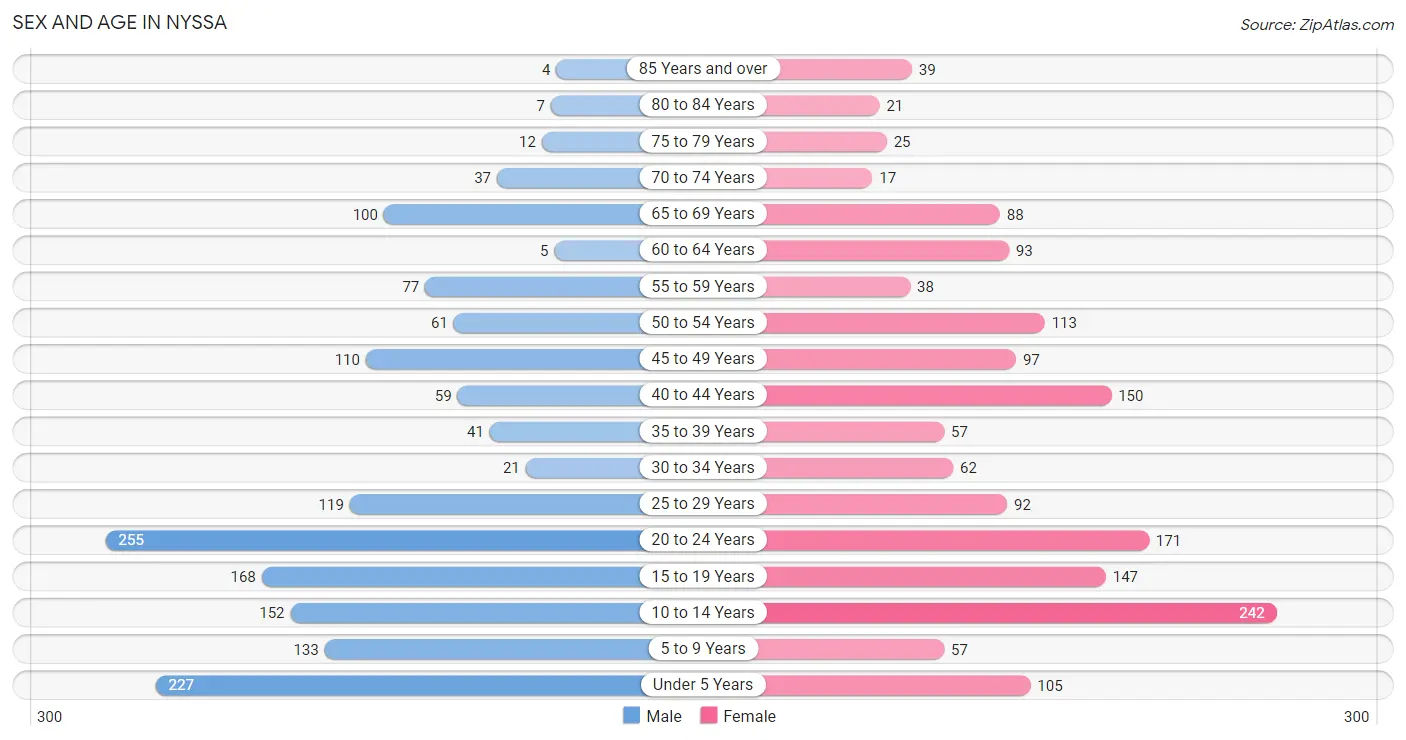
Sex and Age in Nyssa
The most populous age groups in Nyssa are 20 to 24 Years (255 | 16.1%) for men and 10 to 14 Years (242 | 15.0%) for women.
| Age Bracket | Male | Female |
| Under 5 Years | 227 (14.3%) | 105 (6.5%) |
| 5 to 9 Years | 133 (8.4%) | 57 (3.5%) |
| 10 to 14 Years | 152 (9.6%) | 242 (15.0%) |
| 15 to 19 Years | 168 (10.6%) | 147 (9.1%) |
| 20 to 24 Years | 255 (16.1%) | 171 (10.6%) |
| 25 to 29 Years | 119 (7.5%) | 92 (5.7%) |
| 30 to 34 Years | 21 (1.3%) | 62 (3.8%) |
| 35 to 39 Years | 41 (2.6%) | 57 (3.5%) |
| 40 to 44 Years | 59 (3.7%) | 150 (9.3%) |
| 45 to 49 Years | 110 (6.9%) | 97 (6.0%) |
| 50 to 54 Years | 61 (3.8%) | 113 (7.0%) |
| 55 to 59 Years | 77 (4.9%) | 38 (2.4%) |
| 60 to 64 Years | 5 (0.3%) | 93 (5.8%) |
| 65 to 69 Years | 100 (6.3%) | 88 (5.4%) |
| 70 to 74 Years | 37 (2.3%) | 17 (1.1%) |
| 75 to 79 Years | 12 (0.8%) | 25 (1.5%) |
| 80 to 84 Years | 7 (0.4%) | 21 (1.3%) |
| 85 Years and over | 4 (0.3%) | 39 (2.4%) |
| Total | 1,588 (100.0%) | 1,614 (100.0%) |
Families and Households in Nyssa
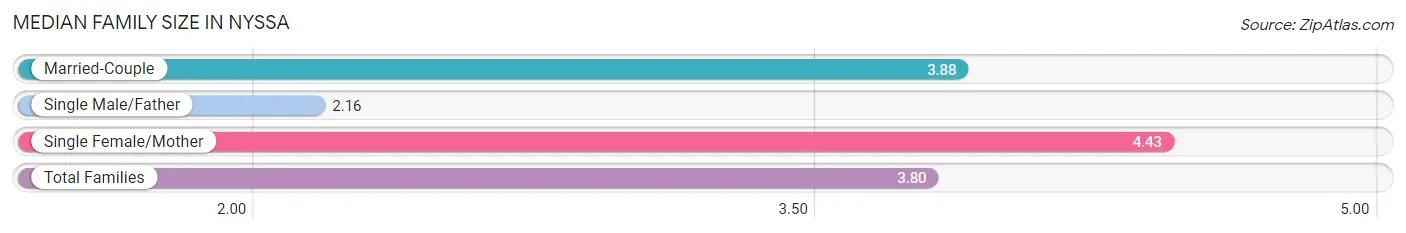
Median Family Size in Nyssa
The median family size in Nyssa is 3.80 persons per family, with single female/mother families (214 | 29.8%) accounting for the largest median family size of 4.43 persons per family. On the other hand, single male/father families (102 | 14.2%) represent the smallest median family size with 2.16 persons per family.
| Family Type | # Families | Family Size |
| Married-Couple | 402 (56.0%) | 3.88 |
| Single Male/Father | 102 (14.2%) | 2.16 |
| Single Female/Mother | 214 (29.8%) | 4.43 |
| Total Families | 718 (100.0%) | 3.80 |
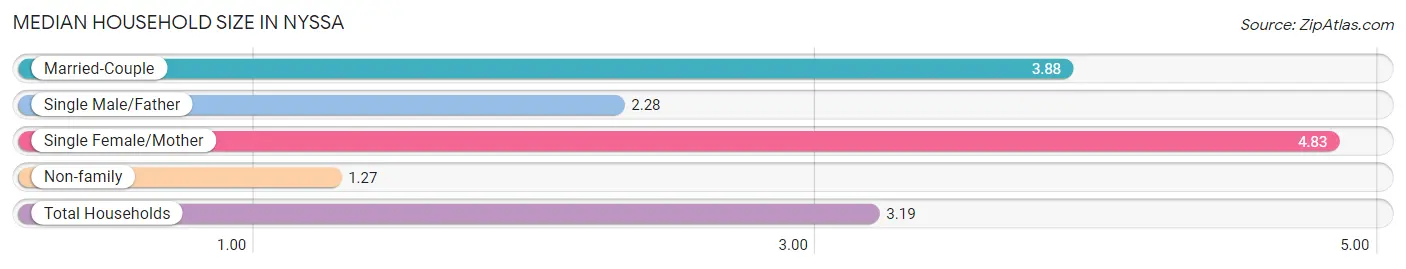
Median Household Size in Nyssa
The median household size in Nyssa is 3.19 persons per household, with single female/mother households (214 | 21.5%) accounting for the largest median household size of 4.83 persons per household. non-family households (279 | 28.0%) represent the smallest median household size with 1.27 persons per household.
| Household Type | # Households | Household Size |
| Married-Couple | 402 (40.3%) | 3.88 |
| Single Male/Father | 102 (10.2%) | 2.28 |
| Single Female/Mother | 214 (21.5%) | 4.83 |
| Non-family | 279 (28.0%) | 1.27 |
| Total Households | 997 (100.0%) | 3.19 |
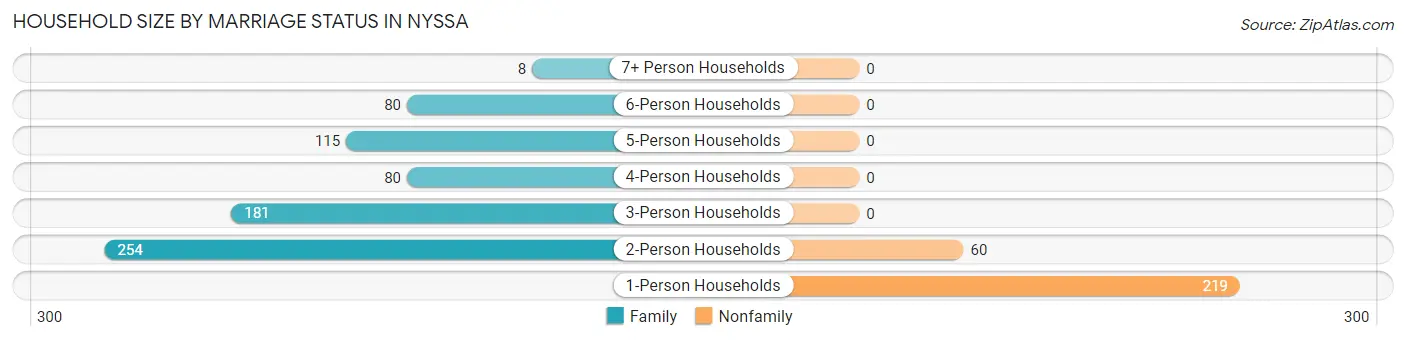
Household Size by Marriage Status in Nyssa
Out of a total of 997 households in Nyssa, 718 (72.0%) are family households, while 279 (28.0%) are nonfamily households. The most numerous type of family households are 2-person households, comprising 254, and the most common type of nonfamily households are 1-person households, comprising 219.
| Household Size | Family Households | Nonfamily Households |
| 1-Person Households | - | 219 (22.0%) |
| 2-Person Households | 254 (25.5%) | 60 (6.0%) |
| 3-Person Households | 181 (18.1%) | 0 (0.0%) |
| 4-Person Households | 80 (8.0%) | 0 (0.0%) |
| 5-Person Households | 115 (11.5%) | 0 (0.0%) |
| 6-Person Households | 80 (8.0%) | 0 (0.0%) |
| 7+ Person Households | 8 (0.8%) | 0 (0.0%) |
| Total | 718 (72.0%) | 279 (28.0%) |
Female Fertility in Nyssa
Fertility by Age in Nyssa
Average fertility rate in Nyssa is 90.0 births per 1,000 women. Women in the age bracket of 20 to 34 years have the highest fertility rate with 182.0 births per 1,000 women. Women in the age bracket of 20 to 34 years acount for 83.1% of all women with births.
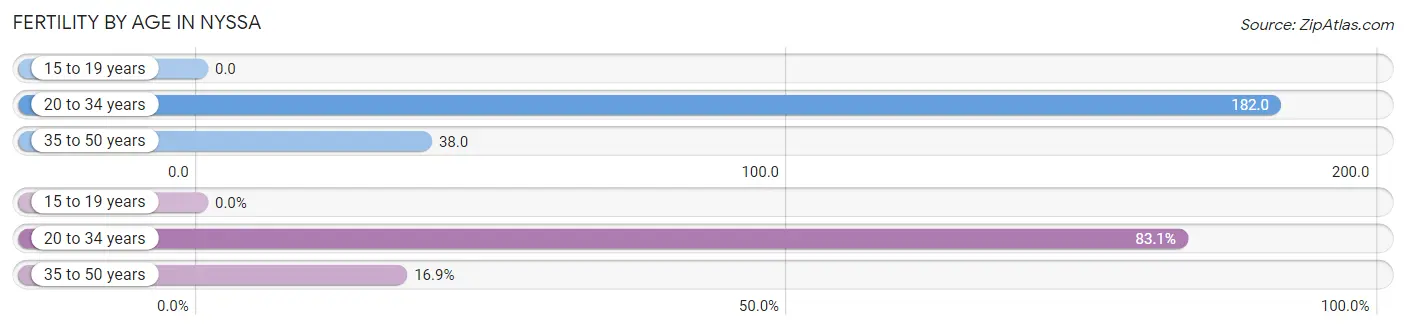
| Age Bracket | Women with Births | Births / 1,000 Women |
| 15 to 19 years | 0 (0.0%) | 0.0 |
| 20 to 34 years | 59 (83.1%) | 182.0 |
| 35 to 50 years | 12 (16.9%) | 38.0 |
| Total | 71 (100.0%) | 90.0 |
Fertility by Age by Marriage Status in Nyssa
40.8% of women with births (71) in Nyssa are married. The highest percentage of unmarried women with births falls into 35 to 50 years age bracket with 100.0% of them unmarried at the time of birth, while the lowest percentage of unmarried women with births belong to 20 to 34 years age bracket with 50.8% of them unmarried.
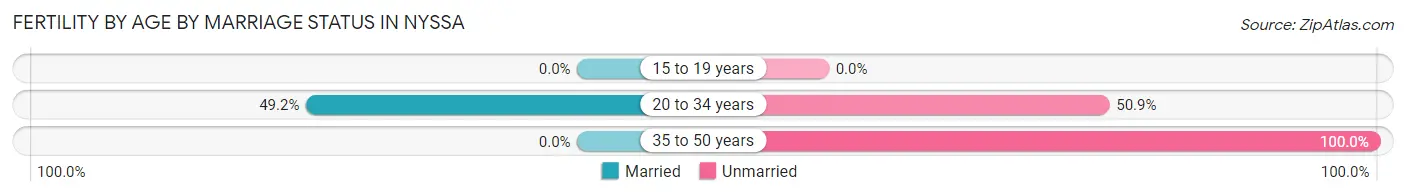
| Age Bracket | Married | Unmarried |
| 15 to 19 years | 0 (0.0%) | 0 (0.0%) |
| 20 to 34 years | 29 (49.1%) | 30 (50.8%) |
| 35 to 50 years | 0 (0.0%) | 12 (100.0%) |
| Total | 29 (40.8%) | 42 (59.2%) |
Fertility by Education in Nyssa
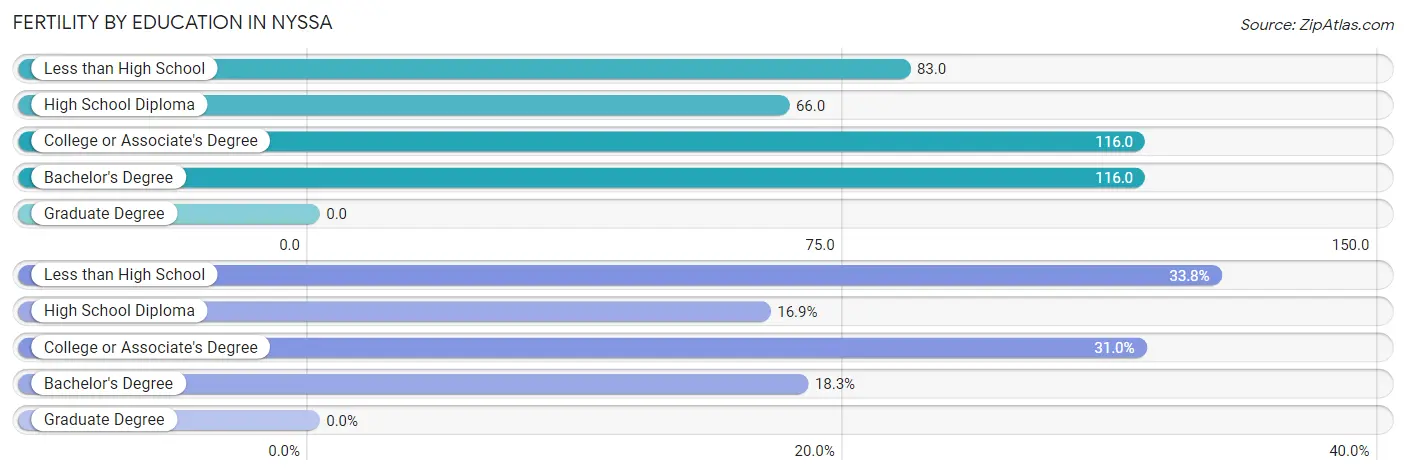
| Educational Attainment | Women with Births | Births / 1,000 Women |
| Less than High School | 24 (33.8%) | 83.0 |
| High School Diploma | 12 (16.9%) | 66.0 |
| College or Associate's Degree | 22 (31.0%) | 116.0 |
| Bachelor's Degree | 13 (18.3%) | 116.0 |
| Graduate Degree | 0 (0.0%) | 0.0 |
| Total | 71 (100.0%) | 90.0 |
Fertility by Education by Marriage Status in Nyssa
59.2% of women with births in Nyssa are unmarried. Women with the educational attainment of less than high school are most likely to be married with 100.0% of them married at childbirth, while women with the educational attainment of high school diploma are least likely to be married with 100.0% of them unmarried at childbirth.
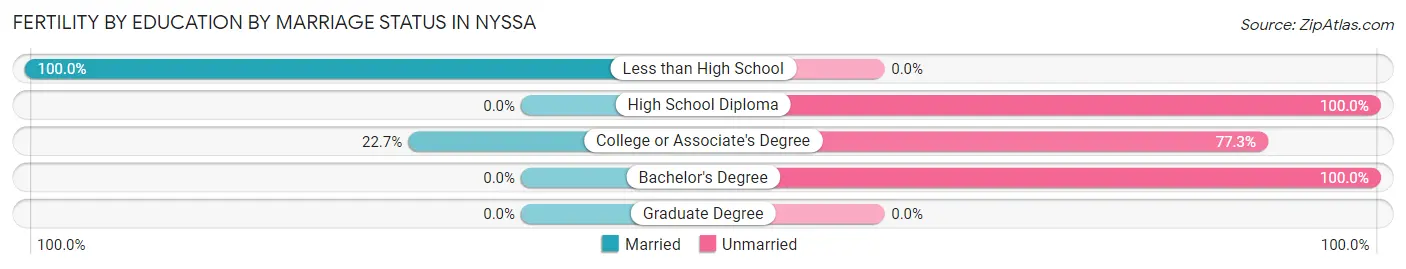
| Educational Attainment | Married | Unmarried |
| Less than High School | 24 (100.0%) | 0 (0.0%) |
| High School Diploma | 0 (0.0%) | 12 (100.0%) |
| College or Associate's Degree | 5 (22.7%) | 17 (77.3%) |
| Bachelor's Degree | 0 (0.0%) | 13 (100.0%) |
| Graduate Degree | 0 (0.0%) | 0 (0.0%) |
| Total | 29 (40.8%) | 42 (59.2%) |
Income in Nyssa
Income Overview in Nyssa
Per Capita Income in Nyssa is $19,931, while median incomes of families and households are $54,667 and $46,950 respectively.
| Characteristic | Number | Measure |
| Per Capita Income | 3,202 | $19,931 |
| Median Family Income | 718 | $54,667 |
| Mean Family Income | 718 | $62,394 |
| Median Household Income | 997 | $46,950 |
| Mean Household Income | 997 | $58,587 |
| Income Deficit | 718 | $0 |
| Wage / Income Gap (%) | 3,202 | 40.76% |
| Wage / Income Gap ($) | 3,202 | 59.24¢ per $1 |
| Gini / Inequality Index | 3,202 | 0.39 |
Earnings by Sex in Nyssa
Average Earnings in Nyssa are $26,997, $37,857 for men and $22,428 for women, a difference of 40.8%.
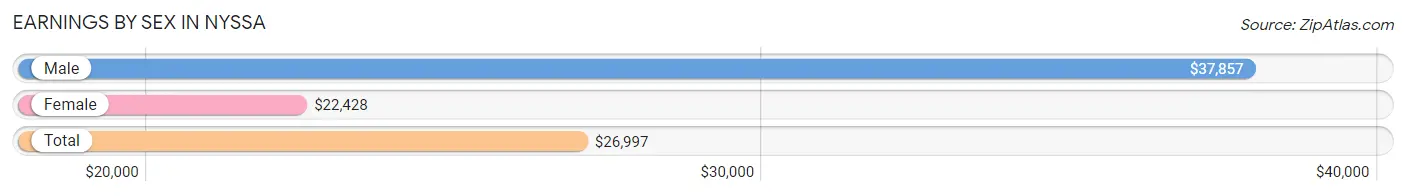
| Sex | Number | Average Earnings |
| Male | 712 (52.9%) | $37,857 |
| Female | 635 (47.1%) | $22,428 |
| Total | 1,347 (100.0%) | $26,997 |
Earnings by Sex by Income Bracket in Nyssa
The most common earnings brackets in Nyssa are $25,000 to $29,999 for men (104 | 14.6%) and $17,500 to $19,999 for women (91 | 14.3%).
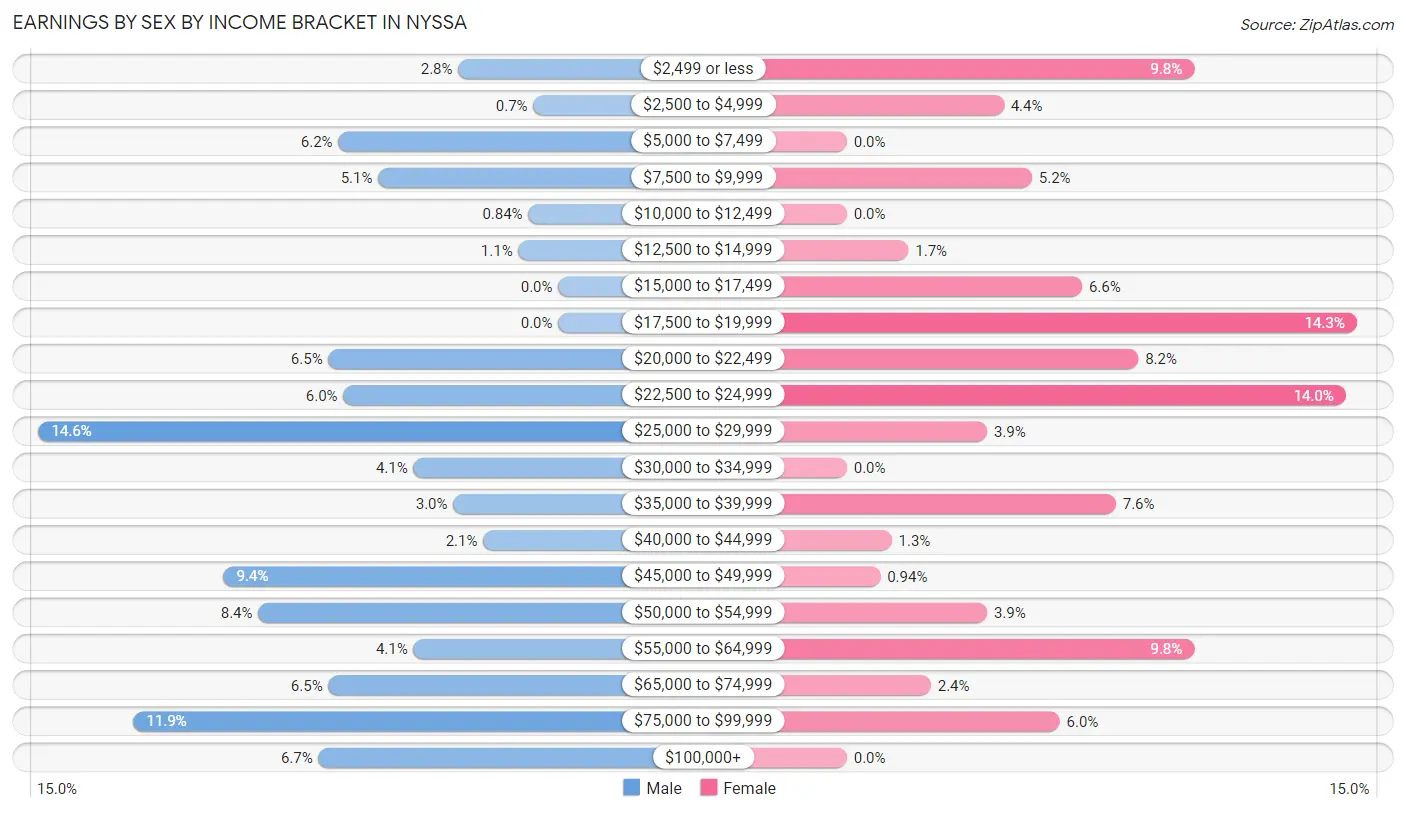
| Income | Male | Female |
| $2,499 or less | 20 (2.8%) | 62 (9.8%) |
| $2,500 to $4,999 | 5 (0.7%) | 28 (4.4%) |
| $5,000 to $7,499 | 44 (6.2%) | 0 (0.0%) |
| $7,500 to $9,999 | 36 (5.1%) | 33 (5.2%) |
| $10,000 to $12,499 | 6 (0.8%) | 0 (0.0%) |
| $12,500 to $14,999 | 8 (1.1%) | 11 (1.7%) |
| $15,000 to $17,499 | 0 (0.0%) | 42 (6.6%) |
| $17,500 to $19,999 | 0 (0.0%) | 91 (14.3%) |
| $20,000 to $22,499 | 46 (6.5%) | 52 (8.2%) |
| $22,500 to $24,999 | 43 (6.0%) | 89 (14.0%) |
| $25,000 to $29,999 | 104 (14.6%) | 25 (3.9%) |
| $30,000 to $34,999 | 29 (4.1%) | 0 (0.0%) |
| $35,000 to $39,999 | 21 (2.9%) | 48 (7.6%) |
| $40,000 to $44,999 | 15 (2.1%) | 8 (1.3%) |
| $45,000 to $49,999 | 67 (9.4%) | 6 (0.9%) |
| $50,000 to $54,999 | 60 (8.4%) | 25 (3.9%) |
| $55,000 to $64,999 | 29 (4.1%) | 62 (9.8%) |
| $65,000 to $74,999 | 46 (6.5%) | 15 (2.4%) |
| $75,000 to $99,999 | 85 (11.9%) | 38 (6.0%) |
| $100,000+ | 48 (6.7%) | 0 (0.0%) |
| Total | 712 (100.0%) | 635 (100.0%) |
Earnings by Sex by Educational Attainment in Nyssa
Average earnings in Nyssa are $49,412 for men and $24,329 for women, a difference of 50.8%. Men with an educational attainment of bachelor's degree enjoy the highest average annual earnings of $90,357, while those with less than high school education earn the least with $35,804. Women with an educational attainment of college or associate's degree earn the most with the average annual earnings of $38,693, while those with less than high school education have the smallest earnings of $18,333.
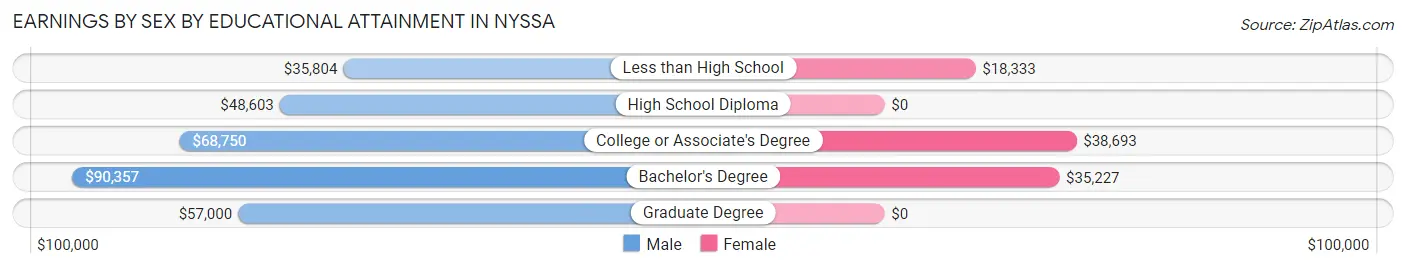
| Educational Attainment | Male Income | Female Income |
| Less than High School | $35,804 | $18,333 |
| High School Diploma | $48,603 | $0 |
| College or Associate's Degree | $68,750 | $38,693 |
| Bachelor's Degree | $90,357 | $35,227 |
| Graduate Degree | $57,000 | $0 |
| Total | $49,412 | $24,329 |
Family Income in Nyssa
Family Income Brackets in Nyssa
According to the Nyssa family income data, there are 170 families falling into the $35,000 to $49,999 income range, which is the most common income bracket and makes up 23.7% of all families.
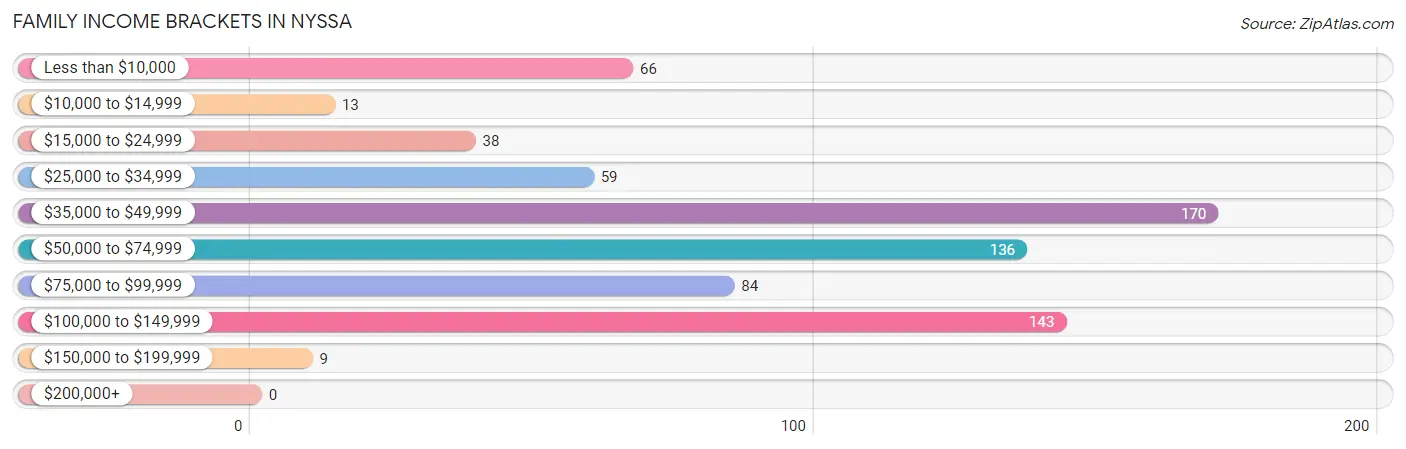
| Income Bracket | # Families | % Families |
| Less than $10,000 | 66 | 9.2% |
| $10,000 to $14,999 | 13 | 1.8% |
| $15,000 to $24,999 | 38 | 5.3% |
| $25,000 to $34,999 | 59 | 8.2% |
| $35,000 to $49,999 | 170 | 23.7% |
| $50,000 to $74,999 | 136 | 18.9% |
| $75,000 to $99,999 | 84 | 11.7% |
| $100,000 to $149,999 | 143 | 19.9% |
| $150,000 to $199,999 | 9 | 1.3% |
| $200,000+ | 0 | 0.0% |
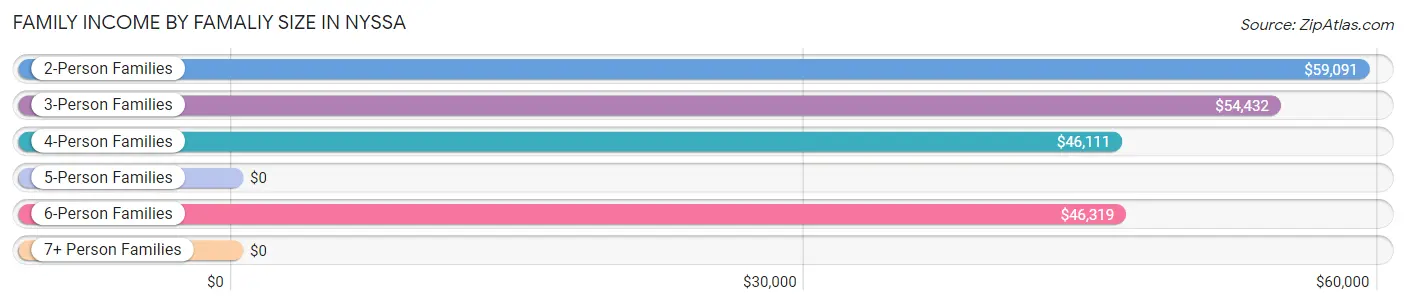
Family Income by Famaliy Size in Nyssa
2-person families (264 | 36.8%) account for the highest median family income in Nyssa with $59,091 per family, while 2-person families (264 | 36.8%) have the highest median income of $29,546 per family member.
| Income Bracket | # Families | Median Income |
| 2-Person Families | 264 (36.8%) | $59,091 |
| 3-Person Families | 195 (27.2%) | $54,432 |
| 4-Person Families | 92 (12.8%) | $46,111 |
| 5-Person Families | 79 (11.0%) | $0 |
| 6-Person Families | 80 (11.1%) | $46,319 |
| 7+ Person Families | 8 (1.1%) | $0 |
| Total | 718 (100.0%) | $54,667 |
Family Income by Number of Earners in Nyssa
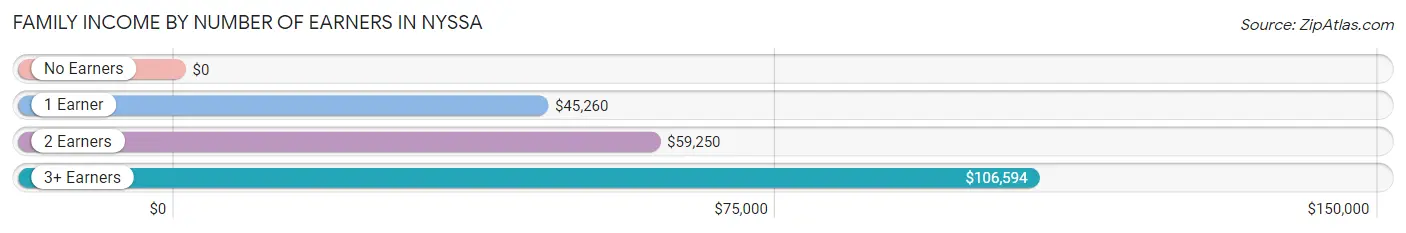
| Number of Earners | # Families | Median Income |
| No Earners | 114 (15.9%) | $0 |
| 1 Earner | 277 (38.6%) | $45,260 |
| 2 Earners | 238 (33.2%) | $59,250 |
| 3+ Earners | 89 (12.4%) | $106,594 |
| Total | 718 (100.0%) | $54,667 |
Household Income in Nyssa
Household Income Brackets in Nyssa
With 194 households falling in the category, the $35,000 to $49,999 income range is the most frequent in Nyssa, accounting for 19.5% of all households. In contrast, only 9 households (0.9%) fall into the $150,000 to $199,999 income bracket, making it the least populous group.
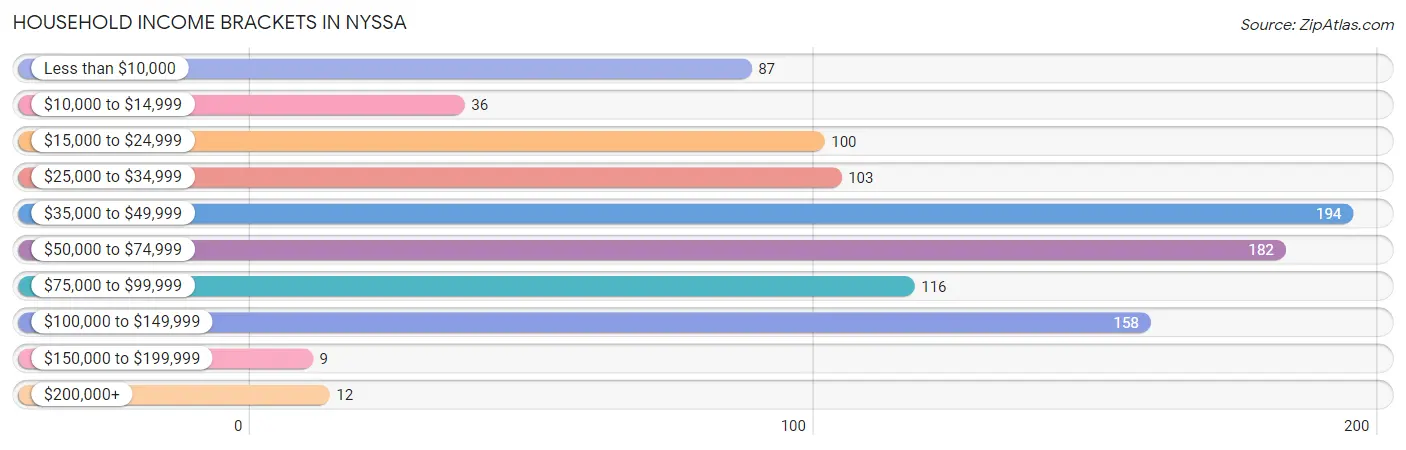
| Income Bracket | # Households | % Households |
| Less than $10,000 | 87 | 8.7% |
| $10,000 to $14,999 | 36 | 3.6% |
| $15,000 to $24,999 | 100 | 10.0% |
| $25,000 to $34,999 | 103 | 10.3% |
| $35,000 to $49,999 | 194 | 19.5% |
| $50,000 to $74,999 | 182 | 18.3% |
| $75,000 to $99,999 | 116 | 11.6% |
| $100,000 to $149,999 | 158 | 15.8% |
| $150,000 to $199,999 | 9 | 0.9% |
| $200,000+ | 12 | 1.2% |
Household Income by Householder Age in Nyssa
The median household income in Nyssa is $46,950, with the highest median household income of $46,204 found in the 25 to 44 years age bracket for the primary householder. A total of 370 households (37.1%) fall into this category. Meanwhile, the 15 to 24 years age bracket for the primary householder has the lowest median household income of $0, with 100 households (10.0%) in this group.
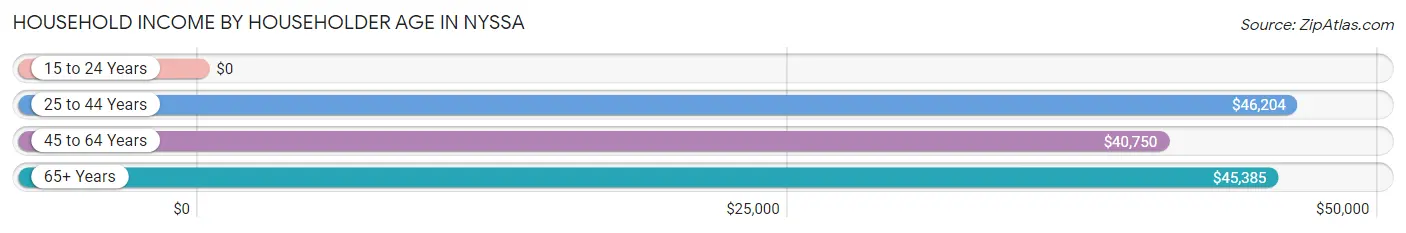
| Income Bracket | # Households | Median Income |
| 15 to 24 Years | 100 (10.0%) | $0 |
| 25 to 44 Years | 370 (37.1%) | $46,204 |
| 45 to 64 Years | 323 (32.4%) | $40,750 |
| 65+ Years | 204 (20.5%) | $45,385 |
| Total | 997 (100.0%) | $46,950 |
Poverty in Nyssa
Income Below Poverty by Sex and Age in Nyssa
With 18.9% poverty level for males and 13.6% for females among the residents of Nyssa, 5 year old males and 5 year old females are the most vulnerable to poverty, with 26 males (100.0%) and 10 females (58.8%) in their respective age groups living below the poverty level.
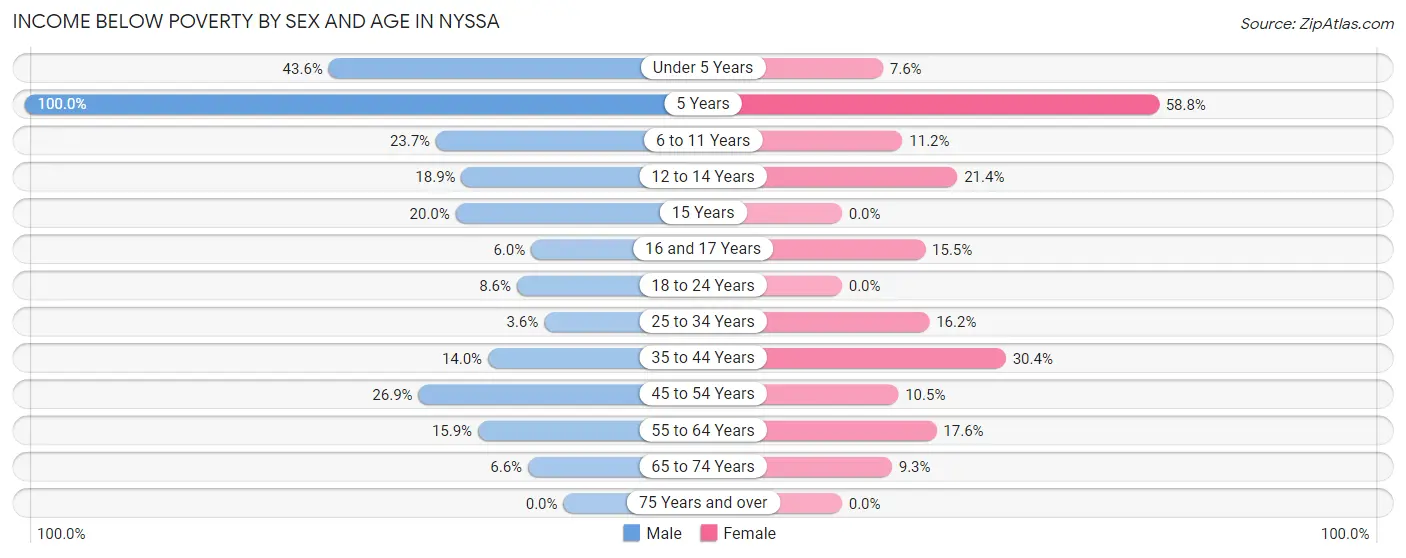
| Age Bracket | Male | Female |
| Under 5 Years | 88 (43.6%) | 8 (7.6%) |
| 5 Years | 26 (100.0%) | 10 (58.8%) |
| 6 to 11 Years | 35 (23.6%) | 19 (11.2%) |
| 12 to 14 Years | 21 (18.9%) | 18 (21.4%) |
| 15 Years | 9 (20.0%) | 0 (0.0%) |
| 16 and 17 Years | 6 (6.0%) | 15 (15.5%) |
| 18 to 24 Years | 24 (8.6%) | 0 (0.0%) |
| 25 to 34 Years | 5 (3.6%) | 25 (16.2%) |
| 35 to 44 Years | 14 (14.0%) | 63 (30.4%) |
| 45 to 54 Years | 46 (26.9%) | 22 (10.5%) |
| 55 to 64 Years | 13 (15.9%) | 23 (17.6%) |
| 65 to 74 Years | 9 (6.6%) | 9 (9.3%) |
| 75 Years and over | 0 (0.0%) | 0 (0.0%) |
| Total | 296 (18.9%) | 212 (13.6%) |
Income Above Poverty by Sex and Age in Nyssa
According to the poverty statistics in Nyssa, males aged 75 years and over and females aged 15 years are the age groups that are most secure financially, with 100.0% of males and 100.0% of females in these age groups living above the poverty line.
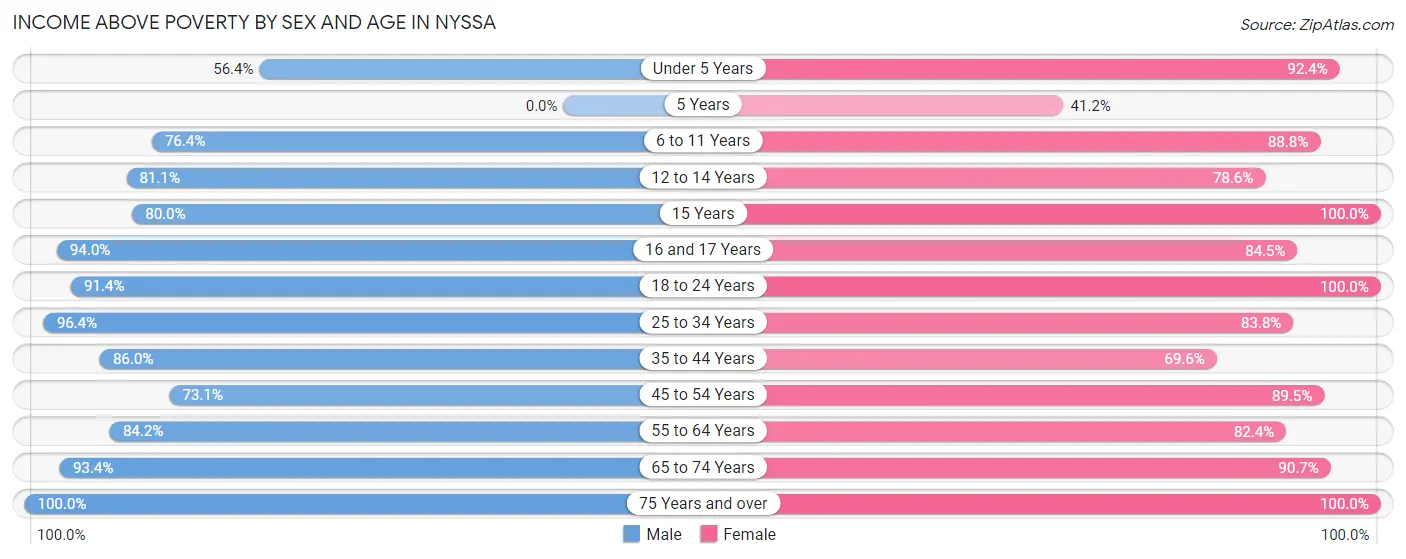
| Age Bracket | Male | Female |
| Under 5 Years | 114 (56.4%) | 97 (92.4%) |
| 5 Years | 0 (0.0%) | 7 (41.2%) |
| 6 to 11 Years | 113 (76.3%) | 150 (88.8%) |
| 12 to 14 Years | 90 (81.1%) | 66 (78.6%) |
| 15 Years | 36 (80.0%) | 13 (100.0%) |
| 16 and 17 Years | 94 (94.0%) | 82 (84.5%) |
| 18 to 24 Years | 254 (91.4%) | 208 (100.0%) |
| 25 to 34 Years | 135 (96.4%) | 129 (83.8%) |
| 35 to 44 Years | 86 (86.0%) | 144 (69.6%) |
| 45 to 54 Years | 125 (73.1%) | 188 (89.5%) |
| 55 to 64 Years | 69 (84.2%) | 108 (82.4%) |
| 65 to 74 Years | 128 (93.4%) | 88 (90.7%) |
| 75 Years and over | 23 (100.0%) | 70 (100.0%) |
| Total | 1,267 (81.1%) | 1,350 (86.4%) |
Income Below Poverty Among Married-Couple Families in Nyssa
The poverty statistics for married-couple families in Nyssa show that 8.5% or 34 of the total 402 families live below the poverty line. Families with 3 or 4 children have the highest poverty rate of 23.3%, comprising of 21 families. On the other hand, families with 1 or 2 children have the lowest poverty rate of 0.0%, which includes 0 families.
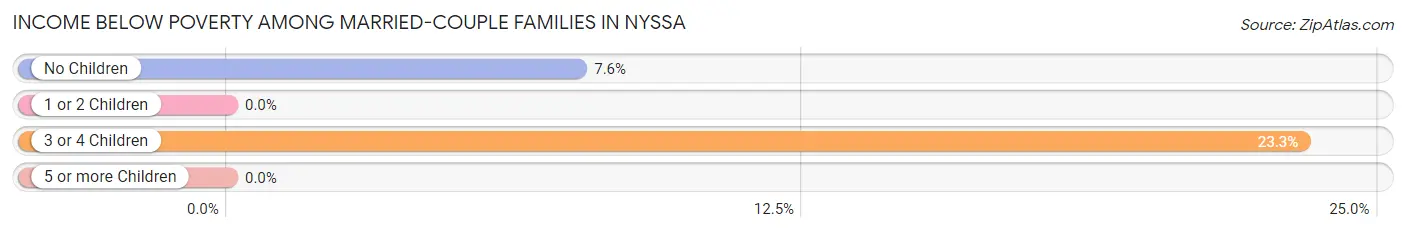
| Children | Above Poverty | Below Poverty |
| No Children | 158 (92.4%) | 13 (7.6%) |
| 1 or 2 Children | 141 (100.0%) | 0 (0.0%) |
| 3 or 4 Children | 69 (76.7%) | 21 (23.3%) |
| 5 or more Children | 0 (0.0%) | 0 (0.0%) |
| Total | 368 (91.5%) | 34 (8.5%) |
Income Below Poverty Among Single-Parent Households in Nyssa
According to the poverty data in Nyssa, 13.7% or 14 single-father households and 28.0% or 60 single-mother households are living below the poverty line. Among single-father households, those with 1 or 2 children have the highest poverty rate, with 14 households (48.3%) experiencing poverty. Likewise, among single-mother households, those with 3 or 4 children have the highest poverty rate, with 22 households (39.3%) falling below the poverty line.
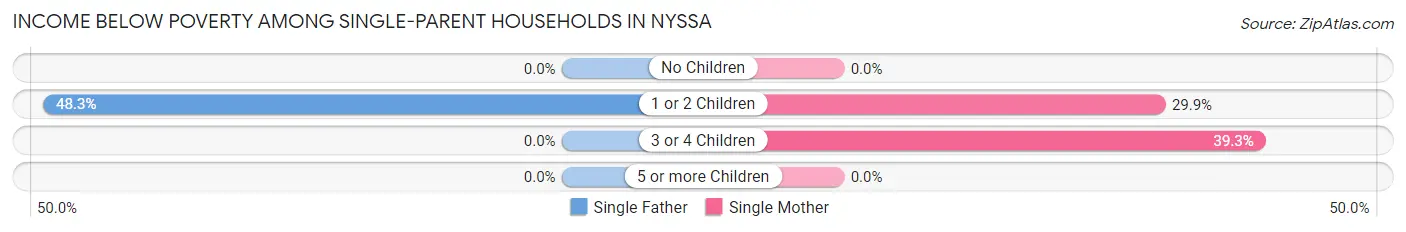
| Children | Single Father | Single Mother |
| No Children | 0 (0.0%) | 0 (0.0%) |
| 1 or 2 Children | 14 (48.3%) | 38 (29.9%) |
| 3 or 4 Children | 0 (0.0%) | 22 (39.3%) |
| 5 or more Children | 0 (0.0%) | 0 (0.0%) |
| Total | 14 (13.7%) | 60 (28.0%) |
Income Below Poverty Among Married-Couple vs Single-Parent Households in Nyssa
The poverty data for Nyssa shows that 34 of the married-couple family households (8.5%) and 74 of the single-parent households (23.4%) are living below the poverty level. Within the married-couple family households, those with 3 or 4 children have the highest poverty rate, with 21 households (23.3%) falling below the poverty line. Among the single-parent households, those with 3 or 4 children have the highest poverty rate, with 22 household (39.3%) living below poverty.
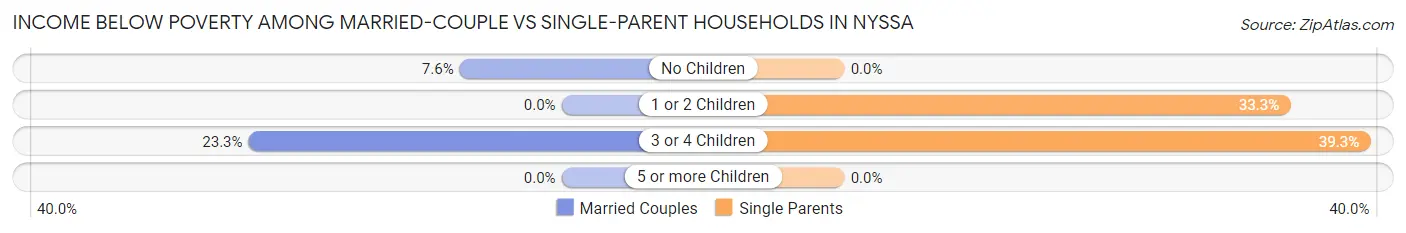
| Children | Married-Couple Families | Single-Parent Households |
| No Children | 13 (7.6%) | 0 (0.0%) |
| 1 or 2 Children | 0 (0.0%) | 52 (33.3%) |
| 3 or 4 Children | 21 (23.3%) | 22 (39.3%) |
| 5 or more Children | 0 (0.0%) | 0 (0.0%) |
| Total | 34 (8.5%) | 74 (23.4%) |
Employment Characteristics in Nyssa
Employment by Class of Employer in Nyssa
Among the 1,185 employed individuals in Nyssa, private company employees (866 | 73.1%), local government employees (139 | 11.7%), and not-for-profit organizations (72 | 6.1%) make up the most common classes of employment.
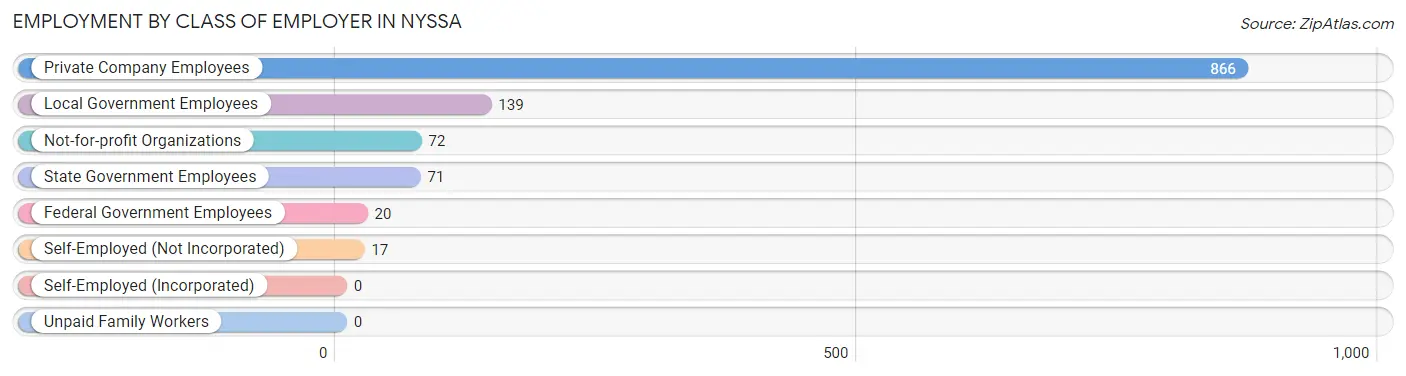
| Employer Class | # Employees | % Employees |
| Private Company Employees | 866 | 73.1% |
| Self-Employed (Incorporated) | 0 | 0.0% |
| Self-Employed (Not Incorporated) | 17 | 1.4% |
| Not-for-profit Organizations | 72 | 6.1% |
| Local Government Employees | 139 | 11.7% |
| State Government Employees | 71 | 6.0% |
| Federal Government Employees | 20 | 1.7% |
| Unpaid Family Workers | 0 | 0.0% |
| Total | 1,185 | 100.0% |
Employment Status by Age in Nyssa
According to the labor force statistics for Nyssa, out of the total population over 16 years of age (2,228), 59.8% or 1,332 individuals are in the labor force, with 7.4% or 99 of them unemployed. The age group with the highest labor force participation rate is 25 to 29 years, with 97.2% or 205 individuals in the labor force. Within the labor force, the 16 to 19 years age range has the highest percentage of unemployed individuals, with 43.2% or 54 of them being unemployed.
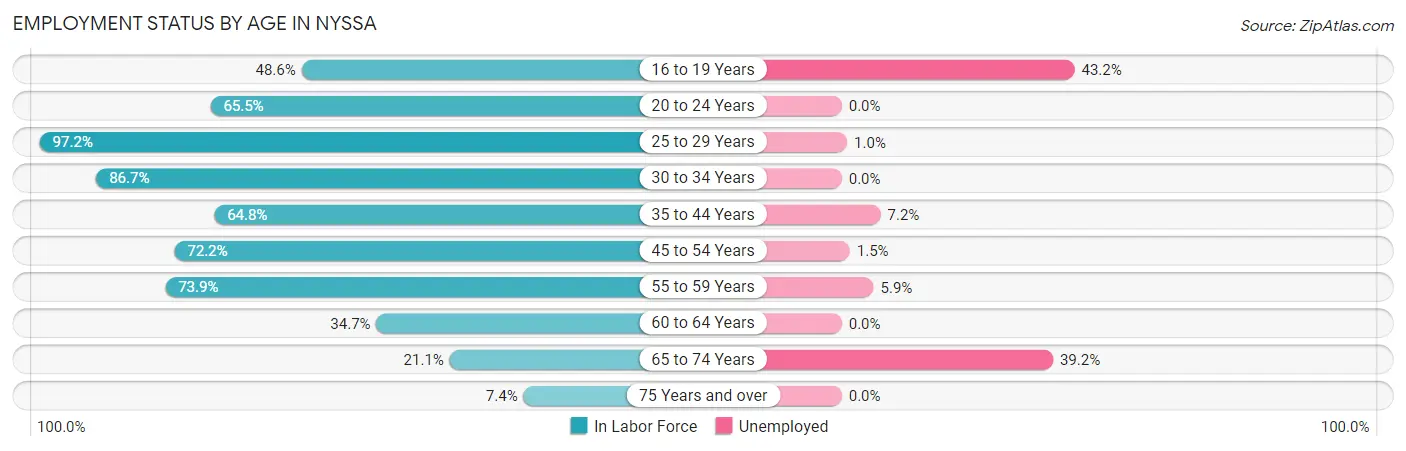
| Age Bracket | In Labor Force | Unemployed |
| 16 to 19 Years | 125 (48.6%) | 54 (43.2%) |
| 20 to 24 Years | 279 (65.5%) | 0 (0.0%) |
| 25 to 29 Years | 205 (97.2%) | 2 (1.0%) |
| 30 to 34 Years | 72 (86.7%) | 0 (0.0%) |
| 35 to 44 Years | 199 (64.8%) | 14 (7.2%) |
| 45 to 54 Years | 275 (72.2%) | 4 (1.5%) |
| 55 to 59 Years | 85 (73.9%) | 5 (5.9%) |
| 60 to 64 Years | 34 (34.7%) | 0 (0.0%) |
| 65 to 74 Years | 51 (21.1%) | 20 (39.2%) |
| 75 Years and over | 8 (7.4%) | 0 (0.0%) |
| Total | 1,332 (59.8%) | 99 (7.4%) |
Employment Status by Educational Attainment in Nyssa
According to labor force statistics for Nyssa, 72.8% of individuals (870) out of the total population between 25 and 64 years of age (1,195) are in the labor force, with 2.9% or 25 of them being unemployed. The group with the highest labor force participation rate are those with the educational attainment of bachelor's degree or higher, with 82.4% or 89 individuals in the labor force. Within the labor force, individuals with high school diploma education have the highest percentage of unemployment, with 9.0% or 21 of them being unemployed.
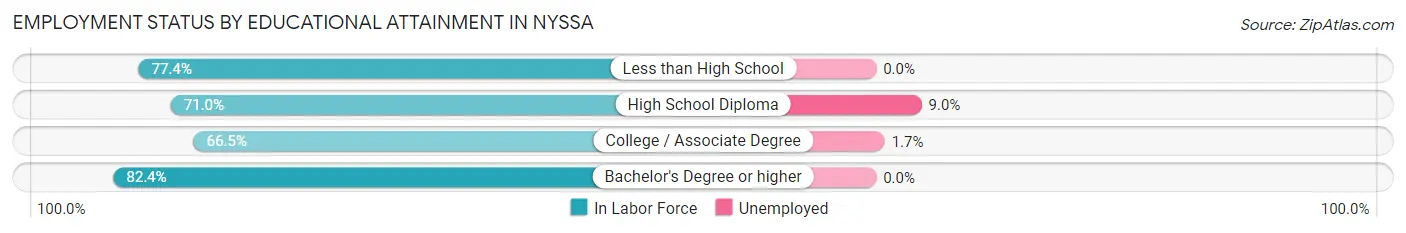
| Educational Attainment | In Labor Force | Unemployed |
| Less than High School | 308 (77.4%) | 0 (0.0%) |
| High School Diploma | 233 (71.0%) | 30 (9.0%) |
| College / Associate Degree | 240 (66.5%) | 6 (1.7%) |
| Bachelor's Degree or higher | 89 (82.4%) | 0 (0.0%) |
| Total | 870 (72.8%) | 35 (2.9%) |
Employment Occupations by Sex in Nyssa
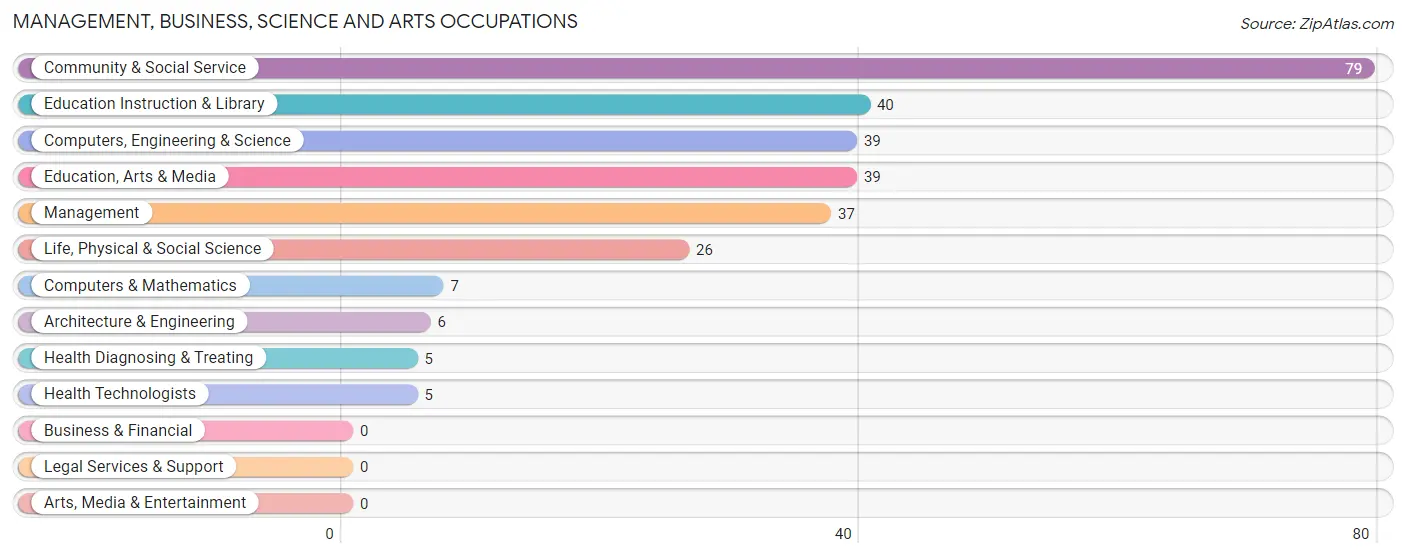
Management, Business, Science and Arts Occupations
The most common Management, Business, Science and Arts occupations in Nyssa are Community & Social Service (79 | 6.4%), Education Instruction & Library (40 | 3.3%), Computers, Engineering & Science (39 | 3.2%), Education, Arts & Media (39 | 3.2%), and Management (37 | 3.0%).
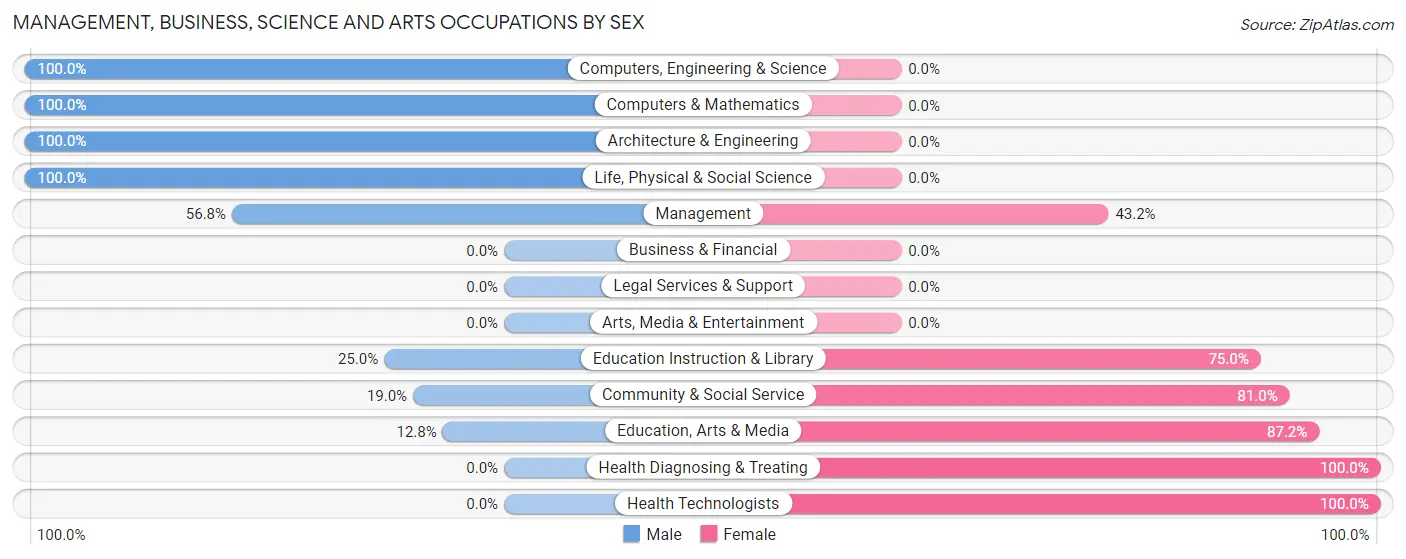
Management, Business, Science and Arts Occupations by Sex
Within the Management, Business, Science and Arts occupations in Nyssa, the most male-oriented occupations are Computers, Engineering & Science (100.0%), Computers & Mathematics (100.0%), and Architecture & Engineering (100.0%), while the most female-oriented occupations are Health Diagnosing & Treating (100.0%), Health Technologists (100.0%), and Education, Arts & Media (87.2%).
| Occupation | Male | Female |
| Management | 21 (56.8%) | 16 (43.2%) |
| Business & Financial | 0 (0.0%) | 0 (0.0%) |
| Computers, Engineering & Science | 39 (100.0%) | 0 (0.0%) |
| Computers & Mathematics | 7 (100.0%) | 0 (0.0%) |
| Architecture & Engineering | 6 (100.0%) | 0 (0.0%) |
| Life, Physical & Social Science | 26 (100.0%) | 0 (0.0%) |
| Community & Social Service | 15 (19.0%) | 64 (81.0%) |
| Education, Arts & Media | 5 (12.8%) | 34 (87.2%) |
| Legal Services & Support | 0 (0.0%) | 0 (0.0%) |
| Education Instruction & Library | 10 (25.0%) | 30 (75.0%) |
| Arts, Media & Entertainment | 0 (0.0%) | 0 (0.0%) |
| Health Diagnosing & Treating | 0 (0.0%) | 5 (100.0%) |
| Health Technologists | 0 (0.0%) | 5 (100.0%) |
| Total (Category) | 75 (46.9%) | 85 (53.1%) |
| Total (Overall) | 671 (54.5%) | 559 (45.5%) |
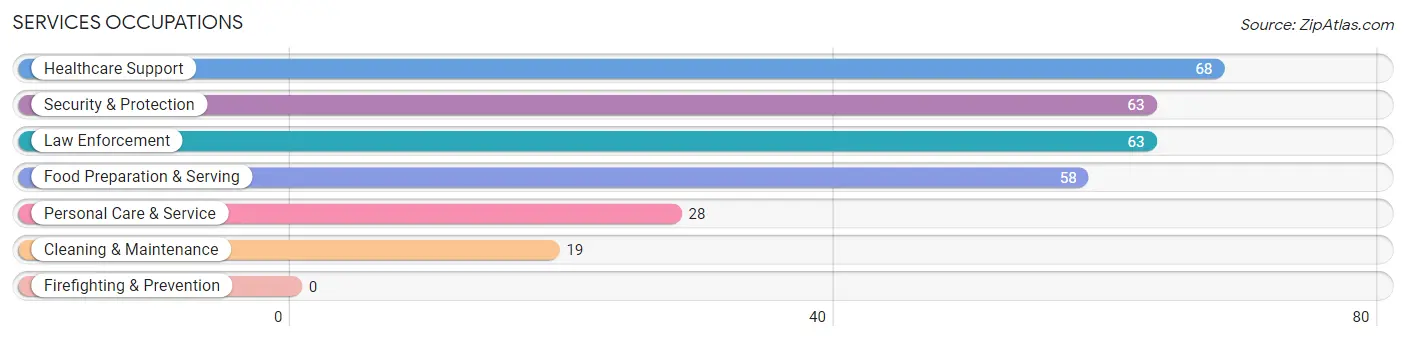
Services Occupations
The most common Services occupations in Nyssa are Healthcare Support (68 | 5.5%), Security & Protection (63 | 5.1%), Law Enforcement (63 | 5.1%), Food Preparation & Serving (58 | 4.7%), and Personal Care & Service (28 | 2.3%).
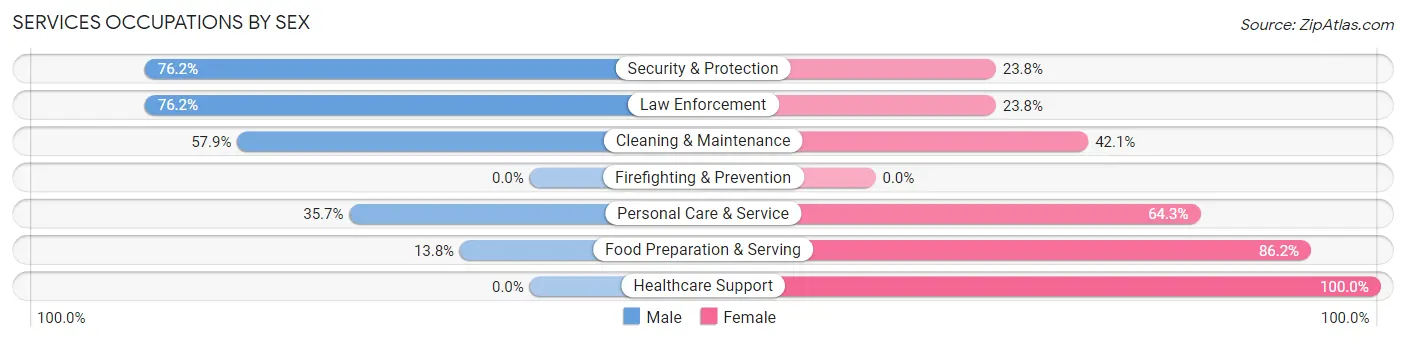
Services Occupations by Sex
Within the Services occupations in Nyssa, the most male-oriented occupations are Security & Protection (76.2%), Law Enforcement (76.2%), and Cleaning & Maintenance (57.9%), while the most female-oriented occupations are Healthcare Support (100.0%), Food Preparation & Serving (86.2%), and Personal Care & Service (64.3%).
| Occupation | Male | Female |
| Healthcare Support | 0 (0.0%) | 68 (100.0%) |
| Security & Protection | 48 (76.2%) | 15 (23.8%) |
| Firefighting & Prevention | 0 (0.0%) | 0 (0.0%) |
| Law Enforcement | 48 (76.2%) | 15 (23.8%) |
| Food Preparation & Serving | 8 (13.8%) | 50 (86.2%) |
| Cleaning & Maintenance | 11 (57.9%) | 8 (42.1%) |
| Personal Care & Service | 10 (35.7%) | 18 (64.3%) |
| Total (Category) | 77 (32.6%) | 159 (67.4%) |
| Total (Overall) | 671 (54.5%) | 559 (45.5%) |
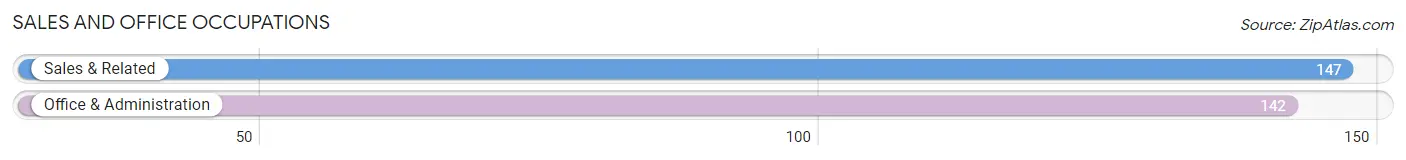
Sales and Office Occupations
The most common Sales and Office occupations in Nyssa are Sales & Related (147 | 11.9%), and Office & Administration (142 | 11.5%).
Sales and Office Occupations by Sex
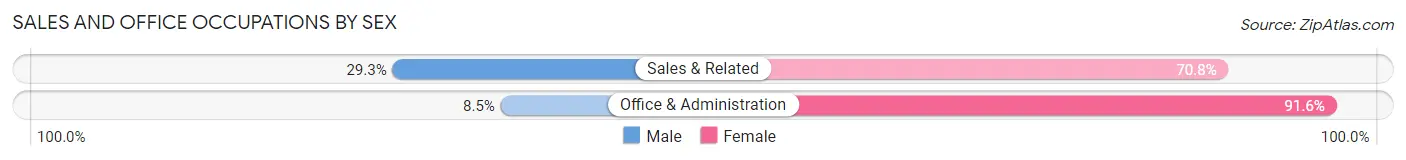
| Occupation | Male | Female |
| Sales & Related | 43 (29.2%) | 104 (70.8%) |
| Office & Administration | 12 (8.5%) | 130 (91.5%) |
| Total (Category) | 55 (19.0%) | 234 (81.0%) |
| Total (Overall) | 671 (54.5%) | 559 (45.5%) |
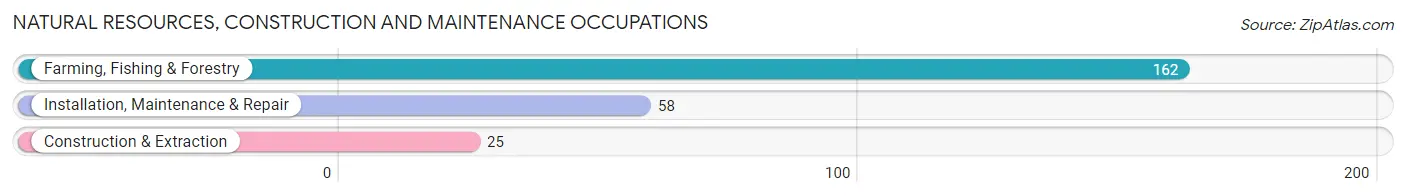
Natural Resources, Construction and Maintenance Occupations
The most common Natural Resources, Construction and Maintenance occupations in Nyssa are Farming, Fishing & Forestry (162 | 13.2%), Installation, Maintenance & Repair (58 | 4.7%), and Construction & Extraction (25 | 2.0%).
Natural Resources, Construction and Maintenance Occupations by Sex
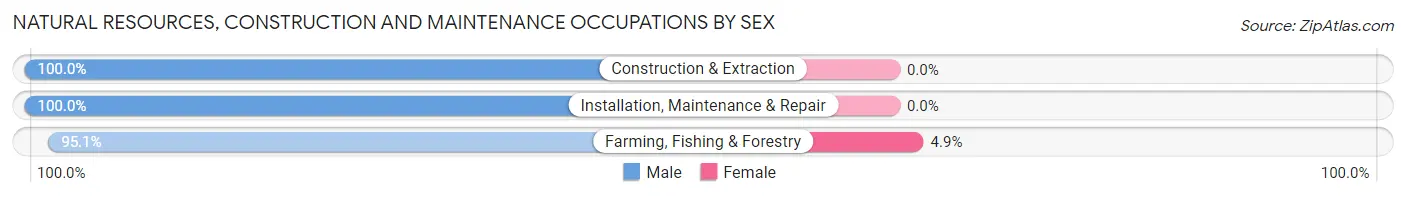
| Occupation | Male | Female |
| Farming, Fishing & Forestry | 154 (95.1%) | 8 (4.9%) |
| Construction & Extraction | 25 (100.0%) | 0 (0.0%) |
| Installation, Maintenance & Repair | 58 (100.0%) | 0 (0.0%) |
| Total (Category) | 237 (96.7%) | 8 (3.3%) |
| Total (Overall) | 671 (54.5%) | 559 (45.5%) |
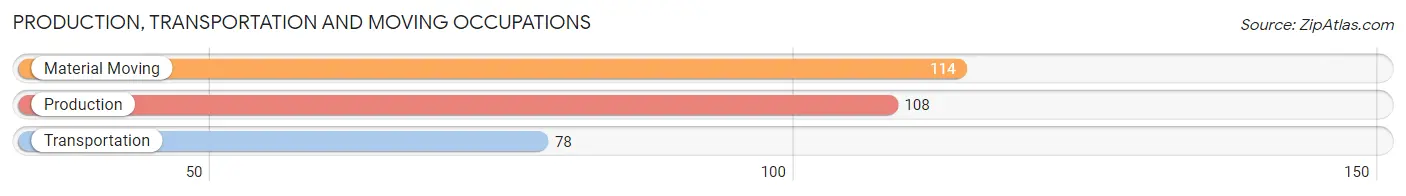
Production, Transportation and Moving Occupations
The most common Production, Transportation and Moving occupations in Nyssa are Material Moving (114 | 9.3%), Production (108 | 8.8%), and Transportation (78 | 6.3%).
Production, Transportation and Moving Occupations by Sex
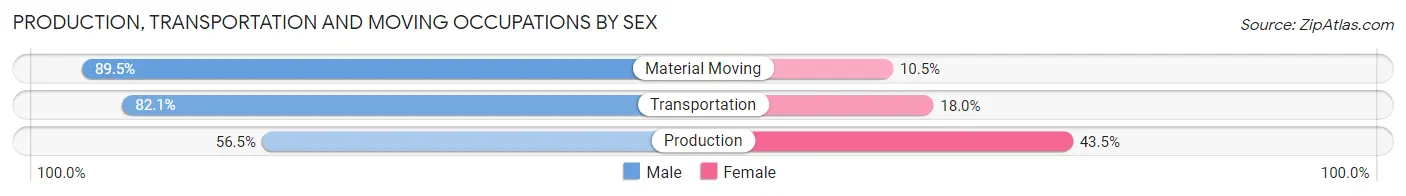
| Occupation | Male | Female |
| Production | 61 (56.5%) | 47 (43.5%) |
| Transportation | 64 (82.1%) | 14 (17.9%) |
| Material Moving | 102 (89.5%) | 12 (10.5%) |
| Total (Category) | 227 (75.7%) | 73 (24.3%) |
| Total (Overall) | 671 (54.5%) | 559 (45.5%) |
Employment Industries by Sex in Nyssa
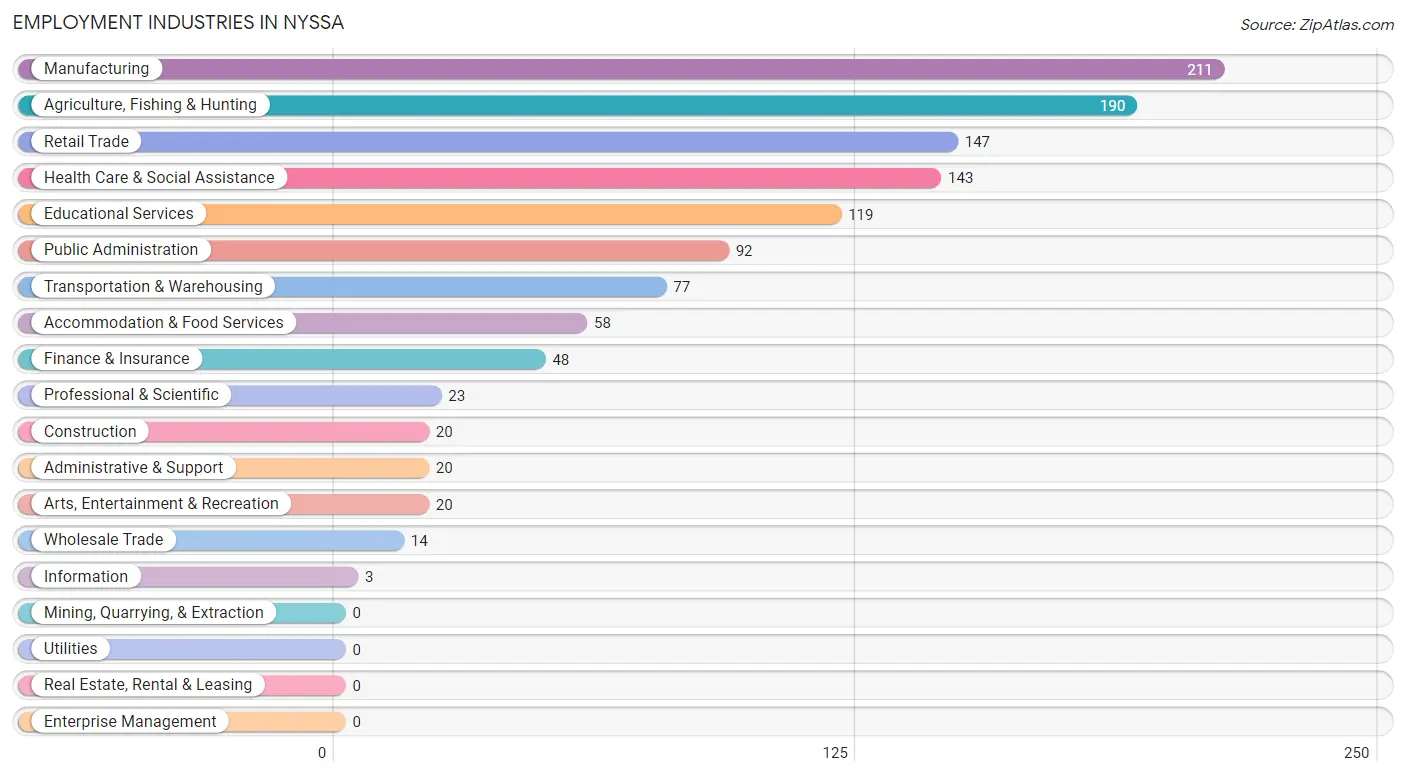
Employment Industries in Nyssa
The major employment industries in Nyssa include Manufacturing (211 | 17.2%), Agriculture, Fishing & Hunting (190 | 15.4%), Retail Trade (147 | 11.9%), Health Care & Social Assistance (143 | 11.6%), and Educational Services (119 | 9.7%).
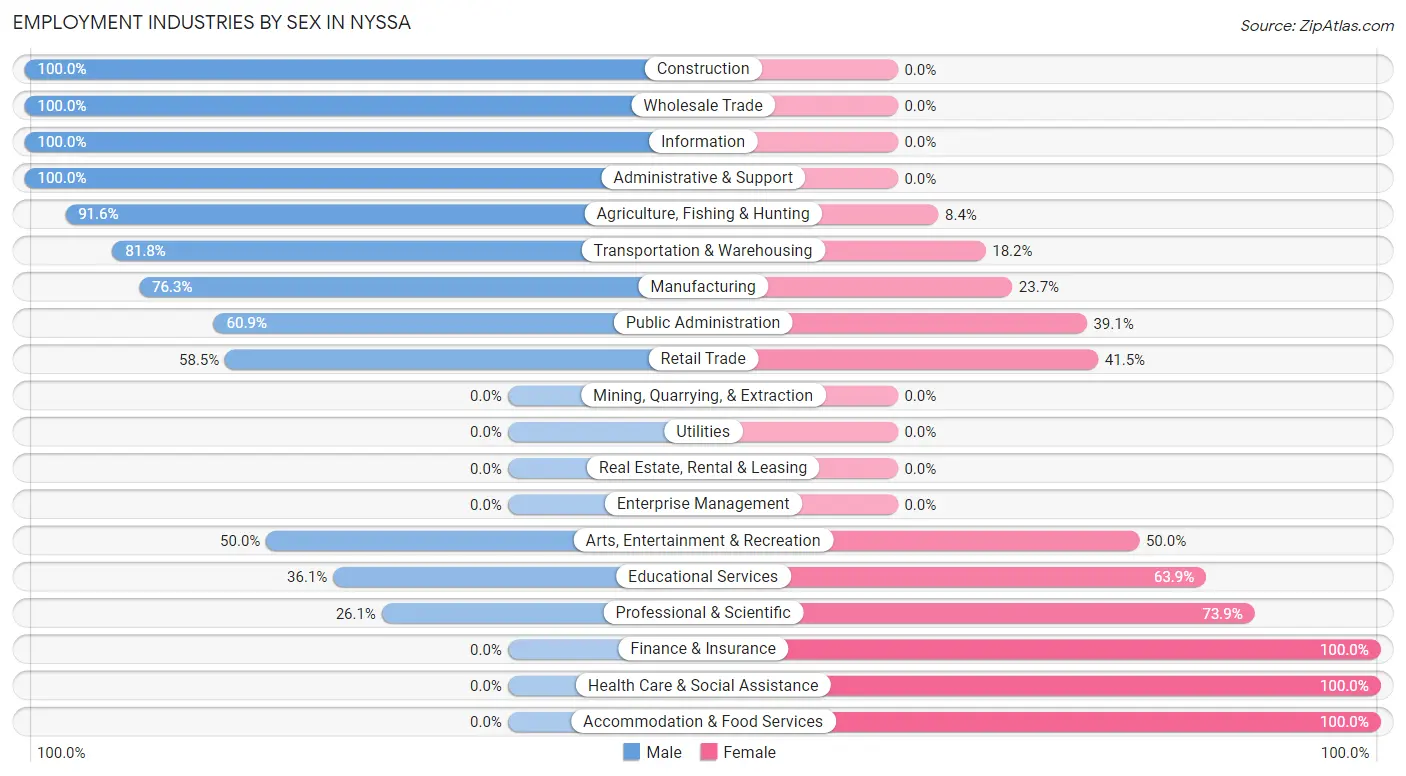
Employment Industries by Sex in Nyssa
The Nyssa industries that see more men than women are Construction (100.0%), Wholesale Trade (100.0%), and Information (100.0%), whereas the industries that tend to have a higher number of women are Finance & Insurance (100.0%), Health Care & Social Assistance (100.0%), and Accommodation & Food Services (100.0%).
| Industry | Male | Female |
| Agriculture, Fishing & Hunting | 174 (91.6%) | 16 (8.4%) |
| Mining, Quarrying, & Extraction | 0 (0.0%) | 0 (0.0%) |
| Construction | 20 (100.0%) | 0 (0.0%) |
| Manufacturing | 161 (76.3%) | 50 (23.7%) |
| Wholesale Trade | 14 (100.0%) | 0 (0.0%) |
| Retail Trade | 86 (58.5%) | 61 (41.5%) |
| Transportation & Warehousing | 63 (81.8%) | 14 (18.2%) |
| Utilities | 0 (0.0%) | 0 (0.0%) |
| Information | 3 (100.0%) | 0 (0.0%) |
| Finance & Insurance | 0 (0.0%) | 48 (100.0%) |
| Real Estate, Rental & Leasing | 0 (0.0%) | 0 (0.0%) |
| Professional & Scientific | 6 (26.1%) | 17 (73.9%) |
| Enterprise Management | 0 (0.0%) | 0 (0.0%) |
| Administrative & Support | 20 (100.0%) | 0 (0.0%) |
| Educational Services | 43 (36.1%) | 76 (63.9%) |
| Health Care & Social Assistance | 0 (0.0%) | 143 (100.0%) |
| Arts, Entertainment & Recreation | 10 (50.0%) | 10 (50.0%) |
| Accommodation & Food Services | 0 (0.0%) | 58 (100.0%) |
| Public Administration | 56 (60.9%) | 36 (39.1%) |
| Total | 671 (54.5%) | 559 (45.5%) |
Education in Nyssa
School Enrollment in Nyssa
The most common levels of schooling among the 1,038 students in Nyssa are high school (334 | 32.2%), middle school (298 | 28.7%), and elementary school (157 | 15.1%).
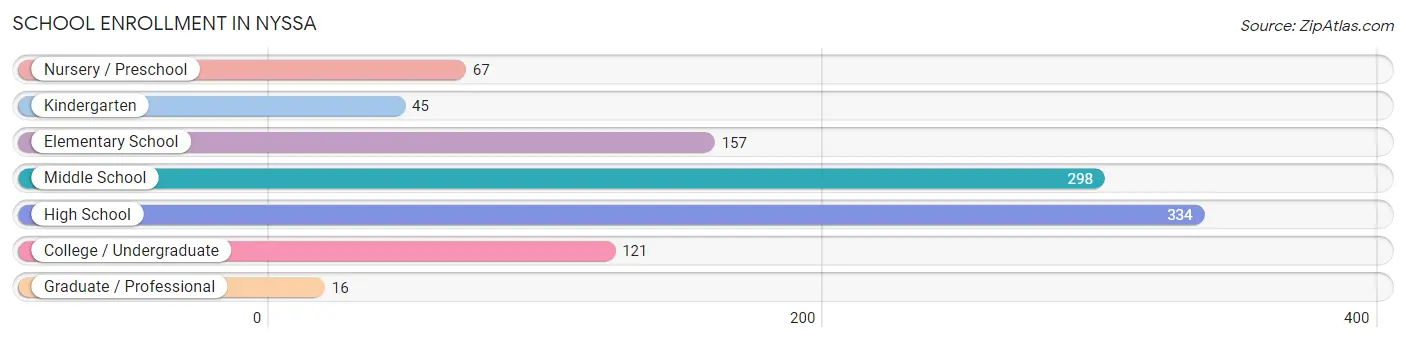
| School Level | # Students | % Students |
| Nursery / Preschool | 67 | 6.5% |
| Kindergarten | 45 | 4.3% |
| Elementary School | 157 | 15.1% |
| Middle School | 298 | 28.7% |
| High School | 334 | 32.2% |
| College / Undergraduate | 121 | 11.7% |
| Graduate / Professional | 16 | 1.5% |
| Total | 1,038 | 100.0% |
School Enrollment by Age by Funding Source in Nyssa
Out of a total of 1,038 students who are enrolled in schools in Nyssa, 21 (2.0%) attend a private institution, while the remaining 1,017 (98.0%) are enrolled in public schools. The age group of 10 to 14 year olds has the highest likelihood of being enrolled in private schools, with 16 (4.1% in the age bracket) enrolled. Conversely, the age group of 3 to 4 year olds has the lowest likelihood of being enrolled in a private school, with 31 (100.0% in the age bracket) attending a public institution.
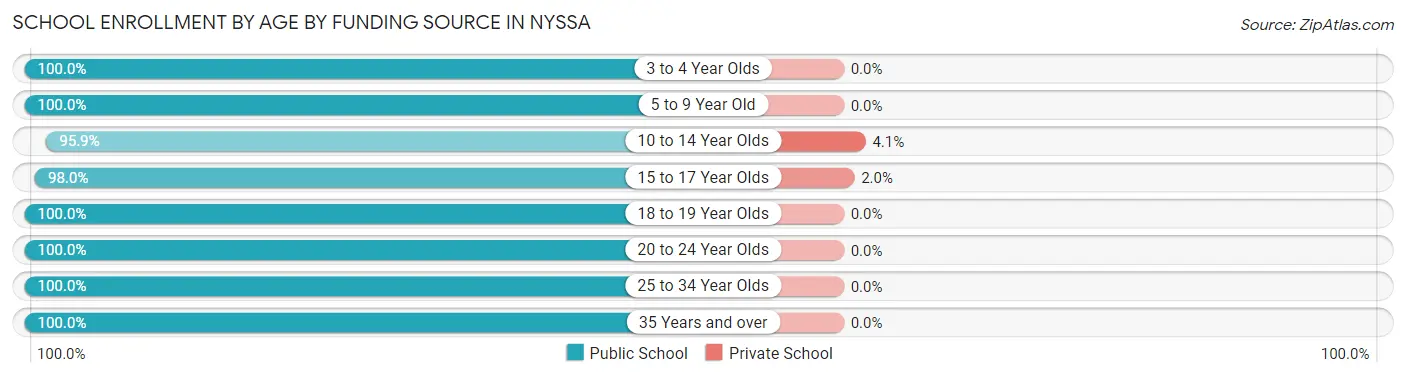
| Age Bracket | Public School | Private School |
| 3 to 4 Year Olds | 31 (100.0%) | 0 (0.0%) |
| 5 to 9 Year Old | 190 (100.0%) | 0 (0.0%) |
| 10 to 14 Year Olds | 378 (95.9%) | 16 (4.1%) |
| 15 to 17 Year Olds | 250 (98.0%) | 5 (2.0%) |
| 18 to 19 Year Olds | 52 (100.0%) | 0 (0.0%) |
| 20 to 24 Year Olds | 74 (100.0%) | 0 (0.0%) |
| 25 to 34 Year Olds | 15 (100.0%) | 0 (0.0%) |
| 35 Years and over | 27 (100.0%) | 0 (0.0%) |
| Total | 1,017 (98.0%) | 21 (2.0%) |
Educational Attainment by Field of Study in Nyssa
Business (37 | 22.2%), education (30 | 18.0%), communications (22 | 13.2%), liberal arts & history (19 | 11.4%), and arts & humanities (16 | 9.6%) are the most common fields of study among 167 individuals in Nyssa who have obtained a bachelor's degree or higher.
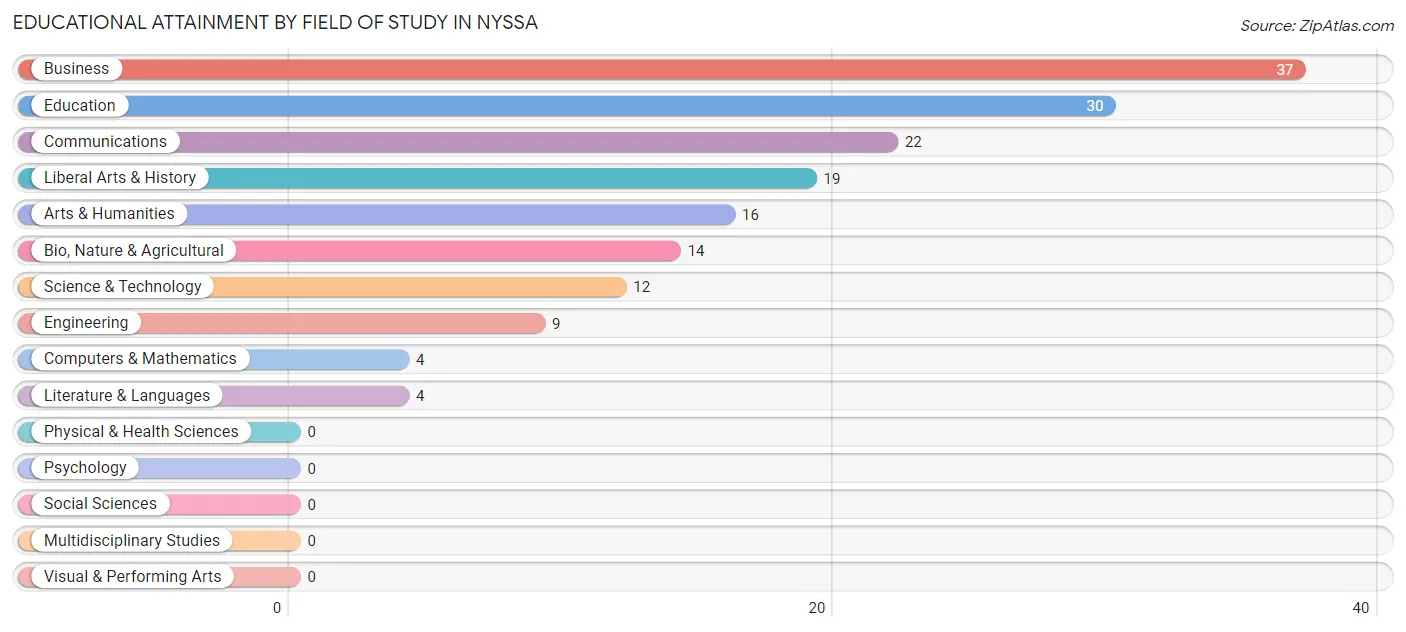
| Field of Study | # Graduates | % Graduates |
| Computers & Mathematics | 4 | 2.4% |
| Bio, Nature & Agricultural | 14 | 8.4% |
| Physical & Health Sciences | 0 | 0.0% |
| Psychology | 0 | 0.0% |
| Social Sciences | 0 | 0.0% |
| Engineering | 9 | 5.4% |
| Multidisciplinary Studies | 0 | 0.0% |
| Science & Technology | 12 | 7.2% |
| Business | 37 | 22.2% |
| Education | 30 | 18.0% |
| Literature & Languages | 4 | 2.4% |
| Liberal Arts & History | 19 | 11.4% |
| Visual & Performing Arts | 0 | 0.0% |
| Communications | 22 | 13.2% |
| Arts & Humanities | 16 | 9.6% |
| Total | 167 | 100.0% |
Transportation & Commute in Nyssa
Vehicle Availability by Sex in Nyssa
The most prevalent vehicle ownership categories in Nyssa are males with 2 vehicles (191, accounting for 29.0%) and females with 2 vehicles (190, making up 36.3%).
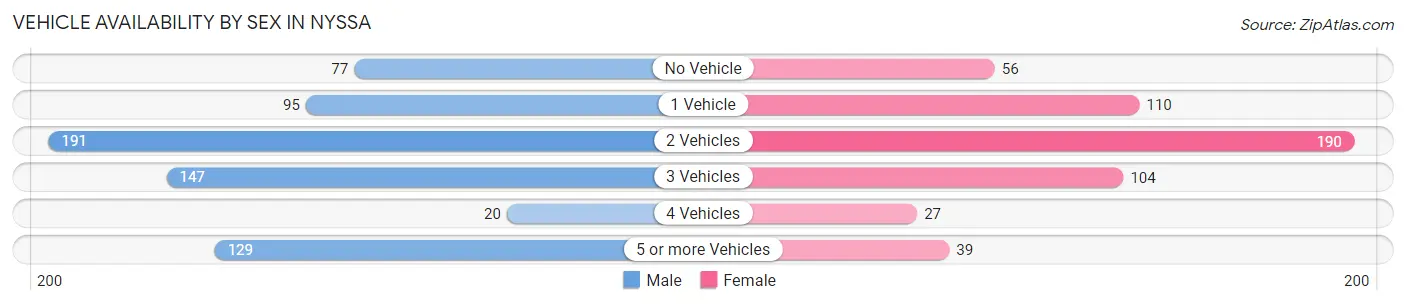
| Vehicles Available | Male | Female |
| No Vehicle | 77 (11.7%) | 56 (10.6%) |
| 1 Vehicle | 95 (14.4%) | 110 (20.9%) |
| 2 Vehicles | 191 (29.0%) | 190 (36.1%) |
| 3 Vehicles | 147 (22.3%) | 104 (19.8%) |
| 4 Vehicles | 20 (3.0%) | 27 (5.1%) |
| 5 or more Vehicles | 129 (19.6%) | 39 (7.4%) |
| Total | 659 (100.0%) | 526 (100.0%) |
Commute Time in Nyssa
The most frequently occuring commute durations in Nyssa are 15 to 19 minutes (202 commuters, 17.6%), 20 to 24 minutes (190 commuters, 16.5%), and 10 to 14 minutes (189 commuters, 16.4%).
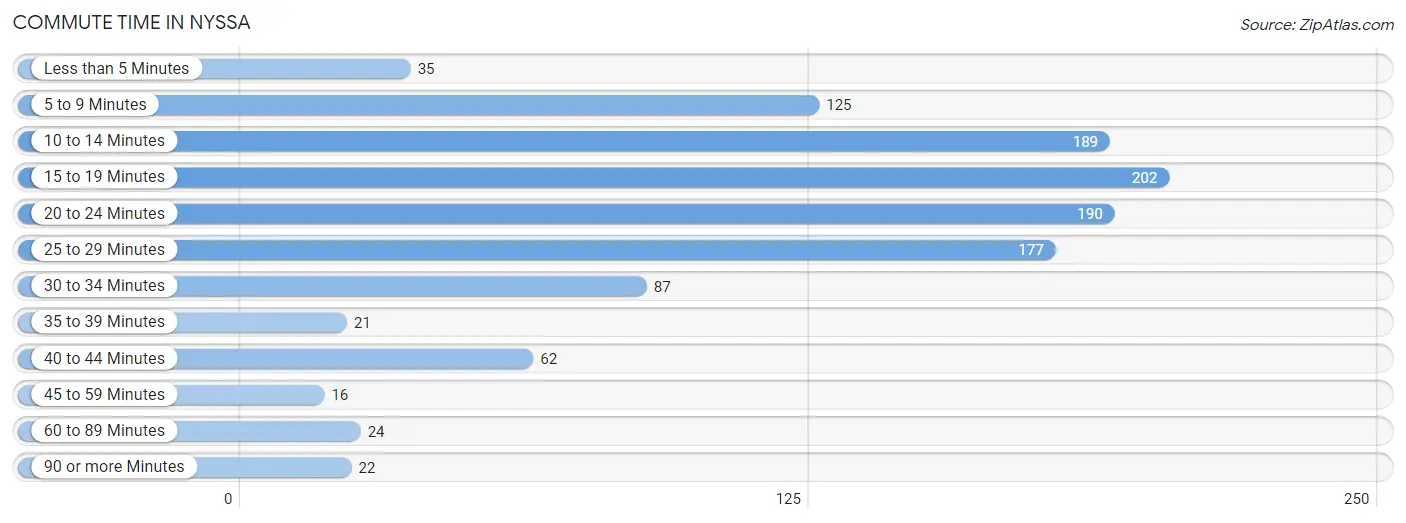
| Commute Time | # Commuters | % Commuters |
| Less than 5 Minutes | 35 | 3.0% |
| 5 to 9 Minutes | 125 | 10.9% |
| 10 to 14 Minutes | 189 | 16.4% |
| 15 to 19 Minutes | 202 | 17.6% |
| 20 to 24 Minutes | 190 | 16.5% |
| 25 to 29 Minutes | 177 | 15.4% |
| 30 to 34 Minutes | 87 | 7.6% |
| 35 to 39 Minutes | 21 | 1.8% |
| 40 to 44 Minutes | 62 | 5.4% |
| 45 to 59 Minutes | 16 | 1.4% |
| 60 to 89 Minutes | 24 | 2.1% |
| 90 or more Minutes | 22 | 1.9% |
Commute Time by Sex in Nyssa
The most common commute times in Nyssa are 20 to 24 minutes (133 commuters, 21.0%) for males and 25 to 29 minutes (109 commuters, 21.1%) for females.
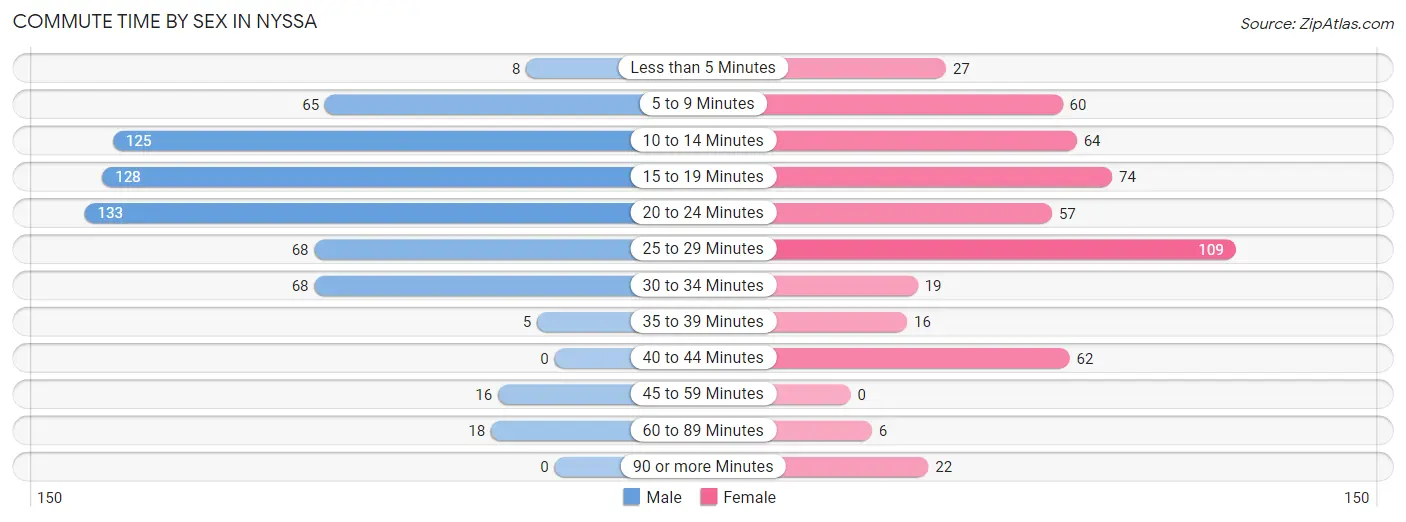
| Commute Time | Male | Female |
| Less than 5 Minutes | 8 (1.3%) | 27 (5.2%) |
| 5 to 9 Minutes | 65 (10.2%) | 60 (11.6%) |
| 10 to 14 Minutes | 125 (19.7%) | 64 (12.4%) |
| 15 to 19 Minutes | 128 (20.2%) | 74 (14.3%) |
| 20 to 24 Minutes | 133 (21.0%) | 57 (11.1%) |
| 25 to 29 Minutes | 68 (10.7%) | 109 (21.1%) |
| 30 to 34 Minutes | 68 (10.7%) | 19 (3.7%) |
| 35 to 39 Minutes | 5 (0.8%) | 16 (3.1%) |
| 40 to 44 Minutes | 0 (0.0%) | 62 (12.0%) |
| 45 to 59 Minutes | 16 (2.5%) | 0 (0.0%) |
| 60 to 89 Minutes | 18 (2.8%) | 6 (1.2%) |
| 90 or more Minutes | 0 (0.0%) | 22 (4.3%) |
Time of Departure to Work by Sex in Nyssa
The most frequent times of departure to work in Nyssa are 7:30 AM to 7:59 AM (166, 26.2%) for males and 7:30 AM to 7:59 AM (166, 32.2%) for females.
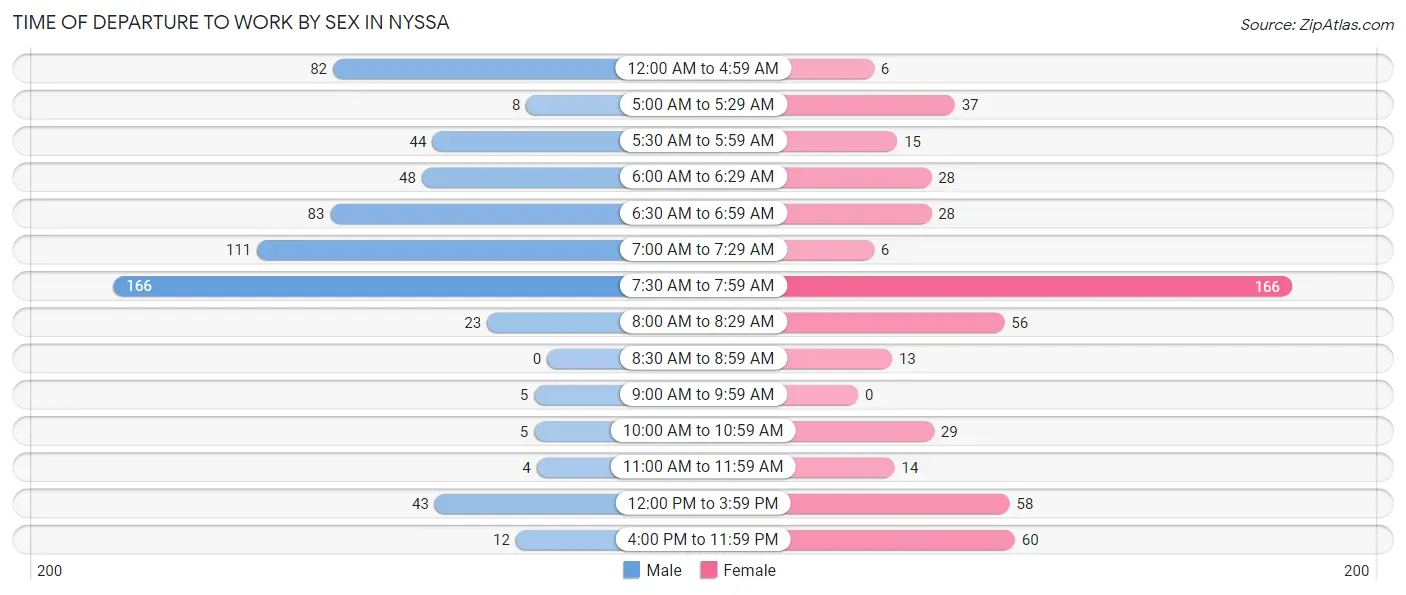
| Time of Departure | Male | Female |
| 12:00 AM to 4:59 AM | 82 (12.9%) | 6 (1.2%) |
| 5:00 AM to 5:29 AM | 8 (1.3%) | 37 (7.2%) |
| 5:30 AM to 5:59 AM | 44 (6.9%) | 15 (2.9%) |
| 6:00 AM to 6:29 AM | 48 (7.6%) | 28 (5.4%) |
| 6:30 AM to 6:59 AM | 83 (13.1%) | 28 (5.4%) |
| 7:00 AM to 7:29 AM | 111 (17.5%) | 6 (1.2%) |
| 7:30 AM to 7:59 AM | 166 (26.2%) | 166 (32.2%) |
| 8:00 AM to 8:29 AM | 23 (3.6%) | 56 (10.8%) |
| 8:30 AM to 8:59 AM | 0 (0.0%) | 13 (2.5%) |
| 9:00 AM to 9:59 AM | 5 (0.8%) | 0 (0.0%) |
| 10:00 AM to 10:59 AM | 5 (0.8%) | 29 (5.6%) |
| 11:00 AM to 11:59 AM | 4 (0.6%) | 14 (2.7%) |
| 12:00 PM to 3:59 PM | 43 (6.8%) | 58 (11.2%) |
| 4:00 PM to 11:59 PM | 12 (1.9%) | 60 (11.6%) |
| Total | 634 (100.0%) | 516 (100.0%) |
Housing Occupancy in Nyssa
Occupancy by Ownership in Nyssa
Of the total 997 dwellings in Nyssa, owner-occupied units account for 591 (59.3%), while renter-occupied units make up 406 (40.7%).
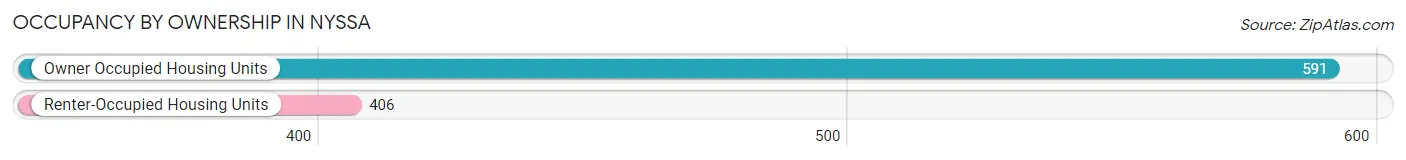
| Occupancy | # Housing Units | % Housing Units |
| Owner Occupied Housing Units | 591 | 59.3% |
| Renter-Occupied Housing Units | 406 | 40.7% |
| Total Occupied Housing Units | 997 | 100.0% |
Occupancy by Household Size in Nyssa
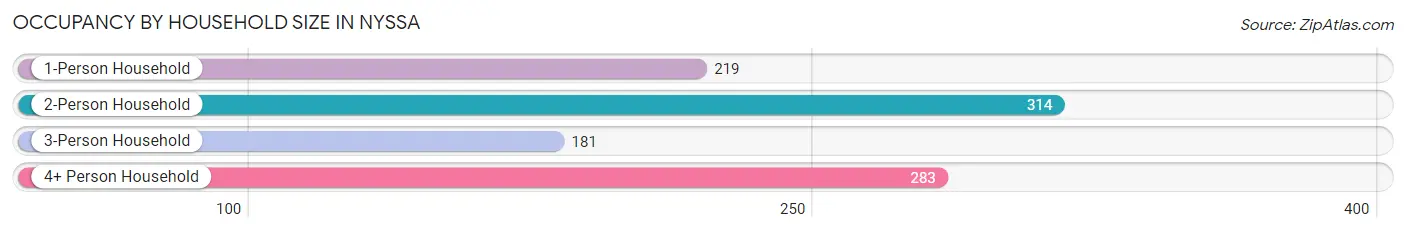
| Household Size | # Housing Units | % Housing Units |
| 1-Person Household | 219 | 22.0% |
| 2-Person Household | 314 | 31.5% |
| 3-Person Household | 181 | 18.1% |
| 4+ Person Household | 283 | 28.4% |
| Total Housing Units | 997 | 100.0% |
Occupancy by Ownership by Household Size in Nyssa
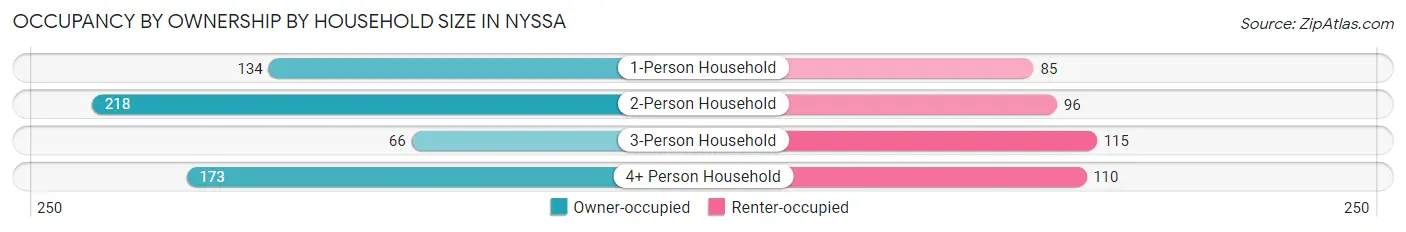
| Household Size | Owner-occupied | Renter-occupied |
| 1-Person Household | 134 (61.2%) | 85 (38.8%) |
| 2-Person Household | 218 (69.4%) | 96 (30.6%) |
| 3-Person Household | 66 (36.5%) | 115 (63.5%) |
| 4+ Person Household | 173 (61.1%) | 110 (38.9%) |
| Total Housing Units | 591 (59.3%) | 406 (40.7%) |
Occupancy by Educational Attainment in Nyssa
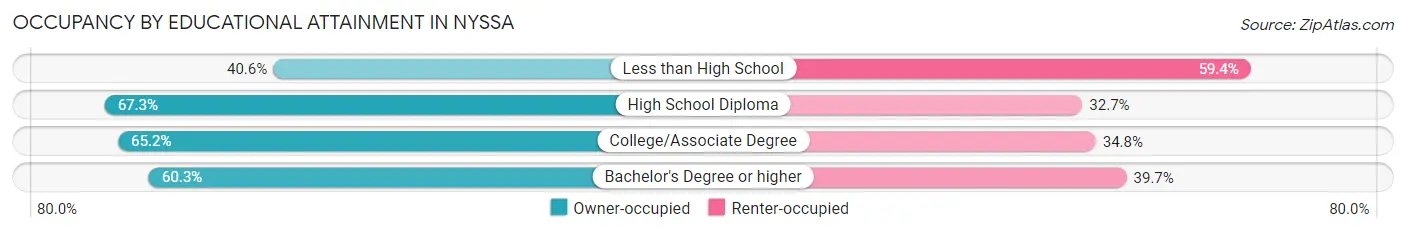
| Household Size | Owner-occupied | Renter-occupied |
| Less than High School | 95 (40.6%) | 139 (59.4%) |
| High School Diploma | 179 (67.3%) | 87 (32.7%) |
| College/Associate Degree | 232 (65.2%) | 124 (34.8%) |
| Bachelor's Degree or higher | 85 (60.3%) | 56 (39.7%) |
Occupancy by Age of Householder in Nyssa
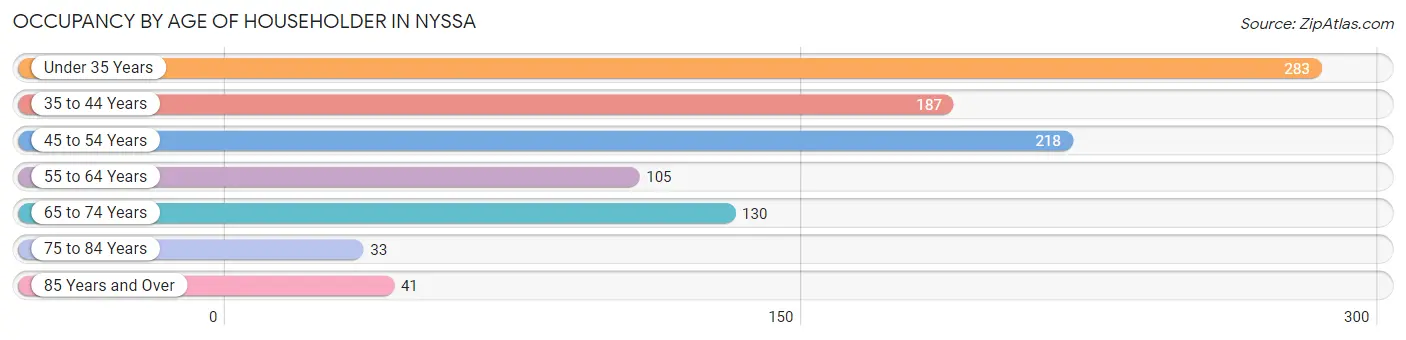
| Age Bracket | # Households | % Households |
| Under 35 Years | 283 | 28.4% |
| 35 to 44 Years | 187 | 18.8% |
| 45 to 54 Years | 218 | 21.9% |
| 55 to 64 Years | 105 | 10.5% |
| 65 to 74 Years | 130 | 13.0% |
| 75 to 84 Years | 33 | 3.3% |
| 85 Years and Over | 41 | 4.1% |
| Total | 997 | 100.0% |
Housing Finances in Nyssa
Median Income by Occupancy in Nyssa
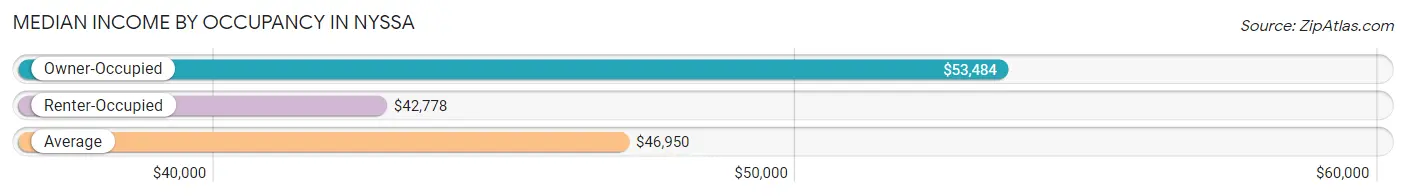
| Occupancy Type | # Households | Median Income |
| Owner-Occupied | 591 (59.3%) | $53,484 |
| Renter-Occupied | 406 (40.7%) | $42,778 |
| Average | 997 (100.0%) | $46,950 |
Occupancy by Householder Income Bracket in Nyssa
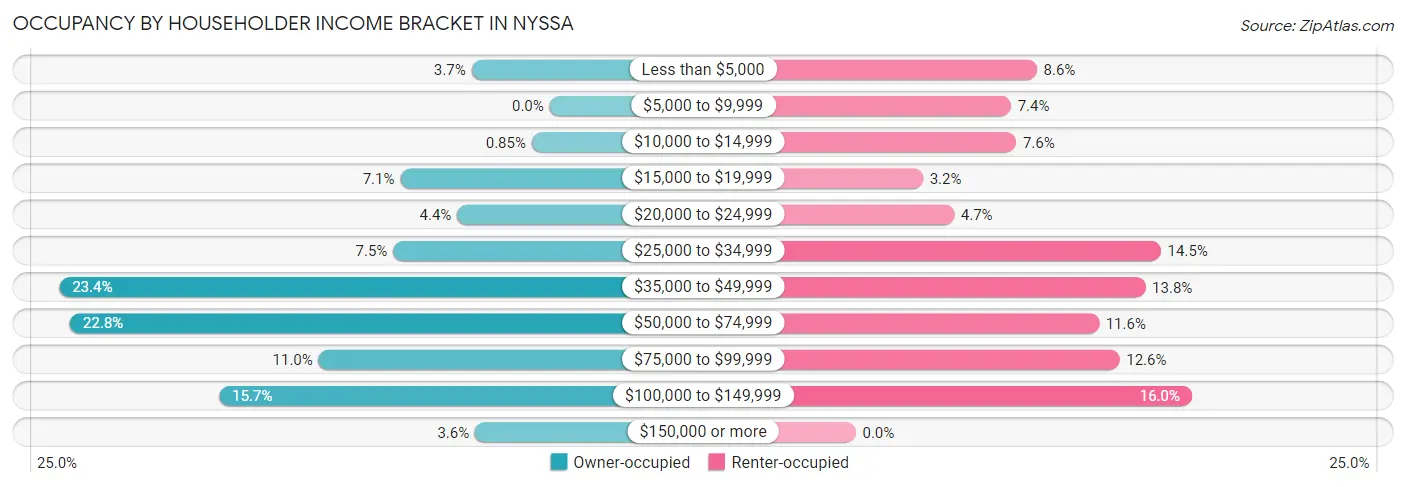
| Income Bracket | Owner-occupied | Renter-occupied |
| Less than $5,000 | 22 (3.7%) | 35 (8.6%) |
| $5,000 to $9,999 | 0 (0.0%) | 30 (7.4%) |
| $10,000 to $14,999 | 5 (0.9%) | 31 (7.6%) |
| $15,000 to $19,999 | 42 (7.1%) | 13 (3.2%) |
| $20,000 to $24,999 | 26 (4.4%) | 19 (4.7%) |
| $25,000 to $34,999 | 44 (7.4%) | 59 (14.5%) |
| $35,000 to $49,999 | 138 (23.4%) | 56 (13.8%) |
| $50,000 to $74,999 | 135 (22.8%) | 47 (11.6%) |
| $75,000 to $99,999 | 65 (11.0%) | 51 (12.6%) |
| $100,000 to $149,999 | 93 (15.7%) | 65 (16.0%) |
| $150,000 or more | 21 (3.5%) | 0 (0.0%) |
| Total | 591 (100.0%) | 406 (100.0%) |
Monthly Housing Cost Tiers in Nyssa
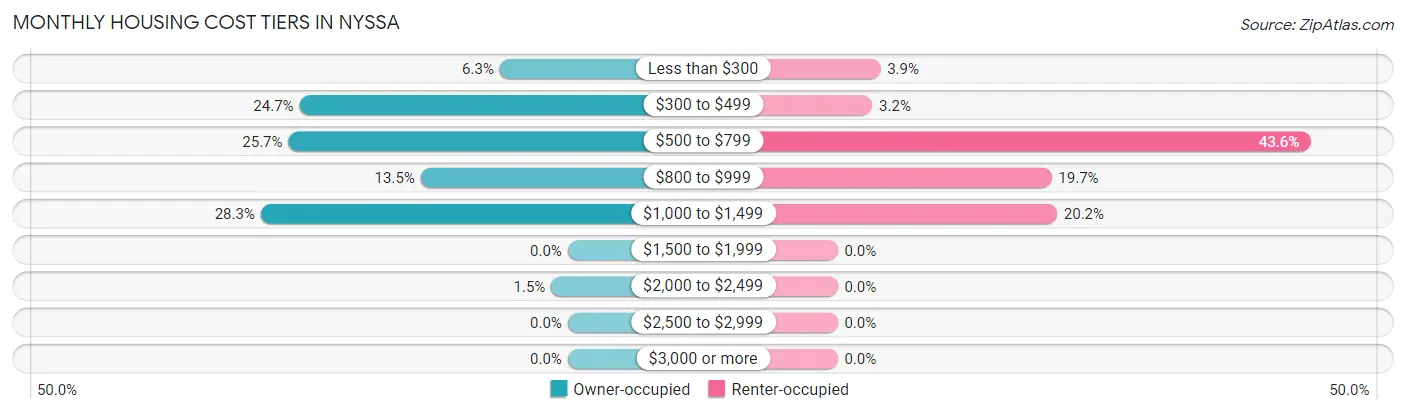
| Monthly Cost | Owner-occupied | Renter-occupied |
| Less than $300 | 37 (6.3%) | 16 (3.9%) |
| $300 to $499 | 146 (24.7%) | 13 (3.2%) |
| $500 to $799 | 152 (25.7%) | 177 (43.6%) |
| $800 to $999 | 80 (13.5%) | 80 (19.7%) |
| $1,000 to $1,499 | 167 (28.3%) | 82 (20.2%) |
| $1,500 to $1,999 | 0 (0.0%) | 0 (0.0%) |
| $2,000 to $2,499 | 9 (1.5%) | 0 (0.0%) |
| $2,500 to $2,999 | 0 (0.0%) | 0 (0.0%) |
| $3,000 or more | 0 (0.0%) | 0 (0.0%) |
| Total | 591 (100.0%) | 406 (100.0%) |
Physical Housing Characteristics in Nyssa
Housing Structures in Nyssa
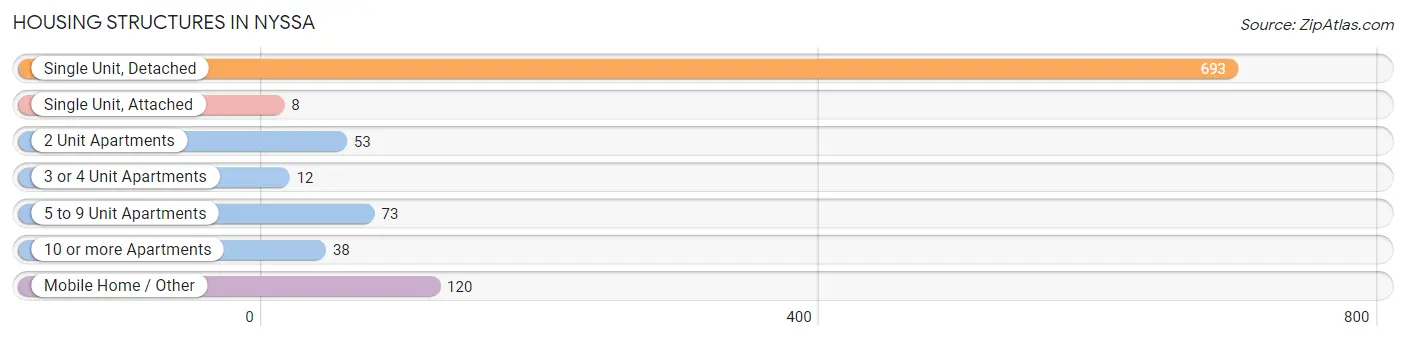
| Structure Type | # Housing Units | % Housing Units |
| Single Unit, Detached | 693 | 69.5% |
| Single Unit, Attached | 8 | 0.8% |
| 2 Unit Apartments | 53 | 5.3% |
| 3 or 4 Unit Apartments | 12 | 1.2% |
| 5 to 9 Unit Apartments | 73 | 7.3% |
| 10 or more Apartments | 38 | 3.8% |
| Mobile Home / Other | 120 | 12.0% |
| Total | 997 | 100.0% |
Housing Structures by Occupancy in Nyssa
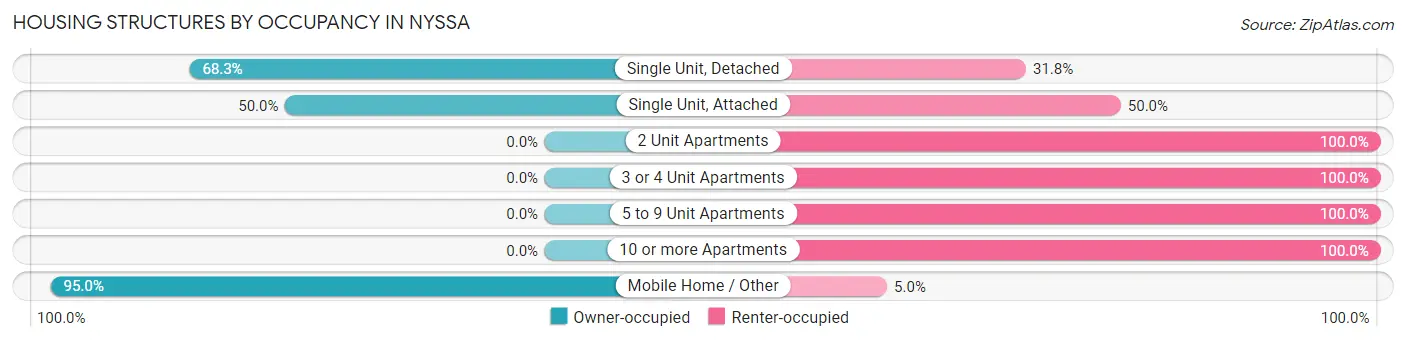
| Structure Type | Owner-occupied | Renter-occupied |
| Single Unit, Detached | 473 (68.2%) | 220 (31.8%) |
| Single Unit, Attached | 4 (50.0%) | 4 (50.0%) |
| 2 Unit Apartments | 0 (0.0%) | 53 (100.0%) |
| 3 or 4 Unit Apartments | 0 (0.0%) | 12 (100.0%) |
| 5 to 9 Unit Apartments | 0 (0.0%) | 73 (100.0%) |
| 10 or more Apartments | 0 (0.0%) | 38 (100.0%) |
| Mobile Home / Other | 114 (95.0%) | 6 (5.0%) |
| Total | 591 (59.3%) | 406 (40.7%) |
Housing Structures by Number of Rooms in Nyssa
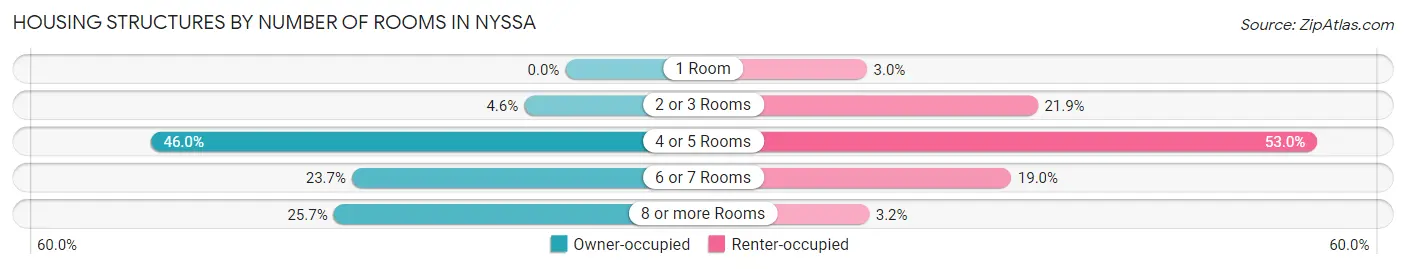
| Number of Rooms | Owner-occupied | Renter-occupied |
| 1 Room | 0 (0.0%) | 12 (3.0%) |
| 2 or 3 Rooms | 27 (4.6%) | 89 (21.9%) |
| 4 or 5 Rooms | 272 (46.0%) | 215 (53.0%) |
| 6 or 7 Rooms | 140 (23.7%) | 77 (19.0%) |
| 8 or more Rooms | 152 (25.7%) | 13 (3.2%) |
| Total | 591 (100.0%) | 406 (100.0%) |
Housing Structure by Heating Type in Nyssa
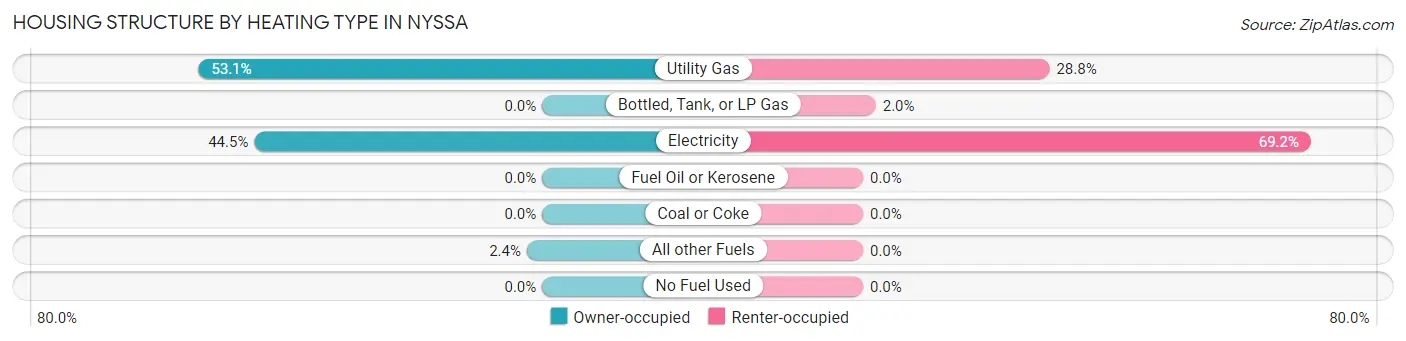
| Heating Type | Owner-occupied | Renter-occupied |
| Utility Gas | 314 (53.1%) | 117 (28.8%) |
| Bottled, Tank, or LP Gas | 0 (0.0%) | 8 (2.0%) |
| Electricity | 263 (44.5%) | 281 (69.2%) |
| Fuel Oil or Kerosene | 0 (0.0%) | 0 (0.0%) |
| Coal or Coke | 0 (0.0%) | 0 (0.0%) |
| All other Fuels | 14 (2.4%) | 0 (0.0%) |
| No Fuel Used | 0 (0.0%) | 0 (0.0%) |
| Total | 591 (100.0%) | 406 (100.0%) |
Household Vehicle Usage in Nyssa
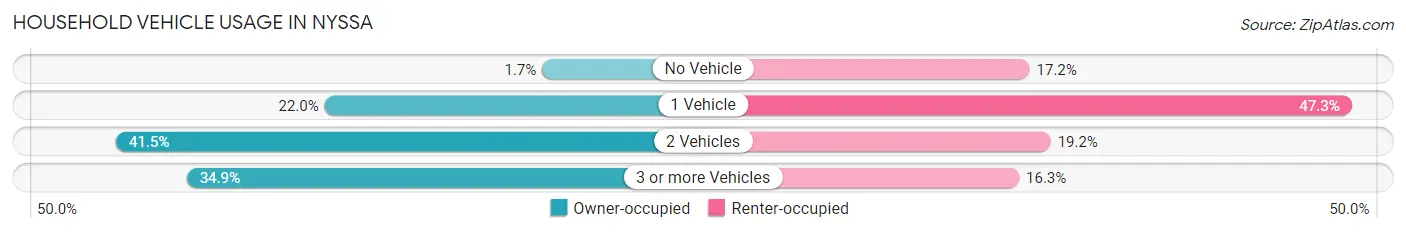
| Vehicles per Household | Owner-occupied | Renter-occupied |
| No Vehicle | 10 (1.7%) | 70 (17.2%) |
| 1 Vehicle | 130 (22.0%) | 192 (47.3%) |
| 2 Vehicles | 245 (41.5%) | 78 (19.2%) |
| 3 or more Vehicles | 206 (34.9%) | 66 (16.3%) |
| Total | 591 (100.0%) | 406 (100.0%) |
Real Estate & Mortgages in Nyssa
Real Estate and Mortgage Overview in Nyssa
| Characteristic | Without Mortgage | With Mortgage |
| Housing Units | 293 | 298 |
| Median Property Value | $129,200 | $151,500 |
| Median Household Income | $46,402 | $16 |
| Monthly Housing Costs | $456 | $0 |
| Real Estate Taxes | $1,432 | $0 |
Property Value by Mortgage Status in Nyssa
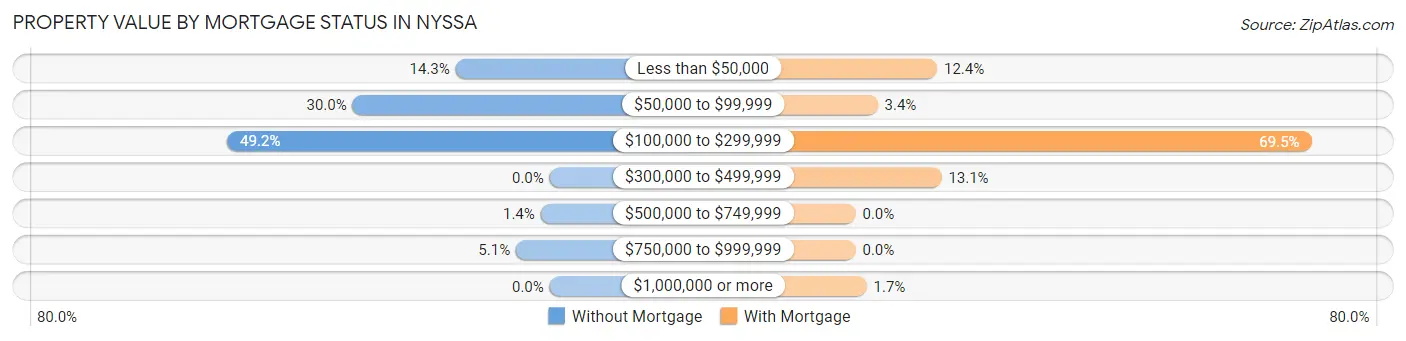
| Property Value | Without Mortgage | With Mortgage |
| Less than $50,000 | 42 (14.3%) | 37 (12.4%) |
| $50,000 to $99,999 | 88 (30.0%) | 10 (3.4%) |
| $100,000 to $299,999 | 144 (49.1%) | 207 (69.5%) |
| $300,000 to $499,999 | 0 (0.0%) | 39 (13.1%) |
| $500,000 to $749,999 | 4 (1.4%) | 0 (0.0%) |
| $750,000 to $999,999 | 15 (5.1%) | 0 (0.0%) |
| $1,000,000 or more | 0 (0.0%) | 5 (1.7%) |
| Total | 293 (100.0%) | 298 (100.0%) |
Household Income by Mortgage Status in Nyssa
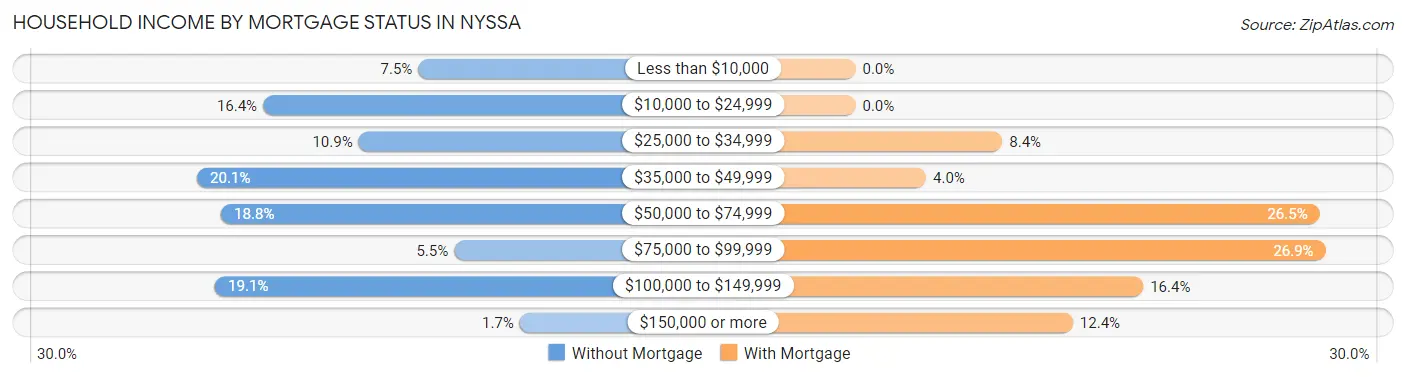
| Household Income | Without Mortgage | With Mortgage |
| Less than $10,000 | 22 (7.5%) | 0 (0.0%) |
| $10,000 to $24,999 | 48 (16.4%) | 0 (0.0%) |
| $25,000 to $34,999 | 32 (10.9%) | 25 (8.4%) |
| $35,000 to $49,999 | 59 (20.1%) | 12 (4.0%) |
| $50,000 to $74,999 | 55 (18.8%) | 79 (26.5%) |
| $75,000 to $99,999 | 16 (5.5%) | 80 (26.9%) |
| $100,000 to $149,999 | 56 (19.1%) | 49 (16.4%) |
| $150,000 or more | 5 (1.7%) | 37 (12.4%) |
| Total | 293 (100.0%) | 298 (100.0%) |
Property Value to Household Income Ratio in Nyssa
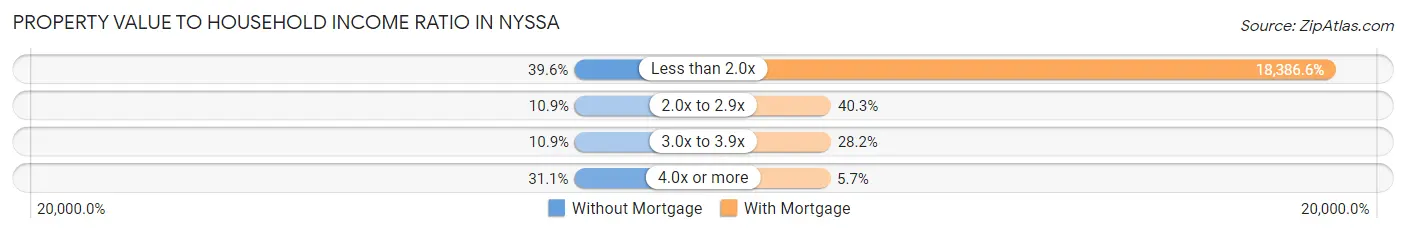
| Value-to-Income Ratio | Without Mortgage | With Mortgage |
| Less than 2.0x | 116 (39.6%) | 54,792 (18,386.6%) |
| 2.0x to 2.9x | 32 (10.9%) | 120 (40.3%) |
| 3.0x to 3.9x | 32 (10.9%) | 84 (28.2%) |
| 4.0x or more | 91 (31.1%) | 17 (5.7%) |
| Total | 293 (100.0%) | 298 (100.0%) |
Real Estate Taxes by Mortgage Status in Nyssa
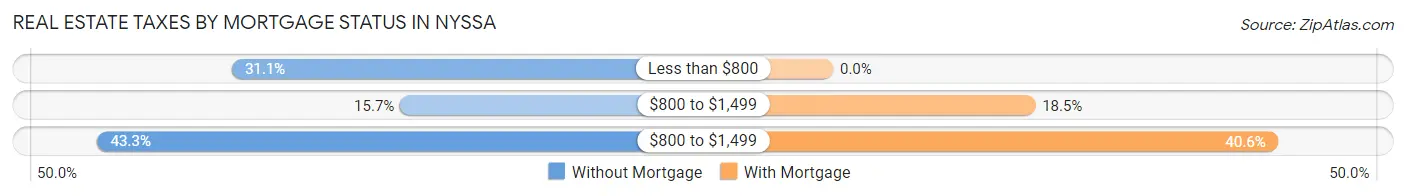
| Property Taxes | Without Mortgage | With Mortgage |
| Less than $800 | 91 (31.1%) | 0 (0.0%) |
| $800 to $1,499 | 46 (15.7%) | 55 (18.5%) |
| $800 to $1,499 | 127 (43.3%) | 121 (40.6%) |
| Total | 293 (100.0%) | 298 (100.0%) |
Health & Disability in Nyssa
Health Insurance Coverage by Age in Nyssa
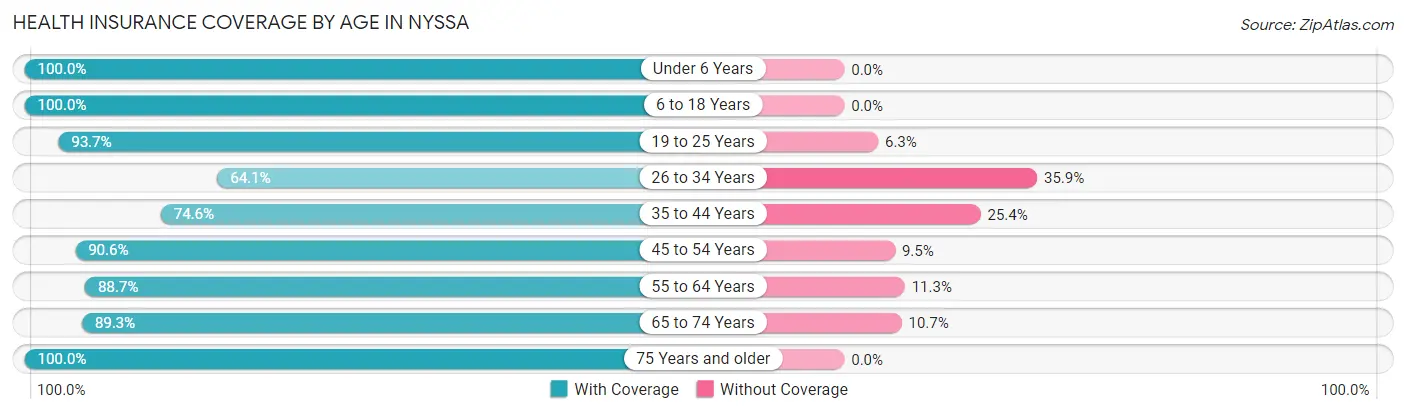
| Age Bracket | With Coverage | Without Coverage |
| Under 6 Years | 375 (100.0%) | 0 (0.0%) |
| 6 to 18 Years | 843 (100.0%) | 0 (0.0%) |
| 19 to 25 Years | 447 (93.7%) | 30 (6.3%) |
| 26 to 34 Years | 164 (64.1%) | 92 (35.9%) |
| 35 to 44 Years | 226 (74.6%) | 77 (25.4%) |
| 45 to 54 Years | 345 (90.5%) | 36 (9.5%) |
| 55 to 64 Years | 189 (88.7%) | 24 (11.3%) |
| 65 to 74 Years | 209 (89.3%) | 25 (10.7%) |
| 75 Years and older | 93 (100.0%) | 0 (0.0%) |
| Total | 2,891 (91.1%) | 284 (8.9%) |
Health Insurance Coverage by Citizenship Status in Nyssa
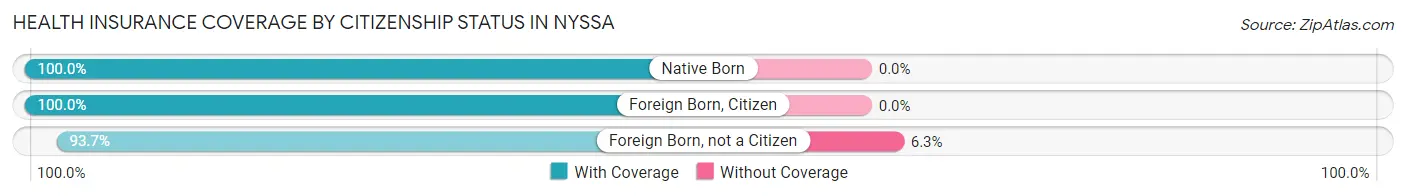
| Citizenship Status | With Coverage | Without Coverage |
| Native Born | 375 (100.0%) | 0 (0.0%) |
| Foreign Born, Citizen | 843 (100.0%) | 0 (0.0%) |
| Foreign Born, not a Citizen | 447 (93.7%) | 30 (6.3%) |
Health Insurance Coverage by Household Income in Nyssa
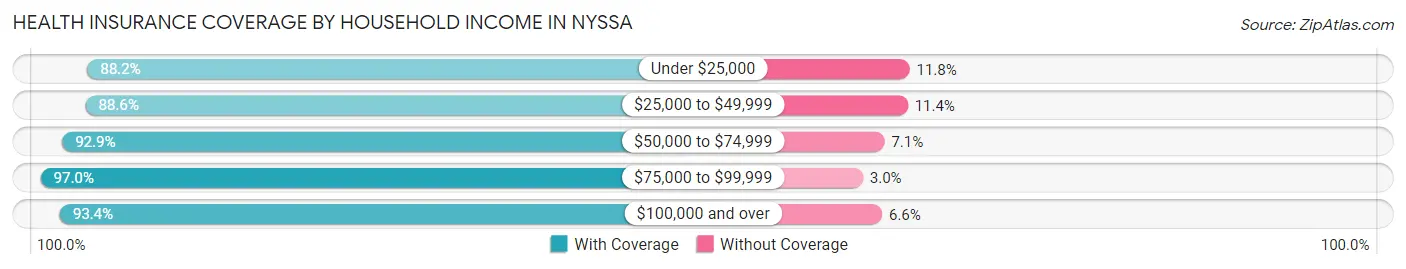
| Household Income | With Coverage | Without Coverage |
| Under $25,000 | 510 (88.2%) | 68 (11.8%) |
| $25,000 to $49,999 | 1,056 (88.6%) | 136 (11.4%) |
| $50,000 to $74,999 | 329 (92.9%) | 25 (7.1%) |
| $75,000 to $99,999 | 387 (97.0%) | 12 (3.0%) |
| $100,000 and over | 609 (93.4%) | 43 (6.6%) |
Public vs Private Health Insurance Coverage by Age in Nyssa
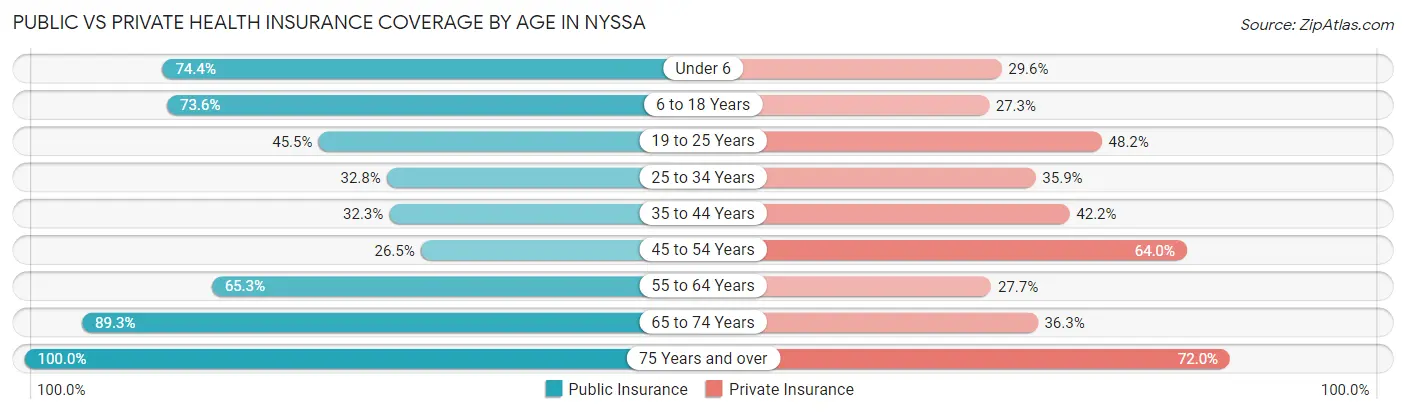
| Age Bracket | Public Insurance | Private Insurance |
| Under 6 | 279 (74.4%) | 111 (29.6%) |
| 6 to 18 Years | 620 (73.6%) | 230 (27.3%) |
| 19 to 25 Years | 217 (45.5%) | 230 (48.2%) |
| 25 to 34 Years | 84 (32.8%) | 92 (35.9%) |
| 35 to 44 Years | 98 (32.3%) | 128 (42.2%) |
| 45 to 54 Years | 101 (26.5%) | 244 (64.0%) |
| 55 to 64 Years | 139 (65.3%) | 59 (27.7%) |
| 65 to 74 Years | 209 (89.3%) | 85 (36.3%) |
| 75 Years and over | 93 (100.0%) | 67 (72.0%) |
| Total | 1,840 (58.0%) | 1,246 (39.2%) |
Disability Status by Sex by Age in Nyssa
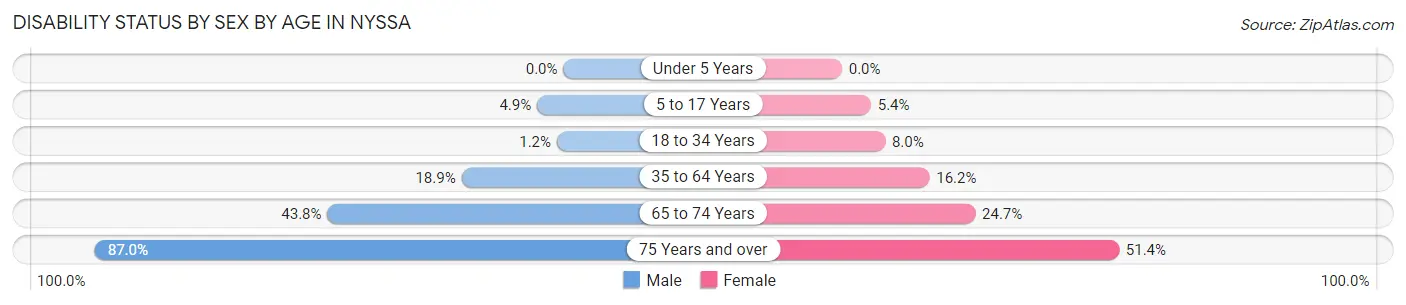
| Age Bracket | Male | Female |
| Under 5 Years | 0 (0.0%) | 0 (0.0%) |
| 5 to 17 Years | 21 (4.9%) | 22 (5.4%) |
| 18 to 34 Years | 5 (1.2%) | 29 (8.0%) |
| 35 to 64 Years | 66 (18.9%) | 89 (16.2%) |
| 65 to 74 Years | 60 (43.8%) | 24 (24.7%) |
| 75 Years and over | 20 (87.0%) | 36 (51.4%) |
Disability Class by Sex by Age in Nyssa
Disability Class: Hearing Difficulty
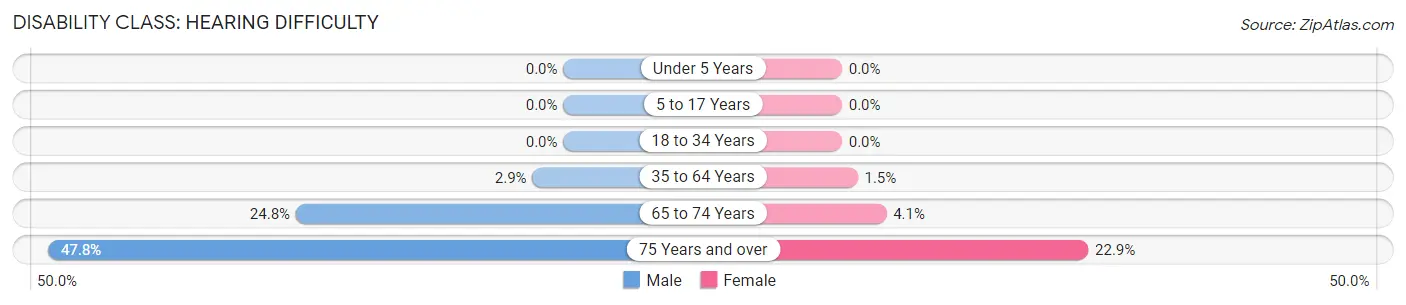
| Age Bracket | Male | Female |
| Under 5 Years | 0 (0.0%) | 0 (0.0%) |
| 5 to 17 Years | 0 (0.0%) | 0 (0.0%) |
| 18 to 34 Years | 0 (0.0%) | 0 (0.0%) |
| 35 to 64 Years | 10 (2.9%) | 8 (1.5%) |
| 65 to 74 Years | 34 (24.8%) | 4 (4.1%) |
| 75 Years and over | 11 (47.8%) | 16 (22.9%) |
Disability Class: Vision Difficulty
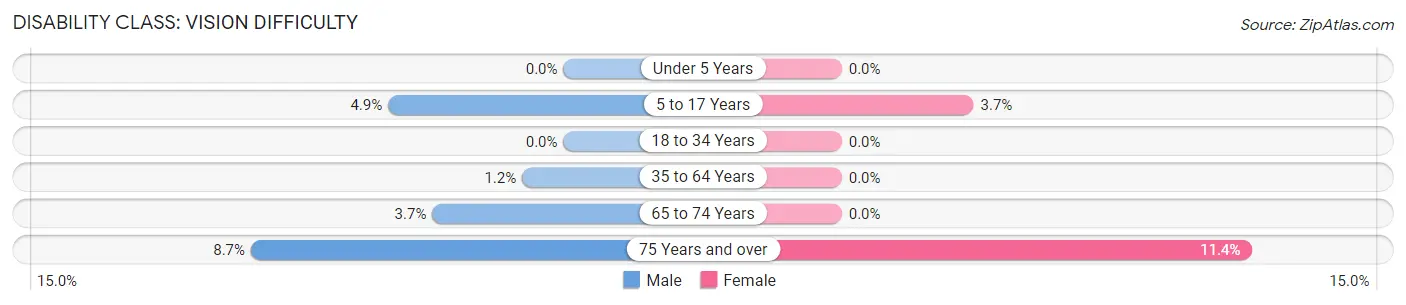
| Age Bracket | Male | Female |
| Under 5 Years | 0 (0.0%) | 0 (0.0%) |
| 5 to 17 Years | 21 (4.9%) | 15 (3.7%) |
| 18 to 34 Years | 0 (0.0%) | 0 (0.0%) |
| 35 to 64 Years | 4 (1.1%) | 0 (0.0%) |
| 65 to 74 Years | 5 (3.6%) | 0 (0.0%) |
| 75 Years and over | 2 (8.7%) | 8 (11.4%) |
Disability Class: Cognitive Difficulty
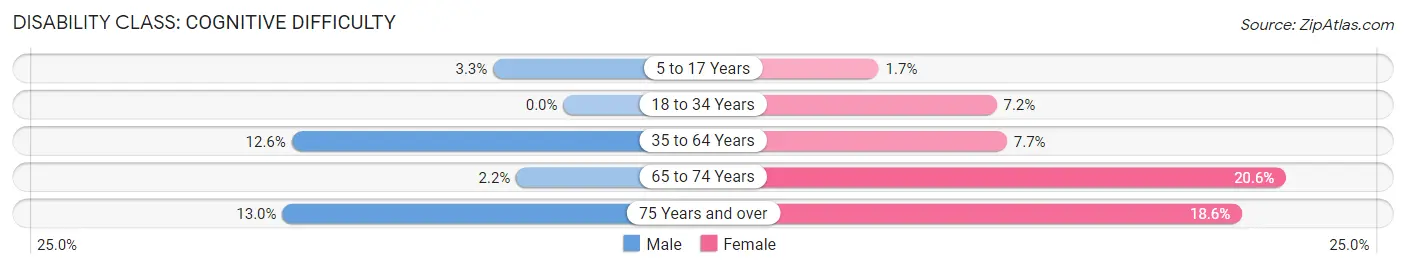
| Age Bracket | Male | Female |
| 5 to 17 Years | 14 (3.3%) | 7 (1.7%) |
| 18 to 34 Years | 0 (0.0%) | 26 (7.2%) |
| 35 to 64 Years | 44 (12.6%) | 42 (7.7%) |
| 65 to 74 Years | 3 (2.2%) | 20 (20.6%) |
| 75 Years and over | 3 (13.0%) | 13 (18.6%) |
Disability Class: Ambulatory Difficulty
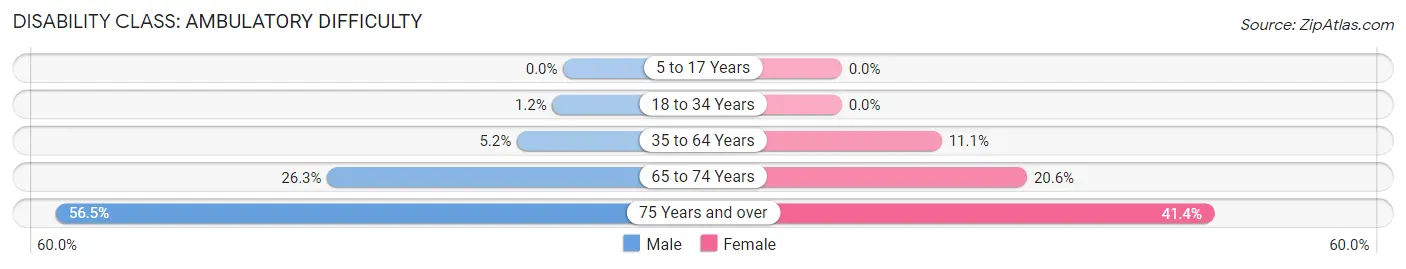
| Age Bracket | Male | Female |
| 5 to 17 Years | 0 (0.0%) | 0 (0.0%) |
| 18 to 34 Years | 5 (1.2%) | 0 (0.0%) |
| 35 to 64 Years | 18 (5.2%) | 61 (11.1%) |
| 65 to 74 Years | 36 (26.3%) | 20 (20.6%) |
| 75 Years and over | 13 (56.5%) | 29 (41.4%) |
Disability Class: Self-Care Difficulty
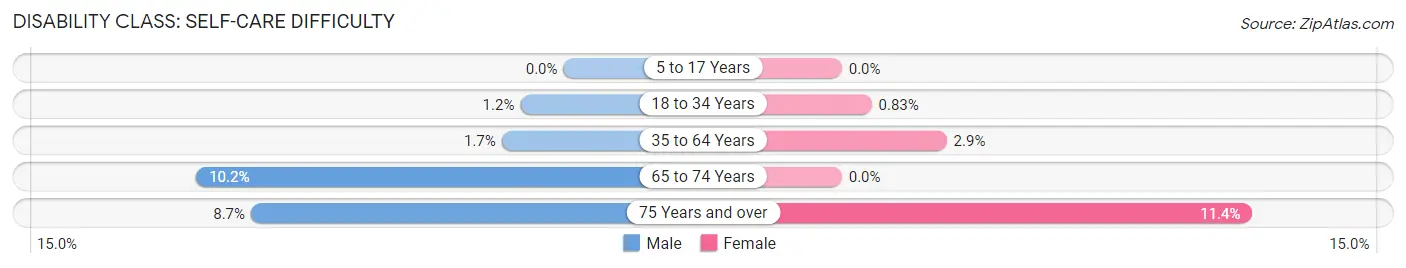
| Age Bracket | Male | Female |
| 5 to 17 Years | 0 (0.0%) | 0 (0.0%) |
| 18 to 34 Years | 5 (1.2%) | 3 (0.8%) |
| 35 to 64 Years | 6 (1.7%) | 16 (2.9%) |
| 65 to 74 Years | 14 (10.2%) | 0 (0.0%) |
| 75 Years and over | 2 (8.7%) | 8 (11.4%) |
Technology Access in Nyssa
Computing Device Access in Nyssa
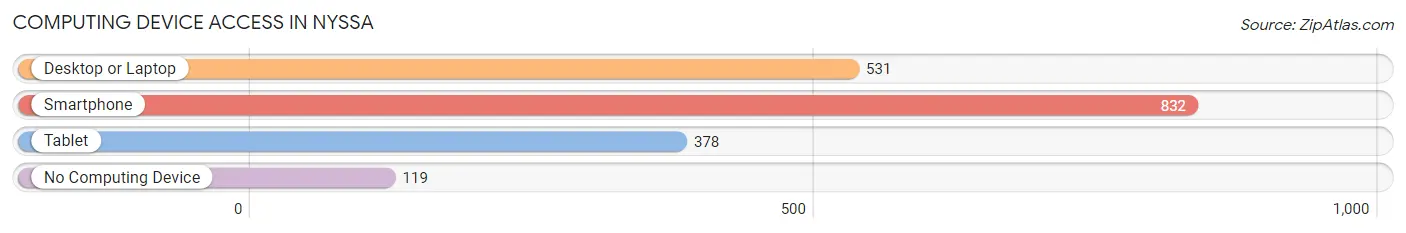
| Device Type | # Households | % Households |
| Desktop or Laptop | 531 | 53.3% |
| Smartphone | 832 | 83.5% |
| Tablet | 378 | 37.9% |
| No Computing Device | 119 | 11.9% |
| Total | 997 | 100.0% |
Internet Access in Nyssa
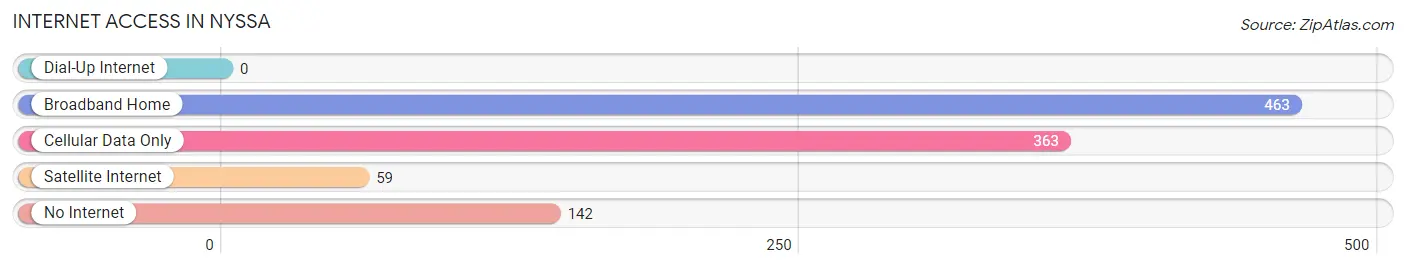
| Internet Type | # Households | % Households |
| Dial-Up Internet | 0 | 0.0% |
| Broadband Home | 463 | 46.4% |
| Cellular Data Only | 363 | 36.4% |
| Satellite Internet | 59 | 5.9% |
| No Internet | 142 | 14.2% |
| Total | 997 | 100.0% |
Nyssa Summary
Nyssa is a small city located in Malheur County, Oregon, United States. It is situated in the Treasure Valley, near the Idaho border. The city is located along the Snake River, and is the county seat of Malheur County. As of the 2010 census, the population of Nyssa was 3,267.
History
The area around Nyssa was first inhabited by the Northern Paiute people. The first European settlers arrived in the area in the late 1800s, and the city was officially incorporated in 1903. The city was named after the Greek goddess Nyssa, and was originally a farming community.
In the early 1900s, the city was a major hub for the Oregon Short Line Railroad. The railroad brought in many new settlers, and the city grew rapidly. In the 1920s, the city was home to a large sugar beet processing plant, which was the largest employer in the area.
Geography
Nyssa is located in the Treasure Valley, near the Idaho border. The city is situated along the Snake River, and is the county seat of Malheur County. The city has a total area of 2.2 square miles, all of which is land.
The city has a semi-arid climate, with hot summers and cold winters. The average annual precipitation is 8.5 inches.
Economy
Nyssa’s economy is largely based on agriculture. The city is home to a large sugar beet processing plant, which is the largest employer in the area. Other major industries in the city include manufacturing, retail, and healthcare.
Demographics
As of the 2010 census, the population of Nyssa was 3,267. The racial makeup of the city was 79.2% White, 0.7% African American, 0.7% Native American, 0.3% Asian, 0.1% Pacific Islander, 16.2% from other races, and 2.9% from two or more races. Hispanic or Latino of any race were 28.2% of the population.
The median income for a household in the city was $30,938, and the median income for a family was $36,250. The per capita income for the city was $14,945. About 18.2% of the population was below the poverty line.
Common Questions
What is the Total Population of Nyssa?
Total Population of Nyssa is 3,202.
What is the Total Male Population of Nyssa?
Total Male Population of Nyssa is 1,588.
What is the Total Female Population of Nyssa?
Total Female Population of Nyssa is 1,614.
What is the Ratio of Males per 100 Females in Nyssa?
There are 98.39 Males per 100 Females in Nyssa.
What is the Ratio of Females per 100 Males in Nyssa?
There are 101.64 Females per 100 Males in Nyssa.
What is the Median Population Age in Nyssa?
Median Population Age in Nyssa is 24.5 Years.
What is the Average Family Size in Nyssa
Average Family Size in Nyssa is 3.8 People.
What is the Average Household Size in Nyssa
Average Household Size in Nyssa is 3.2 People.
What is Per Capita Income in Nyssa?
Per Capita income in Nyssa is $19,931.
What is the Median Family Income in Nyssa?
Median Family Income in Nyssa is $54,667.
What is the Median Household income in Nyssa?
Median Household Income in Nyssa is $46,950.
What is Income or Wage Gap in Nyssa?
Income or Wage Gap in Nyssa is 40.8%.
Women in Nyssa earn 59.2 cents for every dollar earned by a man.
What is Inequality or Gini Index in Nyssa?
Inequality or Gini Index in Nyssa is 0.39.
How Large is the Labor Force in Nyssa?
There are 1,332 People in the Labor Forcein in Nyssa.
What is the Percentage of People in the Labor Force in Nyssa?
59.8% of People are in the Labor Force in Nyssa.
What is the Unemployment Rate in Nyssa?
Unemployment Rate in Nyssa is 7.4%.