Cities with the Highest Percentage of Immigrants from Poland in Oregon

RELATED REPORTS & OPTIONS

Poland
Population
Families and Households
Female Fertility
Female Fertility (Unmarried)
Race (Community Size)
Race (Percentage)
Ancestry (Community Size)
AfghanAfricanAlaska NativeAlaskan AthabascanAlbanianAleutAlsatianAmericanApacheArabArapahoArgentineanArmenianAssyrian / Chaldean / SyriacAustralianAustrianBahamianBangladeshiBarbadianBasqueBelgianBelizeanBermudanBhutaneseBlackfeetBolivianBrazilianBritishBritish West IndianBulgarianBurmeseCajunCambodianCanadianCape VerdeanCarpatho RusynCelticCentral AmericanCentral American IndianCherokeeCheyenneChickasawChileanChineseChippewaChoctawColombianColvilleComancheCosta RicanCreeCreekCroatianCrowCubanCypriotCzechCzechoslovakianDanishDelawareDominicanDutchDutch West IndianEastern EuropeanEcuadorianEgyptianEnglishEstonianEthiopianEuropeanFijianFilipinoFinnishFrenchFrench American IndianFrench CanadianGermanGerman RussianGhanaianGreekGuamanian / ChamorroGuatemalanGuyaneseHaitianHmongHonduranHopiHoumaHungarianIcelanderIndian (Asian)IndonesianInupiatIranianIraqiIrishIroquoisIsraeliItalianJamaicanJapaneseJordanianKenyanKiowaKoreanLaotianLatvianLebaneseLiberianLithuanianLumbeeLuxembourgerMacedonianMalaysianMalteseMarshalleseMenomineeMexicanMexican American IndianMongolianMoroccanNative HawaiianNavajoNepaleseNew ZealanderNicaraguanNigerianNorthern EuropeanNorwegianOkinawanOsageOttawaPaiutePakistaniPalestinianPanamanianParaguayanPennsylvania GermanPeruvianPimaPolishPortuguesePotawatomiPuebloPuerto RicanPuget Sound SalishRomanianRussianSalvadoranSamoanScandinavianScotch-IrishScottishSeminoleSenegaleseSerbianShoshoneSierra LeoneanSiouxSlavicSlovakSloveneSomaliSouth AfricanSouth AmericanSouth American IndianSoviet UnionSpaniardSpanishSpanish AmericanSpanish American IndianSri LankanSubsaharan AfricanSudaneseSwedishSwissSyrianTaiwaneseThaiTlingit-HaidaTohono O'OdhamTonganTrinidadian and TobagonianTsimshianTurkishU.S. Virgin IslanderUgandanUkrainianUruguayanUteVenezuelanVietnameseWelshWest IndianYakamaYaquiYugoslavianYumanYup'ikZimbabwean
Ancestry (Percentage)
AfghanAfricanAlaska NativeAlaskan AthabascanAlbanianAleutAlsatianAmericanApacheArabArapahoArgentineanArmenianAssyrian / Chaldean / SyriacAustralianAustrianBahamianBangladeshiBarbadianBasqueBelgianBelizeanBermudanBhutaneseBlackfeetBolivianBrazilianBritishBritish West IndianBulgarianBurmeseCajunCambodianCanadianCape VerdeanCarpatho RusynCelticCentral AmericanCentral American IndianCherokeeCheyenneChickasawChileanChineseChippewaChoctawColombianColvilleComancheCosta RicanCreeCreekCroatianCrowCubanCypriotCzechCzechoslovakianDanishDelawareDominicanDutchDutch West IndianEastern EuropeanEcuadorianEgyptianEnglishEstonianEthiopianEuropeanFijianFilipinoFinnishFrenchFrench American IndianFrench CanadianGermanGerman RussianGhanaianGreekGuamanian / ChamorroGuatemalanGuyaneseHaitianHmongHonduranHopiHoumaHungarianIcelanderIndian (Asian)IndonesianInupiatIranianIraqiIrishIroquoisIsraeliItalianJamaicanJapaneseJordanianKenyanKiowaKoreanLaotianLatvianLebaneseLiberianLithuanianLumbeeLuxembourgerMacedonianMalaysianMalteseMarshalleseMenomineeMexicanMexican American IndianMongolianMoroccanNative HawaiianNavajoNepaleseNew ZealanderNicaraguanNigerianNorthern EuropeanNorwegianOkinawanOsageOttawaPaiutePakistaniPalestinianPanamanianParaguayanPennsylvania GermanPeruvianPimaPolishPortuguesePotawatomiPuebloPuerto RicanPuget Sound SalishRomanianRussianSalvadoranSamoanScandinavianScotch-IrishScottishSeminoleSenegaleseSerbianShoshoneSierra LeoneanSiouxSlavicSlovakSloveneSomaliSouth AfricanSouth AmericanSouth American IndianSoviet UnionSpaniardSpanishSpanish AmericanSpanish American IndianSri LankanSubsaharan AfricanSudaneseSwedishSwissSyrianTaiwaneseThaiTlingit-HaidaTohono O'OdhamTonganTrinidadian and TobagonianTsimshianTurkishU.S. Virgin IslanderUgandanUkrainianUruguayanUteVenezuelanVietnameseWelshWest IndianYakamaYaquiYugoslavianYumanYup'ikZimbabwean
Immigrant Origin (Total)
AfghanistanAfricaAlbaniaArgentinaArmeniaAsiaAustraliaAustriaAzoresBahamasBangladeshBarbadosBelarusBelgiumBelizeBoliviaBosnia and HerzegovinaBrazilBulgariaBurma / MyanmarCabo VerdeCambodiaCameroonCanadaCaribbeanCentral AmericaChileChinaColombiaCongoCosta RicaCroatiaCubaCzechoslovakiaDenmarkDominicaDominican RepublicEastern AfricaEastern AsiaEastern EuropeEcuadorEgyptEl SalvadorEnglandEritreaEthiopiaEuropeFijiFranceGermanyGhanaGreeceGrenadaGuatemalaGuyanaHaitiHondurasHong KongHungaryIndiaIndonesiaIranIraqIrelandIsraelItalyJamaicaJapanJordanKazakhstanKenyaKoreaKuwaitLaosLatin AmericaLatviaLebanonLiberiaLithuaniaMalaysiaMexicoMicronesiaMiddle AfricaMoldovaMoroccoNepalNetherlandsNicaraguaNigeriaNorth MacedoniaNorthern AfricaNorthern EuropeNorwayOceaniaPakistanPanamaPeruPhilippinesPolandPortugalRomaniaRussiaSaudi ArabiaScotlandSenegalSerbiaSierra LeoneSingaporeSomaliaSouth AfricaSouth AmericaSouth Central AsiaSouth Eastern AsiaSouthern EuropeSpainSri LankaSt. Vincent and the GrenadinesSudanSwedenSwitzerlandSyriaTaiwanThailandTrinidad and TobagoTurkeyUgandaUkraineUruguayUzbekistanVenezuelaVietnamWest IndiesWestern AfricaWestern AsiaWestern EuropeYemenZaireZimbabwe
Immigrant Origin (Percentage)
AfghanistanAfricaAlbaniaArgentinaArmeniaAsiaAustraliaAustriaAzoresBahamasBangladeshBarbadosBelarusBelgiumBelizeBoliviaBosnia and HerzegovinaBrazilBulgariaBurma / MyanmarCabo VerdeCambodiaCameroonCanadaCaribbeanCentral AmericaChileChinaColombiaCongoCosta RicaCroatiaCubaCzechoslovakiaDenmarkDominicaDominican RepublicEastern AfricaEastern AsiaEastern EuropeEcuadorEgyptEl SalvadorEnglandEritreaEthiopiaEuropeFijiFranceGermanyGhanaGreeceGrenadaGuatemalaGuyanaHaitiHondurasHong KongHungaryIndiaIndonesiaIranIraqIrelandIsraelItalyJamaicaJapanJordanKazakhstanKenyaKoreaKuwaitLaosLatin AmericaLatviaLebanonLiberiaLithuaniaMalaysiaMexicoMicronesiaMiddle AfricaMoldovaMoroccoNepalNetherlandsNicaraguaNigeriaNorth MacedoniaNorthern AfricaNorthern EuropeNorwayOceaniaPakistanPanamaPeruPhilippinesPolandPortugalRomaniaRussiaSaudi ArabiaScotlandSenegalSerbiaSierra LeoneSingaporeSomaliaSouth AfricaSouth AmericaSouth Central AsiaSouth Eastern AsiaSouthern EuropeSpainSri LankaSt. Vincent and the GrenadinesSudanSwedenSwitzerlandSyriaTaiwanThailandTrinidad and TobagoTurkeyUgandaUkraineUruguayUzbekistanVenezuelaVietnamWest IndiesWestern AfricaWestern AsiaWestern EuropeYemenZaireZimbabwe
Income
Income (Families)
Income (Households)
Poverty
Poverty (Families)
Unemployment
Employment Occupations
Employment Industries
Employer Class
Commute Time
Commute Means
School Enrollment
Education by Degree Field
Occupancy
Finances
Physical Characteristics
Oregon
Compare Cities
Comparison Subject

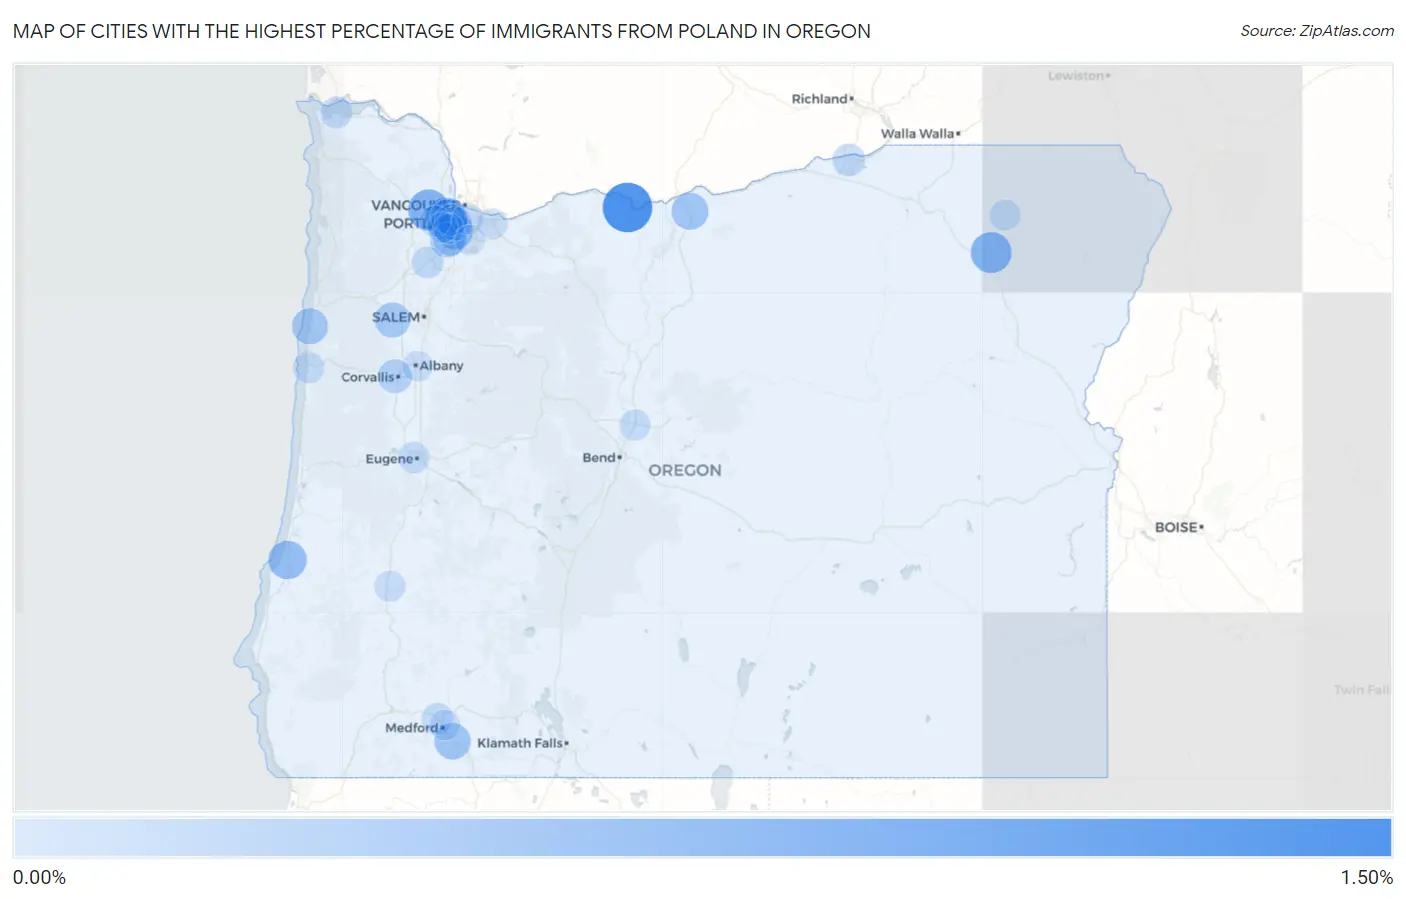
Map of Cities with the Highest Percentage of Immigrants from Poland in Oregon

0.00%
1.50%
Cities with the Highest Percentage of Immigrants from Poland in Oregon Map

Cities with the Highest Percentage of Immigrants from Poland in Oregon

City Poland vs State vs National
1.Chenoweth1.22%0.038%(+1.18)#10.12%(+1.10)#321
2.Oak Hills0.74%0.038%(+0.700)#20.12%(+0.615)#539
3.North Plains0.68%0.038%(+0.645)#30.12%(+0.560)#593
4.Island City0.66%0.038%(+0.626)#40.12%(+0.541)#616
5.North Bend0.52%0.038%(+0.479)#50.12%(+0.394)#771
6.Wasco0.41%0.038%(+0.377)#60.12%(+0.291)#962
7.Talent0.38%0.038%(+0.345)#70.12%(+0.260)#1,015
8.Garden Home Whitford0.38%0.038%(+0.343)#80.12%(+0.258)#1,022
9.Lincoln Beach0.36%0.038%(+0.322)#90.12%(+0.236)#1,067
10.Dallas0.31%0.038%(+0.275)#100.12%(+0.189)#1,186
11.Bull Mountain0.28%0.038%(+0.241)#110.12%(+0.156)#1,313
12.Bethany0.24%0.038%(+0.197)#120.12%(+0.112)#1,488
13.Tigard0.23%0.038%(+0.192)#130.12%(+0.107)#1,510
14.West Haven Sylvan0.23%0.038%(+0.189)#140.12%(+0.103)#1,528
15.Corvallis0.22%0.038%(+0.180)#150.12%(+0.095)#1,563
16.Umatilla0.15%0.038%(+0.110)#160.12%(+0.024)#1,917
17.Astoria0.098%0.038%(+0.060)#170.12%(-0.025)#2,219
18.Dundee0.093%0.038%(+0.055)#180.12%(-0.030)#2,267
19.Central Point0.089%0.038%(+0.051)#190.12%(-0.035)#2,298
20.Cedar Mill0.089%0.038%(+0.051)#200.12%(-0.035)#2,300
21.Eugene0.081%0.038%(+0.043)#210.12%(-0.042)#2,364
22.Newport0.078%0.038%(+0.039)#220.12%(-0.046)#2,402
23.Hillsboro0.070%0.038%(+0.032)#230.12%(-0.053)#2,472
24.Elgin0.062%0.038%(+0.024)#240.12%(-0.061)#2,559
25.Redmond0.056%0.038%(+0.017)#250.12%(-0.068)#2,628
26.Portland0.050%0.038%(+0.012)#260.12%(-0.074)#2,695
27.Roseburg0.046%0.038%(+0.008)#270.12%(-0.077)#2,732
28.Medford0.032%0.038%(-0.007)#280.12%(-0.092)#2,924
29.Gresham0.020%0.038%(-0.018)#290.12%(-0.103)#3,086
30.Albany0.020%0.038%(-0.019)#300.12%(-0.104)#3,098
31.Beaverton0.015%0.038%(-0.023)#310.12%(-0.108)#3,154
32.Aloha0.013%0.038%(-0.025)#320.12%(-0.110)#3,184
33.Oak Grove0.0057%0.038%(-0.032)#330.12%(-0.118)#3,266

Common Questions

What are the Top 10 Cities with the Highest Percentage of Immigrants from Poland in Oregon?
Top 10 Cities with the Highest Percentage of Immigrants from Poland in Oregon are:
#1
1.22%
#2
0.74%
#3
0.68%
#4
0.66%
#5
0.52%
#6
0.41%
#7
0.38%
#8
0.38%
#9
0.36%
#10
0.31%
What city has the Highest Percentage of Immigrants from Poland in Oregon?
Chenoweth has the Highest Percentage of Immigrants from Poland in Oregon with 1.22%.
What is the Percentage of Immigrants from Poland in the State of Oregon?
Percentage of Immigrants from Poland in Oregon is 0.038%.
What is the Percentage of Immigrants from Poland in the United States?
Percentage of Immigrants from Poland in the United States is 0.12%.