Cities with the Highest Percentage of Immigrants from Ukraine in Oregon

RELATED REPORTS & OPTIONS

Ukraine
Population
Families and Households
Female Fertility
Female Fertility (Unmarried)
Race (Community Size)
Race (Percentage)
Ancestry (Community Size)
AfghanAfricanAlaska NativeAlaskan AthabascanAlbanianAleutAlsatianAmericanApacheArabArapahoArgentineanArmenianAssyrian / Chaldean / SyriacAustralianAustrianBahamianBangladeshiBarbadianBasqueBelgianBelizeanBermudanBhutaneseBlackfeetBolivianBrazilianBritishBritish West IndianBulgarianBurmeseCajunCambodianCanadianCape VerdeanCarpatho RusynCelticCentral AmericanCentral American IndianCherokeeCheyenneChickasawChileanChineseChippewaChoctawColombianColvilleComancheCosta RicanCreeCreekCroatianCrowCubanCypriotCzechCzechoslovakianDanishDelawareDominicanDutchDutch West IndianEastern EuropeanEcuadorianEgyptianEnglishEstonianEthiopianEuropeanFijianFilipinoFinnishFrenchFrench American IndianFrench CanadianGermanGerman RussianGhanaianGreekGuamanian / ChamorroGuatemalanGuyaneseHaitianHmongHonduranHopiHoumaHungarianIcelanderIndian (Asian)IndonesianInupiatIranianIraqiIrishIroquoisIsraeliItalianJamaicanJapaneseJordanianKenyanKiowaKoreanLaotianLatvianLebaneseLiberianLithuanianLumbeeLuxembourgerMacedonianMalaysianMalteseMarshalleseMenomineeMexicanMexican American IndianMongolianMoroccanNative HawaiianNavajoNepaleseNew ZealanderNicaraguanNigerianNorthern EuropeanNorwegianOkinawanOsageOttawaPaiutePakistaniPalestinianPanamanianParaguayanPennsylvania GermanPeruvianPimaPolishPortuguesePotawatomiPuebloPuerto RicanPuget Sound SalishRomanianRussianSalvadoranSamoanScandinavianScotch-IrishScottishSeminoleSenegaleseSerbianShoshoneSierra LeoneanSiouxSlavicSlovakSloveneSomaliSouth AfricanSouth AmericanSouth American IndianSoviet UnionSpaniardSpanishSpanish AmericanSpanish American IndianSri LankanSubsaharan AfricanSudaneseSwedishSwissSyrianTaiwaneseThaiTlingit-HaidaTohono O'OdhamTonganTrinidadian and TobagonianTsimshianTurkishU.S. Virgin IslanderUgandanUkrainianUruguayanUteVenezuelanVietnameseWelshWest IndianYakamaYaquiYugoslavianYumanYup'ikZimbabwean
Ancestry (Percentage)
AfghanAfricanAlaska NativeAlaskan AthabascanAlbanianAleutAlsatianAmericanApacheArabArapahoArgentineanArmenianAssyrian / Chaldean / SyriacAustralianAustrianBahamianBangladeshiBarbadianBasqueBelgianBelizeanBermudanBhutaneseBlackfeetBolivianBrazilianBritishBritish West IndianBulgarianBurmeseCajunCambodianCanadianCape VerdeanCarpatho RusynCelticCentral AmericanCentral American IndianCherokeeCheyenneChickasawChileanChineseChippewaChoctawColombianColvilleComancheCosta RicanCreeCreekCroatianCrowCubanCypriotCzechCzechoslovakianDanishDelawareDominicanDutchDutch West IndianEastern EuropeanEcuadorianEgyptianEnglishEstonianEthiopianEuropeanFijianFilipinoFinnishFrenchFrench American IndianFrench CanadianGermanGerman RussianGhanaianGreekGuamanian / ChamorroGuatemalanGuyaneseHaitianHmongHonduranHopiHoumaHungarianIcelanderIndian (Asian)IndonesianInupiatIranianIraqiIrishIroquoisIsraeliItalianJamaicanJapaneseJordanianKenyanKiowaKoreanLaotianLatvianLebaneseLiberianLithuanianLumbeeLuxembourgerMacedonianMalaysianMalteseMarshalleseMenomineeMexicanMexican American IndianMongolianMoroccanNative HawaiianNavajoNepaleseNew ZealanderNicaraguanNigerianNorthern EuropeanNorwegianOkinawanOsageOttawaPaiutePakistaniPalestinianPanamanianParaguayanPennsylvania GermanPeruvianPimaPolishPortuguesePotawatomiPuebloPuerto RicanPuget Sound SalishRomanianRussianSalvadoranSamoanScandinavianScotch-IrishScottishSeminoleSenegaleseSerbianShoshoneSierra LeoneanSiouxSlavicSlovakSloveneSomaliSouth AfricanSouth AmericanSouth American IndianSoviet UnionSpaniardSpanishSpanish AmericanSpanish American IndianSri LankanSubsaharan AfricanSudaneseSwedishSwissSyrianTaiwaneseThaiTlingit-HaidaTohono O'OdhamTonganTrinidadian and TobagonianTsimshianTurkishU.S. Virgin IslanderUgandanUkrainianUruguayanUteVenezuelanVietnameseWelshWest IndianYakamaYaquiYugoslavianYumanYup'ikZimbabwean
Immigrant Origin (Total)
AfghanistanAfricaAlbaniaArgentinaArmeniaAsiaAustraliaAustriaAzoresBahamasBangladeshBarbadosBelarusBelgiumBelizeBoliviaBosnia and HerzegovinaBrazilBulgariaBurma / MyanmarCabo VerdeCambodiaCameroonCanadaCaribbeanCentral AmericaChileChinaColombiaCongoCosta RicaCroatiaCubaCzechoslovakiaDenmarkDominicaDominican RepublicEastern AfricaEastern AsiaEastern EuropeEcuadorEgyptEl SalvadorEnglandEritreaEthiopiaEuropeFijiFranceGermanyGhanaGreeceGrenadaGuatemalaGuyanaHaitiHondurasHong KongHungaryIndiaIndonesiaIranIraqIrelandIsraelItalyJamaicaJapanJordanKazakhstanKenyaKoreaKuwaitLaosLatin AmericaLatviaLebanonLiberiaLithuaniaMalaysiaMexicoMicronesiaMiddle AfricaMoldovaMoroccoNepalNetherlandsNicaraguaNigeriaNorth MacedoniaNorthern AfricaNorthern EuropeNorwayOceaniaPakistanPanamaPeruPhilippinesPolandPortugalRomaniaRussiaSaudi ArabiaScotlandSenegalSerbiaSierra LeoneSingaporeSomaliaSouth AfricaSouth AmericaSouth Central AsiaSouth Eastern AsiaSouthern EuropeSpainSri LankaSt. Vincent and the GrenadinesSudanSwedenSwitzerlandSyriaTaiwanThailandTrinidad and TobagoTurkeyUgandaUkraineUruguayUzbekistanVenezuelaVietnamWest IndiesWestern AfricaWestern AsiaWestern EuropeYemenZaireZimbabwe
Immigrant Origin (Percentage)
AfghanistanAfricaAlbaniaArgentinaArmeniaAsiaAustraliaAustriaAzoresBahamasBangladeshBarbadosBelarusBelgiumBelizeBoliviaBosnia and HerzegovinaBrazilBulgariaBurma / MyanmarCabo VerdeCambodiaCameroonCanadaCaribbeanCentral AmericaChileChinaColombiaCongoCosta RicaCroatiaCubaCzechoslovakiaDenmarkDominicaDominican RepublicEastern AfricaEastern AsiaEastern EuropeEcuadorEgyptEl SalvadorEnglandEritreaEthiopiaEuropeFijiFranceGermanyGhanaGreeceGrenadaGuatemalaGuyanaHaitiHondurasHong KongHungaryIndiaIndonesiaIranIraqIrelandIsraelItalyJamaicaJapanJordanKazakhstanKenyaKoreaKuwaitLaosLatin AmericaLatviaLebanonLiberiaLithuaniaMalaysiaMexicoMicronesiaMiddle AfricaMoldovaMoroccoNepalNetherlandsNicaraguaNigeriaNorth MacedoniaNorthern AfricaNorthern EuropeNorwayOceaniaPakistanPanamaPeruPhilippinesPolandPortugalRomaniaRussiaSaudi ArabiaScotlandSenegalSerbiaSierra LeoneSingaporeSomaliaSouth AfricaSouth AmericaSouth Central AsiaSouth Eastern AsiaSouthern EuropeSpainSri LankaSt. Vincent and the GrenadinesSudanSwedenSwitzerlandSyriaTaiwanThailandTrinidad and TobagoTurkeyUgandaUkraineUruguayUzbekistanVenezuelaVietnamWest IndiesWestern AfricaWestern AsiaWestern EuropeYemenZaireZimbabwe
Income
Income (Families)
Income (Households)
Poverty
Poverty (Families)
Unemployment
Employment Occupations
Employment Industries
Employer Class
Commute Time
Commute Means
School Enrollment
Education by Degree Field
Occupancy
Finances
Physical Characteristics
Oregon
Compare Cities
Comparison Subject

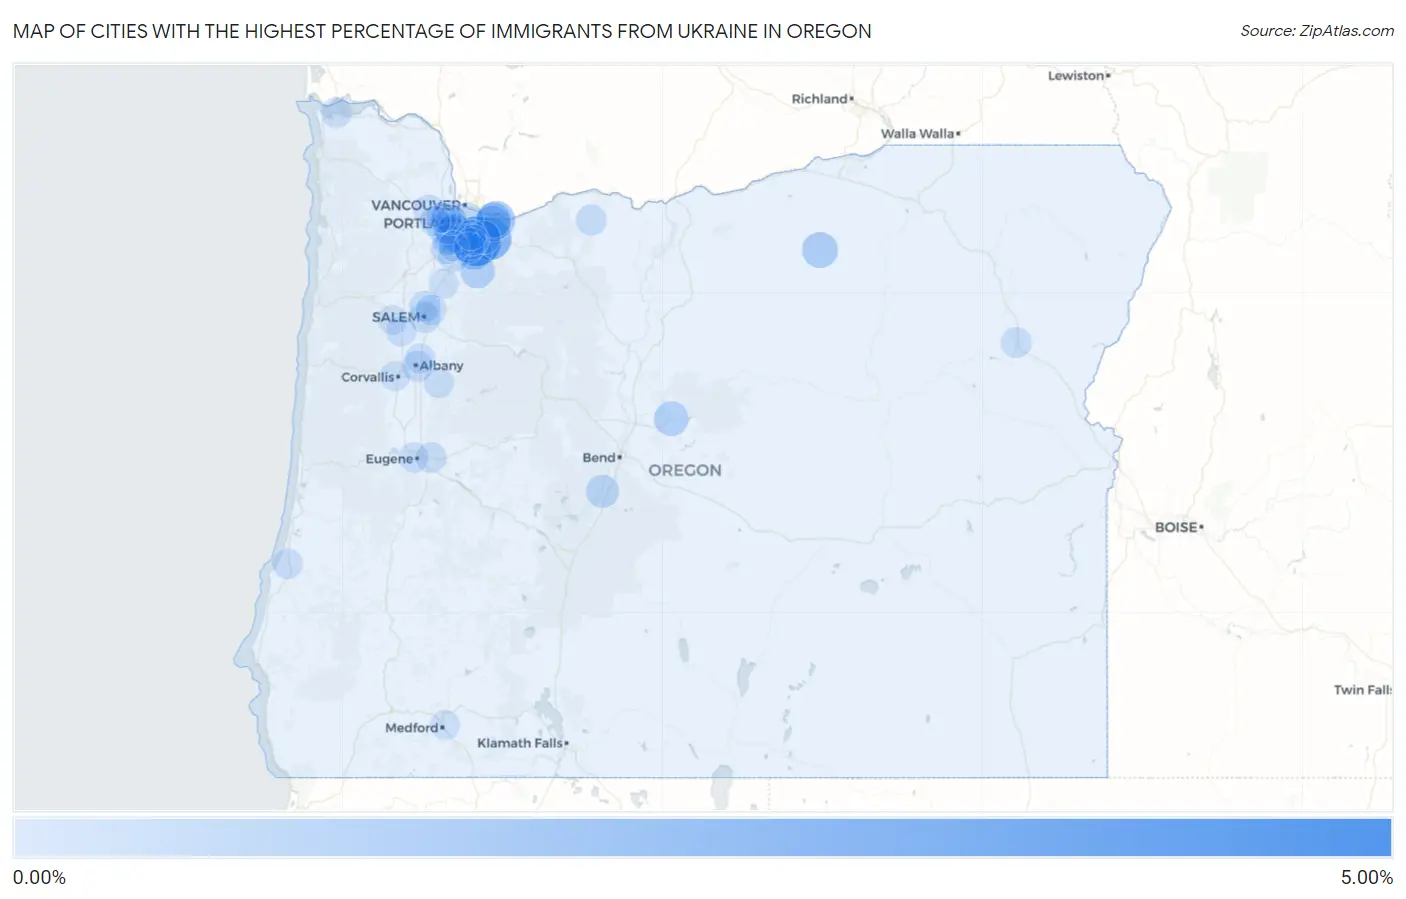
Map of Cities with the Highest Percentage of Immigrants from Ukraine in Oregon

0.00%
5.00%
Cities with the Highest Percentage of Immigrants from Ukraine in Oregon Map

Cities with the Highest Percentage of Immigrants from Ukraine in Oregon

City Ukraine vs State vs National
1.Oregon Shores4.90%0.20%(+4.70)#10.12%(+4.78)#37
2.Johnson City3.95%0.20%(+3.75)#20.12%(+3.84)#50
3.Damascus2.57%0.20%(+2.37)#30.12%(+2.45)#99
4.Dunthorpe1.75%0.20%(+1.55)#40.12%(+1.64)#179
5.Troutdale1.54%0.20%(+1.34)#50.12%(+1.42)#216
6.Metzger1.32%0.20%(+1.12)#60.12%(+1.21)#254
7.Oregon City1.26%0.20%(+1.06)#70.12%(+1.15)#270
8.Gresham1.18%0.20%(+0.982)#80.12%(+1.07)#292
9.Heppner1.14%0.20%(+0.938)#90.12%(+1.02)#306
10.Garden Home Whitford1.03%0.20%(+0.830)#100.12%(+0.914)#347
11.Wood Village0.99%0.20%(+0.789)#110.12%(+0.874)#358
12.Prineville0.90%0.20%(+0.698)#120.12%(+0.782)#393
13.Mulino0.86%0.20%(+0.662)#130.12%(+0.747)#407
14.Three Rivers0.61%0.20%(+0.411)#140.12%(+0.496)#593
15.Happy Valley0.60%0.20%(+0.403)#150.12%(+0.487)#604
16.Oak Grove0.44%0.20%(+0.245)#160.12%(+0.329)#803
17.Bethany0.44%0.20%(+0.242)#170.12%(+0.326)#807
18.Portland0.41%0.20%(+0.206)#180.12%(+0.291)#877
19.Jennings Lodge0.33%0.20%(+0.126)#190.12%(+0.211)#1,030
20.Lake Oswego0.29%0.20%(+0.094)#200.12%(+0.178)#1,105
21.Wilsonville0.25%0.20%(+0.054)#210.12%(+0.138)#1,202
22.Aloha0.24%0.20%(+0.035)#220.12%(+0.120)#1,274
23.Tigard0.23%0.20%(+0.032)#230.12%(+0.116)#1,283
24.Salem0.22%0.20%(+0.024)#240.12%(+0.108)#1,314
25.Keizer0.21%0.20%(+0.014)#250.12%(+0.099)#1,353
26.Bull Mountain0.19%0.20%(-0.007)#260.12%(+0.077)#1,434
27.Albany0.17%0.20%(-0.028)#270.12%(+0.056)#1,534
28.Mount Hood0.17%0.20%(-0.029)#280.12%(+0.056)#1,536
29.Baker City0.17%0.20%(-0.032)#290.12%(+0.052)#1,555
30.Beaverton0.17%0.20%(-0.032)#300.12%(+0.052)#1,556
31.Oak Hills0.16%0.20%(-0.039)#310.12%(+0.046)#1,584
32.North Plains0.15%0.20%(-0.052)#320.12%(+0.033)#1,641
33.Astoria0.15%0.20%(-0.053)#330.12%(+0.032)#1,646
34.Sherwood0.13%0.20%(-0.072)#340.12%(+0.012)#1,743
35.Hayesville0.12%0.20%(-0.077)#350.12%(+0.008)#1,771
36.Lebanon0.12%0.20%(-0.082)#360.12%(+0.003)#1,804
37.Springfield0.12%0.20%(-0.084)#370.12%(+0.001)#1,818
38.Millersburg0.10%0.20%(-0.099)#380.12%(-0.015)#1,927
39.Coos Bay0.10%0.20%(-0.100)#390.12%(-0.015)#1,933
40.Cedar Mill0.099%0.20%(-0.101)#400.12%(-0.017)#1,940
41.Monmouth0.090%0.20%(-0.110)#410.12%(-0.025)#1,995
42.Oatfield0.084%0.20%(-0.116)#420.12%(-0.032)#2,040
43.Rockcreek0.081%0.20%(-0.120)#430.12%(-0.035)#2,070
44.Eugene0.078%0.20%(-0.122)#440.12%(-0.038)#2,101
45.Tualatin0.068%0.20%(-0.132)#450.12%(-0.047)#2,181
46.Hillsboro0.064%0.20%(-0.136)#460.12%(-0.052)#2,232
47.West Linn0.055%0.20%(-0.145)#470.12%(-0.061)#2,306
48.Milwaukie0.042%0.20%(-0.158)#480.12%(-0.073)#2,432
49.Woodburn0.034%0.20%(-0.166)#490.12%(-0.081)#2,528
50.Dallas0.024%0.20%(-0.177)#500.12%(-0.092)#2,648
51.Medford0.019%0.20%(-0.182)#510.12%(-0.097)#2,708
52.Corvallis0.012%0.20%(-0.189)#520.12%(-0.104)#2,779

Common Questions

What are the Top 10 Cities with the Highest Percentage of Immigrants from Ukraine in Oregon?
Top 10 Cities with the Highest Percentage of Immigrants from Ukraine in Oregon are:
#1
3.95%
#2
2.57%
#3
1.54%
#4
1.32%
#5
1.26%
#6
1.18%
#7
1.14%
#8
1.03%
#9
0.99%
#10
0.90%
What city has the Highest Percentage of Immigrants from Ukraine in Oregon?
Johnson City has the Highest Percentage of Immigrants from Ukraine in Oregon with 3.95%.
What is the Percentage of Immigrants from Ukraine in the State of Oregon?
Percentage of Immigrants from Ukraine in Oregon is 0.20%.
What is the Percentage of Immigrants from Ukraine in the United States?
Percentage of Immigrants from Ukraine in the United States is 0.12%.