Drain, OR
Drain Map
Drain Overview
1,055
TOTAL POPULATION
501
MALE POPULATION
554
FEMALE POPULATION
90.43
MALES / 100 FEMALES
110.58
FEMALES / 100 MALES
52.7
MEDIAN AGE
2.6
AVG FAMILY SIZE
2.3
AVG HOUSEHOLD SIZE
$25,730
PER CAPITA INCOME
$67,670
AVG FAMILY INCOME
$49,130
AVG HOUSEHOLD INCOME
0.37
INEQUALITY / GINI INDEX
505
LABOR FORCE [ PEOPLE ]
56.0%
PERCENT IN LABOR FORCE
5.5%
UNEMPLOYMENT RATE
Drain Zip Codes
Drain Area Codes
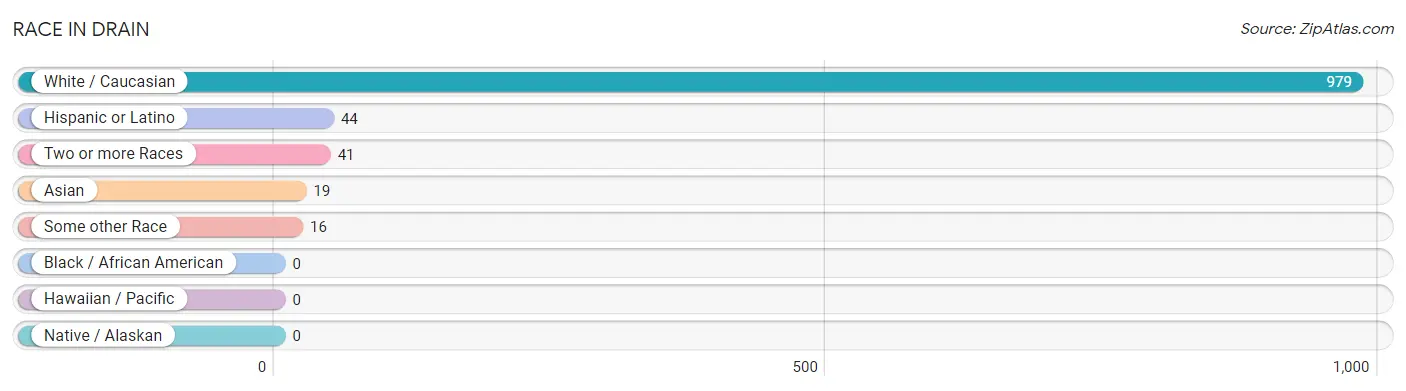
Race in Drain
The most populous races in Drain are White / Caucasian (979 | 92.8%), Hispanic or Latino (44 | 4.2%), and Two or more Races (41 | 3.9%).
| Race | # Population | % Population |
| Asian | 19 | 1.8% |
| Black / African American | 0 | 0.0% |
| Hawaiian / Pacific | 0 | 0.0% |
| Hispanic or Latino | 44 | 4.2% |
| Native / Alaskan | 0 | 0.0% |
| White / Caucasian | 979 | 92.8% |
| Two or more Races | 41 | 3.9% |
| Some other Race | 16 | 1.5% |
| Total | 1,055 | 100.0% |
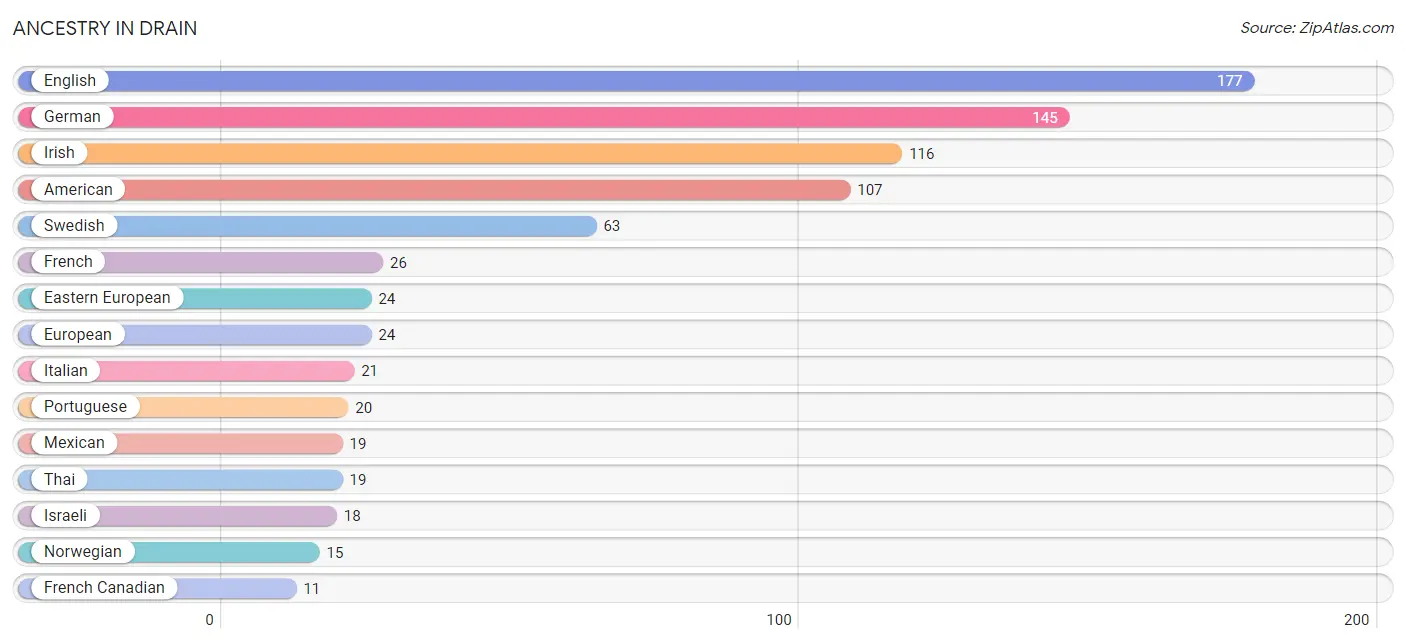
Ancestry in Drain
The most populous ancestries reported in Drain are English (177 | 16.8%), German (145 | 13.7%), Irish (116 | 11.0%), American (107 | 10.1%), and Swedish (63 | 6.0%), together accounting for 57.6% of all Drain residents.
| Ancestry | # Population | % Population |
| American | 107 | 10.1% |
| Central American | 2 | 0.2% |
| Cherokee | 2 | 0.2% |
| Costa Rican | 2 | 0.2% |
| Danish | 10 | 0.9% |
| Eastern European | 24 | 2.3% |
| English | 177 | 16.8% |
| European | 24 | 2.3% |
| French | 26 | 2.5% |
| French Canadian | 11 | 1.0% |
| German | 145 | 13.7% |
| Irish | 116 | 11.0% |
| Israeli | 18 | 1.7% |
| Italian | 21 | 2.0% |
| Mexican | 19 | 1.8% |
| Norwegian | 15 | 1.4% |
| Portuguese | 20 | 1.9% |
| Scotch-Irish | 10 | 0.9% |
| Scottish | 3 | 0.3% |
| Seminole | 11 | 1.0% |
| Swedish | 63 | 6.0% |
| Thai | 19 | 1.8% | View All 22 Rows |
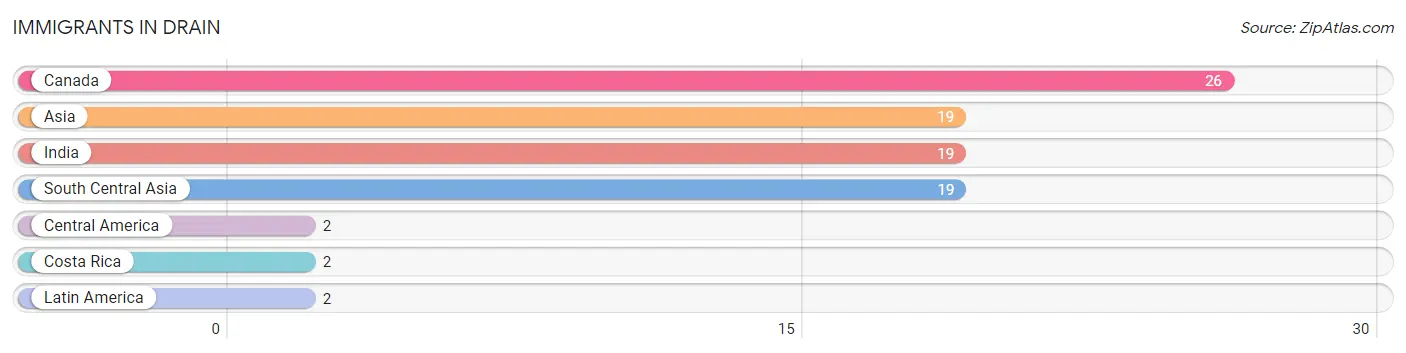
Immigrants in Drain
The most numerous immigrant groups reported in Drain came from Canada (26 | 2.5%), Asia (19 | 1.8%), India (19 | 1.8%), South Central Asia (19 | 1.8%), and Central America (2 | 0.2%), together accounting for 8.1% of all Drain residents.
| Immigration Origin | # Population | % Population |
| Asia | 19 | 1.8% |
| Canada | 26 | 2.5% |
| Central America | 2 | 0.2% |
| Costa Rica | 2 | 0.2% |
| India | 19 | 1.8% |
| Latin America | 2 | 0.2% |
| South Central Asia | 19 | 1.8% | View All 7 Rows |
Sex and Age in Drain
Sex and Age in Drain
The most populous age groups in Drain are 55 to 59 Years (71 | 14.2%) for men and 50 to 54 Years (92 | 16.6%) for women.
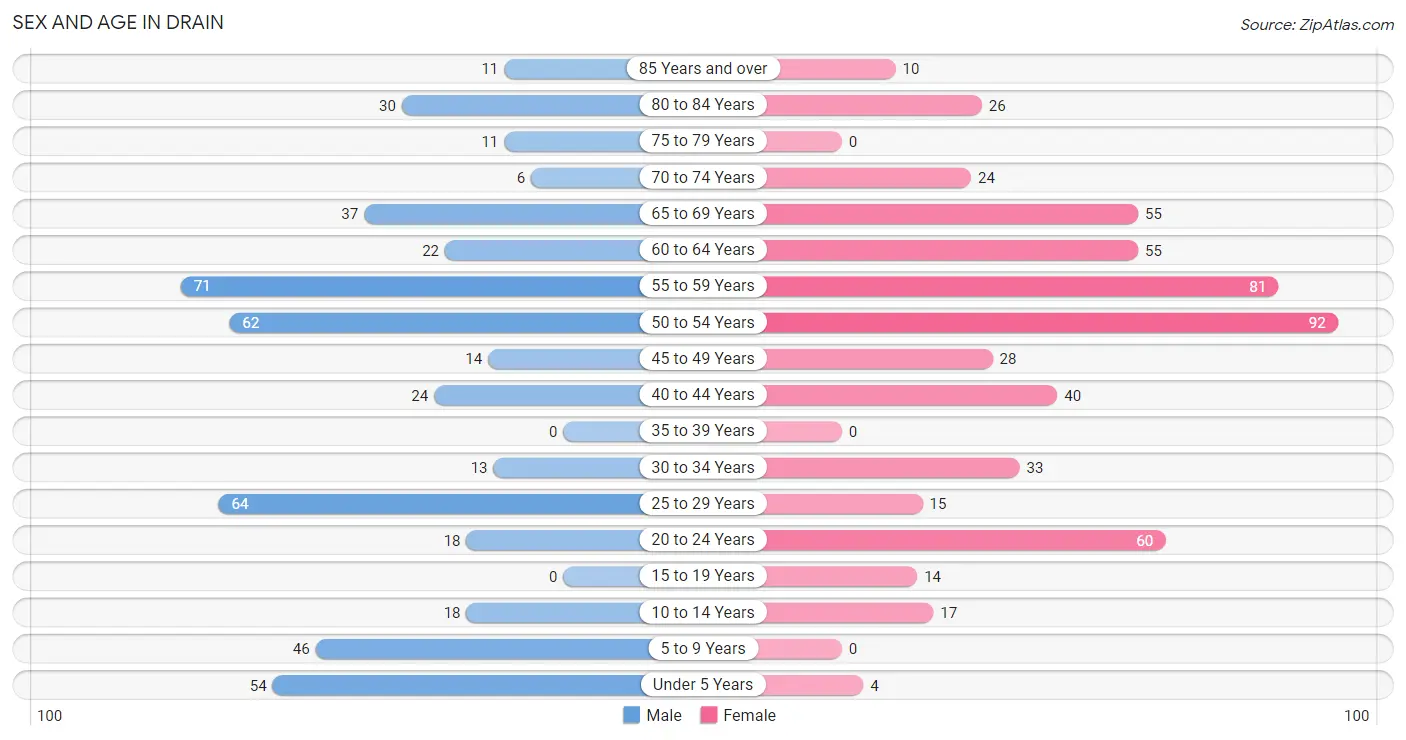
| Age Bracket | Male | Female |
| Under 5 Years | 54 (10.8%) | 4 (0.7%) |
| 5 to 9 Years | 46 (9.2%) | 0 (0.0%) |
| 10 to 14 Years | 18 (3.6%) | 17 (3.1%) |
| 15 to 19 Years | 0 (0.0%) | 14 (2.5%) |
| 20 to 24 Years | 18 (3.6%) | 60 (10.8%) |
| 25 to 29 Years | 64 (12.8%) | 15 (2.7%) |
| 30 to 34 Years | 13 (2.6%) | 33 (6.0%) |
| 35 to 39 Years | 0 (0.0%) | 0 (0.0%) |
| 40 to 44 Years | 24 (4.8%) | 40 (7.2%) |
| 45 to 49 Years | 14 (2.8%) | 28 (5.1%) |
| 50 to 54 Years | 62 (12.4%) | 92 (16.6%) |
| 55 to 59 Years | 71 (14.2%) | 81 (14.6%) |
| 60 to 64 Years | 22 (4.4%) | 55 (9.9%) |
| 65 to 69 Years | 37 (7.4%) | 55 (9.9%) |
| 70 to 74 Years | 6 (1.2%) | 24 (4.3%) |
| 75 to 79 Years | 11 (2.2%) | 0 (0.0%) |
| 80 to 84 Years | 30 (6.0%) | 26 (4.7%) |
| 85 Years and over | 11 (2.2%) | 10 (1.8%) |
| Total | 501 (100.0%) | 554 (100.0%) |
Families and Households in Drain
Median Family Size in Drain
The median family size in Drain is 2.61 persons per family, with single male/father families (29 | 9.3%) accounting for the largest median family size of 3.72 persons per family. On the other hand, married-couple families (225 | 72.4%) represent the smallest median family size with 2.36 persons per family.
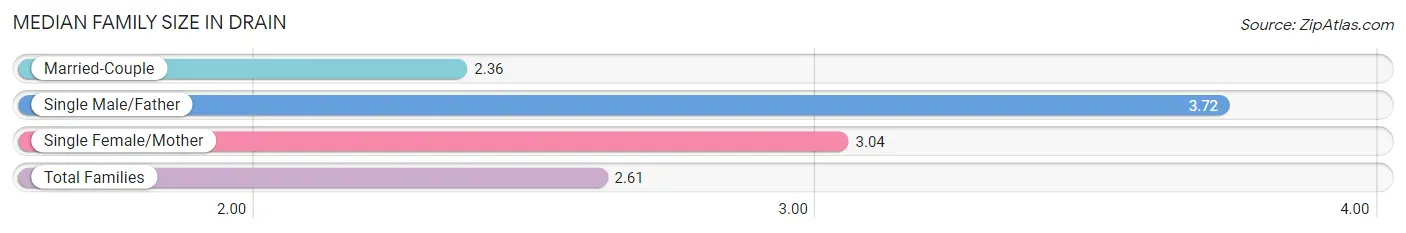
| Family Type | # Families | Family Size |
| Married-Couple | 225 (72.4%) | 2.36 |
| Single Male/Father | 29 (9.3%) | 3.72 |
| Single Female/Mother | 57 (18.3%) | 3.04 |
| Total Families | 311 (100.0%) | 2.61 |
Median Household Size in Drain
The median household size in Drain is 2.31 persons per household, with single male/father households (29 | 6.4%) accounting for the largest median household size of 4.24 persons per household. non-family households (145 | 31.8%) represent the smallest median household size with 1.41 persons per household.
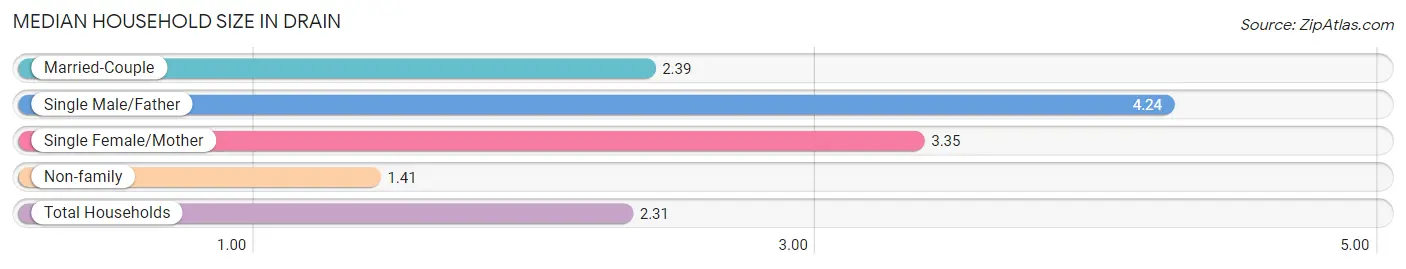
| Household Type | # Households | Household Size |
| Married-Couple | 225 (49.3%) | 2.39 |
| Single Male/Father | 29 (6.4%) | 4.24 |
| Single Female/Mother | 57 (12.5%) | 3.35 |
| Non-family | 145 (31.8%) | 1.41 |
| Total Households | 456 (100.0%) | 2.31 |
Household Size by Marriage Status in Drain
Out of a total of 456 households in Drain, 311 (68.2%) are family households, while 145 (31.8%) are nonfamily households. The most numerous type of family households are 2-person households, comprising 196, and the most common type of nonfamily households are 1-person households, comprising 74.
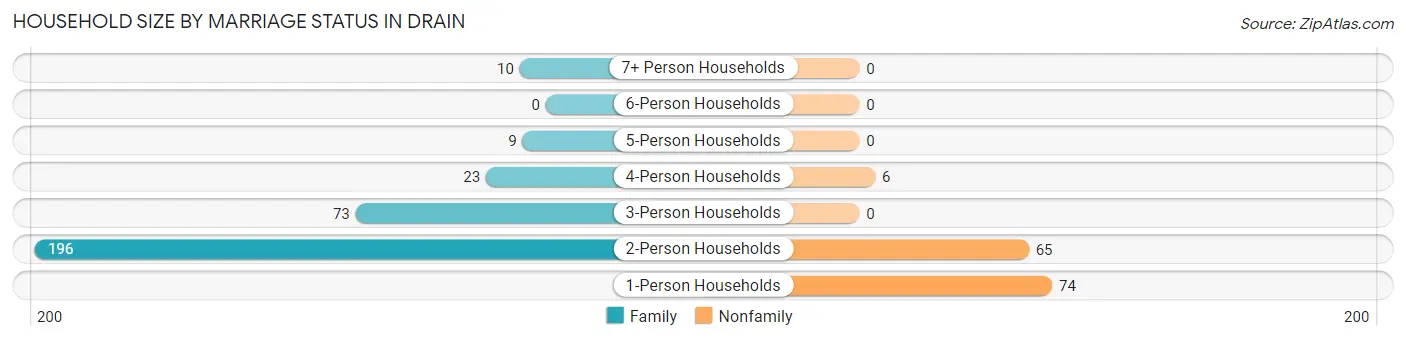
| Household Size | Family Households | Nonfamily Households |
| 1-Person Households | - | 74 (16.2%) |
| 2-Person Households | 196 (43.0%) | 65 (14.2%) |
| 3-Person Households | 73 (16.0%) | 0 (0.0%) |
| 4-Person Households | 23 (5.0%) | 6 (1.3%) |
| 5-Person Households | 9 (2.0%) | 0 (0.0%) |
| 6-Person Households | 0 (0.0%) | 0 (0.0%) |
| 7+ Person Households | 10 (2.2%) | 0 (0.0%) |
| Total | 311 (68.2%) | 145 (31.8%) |
Female Fertility in Drain
Fertility by Age in Drain
Average fertility rate in Drain is 95.0 births per 1,000 women. Women in the age bracket of 20 to 34 years have the highest fertility rate with 204.0 births per 1,000 women. Women in the age bracket of 20 to 34 years acount for 100.0% of all women with births.
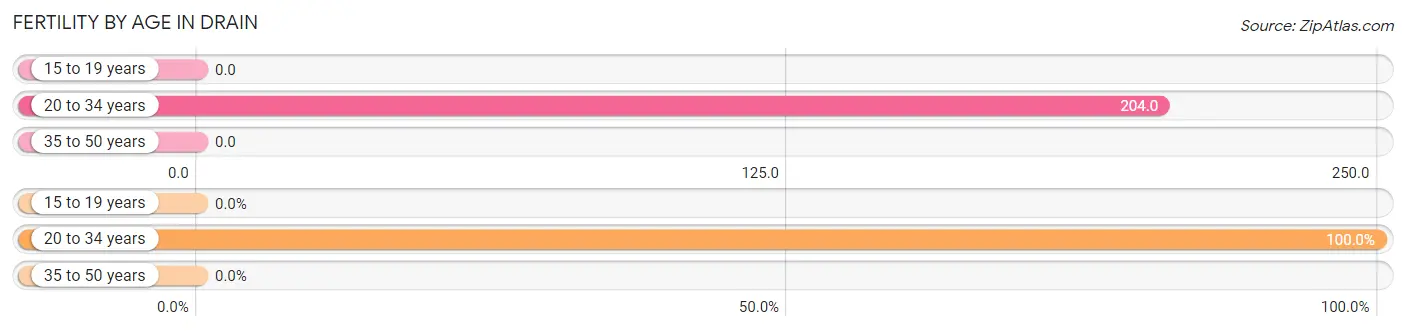
| Age Bracket | Women with Births | Births / 1,000 Women |
| 15 to 19 years | 0 (0.0%) | 0.0 |
| 20 to 34 years | 22 (100.0%) | 204.0 |
| 35 to 50 years | 0 (0.0%) | 0.0 |
| Total | 22 (100.0%) | 95.0 |
Fertility by Age by Marriage Status in Drain
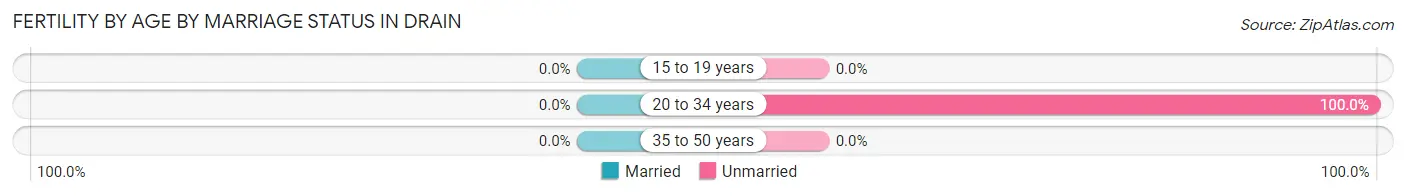
| Age Bracket | Married | Unmarried |
| 15 to 19 years | 0 (0.0%) | 0 (0.0%) |
| 20 to 34 years | 0 (0.0%) | 22 (100.0%) |
| 35 to 50 years | 0 (0.0%) | 0 (0.0%) |
| Total | 0 (0.0%) | 22 (100.0%) |
Fertility by Education in Drain
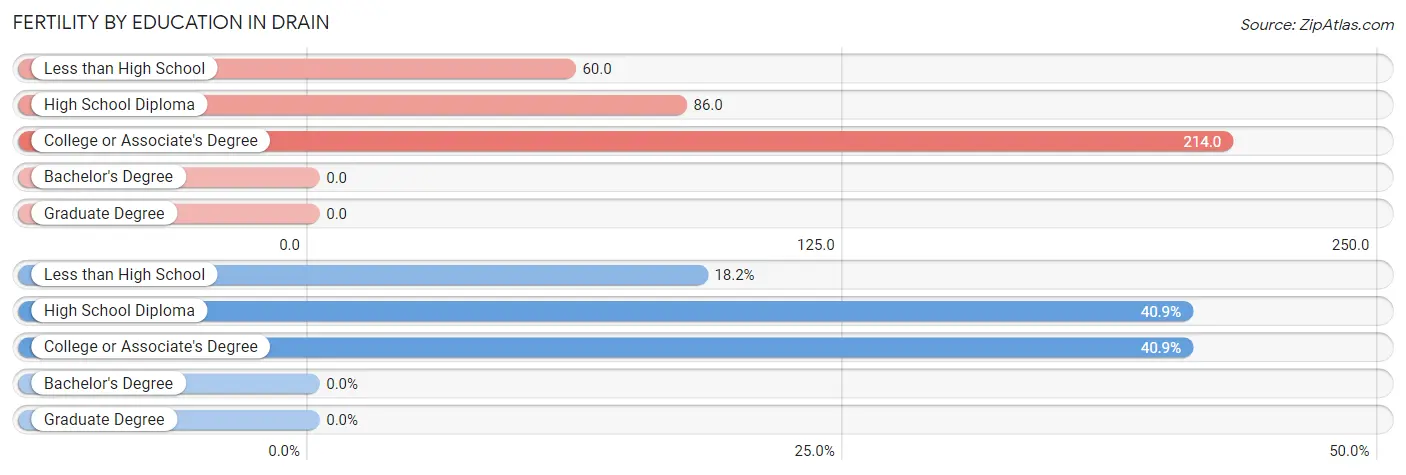
| Educational Attainment | Women with Births | Births / 1,000 Women |
| Less than High School | 4 (18.2%) | 60.0 |
| High School Diploma | 9 (40.9%) | 86.0 |
| College or Associate's Degree | 9 (40.9%) | 214.0 |
| Bachelor's Degree | 0 (0.0%) | 0.0 |
| Graduate Degree | 0 (0.0%) | 0.0 |
| Total | 22 (100.0%) | 95.0 |
Fertility by Education by Marriage Status in Drain
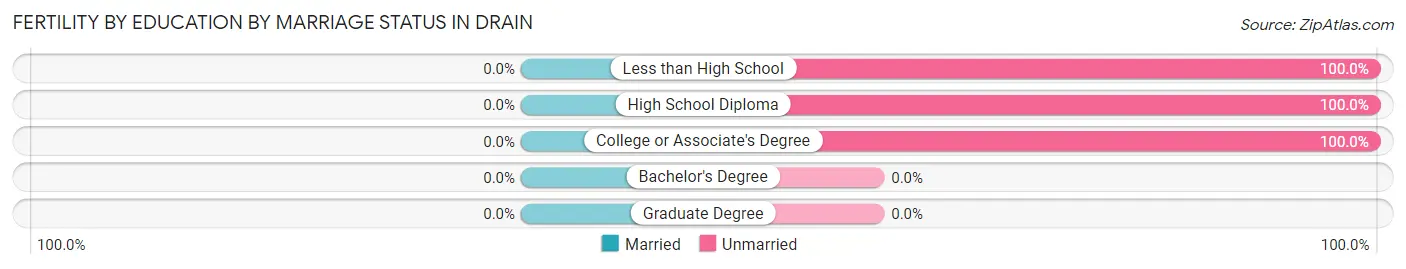
| Educational Attainment | Married | Unmarried |
| Less than High School | 0 (0.0%) | 4 (100.0%) |
| High School Diploma | 0 (0.0%) | 9 (100.0%) |
| College or Associate's Degree | 0 (0.0%) | 9 (100.0%) |
| Bachelor's Degree | 0 (0.0%) | 0 (0.0%) |
| Graduate Degree | 0 (0.0%) | 0 (0.0%) |
| Total | 0 (0.0%) | 22 (100.0%) |
Income in Drain
Income Overview in Drain
Per Capita Income in Drain is $25,730, while median incomes of families and households are $67,670 and $49,130 respectively.
| Characteristic | Number | Measure |
| Per Capita Income | 1,055 | $25,730 |
| Median Family Income | 311 | $67,670 |
| Mean Family Income | 311 | $68,878 |
| Median Household Income | 456 | $49,130 |
| Mean Household Income | 456 | $59,949 |
| Income Deficit | 311 | $0 |
| Wage / Income Gap (%) | 1,055 | 0.00% |
| Wage / Income Gap ($) | 1,055 | 100.00¢ per $1 |
| Gini / Inequality Index | 1,055 | 0.37 |
Earnings by Sex in Drain
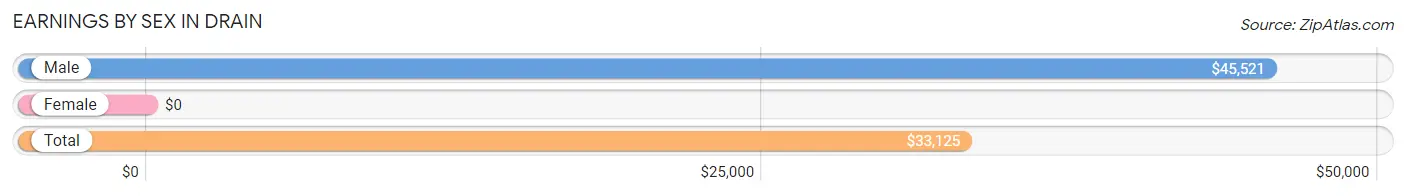
| Sex | Number | Average Earnings |
| Male | 241 (47.9%) | $45,521 |
| Female | 262 (52.1%) | $0 |
| Total | 503 (100.0%) | $33,125 |
Earnings by Sex by Income Bracket in Drain
The most common earnings brackets in Drain are $100,000+ for men (56 | 23.2%) and $5,000 to $7,499 for women (38 | 14.5%).
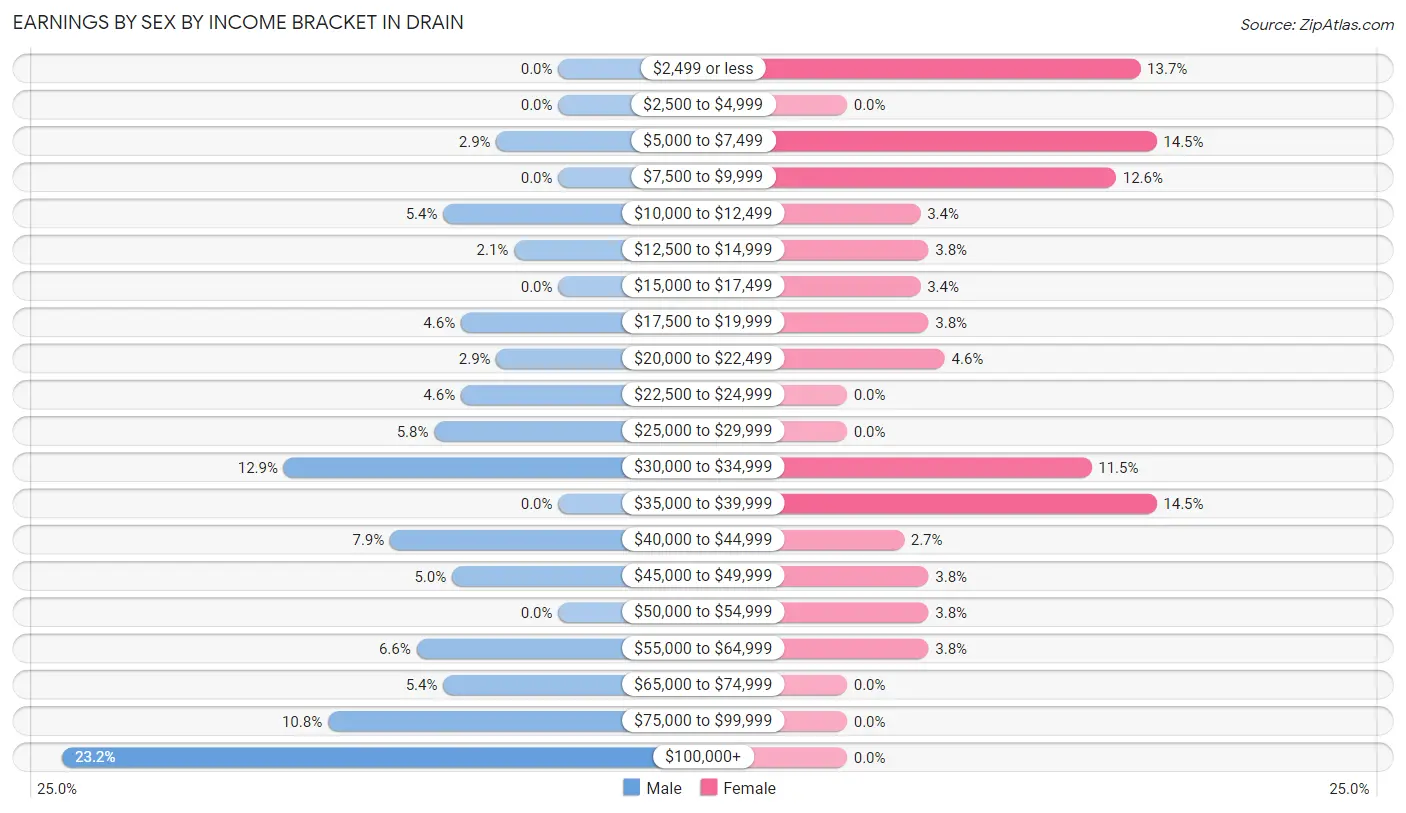
| Income | Male | Female |
| $2,499 or less | 0 (0.0%) | 36 (13.7%) |
| $2,500 to $4,999 | 0 (0.0%) | 0 (0.0%) |
| $5,000 to $7,499 | 7 (2.9%) | 38 (14.5%) |
| $7,500 to $9,999 | 0 (0.0%) | 33 (12.6%) |
| $10,000 to $12,499 | 13 (5.4%) | 9 (3.4%) |
| $12,500 to $14,999 | 5 (2.1%) | 10 (3.8%) |
| $15,000 to $17,499 | 0 (0.0%) | 9 (3.4%) |
| $17,500 to $19,999 | 11 (4.6%) | 10 (3.8%) |
| $20,000 to $22,499 | 7 (2.9%) | 12 (4.6%) |
| $22,500 to $24,999 | 11 (4.6%) | 0 (0.0%) |
| $25,000 to $29,999 | 14 (5.8%) | 0 (0.0%) |
| $30,000 to $34,999 | 31 (12.9%) | 30 (11.5%) |
| $35,000 to $39,999 | 0 (0.0%) | 38 (14.5%) |
| $40,000 to $44,999 | 19 (7.9%) | 7 (2.7%) |
| $45,000 to $49,999 | 12 (5.0%) | 10 (3.8%) |
| $50,000 to $54,999 | 0 (0.0%) | 10 (3.8%) |
| $55,000 to $64,999 | 16 (6.6%) | 10 (3.8%) |
| $65,000 to $74,999 | 13 (5.4%) | 0 (0.0%) |
| $75,000 to $99,999 | 26 (10.8%) | 0 (0.0%) |
| $100,000+ | 56 (23.2%) | 0 (0.0%) |
| Total | 241 (100.0%) | 262 (100.0%) |
Earnings by Sex by Educational Attainment in Drain
Average earnings in Drain are $47,396 for men and $16,389 for women, a difference of 65.4%. Men with an educational attainment of less than high school enjoy the highest average annual earnings of $57,500, while those with college or associate's degree education earn the least with $32,500. Women with an educational attainment of college or associate's degree earn the most with the average annual earnings of $35,682, while those with high school diploma education have the smallest earnings of $9,318.
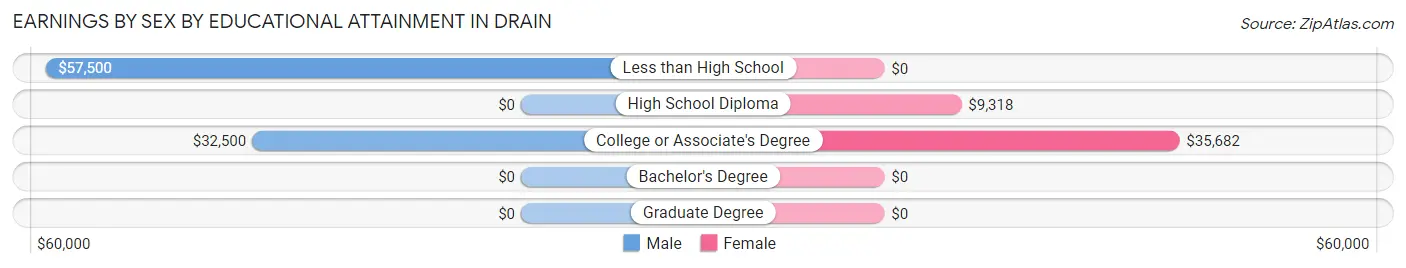
| Educational Attainment | Male Income | Female Income |
| Less than High School | $57,500 | $0 |
| High School Diploma | - | - |
| College or Associate's Degree | $32,500 | $35,682 |
| Bachelor's Degree | - | - |
| Graduate Degree | - | - |
| Total | $47,396 | $16,389 |
Family Income in Drain
Family Income Brackets in Drain
According to the Drain family income data, there are 86 families falling into the $100,000 to $149,999 income range, which is the most common income bracket and makes up 27.7% of all families.
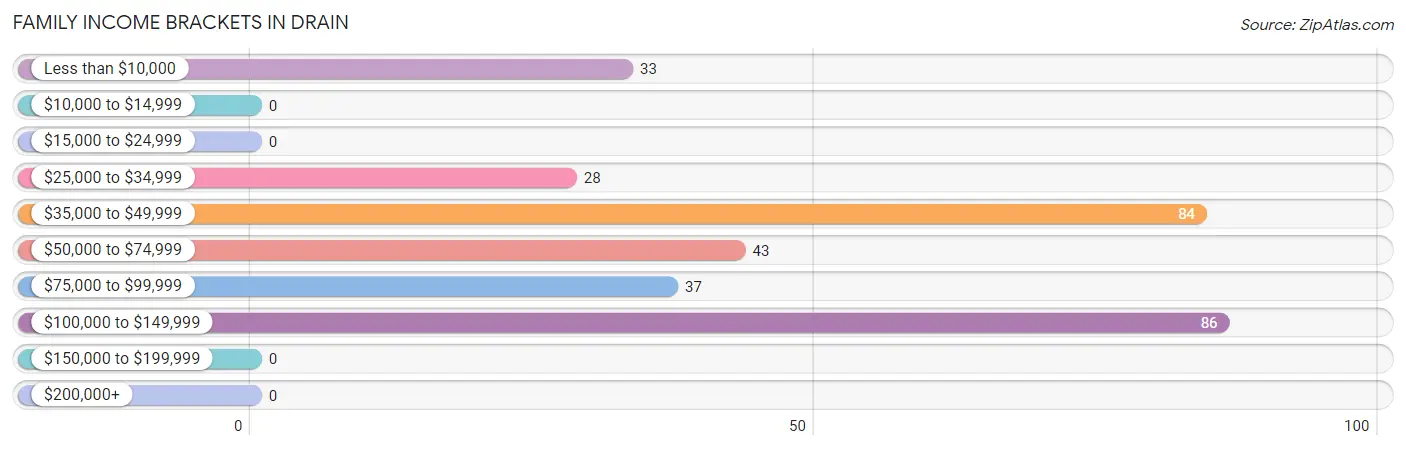
| Income Bracket | # Families | % Families |
| Less than $10,000 | 33 | 10.6% |
| $10,000 to $14,999 | 0 | 0.0% |
| $15,000 to $24,999 | 0 | 0.0% |
| $25,000 to $34,999 | 28 | 9.0% |
| $35,000 to $49,999 | 84 | 27.0% |
| $50,000 to $74,999 | 43 | 13.8% |
| $75,000 to $99,999 | 37 | 11.9% |
| $100,000 to $149,999 | 86 | 27.7% |
| $150,000 to $199,999 | 0 | 0.0% |
| $200,000+ | 0 | 0.0% |
Family Income by Famaliy Size in Drain
2-person families (196 | 63.0%) account for the highest median family income in Drain with $72,500 per family, while 2-person families (196 | 63.0%) have the highest median income of $36,250 per family member.
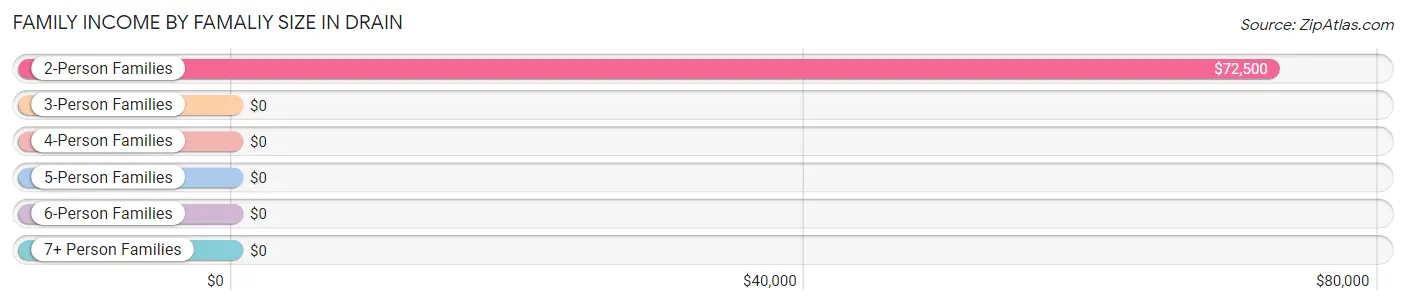
| Income Bracket | # Families | Median Income |
| 2-Person Families | 196 (63.0%) | $72,500 |
| 3-Person Families | 86 (27.7%) | $0 |
| 4-Person Families | 10 (3.2%) | $0 |
| 5-Person Families | 16 (5.1%) | $0 |
| 6-Person Families | 0 (0.0%) | $0 |
| 7+ Person Families | 3 (1.0%) | $0 |
| Total | 311 (100.0%) | $67,670 |
Family Income by Number of Earners in Drain
The median family income in Drain is $67,670, with families comprising 3+ earners (18) having the highest median family income of $100,833, while families with no earners (41) have the lowest median family income of $34,940, accounting for 5.8% and 13.2% of families, respectively.
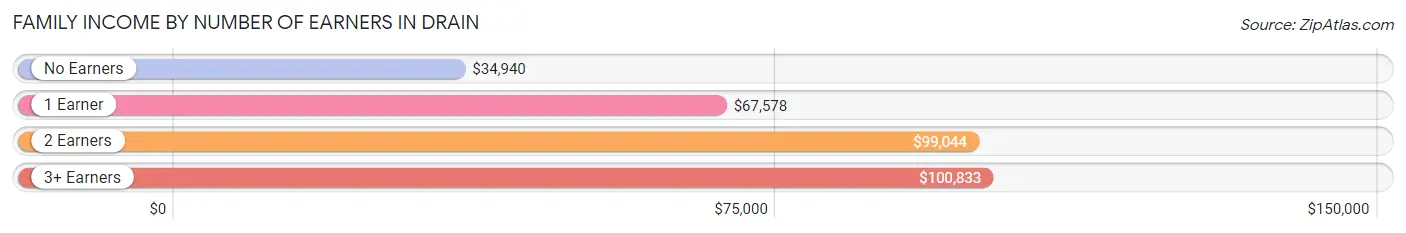
| Number of Earners | # Families | Median Income |
| No Earners | 41 (13.2%) | $34,940 |
| 1 Earner | 173 (55.6%) | $67,578 |
| 2 Earners | 79 (25.4%) | $99,044 |
| 3+ Earners | 18 (5.8%) | $100,833 |
| Total | 311 (100.0%) | $67,670 |
Household Income in Drain
Household Income Brackets in Drain
With 130 households falling in the category, the $35,000 to $49,999 income range is the most frequent in Drain, accounting for 28.5% of all households.
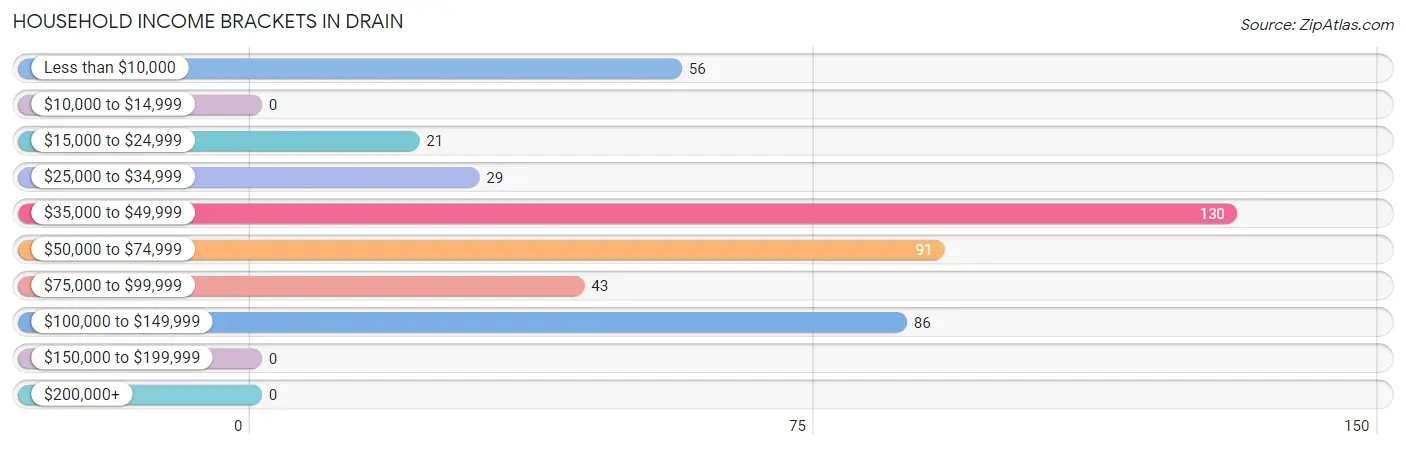
| Income Bracket | # Households | % Households |
| Less than $10,000 | 56 | 12.3% |
| $10,000 to $14,999 | 0 | 0.0% |
| $15,000 to $24,999 | 21 | 4.6% |
| $25,000 to $34,999 | 29 | 6.4% |
| $35,000 to $49,999 | 130 | 28.5% |
| $50,000 to $74,999 | 91 | 20.0% |
| $75,000 to $99,999 | 43 | 9.4% |
| $100,000 to $149,999 | 86 | 18.9% |
| $150,000 to $199,999 | 0 | 0.0% |
| $200,000+ | 0 | 0.0% |
Household Income by Householder Age in Drain
The median household income in Drain is $49,130, with the highest median household income of $71,875 found in the 45 to 64 years age bracket for the primary householder. A total of 229 households (50.2%) fall into this category.
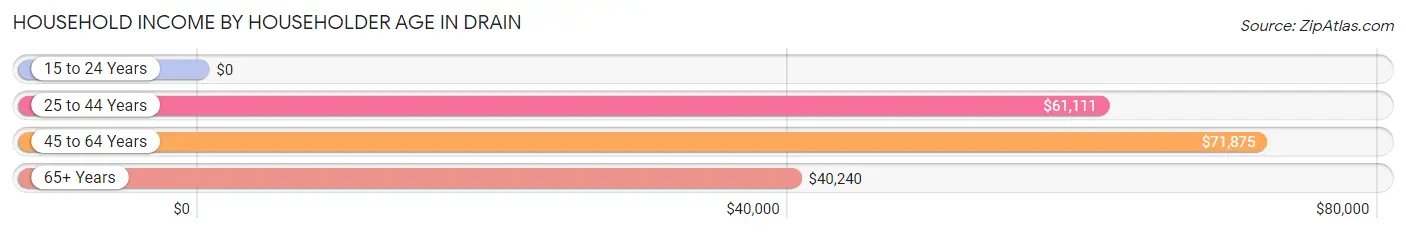
| Income Bracket | # Households | Median Income |
| 15 to 24 Years | 0 (0.0%) | $0 |
| 25 to 44 Years | 92 (20.2%) | $61,111 |
| 45 to 64 Years | 229 (50.2%) | $71,875 |
| 65+ Years | 135 (29.6%) | $40,240 |
| Total | 456 (100.0%) | $49,130 |
Poverty in Drain
Income Below Poverty by Sex and Age in Drain
With 14.1% poverty level for males and 25.3% for females among the residents of Drain, 5 year old males and 25 to 34 year old females are the most vulnerable to poverty, with 18 males (100.0%) and 48 females (100.0%) in their respective age groups living below the poverty level.
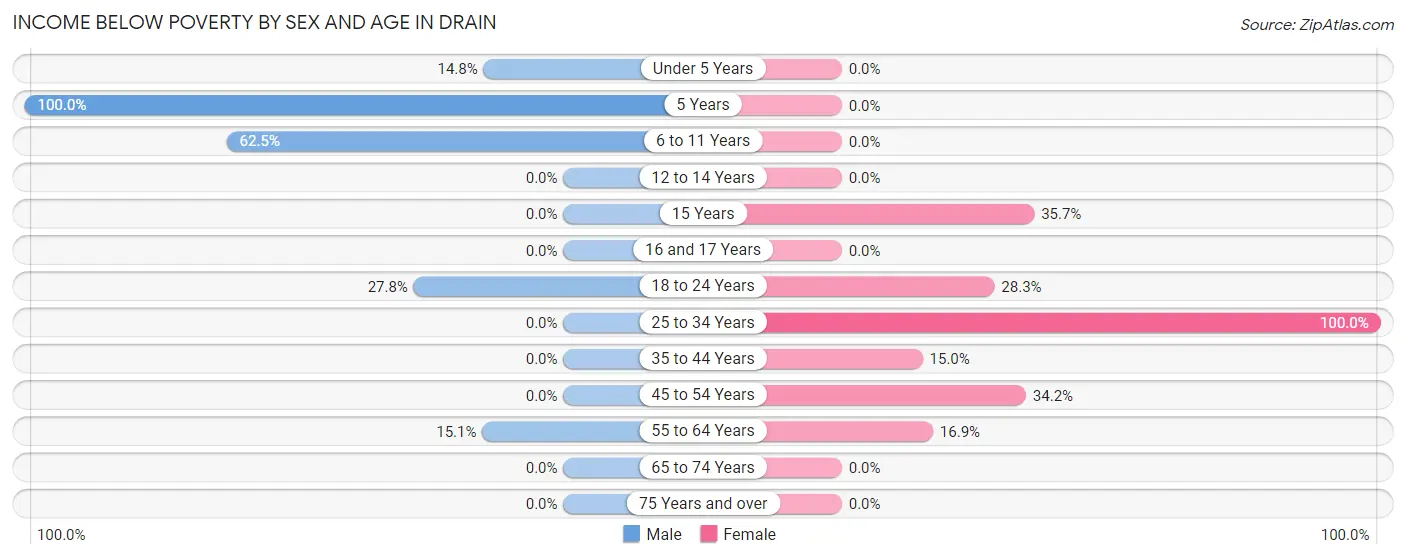
| Age Bracket | Male | Female |
| Under 5 Years | 8 (14.8%) | 0 (0.0%) |
| 5 Years | 18 (100.0%) | 0 (0.0%) |
| 6 to 11 Years | 25 (62.5%) | 0 (0.0%) |
| 12 to 14 Years | 0 (0.0%) | 0 (0.0%) |
| 15 Years | 0 (0.0%) | 5 (35.7%) |
| 16 and 17 Years | 0 (0.0%) | 0 (0.0%) |
| 18 to 24 Years | 5 (27.8%) | 17 (28.3%) |
| 25 to 34 Years | 0 (0.0%) | 48 (100.0%) |
| 35 to 44 Years | 0 (0.0%) | 6 (15.0%) |
| 45 to 54 Years | 0 (0.0%) | 41 (34.2%) |
| 55 to 64 Years | 14 (15.0%) | 23 (16.9%) |
| 65 to 74 Years | 0 (0.0%) | 0 (0.0%) |
| 75 Years and over | 0 (0.0%) | 0 (0.0%) |
| Total | 70 (14.1%) | 140 (25.3%) |
Income Above Poverty by Sex and Age in Drain
According to the poverty statistics in Drain, males aged 25 to 34 years and females aged under 5 years are the age groups that are most secure financially, with 100.0% of males and 100.0% of females in these age groups living above the poverty line.
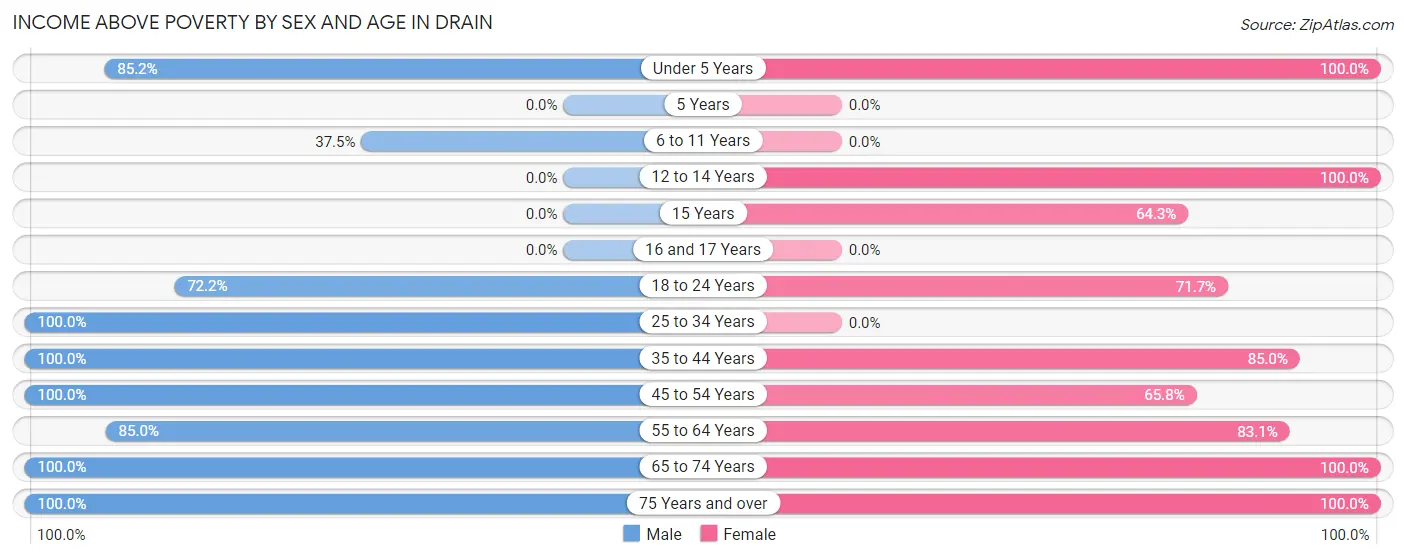
| Age Bracket | Male | Female |
| Under 5 Years | 46 (85.2%) | 4 (100.0%) |
| 5 Years | 0 (0.0%) | 0 (0.0%) |
| 6 to 11 Years | 15 (37.5%) | 0 (0.0%) |
| 12 to 14 Years | 0 (0.0%) | 17 (100.0%) |
| 15 Years | 0 (0.0%) | 9 (64.3%) |
| 16 and 17 Years | 0 (0.0%) | 0 (0.0%) |
| 18 to 24 Years | 13 (72.2%) | 43 (71.7%) |
| 25 to 34 Years | 77 (100.0%) | 0 (0.0%) |
| 35 to 44 Years | 24 (100.0%) | 34 (85.0%) |
| 45 to 54 Years | 76 (100.0%) | 79 (65.8%) |
| 55 to 64 Years | 79 (85.0%) | 113 (83.1%) |
| 65 to 74 Years | 43 (100.0%) | 79 (100.0%) |
| 75 Years and over | 52 (100.0%) | 36 (100.0%) |
| Total | 425 (85.9%) | 414 (74.7%) |
Income Below Poverty Among Married-Couple Families in Drain
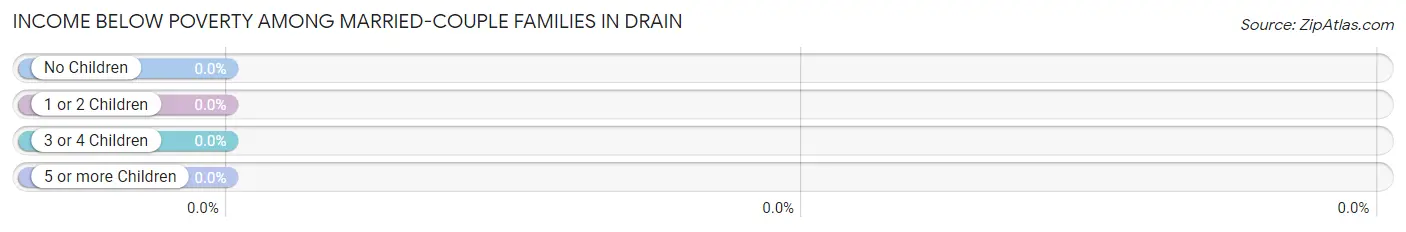
| Children | Above Poverty | Below Poverty |
| No Children | 194 (100.0%) | 0 (0.0%) |
| 1 or 2 Children | 28 (100.0%) | 0 (0.0%) |
| 3 or 4 Children | 3 (100.0%) | 0 (0.0%) |
| 5 or more Children | 0 (0.0%) | 0 (0.0%) |
| Total | 225 (100.0%) | 0 (0.0%) |
Income Below Poverty Among Single-Parent Households in Drain
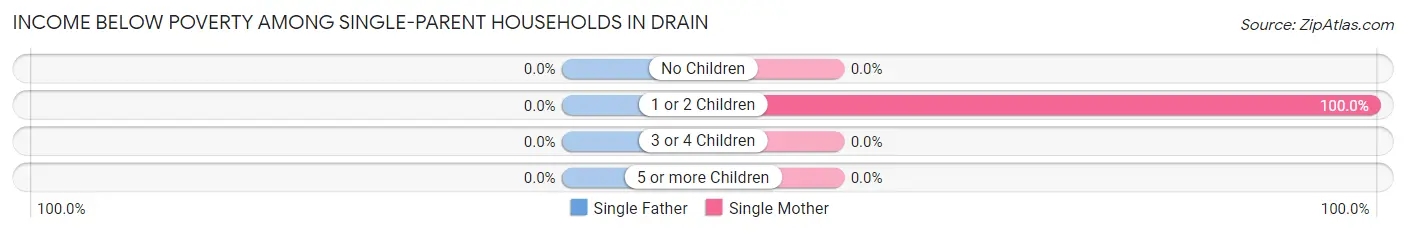
| Children | Single Father | Single Mother |
| No Children | 0 (0.0%) | 0 (0.0%) |
| 1 or 2 Children | 0 (0.0%) | 40 (100.0%) |
| 3 or 4 Children | 0 (0.0%) | 0 (0.0%) |
| 5 or more Children | 0 (0.0%) | 0 (0.0%) |
| Total | 0 (0.0%) | 40 (70.2%) |
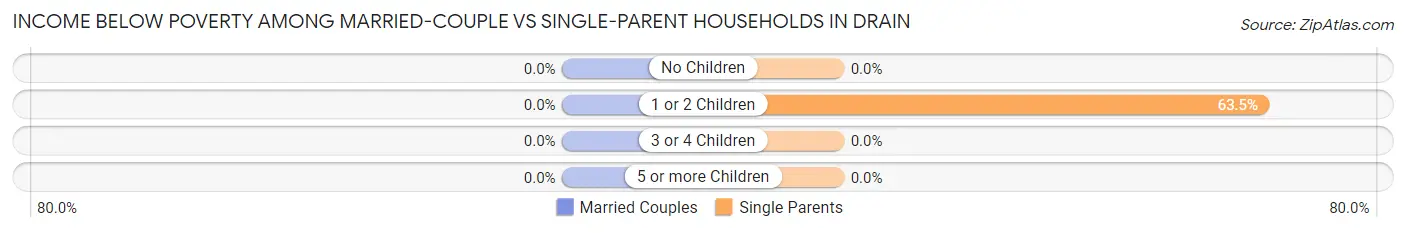
Income Below Poverty Among Married-Couple vs Single-Parent Households in Drain
| Children | Married-Couple Families | Single-Parent Households |
| No Children | 0 (0.0%) | 0 (0.0%) |
| 1 or 2 Children | 0 (0.0%) | 40 (63.5%) |
| 3 or 4 Children | 0 (0.0%) | 0 (0.0%) |
| 5 or more Children | 0 (0.0%) | 0 (0.0%) |
| Total | 0 (0.0%) | 40 (46.5%) |
Employment Characteristics in Drain
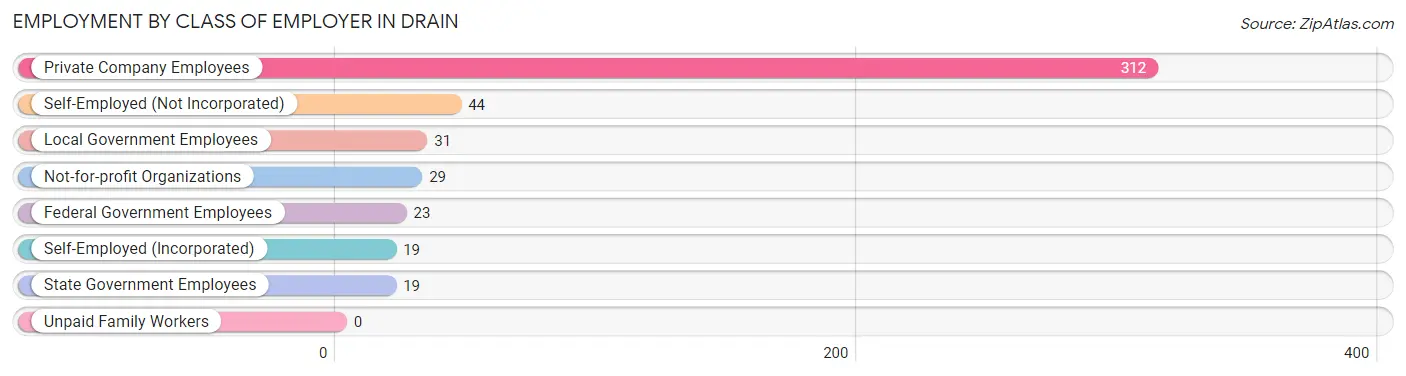
Employment by Class of Employer in Drain
Among the 477 employed individuals in Drain, private company employees (312 | 65.4%), self-employed (not incorporated) (44 | 9.2%), and local government employees (31 | 6.5%) make up the most common classes of employment.
| Employer Class | # Employees | % Employees |
| Private Company Employees | 312 | 65.4% |
| Self-Employed (Incorporated) | 19 | 4.0% |
| Self-Employed (Not Incorporated) | 44 | 9.2% |
| Not-for-profit Organizations | 29 | 6.1% |
| Local Government Employees | 31 | 6.5% |
| State Government Employees | 19 | 4.0% |
| Federal Government Employees | 23 | 4.8% |
| Unpaid Family Workers | 0 | 0.0% |
| Total | 477 | 100.0% |
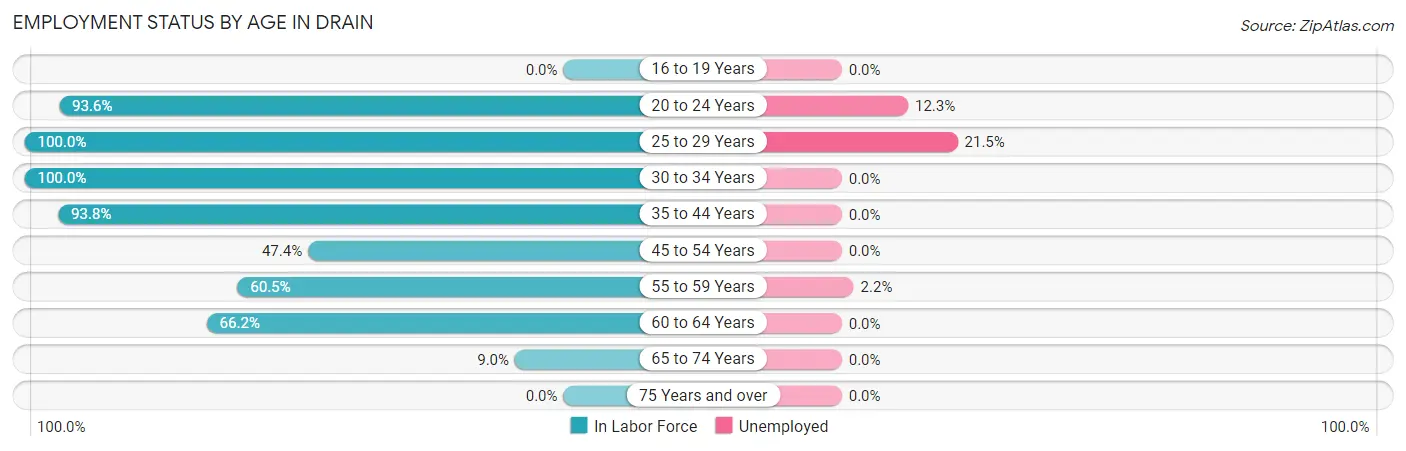
Employment Status by Age in Drain
According to the labor force statistics for Drain, out of the total population over 16 years of age (902), 56.0% or 505 individuals are in the labor force, with 5.5% or 28 of them unemployed. The age group with the highest labor force participation rate is 25 to 29 years, with 100.0% or 79 individuals in the labor force. Within the labor force, the 25 to 29 years age range has the highest percentage of unemployed individuals, with 21.5% or 17 of them being unemployed.
| Age Bracket | In Labor Force | Unemployed |
| 16 to 19 Years | 0 (0.0%) | 0 (0.0%) |
| 20 to 24 Years | 73 (93.6%) | 9 (12.3%) |
| 25 to 29 Years | 79 (100.0%) | 17 (21.5%) |
| 30 to 34 Years | 46 (100.0%) | 0 (0.0%) |
| 35 to 44 Years | 60 (93.8%) | 0 (0.0%) |
| 45 to 54 Years | 93 (47.4%) | 0 (0.0%) |
| 55 to 59 Years | 92 (60.5%) | 2 (2.2%) |
| 60 to 64 Years | 51 (66.2%) | 0 (0.0%) |
| 65 to 74 Years | 11 (9.0%) | 0 (0.0%) |
| 75 Years and over | 0 (0.0%) | 0 (0.0%) |
| Total | 505 (56.0%) | 28 (5.5%) |
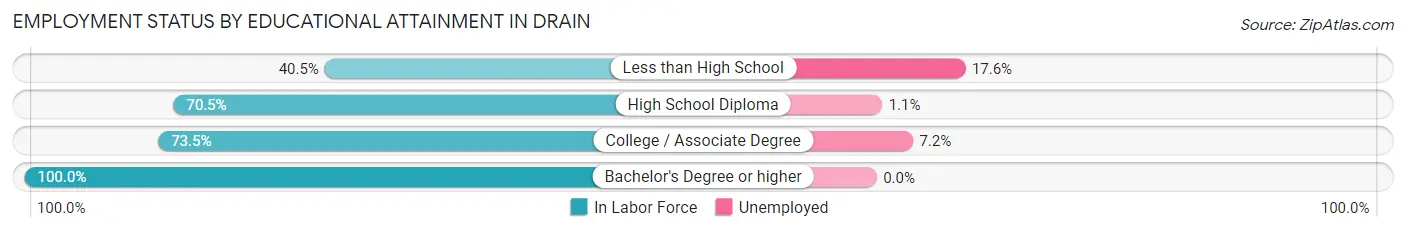
Employment Status by Educational Attainment in Drain
According to labor force statistics for Drain, 68.6% of individuals (421) out of the total population between 25 and 64 years of age (614) are in the labor force, with 4.5% or 19 of them being unemployed. The group with the highest labor force participation rate are those with the educational attainment of bachelor's degree or higher, with 100.0% or 73 individuals in the labor force. Within the labor force, individuals with less than high school education have the highest percentage of unemployment, with 17.6% or 9 of them being unemployed.
| Educational Attainment | In Labor Force | Unemployed |
| Less than High School | 51 (40.5%) | 22 (17.6%) |
| High School Diploma | 186 (70.5%) | 3 (1.1%) |
| College / Associate Degree | 111 (73.5%) | 11 (7.2%) |
| Bachelor's Degree or higher | 73 (100.0%) | 0 (0.0%) |
| Total | 421 (68.6%) | 28 (4.5%) |
Employment Occupations by Sex in Drain
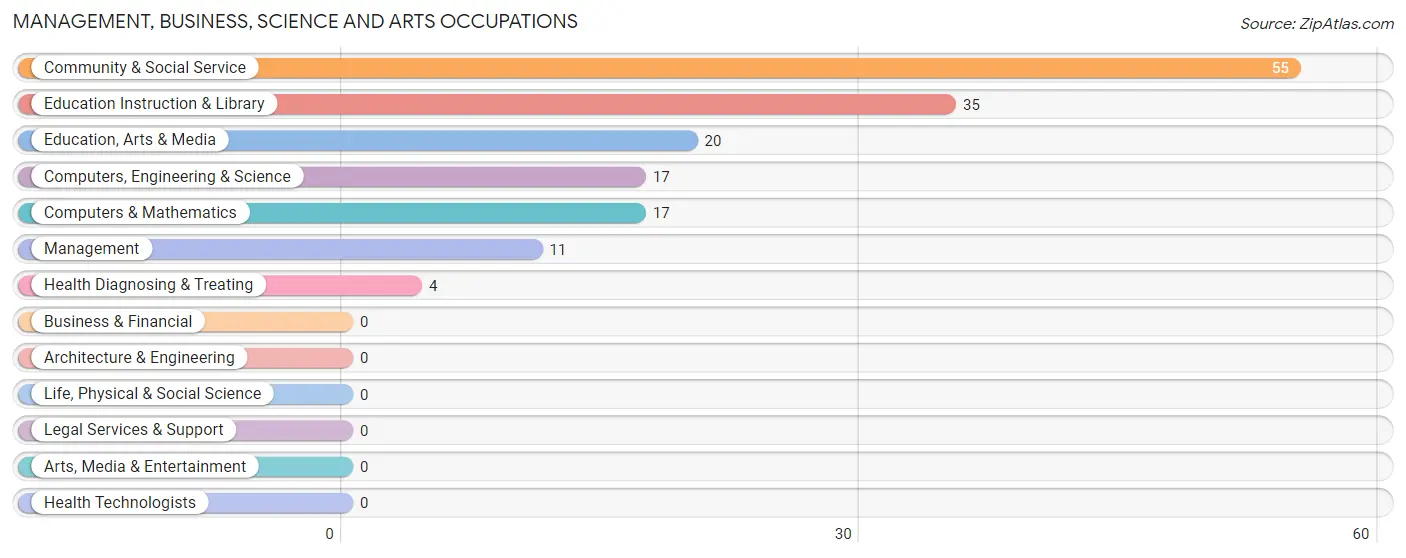
Management, Business, Science and Arts Occupations
The most common Management, Business, Science and Arts occupations in Drain are Community & Social Service (55 | 11.5%), Education Instruction & Library (35 | 7.3%), Education, Arts & Media (20 | 4.2%), Computers, Engineering & Science (17 | 3.6%), and Computers & Mathematics (17 | 3.6%).
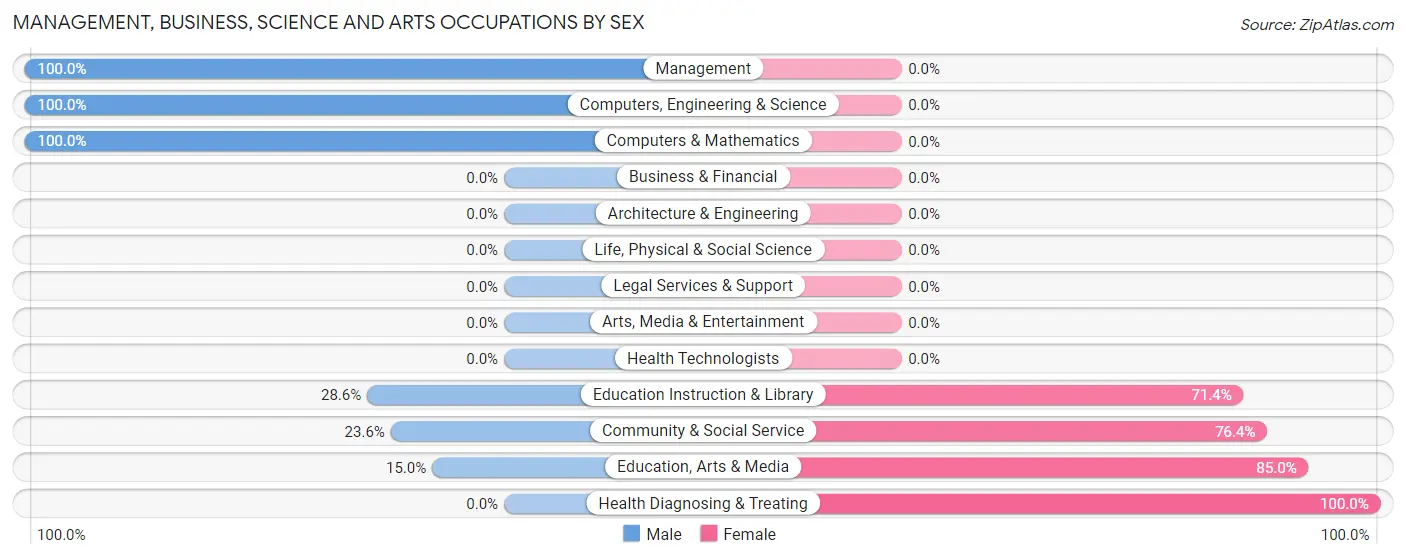
Management, Business, Science and Arts Occupations by Sex
Within the Management, Business, Science and Arts occupations in Drain, the most male-oriented occupations are Management (100.0%), Computers, Engineering & Science (100.0%), and Computers & Mathematics (100.0%), while the most female-oriented occupations are Health Diagnosing & Treating (100.0%), Education, Arts & Media (85.0%), and Community & Social Service (76.4%).
| Occupation | Male | Female |
| Management | 11 (100.0%) | 0 (0.0%) |
| Business & Financial | 0 (0.0%) | 0 (0.0%) |
| Computers, Engineering & Science | 17 (100.0%) | 0 (0.0%) |
| Computers & Mathematics | 17 (100.0%) | 0 (0.0%) |
| Architecture & Engineering | 0 (0.0%) | 0 (0.0%) |
| Life, Physical & Social Science | 0 (0.0%) | 0 (0.0%) |
| Community & Social Service | 13 (23.6%) | 42 (76.4%) |
| Education, Arts & Media | 3 (15.0%) | 17 (85.0%) |
| Legal Services & Support | 0 (0.0%) | 0 (0.0%) |
| Education Instruction & Library | 10 (28.6%) | 25 (71.4%) |
| Arts, Media & Entertainment | 0 (0.0%) | 0 (0.0%) |
| Health Diagnosing & Treating | 0 (0.0%) | 4 (100.0%) |
| Health Technologists | 0 (0.0%) | 0 (0.0%) |
| Total (Category) | 41 (47.1%) | 46 (52.9%) |
| Total (Overall) | 236 (49.5%) | 241 (50.5%) |
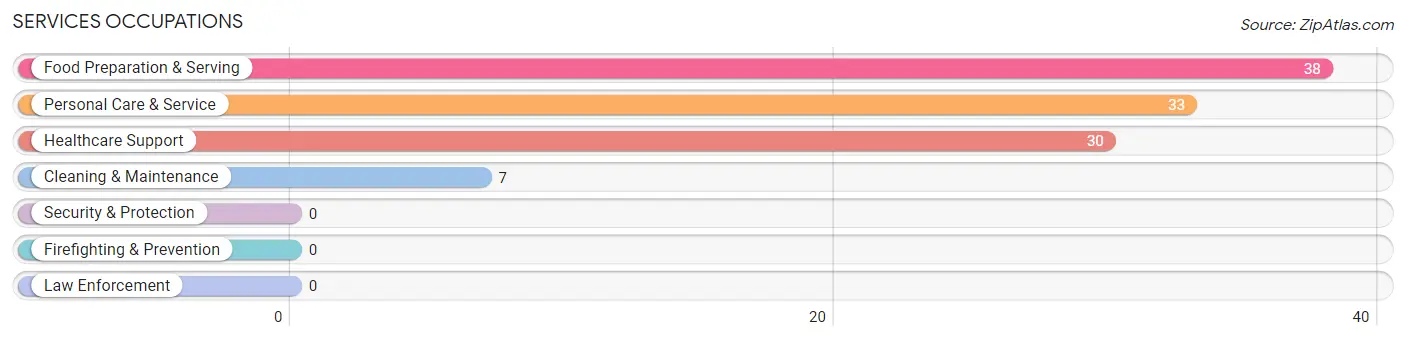
Services Occupations
The most common Services occupations in Drain are Food Preparation & Serving (38 | 8.0%), Personal Care & Service (33 | 6.9%), Healthcare Support (30 | 6.3%), and Cleaning & Maintenance (7 | 1.5%).
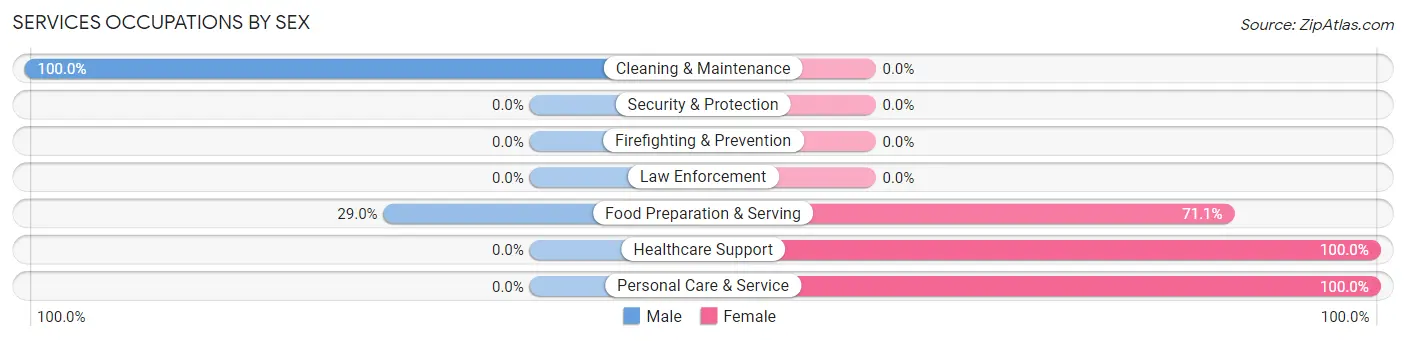
Services Occupations by Sex
Within the Services occupations in Drain, the most male-oriented occupations are Cleaning & Maintenance (100.0%), and Food Preparation & Serving (28.9%), while the most female-oriented occupations are Healthcare Support (100.0%), Personal Care & Service (100.0%), and Food Preparation & Serving (71.1%).
| Occupation | Male | Female |
| Healthcare Support | 0 (0.0%) | 30 (100.0%) |
| Security & Protection | 0 (0.0%) | 0 (0.0%) |
| Firefighting & Prevention | 0 (0.0%) | 0 (0.0%) |
| Law Enforcement | 0 (0.0%) | 0 (0.0%) |
| Food Preparation & Serving | 11 (28.9%) | 27 (71.1%) |
| Cleaning & Maintenance | 7 (100.0%) | 0 (0.0%) |
| Personal Care & Service | 0 (0.0%) | 33 (100.0%) |
| Total (Category) | 18 (16.7%) | 90 (83.3%) |
| Total (Overall) | 236 (49.5%) | 241 (50.5%) |
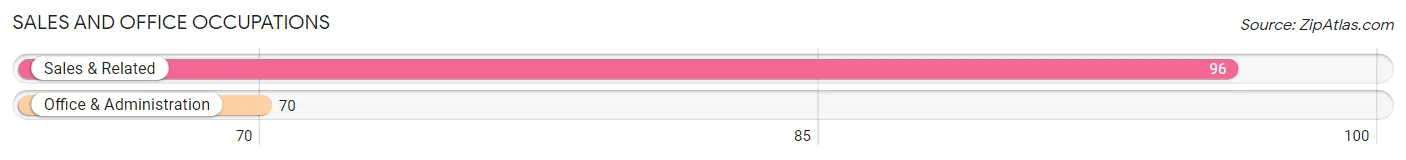
Sales and Office Occupations
The most common Sales and Office occupations in Drain are Sales & Related (96 | 20.1%), and Office & Administration (70 | 14.7%).
Sales and Office Occupations by Sex
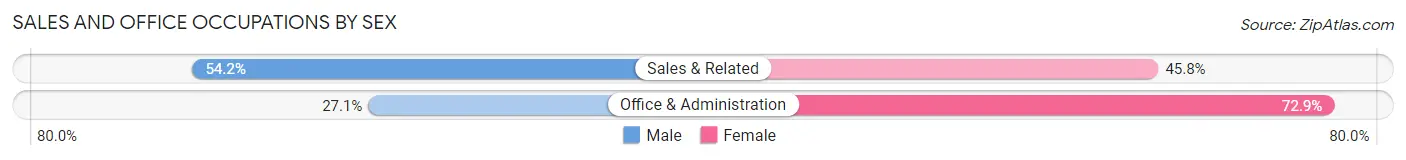
| Occupation | Male | Female |
| Sales & Related | 52 (54.2%) | 44 (45.8%) |
| Office & Administration | 19 (27.1%) | 51 (72.9%) |
| Total (Category) | 71 (42.8%) | 95 (57.2%) |
| Total (Overall) | 236 (49.5%) | 241 (50.5%) |
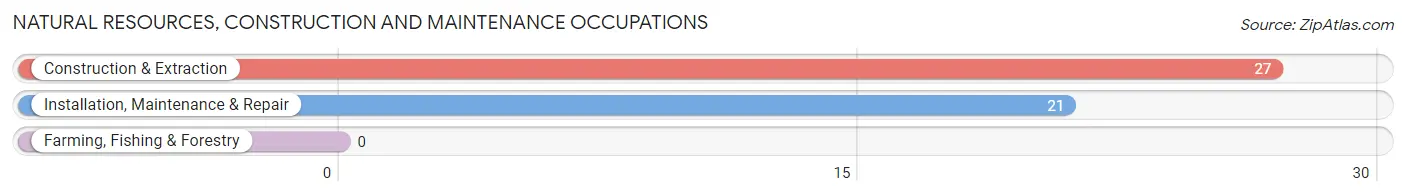
Natural Resources, Construction and Maintenance Occupations
The most common Natural Resources, Construction and Maintenance occupations in Drain are Construction & Extraction (27 | 5.7%), and Installation, Maintenance & Repair (21 | 4.4%).
Natural Resources, Construction and Maintenance Occupations by Sex
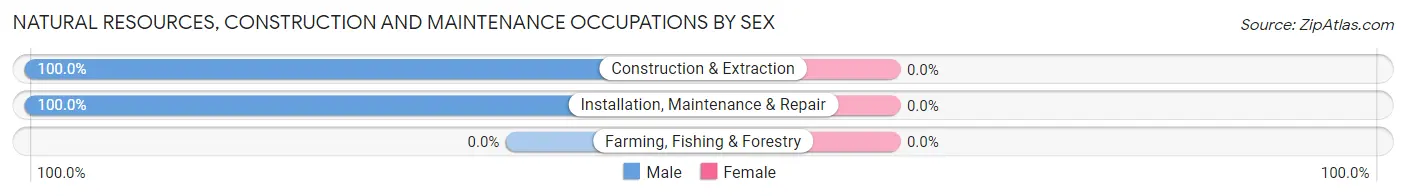
| Occupation | Male | Female |
| Farming, Fishing & Forestry | 0 (0.0%) | 0 (0.0%) |
| Construction & Extraction | 27 (100.0%) | 0 (0.0%) |
| Installation, Maintenance & Repair | 21 (100.0%) | 0 (0.0%) |
| Total (Category) | 48 (100.0%) | 0 (0.0%) |
| Total (Overall) | 236 (49.5%) | 241 (50.5%) |
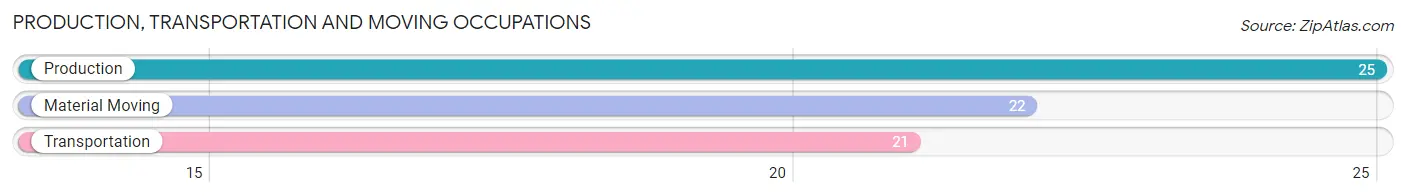
Production, Transportation and Moving Occupations
The most common Production, Transportation and Moving occupations in Drain are Production (25 | 5.2%), Material Moving (22 | 4.6%), and Transportation (21 | 4.4%).
Production, Transportation and Moving Occupations by Sex
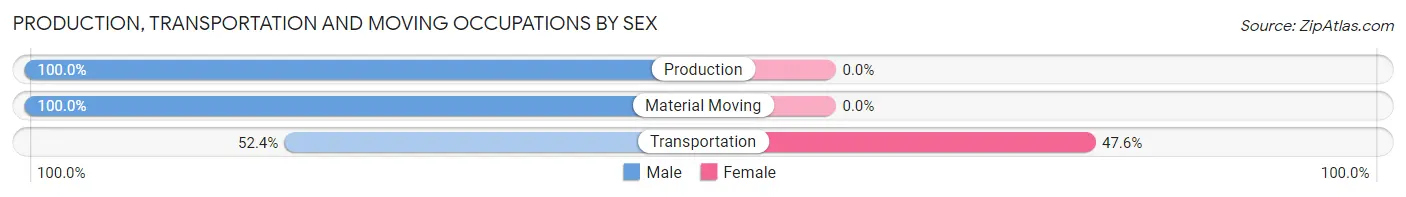
| Occupation | Male | Female |
| Production | 25 (100.0%) | 0 (0.0%) |
| Transportation | 11 (52.4%) | 10 (47.6%) |
| Material Moving | 22 (100.0%) | 0 (0.0%) |
| Total (Category) | 58 (85.3%) | 10 (14.7%) |
| Total (Overall) | 236 (49.5%) | 241 (50.5%) |
Employment Industries by Sex in Drain
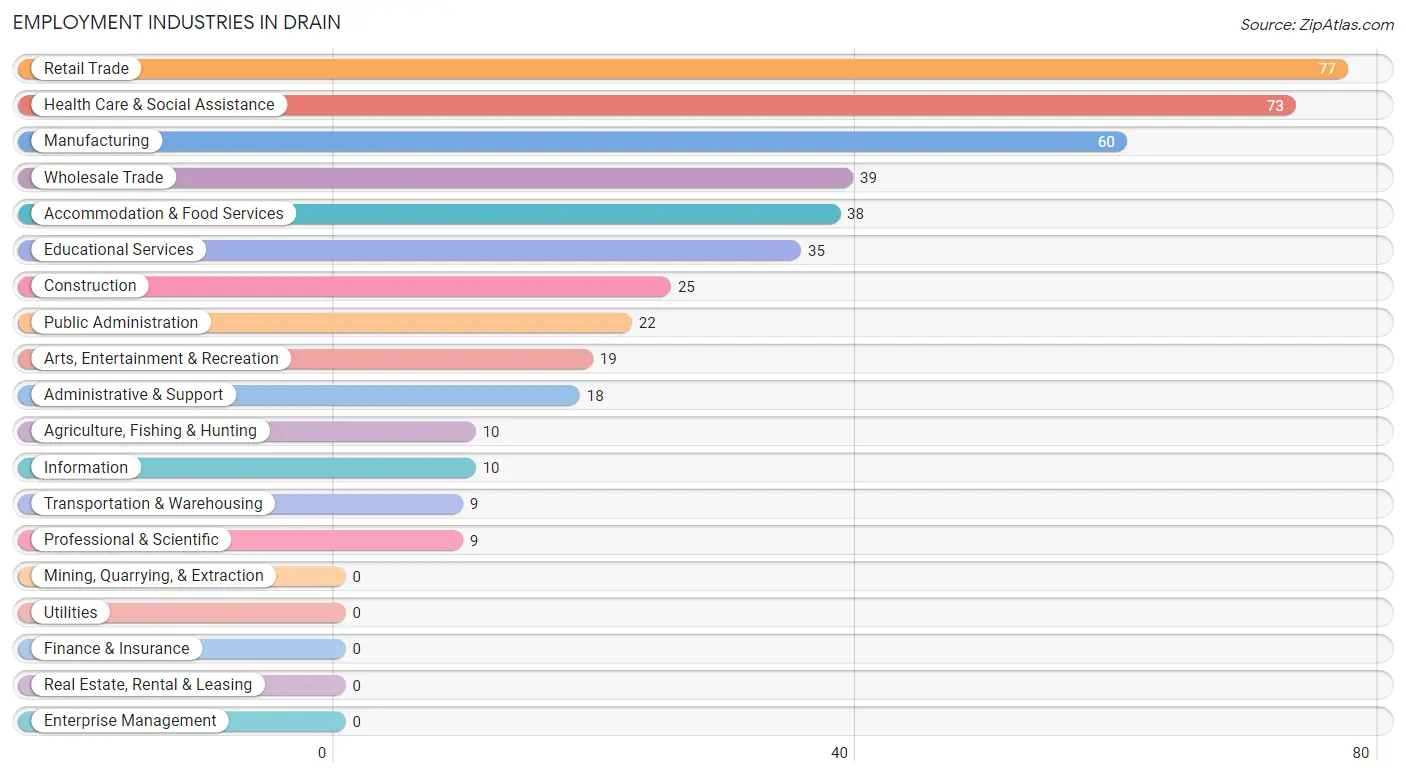
Employment Industries in Drain
The major employment industries in Drain include Retail Trade (77 | 16.1%), Health Care & Social Assistance (73 | 15.3%), Manufacturing (60 | 12.6%), Wholesale Trade (39 | 8.2%), and Accommodation & Food Services (38 | 8.0%).
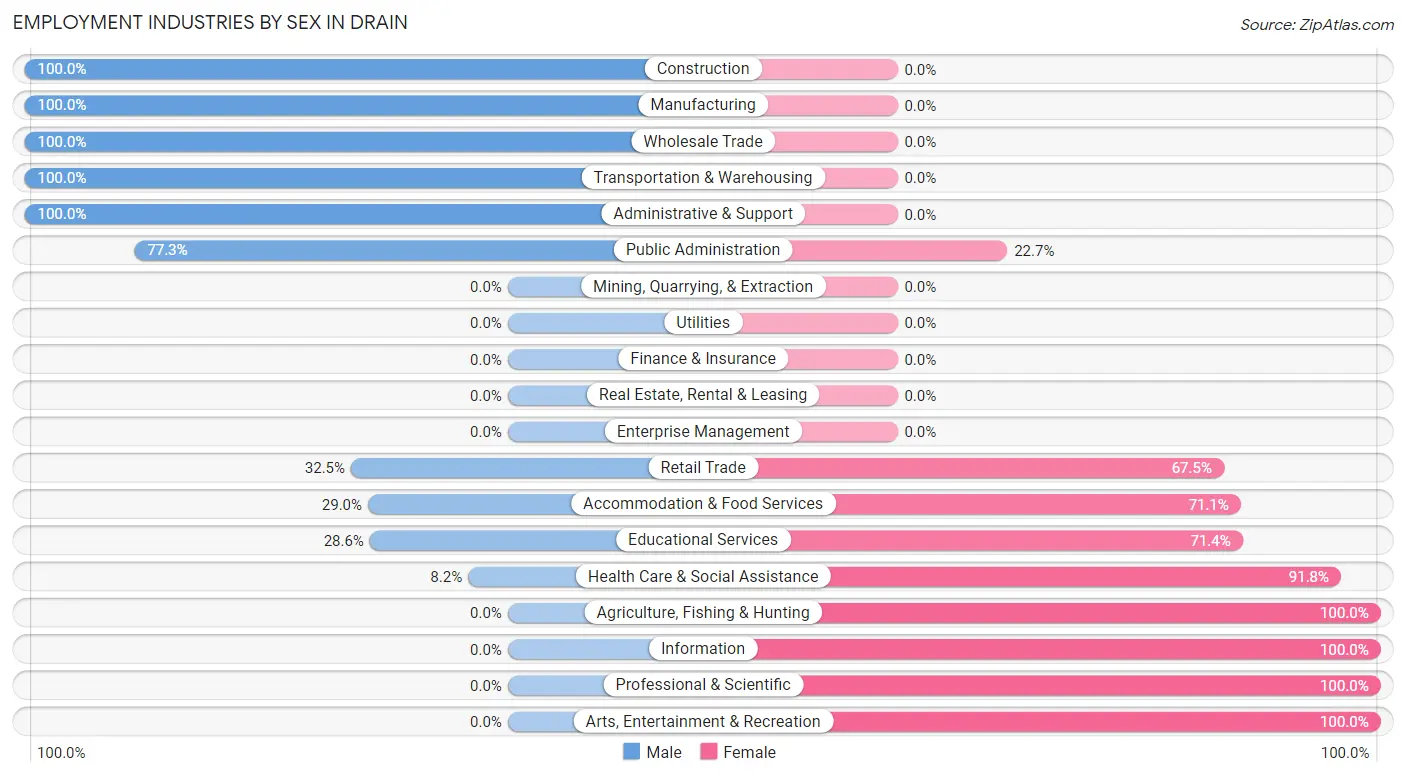
Employment Industries by Sex in Drain
The Drain industries that see more men than women are Construction (100.0%), Manufacturing (100.0%), and Wholesale Trade (100.0%), whereas the industries that tend to have a higher number of women are Agriculture, Fishing & Hunting (100.0%), Information (100.0%), and Professional & Scientific (100.0%).
| Industry | Male | Female |
| Agriculture, Fishing & Hunting | 0 (0.0%) | 10 (100.0%) |
| Mining, Quarrying, & Extraction | 0 (0.0%) | 0 (0.0%) |
| Construction | 25 (100.0%) | 0 (0.0%) |
| Manufacturing | 60 (100.0%) | 0 (0.0%) |
| Wholesale Trade | 39 (100.0%) | 0 (0.0%) |
| Retail Trade | 25 (32.5%) | 52 (67.5%) |
| Transportation & Warehousing | 9 (100.0%) | 0 (0.0%) |
| Utilities | 0 (0.0%) | 0 (0.0%) |
| Information | 0 (0.0%) | 10 (100.0%) |
| Finance & Insurance | 0 (0.0%) | 0 (0.0%) |
| Real Estate, Rental & Leasing | 0 (0.0%) | 0 (0.0%) |
| Professional & Scientific | 0 (0.0%) | 9 (100.0%) |
| Enterprise Management | 0 (0.0%) | 0 (0.0%) |
| Administrative & Support | 18 (100.0%) | 0 (0.0%) |
| Educational Services | 10 (28.6%) | 25 (71.4%) |
| Health Care & Social Assistance | 6 (8.2%) | 67 (91.8%) |
| Arts, Entertainment & Recreation | 0 (0.0%) | 19 (100.0%) |
| Accommodation & Food Services | 11 (28.9%) | 27 (71.1%) |
| Public Administration | 17 (77.3%) | 5 (22.7%) |
| Total | 236 (49.5%) | 241 (50.5%) |
Education in Drain
School Enrollment in Drain
The most common levels of schooling among the 104 students in Drain are elementary school (37 | 35.6%), middle school (23 | 22.1%), and nursery / preschool (18 | 17.3%).
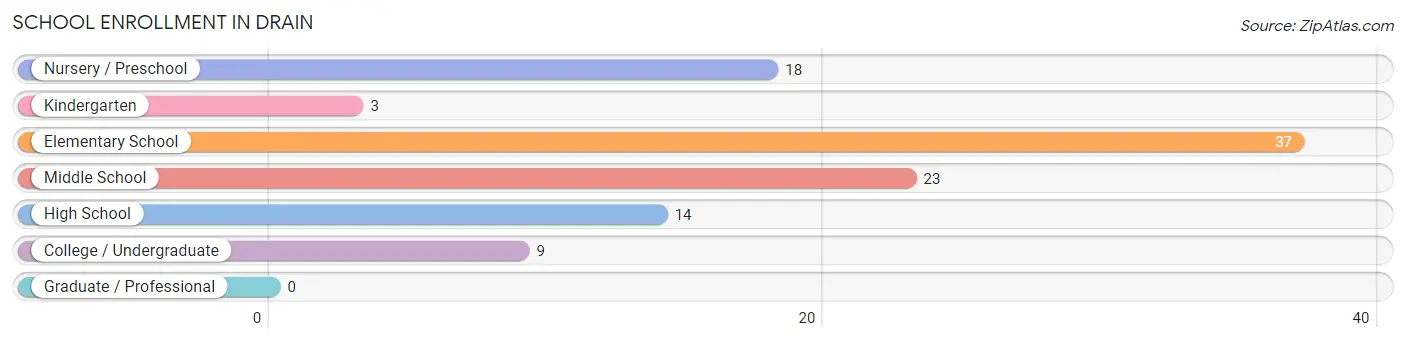
| School Level | # Students | % Students |
| Nursery / Preschool | 18 | 17.3% |
| Kindergarten | 3 | 2.9% |
| Elementary School | 37 | 35.6% |
| Middle School | 23 | 22.1% |
| High School | 14 | 13.5% |
| College / Undergraduate | 9 | 8.6% |
| Graduate / Professional | 0 | 0.0% |
| Total | 104 | 100.0% |
School Enrollment by Age by Funding Source in Drain
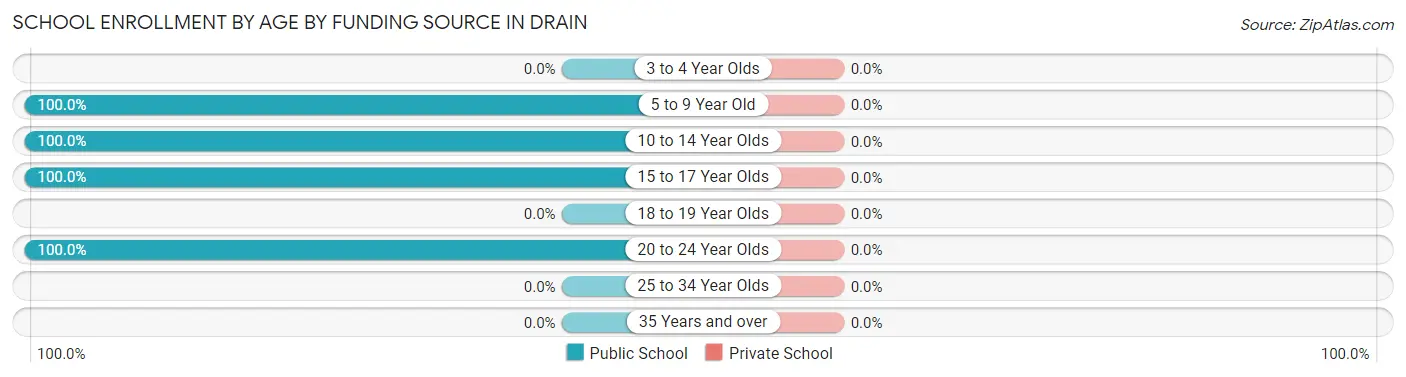
| Age Bracket | Public School | Private School |
| 3 to 4 Year Olds | 0 (0.0%) | 0 (0.0%) |
| 5 to 9 Year Old | 46 (100.0%) | 0 (0.0%) |
| 10 to 14 Year Olds | 35 (100.0%) | 0 (0.0%) |
| 15 to 17 Year Olds | 14 (100.0%) | 0 (0.0%) |
| 18 to 19 Year Olds | 0 (0.0%) | 0 (0.0%) |
| 20 to 24 Year Olds | 9 (100.0%) | 0 (0.0%) |
| 25 to 34 Year Olds | 0 (0.0%) | 0 (0.0%) |
| 35 Years and over | 0 (0.0%) | 0 (0.0%) |
| Total | 104 (100.0%) | 0 (0.0%) |
Educational Attainment by Field of Study in Drain
Business (29 | 24.0%), liberal arts & history (26 | 21.5%), education (20 | 16.5%), arts & humanities (19 | 15.7%), and psychology (17 | 14.1%) are the most common fields of study among 121 individuals in Drain who have obtained a bachelor's degree or higher.
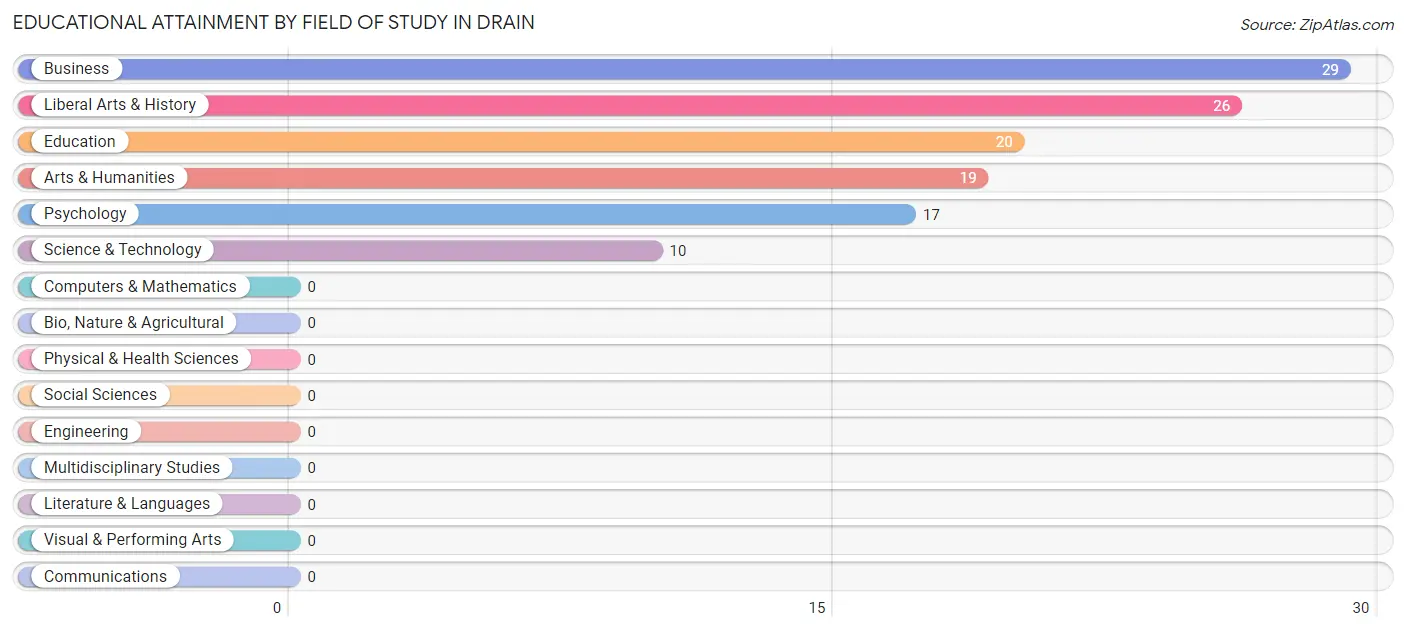
| Field of Study | # Graduates | % Graduates |
| Computers & Mathematics | 0 | 0.0% |
| Bio, Nature & Agricultural | 0 | 0.0% |
| Physical & Health Sciences | 0 | 0.0% |
| Psychology | 17 | 14.1% |
| Social Sciences | 0 | 0.0% |
| Engineering | 0 | 0.0% |
| Multidisciplinary Studies | 0 | 0.0% |
| Science & Technology | 10 | 8.3% |
| Business | 29 | 24.0% |
| Education | 20 | 16.5% |
| Literature & Languages | 0 | 0.0% |
| Liberal Arts & History | 26 | 21.5% |
| Visual & Performing Arts | 0 | 0.0% |
| Communications | 0 | 0.0% |
| Arts & Humanities | 19 | 15.7% |
| Total | 121 | 100.0% |
Transportation & Commute in Drain
Vehicle Availability by Sex in Drain
The most prevalent vehicle ownership categories in Drain are males with 2 vehicles (109, accounting for 46.2%) and females with 2 vehicles (92, making up 45.2%).
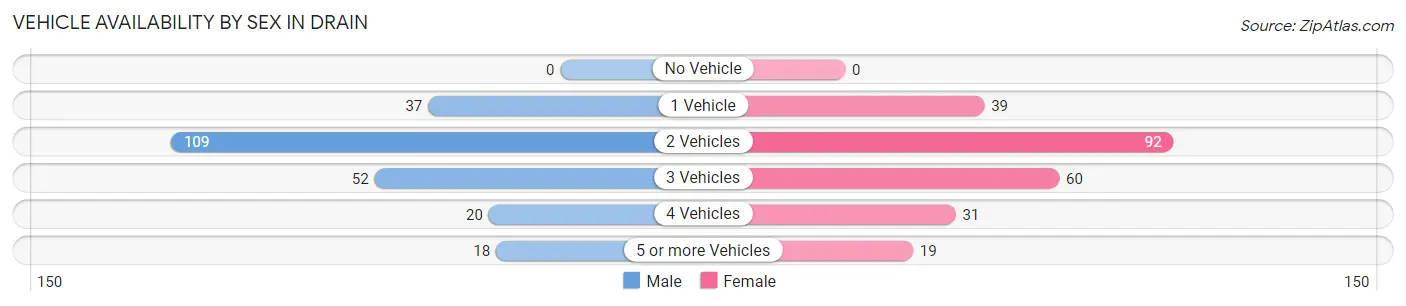
| Vehicles Available | Male | Female |
| No Vehicle | 0 (0.0%) | 0 (0.0%) |
| 1 Vehicle | 37 (15.7%) | 39 (16.2%) |
| 2 Vehicles | 109 (46.2%) | 92 (38.2%) |
| 3 Vehicles | 52 (22.0%) | 60 (24.9%) |
| 4 Vehicles | 20 (8.5%) | 31 (12.9%) |
| 5 or more Vehicles | 18 (7.6%) | 19 (7.9%) |
| Total | 236 (100.0%) | 241 (100.0%) |
Commute Time in Drain
The most frequently occuring commute durations in Drain are 45 to 59 minutes (102 commuters, 21.4%), 30 to 34 minutes (84 commuters, 17.6%), and 20 to 24 minutes (58 commuters, 12.2%).
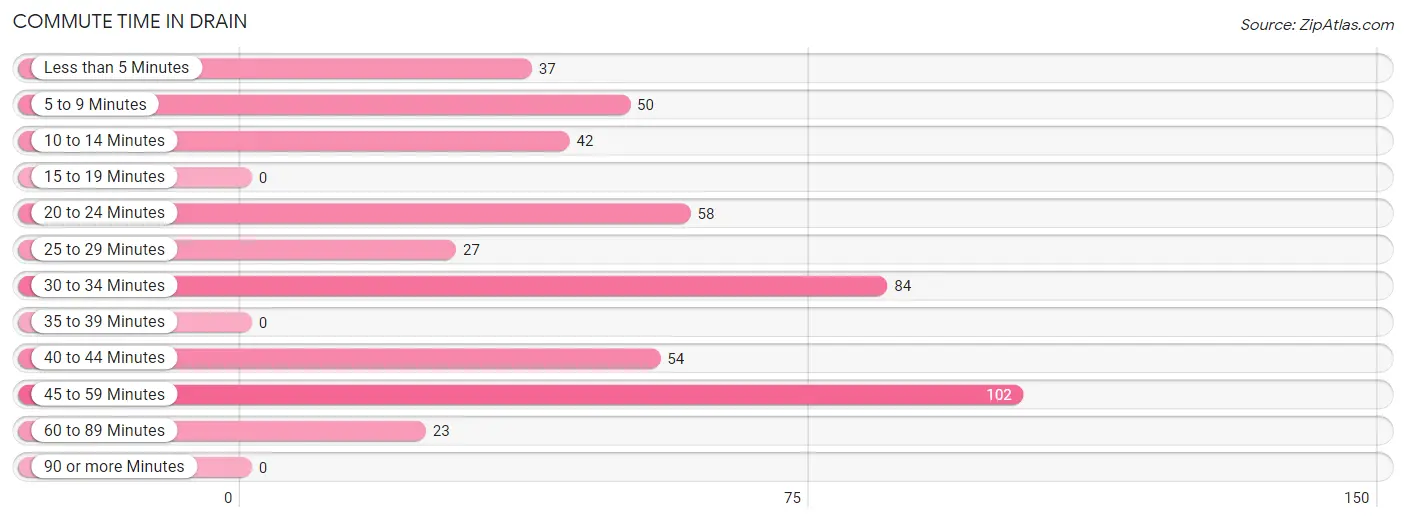
| Commute Time | # Commuters | % Commuters |
| Less than 5 Minutes | 37 | 7.8% |
| 5 to 9 Minutes | 50 | 10.5% |
| 10 to 14 Minutes | 42 | 8.8% |
| 15 to 19 Minutes | 0 | 0.0% |
| 20 to 24 Minutes | 58 | 12.2% |
| 25 to 29 Minutes | 27 | 5.7% |
| 30 to 34 Minutes | 84 | 17.6% |
| 35 to 39 Minutes | 0 | 0.0% |
| 40 to 44 Minutes | 54 | 11.3% |
| 45 to 59 Minutes | 102 | 21.4% |
| 60 to 89 Minutes | 23 | 4.8% |
| 90 or more Minutes | 0 | 0.0% |
Commute Time by Sex in Drain
The most common commute times in Drain are 45 to 59 minutes (66 commuters, 28.0%) for males and 30 to 34 minutes (45 commuters, 18.7%) for females.
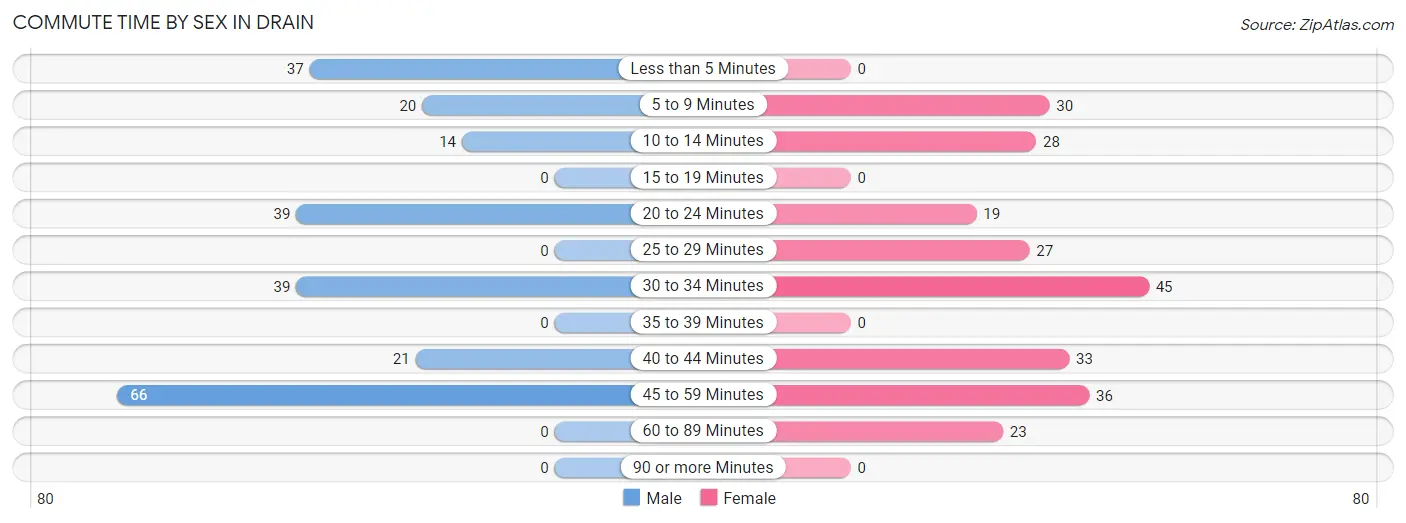
| Commute Time | Male | Female |
| Less than 5 Minutes | 37 (15.7%) | 0 (0.0%) |
| 5 to 9 Minutes | 20 (8.5%) | 30 (12.4%) |
| 10 to 14 Minutes | 14 (5.9%) | 28 (11.6%) |
| 15 to 19 Minutes | 0 (0.0%) | 0 (0.0%) |
| 20 to 24 Minutes | 39 (16.5%) | 19 (7.9%) |
| 25 to 29 Minutes | 0 (0.0%) | 27 (11.2%) |
| 30 to 34 Minutes | 39 (16.5%) | 45 (18.7%) |
| 35 to 39 Minutes | 0 (0.0%) | 0 (0.0%) |
| 40 to 44 Minutes | 21 (8.9%) | 33 (13.7%) |
| 45 to 59 Minutes | 66 (28.0%) | 36 (14.9%) |
| 60 to 89 Minutes | 0 (0.0%) | 23 (9.5%) |
| 90 or more Minutes | 0 (0.0%) | 0 (0.0%) |
Time of Departure to Work by Sex in Drain
The most frequent times of departure to work in Drain are 12:00 AM to 4:59 AM (57, 24.1%) for males and 7:00 AM to 7:29 AM (67, 27.8%) for females.
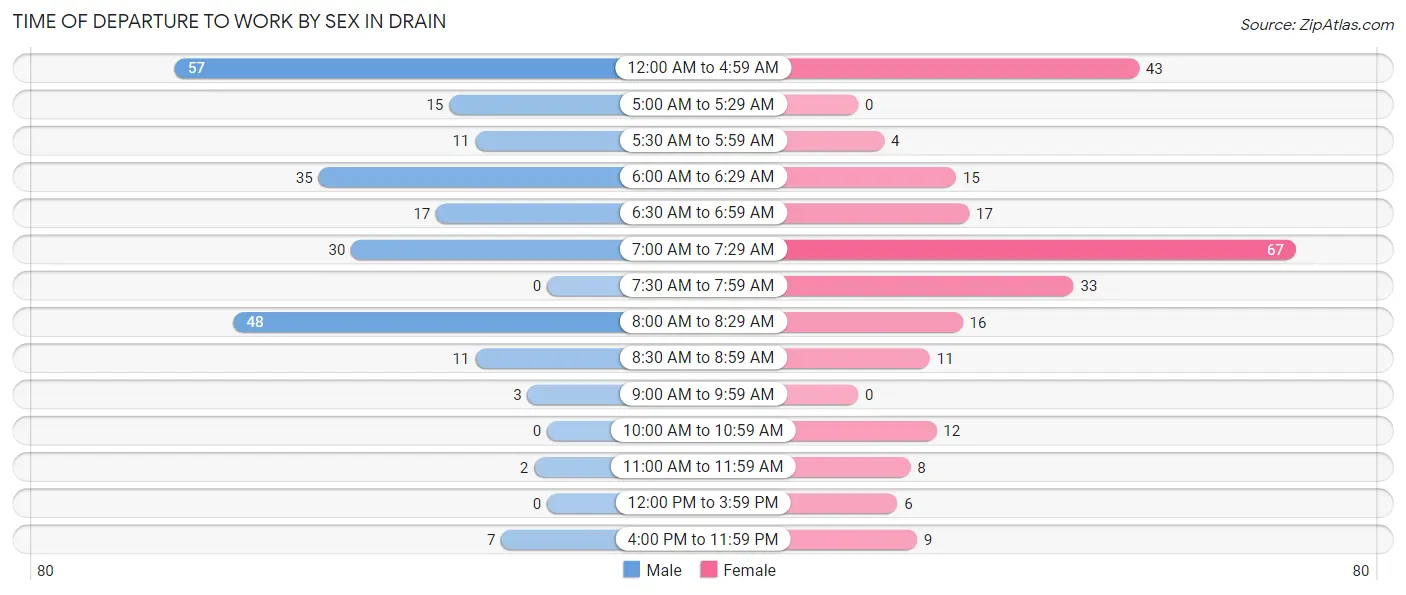
| Time of Departure | Male | Female |
| 12:00 AM to 4:59 AM | 57 (24.1%) | 43 (17.8%) |
| 5:00 AM to 5:29 AM | 15 (6.4%) | 0 (0.0%) |
| 5:30 AM to 5:59 AM | 11 (4.7%) | 4 (1.7%) |
| 6:00 AM to 6:29 AM | 35 (14.8%) | 15 (6.2%) |
| 6:30 AM to 6:59 AM | 17 (7.2%) | 17 (7.0%) |
| 7:00 AM to 7:29 AM | 30 (12.7%) | 67 (27.8%) |
| 7:30 AM to 7:59 AM | 0 (0.0%) | 33 (13.7%) |
| 8:00 AM to 8:29 AM | 48 (20.3%) | 16 (6.6%) |
| 8:30 AM to 8:59 AM | 11 (4.7%) | 11 (4.6%) |
| 9:00 AM to 9:59 AM | 3 (1.3%) | 0 (0.0%) |
| 10:00 AM to 10:59 AM | 0 (0.0%) | 12 (5.0%) |
| 11:00 AM to 11:59 AM | 2 (0.9%) | 8 (3.3%) |
| 12:00 PM to 3:59 PM | 0 (0.0%) | 6 (2.5%) |
| 4:00 PM to 11:59 PM | 7 (3.0%) | 9 (3.7%) |
| Total | 236 (100.0%) | 241 (100.0%) |
Housing Occupancy in Drain
Occupancy by Ownership in Drain
Of the total 456 dwellings in Drain, owner-occupied units account for 305 (66.9%), while renter-occupied units make up 151 (33.1%).
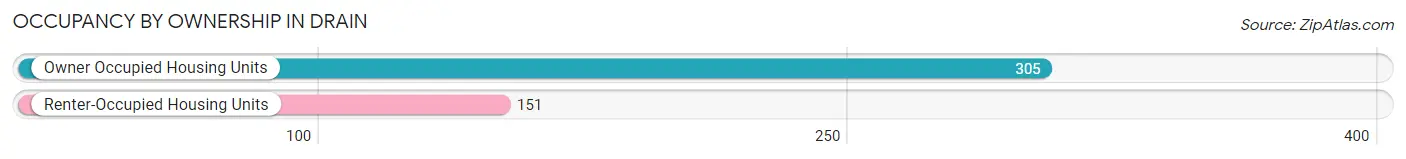
| Occupancy | # Housing Units | % Housing Units |
| Owner Occupied Housing Units | 305 | 66.9% |
| Renter-Occupied Housing Units | 151 | 33.1% |
| Total Occupied Housing Units | 456 | 100.0% |
Occupancy by Household Size in Drain
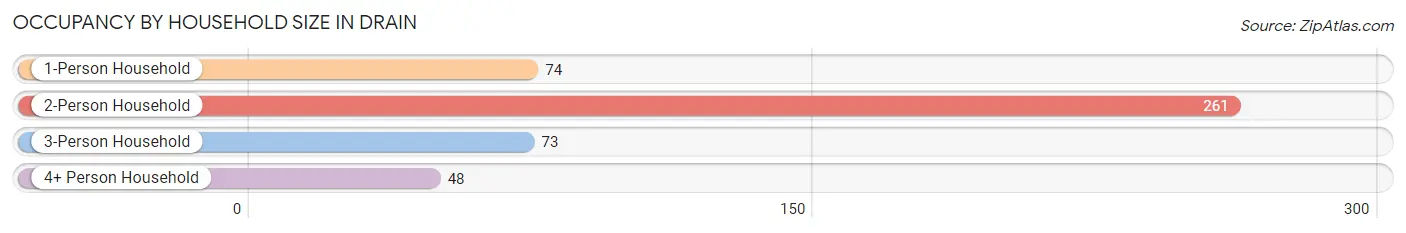
| Household Size | # Housing Units | % Housing Units |
| 1-Person Household | 74 | 16.2% |
| 2-Person Household | 261 | 57.2% |
| 3-Person Household | 73 | 16.0% |
| 4+ Person Household | 48 | 10.5% |
| Total Housing Units | 456 | 100.0% |
Occupancy by Ownership by Household Size in Drain
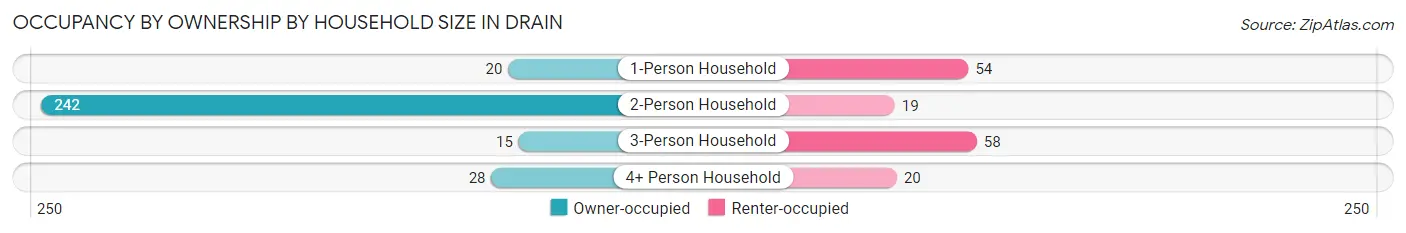
| Household Size | Owner-occupied | Renter-occupied |
| 1-Person Household | 20 (27.0%) | 54 (73.0%) |
| 2-Person Household | 242 (92.7%) | 19 (7.3%) |
| 3-Person Household | 15 (20.5%) | 58 (79.4%) |
| 4+ Person Household | 28 (58.3%) | 20 (41.7%) |
| Total Housing Units | 305 (66.9%) | 151 (33.1%) |
Occupancy by Educational Attainment in Drain
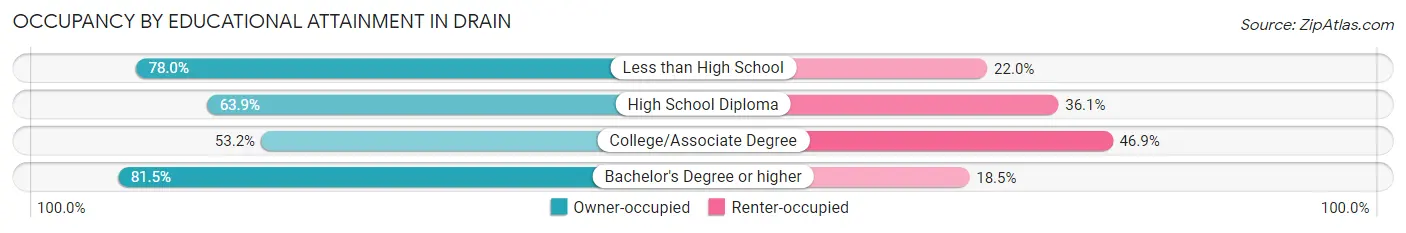
| Household Size | Owner-occupied | Renter-occupied |
| Less than High School | 78 (78.0%) | 22 (22.0%) |
| High School Diploma | 115 (63.9%) | 65 (36.1%) |
| College/Associate Degree | 59 (53.1%) | 52 (46.9%) |
| Bachelor's Degree or higher | 53 (81.5%) | 12 (18.5%) |
Occupancy by Age of Householder in Drain
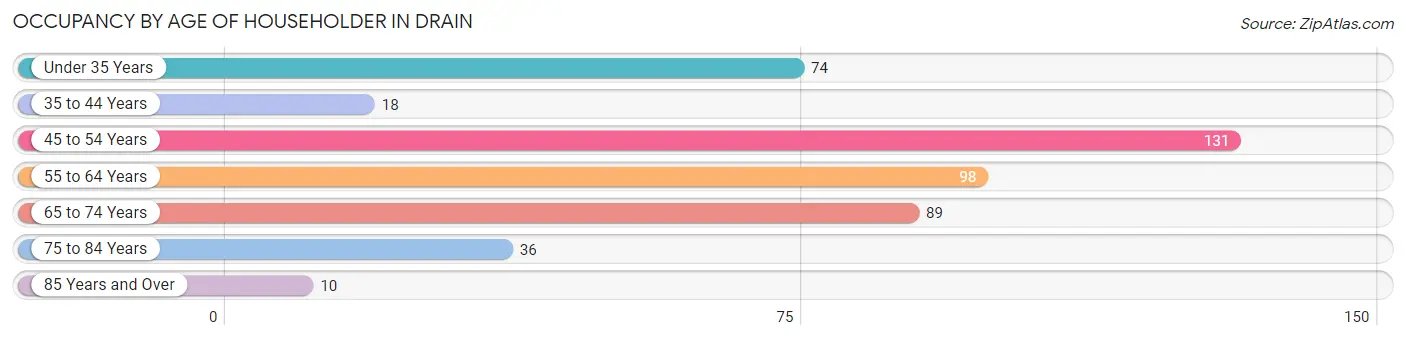
| Age Bracket | # Households | % Households |
| Under 35 Years | 74 | 16.2% |
| 35 to 44 Years | 18 | 4.0% |
| 45 to 54 Years | 131 | 28.7% |
| 55 to 64 Years | 98 | 21.5% |
| 65 to 74 Years | 89 | 19.5% |
| 75 to 84 Years | 36 | 7.9% |
| 85 Years and Over | 10 | 2.2% |
| Total | 456 | 100.0% |
Housing Finances in Drain
Median Income by Occupancy in Drain
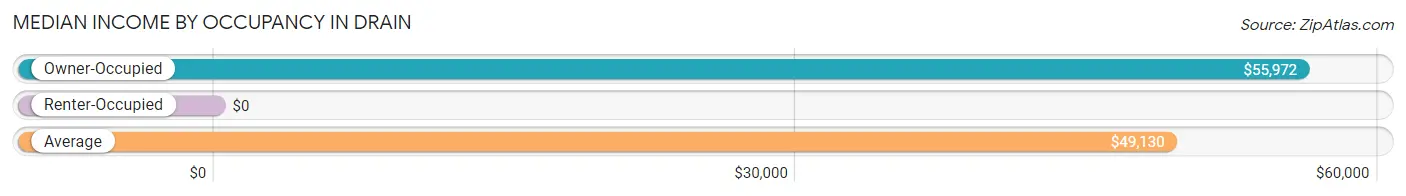
| Occupancy Type | # Households | Median Income |
| Owner-Occupied | 305 (66.9%) | $55,972 |
| Renter-Occupied | 151 (33.1%) | $0 |
| Average | 456 (100.0%) | $49,130 |
Occupancy by Householder Income Bracket in Drain
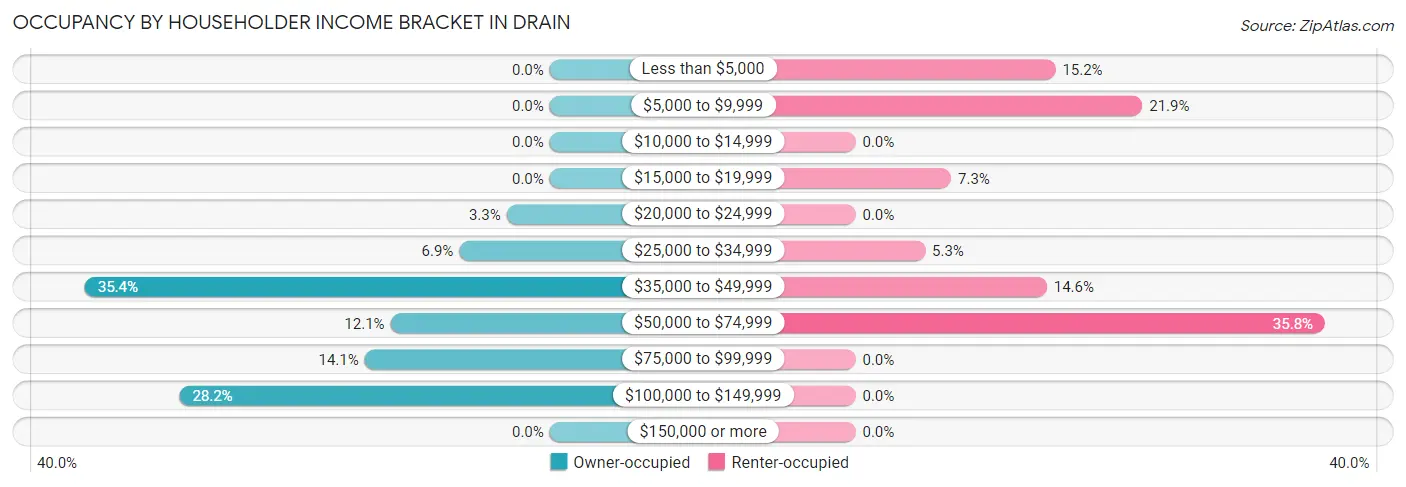
| Income Bracket | Owner-occupied | Renter-occupied |
| Less than $5,000 | 0 (0.0%) | 23 (15.2%) |
| $5,000 to $9,999 | 0 (0.0%) | 33 (21.8%) |
| $10,000 to $14,999 | 0 (0.0%) | 0 (0.0%) |
| $15,000 to $19,999 | 0 (0.0%) | 11 (7.3%) |
| $20,000 to $24,999 | 10 (3.3%) | 0 (0.0%) |
| $25,000 to $34,999 | 21 (6.9%) | 8 (5.3%) |
| $35,000 to $49,999 | 108 (35.4%) | 22 (14.6%) |
| $50,000 to $74,999 | 37 (12.1%) | 54 (35.8%) |
| $75,000 to $99,999 | 43 (14.1%) | 0 (0.0%) |
| $100,000 to $149,999 | 86 (28.2%) | 0 (0.0%) |
| $150,000 or more | 0 (0.0%) | 0 (0.0%) |
| Total | 305 (100.0%) | 151 (100.0%) |
Monthly Housing Cost Tiers in Drain
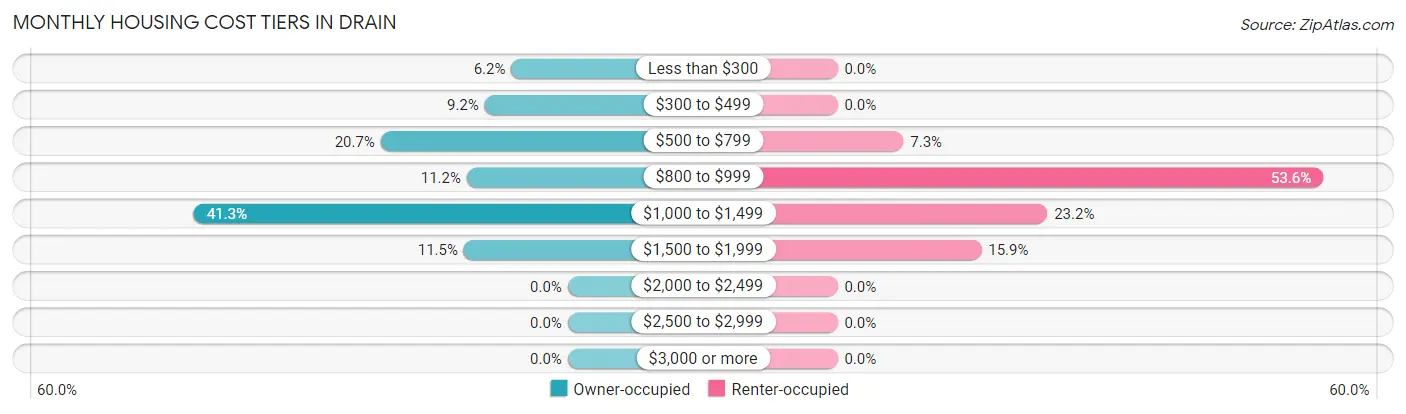
| Monthly Cost | Owner-occupied | Renter-occupied |
| Less than $300 | 19 (6.2%) | 0 (0.0%) |
| $300 to $499 | 28 (9.2%) | 0 (0.0%) |
| $500 to $799 | 63 (20.7%) | 11 (7.3%) |
| $800 to $999 | 34 (11.2%) | 81 (53.6%) |
| $1,000 to $1,499 | 126 (41.3%) | 35 (23.2%) |
| $1,500 to $1,999 | 35 (11.5%) | 24 (15.9%) |
| $2,000 to $2,499 | 0 (0.0%) | 0 (0.0%) |
| $2,500 to $2,999 | 0 (0.0%) | 0 (0.0%) |
| $3,000 or more | 0 (0.0%) | 0 (0.0%) |
| Total | 305 (100.0%) | 151 (100.0%) |
Physical Housing Characteristics in Drain
Housing Structures in Drain
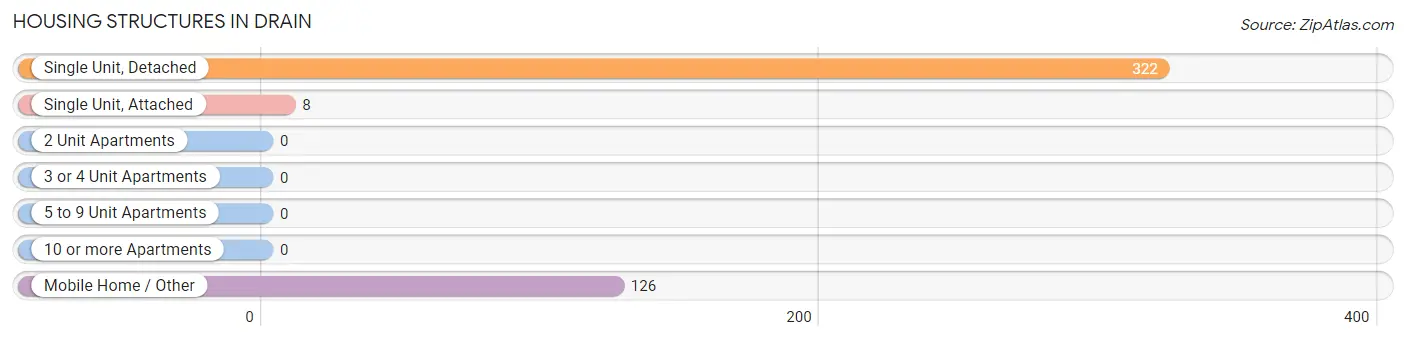
| Structure Type | # Housing Units | % Housing Units |
| Single Unit, Detached | 322 | 70.6% |
| Single Unit, Attached | 8 | 1.8% |
| 2 Unit Apartments | 0 | 0.0% |
| 3 or 4 Unit Apartments | 0 | 0.0% |
| 5 to 9 Unit Apartments | 0 | 0.0% |
| 10 or more Apartments | 0 | 0.0% |
| Mobile Home / Other | 126 | 27.6% |
| Total | 456 | 100.0% |
Housing Structures by Occupancy in Drain
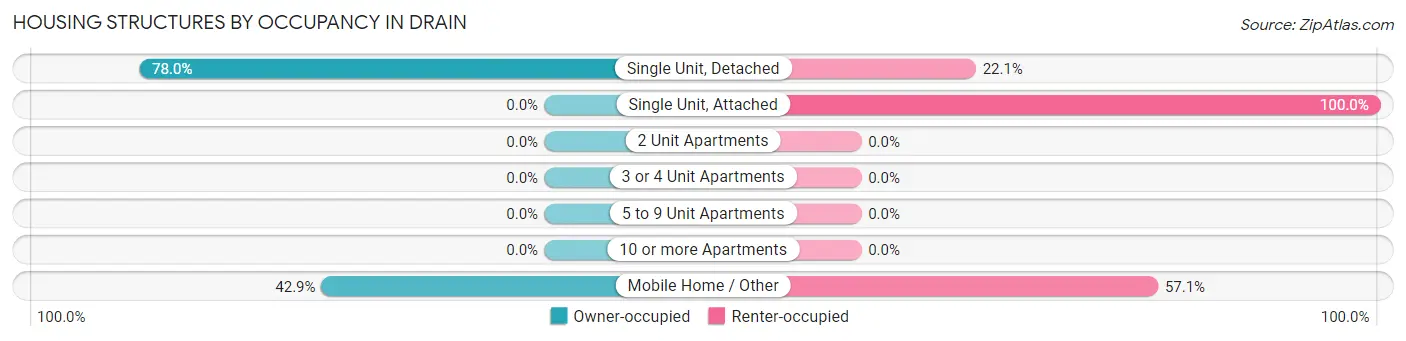
| Structure Type | Owner-occupied | Renter-occupied |
| Single Unit, Detached | 251 (77.9%) | 71 (22.1%) |
| Single Unit, Attached | 0 (0.0%) | 8 (100.0%) |
| 2 Unit Apartments | 0 (0.0%) | 0 (0.0%) |
| 3 or 4 Unit Apartments | 0 (0.0%) | 0 (0.0%) |
| 5 to 9 Unit Apartments | 0 (0.0%) | 0 (0.0%) |
| 10 or more Apartments | 0 (0.0%) | 0 (0.0%) |
| Mobile Home / Other | 54 (42.9%) | 72 (57.1%) |
| Total | 305 (66.9%) | 151 (33.1%) |
Housing Structures by Number of Rooms in Drain
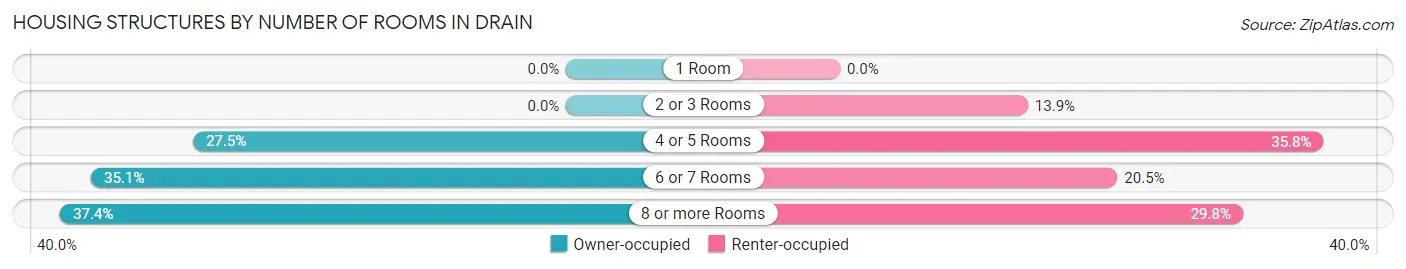
| Number of Rooms | Owner-occupied | Renter-occupied |
| 1 Room | 0 (0.0%) | 0 (0.0%) |
| 2 or 3 Rooms | 0 (0.0%) | 21 (13.9%) |
| 4 or 5 Rooms | 84 (27.5%) | 54 (35.8%) |
| 6 or 7 Rooms | 107 (35.1%) | 31 (20.5%) |
| 8 or more Rooms | 114 (37.4%) | 45 (29.8%) |
| Total | 305 (100.0%) | 151 (100.0%) |
Housing Structure by Heating Type in Drain
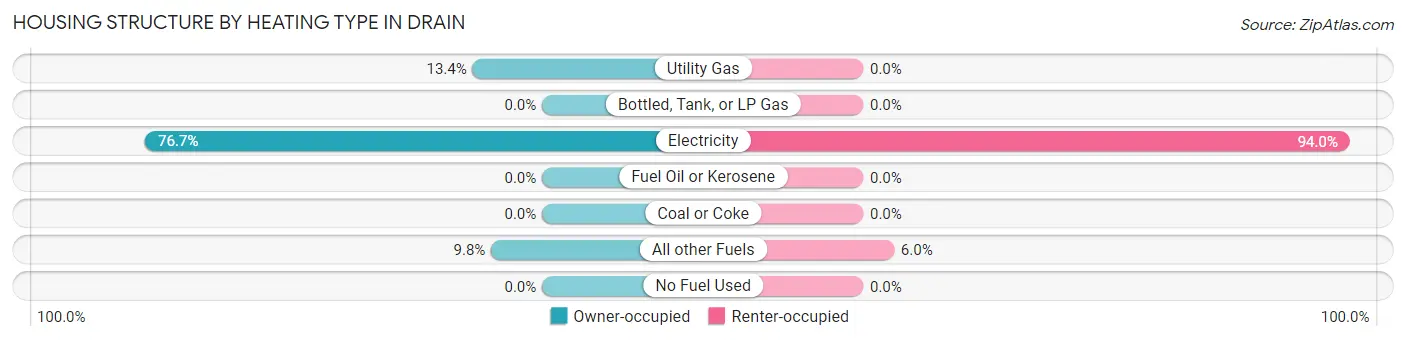
| Heating Type | Owner-occupied | Renter-occupied |
| Utility Gas | 41 (13.4%) | 0 (0.0%) |
| Bottled, Tank, or LP Gas | 0 (0.0%) | 0 (0.0%) |
| Electricity | 234 (76.7%) | 142 (94.0%) |
| Fuel Oil or Kerosene | 0 (0.0%) | 0 (0.0%) |
| Coal or Coke | 0 (0.0%) | 0 (0.0%) |
| All other Fuels | 30 (9.8%) | 9 (6.0%) |
| No Fuel Used | 0 (0.0%) | 0 (0.0%) |
| Total | 305 (100.0%) | 151 (100.0%) |
Household Vehicle Usage in Drain
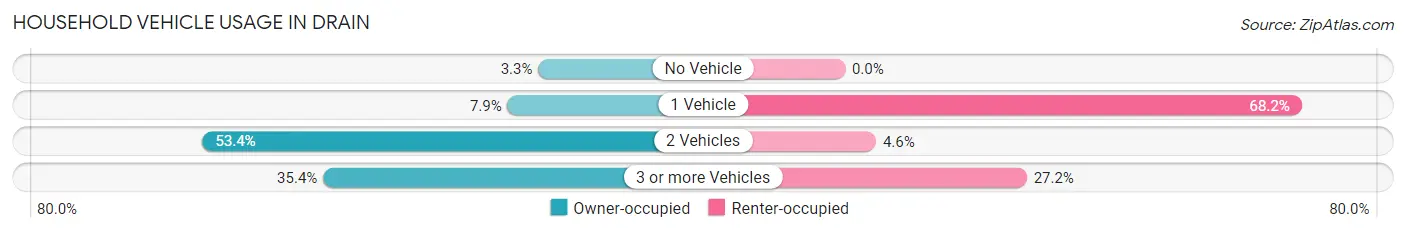
| Vehicles per Household | Owner-occupied | Renter-occupied |
| No Vehicle | 10 (3.3%) | 0 (0.0%) |
| 1 Vehicle | 24 (7.9%) | 103 (68.2%) |
| 2 Vehicles | 163 (53.4%) | 7 (4.6%) |
| 3 or more Vehicles | 108 (35.4%) | 41 (27.2%) |
| Total | 305 (100.0%) | 151 (100.0%) |
Real Estate & Mortgages in Drain
Real Estate and Mortgage Overview in Drain
| Characteristic | Without Mortgage | With Mortgage |
| Housing Units | 134 | 171 |
| Median Property Value | $205,600 | $250,400 |
| Median Household Income | $44,485 | $0 |
| Monthly Housing Costs | $600 | $0 |
| Real Estate Taxes | $1,217 | $0 |
Property Value by Mortgage Status in Drain
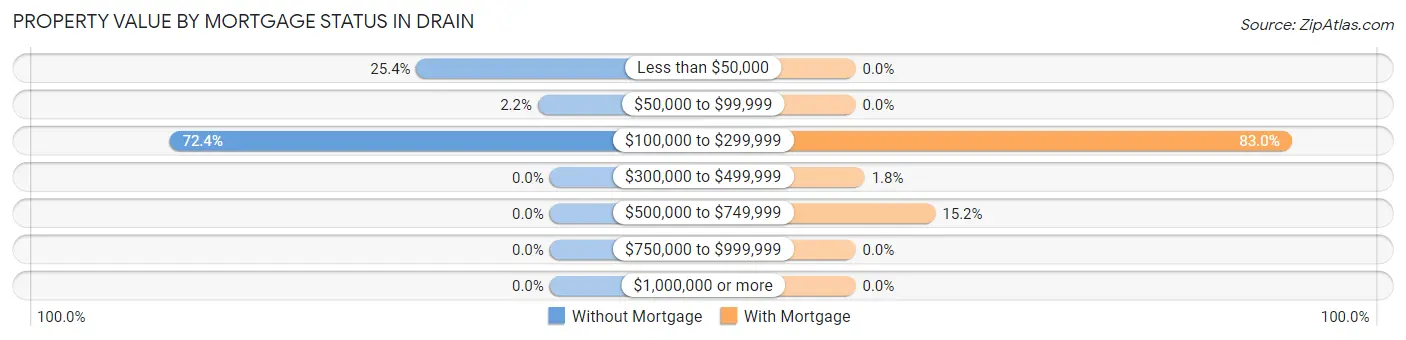
| Property Value | Without Mortgage | With Mortgage |
| Less than $50,000 | 34 (25.4%) | 0 (0.0%) |
| $50,000 to $99,999 | 3 (2.2%) | 0 (0.0%) |
| $100,000 to $299,999 | 97 (72.4%) | 142 (83.0%) |
| $300,000 to $499,999 | 0 (0.0%) | 3 (1.8%) |
| $500,000 to $749,999 | 0 (0.0%) | 26 (15.2%) |
| $750,000 to $999,999 | 0 (0.0%) | 0 (0.0%) |
| $1,000,000 or more | 0 (0.0%) | 0 (0.0%) |
| Total | 134 (100.0%) | 171 (100.0%) |
Household Income by Mortgage Status in Drain
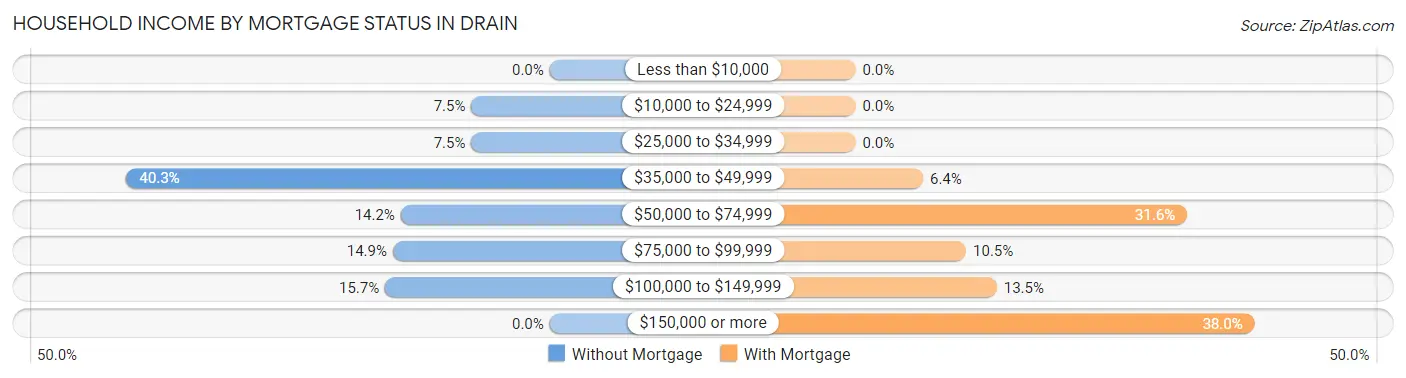
| Household Income | Without Mortgage | With Mortgage |
| Less than $10,000 | 0 (0.0%) | 0 (0.0%) |
| $10,000 to $24,999 | 10 (7.5%) | 0 (0.0%) |
| $25,000 to $34,999 | 10 (7.5%) | 0 (0.0%) |
| $35,000 to $49,999 | 54 (40.3%) | 11 (6.4%) |
| $50,000 to $74,999 | 19 (14.2%) | 54 (31.6%) |
| $75,000 to $99,999 | 20 (14.9%) | 18 (10.5%) |
| $100,000 to $149,999 | 21 (15.7%) | 23 (13.5%) |
| $150,000 or more | 0 (0.0%) | 65 (38.0%) |
| Total | 134 (100.0%) | 171 (100.0%) |
Property Value to Household Income Ratio in Drain
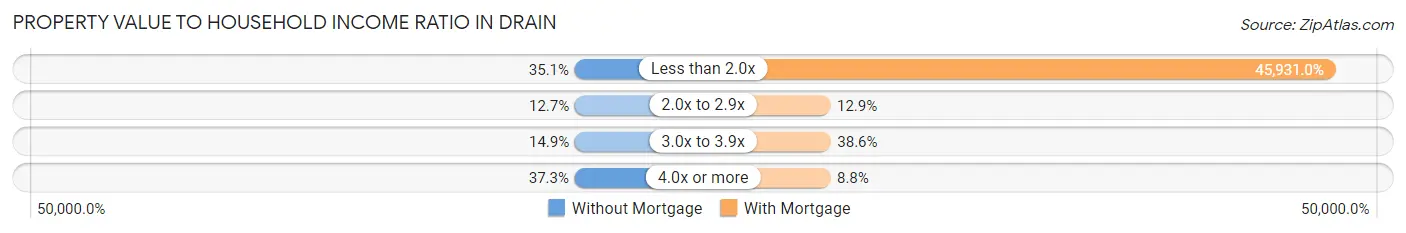
| Value-to-Income Ratio | Without Mortgage | With Mortgage |
| Less than 2.0x | 47 (35.1%) | 78,542 (45,931.0%) |
| 2.0x to 2.9x | 17 (12.7%) | 22 (12.9%) |
| 3.0x to 3.9x | 20 (14.9%) | 66 (38.6%) |
| 4.0x or more | 50 (37.3%) | 15 (8.8%) |
| Total | 134 (100.0%) | 171 (100.0%) |
Real Estate Taxes by Mortgage Status in Drain
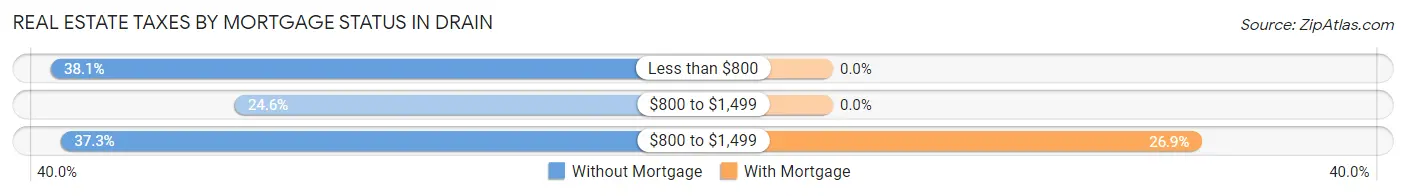
| Property Taxes | Without Mortgage | With Mortgage |
| Less than $800 | 51 (38.1%) | 0 (0.0%) |
| $800 to $1,499 | 33 (24.6%) | 0 (0.0%) |
| $800 to $1,499 | 50 (37.3%) | 46 (26.9%) |
| Total | 134 (100.0%) | 171 (100.0%) |
Health & Disability in Drain
Health Insurance Coverage by Age in Drain
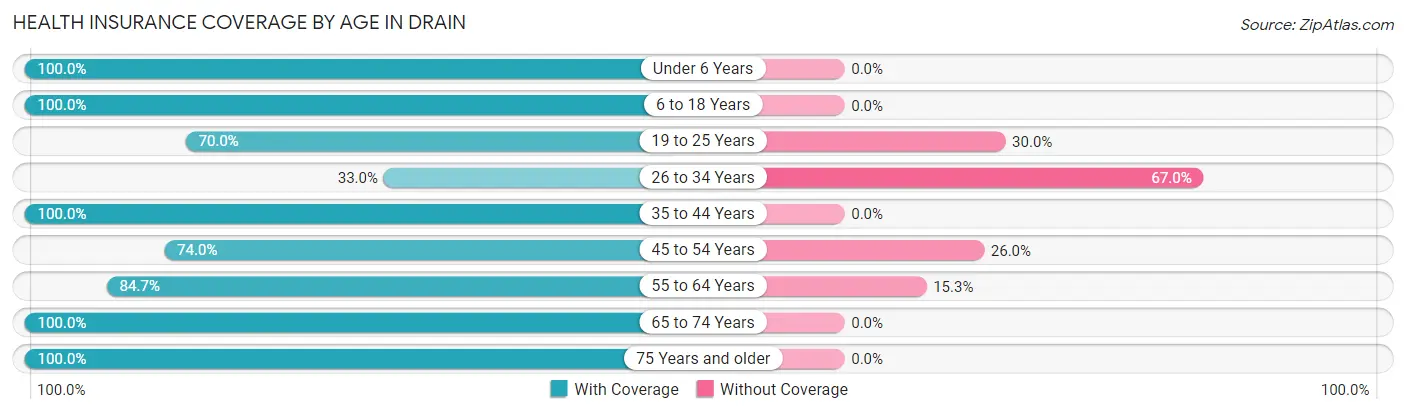
| Age Bracket | With Coverage | Without Coverage |
| Under 6 Years | 76 (100.0%) | 0 (0.0%) |
| 6 to 18 Years | 77 (100.0%) | 0 (0.0%) |
| 19 to 25 Years | 70 (70.0%) | 30 (30.0%) |
| 26 to 34 Years | 34 (33.0%) | 69 (67.0%) |
| 35 to 44 Years | 64 (100.0%) | 0 (0.0%) |
| 45 to 54 Years | 145 (74.0%) | 51 (26.0%) |
| 55 to 64 Years | 194 (84.7%) | 35 (15.3%) |
| 65 to 74 Years | 122 (100.0%) | 0 (0.0%) |
| 75 Years and older | 88 (100.0%) | 0 (0.0%) |
| Total | 870 (82.5%) | 185 (17.5%) |
Health Insurance Coverage by Citizenship Status in Drain
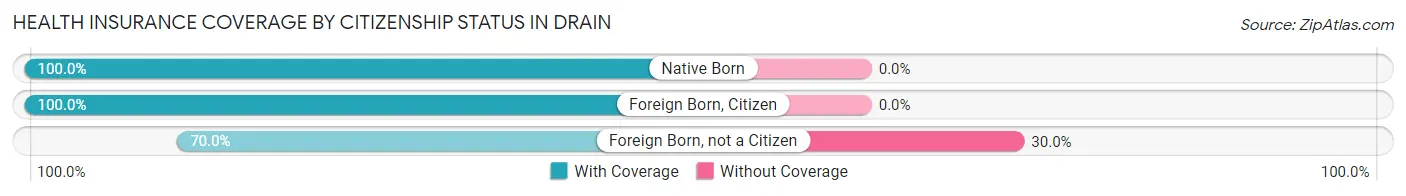
| Citizenship Status | With Coverage | Without Coverage |
| Native Born | 76 (100.0%) | 0 (0.0%) |
| Foreign Born, Citizen | 77 (100.0%) | 0 (0.0%) |
| Foreign Born, not a Citizen | 70 (70.0%) | 30 (30.0%) |
Health Insurance Coverage by Household Income in Drain
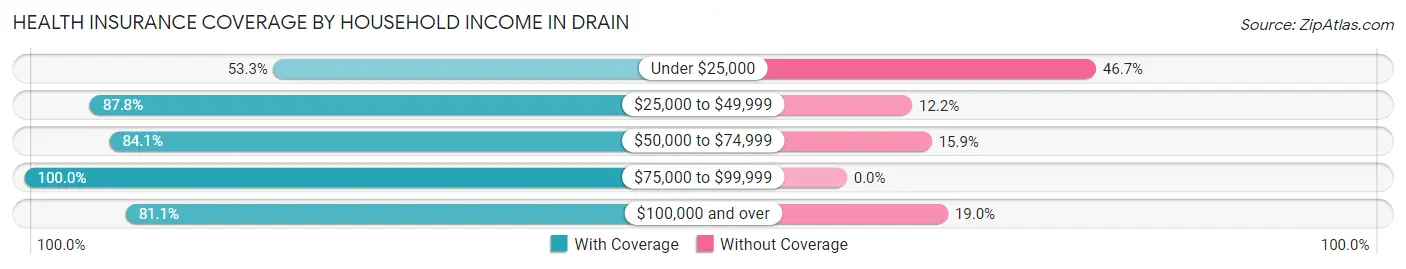
| Household Income | With Coverage | Without Coverage |
| Under $25,000 | 64 (53.3%) | 56 (46.7%) |
| $25,000 to $49,999 | 287 (87.8%) | 40 (12.2%) |
| $50,000 to $74,999 | 222 (84.1%) | 42 (15.9%) |
| $75,000 to $99,999 | 96 (100.0%) | 0 (0.0%) |
| $100,000 and over | 201 (81.0%) | 47 (19.0%) |
Public vs Private Health Insurance Coverage by Age in Drain
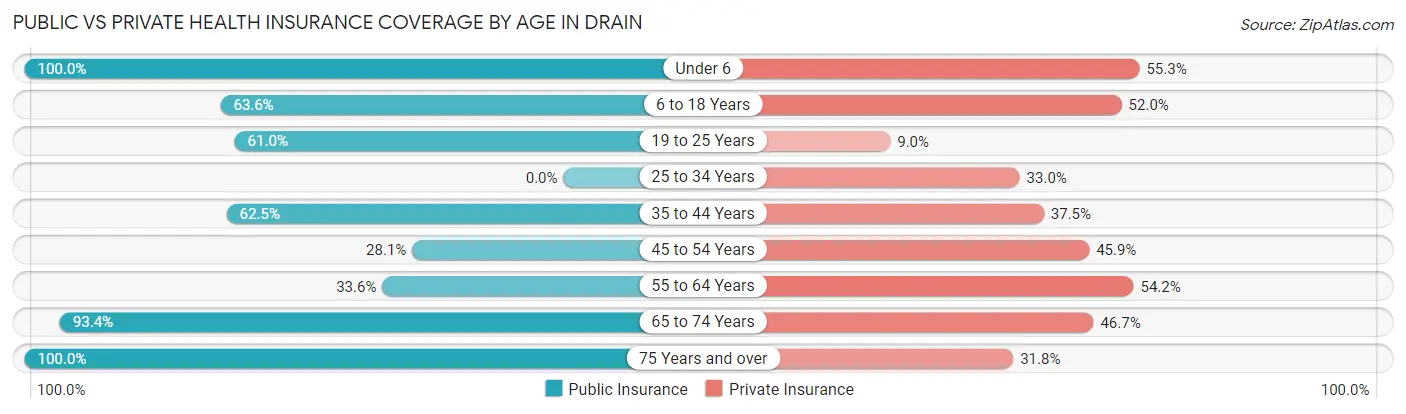
| Age Bracket | Public Insurance | Private Insurance |
| Under 6 | 76 (100.0%) | 42 (55.3%) |
| 6 to 18 Years | 49 (63.6%) | 40 (51.9%) |
| 19 to 25 Years | 61 (61.0%) | 9 (9.0%) |
| 25 to 34 Years | 0 (0.0%) | 34 (33.0%) |
| 35 to 44 Years | 40 (62.5%) | 24 (37.5%) |
| 45 to 54 Years | 55 (28.1%) | 90 (45.9%) |
| 55 to 64 Years | 77 (33.6%) | 124 (54.1%) |
| 65 to 74 Years | 114 (93.4%) | 57 (46.7%) |
| 75 Years and over | 88 (100.0%) | 28 (31.8%) |
| Total | 560 (53.1%) | 448 (42.5%) |
Disability Status by Sex by Age in Drain
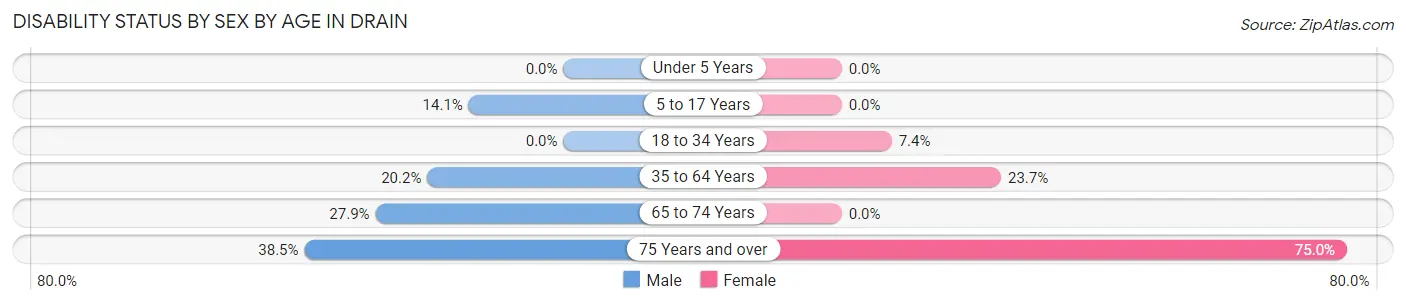
| Age Bracket | Male | Female |
| Under 5 Years | 0 (0.0%) | 0 (0.0%) |
| 5 to 17 Years | 9 (14.1%) | 0 (0.0%) |
| 18 to 34 Years | 0 (0.0%) | 8 (7.4%) |
| 35 to 64 Years | 39 (20.2%) | 70 (23.6%) |
| 65 to 74 Years | 12 (27.9%) | 0 (0.0%) |
| 75 Years and over | 20 (38.5%) | 27 (75.0%) |
Disability Class by Sex by Age in Drain
Disability Class: Hearing Difficulty
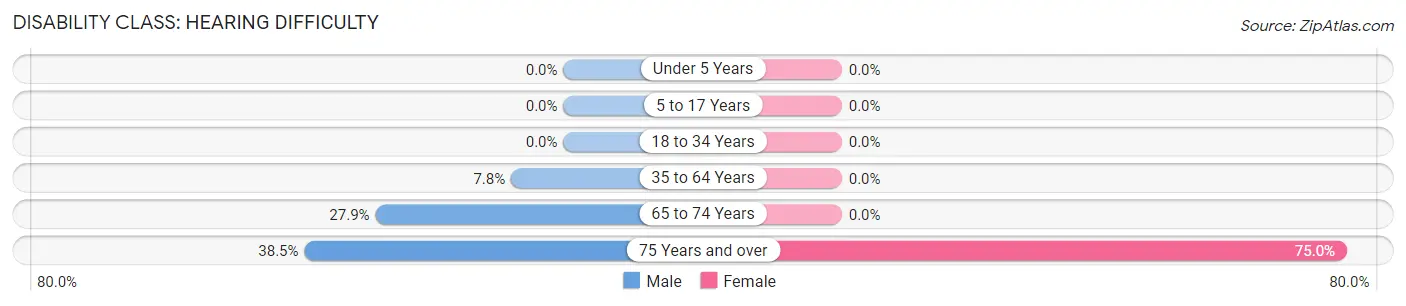
| Age Bracket | Male | Female |
| Under 5 Years | 0 (0.0%) | 0 (0.0%) |
| 5 to 17 Years | 0 (0.0%) | 0 (0.0%) |
| 18 to 34 Years | 0 (0.0%) | 0 (0.0%) |
| 35 to 64 Years | 15 (7.8%) | 0 (0.0%) |
| 65 to 74 Years | 12 (27.9%) | 0 (0.0%) |
| 75 Years and over | 20 (38.5%) | 27 (75.0%) |
Disability Class: Vision Difficulty
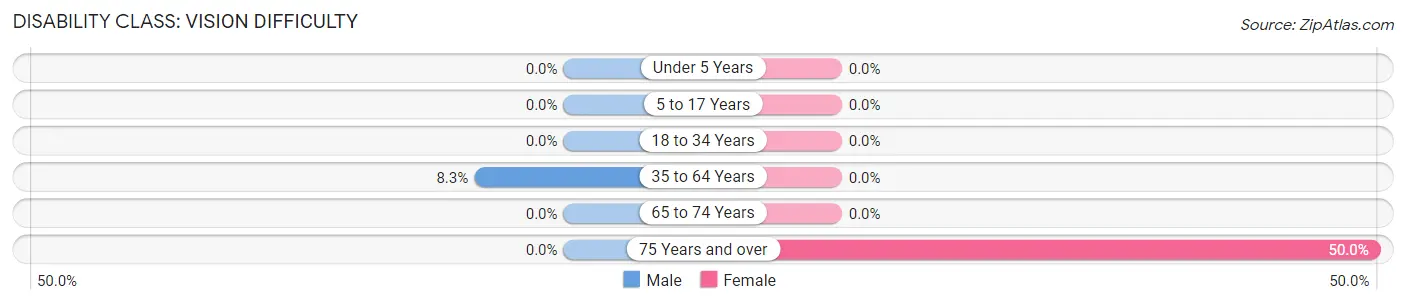
| Age Bracket | Male | Female |
| Under 5 Years | 0 (0.0%) | 0 (0.0%) |
| 5 to 17 Years | 0 (0.0%) | 0 (0.0%) |
| 18 to 34 Years | 0 (0.0%) | 0 (0.0%) |
| 35 to 64 Years | 16 (8.3%) | 0 (0.0%) |
| 65 to 74 Years | 0 (0.0%) | 0 (0.0%) |
| 75 Years and over | 0 (0.0%) | 18 (50.0%) |
Disability Class: Cognitive Difficulty
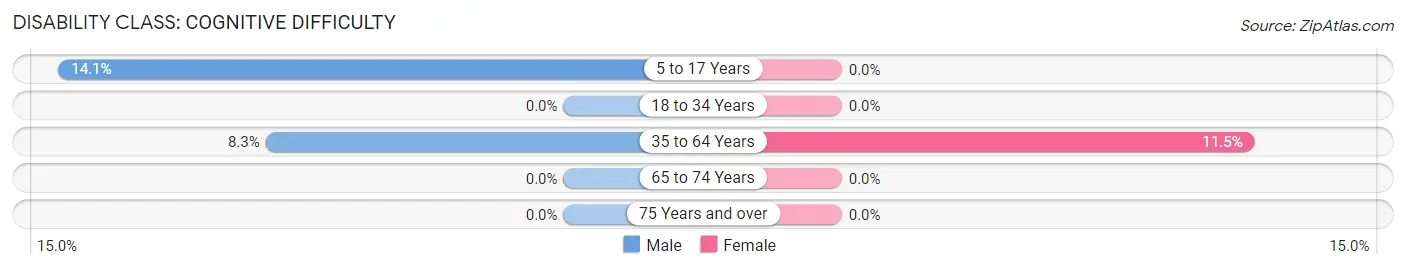
| Age Bracket | Male | Female |
| 5 to 17 Years | 9 (14.1%) | 0 (0.0%) |
| 18 to 34 Years | 0 (0.0%) | 0 (0.0%) |
| 35 to 64 Years | 16 (8.3%) | 34 (11.5%) |
| 65 to 74 Years | 0 (0.0%) | 0 (0.0%) |
| 75 Years and over | 0 (0.0%) | 0 (0.0%) |
Disability Class: Ambulatory Difficulty
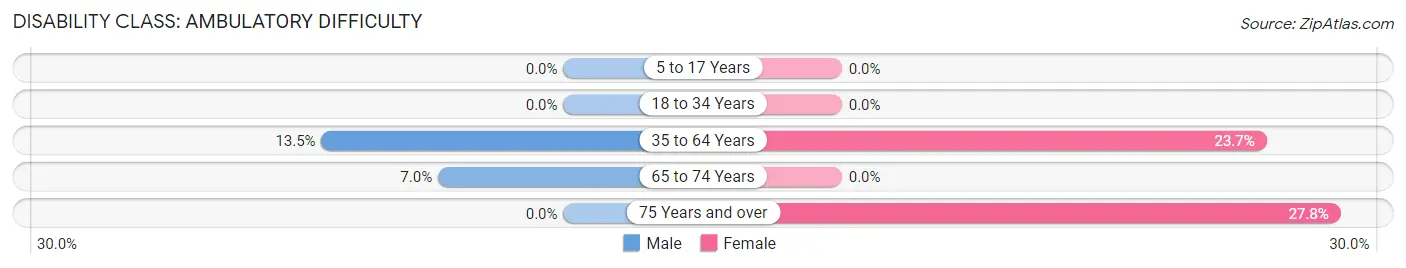
| Age Bracket | Male | Female |
| 5 to 17 Years | 0 (0.0%) | 0 (0.0%) |
| 18 to 34 Years | 0 (0.0%) | 0 (0.0%) |
| 35 to 64 Years | 26 (13.5%) | 70 (23.6%) |
| 65 to 74 Years | 3 (7.0%) | 0 (0.0%) |
| 75 Years and over | 0 (0.0%) | 10 (27.8%) |
Disability Class: Self-Care Difficulty
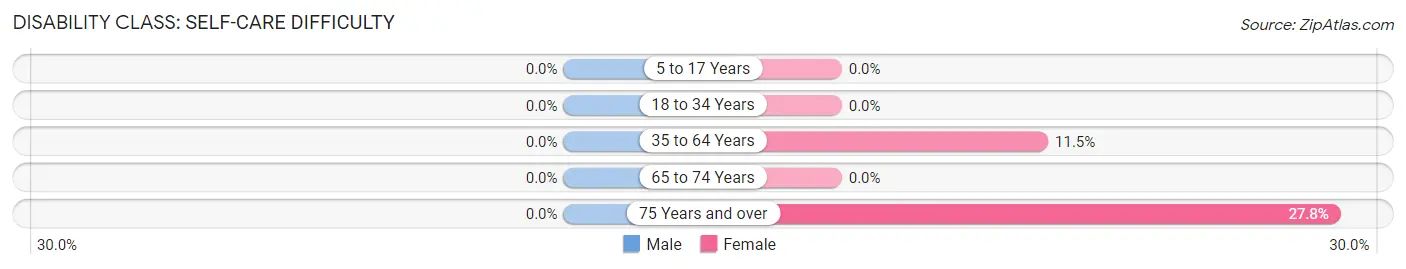
| Age Bracket | Male | Female |
| 5 to 17 Years | 0 (0.0%) | 0 (0.0%) |
| 18 to 34 Years | 0 (0.0%) | 0 (0.0%) |
| 35 to 64 Years | 0 (0.0%) | 34 (11.5%) |
| 65 to 74 Years | 0 (0.0%) | 0 (0.0%) |
| 75 Years and over | 0 (0.0%) | 10 (27.8%) |
Technology Access in Drain
Computing Device Access in Drain
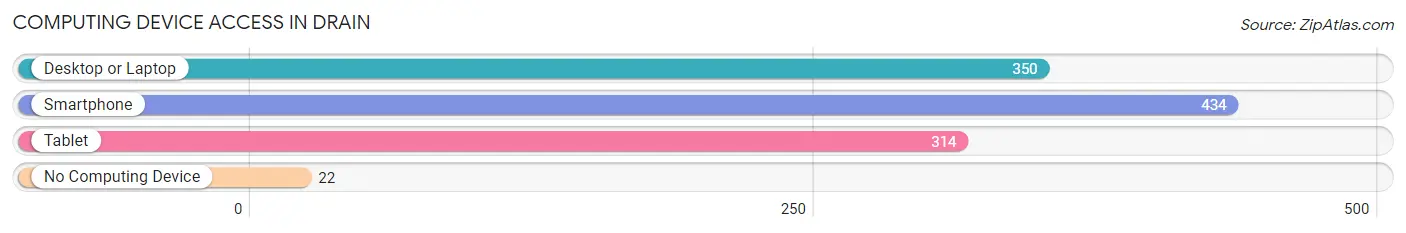
| Device Type | # Households | % Households |
| Desktop or Laptop | 350 | 76.7% |
| Smartphone | 434 | 95.2% |
| Tablet | 314 | 68.9% |
| No Computing Device | 22 | 4.8% |
| Total | 456 | 100.0% |
Internet Access in Drain
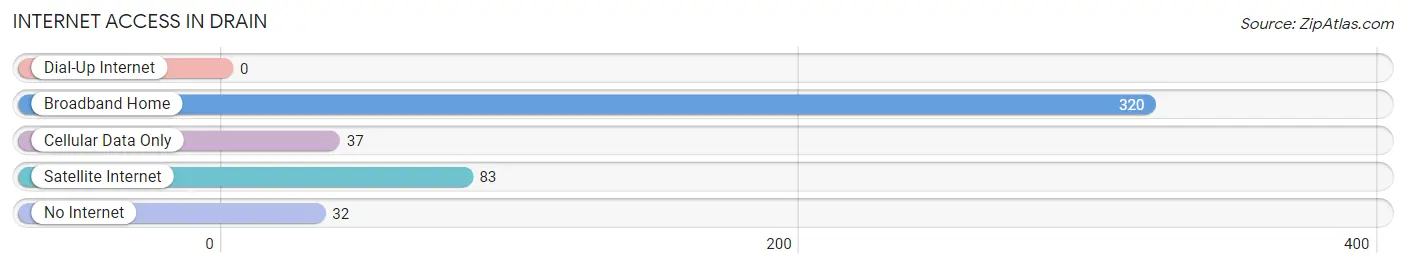
| Internet Type | # Households | % Households |
| Dial-Up Internet | 0 | 0.0% |
| Broadband Home | 320 | 70.2% |
| Cellular Data Only | 37 | 8.1% |
| Satellite Internet | 83 | 18.2% |
| No Internet | 32 | 7.0% |
| Total | 456 | 100.0% |
Drain Summary
History
Drain, Oregon is a small city located in Douglas County, Oregon. It was founded in 1853 by a group of settlers from the Willamette Valley. The city was named after a nearby creek, which was named after a local Native American chief. The city was originally a farming community, but in the late 19th century, it became a logging town. The logging industry was the main source of income for the city until the mid-20th century.
In the early 20th century, Drain began to experience a period of growth and development. The city was incorporated in 1911 and the first mayor was elected in 1912. The city was home to several businesses, including a sawmill, a flour mill, a creamery, and a cannery. The city also had a railroad station, which connected it to the rest of the state.
In the 1950s, the city began to experience a decline in population as the logging industry declined. The city was also affected by the Great Depression and World War II. In the late 1950s, the city began to experience a period of revitalization. The city was able to attract new businesses and industries, including a paper mill, a lumber mill, and a furniture factory.
Geography
Drain is located in the Umpqua Valley in southwestern Oregon. The city is situated on the banks of the Umpqua River, which is a tributary of the Willamette River. The city is surrounded by rolling hills and is located in the foothills of the Cascade Mountains. The city has a total area of 1.3 square miles, with 0.2 square miles of water.
The climate in Drain is mild and temperate. The average temperature in the summer is around 75 degrees Fahrenheit, and the average temperature in the winter is around 40 degrees Fahrenheit. The city receives an average of 35 inches of precipitation per year.
Economy
The economy of Drain is largely based on agriculture and forestry. The city is home to several farms and ranches, which produce a variety of crops, including wheat, corn, and hay. The city is also home to several lumber mills, which produce lumber for the construction industry.
The city is also home to several manufacturing companies, which produce a variety of products, including furniture, paper products, and clothing. The city is also home to several retail stores, which sell a variety of goods, including clothing, electronics, and home goods.
Demographics
As of the 2010 census, the population of Drain was 1,845. The racial makeup of the city was 94.3% White, 0.7% African American, 0.3% Native American, 0.3% Asian, 0.1% Pacific Islander, and 4.3% from other races. The median household income in the city was $37,917, and the median family income was $45,917. The per capita income in the city was $19,917.
Conclusion
Drain, Oregon is a small city located in Douglas County, Oregon. It was founded in 1853 and has a long history of logging and farming. The city has experienced a period of revitalization in the late 20th century, and is now home to several businesses and industries. The economy of Drain is largely based on agriculture and forestry, and the city is home to several farms and ranches. The population of Drain is 1,845, and the median household income is $37,917.
Common Questions
What is the Total Population of Drain?
Total Population of Drain is 1,055.
What is the Total Male Population of Drain?
Total Male Population of Drain is 501.
What is the Total Female Population of Drain?
Total Female Population of Drain is 554.
What is the Ratio of Males per 100 Females in Drain?
There are 90.43 Males per 100 Females in Drain.
What is the Ratio of Females per 100 Males in Drain?
There are 110.58 Females per 100 Males in Drain.
What is the Median Population Age in Drain?
Median Population Age in Drain is 52.7 Years.
What is the Average Family Size in Drain
Average Family Size in Drain is 2.6 People.
What is the Average Household Size in Drain
Average Household Size in Drain is 2.3 People.
What is Per Capita Income in Drain?
Per Capita income in Drain is $25,730.
What is the Median Family Income in Drain?
Median Family Income in Drain is $67,670.
What is the Median Household income in Drain?
Median Household Income in Drain is $49,130.
What is Inequality or Gini Index in Drain?
Inequality or Gini Index in Drain is 0.37.
How Large is the Labor Force in Drain?
There are 505 People in the Labor Forcein in Drain.
What is the Percentage of People in the Labor Force in Drain?
56.0% of People are in the Labor Force in Drain.
What is the Unemployment Rate in Drain?
Unemployment Rate in Drain is 5.5%.