North Powder, OR
North Powder Map
North Powder Overview
658
TOTAL POPULATION
330
MALE POPULATION
328
FEMALE POPULATION
100.61
MALES / 100 FEMALES
99.39
FEMALES / 100 MALES
42.3
MEDIAN AGE
2.9
AVG FAMILY SIZE
2.5
AVG HOUSEHOLD SIZE
$30,167
PER CAPITA INCOME
$74,306
AVG FAMILY INCOME
$64,583
AVG HOUSEHOLD INCOME
65.0%
WAGE / INCOME GAP [ % ]
35.0¢/ $1
WAGE / INCOME GAP [ $ ]
0.52
INEQUALITY / GINI INDEX
252
LABOR FORCE [ PEOPLE ]
52.1%
PERCENT IN LABOR FORCE
3.2%
UNEMPLOYMENT RATE
North Powder Zip Codes
North Powder Area Codes
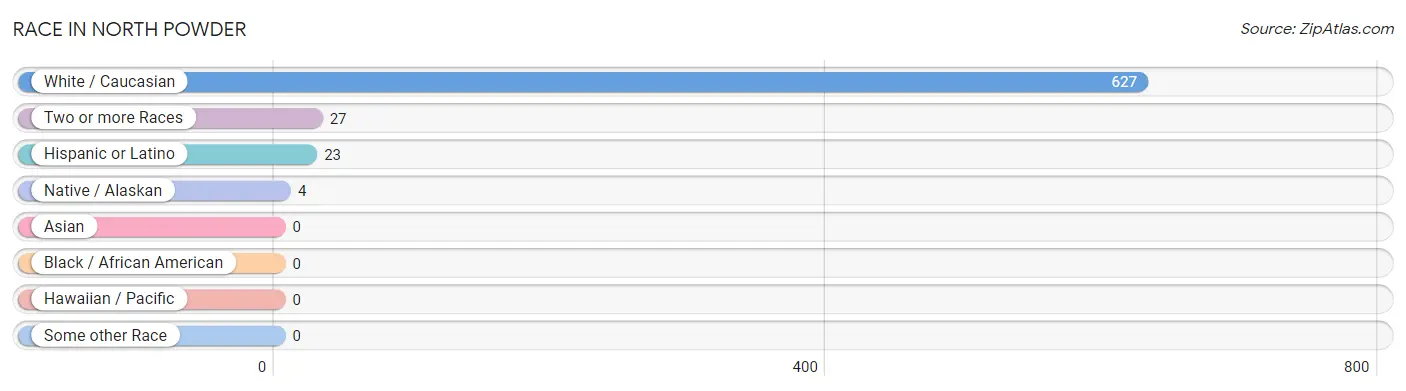
Race in North Powder
The most populous races in North Powder are White / Caucasian (627 | 95.3%), Two or more Races (27 | 4.1%), and Hispanic or Latino (23 | 3.5%).
| Race | # Population | % Population |
| Asian | 0 | 0.0% |
| Black / African American | 0 | 0.0% |
| Hawaiian / Pacific | 0 | 0.0% |
| Hispanic or Latino | 23 | 3.5% |
| Native / Alaskan | 4 | 0.6% |
| White / Caucasian | 627 | 95.3% |
| Two or more Races | 27 | 4.1% |
| Some other Race | 0 | 0.0% |
| Total | 658 | 100.0% |
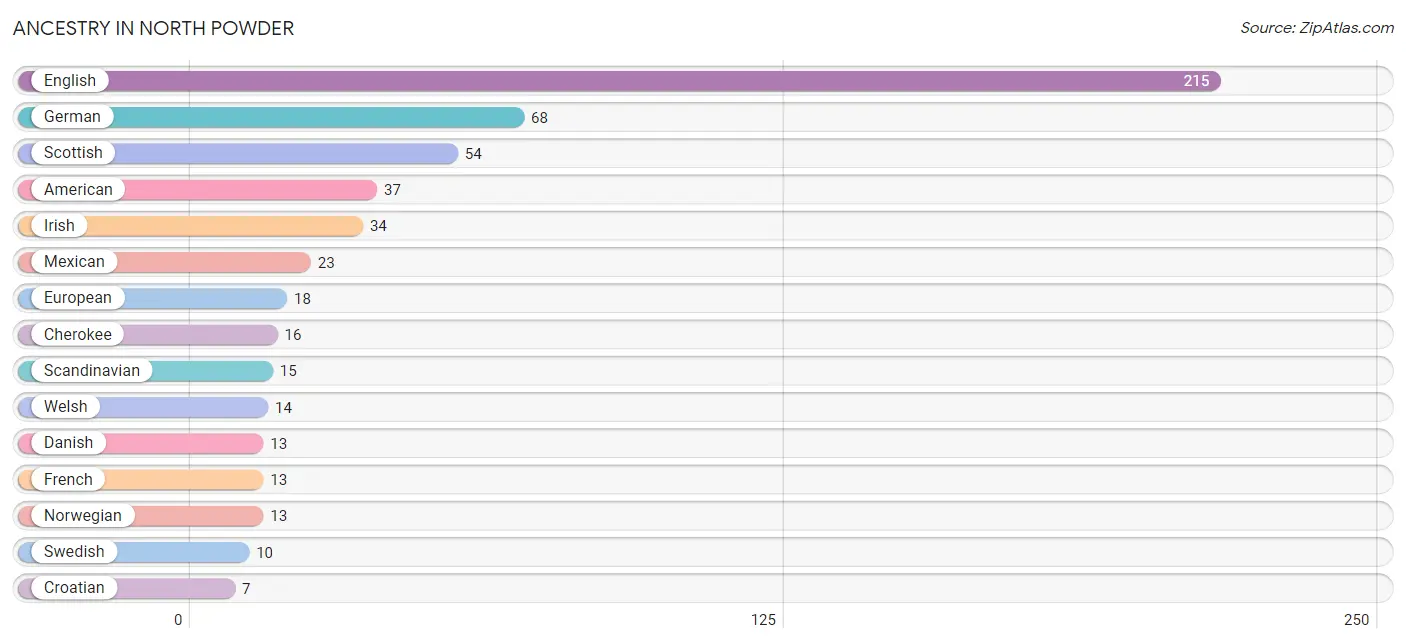
Ancestry in North Powder
The most populous ancestries reported in North Powder are English (215 | 32.7%), German (68 | 10.3%), Scottish (54 | 8.2%), American (37 | 5.6%), and Irish (34 | 5.2%), together accounting for 62.0% of all North Powder residents.
| Ancestry | # Population | % Population |
| American | 37 | 5.6% |
| Cherokee | 16 | 2.4% |
| Croatian | 7 | 1.1% |
| Danish | 13 | 2.0% |
| English | 215 | 32.7% |
| European | 18 | 2.7% |
| French | 13 | 2.0% |
| German | 68 | 10.3% |
| Irish | 34 | 5.2% |
| Italian | 5 | 0.8% |
| Mexican | 23 | 3.5% |
| Norwegian | 13 | 2.0% |
| Russian | 4 | 0.6% |
| Scandinavian | 15 | 2.3% |
| Scottish | 54 | 8.2% |
| Swedish | 10 | 1.5% |
| Welsh | 14 | 2.1% | View All 17 Rows |
Immigrants in North Powder

| Immigration Origin | # Population | % Population | View All 0 Rows |
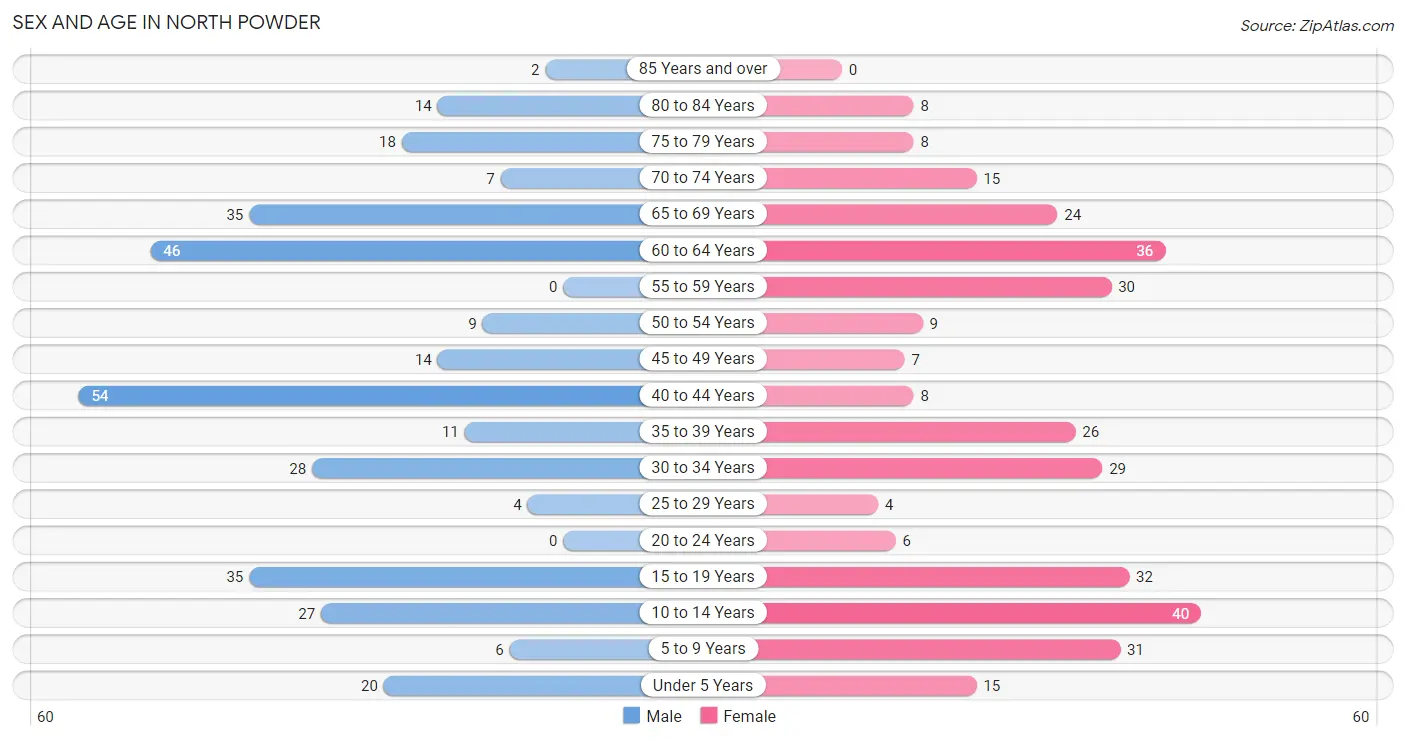
Sex and Age in North Powder
Sex and Age in North Powder
The most populous age groups in North Powder are 40 to 44 Years (54 | 16.4%) for men and 10 to 14 Years (40 | 12.2%) for women.
| Age Bracket | Male | Female |
| Under 5 Years | 20 (6.1%) | 15 (4.6%) |
| 5 to 9 Years | 6 (1.8%) | 31 (9.5%) |
| 10 to 14 Years | 27 (8.2%) | 40 (12.2%) |
| 15 to 19 Years | 35 (10.6%) | 32 (9.8%) |
| 20 to 24 Years | 0 (0.0%) | 6 (1.8%) |
| 25 to 29 Years | 4 (1.2%) | 4 (1.2%) |
| 30 to 34 Years | 28 (8.5%) | 29 (8.8%) |
| 35 to 39 Years | 11 (3.3%) | 26 (7.9%) |
| 40 to 44 Years | 54 (16.4%) | 8 (2.4%) |
| 45 to 49 Years | 14 (4.2%) | 7 (2.1%) |
| 50 to 54 Years | 9 (2.7%) | 9 (2.7%) |
| 55 to 59 Years | 0 (0.0%) | 30 (9.1%) |
| 60 to 64 Years | 46 (13.9%) | 36 (11.0%) |
| 65 to 69 Years | 35 (10.6%) | 24 (7.3%) |
| 70 to 74 Years | 7 (2.1%) | 15 (4.6%) |
| 75 to 79 Years | 18 (5.4%) | 8 (2.4%) |
| 80 to 84 Years | 14 (4.2%) | 8 (2.4%) |
| 85 Years and over | 2 (0.6%) | 0 (0.0%) |
| Total | 330 (100.0%) | 328 (100.0%) |
Families and Households in North Powder
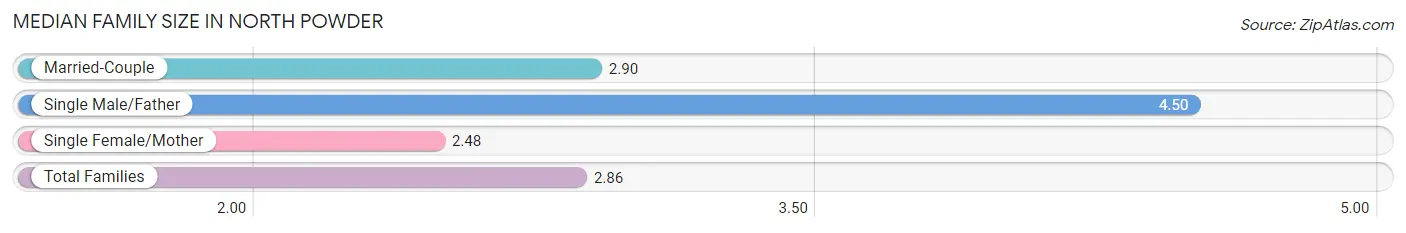
Median Family Size in North Powder
The median family size in North Powder is 2.86 persons per family, with single male/father families (2 | 1.0%) accounting for the largest median family size of 4.5 persons per family. On the other hand, single female/mother families (29 | 13.9%) represent the smallest median family size with 2.48 persons per family.
| Family Type | # Families | Family Size |
| Married-Couple | 178 (85.2%) | 2.90 |
| Single Male/Father | 2 (1.0%) | 4.50 |
| Single Female/Mother | 29 (13.9%) | 2.48 |
| Total Families | 209 (100.0%) | 2.86 |
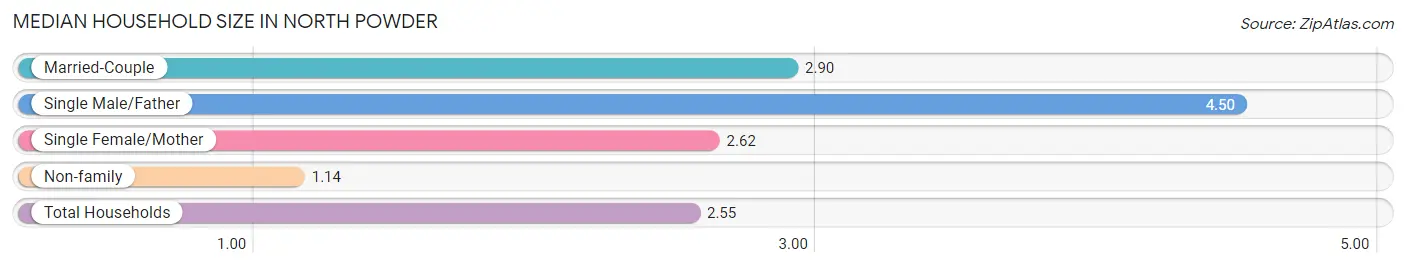
Median Household Size in North Powder
The median household size in North Powder is 2.55 persons per household, with single male/father households (2 | 0.8%) accounting for the largest median household size of 4.5 persons per household. non-family households (49 | 19.0%) represent the smallest median household size with 1.14 persons per household.
| Household Type | # Households | Household Size |
| Married-Couple | 178 (69.0%) | 2.90 |
| Single Male/Father | 2 (0.8%) | 4.50 |
| Single Female/Mother | 29 (11.2%) | 2.62 |
| Non-family | 49 (19.0%) | 1.14 |
| Total Households | 258 (100.0%) | 2.55 |
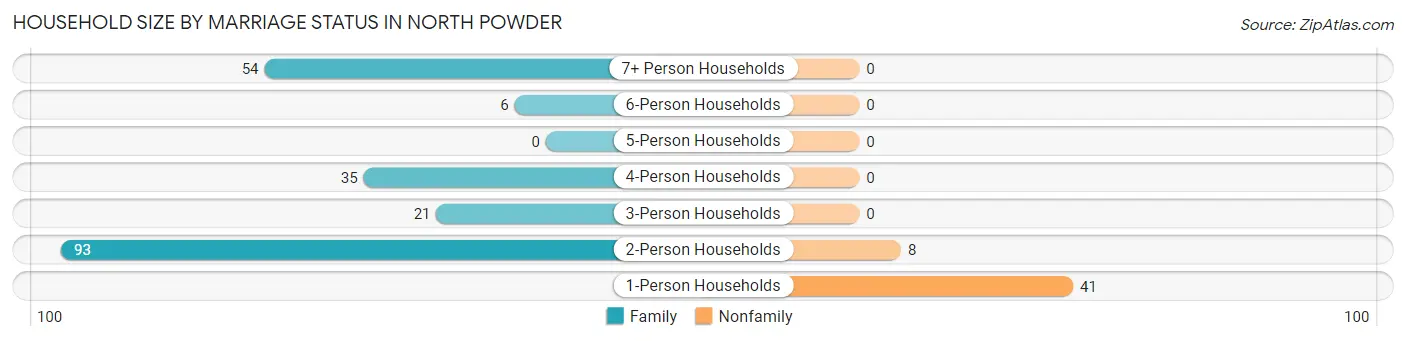
Household Size by Marriage Status in North Powder
Out of a total of 258 households in North Powder, 209 (81.0%) are family households, while 49 (19.0%) are nonfamily households. The most numerous type of family households are 2-person households, comprising 93, and the most common type of nonfamily households are 1-person households, comprising 41.
| Household Size | Family Households | Nonfamily Households |
| 1-Person Households | - | 41 (15.9%) |
| 2-Person Households | 93 (36.0%) | 8 (3.1%) |
| 3-Person Households | 21 (8.1%) | 0 (0.0%) |
| 4-Person Households | 35 (13.6%) | 0 (0.0%) |
| 5-Person Households | 0 (0.0%) | 0 (0.0%) |
| 6-Person Households | 6 (2.3%) | 0 (0.0%) |
| 7+ Person Households | 54 (20.9%) | 0 (0.0%) |
| Total | 209 (81.0%) | 49 (19.0%) |
Female Fertility in North Powder
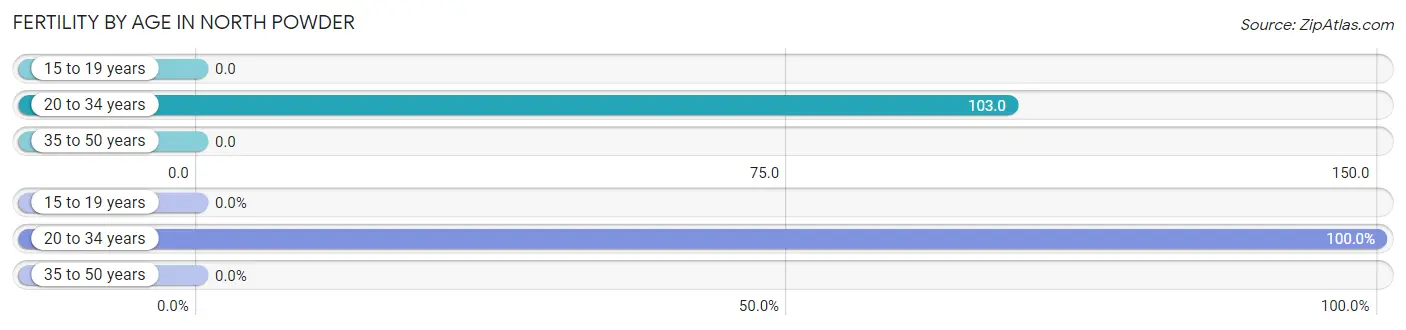
Fertility by Age in North Powder
Average fertility rate in North Powder is 36.0 births per 1,000 women. Women in the age bracket of 20 to 34 years have the highest fertility rate with 103.0 births per 1,000 women. Women in the age bracket of 20 to 34 years acount for 100.0% of all women with births.
| Age Bracket | Women with Births | Births / 1,000 Women |
| 15 to 19 years | 0 (0.0%) | 0.0 |
| 20 to 34 years | 4 (100.0%) | 103.0 |
| 35 to 50 years | 0 (0.0%) | 0.0 |
| Total | 4 (100.0%) | 36.0 |
Fertility by Age by Marriage Status in North Powder
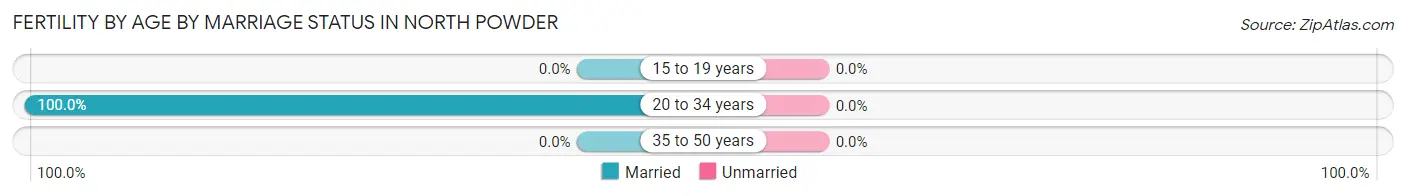
| Age Bracket | Married | Unmarried |
| 15 to 19 years | 0 (0.0%) | 0 (0.0%) |
| 20 to 34 years | 4 (100.0%) | 0 (0.0%) |
| 35 to 50 years | 0 (0.0%) | 0 (0.0%) |
| Total | 4 (100.0%) | 0 (0.0%) |
Fertility by Education in North Powder
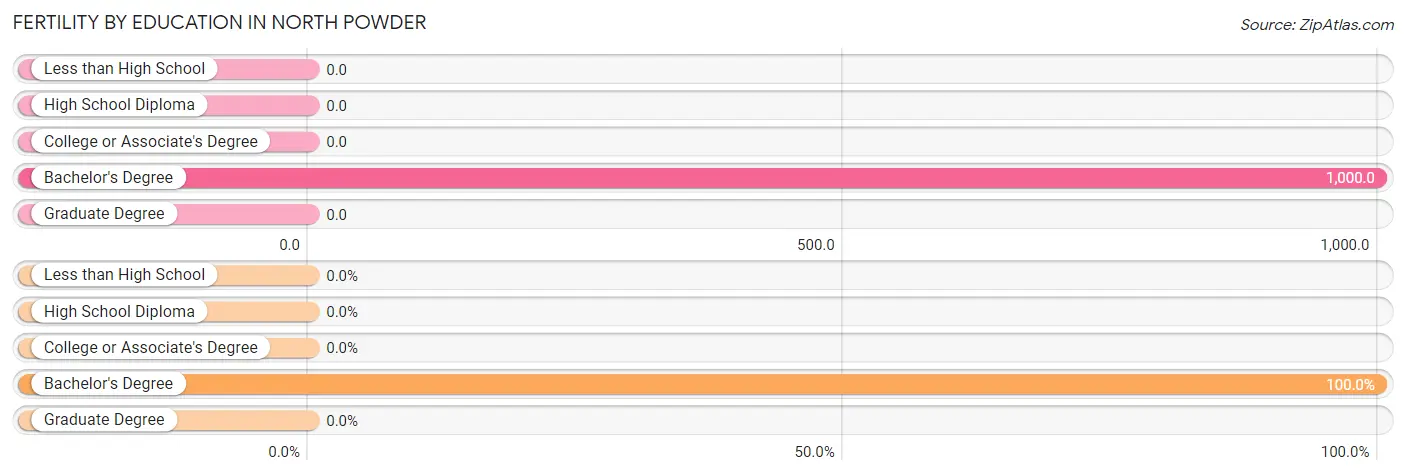
| Educational Attainment | Women with Births | Births / 1,000 Women |
| Less than High School | 0 (0.0%) | 0.0 |
| High School Diploma | 0 (0.0%) | 0.0 |
| College or Associate's Degree | 0 (0.0%) | 0.0 |
| Bachelor's Degree | 4 (100.0%) | 1,000.0 |
| Graduate Degree | 0 (0.0%) | 0.0 |
| Total | 4 (100.0%) | 36.0 |
Fertility by Education by Marriage Status in North Powder
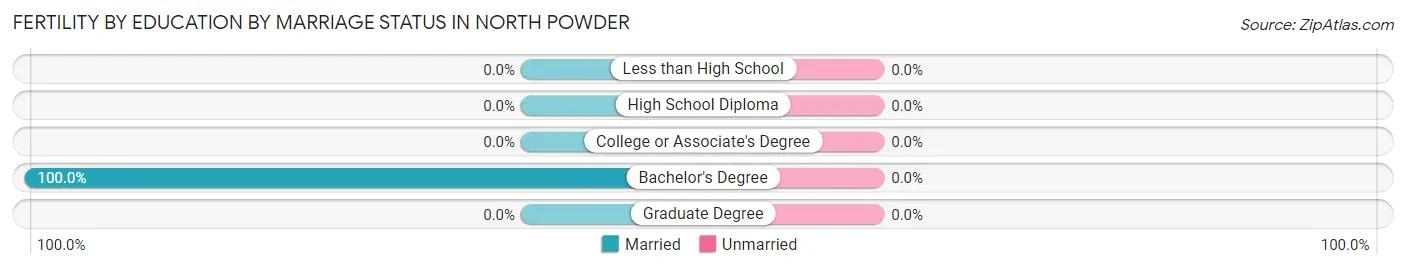
| Educational Attainment | Married | Unmarried |
| Less than High School | 0 (0.0%) | 0 (0.0%) |
| High School Diploma | 0 (0.0%) | 0 (0.0%) |
| College or Associate's Degree | 0 (0.0%) | 0 (0.0%) |
| Bachelor's Degree | 4 (100.0%) | 0 (0.0%) |
| Graduate Degree | 0 (0.0%) | 0 (0.0%) |
| Total | 4 (100.0%) | 0 (0.0%) |
Income in North Powder
Income Overview in North Powder
Per Capita Income in North Powder is $30,167, while median incomes of families and households are $74,306 and $64,583 respectively.
| Characteristic | Number | Measure |
| Per Capita Income | 658 | $30,167 |
| Median Family Income | 209 | $74,306 |
| Mean Family Income | 209 | $93,778 |
| Median Household Income | 258 | $64,583 |
| Mean Household Income | 258 | $82,348 |
| Income Deficit | 209 | $0 |
| Wage / Income Gap (%) | 658 | 64.96% |
| Wage / Income Gap ($) | 658 | 35.04¢ per $1 |
| Gini / Inequality Index | 658 | 0.52 |
Earnings by Sex in North Powder
Average Earnings in North Powder are $45,231, $47,083 for men and $16,500 for women, a difference of 65.0%.
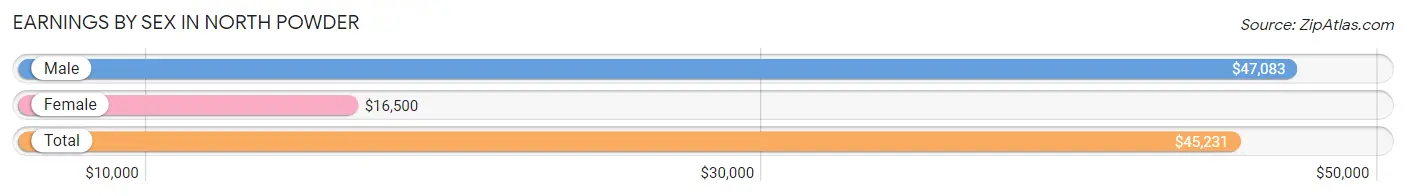
| Sex | Number | Average Earnings |
| Male | 144 (52.5%) | $47,083 |
| Female | 130 (47.4%) | $16,500 |
| Total | 274 (100.0%) | $45,231 |
Earnings by Sex by Income Bracket in North Powder
The most common earnings brackets in North Powder are $45,000 to $49,999 for men (54 | 37.5%) and $15,000 to $17,499 for women (25 | 19.2%).
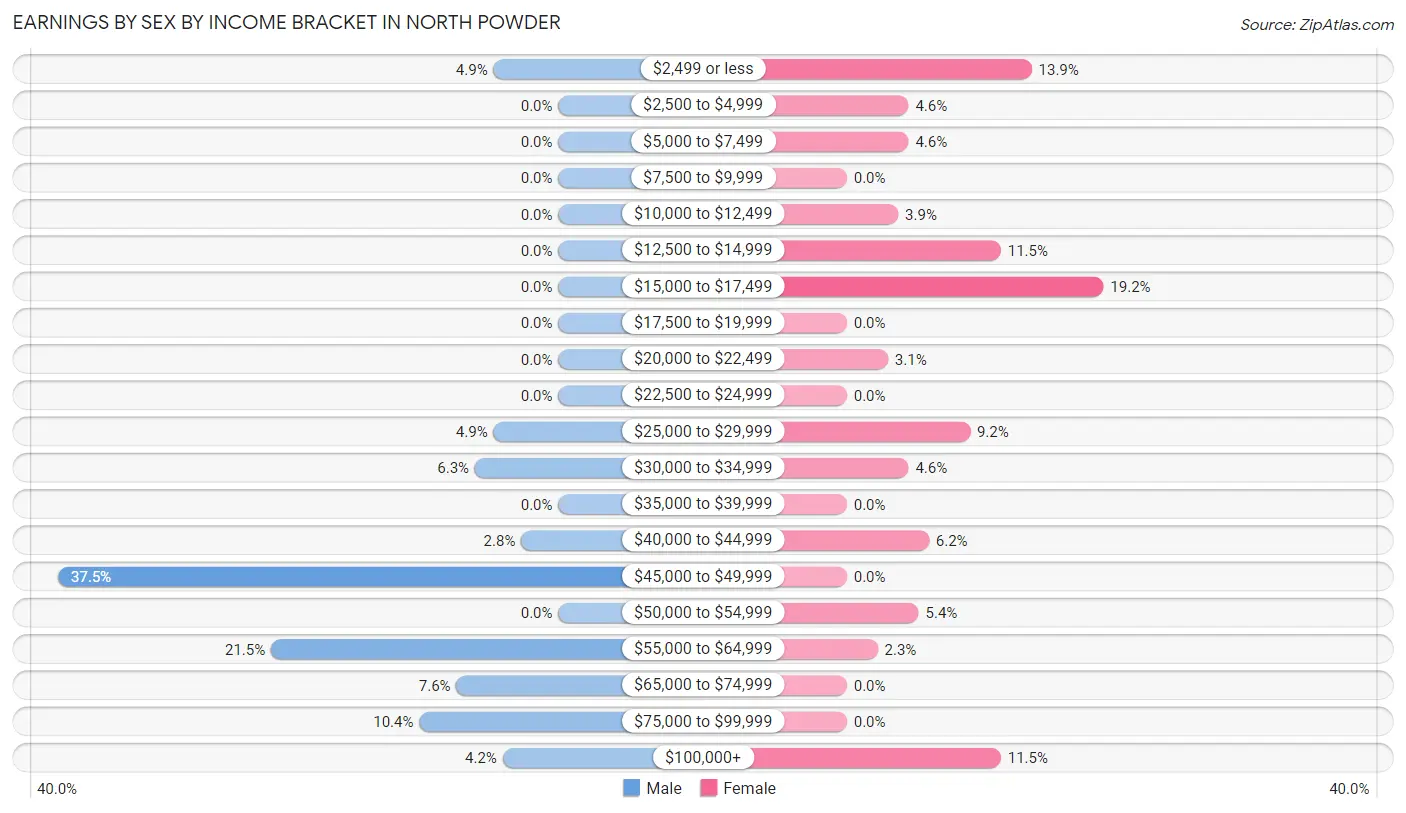
| Income | Male | Female |
| $2,499 or less | 7 (4.9%) | 18 (13.9%) |
| $2,500 to $4,999 | 0 (0.0%) | 6 (4.6%) |
| $5,000 to $7,499 | 0 (0.0%) | 6 (4.6%) |
| $7,500 to $9,999 | 0 (0.0%) | 0 (0.0%) |
| $10,000 to $12,499 | 0 (0.0%) | 5 (3.8%) |
| $12,500 to $14,999 | 0 (0.0%) | 15 (11.5%) |
| $15,000 to $17,499 | 0 (0.0%) | 25 (19.2%) |
| $17,500 to $19,999 | 0 (0.0%) | 0 (0.0%) |
| $20,000 to $22,499 | 0 (0.0%) | 4 (3.1%) |
| $22,500 to $24,999 | 0 (0.0%) | 0 (0.0%) |
| $25,000 to $29,999 | 7 (4.9%) | 12 (9.2%) |
| $30,000 to $34,999 | 9 (6.2%) | 6 (4.6%) |
| $35,000 to $39,999 | 0 (0.0%) | 0 (0.0%) |
| $40,000 to $44,999 | 4 (2.8%) | 8 (6.1%) |
| $45,000 to $49,999 | 54 (37.5%) | 0 (0.0%) |
| $50,000 to $54,999 | 0 (0.0%) | 7 (5.4%) |
| $55,000 to $64,999 | 31 (21.5%) | 3 (2.3%) |
| $65,000 to $74,999 | 11 (7.6%) | 0 (0.0%) |
| $75,000 to $99,999 | 15 (10.4%) | 0 (0.0%) |
| $100,000+ | 6 (4.2%) | 15 (11.5%) |
| Total | 144 (100.0%) | 130 (100.0%) |
Earnings by Sex by Educational Attainment in North Powder
Average earnings in North Powder are $47,083 for men and $17,100 for women, a difference of 63.7%. Men with an educational attainment of less than high school enjoy the highest average annual earnings of $61,250, while those with college or associate's degree education earn the least with $46,528. Women with an educational attainment of high school diploma earn the most with the average annual earnings of $14,531, while those with high school diploma education have the smallest earnings of $14,531.
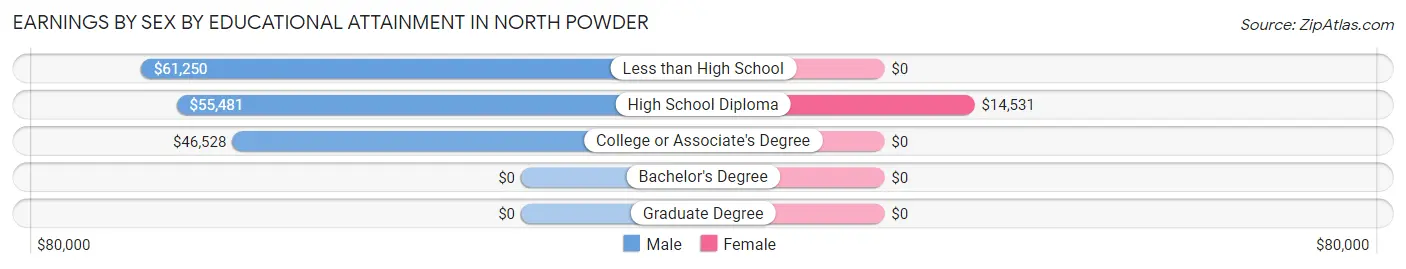
| Educational Attainment | Male Income | Female Income |
| Less than High School | $61,250 | $0 |
| High School Diploma | $55,481 | $14,531 |
| College or Associate's Degree | $46,528 | $0 |
| Bachelor's Degree | - | - |
| Graduate Degree | - | - |
| Total | $47,083 | $17,100 |
Family Income in North Powder
Family Income Brackets in North Powder
According to the North Powder family income data, there are 63 families falling into the $75,000 to $99,999 income range, which is the most common income bracket and makes up 30.1% of all families.
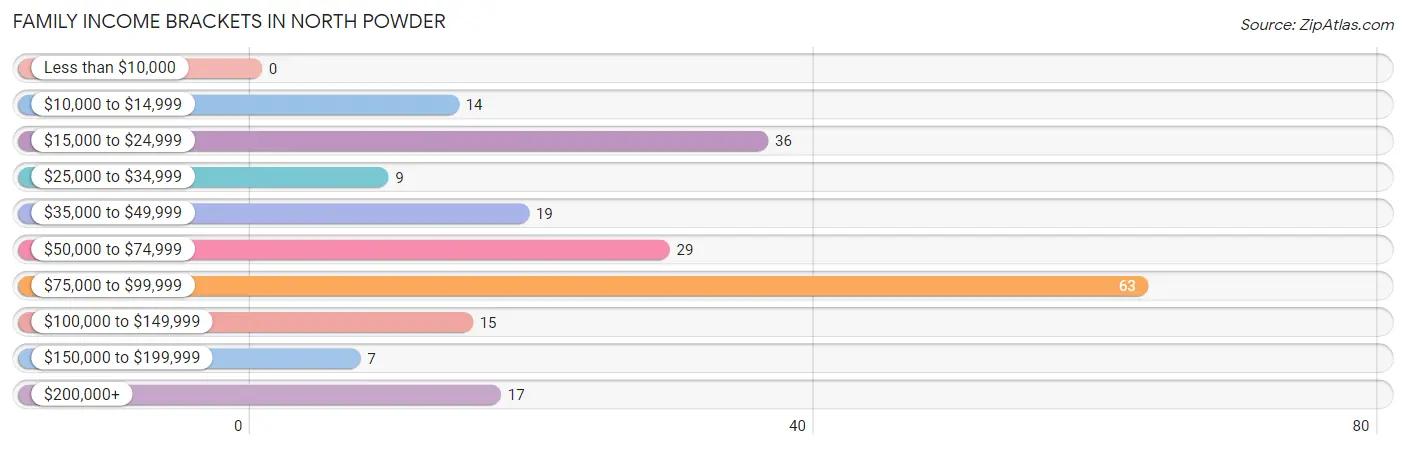
| Income Bracket | # Families | % Families |
| Less than $10,000 | 0 | 0.0% |
| $10,000 to $14,999 | 14 | 6.7% |
| $15,000 to $24,999 | 36 | 17.2% |
| $25,000 to $34,999 | 9 | 4.3% |
| $35,000 to $49,999 | 19 | 9.1% |
| $50,000 to $74,999 | 29 | 13.9% |
| $75,000 to $99,999 | 63 | 30.1% |
| $100,000 to $149,999 | 15 | 7.2% |
| $150,000 to $199,999 | 7 | 3.3% |
| $200,000+ | 17 | 8.1% |
Family Income by Famaliy Size in North Powder
4-person families (35 | 16.8%) account for the highest median family income in North Powder with $105,694 per family, while 4-person families (35 | 16.8%) have the highest median income of $26,424 per family member.
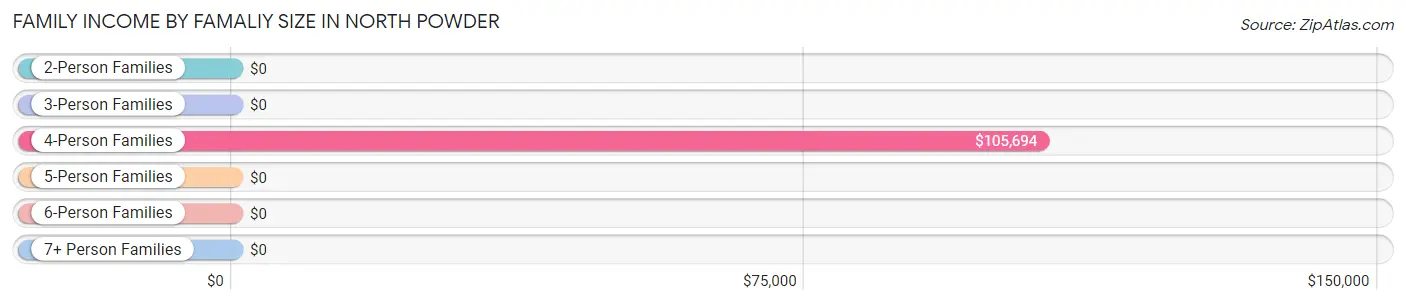
| Income Bracket | # Families | Median Income |
| 2-Person Families | 105 (50.2%) | $0 |
| 3-Person Families | 9 (4.3%) | $0 |
| 4-Person Families | 35 (16.8%) | $105,694 |
| 5-Person Families | 0 (0.0%) | $0 |
| 6-Person Families | 6 (2.9%) | $0 |
| 7+ Person Families | 54 (25.8%) | $0 |
| Total | 209 (100.0%) | $74,306 |
Family Income by Number of Earners in North Powder
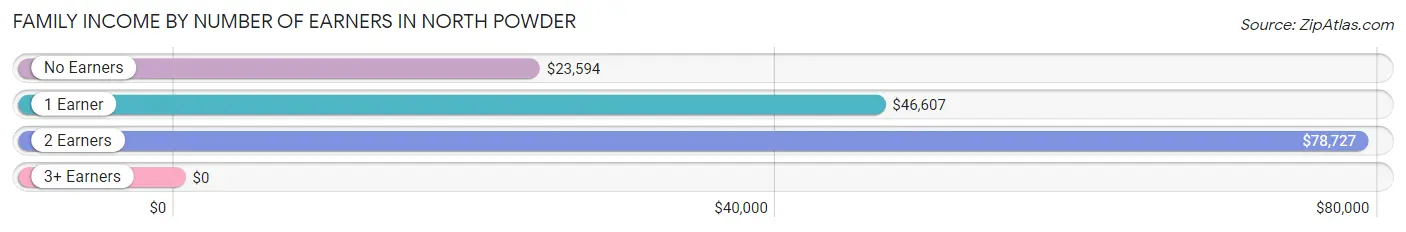
| Number of Earners | # Families | Median Income |
| No Earners | 61 (29.2%) | $23,594 |
| 1 Earner | 25 (12.0%) | $46,607 |
| 2 Earners | 107 (51.2%) | $78,727 |
| 3+ Earners | 16 (7.7%) | $0 |
| Total | 209 (100.0%) | $74,306 |
Household Income in North Powder
Household Income Brackets in North Powder
With 63 households falling in the category, the $75,000 to $99,999 income range is the most frequent in North Powder, accounting for 24.4% of all households. In contrast, only 7 households (2.7%) fall into the $150,000 to $199,999 income bracket, making it the least populous group.
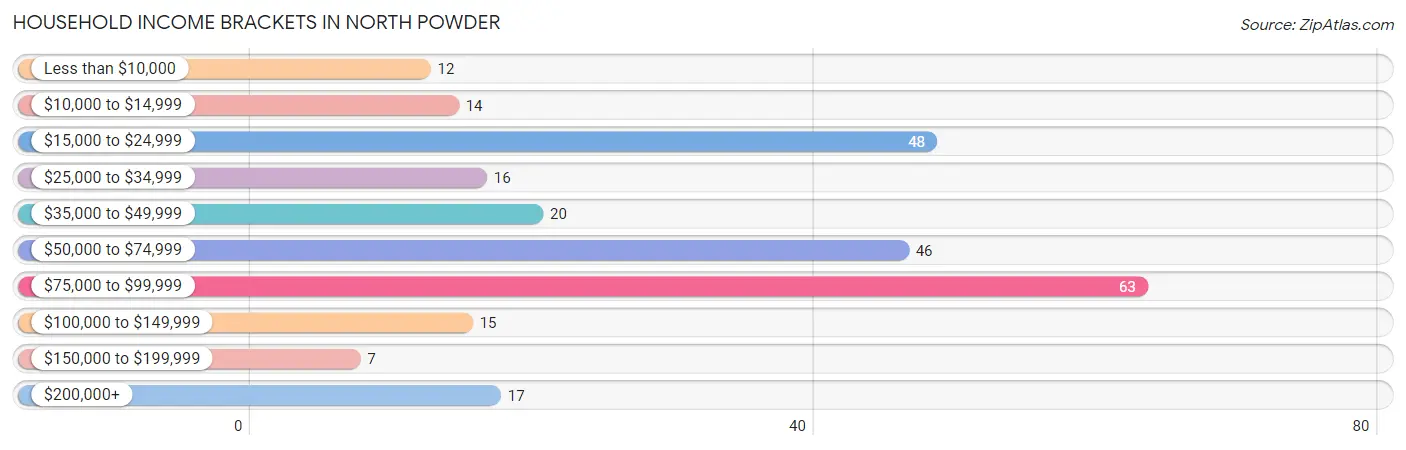
| Income Bracket | # Households | % Households |
| Less than $10,000 | 12 | 4.7% |
| $10,000 to $14,999 | 14 | 5.4% |
| $15,000 to $24,999 | 48 | 18.6% |
| $25,000 to $34,999 | 16 | 6.2% |
| $35,000 to $49,999 | 20 | 7.8% |
| $50,000 to $74,999 | 46 | 17.8% |
| $75,000 to $99,999 | 63 | 24.4% |
| $100,000 to $149,999 | 15 | 5.8% |
| $150,000 to $199,999 | 7 | 2.7% |
| $200,000+ | 17 | 6.6% |
Household Income by Householder Age in North Powder
The median household income in North Powder is $64,583, with the highest median household income of $78,380 found in the 25 to 44 years age bracket for the primary householder. A total of 92 households (35.7%) fall into this category.
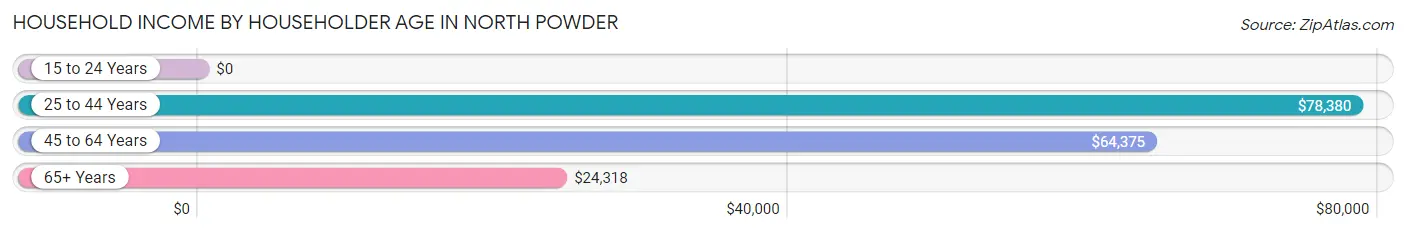
| Income Bracket | # Households | Median Income |
| 15 to 24 Years | 0 (0.0%) | $0 |
| 25 to 44 Years | 92 (35.7%) | $78,380 |
| 45 to 64 Years | 88 (34.1%) | $64,375 |
| 65+ Years | 78 (30.2%) | $24,318 |
| Total | 258 (100.0%) | $64,583 |
Poverty in North Powder
Income Below Poverty by Sex and Age in North Powder
With 11.5% poverty level for males and 19.5% for females among the residents of North Powder, 5 year old males and under 5 year old females are the most vulnerable to poverty, with 6 males (100.0%) and 12 females (80.0%) in their respective age groups living below the poverty level.
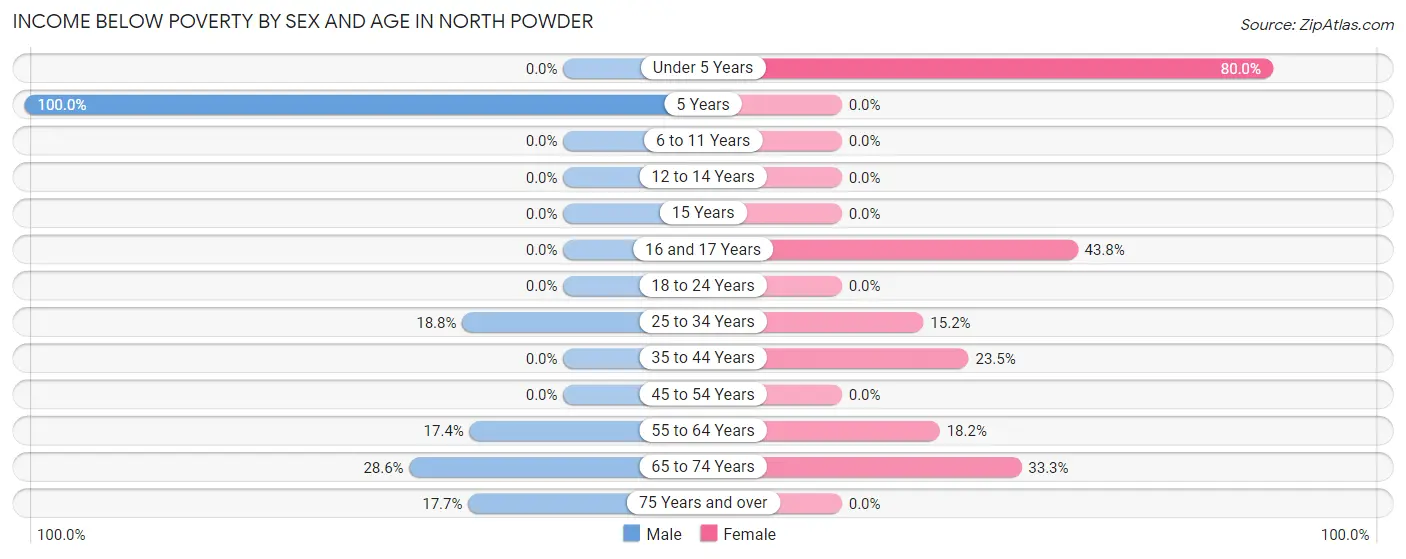
| Age Bracket | Male | Female |
| Under 5 Years | 0 (0.0%) | 12 (80.0%) |
| 5 Years | 6 (100.0%) | 0 (0.0%) |
| 6 to 11 Years | 0 (0.0%) | 0 (0.0%) |
| 12 to 14 Years | 0 (0.0%) | 0 (0.0%) |
| 15 Years | 0 (0.0%) | 0 (0.0%) |
| 16 and 17 Years | 0 (0.0%) | 14 (43.8%) |
| 18 to 24 Years | 0 (0.0%) | 0 (0.0%) |
| 25 to 34 Years | 6 (18.8%) | 5 (15.1%) |
| 35 to 44 Years | 0 (0.0%) | 8 (23.5%) |
| 45 to 54 Years | 0 (0.0%) | 0 (0.0%) |
| 55 to 64 Years | 8 (17.4%) | 12 (18.2%) |
| 65 to 74 Years | 12 (28.6%) | 13 (33.3%) |
| 75 Years and over | 6 (17.6%) | 0 (0.0%) |
| Total | 38 (11.5%) | 64 (19.5%) |
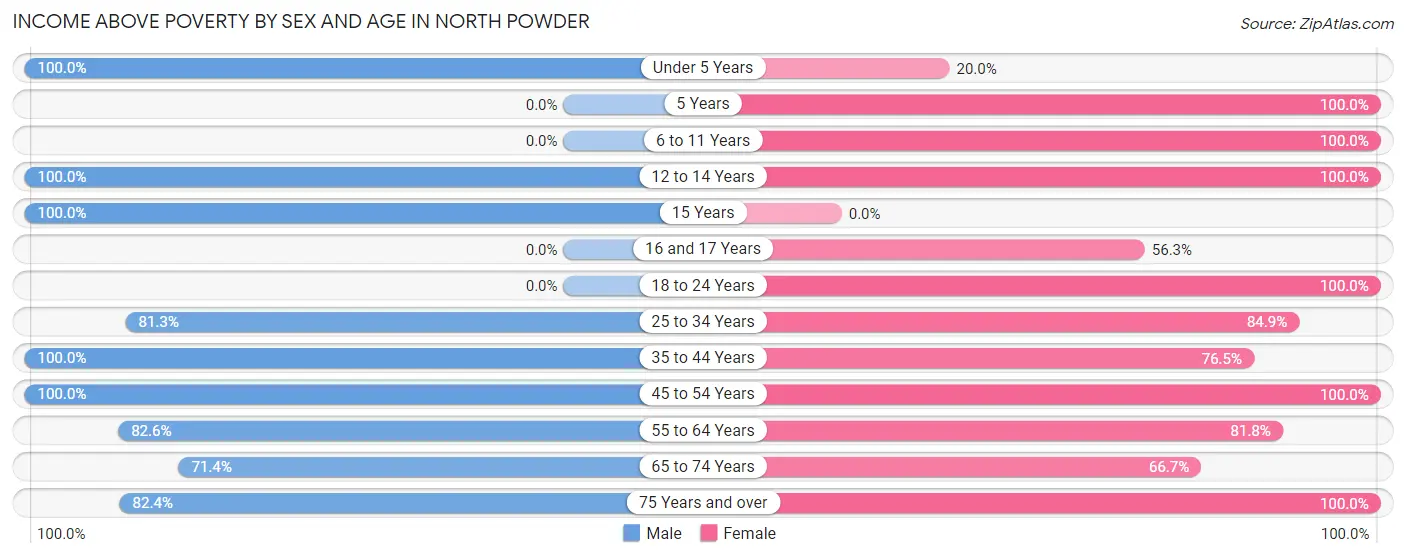
Income Above Poverty by Sex and Age in North Powder
According to the poverty statistics in North Powder, males aged under 5 years and females aged 5 years are the age groups that are most secure financially, with 100.0% of males and 100.0% of females in these age groups living above the poverty line.
| Age Bracket | Male | Female |
| Under 5 Years | 20 (100.0%) | 3 (20.0%) |
| 5 Years | 0 (0.0%) | 31 (100.0%) |
| 6 to 11 Years | 0 (0.0%) | 21 (100.0%) |
| 12 to 14 Years | 27 (100.0%) | 19 (100.0%) |
| 15 Years | 35 (100.0%) | 0 (0.0%) |
| 16 and 17 Years | 0 (0.0%) | 18 (56.2%) |
| 18 to 24 Years | 0 (0.0%) | 6 (100.0%) |
| 25 to 34 Years | 26 (81.2%) | 28 (84.9%) |
| 35 to 44 Years | 65 (100.0%) | 26 (76.5%) |
| 45 to 54 Years | 23 (100.0%) | 16 (100.0%) |
| 55 to 64 Years | 38 (82.6%) | 54 (81.8%) |
| 65 to 74 Years | 30 (71.4%) | 26 (66.7%) |
| 75 Years and over | 28 (82.4%) | 16 (100.0%) |
| Total | 292 (88.5%) | 264 (80.5%) |
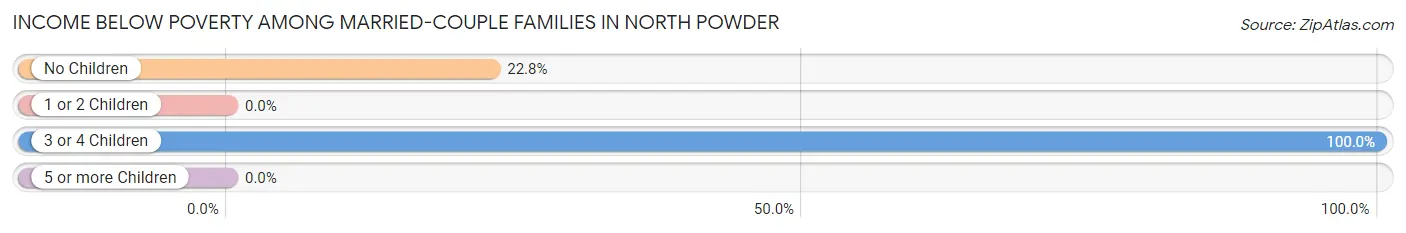
Income Below Poverty Among Married-Couple Families in North Powder
The poverty statistics for married-couple families in North Powder show that 15.2% or 27 of the total 178 families live below the poverty line. Families with 3 or 4 children have the highest poverty rate of 100.0%, comprising of 6 families. On the other hand, families with 1 or 2 children have the lowest poverty rate of 0.0%, which includes 0 families.
| Children | Above Poverty | Below Poverty |
| No Children | 71 (77.2%) | 21 (22.8%) |
| 1 or 2 Children | 26 (100.0%) | 0 (0.0%) |
| 3 or 4 Children | 0 (0.0%) | 6 (100.0%) |
| 5 or more Children | 54 (100.0%) | 0 (0.0%) |
| Total | 151 (84.8%) | 27 (15.2%) |
Income Below Poverty Among Single-Parent Households in North Powder
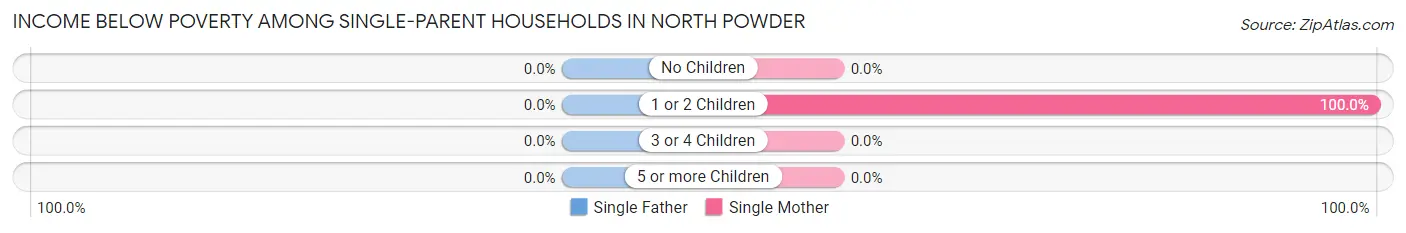
| Children | Single Father | Single Mother |
| No Children | 0 (0.0%) | 0 (0.0%) |
| 1 or 2 Children | 0 (0.0%) | 8 (100.0%) |
| 3 or 4 Children | 0 (0.0%) | 0 (0.0%) |
| 5 or more Children | 0 (0.0%) | 0 (0.0%) |
| Total | 0 (0.0%) | 8 (27.6%) |
Income Below Poverty Among Married-Couple vs Single-Parent Households in North Powder
The poverty data for North Powder shows that 27 of the married-couple family households (15.2%) and 8 of the single-parent households (25.8%) are living below the poverty level. Within the married-couple family households, those with 3 or 4 children have the highest poverty rate, with 6 households (100.0%) falling below the poverty line. Among the single-parent households, those with 1 or 2 children have the highest poverty rate, with 8 household (100.0%) living below poverty.
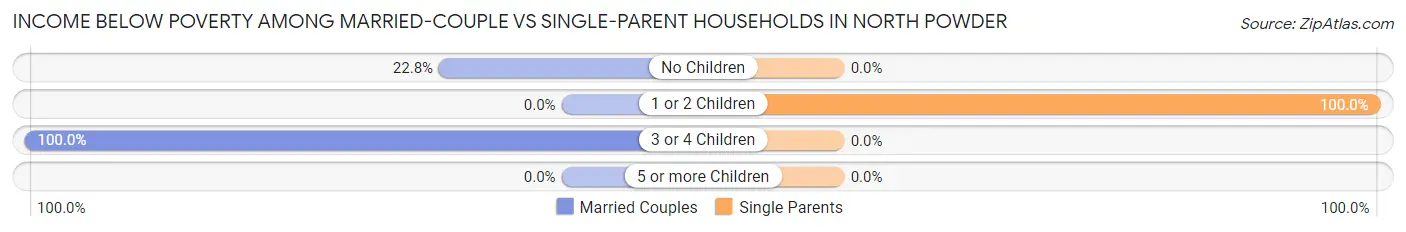
| Children | Married-Couple Families | Single-Parent Households |
| No Children | 21 (22.8%) | 0 (0.0%) |
| 1 or 2 Children | 0 (0.0%) | 8 (100.0%) |
| 3 or 4 Children | 6 (100.0%) | 0 (0.0%) |
| 5 or more Children | 0 (0.0%) | 0 (0.0%) |
| Total | 27 (15.2%) | 8 (25.8%) |
Employment Characteristics in North Powder
Employment by Class of Employer in North Powder
Among the 226 employed individuals in North Powder, private company employees (176 | 77.9%), self-employed (not incorporated) (20 | 8.8%), and state government employees (20 | 8.8%) make up the most common classes of employment.
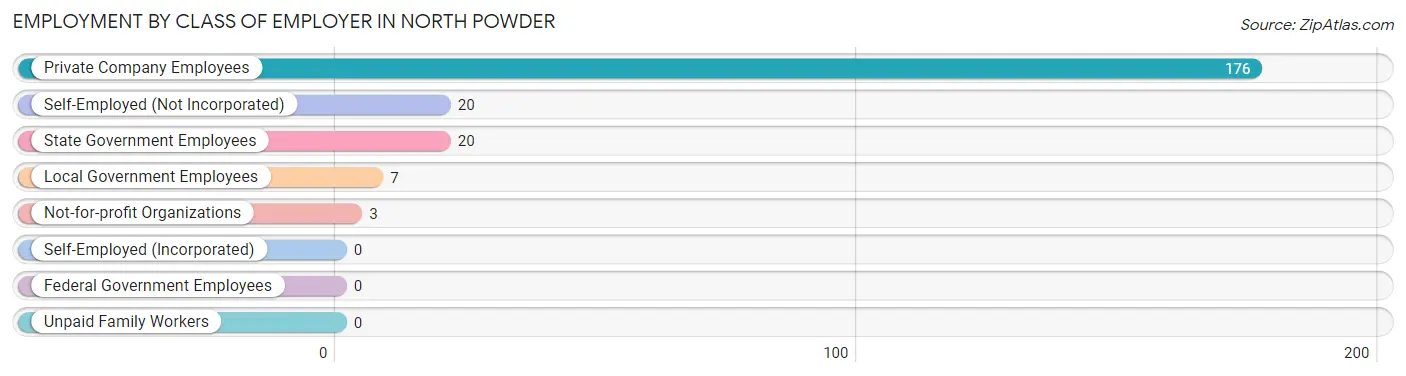
| Employer Class | # Employees | % Employees |
| Private Company Employees | 176 | 77.9% |
| Self-Employed (Incorporated) | 0 | 0.0% |
| Self-Employed (Not Incorporated) | 20 | 8.8% |
| Not-for-profit Organizations | 3 | 1.3% |
| Local Government Employees | 7 | 3.1% |
| State Government Employees | 20 | 8.8% |
| Federal Government Employees | 0 | 0.0% |
| Unpaid Family Workers | 0 | 0.0% |
| Total | 226 | 100.0% |
Employment Status by Age in North Powder
According to the labor force statistics for North Powder, out of the total population over 16 years of age (484), 52.1% or 252 individuals are in the labor force, with 3.2% or 8 of them unemployed. The age group with the highest labor force participation rate is 20 to 24 years, with 100.0% or 6 individuals in the labor force. Within the labor force, the 60 to 64 years age range has the highest percentage of unemployed individuals, with 21.1% or 8 of them being unemployed.
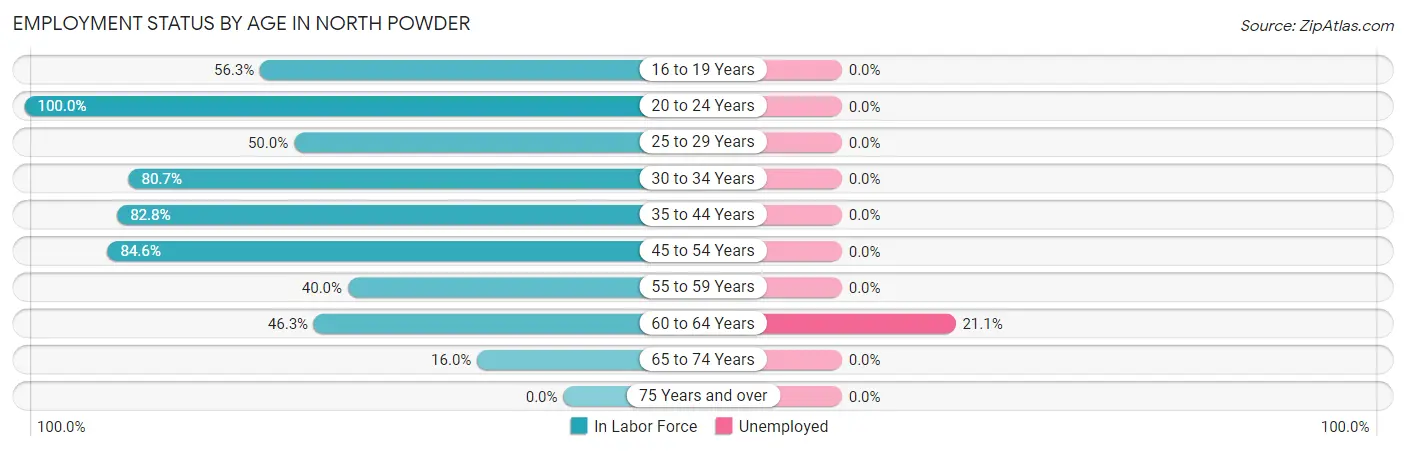
| Age Bracket | In Labor Force | Unemployed |
| 16 to 19 Years | 18 (56.3%) | 0 (0.0%) |
| 20 to 24 Years | 6 (100.0%) | 0 (0.0%) |
| 25 to 29 Years | 4 (50.0%) | 0 (0.0%) |
| 30 to 34 Years | 46 (80.7%) | 0 (0.0%) |
| 35 to 44 Years | 82 (82.8%) | 0 (0.0%) |
| 45 to 54 Years | 33 (84.6%) | 0 (0.0%) |
| 55 to 59 Years | 12 (40.0%) | 0 (0.0%) |
| 60 to 64 Years | 38 (46.3%) | 8 (21.1%) |
| 65 to 74 Years | 13 (16.0%) | 0 (0.0%) |
| 75 Years and over | 0 (0.0%) | 0 (0.0%) |
| Total | 252 (52.1%) | 8 (3.2%) |
Employment Status by Educational Attainment in North Powder
According to labor force statistics for North Powder, 68.3% of individuals (215) out of the total population between 25 and 64 years of age (315) are in the labor force, with 3.7% or 8 of them being unemployed. The group with the highest labor force participation rate are those with the educational attainment of college / associate degree, with 75.7% or 106 individuals in the labor force. Within the labor force, individuals with less than high school education have the highest percentage of unemployment, with 25.0% or 8 of them being unemployed.
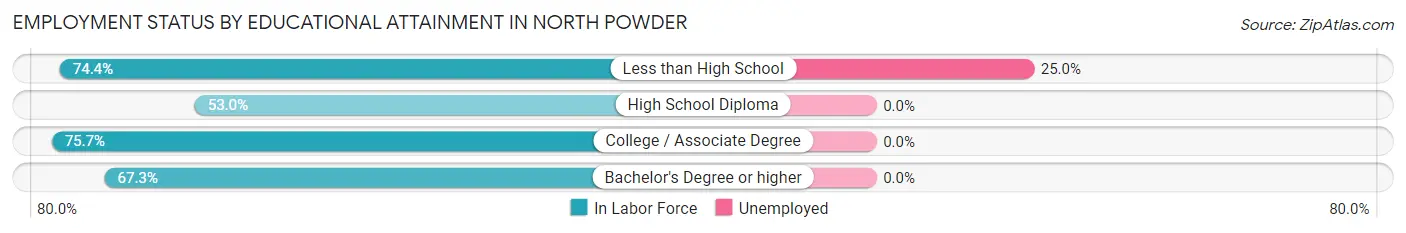
| Educational Attainment | In Labor Force | Unemployed |
| Less than High School | 32 (74.4%) | 11 (25.0%) |
| High School Diploma | 44 (53.0%) | 0 (0.0%) |
| College / Associate Degree | 106 (75.7%) | 0 (0.0%) |
| Bachelor's Degree or higher | 33 (67.3%) | 0 (0.0%) |
| Total | 215 (68.3%) | 12 (3.7%) |
Employment Occupations by Sex in North Powder
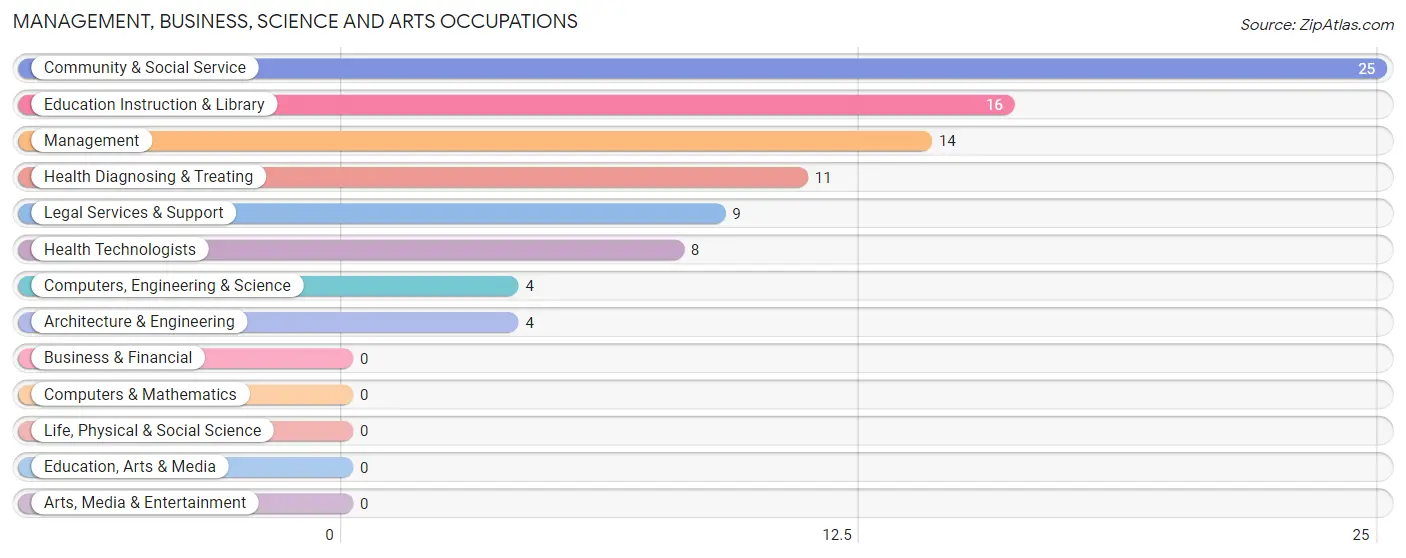
Management, Business, Science and Arts Occupations
The most common Management, Business, Science and Arts occupations in North Powder are Community & Social Service (25 | 10.2%), Education Instruction & Library (16 | 6.6%), Management (14 | 5.7%), Health Diagnosing & Treating (11 | 4.5%), and Legal Services & Support (9 | 3.7%).
Management, Business, Science and Arts Occupations by Sex
Within the Management, Business, Science and Arts occupations in North Powder, the most male-oriented occupations are Management (100.0%), Computers, Engineering & Science (100.0%), and Architecture & Engineering (100.0%), while the most female-oriented occupations are Community & Social Service (100.0%), Legal Services & Support (100.0%), and Education Instruction & Library (100.0%).
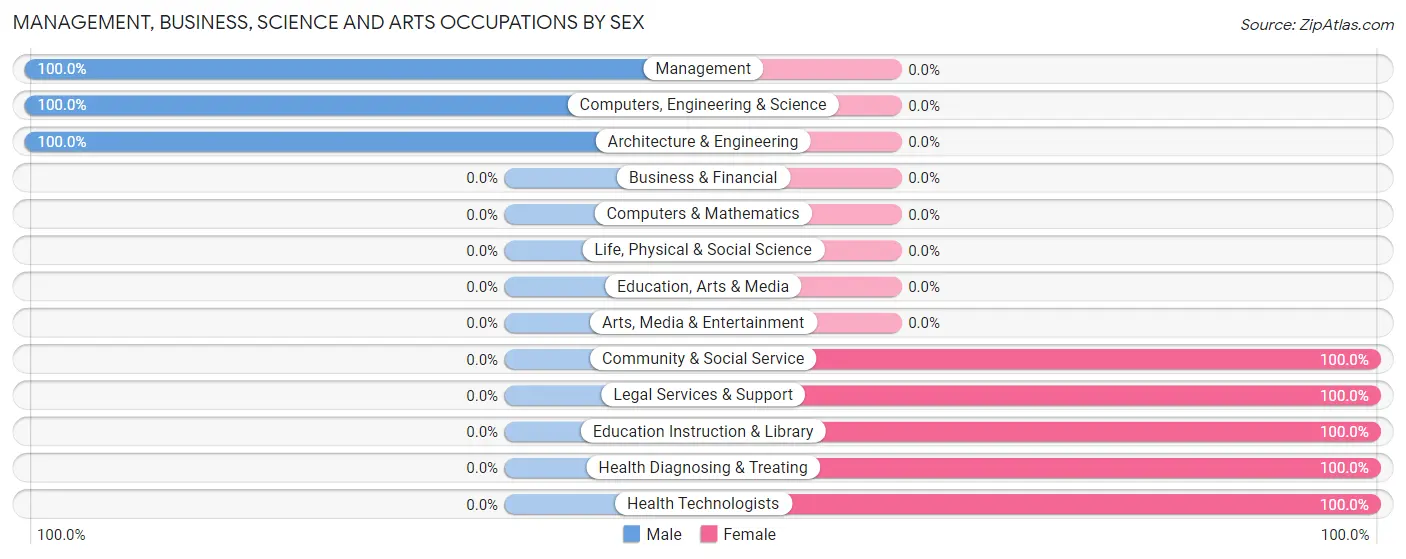
| Occupation | Male | Female |
| Management | 14 (100.0%) | 0 (0.0%) |
| Business & Financial | 0 (0.0%) | 0 (0.0%) |
| Computers, Engineering & Science | 4 (100.0%) | 0 (0.0%) |
| Computers & Mathematics | 0 (0.0%) | 0 (0.0%) |
| Architecture & Engineering | 4 (100.0%) | 0 (0.0%) |
| Life, Physical & Social Science | 0 (0.0%) | 0 (0.0%) |
| Community & Social Service | 0 (0.0%) | 25 (100.0%) |
| Education, Arts & Media | 0 (0.0%) | 0 (0.0%) |
| Legal Services & Support | 0 (0.0%) | 9 (100.0%) |
| Education Instruction & Library | 0 (0.0%) | 16 (100.0%) |
| Arts, Media & Entertainment | 0 (0.0%) | 0 (0.0%) |
| Health Diagnosing & Treating | 0 (0.0%) | 11 (100.0%) |
| Health Technologists | 0 (0.0%) | 8 (100.0%) |
| Total (Category) | 18 (33.3%) | 36 (66.7%) |
| Total (Overall) | 131 (53.7%) | 113 (46.3%) |
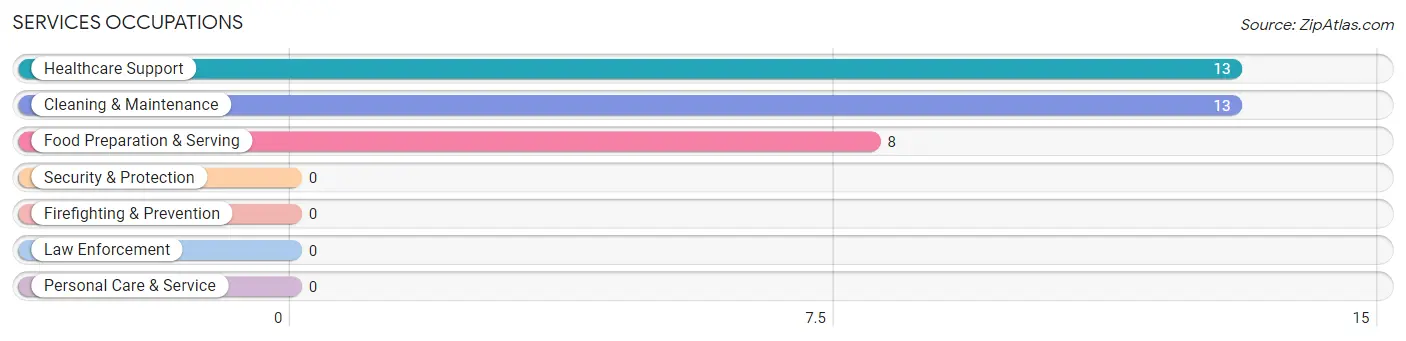
Services Occupations
The most common Services occupations in North Powder are Healthcare Support (13 | 5.3%), Cleaning & Maintenance (13 | 5.3%), and Food Preparation & Serving (8 | 3.3%).
Services Occupations by Sex
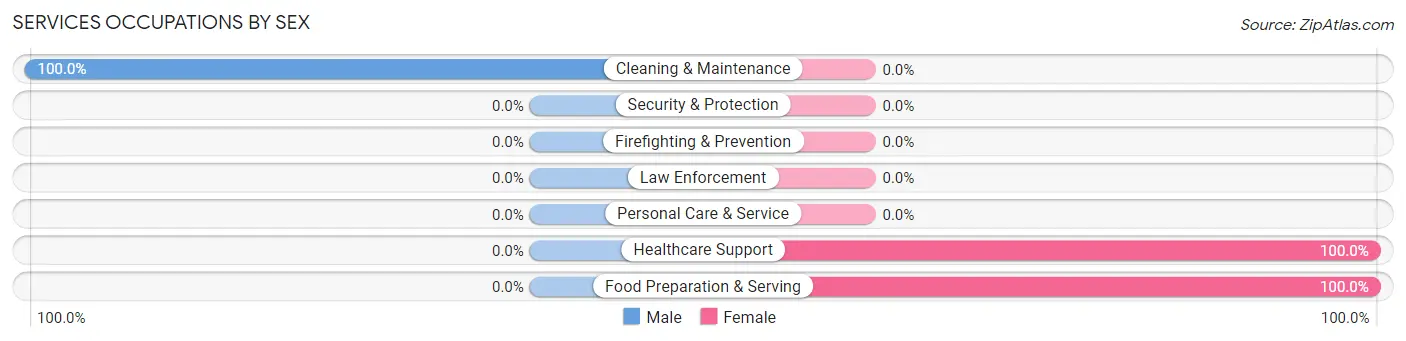
| Occupation | Male | Female |
| Healthcare Support | 0 (0.0%) | 13 (100.0%) |
| Security & Protection | 0 (0.0%) | 0 (0.0%) |
| Firefighting & Prevention | 0 (0.0%) | 0 (0.0%) |
| Law Enforcement | 0 (0.0%) | 0 (0.0%) |
| Food Preparation & Serving | 0 (0.0%) | 8 (100.0%) |
| Cleaning & Maintenance | 13 (100.0%) | 0 (0.0%) |
| Personal Care & Service | 0 (0.0%) | 0 (0.0%) |
| Total (Category) | 13 (38.2%) | 21 (61.8%) |
| Total (Overall) | 131 (53.7%) | 113 (46.3%) |
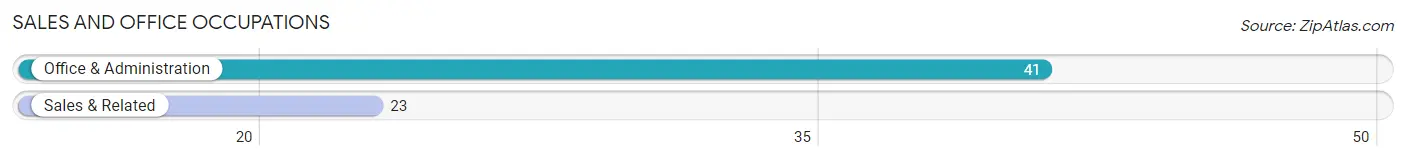
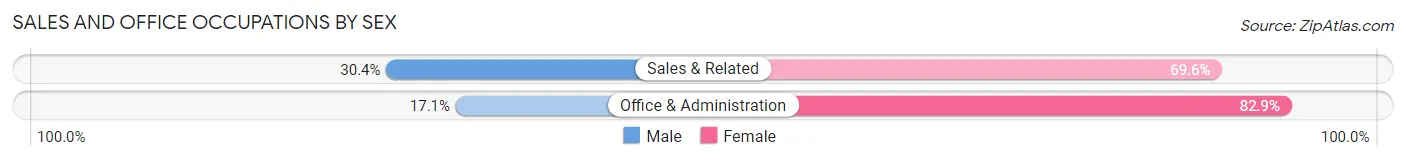
Sales and Office Occupations
The most common Sales and Office occupations in North Powder are Office & Administration (41 | 16.8%), and Sales & Related (23 | 9.4%).
Sales and Office Occupations by Sex
| Occupation | Male | Female |
| Sales & Related | 7 (30.4%) | 16 (69.6%) |
| Office & Administration | 7 (17.1%) | 34 (82.9%) |
| Total (Category) | 14 (21.9%) | 50 (78.1%) |
| Total (Overall) | 131 (53.7%) | 113 (46.3%) |
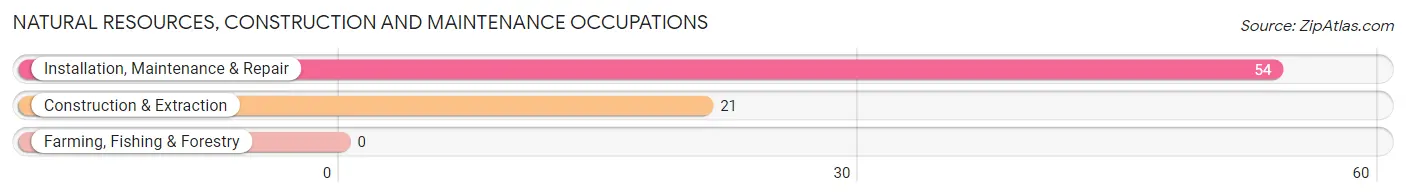
Natural Resources, Construction and Maintenance Occupations
The most common Natural Resources, Construction and Maintenance occupations in North Powder are Installation, Maintenance & Repair (54 | 22.1%), and Construction & Extraction (21 | 8.6%).
Natural Resources, Construction and Maintenance Occupations by Sex
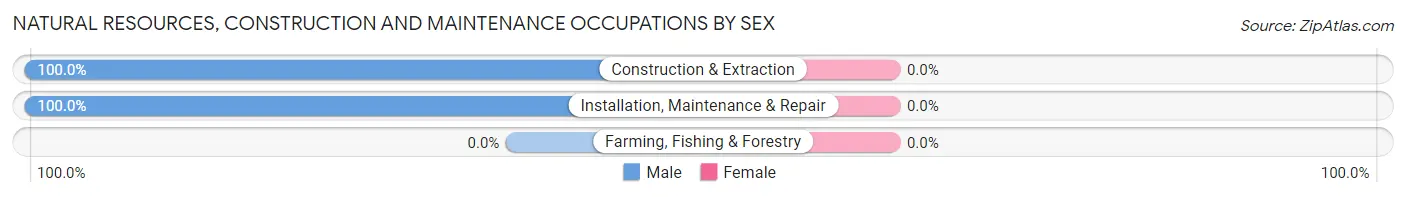
| Occupation | Male | Female |
| Farming, Fishing & Forestry | 0 (0.0%) | 0 (0.0%) |
| Construction & Extraction | 21 (100.0%) | 0 (0.0%) |
| Installation, Maintenance & Repair | 54 (100.0%) | 0 (0.0%) |
| Total (Category) | 75 (100.0%) | 0 (0.0%) |
| Total (Overall) | 131 (53.7%) | 113 (46.3%) |
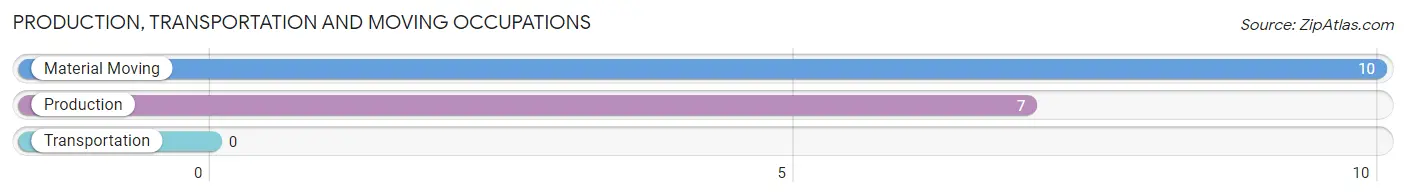
Production, Transportation and Moving Occupations
The most common Production, Transportation and Moving occupations in North Powder are Material Moving (10 | 4.1%), and Production (7 | 2.9%).
Production, Transportation and Moving Occupations by Sex
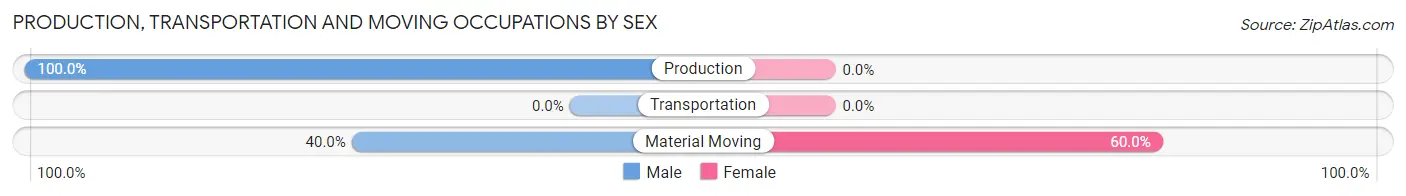
| Occupation | Male | Female |
| Production | 7 (100.0%) | 0 (0.0%) |
| Transportation | 0 (0.0%) | 0 (0.0%) |
| Material Moving | 4 (40.0%) | 6 (60.0%) |
| Total (Category) | 11 (64.7%) | 6 (35.3%) |
| Total (Overall) | 131 (53.7%) | 113 (46.3%) |
Employment Industries by Sex in North Powder
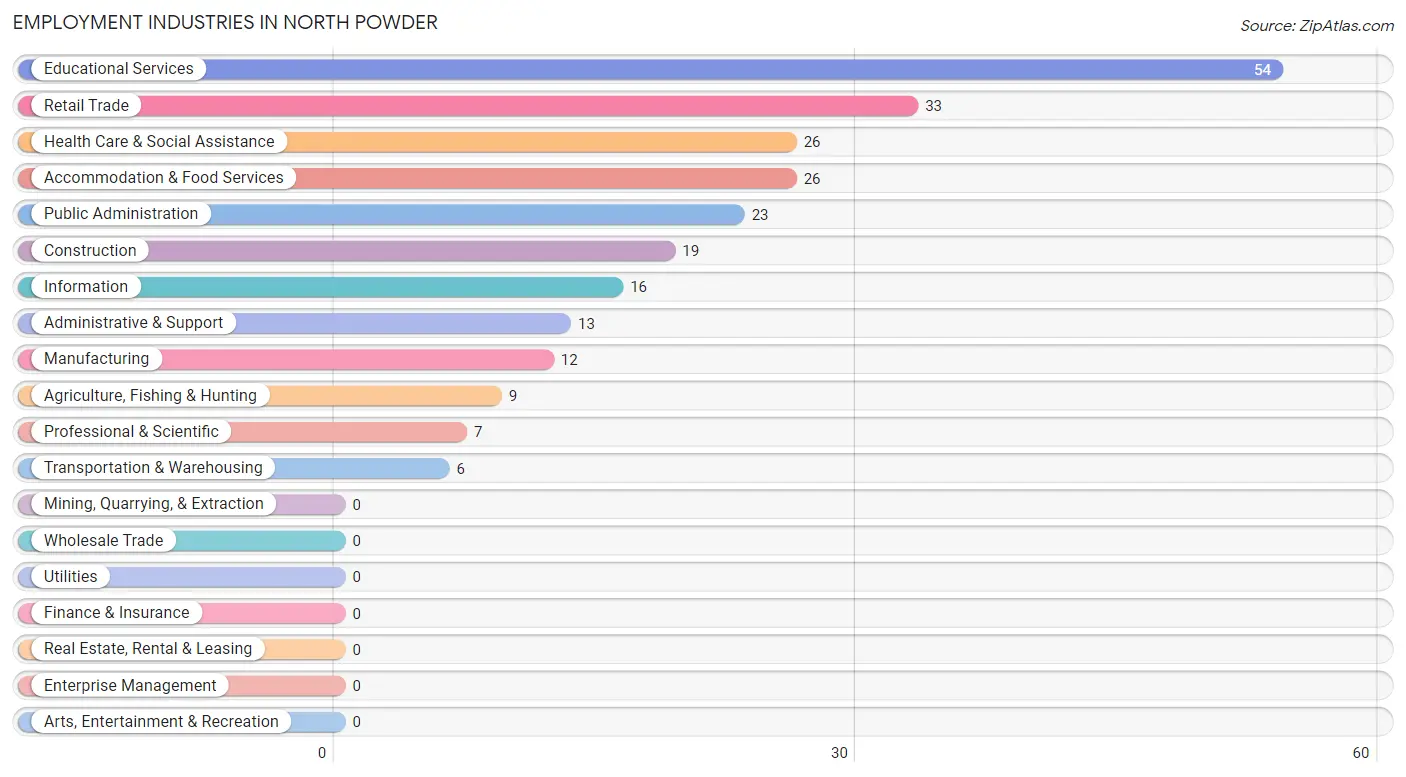
Employment Industries in North Powder
The major employment industries in North Powder include Educational Services (54 | 22.1%), Retail Trade (33 | 13.5%), Health Care & Social Assistance (26 | 10.7%), Accommodation & Food Services (26 | 10.7%), and Public Administration (23 | 9.4%).
Employment Industries by Sex in North Powder
The North Powder industries that see more men than women are Agriculture, Fishing & Hunting (100.0%), Construction (100.0%), and Manufacturing (100.0%), whereas the industries that tend to have a higher number of women are Information (100.0%), Health Care & Social Assistance (100.0%), and Accommodation & Food Services (100.0%).
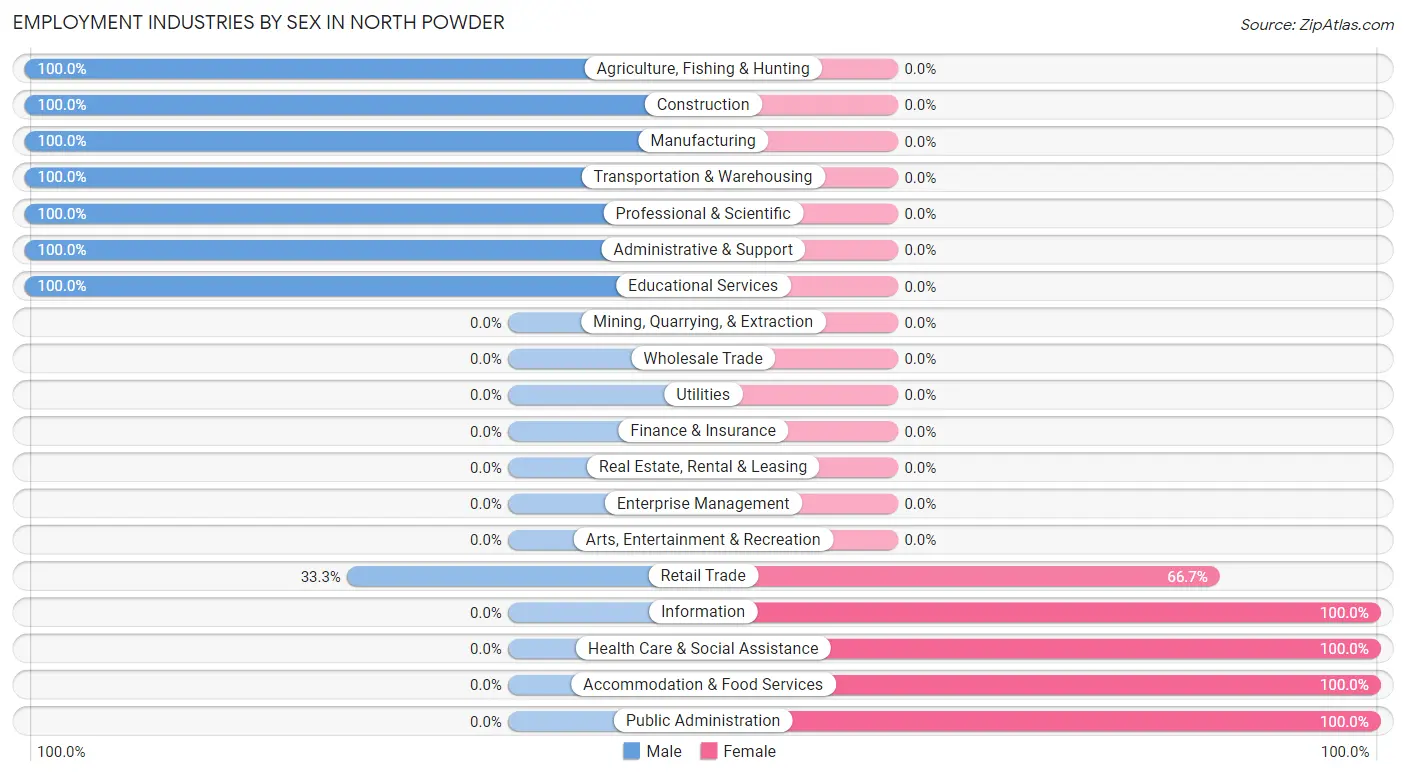
| Industry | Male | Female |
| Agriculture, Fishing & Hunting | 9 (100.0%) | 0 (0.0%) |
| Mining, Quarrying, & Extraction | 0 (0.0%) | 0 (0.0%) |
| Construction | 19 (100.0%) | 0 (0.0%) |
| Manufacturing | 12 (100.0%) | 0 (0.0%) |
| Wholesale Trade | 0 (0.0%) | 0 (0.0%) |
| Retail Trade | 11 (33.3%) | 22 (66.7%) |
| Transportation & Warehousing | 6 (100.0%) | 0 (0.0%) |
| Utilities | 0 (0.0%) | 0 (0.0%) |
| Information | 0 (0.0%) | 16 (100.0%) |
| Finance & Insurance | 0 (0.0%) | 0 (0.0%) |
| Real Estate, Rental & Leasing | 0 (0.0%) | 0 (0.0%) |
| Professional & Scientific | 7 (100.0%) | 0 (0.0%) |
| Enterprise Management | 0 (0.0%) | 0 (0.0%) |
| Administrative & Support | 13 (100.0%) | 0 (0.0%) |
| Educational Services | 54 (100.0%) | 0 (0.0%) |
| Health Care & Social Assistance | 0 (0.0%) | 26 (100.0%) |
| Arts, Entertainment & Recreation | 0 (0.0%) | 0 (0.0%) |
| Accommodation & Food Services | 0 (0.0%) | 26 (100.0%) |
| Public Administration | 0 (0.0%) | 23 (100.0%) |
| Total | 131 (53.7%) | 113 (46.3%) |
Education in North Powder
School Enrollment in North Powder
The most common levels of schooling among the 171 students in North Powder are middle school (102 | 59.7%), high school (32 | 18.7%), and nursery / preschool (31 | 18.1%).
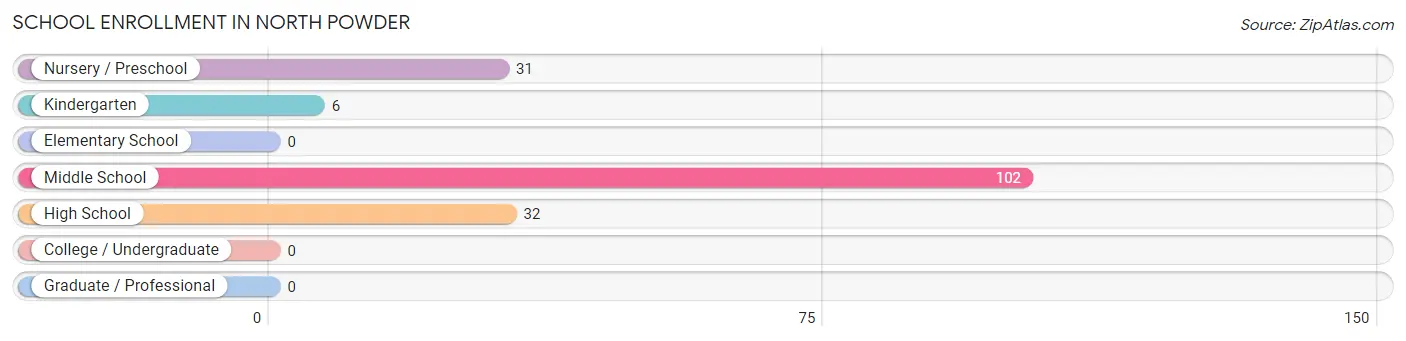
| School Level | # Students | % Students |
| Nursery / Preschool | 31 | 18.1% |
| Kindergarten | 6 | 3.5% |
| Elementary School | 0 | 0.0% |
| Middle School | 102 | 59.7% |
| High School | 32 | 18.7% |
| College / Undergraduate | 0 | 0.0% |
| Graduate / Professional | 0 | 0.0% |
| Total | 171 | 100.0% |
School Enrollment by Age by Funding Source in North Powder
Out of a total of 171 students who are enrolled in schools in North Powder, 10 (5.8%) attend a private institution, while the remaining 161 (94.2%) are enrolled in public schools. The age group of 5 to 9 year old has the highest likelihood of being enrolled in private schools, with 10 (27.0% in the age bracket) enrolled. Conversely, the age group of 10 to 14 year olds has the lowest likelihood of being enrolled in a private school, with 67 (100.0% in the age bracket) attending a public institution.
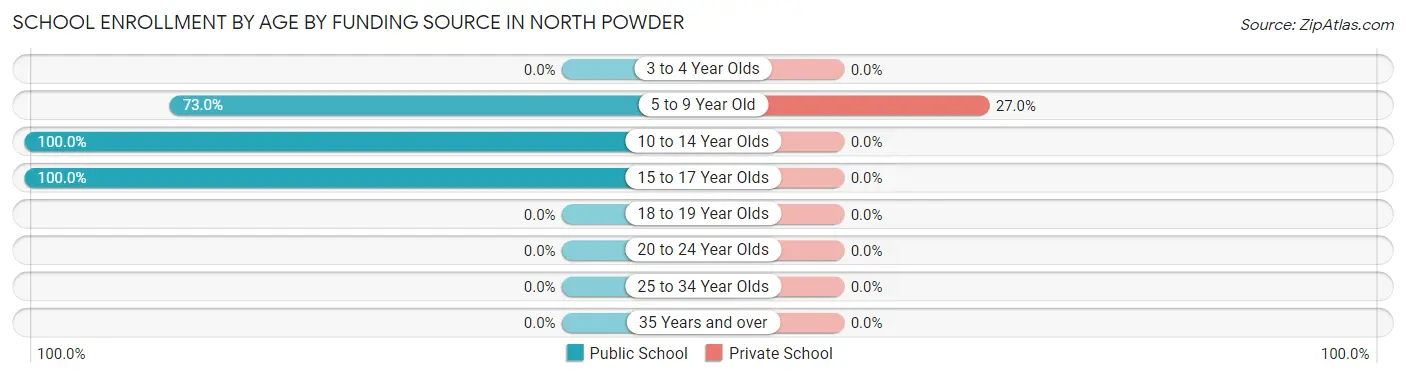
| Age Bracket | Public School | Private School |
| 3 to 4 Year Olds | 0 (0.0%) | 0 (0.0%) |
| 5 to 9 Year Old | 27 (73.0%) | 10 (27.0%) |
| 10 to 14 Year Olds | 67 (100.0%) | 0 (0.0%) |
| 15 to 17 Year Olds | 67 (100.0%) | 0 (0.0%) |
| 18 to 19 Year Olds | 0 (0.0%) | 0 (0.0%) |
| 20 to 24 Year Olds | 0 (0.0%) | 0 (0.0%) |
| 25 to 34 Year Olds | 0 (0.0%) | 0 (0.0%) |
| 35 Years and over | 0 (0.0%) | 0 (0.0%) |
| Total | 161 (94.2%) | 10 (5.8%) |
Educational Attainment by Field of Study in North Powder
Bio, nature & agricultural (15 | 24.6%), liberal arts & history (15 | 24.6%), social sciences (9 | 14.7%), business (8 | 13.1%), and psychology (6 | 9.8%) are the most common fields of study among 61 individuals in North Powder who have obtained a bachelor's degree or higher.
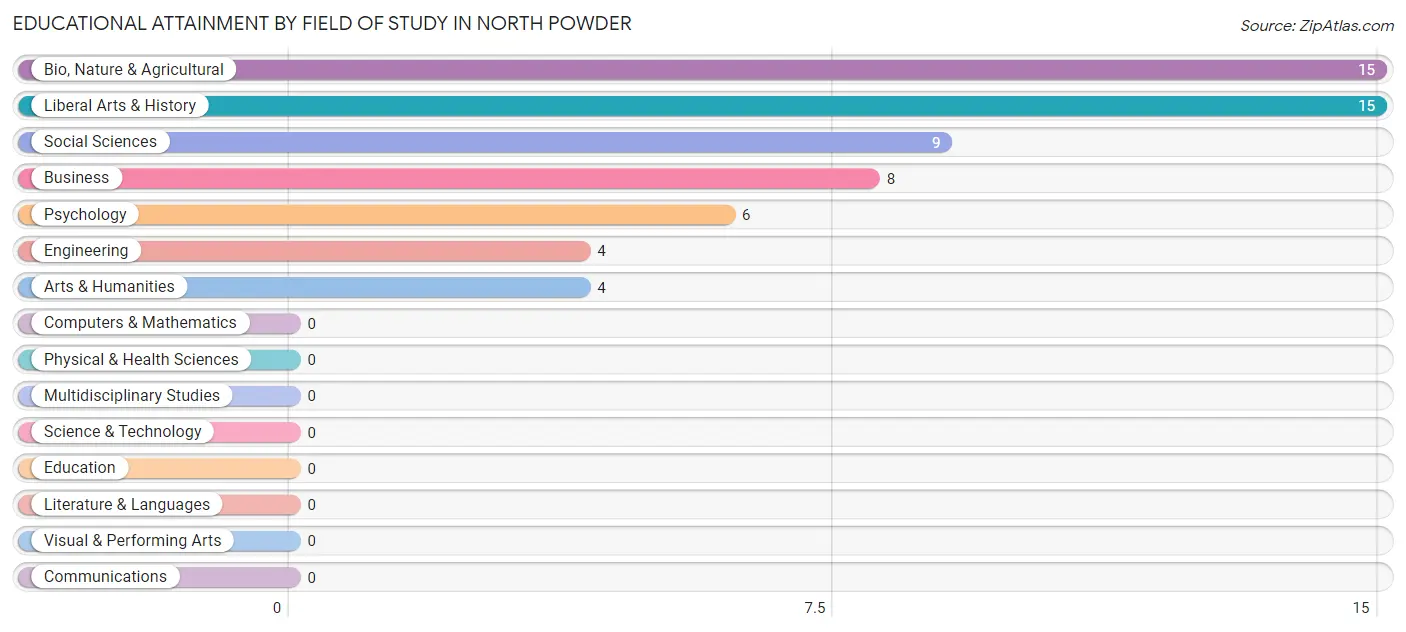
| Field of Study | # Graduates | % Graduates |
| Computers & Mathematics | 0 | 0.0% |
| Bio, Nature & Agricultural | 15 | 24.6% |
| Physical & Health Sciences | 0 | 0.0% |
| Psychology | 6 | 9.8% |
| Social Sciences | 9 | 14.7% |
| Engineering | 4 | 6.6% |
| Multidisciplinary Studies | 0 | 0.0% |
| Science & Technology | 0 | 0.0% |
| Business | 8 | 13.1% |
| Education | 0 | 0.0% |
| Literature & Languages | 0 | 0.0% |
| Liberal Arts & History | 15 | 24.6% |
| Visual & Performing Arts | 0 | 0.0% |
| Communications | 0 | 0.0% |
| Arts & Humanities | 4 | 6.6% |
| Total | 61 | 100.0% |
Transportation & Commute in North Powder
Vehicle Availability by Sex in North Powder
The most prevalent vehicle ownership categories in North Powder are males with 5 or more vehicles (54, accounting for 41.2%) and females with 5 or more vehicles (28, making up 56.8%).
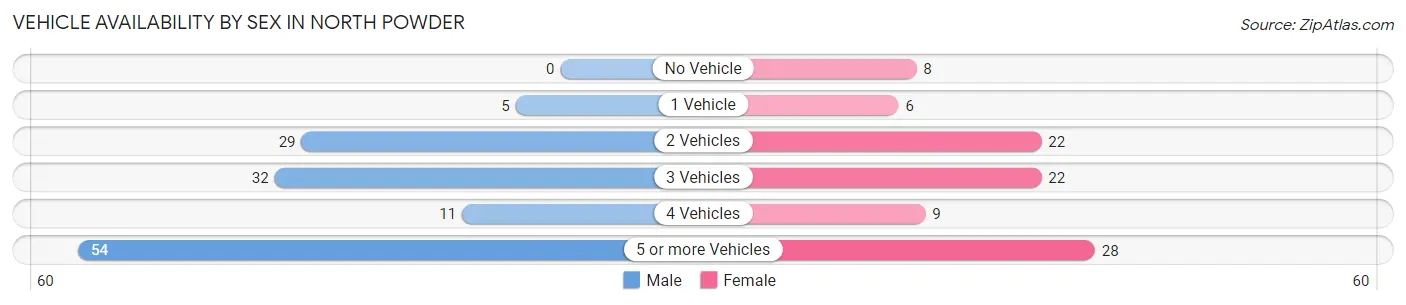
| Vehicles Available | Male | Female |
| No Vehicle | 0 (0.0%) | 8 (8.4%) |
| 1 Vehicle | 5 (3.8%) | 6 (6.3%) |
| 2 Vehicles | 29 (22.1%) | 22 (23.2%) |
| 3 Vehicles | 32 (24.4%) | 22 (23.2%) |
| 4 Vehicles | 11 (8.4%) | 9 (9.5%) |
| 5 or more Vehicles | 54 (41.2%) | 28 (29.5%) |
| Total | 131 (100.0%) | 95 (100.0%) |
Commute Time in North Powder
The most frequently occuring commute durations in North Powder are 5 to 9 minutes (85 commuters, 37.6%), 20 to 24 minutes (49 commuters, 21.7%), and 60 to 89 minutes (27 commuters, 11.9%).
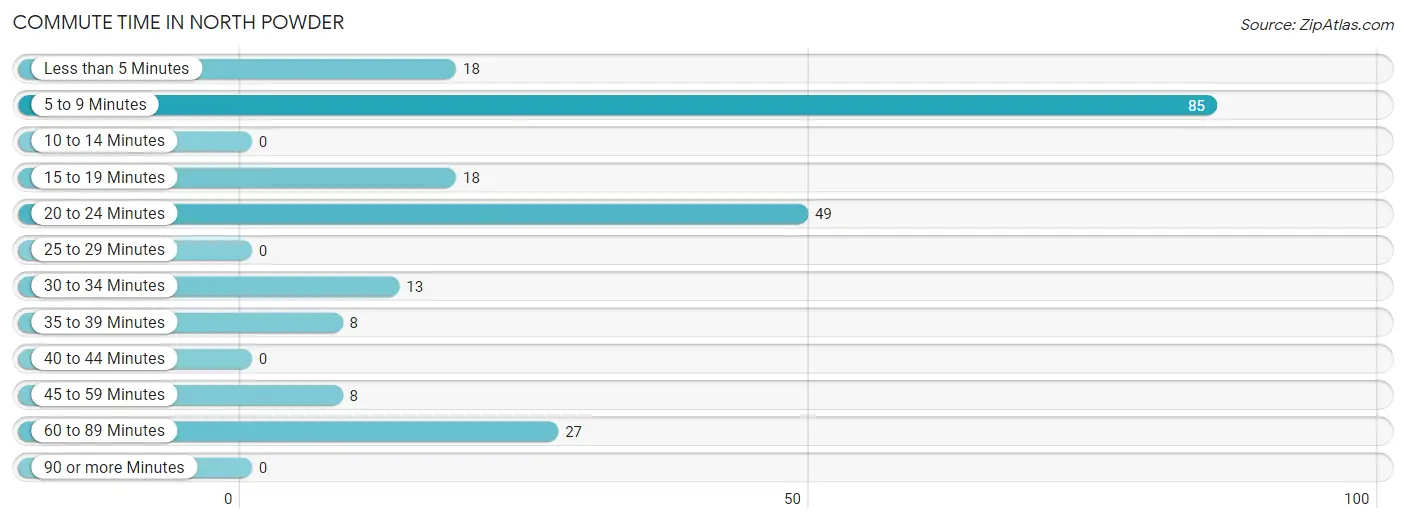
| Commute Time | # Commuters | % Commuters |
| Less than 5 Minutes | 18 | 8.0% |
| 5 to 9 Minutes | 85 | 37.6% |
| 10 to 14 Minutes | 0 | 0.0% |
| 15 to 19 Minutes | 18 | 8.0% |
| 20 to 24 Minutes | 49 | 21.7% |
| 25 to 29 Minutes | 0 | 0.0% |
| 30 to 34 Minutes | 13 | 5.8% |
| 35 to 39 Minutes | 8 | 3.5% |
| 40 to 44 Minutes | 0 | 0.0% |
| 45 to 59 Minutes | 8 | 3.5% |
| 60 to 89 Minutes | 27 | 11.9% |
| 90 or more Minutes | 0 | 0.0% |
Commute Time by Sex in North Powder
The most common commute times in North Powder are 5 to 9 minutes (61 commuters, 46.6%) for males and 5 to 9 minutes (24 commuters, 25.3%) for females.
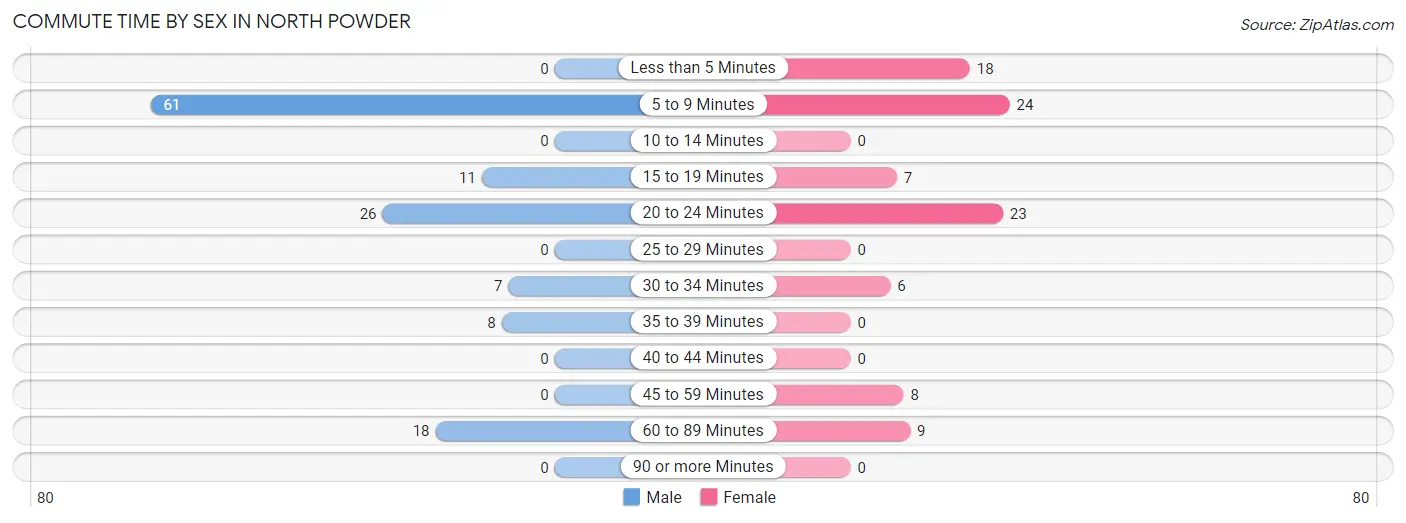
| Commute Time | Male | Female |
| Less than 5 Minutes | 0 (0.0%) | 18 (19.0%) |
| 5 to 9 Minutes | 61 (46.6%) | 24 (25.3%) |
| 10 to 14 Minutes | 0 (0.0%) | 0 (0.0%) |
| 15 to 19 Minutes | 11 (8.4%) | 7 (7.4%) |
| 20 to 24 Minutes | 26 (19.9%) | 23 (24.2%) |
| 25 to 29 Minutes | 0 (0.0%) | 0 (0.0%) |
| 30 to 34 Minutes | 7 (5.3%) | 6 (6.3%) |
| 35 to 39 Minutes | 8 (6.1%) | 0 (0.0%) |
| 40 to 44 Minutes | 0 (0.0%) | 0 (0.0%) |
| 45 to 59 Minutes | 0 (0.0%) | 8 (8.4%) |
| 60 to 89 Minutes | 18 (13.7%) | 9 (9.5%) |
| 90 or more Minutes | 0 (0.0%) | 0 (0.0%) |
Time of Departure to Work by Sex in North Powder
The most frequent times of departure to work in North Powder are 5:30 AM to 5:59 AM (58, 44.3%) for males and 7:30 AM to 7:59 AM (34, 35.8%) for females.
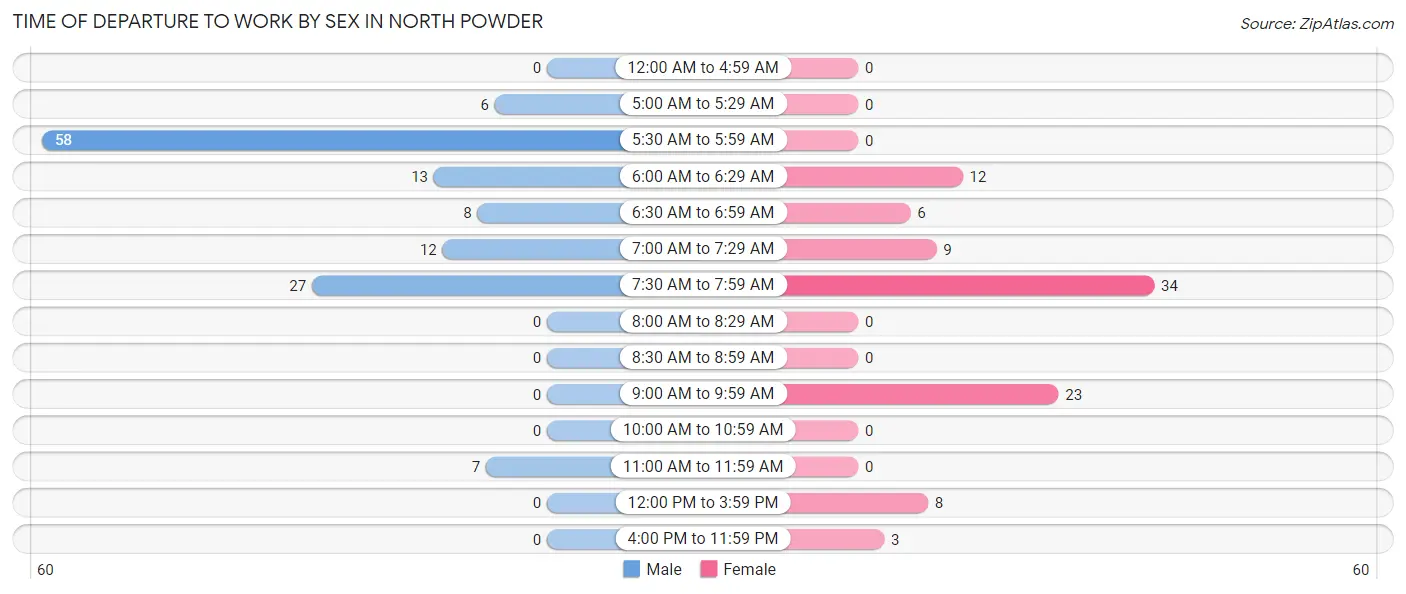
| Time of Departure | Male | Female |
| 12:00 AM to 4:59 AM | 0 (0.0%) | 0 (0.0%) |
| 5:00 AM to 5:29 AM | 6 (4.6%) | 0 (0.0%) |
| 5:30 AM to 5:59 AM | 58 (44.3%) | 0 (0.0%) |
| 6:00 AM to 6:29 AM | 13 (9.9%) | 12 (12.6%) |
| 6:30 AM to 6:59 AM | 8 (6.1%) | 6 (6.3%) |
| 7:00 AM to 7:29 AM | 12 (9.2%) | 9 (9.5%) |
| 7:30 AM to 7:59 AM | 27 (20.6%) | 34 (35.8%) |
| 8:00 AM to 8:29 AM | 0 (0.0%) | 0 (0.0%) |
| 8:30 AM to 8:59 AM | 0 (0.0%) | 0 (0.0%) |
| 9:00 AM to 9:59 AM | 0 (0.0%) | 23 (24.2%) |
| 10:00 AM to 10:59 AM | 0 (0.0%) | 0 (0.0%) |
| 11:00 AM to 11:59 AM | 7 (5.3%) | 0 (0.0%) |
| 12:00 PM to 3:59 PM | 0 (0.0%) | 8 (8.4%) |
| 4:00 PM to 11:59 PM | 0 (0.0%) | 3 (3.2%) |
| Total | 131 (100.0%) | 95 (100.0%) |
Housing Occupancy in North Powder
Occupancy by Ownership in North Powder
Of the total 258 dwellings in North Powder, owner-occupied units account for 195 (75.6%), while renter-occupied units make up 63 (24.4%).
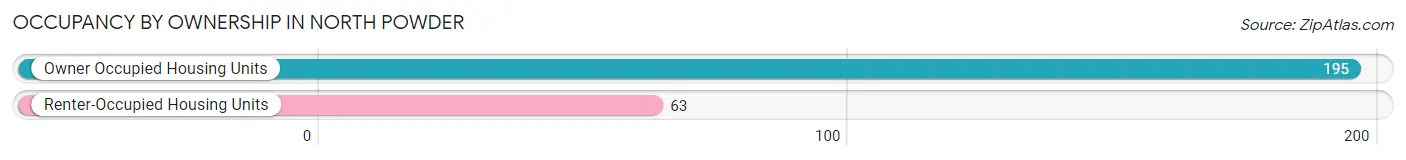
| Occupancy | # Housing Units | % Housing Units |
| Owner Occupied Housing Units | 195 | 75.6% |
| Renter-Occupied Housing Units | 63 | 24.4% |
| Total Occupied Housing Units | 258 | 100.0% |
Occupancy by Household Size in North Powder
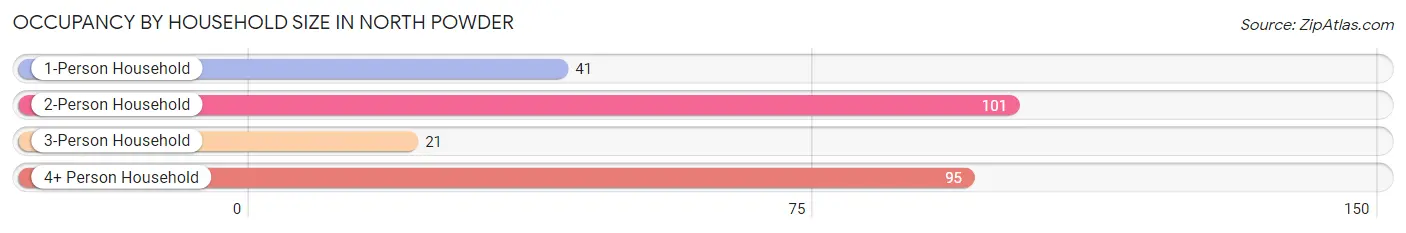
| Household Size | # Housing Units | % Housing Units |
| 1-Person Household | 41 | 15.9% |
| 2-Person Household | 101 | 39.2% |
| 3-Person Household | 21 | 8.1% |
| 4+ Person Household | 95 | 36.8% |
| Total Housing Units | 258 | 100.0% |
Occupancy by Ownership by Household Size in North Powder
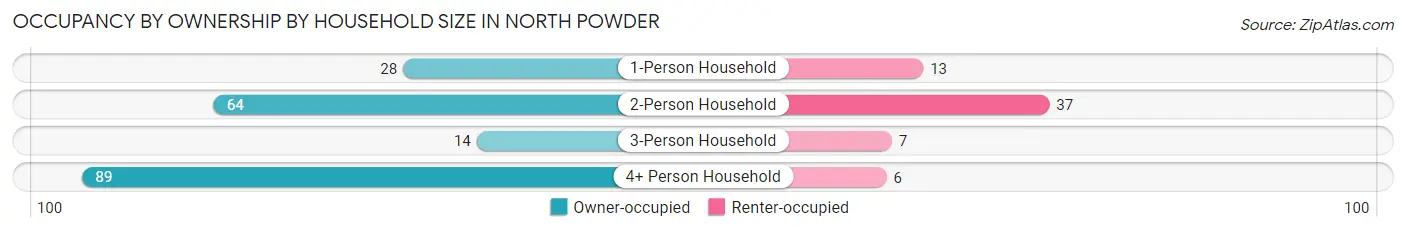
| Household Size | Owner-occupied | Renter-occupied |
| 1-Person Household | 28 (68.3%) | 13 (31.7%) |
| 2-Person Household | 64 (63.4%) | 37 (36.6%) |
| 3-Person Household | 14 (66.7%) | 7 (33.3%) |
| 4+ Person Household | 89 (93.7%) | 6 (6.3%) |
| Total Housing Units | 195 (75.6%) | 63 (24.4%) |
Occupancy by Educational Attainment in North Powder
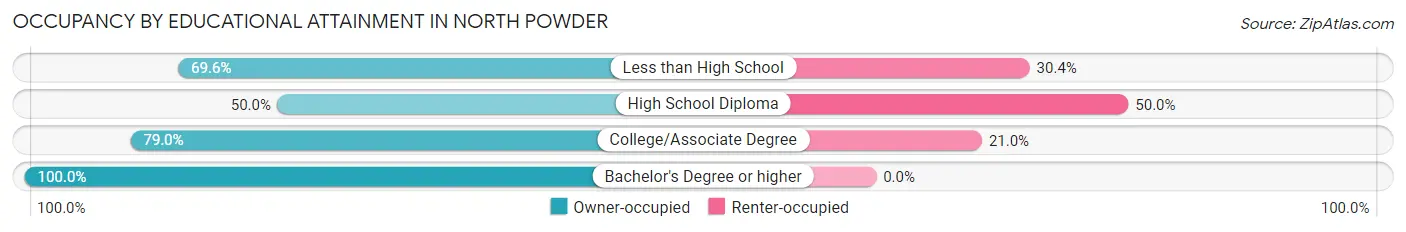
| Household Size | Owner-occupied | Renter-occupied |
| Less than High School | 32 (69.6%) | 14 (30.4%) |
| High School Diploma | 23 (50.0%) | 23 (50.0%) |
| College/Associate Degree | 98 (79.0%) | 26 (21.0%) |
| Bachelor's Degree or higher | 42 (100.0%) | 0 (0.0%) |
Occupancy by Age of Householder in North Powder
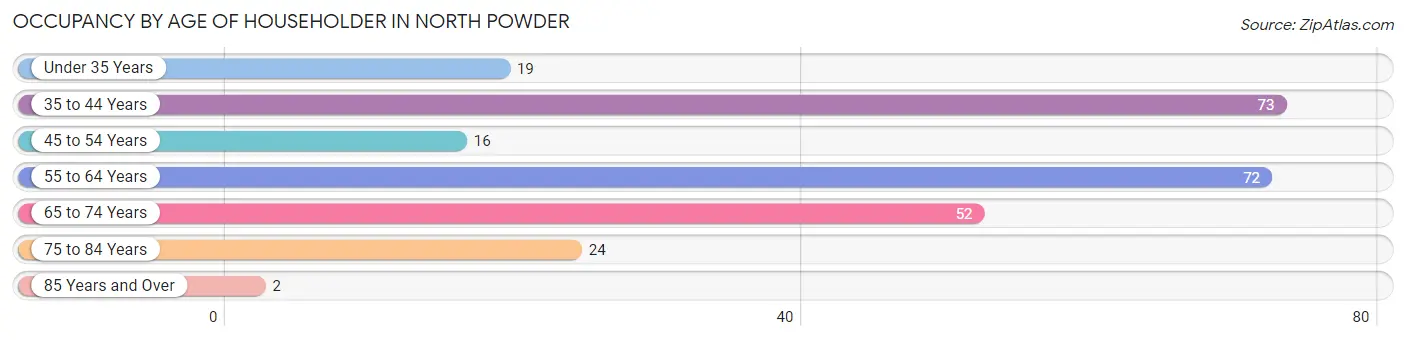
| Age Bracket | # Households | % Households |
| Under 35 Years | 19 | 7.4% |
| 35 to 44 Years | 73 | 28.3% |
| 45 to 54 Years | 16 | 6.2% |
| 55 to 64 Years | 72 | 27.9% |
| 65 to 74 Years | 52 | 20.2% |
| 75 to 84 Years | 24 | 9.3% |
| 85 Years and Over | 2 | 0.8% |
| Total | 258 | 100.0% |
Housing Finances in North Powder
Median Income by Occupancy in North Powder
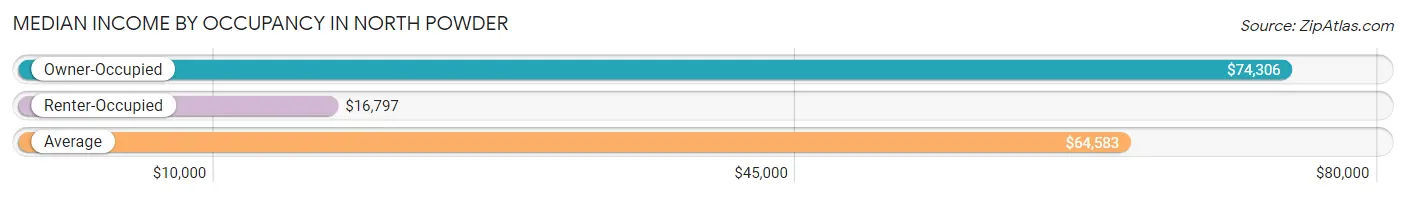
| Occupancy Type | # Households | Median Income |
| Owner-Occupied | 195 (75.6%) | $74,306 |
| Renter-Occupied | 63 (24.4%) | $16,797 |
| Average | 258 (100.0%) | $64,583 |
Occupancy by Householder Income Bracket in North Powder
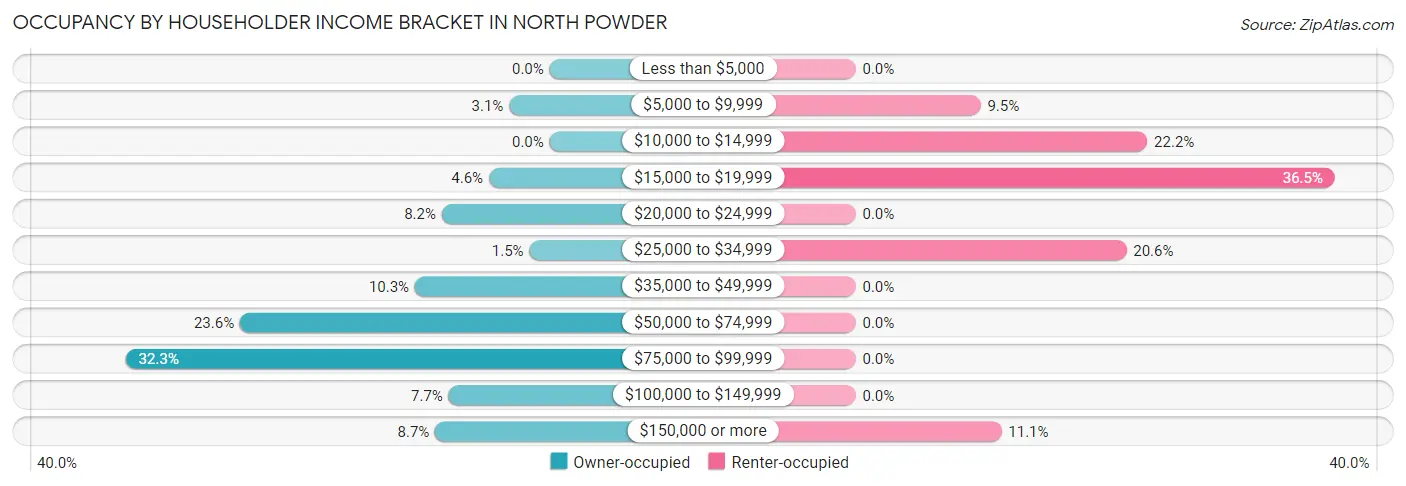
| Income Bracket | Owner-occupied | Renter-occupied |
| Less than $5,000 | 0 (0.0%) | 0 (0.0%) |
| $5,000 to $9,999 | 6 (3.1%) | 6 (9.5%) |
| $10,000 to $14,999 | 0 (0.0%) | 14 (22.2%) |
| $15,000 to $19,999 | 9 (4.6%) | 23 (36.5%) |
| $20,000 to $24,999 | 16 (8.2%) | 0 (0.0%) |
| $25,000 to $34,999 | 3 (1.5%) | 13 (20.6%) |
| $35,000 to $49,999 | 20 (10.3%) | 0 (0.0%) |
| $50,000 to $74,999 | 46 (23.6%) | 0 (0.0%) |
| $75,000 to $99,999 | 63 (32.3%) | 0 (0.0%) |
| $100,000 to $149,999 | 15 (7.7%) | 0 (0.0%) |
| $150,000 or more | 17 (8.7%) | 7 (11.1%) |
| Total | 195 (100.0%) | 63 (100.0%) |
Monthly Housing Cost Tiers in North Powder
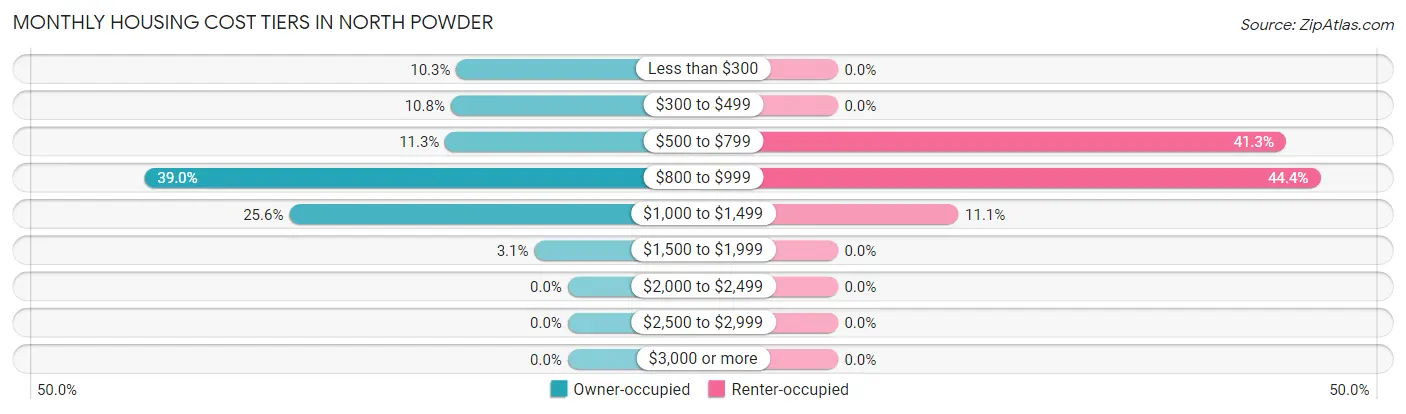
| Monthly Cost | Owner-occupied | Renter-occupied |
| Less than $300 | 20 (10.3%) | 0 (0.0%) |
| $300 to $499 | 21 (10.8%) | 0 (0.0%) |
| $500 to $799 | 22 (11.3%) | 26 (41.3%) |
| $800 to $999 | 76 (39.0%) | 28 (44.4%) |
| $1,000 to $1,499 | 50 (25.6%) | 7 (11.1%) |
| $1,500 to $1,999 | 6 (3.1%) | 0 (0.0%) |
| $2,000 to $2,499 | 0 (0.0%) | 0 (0.0%) |
| $2,500 to $2,999 | 0 (0.0%) | 0 (0.0%) |
| $3,000 or more | 0 (0.0%) | 0 (0.0%) |
| Total | 195 (100.0%) | 63 (100.0%) |
Physical Housing Characteristics in North Powder
Housing Structures in North Powder
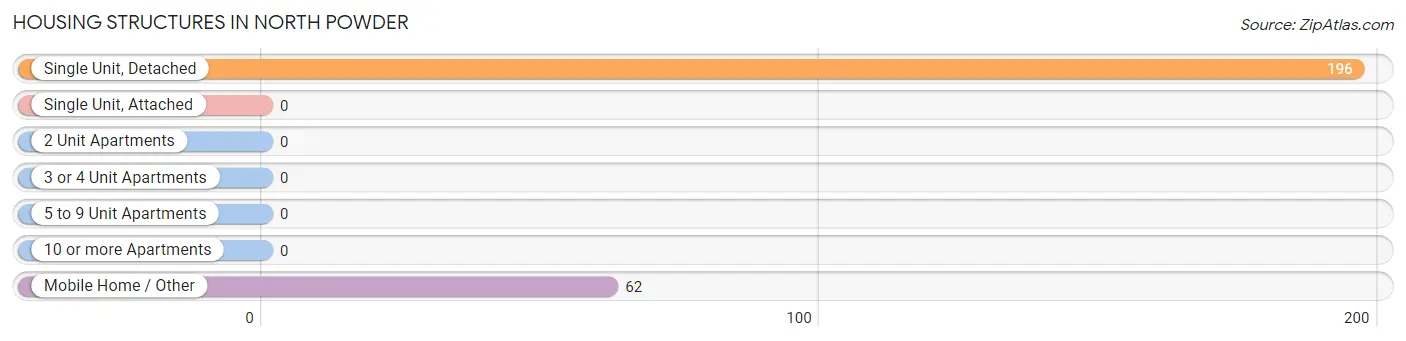
| Structure Type | # Housing Units | % Housing Units |
| Single Unit, Detached | 196 | 76.0% |
| Single Unit, Attached | 0 | 0.0% |
| 2 Unit Apartments | 0 | 0.0% |
| 3 or 4 Unit Apartments | 0 | 0.0% |
| 5 to 9 Unit Apartments | 0 | 0.0% |
| 10 or more Apartments | 0 | 0.0% |
| Mobile Home / Other | 62 | 24.0% |
| Total | 258 | 100.0% |
Housing Structures by Occupancy in North Powder
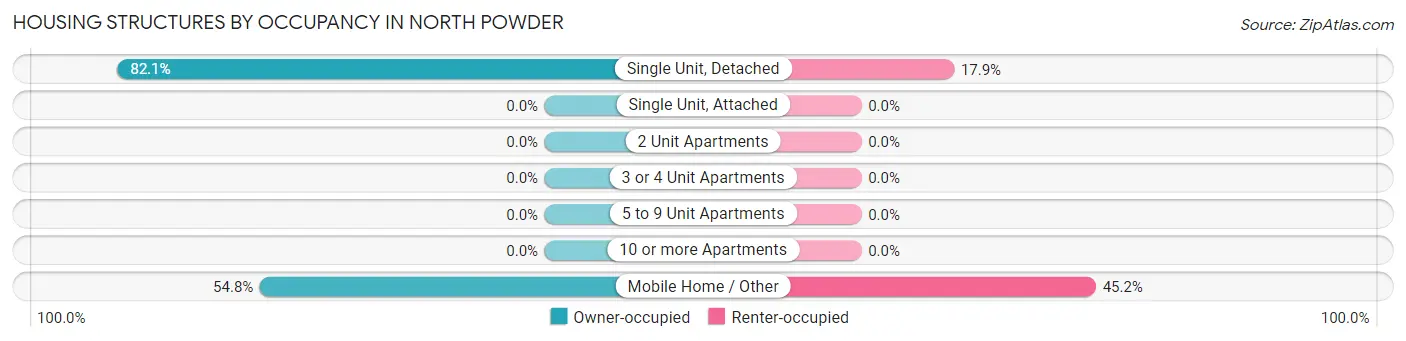
| Structure Type | Owner-occupied | Renter-occupied |
| Single Unit, Detached | 161 (82.1%) | 35 (17.9%) |
| Single Unit, Attached | 0 (0.0%) | 0 (0.0%) |
| 2 Unit Apartments | 0 (0.0%) | 0 (0.0%) |
| 3 or 4 Unit Apartments | 0 (0.0%) | 0 (0.0%) |
| 5 to 9 Unit Apartments | 0 (0.0%) | 0 (0.0%) |
| 10 or more Apartments | 0 (0.0%) | 0 (0.0%) |
| Mobile Home / Other | 34 (54.8%) | 28 (45.2%) |
| Total | 195 (75.6%) | 63 (24.4%) |
Housing Structures by Number of Rooms in North Powder
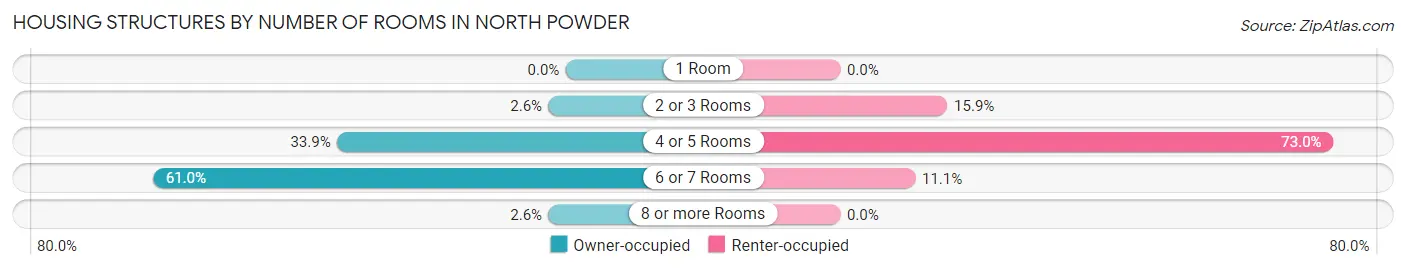
| Number of Rooms | Owner-occupied | Renter-occupied |
| 1 Room | 0 (0.0%) | 0 (0.0%) |
| 2 or 3 Rooms | 5 (2.6%) | 10 (15.9%) |
| 4 or 5 Rooms | 66 (33.9%) | 46 (73.0%) |
| 6 or 7 Rooms | 119 (61.0%) | 7 (11.1%) |
| 8 or more Rooms | 5 (2.6%) | 0 (0.0%) |
| Total | 195 (100.0%) | 63 (100.0%) |
Housing Structure by Heating Type in North Powder
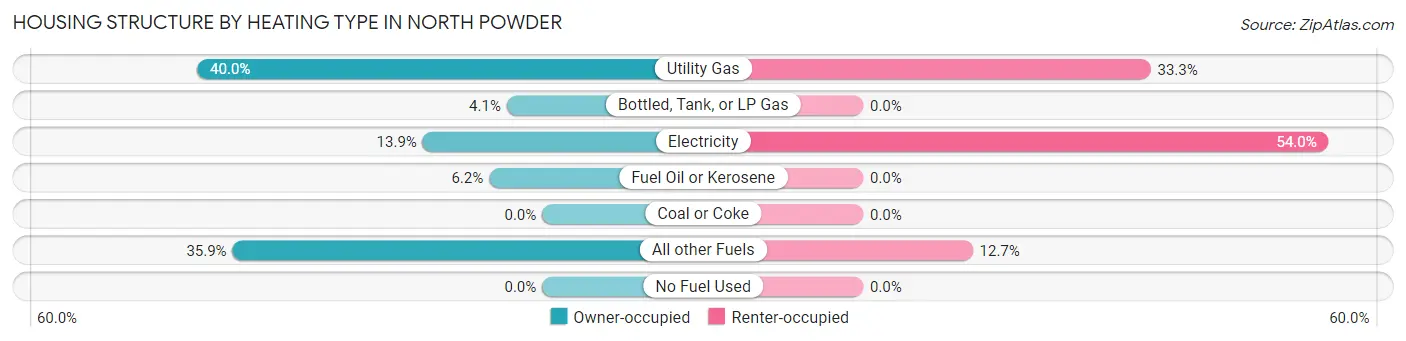
| Heating Type | Owner-occupied | Renter-occupied |
| Utility Gas | 78 (40.0%) | 21 (33.3%) |
| Bottled, Tank, or LP Gas | 8 (4.1%) | 0 (0.0%) |
| Electricity | 27 (13.9%) | 34 (54.0%) |
| Fuel Oil or Kerosene | 12 (6.1%) | 0 (0.0%) |
| Coal or Coke | 0 (0.0%) | 0 (0.0%) |
| All other Fuels | 70 (35.9%) | 8 (12.7%) |
| No Fuel Used | 0 (0.0%) | 0 (0.0%) |
| Total | 195 (100.0%) | 63 (100.0%) |
Household Vehicle Usage in North Powder
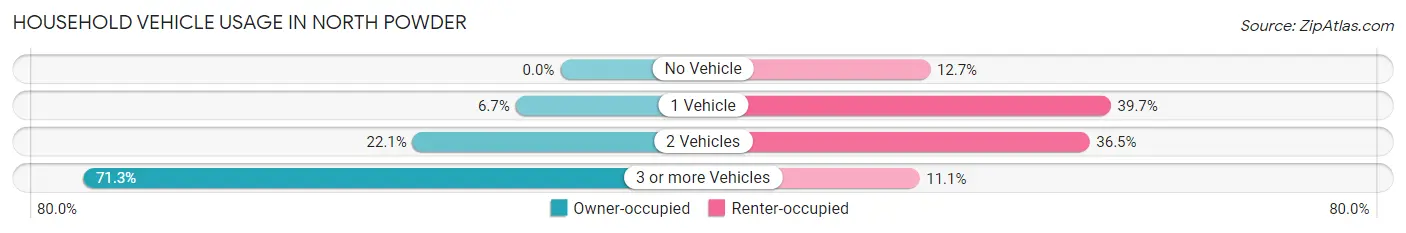
| Vehicles per Household | Owner-occupied | Renter-occupied |
| No Vehicle | 0 (0.0%) | 8 (12.7%) |
| 1 Vehicle | 13 (6.7%) | 25 (39.7%) |
| 2 Vehicles | 43 (22.1%) | 23 (36.5%) |
| 3 or more Vehicles | 139 (71.3%) | 7 (11.1%) |
| Total | 195 (100.0%) | 63 (100.0%) |
Real Estate & Mortgages in North Powder
Real Estate and Mortgage Overview in North Powder
| Characteristic | Without Mortgage | With Mortgage |
| Housing Units | 66 | 129 |
| Median Property Value | $114,700 | $127,000 |
| Median Household Income | $47,000 | $11 |
| Monthly Housing Costs | $433 | $0 |
| Real Estate Taxes | $1,286 | $0 |
Property Value by Mortgage Status in North Powder
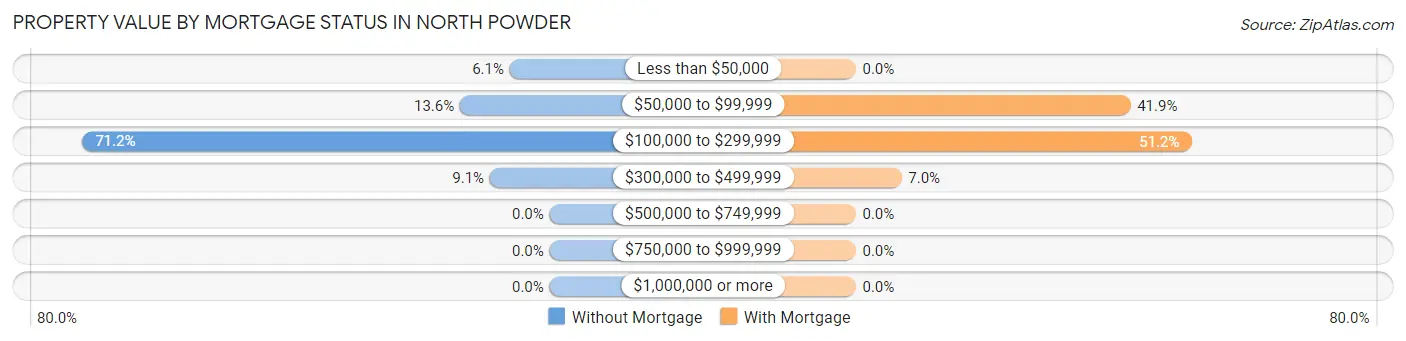
| Property Value | Without Mortgage | With Mortgage |
| Less than $50,000 | 4 (6.1%) | 0 (0.0%) |
| $50,000 to $99,999 | 9 (13.6%) | 54 (41.9%) |
| $100,000 to $299,999 | 47 (71.2%) | 66 (51.2%) |
| $300,000 to $499,999 | 6 (9.1%) | 9 (7.0%) |
| $500,000 to $749,999 | 0 (0.0%) | 0 (0.0%) |
| $750,000 to $999,999 | 0 (0.0%) | 0 (0.0%) |
| $1,000,000 or more | 0 (0.0%) | 0 (0.0%) |
| Total | 66 (100.0%) | 129 (100.0%) |
Household Income by Mortgage Status in North Powder
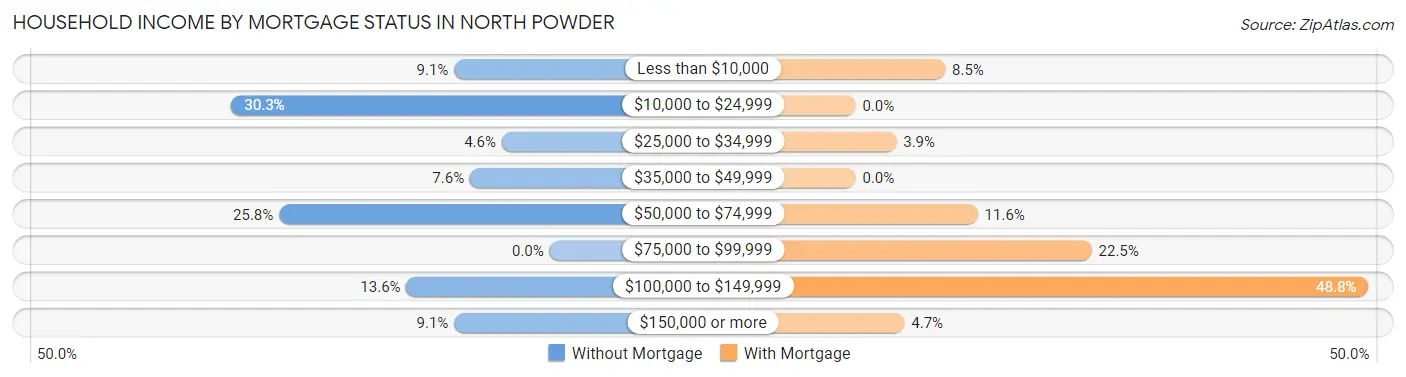
| Household Income | Without Mortgage | With Mortgage |
| Less than $10,000 | 6 (9.1%) | 11 (8.5%) |
| $10,000 to $24,999 | 20 (30.3%) | 0 (0.0%) |
| $25,000 to $34,999 | 3 (4.5%) | 5 (3.9%) |
| $35,000 to $49,999 | 5 (7.6%) | 0 (0.0%) |
| $50,000 to $74,999 | 17 (25.8%) | 15 (11.6%) |
| $75,000 to $99,999 | 0 (0.0%) | 29 (22.5%) |
| $100,000 to $149,999 | 9 (13.6%) | 63 (48.8%) |
| $150,000 or more | 6 (9.1%) | 6 (4.6%) |
| Total | 66 (100.0%) | 129 (100.0%) |
Property Value to Household Income Ratio in North Powder
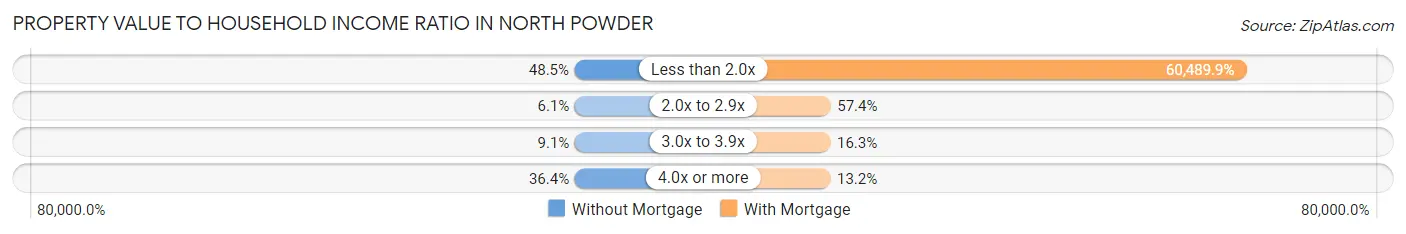
| Value-to-Income Ratio | Without Mortgage | With Mortgage |
| Less than 2.0x | 32 (48.5%) | 78,032 (60,489.9%) |
| 2.0x to 2.9x | 4 (6.1%) | 74 (57.4%) |
| 3.0x to 3.9x | 6 (9.1%) | 21 (16.3%) |
| 4.0x or more | 24 (36.4%) | 17 (13.2%) |
| Total | 66 (100.0%) | 129 (100.0%) |
Real Estate Taxes by Mortgage Status in North Powder
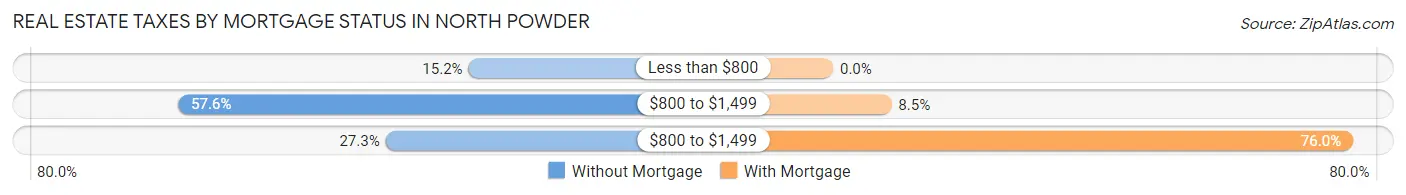
| Property Taxes | Without Mortgage | With Mortgage |
| Less than $800 | 10 (15.1%) | 0 (0.0%) |
| $800 to $1,499 | 38 (57.6%) | 11 (8.5%) |
| $800 to $1,499 | 18 (27.3%) | 98 (76.0%) |
| Total | 66 (100.0%) | 129 (100.0%) |
Health & Disability in North Powder
Health Insurance Coverage by Age in North Powder
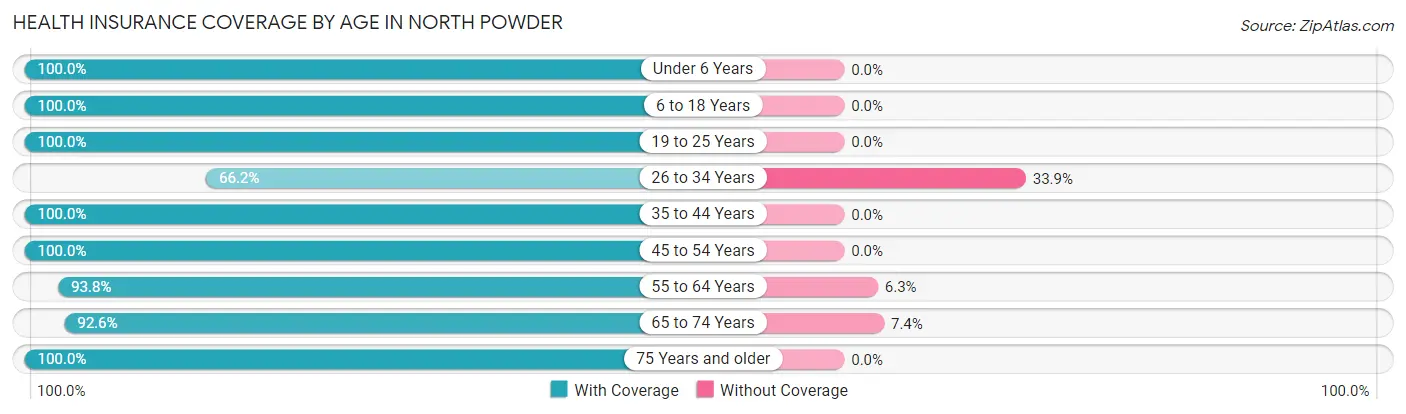
| Age Bracket | With Coverage | Without Coverage |
| Under 6 Years | 72 (100.0%) | 0 (0.0%) |
| 6 to 18 Years | 134 (100.0%) | 0 (0.0%) |
| 19 to 25 Years | 6 (100.0%) | 0 (0.0%) |
| 26 to 34 Years | 43 (66.1%) | 22 (33.9%) |
| 35 to 44 Years | 99 (100.0%) | 0 (0.0%) |
| 45 to 54 Years | 39 (100.0%) | 0 (0.0%) |
| 55 to 64 Years | 105 (93.8%) | 7 (6.2%) |
| 65 to 74 Years | 75 (92.6%) | 6 (7.4%) |
| 75 Years and older | 50 (100.0%) | 0 (0.0%) |
| Total | 623 (94.7%) | 35 (5.3%) |
Health Insurance Coverage by Citizenship Status in North Powder
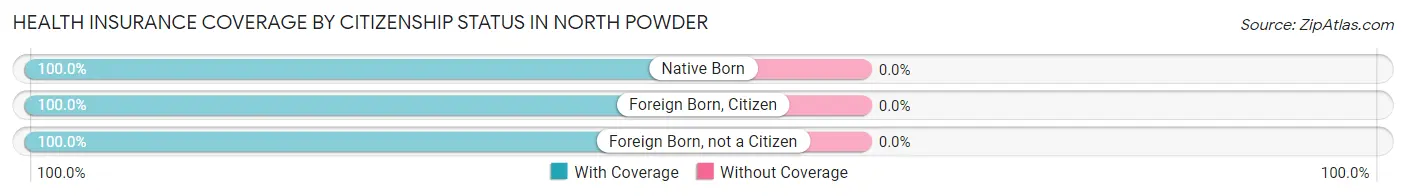
| Citizenship Status | With Coverage | Without Coverage |
| Native Born | 72 (100.0%) | 0 (0.0%) |
| Foreign Born, Citizen | 134 (100.0%) | 0 (0.0%) |
| Foreign Born, not a Citizen | 6 (100.0%) | 0 (0.0%) |
Health Insurance Coverage by Household Income in North Powder
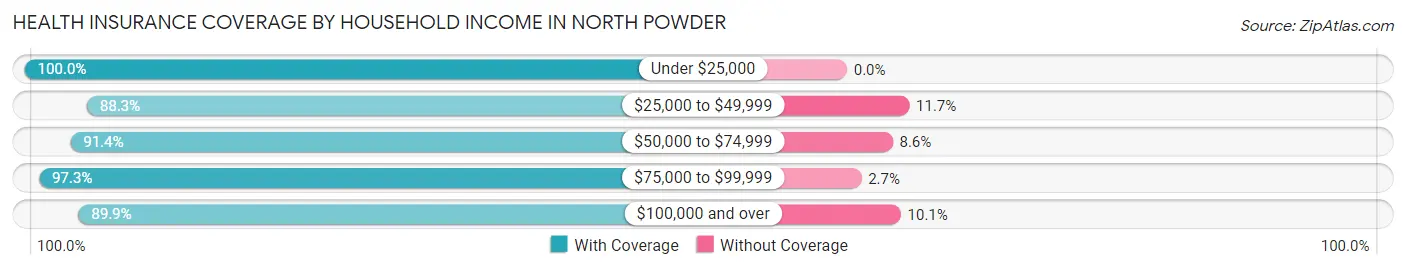
| Household Income | With Coverage | Without Coverage |
| Under $25,000 | 142 (100.0%) | 0 (0.0%) |
| $25,000 to $49,999 | 53 (88.3%) | 7 (11.7%) |
| $50,000 to $74,999 | 96 (91.4%) | 9 (8.6%) |
| $75,000 to $99,999 | 216 (97.3%) | 6 (2.7%) |
| $100,000 and over | 116 (89.9%) | 13 (10.1%) |
Public vs Private Health Insurance Coverage by Age in North Powder
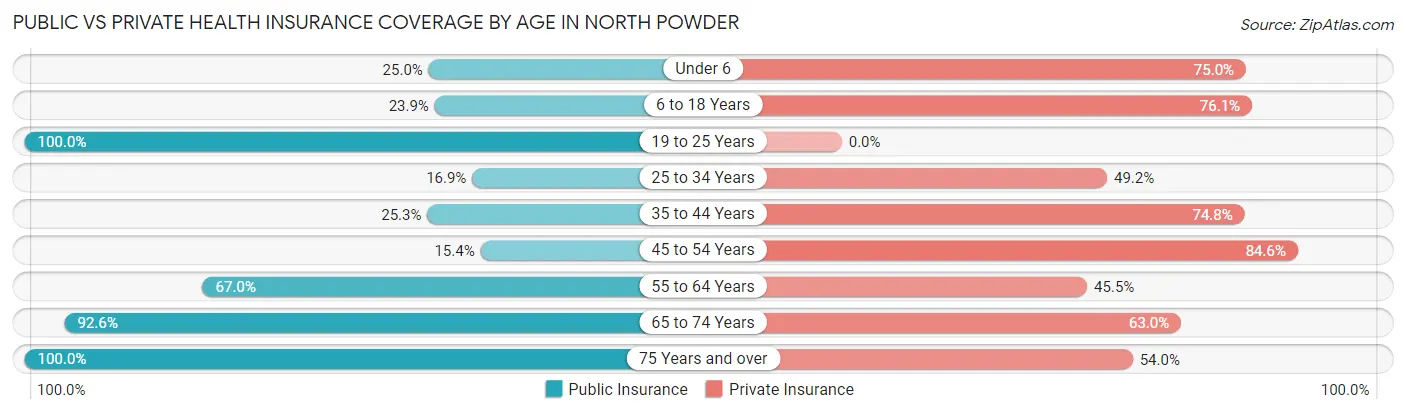
| Age Bracket | Public Insurance | Private Insurance |
| Under 6 | 18 (25.0%) | 54 (75.0%) |
| 6 to 18 Years | 32 (23.9%) | 102 (76.1%) |
| 19 to 25 Years | 6 (100.0%) | 0 (0.0%) |
| 25 to 34 Years | 11 (16.9%) | 32 (49.2%) |
| 35 to 44 Years | 25 (25.3%) | 74 (74.8%) |
| 45 to 54 Years | 6 (15.4%) | 33 (84.6%) |
| 55 to 64 Years | 75 (67.0%) | 51 (45.5%) |
| 65 to 74 Years | 75 (92.6%) | 51 (63.0%) |
| 75 Years and over | 50 (100.0%) | 27 (54.0%) |
| Total | 298 (45.3%) | 424 (64.4%) |
Disability Status by Sex by Age in North Powder
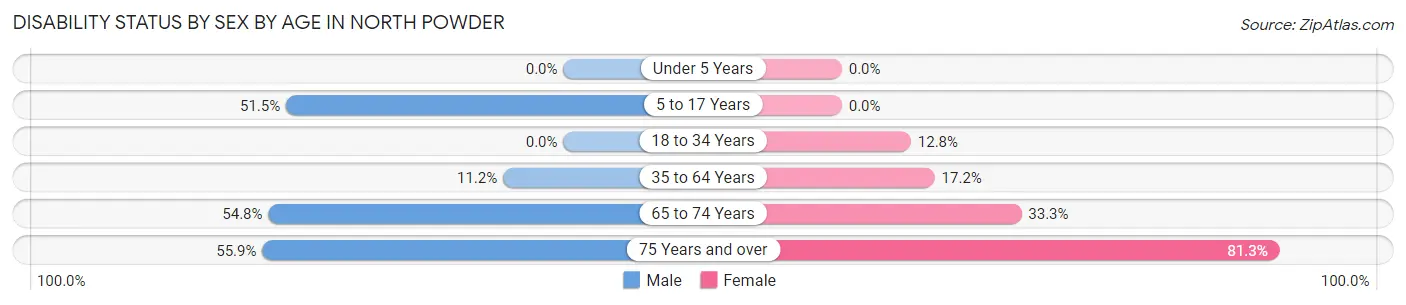
| Age Bracket | Male | Female |
| Under 5 Years | 0 (0.0%) | 0 (0.0%) |
| 5 to 17 Years | 35 (51.5%) | 0 (0.0%) |
| 18 to 34 Years | 0 (0.0%) | 5 (12.8%) |
| 35 to 64 Years | 15 (11.2%) | 20 (17.2%) |
| 65 to 74 Years | 23 (54.8%) | 13 (33.3%) |
| 75 Years and over | 19 (55.9%) | 13 (81.2%) |
Disability Class by Sex by Age in North Powder
Disability Class: Hearing Difficulty
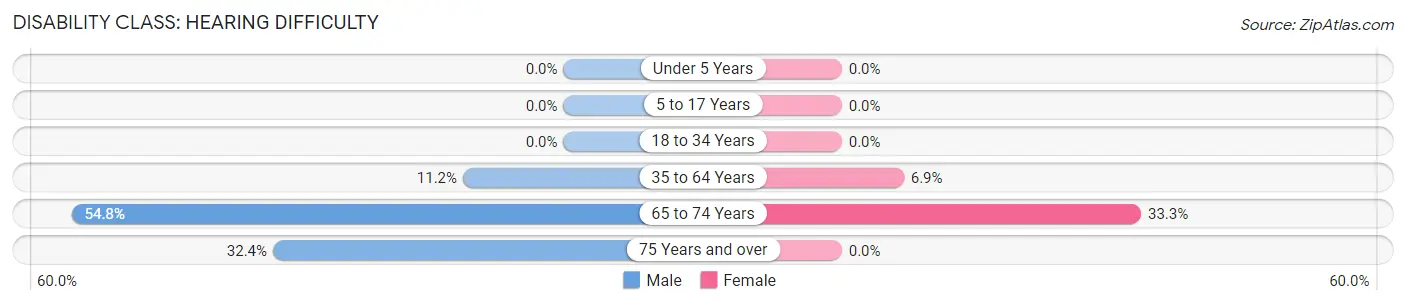
| Age Bracket | Male | Female |
| Under 5 Years | 0 (0.0%) | 0 (0.0%) |
| 5 to 17 Years | 0 (0.0%) | 0 (0.0%) |
| 18 to 34 Years | 0 (0.0%) | 0 (0.0%) |
| 35 to 64 Years | 15 (11.2%) | 8 (6.9%) |
| 65 to 74 Years | 23 (54.8%) | 13 (33.3%) |
| 75 Years and over | 11 (32.4%) | 0 (0.0%) |
Disability Class: Vision Difficulty
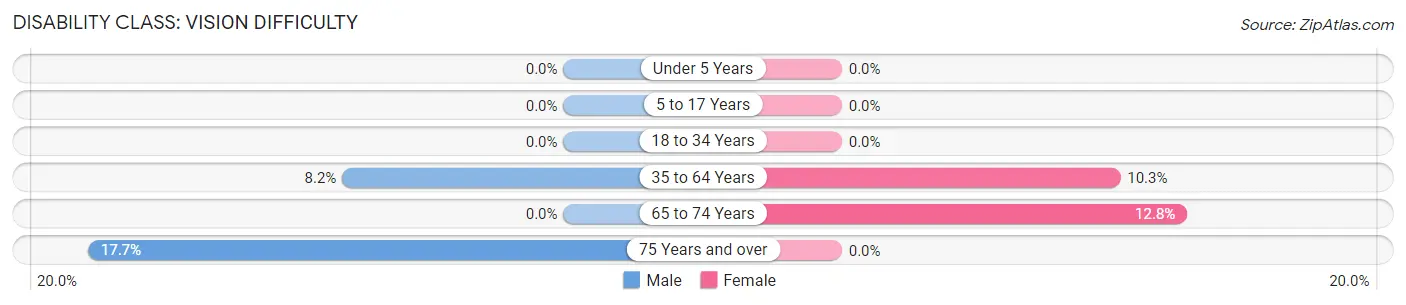
| Age Bracket | Male | Female |
| Under 5 Years | 0 (0.0%) | 0 (0.0%) |
| 5 to 17 Years | 0 (0.0%) | 0 (0.0%) |
| 18 to 34 Years | 0 (0.0%) | 0 (0.0%) |
| 35 to 64 Years | 11 (8.2%) | 12 (10.3%) |
| 65 to 74 Years | 0 (0.0%) | 5 (12.8%) |
| 75 Years and over | 6 (17.6%) | 0 (0.0%) |
Disability Class: Cognitive Difficulty
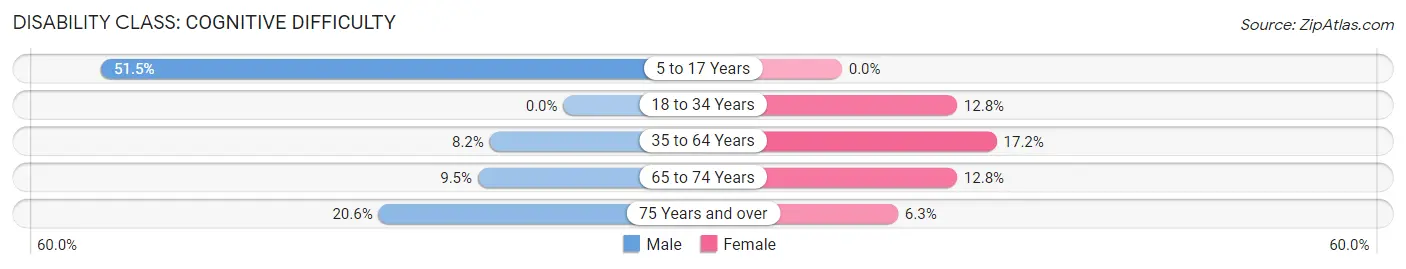
| Age Bracket | Male | Female |
| 5 to 17 Years | 35 (51.5%) | 0 (0.0%) |
| 18 to 34 Years | 0 (0.0%) | 5 (12.8%) |
| 35 to 64 Years | 11 (8.2%) | 20 (17.2%) |
| 65 to 74 Years | 4 (9.5%) | 5 (12.8%) |
| 75 Years and over | 7 (20.6%) | 1 (6.2%) |
Disability Class: Ambulatory Difficulty
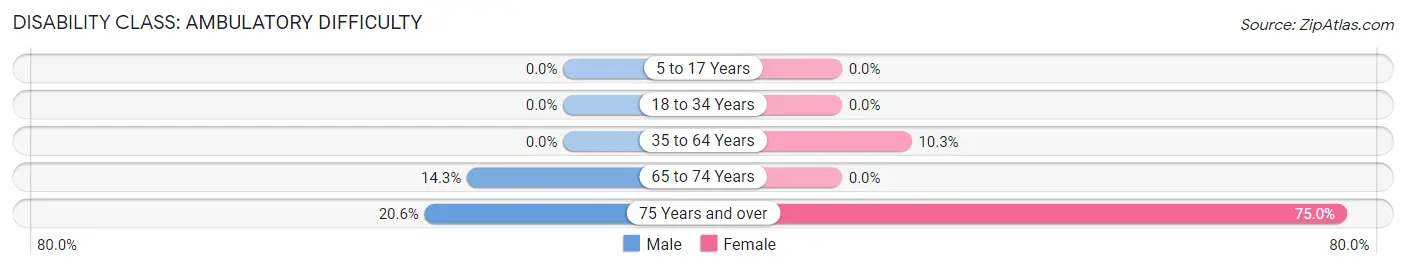
| Age Bracket | Male | Female |
| 5 to 17 Years | 0 (0.0%) | 0 (0.0%) |
| 18 to 34 Years | 0 (0.0%) | 0 (0.0%) |
| 35 to 64 Years | 0 (0.0%) | 12 (10.3%) |
| 65 to 74 Years | 6 (14.3%) | 0 (0.0%) |
| 75 Years and over | 7 (20.6%) | 12 (75.0%) |
Disability Class: Self-Care Difficulty
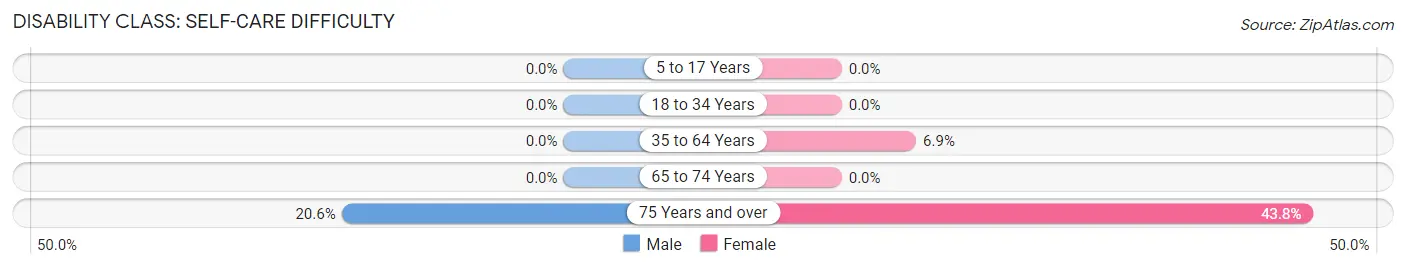
| Age Bracket | Male | Female |
| 5 to 17 Years | 0 (0.0%) | 0 (0.0%) |
| 18 to 34 Years | 0 (0.0%) | 0 (0.0%) |
| 35 to 64 Years | 0 (0.0%) | 8 (6.9%) |
| 65 to 74 Years | 0 (0.0%) | 0 (0.0%) |
| 75 Years and over | 7 (20.6%) | 7 (43.8%) |
Technology Access in North Powder
Computing Device Access in North Powder
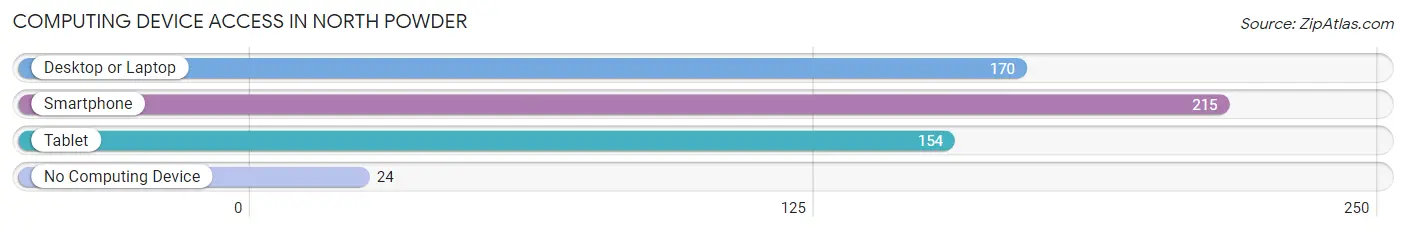
| Device Type | # Households | % Households |
| Desktop or Laptop | 170 | 65.9% |
| Smartphone | 215 | 83.3% |
| Tablet | 154 | 59.7% |
| No Computing Device | 24 | 9.3% |
| Total | 258 | 100.0% |
Internet Access in North Powder
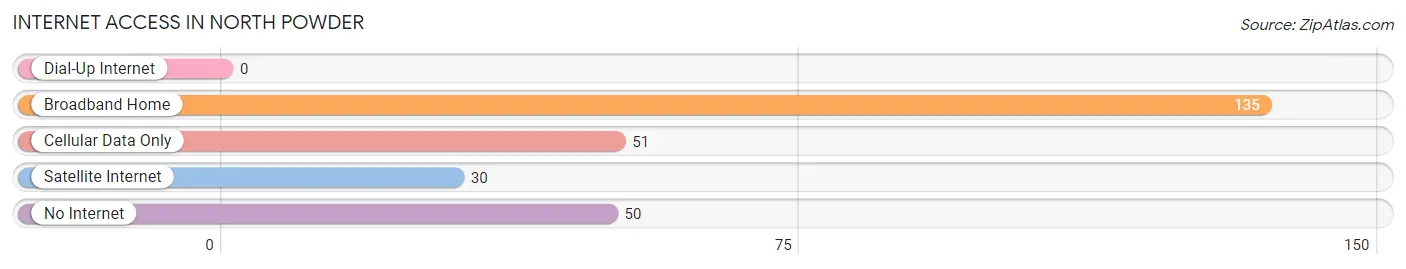
| Internet Type | # Households | % Households |
| Dial-Up Internet | 0 | 0.0% |
| Broadband Home | 135 | 52.3% |
| Cellular Data Only | 51 | 19.8% |
| Satellite Internet | 30 | 11.6% |
| No Internet | 50 | 19.4% |
| Total | 258 | 100.0% |
North Powder Summary
History
North Powder is a small unincorporated community located in Union County, Oregon. It is situated in the foothills of the Blue Mountains, approximately 20 miles east of La Grande. The area was first settled in the late 1800s by homesteaders, and the town was officially established in 1891. The town was named after a nearby creek, which was named after a Native American chief named Powder.
The town was originally a logging and farming community, and the first sawmill was built in 1892. The town grew rapidly, and by the early 1900s, it had a population of over 500 people. The town was home to several businesses, including a hotel, a general store, a blacksmith shop, and a post office.
In the 1920s, the town began to decline as the logging industry moved away. The population dropped to just over 200 people by the 1940s. In the 1950s, the town was revitalized by the construction of a new highway, which connected North Powder to La Grande. This allowed for increased tourism and commerce in the area.
Geography
North Powder is located in the foothills of the Blue Mountains, approximately 20 miles east of La Grande. The town is situated at an elevation of 2,890 feet above sea level. The area is characterized by rolling hills and open meadows, with the nearby mountains providing a scenic backdrop. The climate is semi-arid, with hot summers and cold winters.
The town is located in the Grande Ronde Valley, which is a major agricultural region. The valley is home to a variety of crops, including wheat, barley, oats, and hay. The nearby mountains provide a variety of recreational activities, including hiking, camping, and fishing.
Economy
North Powder’s economy is largely based on agriculture and tourism. The town is home to several farms, which produce a variety of crops, including wheat, barley, oats, and hay. The nearby mountains provide a variety of recreational activities, which attract tourists from all over the region.
The town is also home to several small businesses, including a general store, a gas station, and a restaurant. The town is served by the Union County School District, which provides educational services to the local community.
Demographics
As of the 2010 census, the population of North Powder was 545. The racial makeup of the town was 95.3% White, 0.2% African American, 0.7% Native American, 0.4% Asian, 0.2% Pacific Islander, and 2.2% from other races. The median household income was $37,500, and the median age was 44.
Conclusion
North Powder is a small unincorporated community located in Union County, Oregon. It is situated in the foothills of the Blue Mountains, approximately 20 miles east of La Grande. The town was originally a logging and farming community, and it has since become a popular tourist destination due to its scenic location and recreational activities. The town’s economy is largely based on agriculture and tourism, and it is served by the Union County School District. As of the 2010 census, the population of North Powder was 545.
Common Questions
What is the Total Population of North Powder?
Total Population of North Powder is 658.
What is the Total Male Population of North Powder?
Total Male Population of North Powder is 330.
What is the Total Female Population of North Powder?
Total Female Population of North Powder is 328.
What is the Ratio of Males per 100 Females in North Powder?
There are 100.61 Males per 100 Females in North Powder.
What is the Ratio of Females per 100 Males in North Powder?
There are 99.39 Females per 100 Males in North Powder.
What is the Median Population Age in North Powder?
Median Population Age in North Powder is 42.3 Years.
What is the Average Family Size in North Powder
Average Family Size in North Powder is 2.9 People.
What is the Average Household Size in North Powder
Average Household Size in North Powder is 2.5 People.
What is Per Capita Income in North Powder?
Per Capita income in North Powder is $30,167.
What is the Median Family Income in North Powder?
Median Family Income in North Powder is $74,306.
What is the Median Household income in North Powder?
Median Household Income in North Powder is $64,583.
What is Income or Wage Gap in North Powder?
Income or Wage Gap in North Powder is 65.0%.
Women in North Powder earn 35.0 cents for every dollar earned by a man.
What is Inequality or Gini Index in North Powder?
Inequality or Gini Index in North Powder is 0.52.
How Large is the Labor Force in North Powder?
There are 252 People in the Labor Forcein in North Powder.
What is the Percentage of People in the Labor Force in North Powder?
52.1% of People are in the Labor Force in North Powder.
What is the Unemployment Rate in North Powder?
Unemployment Rate in North Powder is 3.2%.