Mount Vernon, OR
Mount Vernon Map
Mount Vernon Overview
595
TOTAL POPULATION
280
MALE POPULATION
315
FEMALE POPULATION
88.89
MALES / 100 FEMALES
112.50
FEMALES / 100 MALES
39.5
MEDIAN AGE
2.9
AVG FAMILY SIZE
2.2
AVG HOUSEHOLD SIZE
$50,232
PER CAPITA INCOME
$89,375
AVG FAMILY INCOME
$62,422
AVG HOUSEHOLD INCOME
54.2%
WAGE / INCOME GAP [ % ]
45.8¢/ $1
WAGE / INCOME GAP [ $ ]
0.56
INEQUALITY / GINI INDEX
345
LABOR FORCE [ PEOPLE ]
66.9%
PERCENT IN LABOR FORCE
13.0%
UNEMPLOYMENT RATE
Mount Vernon Zip Codes
Mount Vernon Area Codes
Race in Mount Vernon
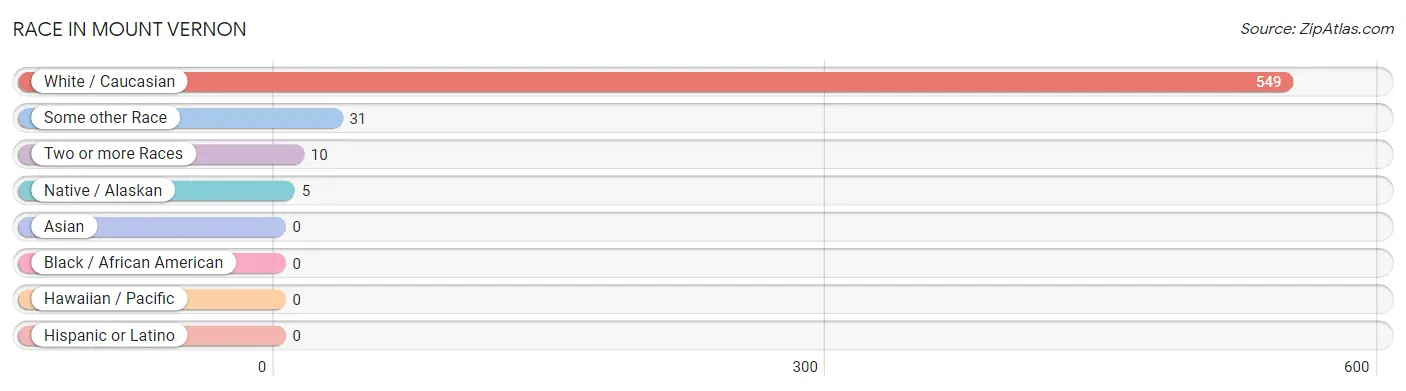
The most populous races in Mount Vernon are White / Caucasian (549 | 92.3%), Some other Race (31 | 5.2%), and Two or more Races (10 | 1.7%).
| Race | # Population | % Population |
| Asian | 0 | 0.0% |
| Black / African American | 0 | 0.0% |
| Hawaiian / Pacific | 0 | 0.0% |
| Hispanic or Latino | 0 | 0.0% |
| Native / Alaskan | 5 | 0.8% |
| White / Caucasian | 549 | 92.3% |
| Two or more Races | 10 | 1.7% |
| Some other Race | 31 | 5.2% |
| Total | 595 | 100.0% |
Ancestry in Mount Vernon
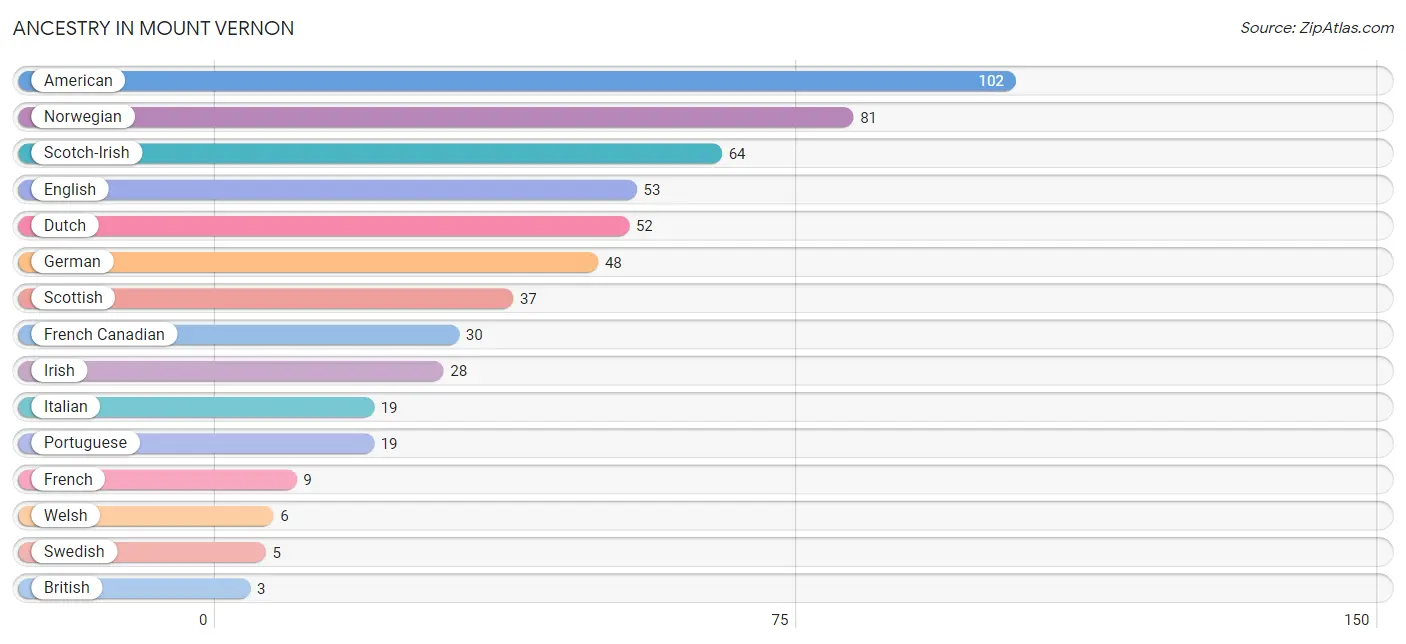
The most populous ancestries reported in Mount Vernon are American (102 | 17.1%), Norwegian (81 | 13.6%), Scotch-Irish (64 | 10.8%), English (53 | 8.9%), and Dutch (52 | 8.7%), together accounting for 59.2% of all Mount Vernon residents.
| Ancestry | # Population | % Population |
| American | 102 | 17.1% |
| Apache | 1 | 0.2% |
| British | 3 | 0.5% |
| Dutch | 52 | 8.7% |
| English | 53 | 8.9% |
| French | 9 | 1.5% |
| French Canadian | 30 | 5.0% |
| German | 48 | 8.1% |
| Irish | 28 | 4.7% |
| Italian | 19 | 3.2% |
| Norwegian | 81 | 13.6% |
| Portuguese | 19 | 3.2% |
| Scotch-Irish | 64 | 10.8% |
| Scottish | 37 | 6.2% |
| Sioux | 3 | 0.5% |
| Swedish | 5 | 0.8% |
| Welsh | 6 | 1.0% | View All 17 Rows |
Immigrants in Mount Vernon

| Immigration Origin | # Population | % Population | View All 0 Rows |
Sex and Age in Mount Vernon
Sex and Age in Mount Vernon
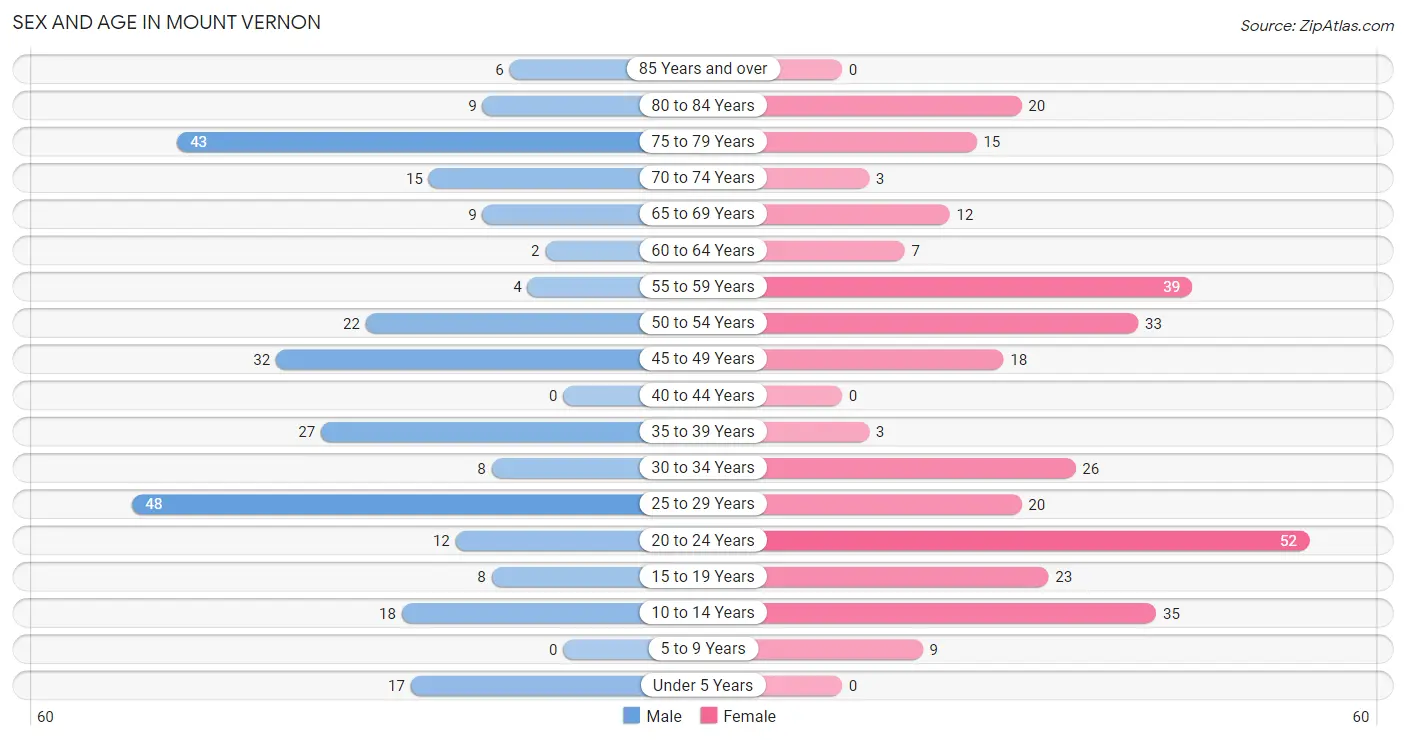
The most populous age groups in Mount Vernon are 25 to 29 Years (48 | 17.1%) for men and 20 to 24 Years (52 | 16.5%) for women.
| Age Bracket | Male | Female |
| Under 5 Years | 17 (6.1%) | 0 (0.0%) |
| 5 to 9 Years | 0 (0.0%) | 9 (2.9%) |
| 10 to 14 Years | 18 (6.4%) | 35 (11.1%) |
| 15 to 19 Years | 8 (2.9%) | 23 (7.3%) |
| 20 to 24 Years | 12 (4.3%) | 52 (16.5%) |
| 25 to 29 Years | 48 (17.1%) | 20 (6.4%) |
| 30 to 34 Years | 8 (2.9%) | 26 (8.3%) |
| 35 to 39 Years | 27 (9.6%) | 3 (0.9%) |
| 40 to 44 Years | 0 (0.0%) | 0 (0.0%) |
| 45 to 49 Years | 32 (11.4%) | 18 (5.7%) |
| 50 to 54 Years | 22 (7.9%) | 33 (10.5%) |
| 55 to 59 Years | 4 (1.4%) | 39 (12.4%) |
| 60 to 64 Years | 2 (0.7%) | 7 (2.2%) |
| 65 to 69 Years | 9 (3.2%) | 12 (3.8%) |
| 70 to 74 Years | 15 (5.4%) | 3 (0.9%) |
| 75 to 79 Years | 43 (15.4%) | 15 (4.8%) |
| 80 to 84 Years | 9 (3.2%) | 20 (6.4%) |
| 85 Years and over | 6 (2.1%) | 0 (0.0%) |
| Total | 280 (100.0%) | 315 (100.0%) |
Families and Households in Mount Vernon
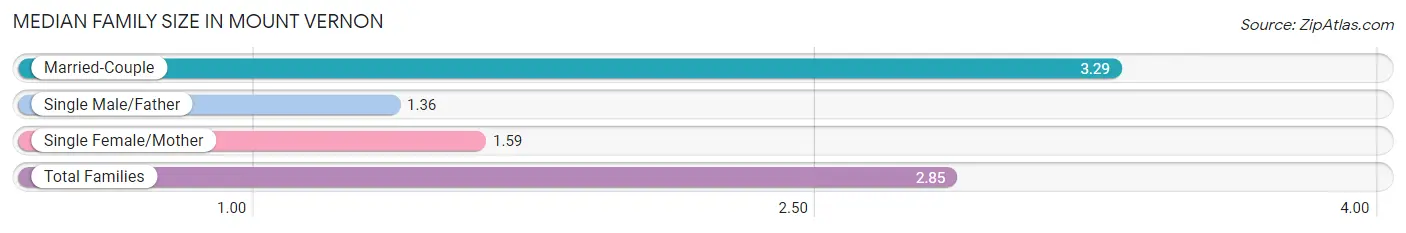
Median Family Size in Mount Vernon
The median family size in Mount Vernon is 2.85 persons per family, with married-couple families (97 | 75.8%) accounting for the largest median family size of 3.29 persons per family. On the other hand, single male/father families (14 | 10.9%) represent the smallest median family size with 1.36 persons per family.
| Family Type | # Families | Family Size |
| Married-Couple | 97 (75.8%) | 3.29 |
| Single Male/Father | 14 (10.9%) | 1.36 |
| Single Female/Mother | 17 (13.3%) | 1.59 |
| Total Families | 128 (100.0%) | 2.85 |
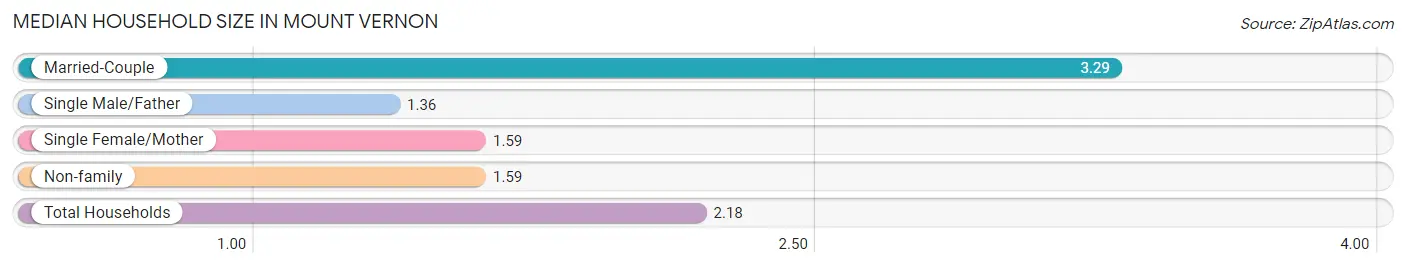
Median Household Size in Mount Vernon
The median household size in Mount Vernon is 2.18 persons per household, with married-couple households (97 | 35.5%) accounting for the largest median household size of 3.29 persons per household. single male/father households (14 | 5.1%) represent the smallest median household size with 1.36 persons per household.
| Household Type | # Households | Household Size |
| Married-Couple | 97 (35.5%) | 3.29 |
| Single Male/Father | 14 (5.1%) | 1.36 |
| Single Female/Mother | 17 (6.2%) | 1.59 |
| Non-family | 145 (53.1%) | 1.59 |
| Total Households | 273 (100.0%) | 2.18 |
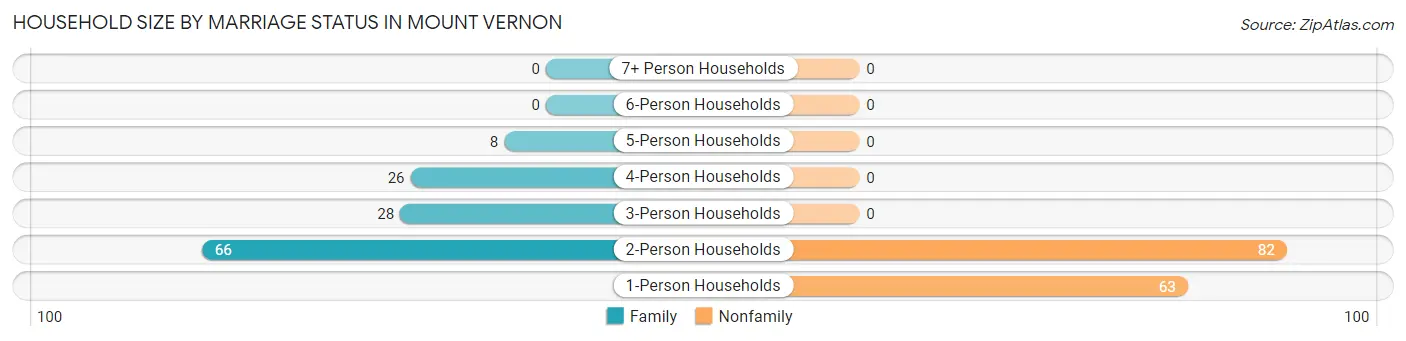
Household Size by Marriage Status in Mount Vernon
Out of a total of 273 households in Mount Vernon, 128 (46.9%) are family households, while 145 (53.1%) are nonfamily households. The most numerous type of family households are 2-person households, comprising 66, and the most common type of nonfamily households are 2-person households, comprising 82.
| Household Size | Family Households | Nonfamily Households |
| 1-Person Households | - | 63 (23.1%) |
| 2-Person Households | 66 (24.2%) | 82 (30.0%) |
| 3-Person Households | 28 (10.3%) | 0 (0.0%) |
| 4-Person Households | 26 (9.5%) | 0 (0.0%) |
| 5-Person Households | 8 (2.9%) | 0 (0.0%) |
| 6-Person Households | 0 (0.0%) | 0 (0.0%) |
| 7+ Person Households | 0 (0.0%) | 0 (0.0%) |
| Total | 128 (46.9%) | 145 (53.1%) |
Female Fertility in Mount Vernon
Fertility by Age in Mount Vernon
| Age Bracket | Women with Births | Births / 1,000 Women |
| 15 to 19 years | 0 (0.0%) | 0.0 |
| 20 to 34 years | 0 (0.0%) | 0.0 |
| 35 to 50 years | 0 (0.0%) | 0.0 |
| Total | 0 (0.0%) | 0.0 |
Fertility by Age by Marriage Status in Mount Vernon
| Age Bracket | Married | Unmarried |
| 15 to 19 years | 0 (0.0%) | 0 (0.0%) |
| 20 to 34 years | 0 (0.0%) | 0 (0.0%) |
| 35 to 50 years | 0 (0.0%) | 0 (0.0%) |
| Total | 0 (0.0%) | 0 (0.0%) |
Fertility by Education in Mount Vernon
| Educational Attainment | Women with Births | Births / 1,000 Women |
| Less than High School | 0 (0.0%) | 0.0 |
| High School Diploma | 0 (0.0%) | 0.0 |
| College or Associate's Degree | 0 (0.0%) | 0.0 |
| Bachelor's Degree | 0 (0.0%) | 0.0 |
| Graduate Degree | 0 (0.0%) | 0.0 |
| Total | 0 (0.0%) | 0.0 |
Fertility by Education by Marriage Status in Mount Vernon
| Educational Attainment | Married | Unmarried |
| Less than High School | 0 (0.0%) | 0 (0.0%) |
| High School Diploma | 0 (0.0%) | 0 (0.0%) |
| College or Associate's Degree | 0 (0.0%) | 0 (0.0%) |
| Bachelor's Degree | 0 (0.0%) | 0 (0.0%) |
| Graduate Degree | 0 (0.0%) | 0 (0.0%) |
| Total | 0 (0.0%) | 0 (0.0%) |
Income in Mount Vernon
Income Overview in Mount Vernon
Per Capita Income in Mount Vernon is $50,232, while median incomes of families and households are $89,375 and $62,422 respectively.
| Characteristic | Number | Measure |
| Per Capita Income | 595 | $50,232 |
| Median Family Income | 128 | $89,375 |
| Mean Family Income | 128 | $166,236 |
| Median Household Income | 273 | $62,422 |
| Mean Household Income | 273 | $109,641 |
| Income Deficit | 128 | $0 |
| Wage / Income Gap (%) | 595 | 54.18% |
| Wage / Income Gap ($) | 595 | 45.82¢ per $1 |
| Gini / Inequality Index | 595 | 0.56 |
Earnings by Sex in Mount Vernon
Average Earnings in Mount Vernon are $33,750, $61,458 for men and $28,162 for women, a difference of 54.2%.
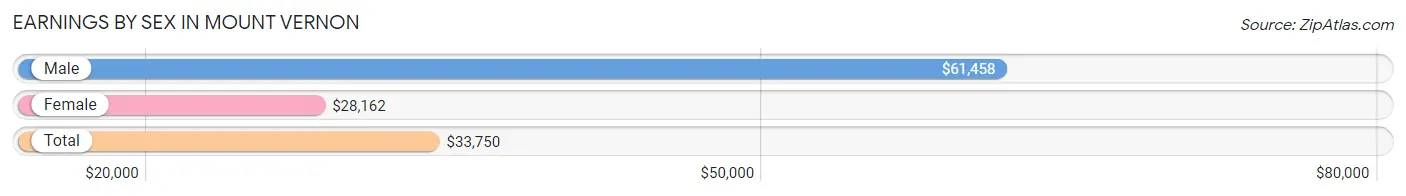
| Sex | Number | Average Earnings |
| Male | 148 (43.0%) | $61,458 |
| Female | 196 (57.0%) | $28,162 |
| Total | 344 (100.0%) | $33,750 |
Earnings by Sex by Income Bracket in Mount Vernon
The most common earnings brackets in Mount Vernon are $100,000+ for men (35 | 23.6%) and $25,000 to $29,999 for women (68 | 34.7%).
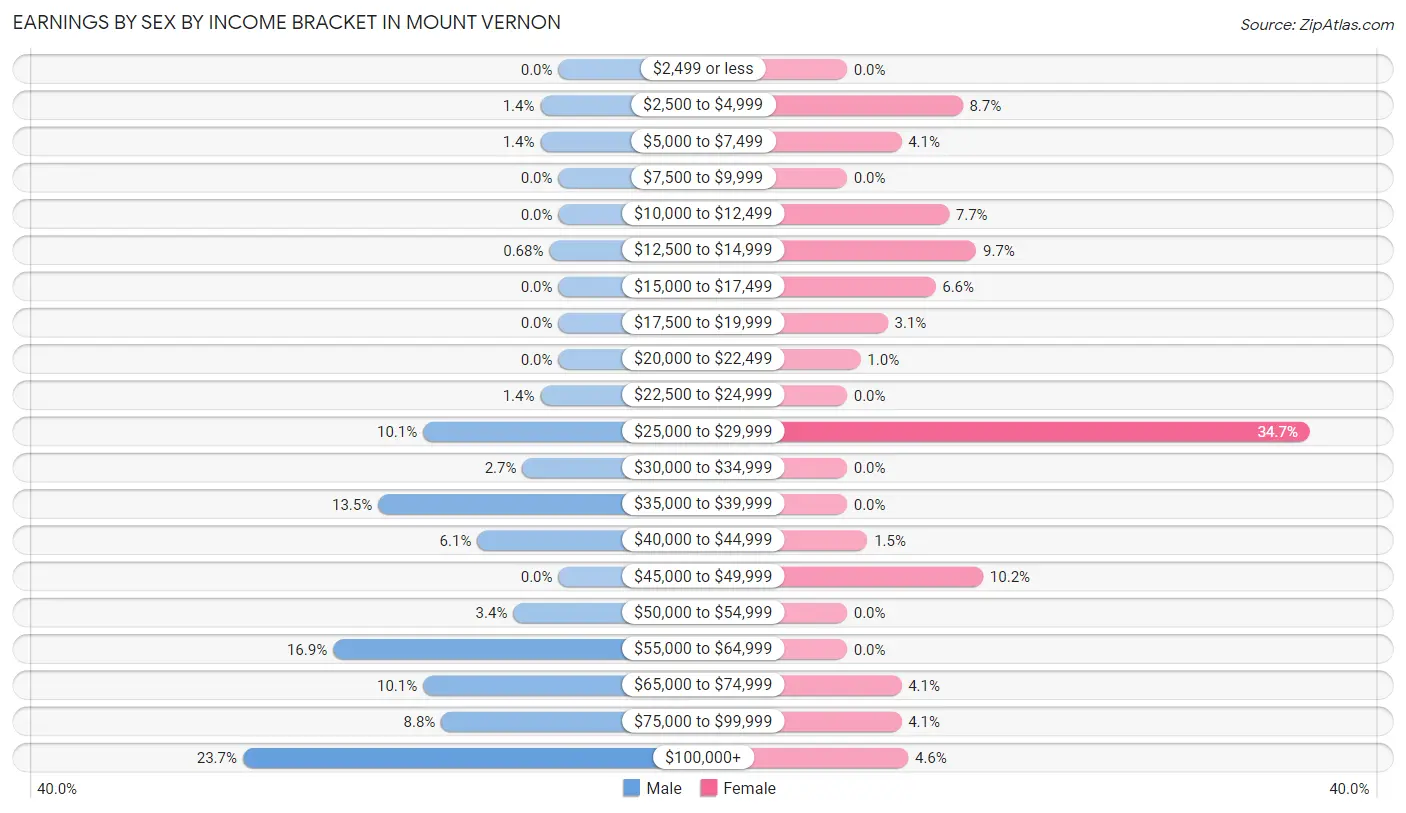
| Income | Male | Female |
| $2,499 or less | 0 (0.0%) | 0 (0.0%) |
| $2,500 to $4,999 | 2 (1.3%) | 17 (8.7%) |
| $5,000 to $7,499 | 2 (1.3%) | 8 (4.1%) |
| $7,500 to $9,999 | 0 (0.0%) | 0 (0.0%) |
| $10,000 to $12,499 | 0 (0.0%) | 15 (7.6%) |
| $12,500 to $14,999 | 1 (0.7%) | 19 (9.7%) |
| $15,000 to $17,499 | 0 (0.0%) | 13 (6.6%) |
| $17,500 to $19,999 | 0 (0.0%) | 6 (3.1%) |
| $20,000 to $22,499 | 0 (0.0%) | 2 (1.0%) |
| $22,500 to $24,999 | 2 (1.3%) | 0 (0.0%) |
| $25,000 to $29,999 | 15 (10.1%) | 68 (34.7%) |
| $30,000 to $34,999 | 4 (2.7%) | 0 (0.0%) |
| $35,000 to $39,999 | 20 (13.5%) | 0 (0.0%) |
| $40,000 to $44,999 | 9 (6.1%) | 3 (1.5%) |
| $45,000 to $49,999 | 0 (0.0%) | 20 (10.2%) |
| $50,000 to $54,999 | 5 (3.4%) | 0 (0.0%) |
| $55,000 to $64,999 | 25 (16.9%) | 0 (0.0%) |
| $65,000 to $74,999 | 15 (10.1%) | 8 (4.1%) |
| $75,000 to $99,999 | 13 (8.8%) | 8 (4.1%) |
| $100,000+ | 35 (23.6%) | 9 (4.6%) |
| Total | 148 (100.0%) | 196 (100.0%) |
Earnings by Sex by Educational Attainment in Mount Vernon
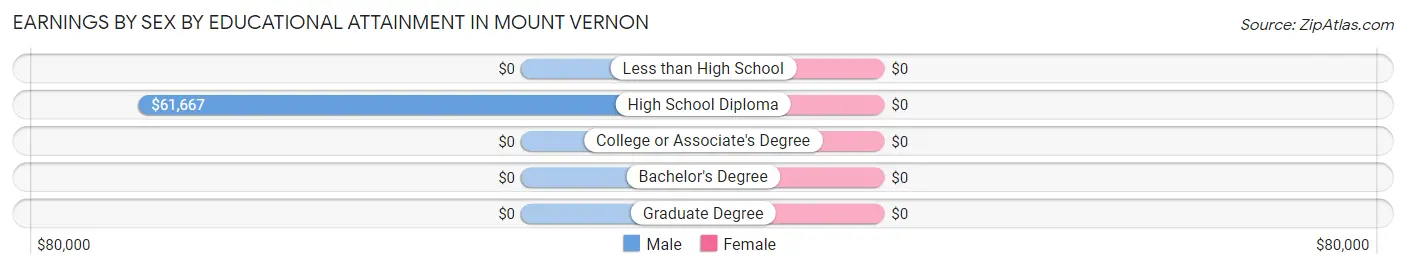
| Educational Attainment | Male Income | Female Income |
| Less than High School | - | - |
| High School Diploma | $61,667 | $0 |
| College or Associate's Degree | - | - |
| Bachelor's Degree | - | - |
| Graduate Degree | - | - |
| Total | $62,083 | $28,047 |
Family Income in Mount Vernon
Family Income Brackets in Mount Vernon
According to the Mount Vernon family income data, there are 48 families falling into the $75,000 to $99,999 income range, which is the most common income bracket and makes up 37.5% of all families.
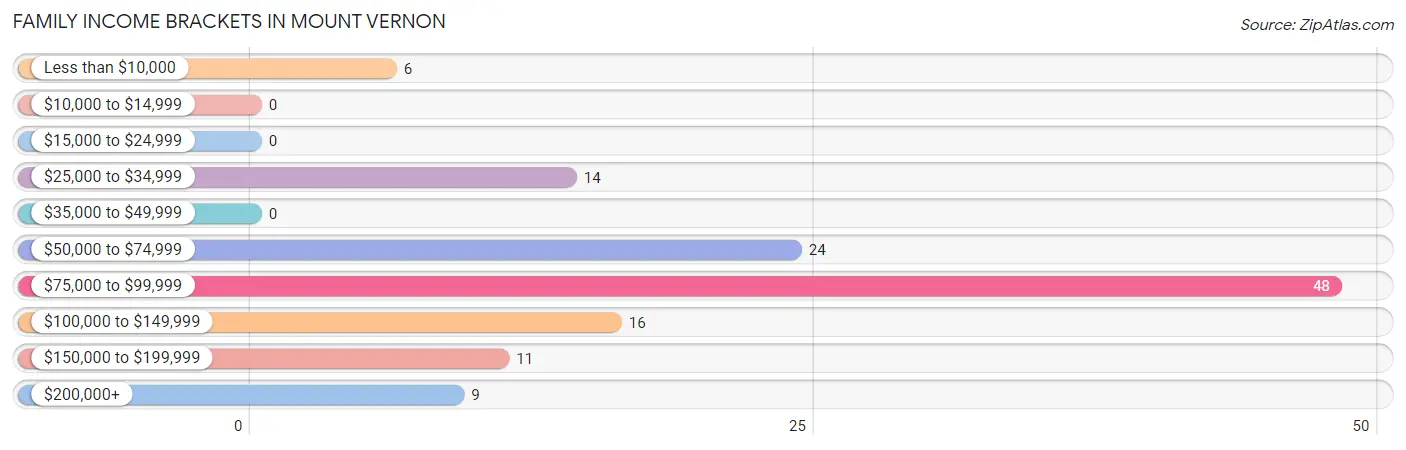
| Income Bracket | # Families | % Families |
| Less than $10,000 | 6 | 4.7% |
| $10,000 to $14,999 | 0 | 0.0% |
| $15,000 to $24,999 | 0 | 0.0% |
| $25,000 to $34,999 | 14 | 10.9% |
| $35,000 to $49,999 | 0 | 0.0% |
| $50,000 to $74,999 | 24 | 18.8% |
| $75,000 to $99,999 | 48 | 37.5% |
| $100,000 to $149,999 | 16 | 12.5% |
| $150,000 to $199,999 | 11 | 8.6% |
| $200,000+ | 9 | 7.0% |
Family Income by Famaliy Size in Mount Vernon
3-person families (28 | 21.9%) account for the highest median family income in Mount Vernon with $145,357 per family, while 3-person families (28 | 21.9%) have the highest median income of $48,452 per family member.
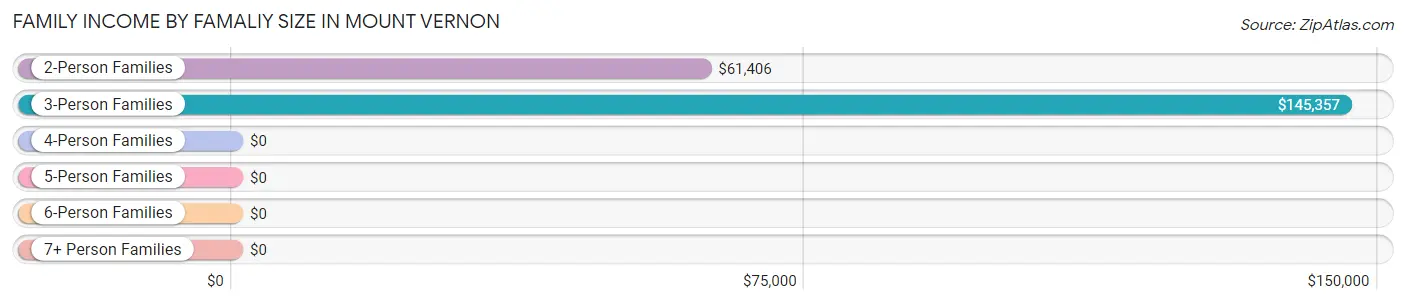
| Income Bracket | # Families | Median Income |
| 2-Person Families | 66 (51.6%) | $61,406 |
| 3-Person Families | 28 (21.9%) | $145,357 |
| 4-Person Families | 26 (20.3%) | $0 |
| 5-Person Families | 8 (6.2%) | $0 |
| 6-Person Families | 0 (0.0%) | $0 |
| 7+ Person Families | 0 (0.0%) | $0 |
| Total | 128 (100.0%) | $89,375 |
Family Income by Number of Earners in Mount Vernon
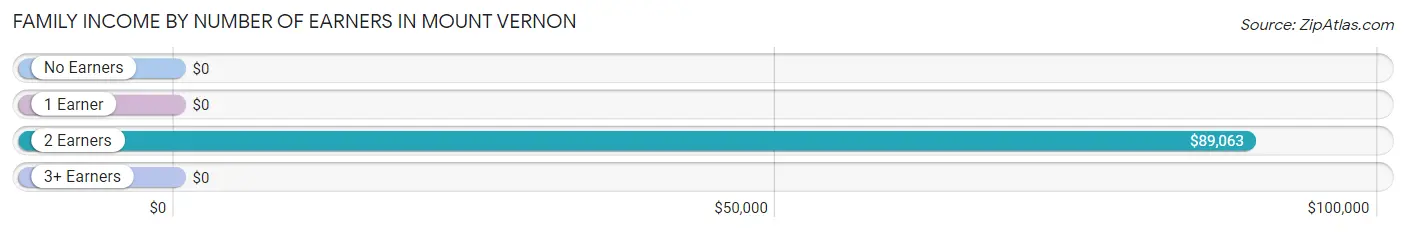
| Number of Earners | # Families | Median Income |
| No Earners | 27 (21.1%) | $0 |
| 1 Earner | 28 (21.9%) | $0 |
| 2 Earners | 46 (35.9%) | $89,063 |
| 3+ Earners | 27 (21.1%) | $0 |
| Total | 128 (100.0%) | $89,375 |
Household Income in Mount Vernon
Household Income Brackets in Mount Vernon
With 54 households falling in the category, the $100,000 to $149,999 income range is the most frequent in Mount Vernon, accounting for 19.8% of all households. In contrast, only 4 households (1.5%) fall into the $10,000 to $14,999 income bracket, making it the least populous group.
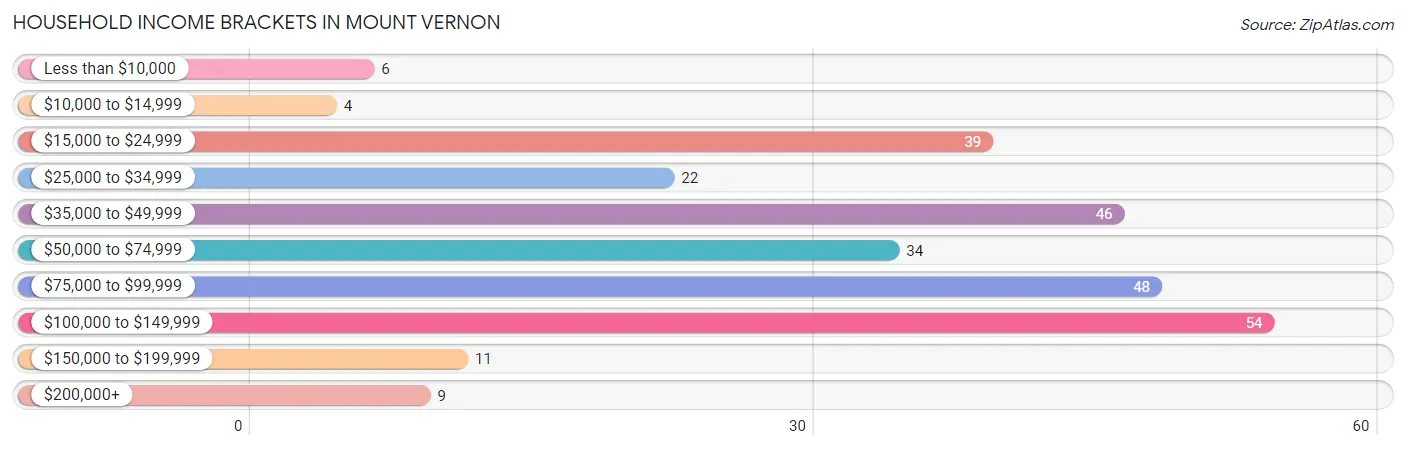
| Income Bracket | # Households | % Households |
| Less than $10,000 | 6 | 2.2% |
| $10,000 to $14,999 | 4 | 1.5% |
| $15,000 to $24,999 | 39 | 14.3% |
| $25,000 to $34,999 | 22 | 8.1% |
| $35,000 to $49,999 | 46 | 16.8% |
| $50,000 to $74,999 | 34 | 12.5% |
| $75,000 to $99,999 | 48 | 17.6% |
| $100,000 to $149,999 | 54 | 19.8% |
| $150,000 to $199,999 | 11 | 4.0% |
| $200,000+ | 9 | 3.3% |
Household Income by Householder Age in Mount Vernon
The median household income in Mount Vernon is $62,422, with the highest median household income of $91,316 found in the 45 to 64 years age bracket for the primary householder. A total of 86 households (31.5%) fall into this category.
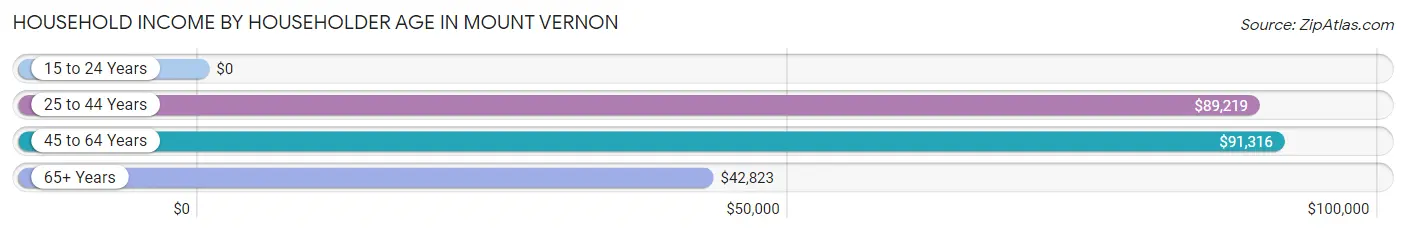
| Income Bracket | # Households | Median Income |
| 15 to 24 Years | 0 (0.0%) | $0 |
| 25 to 44 Years | 81 (29.7%) | $89,219 |
| 45 to 64 Years | 86 (31.5%) | $91,316 |
| 65+ Years | 106 (38.8%) | $42,823 |
| Total | 273 (100.0%) | $62,422 |
Poverty in Mount Vernon
Income Below Poverty by Sex and Age in Mount Vernon
With 7.5% poverty level for males and 9.8% for females among the residents of Mount Vernon, 25 to 34 year old males and 55 to 64 year old females are the most vulnerable to poverty, with 13 males (23.2%) and 15 females (32.6%) in their respective age groups living below the poverty level.
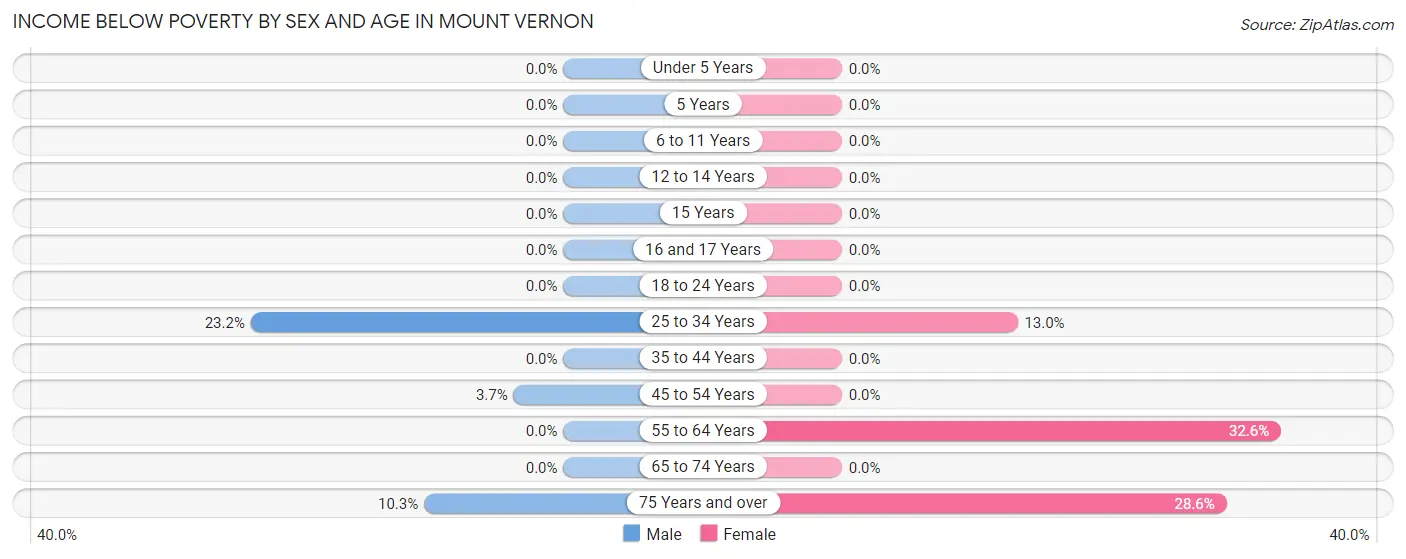
| Age Bracket | Male | Female |
| Under 5 Years | 0 (0.0%) | 0 (0.0%) |
| 5 Years | 0 (0.0%) | 0 (0.0%) |
| 6 to 11 Years | 0 (0.0%) | 0 (0.0%) |
| 12 to 14 Years | 0 (0.0%) | 0 (0.0%) |
| 15 Years | 0 (0.0%) | 0 (0.0%) |
| 16 and 17 Years | 0 (0.0%) | 0 (0.0%) |
| 18 to 24 Years | 0 (0.0%) | 0 (0.0%) |
| 25 to 34 Years | 13 (23.2%) | 6 (13.0%) |
| 35 to 44 Years | 0 (0.0%) | 0 (0.0%) |
| 45 to 54 Years | 2 (3.7%) | 0 (0.0%) |
| 55 to 64 Years | 0 (0.0%) | 15 (32.6%) |
| 65 to 74 Years | 0 (0.0%) | 0 (0.0%) |
| 75 Years and over | 6 (10.3%) | 10 (28.6%) |
| Total | 21 (7.5%) | 31 (9.8%) |
Income Above Poverty by Sex and Age in Mount Vernon
According to the poverty statistics in Mount Vernon, males aged under 5 years and females aged 5 years are the age groups that are most secure financially, with 100.0% of males and 100.0% of females in these age groups living above the poverty line.
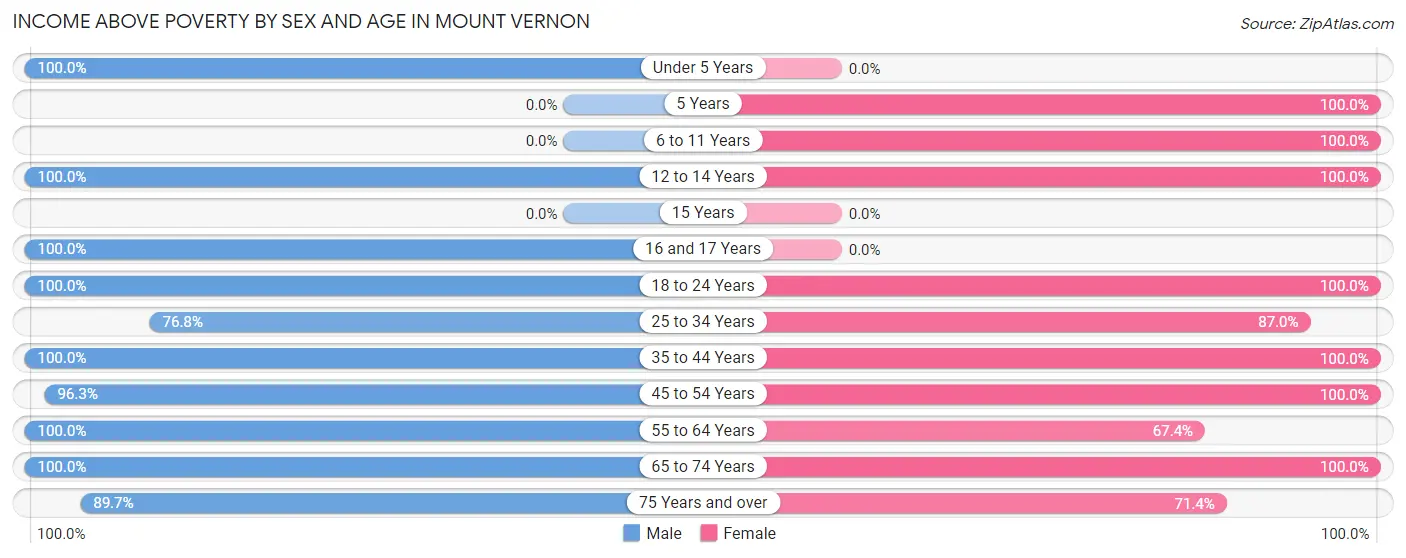
| Age Bracket | Male | Female |
| Under 5 Years | 17 (100.0%) | 0 (0.0%) |
| 5 Years | 0 (0.0%) | 9 (100.0%) |
| 6 to 11 Years | 0 (0.0%) | 9 (100.0%) |
| 12 to 14 Years | 18 (100.0%) | 26 (100.0%) |
| 15 Years | 0 (0.0%) | 0 (0.0%) |
| 16 and 17 Years | 8 (100.0%) | 0 (0.0%) |
| 18 to 24 Years | 12 (100.0%) | 75 (100.0%) |
| 25 to 34 Years | 43 (76.8%) | 40 (87.0%) |
| 35 to 44 Years | 27 (100.0%) | 3 (100.0%) |
| 45 to 54 Years | 52 (96.3%) | 51 (100.0%) |
| 55 to 64 Years | 6 (100.0%) | 31 (67.4%) |
| 65 to 74 Years | 24 (100.0%) | 15 (100.0%) |
| 75 Years and over | 52 (89.7%) | 25 (71.4%) |
| Total | 259 (92.5%) | 284 (90.2%) |
Income Below Poverty Among Married-Couple Families in Mount Vernon
The poverty statistics for married-couple families in Mount Vernon show that 6.2% or 6 of the total 97 families live below the poverty line. Families with no children have the highest poverty rate of 9.7%, comprising of 6 families. On the other hand, families with 1 or 2 children have the lowest poverty rate of 0.0%, which includes 0 families.
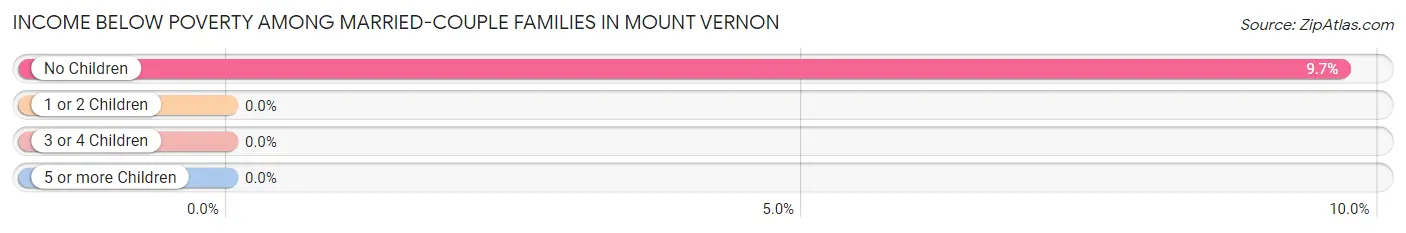
| Children | Above Poverty | Below Poverty |
| No Children | 56 (90.3%) | 6 (9.7%) |
| 1 or 2 Children | 27 (100.0%) | 0 (0.0%) |
| 3 or 4 Children | 8 (100.0%) | 0 (0.0%) |
| 5 or more Children | 0 (0.0%) | 0 (0.0%) |
| Total | 91 (93.8%) | 6 (6.2%) |
Income Below Poverty Among Single-Parent Households in Mount Vernon
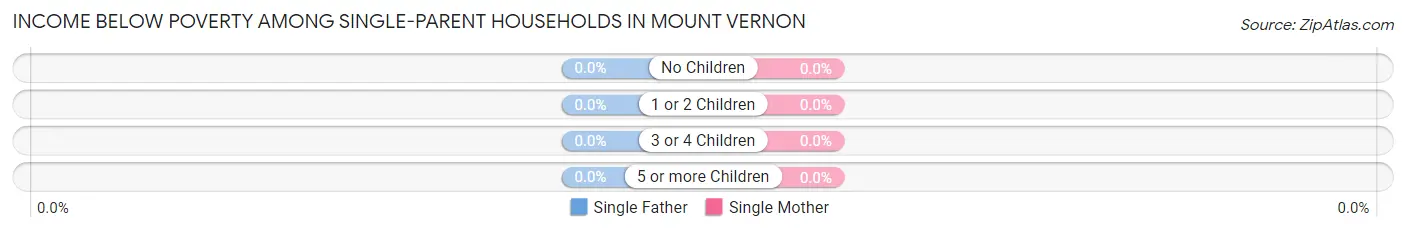
| Children | Single Father | Single Mother |
| No Children | 0 (0.0%) | 0 (0.0%) |
| 1 or 2 Children | 0 (0.0%) | 0 (0.0%) |
| 3 or 4 Children | 0 (0.0%) | 0 (0.0%) |
| 5 or more Children | 0 (0.0%) | 0 (0.0%) |
| Total | 0 (0.0%) | 0 (0.0%) |
Income Below Poverty Among Married-Couple vs Single-Parent Households in Mount Vernon
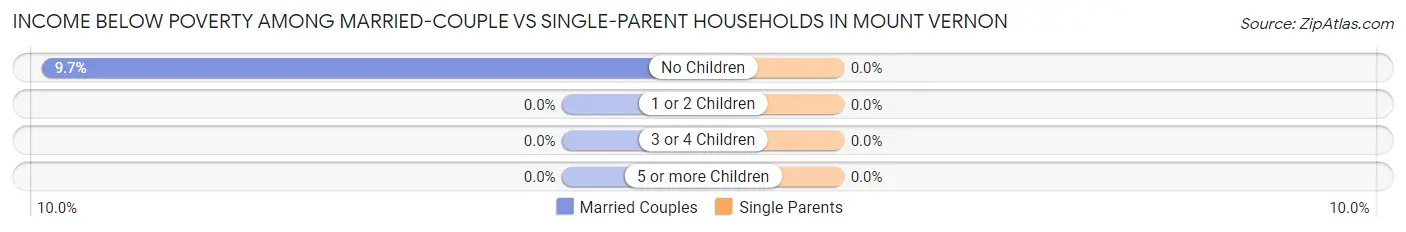
| Children | Married-Couple Families | Single-Parent Households |
| No Children | 6 (9.7%) | 0 (0.0%) |
| 1 or 2 Children | 0 (0.0%) | 0 (0.0%) |
| 3 or 4 Children | 0 (0.0%) | 0 (0.0%) |
| 5 or more Children | 0 (0.0%) | 0 (0.0%) |
| Total | 6 (6.2%) | 0 (0.0%) |
Employment Characteristics in Mount Vernon
Employment by Class of Employer in Mount Vernon
Among the 293 employed individuals in Mount Vernon, private company employees (186 | 63.5%), not-for-profit organizations (47 | 16.0%), and local government employees (26 | 8.9%) make up the most common classes of employment.
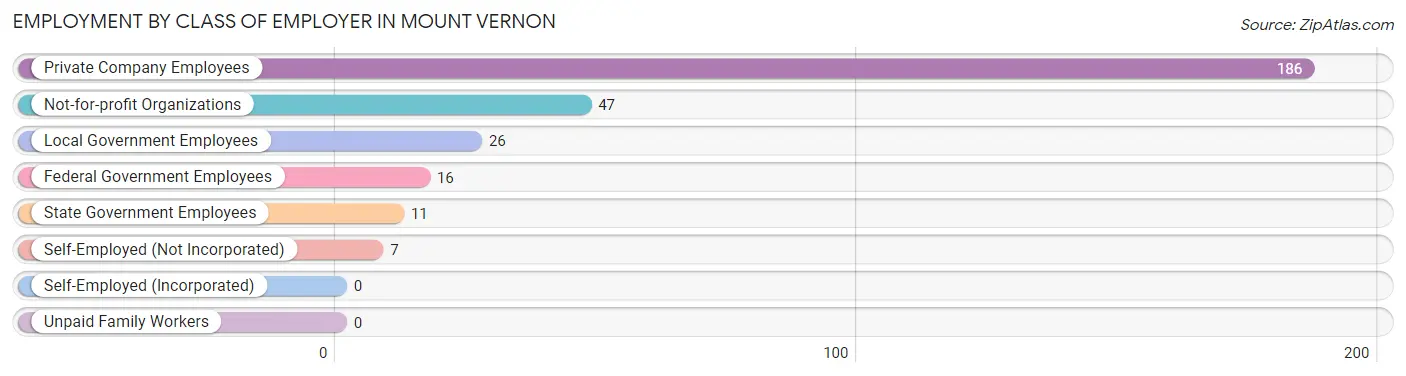
| Employer Class | # Employees | % Employees |
| Private Company Employees | 186 | 63.5% |
| Self-Employed (Incorporated) | 0 | 0.0% |
| Self-Employed (Not Incorporated) | 7 | 2.4% |
| Not-for-profit Organizations | 47 | 16.0% |
| Local Government Employees | 26 | 8.9% |
| State Government Employees | 11 | 3.7% |
| Federal Government Employees | 16 | 5.5% |
| Unpaid Family Workers | 0 | 0.0% |
| Total | 293 | 100.0% |
Employment Status by Age in Mount Vernon
According to the labor force statistics for Mount Vernon, out of the total population over 16 years of age (516), 66.9% or 345 individuals are in the labor force, with 13.0% or 45 of them unemployed. The age group with the highest labor force participation rate is 20 to 24 years, with 100.0% or 64 individuals in the labor force. Within the labor force, the 25 to 29 years age range has the highest percentage of unemployed individuals, with 41.2% or 28 of them being unemployed.
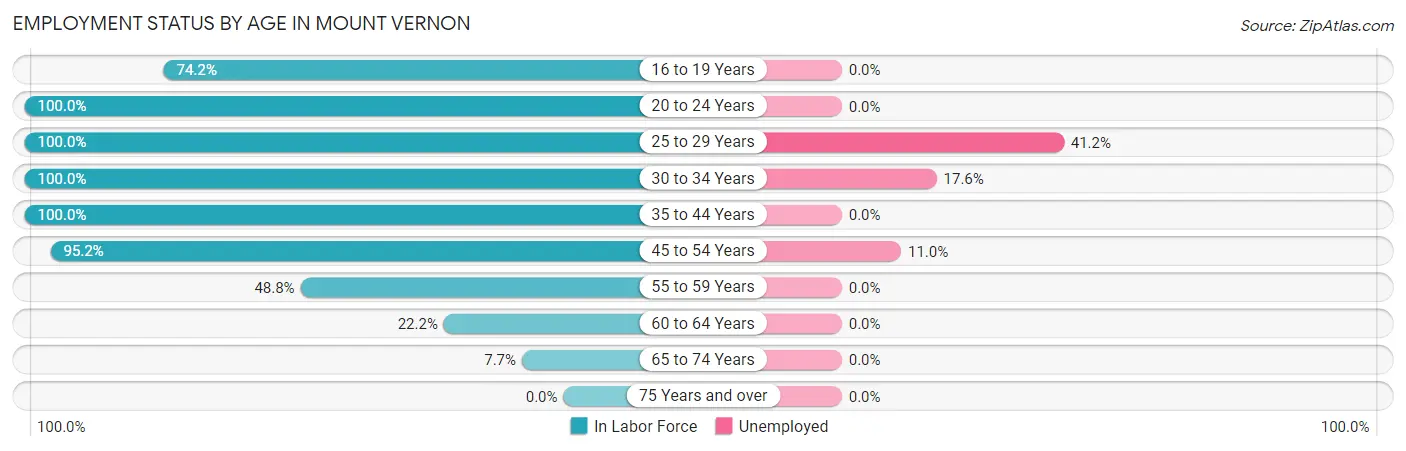
| Age Bracket | In Labor Force | Unemployed |
| 16 to 19 Years | 23 (74.2%) | 0 (0.0%) |
| 20 to 24 Years | 64 (100.0%) | 0 (0.0%) |
| 25 to 29 Years | 68 (100.0%) | 28 (41.2%) |
| 30 to 34 Years | 34 (100.0%) | 6 (17.6%) |
| 35 to 44 Years | 30 (100.0%) | 0 (0.0%) |
| 45 to 54 Years | 100 (95.2%) | 11 (11.0%) |
| 55 to 59 Years | 21 (48.8%) | 0 (0.0%) |
| 60 to 64 Years | 2 (22.2%) | 0 (0.0%) |
| 65 to 74 Years | 3 (7.7%) | 0 (0.0%) |
| 75 Years and over | 0 (0.0%) | 0 (0.0%) |
| Total | 345 (66.9%) | 45 (13.0%) |
Employment Status by Educational Attainment in Mount Vernon
According to labor force statistics for Mount Vernon, 88.2% of individuals (255) out of the total population between 25 and 64 years of age (289) are in the labor force, with 17.6% or 45 of them being unemployed. The group with the highest labor force participation rate are those with the educational attainment of less than high school, with 100.0% or 37 individuals in the labor force. Within the labor force, individuals with less than high school education have the highest percentage of unemployment, with 45.9% or 17 of them being unemployed.
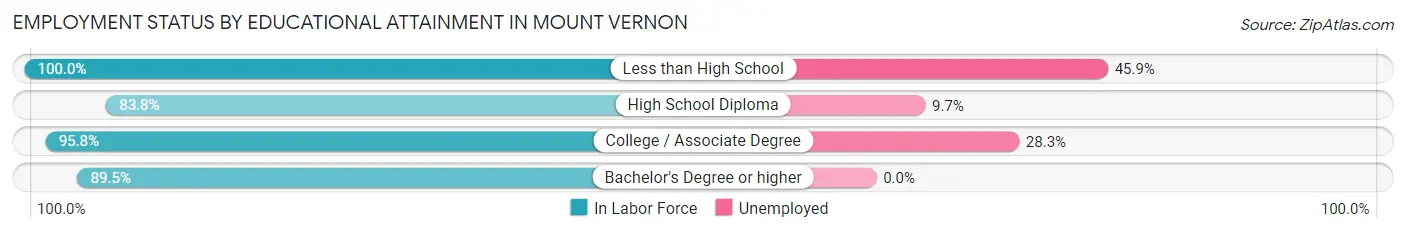
| Educational Attainment | In Labor Force | Unemployed |
| Less than High School | 37 (100.0%) | 17 (45.9%) |
| High School Diploma | 155 (83.8%) | 18 (9.7%) |
| College / Associate Degree | 46 (95.8%) | 14 (28.3%) |
| Bachelor's Degree or higher | 17 (89.5%) | 0 (0.0%) |
| Total | 255 (88.2%) | 51 (17.6%) |
Employment Occupations by Sex in Mount Vernon
Management, Business, Science and Arts Occupations
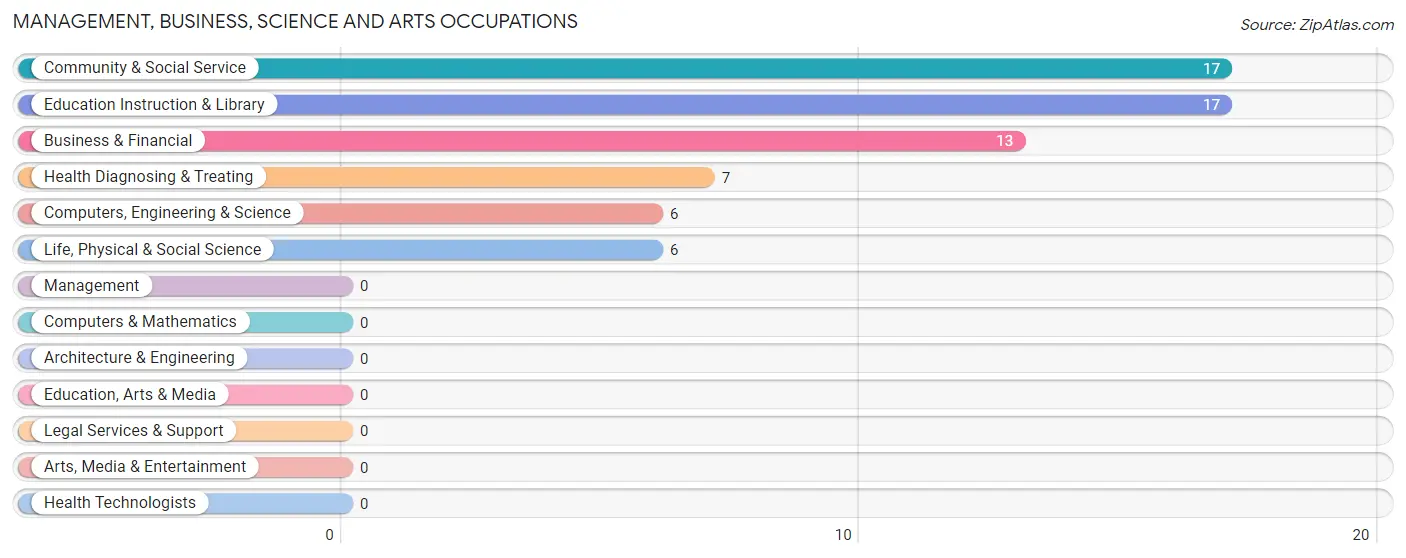
The most common Management, Business, Science and Arts occupations in Mount Vernon are Community & Social Service (17 | 5.7%), Education Instruction & Library (17 | 5.7%), Business & Financial (13 | 4.3%), Health Diagnosing & Treating (7 | 2.3%), and Computers, Engineering & Science (6 | 2.0%).
Management, Business, Science and Arts Occupations by Sex
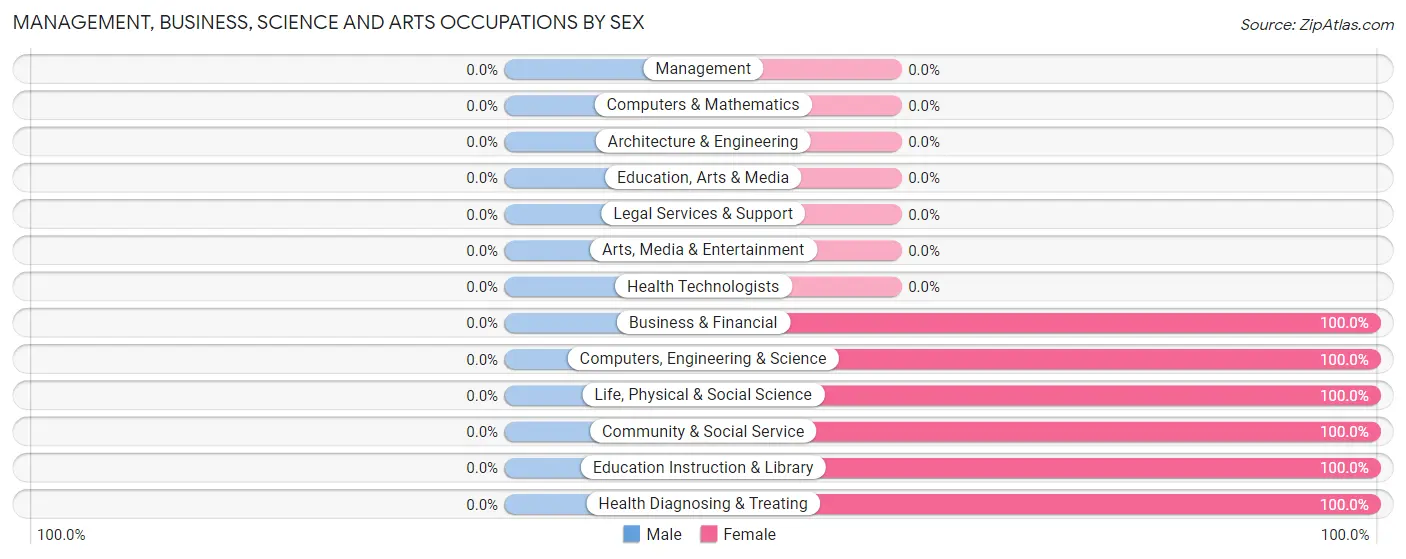
| Occupation | Male | Female |
| Management | 0 (0.0%) | 0 (0.0%) |
| Business & Financial | 0 (0.0%) | 13 (100.0%) |
| Computers, Engineering & Science | 0 (0.0%) | 6 (100.0%) |
| Computers & Mathematics | 0 (0.0%) | 0 (0.0%) |
| Architecture & Engineering | 0 (0.0%) | 0 (0.0%) |
| Life, Physical & Social Science | 0 (0.0%) | 6 (100.0%) |
| Community & Social Service | 0 (0.0%) | 17 (100.0%) |
| Education, Arts & Media | 0 (0.0%) | 0 (0.0%) |
| Legal Services & Support | 0 (0.0%) | 0 (0.0%) |
| Education Instruction & Library | 0 (0.0%) | 17 (100.0%) |
| Arts, Media & Entertainment | 0 (0.0%) | 0 (0.0%) |
| Health Diagnosing & Treating | 0 (0.0%) | 7 (100.0%) |
| Health Technologists | 0 (0.0%) | 0 (0.0%) |
| Total (Category) | 0 (0.0%) | 43 (100.0%) |
| Total (Overall) | 136 (45.3%) | 164 (54.7%) |
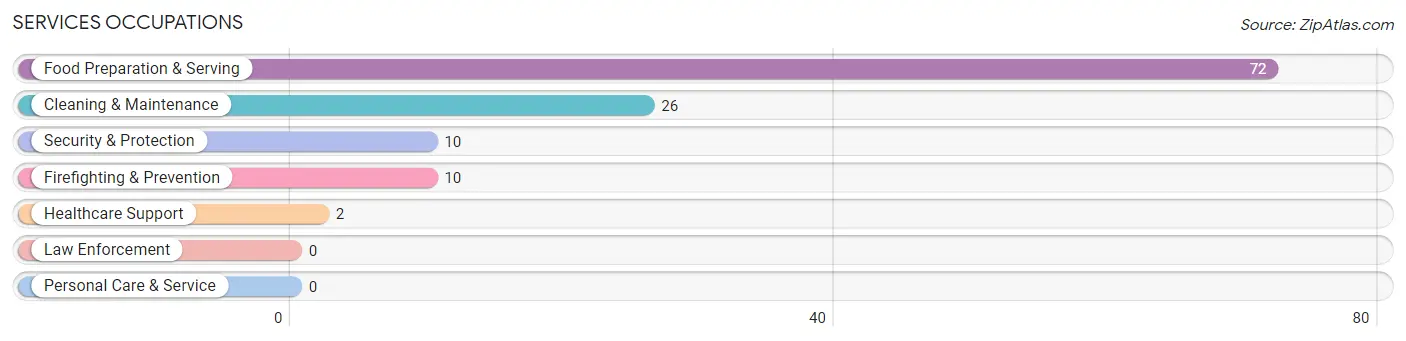
Services Occupations
The most common Services occupations in Mount Vernon are Food Preparation & Serving (72 | 24.0%), Cleaning & Maintenance (26 | 8.7%), Security & Protection (10 | 3.3%), Firefighting & Prevention (10 | 3.3%), and Healthcare Support (2 | 0.7%).
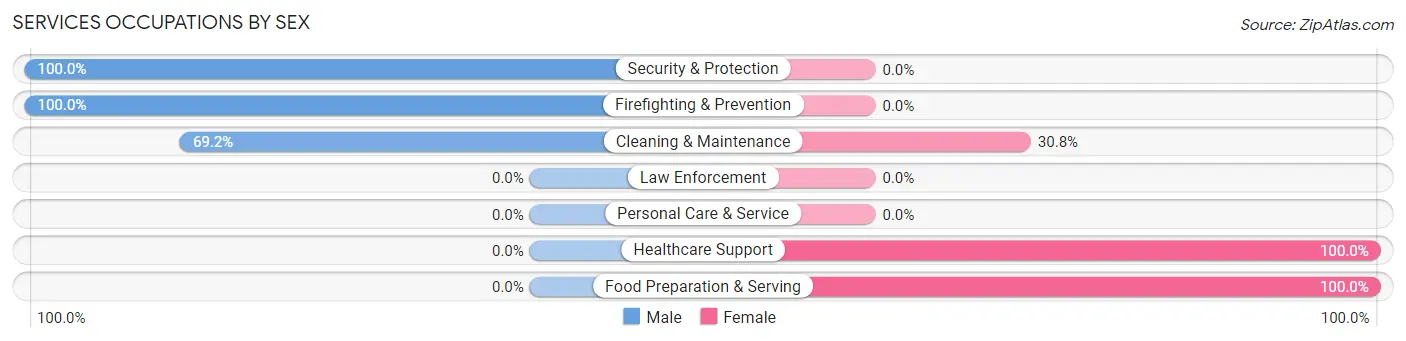
Services Occupations by Sex
Within the Services occupations in Mount Vernon, the most male-oriented occupations are Security & Protection (100.0%), Firefighting & Prevention (100.0%), and Cleaning & Maintenance (69.2%), while the most female-oriented occupations are Healthcare Support (100.0%), Food Preparation & Serving (100.0%), and Cleaning & Maintenance (30.8%).
| Occupation | Male | Female |
| Healthcare Support | 0 (0.0%) | 2 (100.0%) |
| Security & Protection | 10 (100.0%) | 0 (0.0%) |
| Firefighting & Prevention | 10 (100.0%) | 0 (0.0%) |
| Law Enforcement | 0 (0.0%) | 0 (0.0%) |
| Food Preparation & Serving | 0 (0.0%) | 72 (100.0%) |
| Cleaning & Maintenance | 18 (69.2%) | 8 (30.8%) |
| Personal Care & Service | 0 (0.0%) | 0 (0.0%) |
| Total (Category) | 28 (25.5%) | 82 (74.6%) |
| Total (Overall) | 136 (45.3%) | 164 (54.7%) |
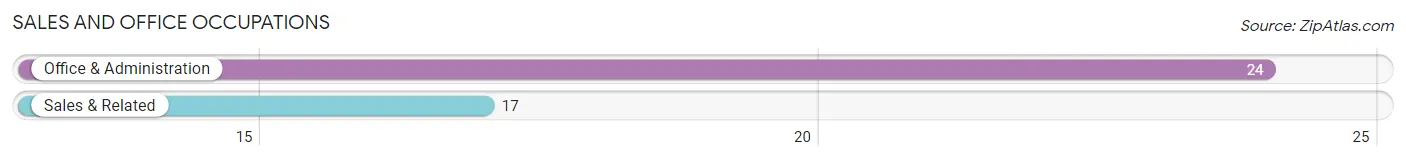
Sales and Office Occupations
The most common Sales and Office occupations in Mount Vernon are Office & Administration (24 | 8.0%), and Sales & Related (17 | 5.7%).
Sales and Office Occupations by Sex
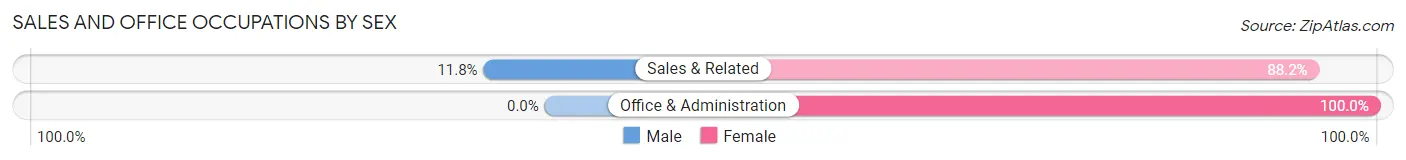
| Occupation | Male | Female |
| Sales & Related | 2 (11.8%) | 15 (88.2%) |
| Office & Administration | 0 (0.0%) | 24 (100.0%) |
| Total (Category) | 2 (4.9%) | 39 (95.1%) |
| Total (Overall) | 136 (45.3%) | 164 (54.7%) |
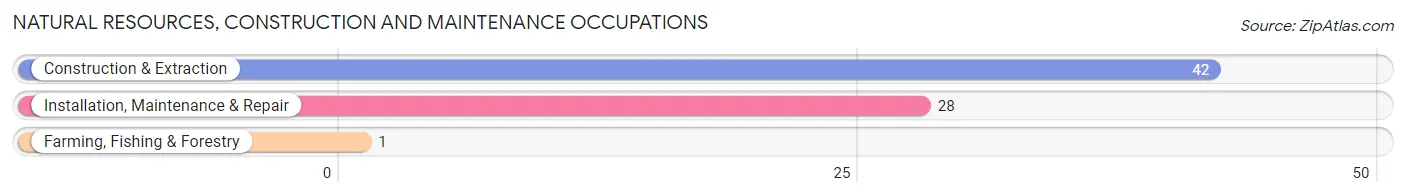
Natural Resources, Construction and Maintenance Occupations
The most common Natural Resources, Construction and Maintenance occupations in Mount Vernon are Construction & Extraction (42 | 14.0%), Installation, Maintenance & Repair (28 | 9.3%), and Farming, Fishing & Forestry (1 | 0.3%).
Natural Resources, Construction and Maintenance Occupations by Sex
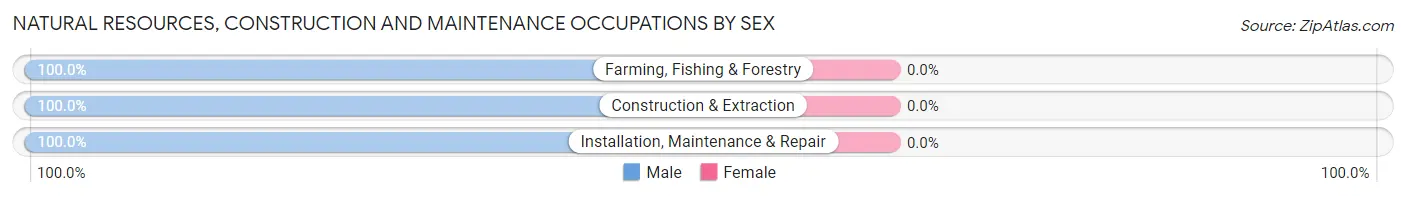
| Occupation | Male | Female |
| Farming, Fishing & Forestry | 1 (100.0%) | 0 (0.0%) |
| Construction & Extraction | 42 (100.0%) | 0 (0.0%) |
| Installation, Maintenance & Repair | 28 (100.0%) | 0 (0.0%) |
| Total (Category) | 71 (100.0%) | 0 (0.0%) |
| Total (Overall) | 136 (45.3%) | 164 (54.7%) |
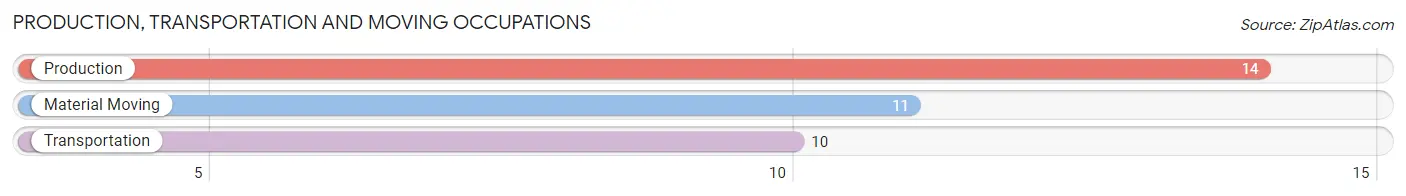
Production, Transportation and Moving Occupations
The most common Production, Transportation and Moving occupations in Mount Vernon are Production (14 | 4.7%), Material Moving (11 | 3.7%), and Transportation (10 | 3.3%).
Production, Transportation and Moving Occupations by Sex
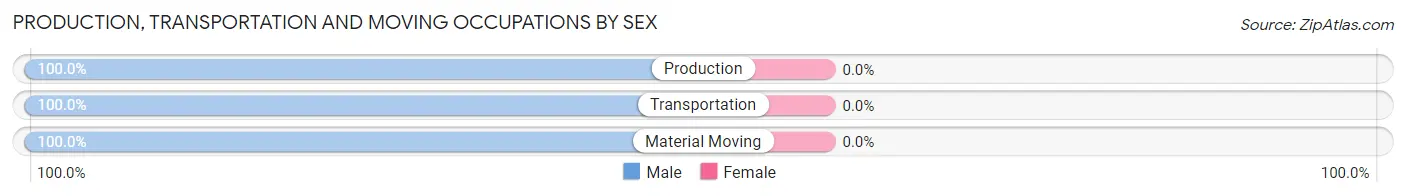
| Occupation | Male | Female |
| Production | 14 (100.0%) | 0 (0.0%) |
| Transportation | 10 (100.0%) | 0 (0.0%) |
| Material Moving | 11 (100.0%) | 0 (0.0%) |
| Total (Category) | 35 (100.0%) | 0 (0.0%) |
| Total (Overall) | 136 (45.3%) | 164 (54.7%) |
Employment Industries by Sex in Mount Vernon
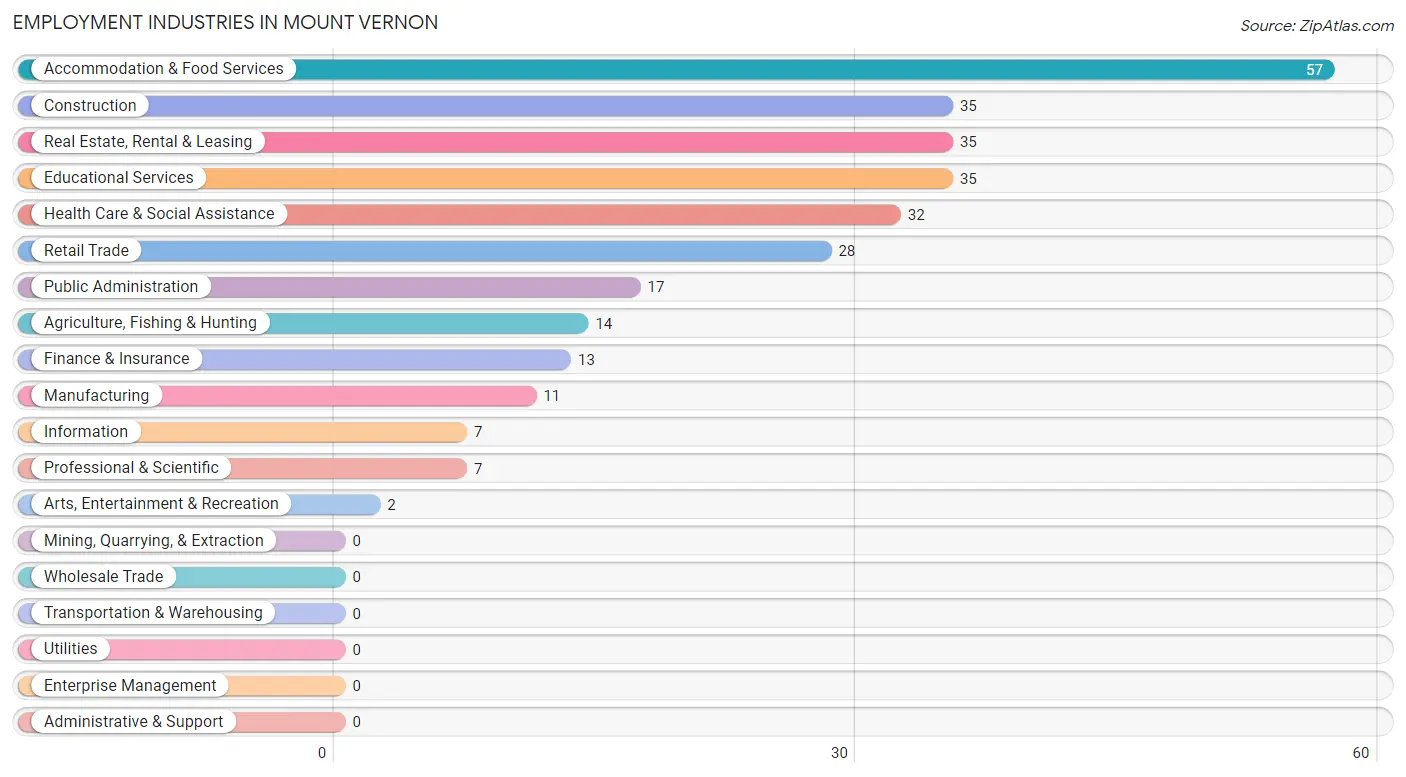
Employment Industries in Mount Vernon
The major employment industries in Mount Vernon include Accommodation & Food Services (57 | 19.0%), Construction (35 | 11.7%), Real Estate, Rental & Leasing (35 | 11.7%), Educational Services (35 | 11.7%), and Health Care & Social Assistance (32 | 10.7%).
Employment Industries by Sex in Mount Vernon
The Mount Vernon industries that see more men than women are Construction (100.0%), Manufacturing (100.0%), and Arts, Entertainment & Recreation (100.0%), whereas the industries that tend to have a higher number of women are Information (100.0%), Finance & Insurance (100.0%), and Professional & Scientific (100.0%).
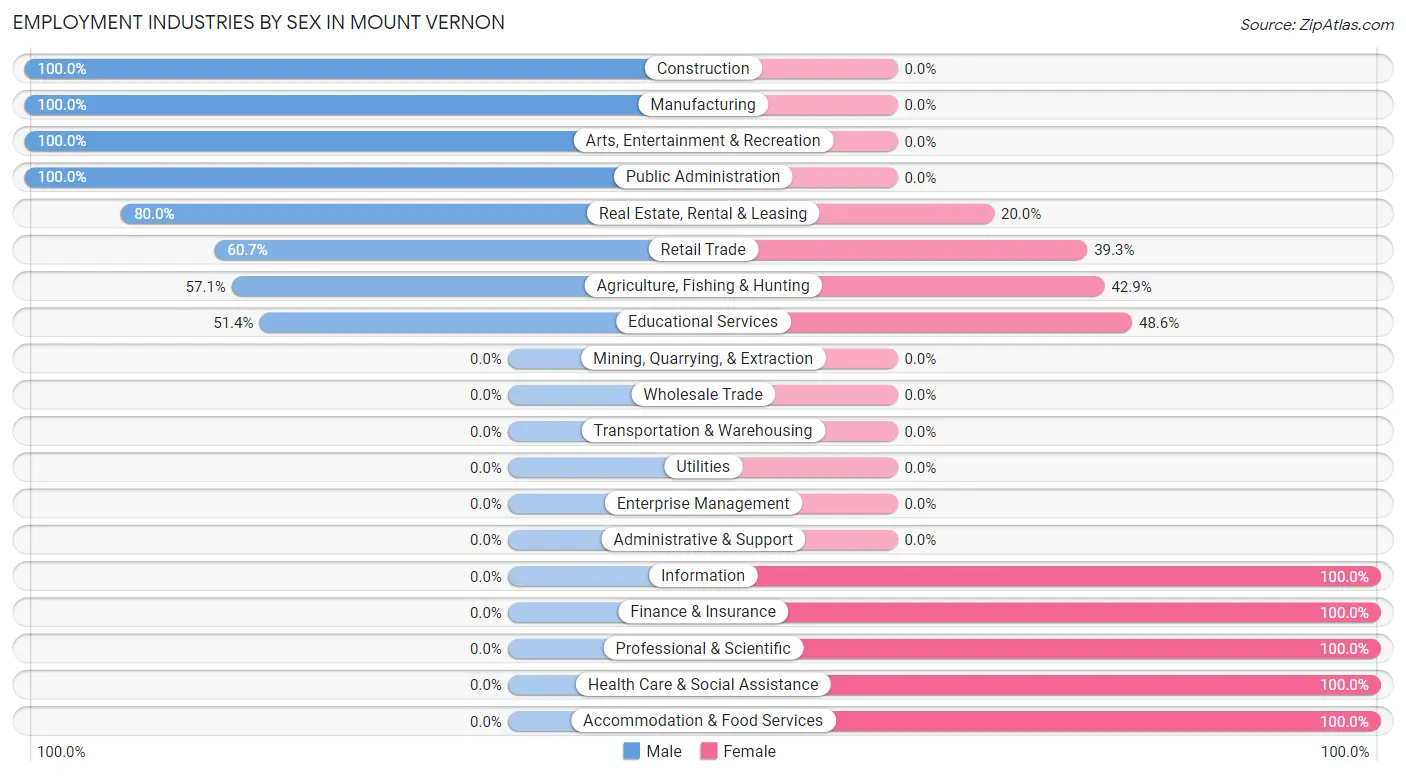
| Industry | Male | Female |
| Agriculture, Fishing & Hunting | 8 (57.1%) | 6 (42.9%) |
| Mining, Quarrying, & Extraction | 0 (0.0%) | 0 (0.0%) |
| Construction | 35 (100.0%) | 0 (0.0%) |
| Manufacturing | 11 (100.0%) | 0 (0.0%) |
| Wholesale Trade | 0 (0.0%) | 0 (0.0%) |
| Retail Trade | 17 (60.7%) | 11 (39.3%) |
| Transportation & Warehousing | 0 (0.0%) | 0 (0.0%) |
| Utilities | 0 (0.0%) | 0 (0.0%) |
| Information | 0 (0.0%) | 7 (100.0%) |
| Finance & Insurance | 0 (0.0%) | 13 (100.0%) |
| Real Estate, Rental & Leasing | 28 (80.0%) | 7 (20.0%) |
| Professional & Scientific | 0 (0.0%) | 7 (100.0%) |
| Enterprise Management | 0 (0.0%) | 0 (0.0%) |
| Administrative & Support | 0 (0.0%) | 0 (0.0%) |
| Educational Services | 18 (51.4%) | 17 (48.6%) |
| Health Care & Social Assistance | 0 (0.0%) | 32 (100.0%) |
| Arts, Entertainment & Recreation | 2 (100.0%) | 0 (0.0%) |
| Accommodation & Food Services | 0 (0.0%) | 57 (100.0%) |
| Public Administration | 17 (100.0%) | 0 (0.0%) |
| Total | 136 (45.3%) | 164 (54.7%) |
Education in Mount Vernon
School Enrollment in Mount Vernon
The most common levels of schooling among the 122 students in Mount Vernon are middle school (53 | 43.4%), high school (31 | 25.4%), and nursery / preschool (26 | 21.3%).
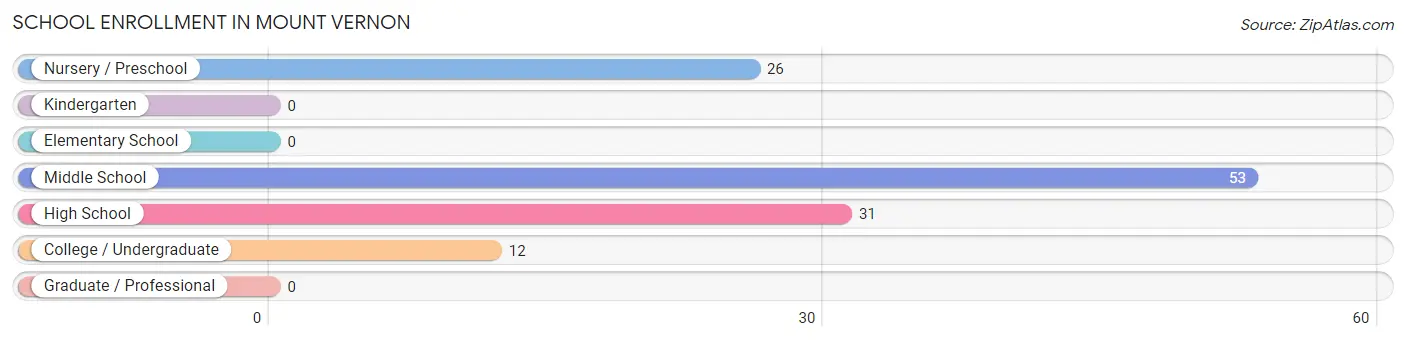
| School Level | # Students | % Students |
| Nursery / Preschool | 26 | 21.3% |
| Kindergarten | 0 | 0.0% |
| Elementary School | 0 | 0.0% |
| Middle School | 53 | 43.4% |
| High School | 31 | 25.4% |
| College / Undergraduate | 12 | 9.8% |
| Graduate / Professional | 0 | 0.0% |
| Total | 122 | 100.0% |
School Enrollment by Age by Funding Source in Mount Vernon
Out of a total of 122 students who are enrolled in schools in Mount Vernon, 28 (23.0%) attend a private institution, while the remaining 94 (77.0%) are enrolled in public schools. The age group of 10 to 14 year olds has the highest likelihood of being enrolled in private schools, with 28 (52.8% in the age bracket) enrolled. Conversely, the age group of 3 to 4 year olds has the lowest likelihood of being enrolled in a private school, with 17 (100.0% in the age bracket) attending a public institution.
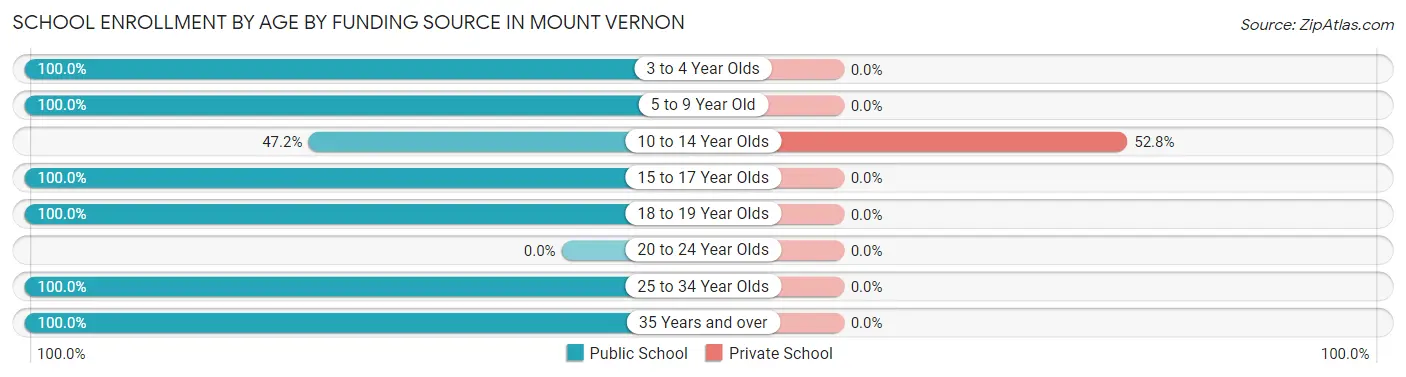
| Age Bracket | Public School | Private School |
| 3 to 4 Year Olds | 17 (100.0%) | 0 (0.0%) |
| 5 to 9 Year Old | 9 (100.0%) | 0 (0.0%) |
| 10 to 14 Year Olds | 25 (47.2%) | 28 (52.8%) |
| 15 to 17 Year Olds | 8 (100.0%) | 0 (0.0%) |
| 18 to 19 Year Olds | 23 (100.0%) | 0 (0.0%) |
| 20 to 24 Year Olds | 0 (0.0%) | 0 (0.0%) |
| 25 to 34 Year Olds | 5 (100.0%) | 0 (0.0%) |
| 35 Years and over | 7 (100.0%) | 0 (0.0%) |
| Total | 94 (77.0%) | 28 (23.0%) |
Educational Attainment by Field of Study in Mount Vernon
Education (11 | 28.9%), bio, nature & agricultural (10 | 26.3%), social sciences (9 | 23.7%), liberal arts & history (6 | 15.8%), and engineering (2 | 5.3%) are the most common fields of study among 38 individuals in Mount Vernon who have obtained a bachelor's degree or higher.
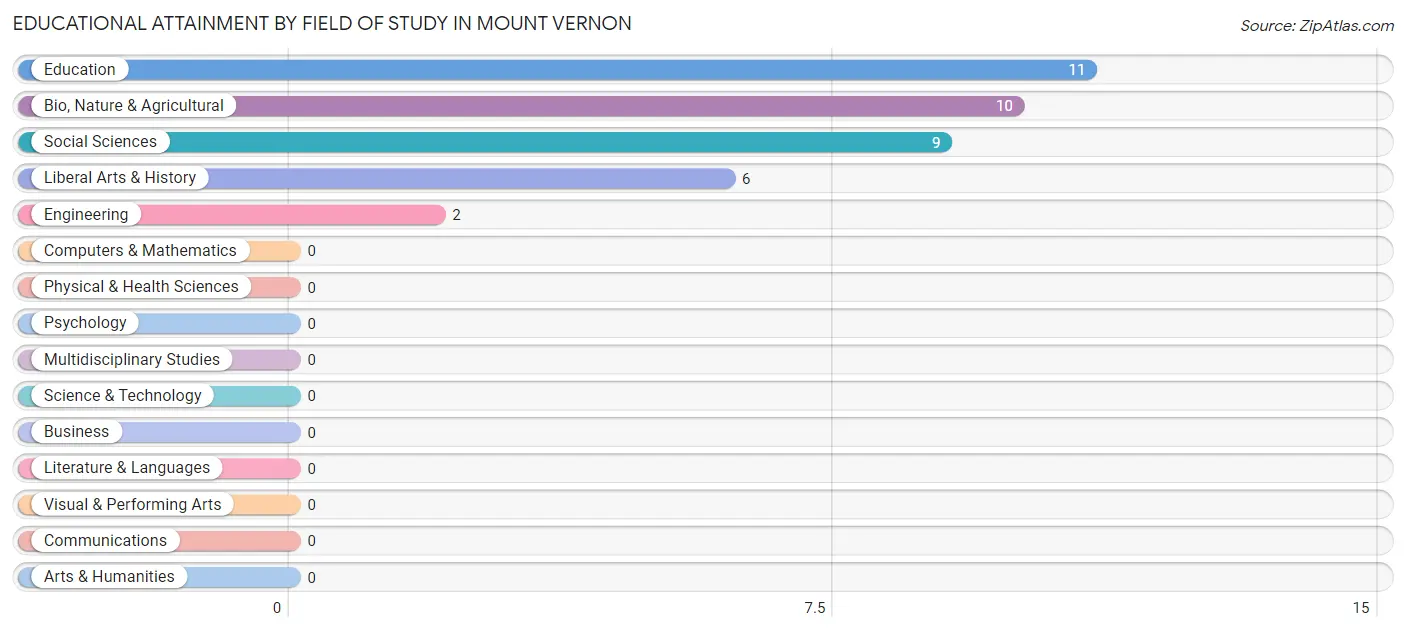
| Field of Study | # Graduates | % Graduates |
| Computers & Mathematics | 0 | 0.0% |
| Bio, Nature & Agricultural | 10 | 26.3% |
| Physical & Health Sciences | 0 | 0.0% |
| Psychology | 0 | 0.0% |
| Social Sciences | 9 | 23.7% |
| Engineering | 2 | 5.3% |
| Multidisciplinary Studies | 0 | 0.0% |
| Science & Technology | 0 | 0.0% |
| Business | 0 | 0.0% |
| Education | 11 | 28.9% |
| Literature & Languages | 0 | 0.0% |
| Liberal Arts & History | 6 | 15.8% |
| Visual & Performing Arts | 0 | 0.0% |
| Communications | 0 | 0.0% |
| Arts & Humanities | 0 | 0.0% |
| Total | 38 | 100.0% |
Transportation & Commute in Mount Vernon
Vehicle Availability by Sex in Mount Vernon
The most prevalent vehicle ownership categories in Mount Vernon are males with 2 vehicles (65, accounting for 47.8%) and females with 2 vehicles (68, making up 41.4%).
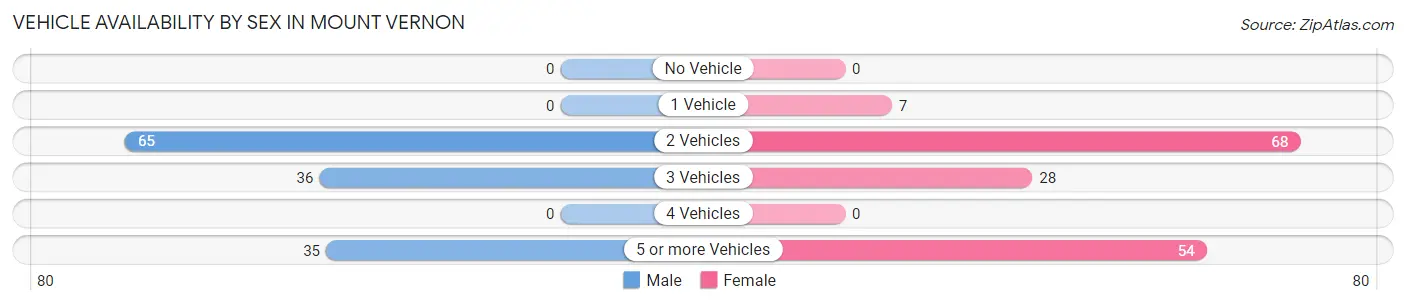
| Vehicles Available | Male | Female |
| No Vehicle | 0 (0.0%) | 0 (0.0%) |
| 1 Vehicle | 0 (0.0%) | 7 (4.5%) |
| 2 Vehicles | 65 (47.8%) | 68 (43.3%) |
| 3 Vehicles | 36 (26.5%) | 28 (17.8%) |
| 4 Vehicles | 0 (0.0%) | 0 (0.0%) |
| 5 or more Vehicles | 35 (25.7%) | 54 (34.4%) |
| Total | 136 (100.0%) | 157 (100.0%) |
Commute Time in Mount Vernon
The most frequently occuring commute durations in Mount Vernon are 10 to 14 minutes (170 commuters, 58.4%), 15 to 19 minutes (38 commuters, 13.1%), and 20 to 24 minutes (35 commuters, 12.0%).
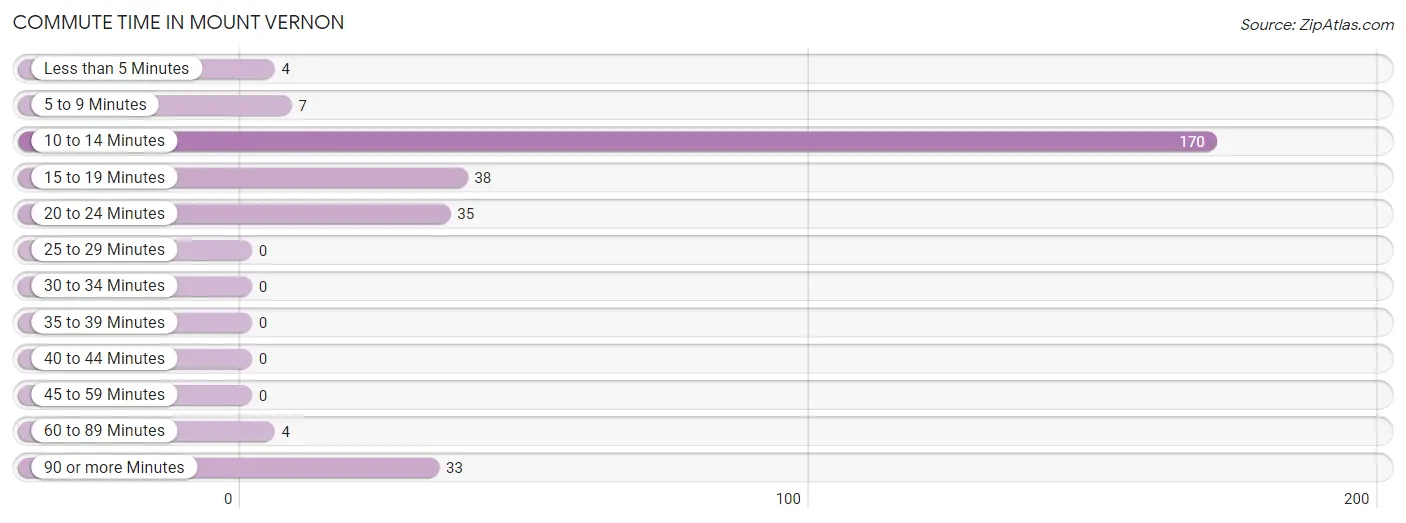
| Commute Time | # Commuters | % Commuters |
| Less than 5 Minutes | 4 | 1.4% |
| 5 to 9 Minutes | 7 | 2.4% |
| 10 to 14 Minutes | 170 | 58.4% |
| 15 to 19 Minutes | 38 | 13.1% |
| 20 to 24 Minutes | 35 | 12.0% |
| 25 to 29 Minutes | 0 | 0.0% |
| 30 to 34 Minutes | 0 | 0.0% |
| 35 to 39 Minutes | 0 | 0.0% |
| 40 to 44 Minutes | 0 | 0.0% |
| 45 to 59 Minutes | 0 | 0.0% |
| 60 to 89 Minutes | 4 | 1.4% |
| 90 or more Minutes | 33 | 11.3% |
Commute Time by Sex in Mount Vernon
The most common commute times in Mount Vernon are 10 to 14 minutes (62 commuters, 45.6%) for males and 10 to 14 minutes (108 commuters, 69.7%) for females.
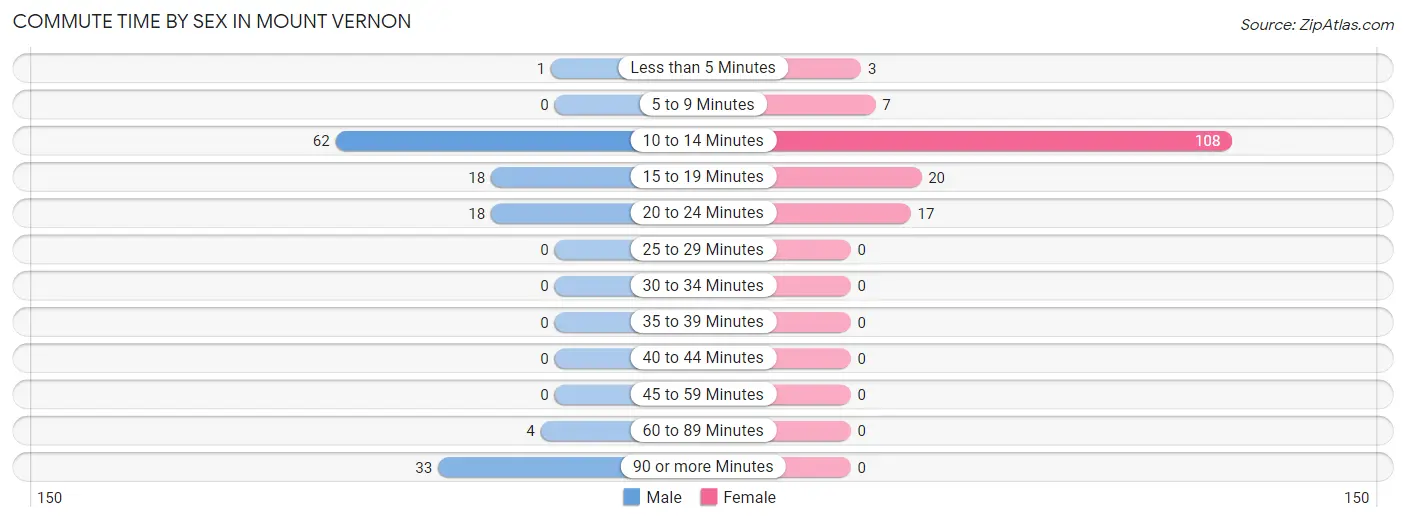
| Commute Time | Male | Female |
| Less than 5 Minutes | 1 (0.7%) | 3 (1.9%) |
| 5 to 9 Minutes | 0 (0.0%) | 7 (4.5%) |
| 10 to 14 Minutes | 62 (45.6%) | 108 (69.7%) |
| 15 to 19 Minutes | 18 (13.2%) | 20 (12.9%) |
| 20 to 24 Minutes | 18 (13.2%) | 17 (11.0%) |
| 25 to 29 Minutes | 0 (0.0%) | 0 (0.0%) |
| 30 to 34 Minutes | 0 (0.0%) | 0 (0.0%) |
| 35 to 39 Minutes | 0 (0.0%) | 0 (0.0%) |
| 40 to 44 Minutes | 0 (0.0%) | 0 (0.0%) |
| 45 to 59 Minutes | 0 (0.0%) | 0 (0.0%) |
| 60 to 89 Minutes | 4 (2.9%) | 0 (0.0%) |
| 90 or more Minutes | 33 (24.3%) | 0 (0.0%) |
Time of Departure to Work by Sex in Mount Vernon
The most frequent times of departure to work in Mount Vernon are 5:00 AM to 5:29 AM (44, 32.4%) for males and 5:00 AM to 5:29 AM (61, 39.4%) for females.
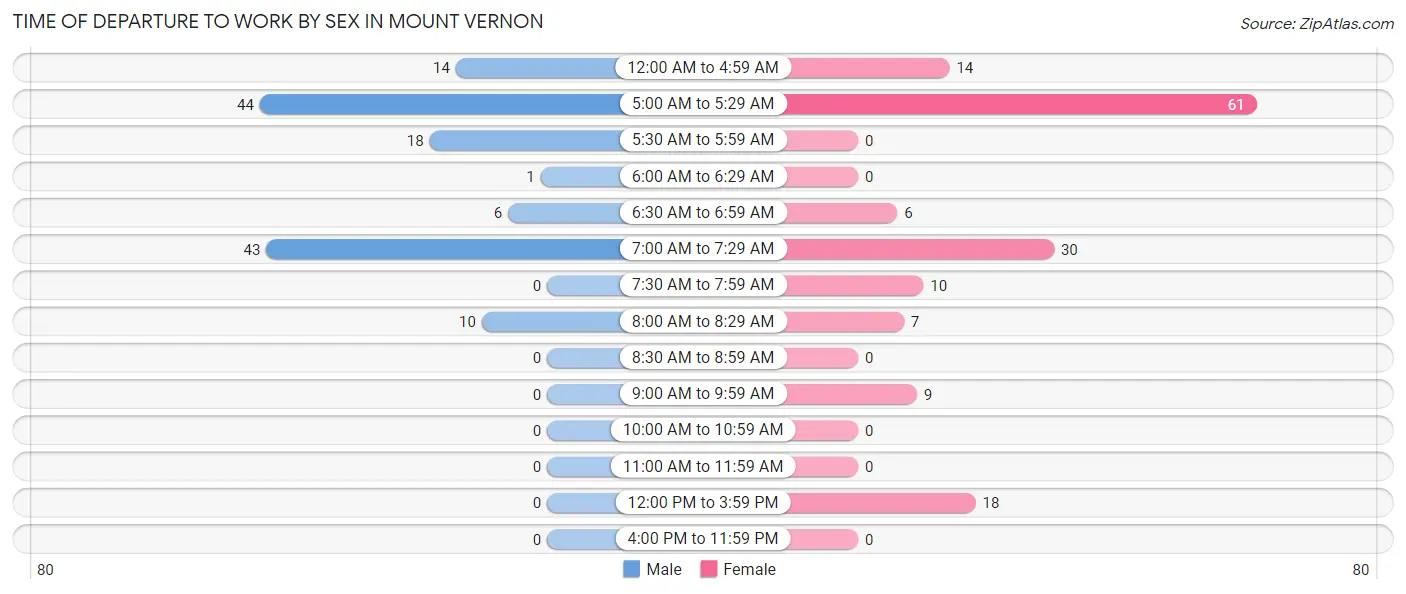
| Time of Departure | Male | Female |
| 12:00 AM to 4:59 AM | 14 (10.3%) | 14 (9.0%) |
| 5:00 AM to 5:29 AM | 44 (32.4%) | 61 (39.4%) |
| 5:30 AM to 5:59 AM | 18 (13.2%) | 0 (0.0%) |
| 6:00 AM to 6:29 AM | 1 (0.7%) | 0 (0.0%) |
| 6:30 AM to 6:59 AM | 6 (4.4%) | 6 (3.9%) |
| 7:00 AM to 7:29 AM | 43 (31.6%) | 30 (19.4%) |
| 7:30 AM to 7:59 AM | 0 (0.0%) | 10 (6.5%) |
| 8:00 AM to 8:29 AM | 10 (7.3%) | 7 (4.5%) |
| 8:30 AM to 8:59 AM | 0 (0.0%) | 0 (0.0%) |
| 9:00 AM to 9:59 AM | 0 (0.0%) | 9 (5.8%) |
| 10:00 AM to 10:59 AM | 0 (0.0%) | 0 (0.0%) |
| 11:00 AM to 11:59 AM | 0 (0.0%) | 0 (0.0%) |
| 12:00 PM to 3:59 PM | 0 (0.0%) | 18 (11.6%) |
| 4:00 PM to 11:59 PM | 0 (0.0%) | 0 (0.0%) |
| Total | 136 (100.0%) | 155 (100.0%) |
Housing Occupancy in Mount Vernon
Occupancy by Ownership in Mount Vernon
Of the total 273 dwellings in Mount Vernon, owner-occupied units account for 215 (78.7%), while renter-occupied units make up 58 (21.2%).
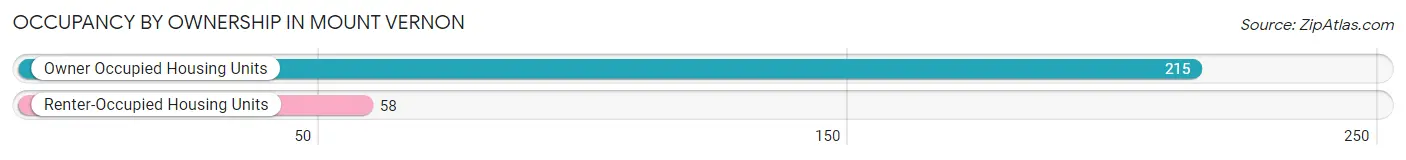
| Occupancy | # Housing Units | % Housing Units |
| Owner Occupied Housing Units | 215 | 78.7% |
| Renter-Occupied Housing Units | 58 | 21.2% |
| Total Occupied Housing Units | 273 | 100.0% |
Occupancy by Household Size in Mount Vernon
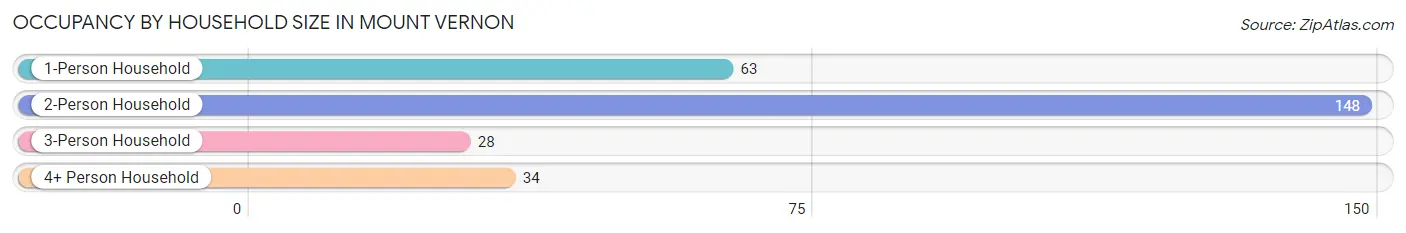
| Household Size | # Housing Units | % Housing Units |
| 1-Person Household | 63 | 23.1% |
| 2-Person Household | 148 | 54.2% |
| 3-Person Household | 28 | 10.3% |
| 4+ Person Household | 34 | 12.4% |
| Total Housing Units | 273 | 100.0% |
Occupancy by Ownership by Household Size in Mount Vernon
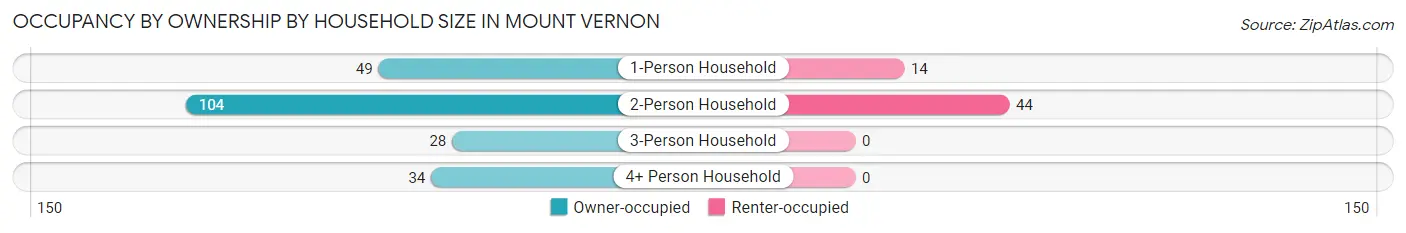
| Household Size | Owner-occupied | Renter-occupied |
| 1-Person Household | 49 (77.8%) | 14 (22.2%) |
| 2-Person Household | 104 (70.3%) | 44 (29.7%) |
| 3-Person Household | 28 (100.0%) | 0 (0.0%) |
| 4+ Person Household | 34 (100.0%) | 0 (0.0%) |
| Total Housing Units | 215 (78.7%) | 58 (21.2%) |
Occupancy by Educational Attainment in Mount Vernon
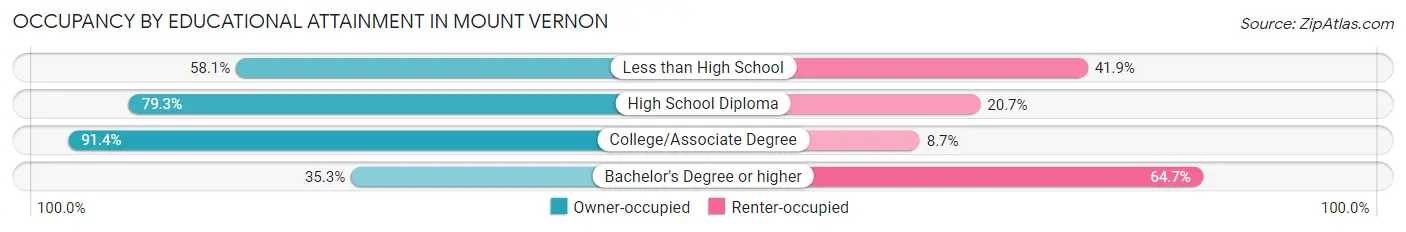
| Household Size | Owner-occupied | Renter-occupied |
| Less than High School | 18 (58.1%) | 13 (41.9%) |
| High School Diploma | 96 (79.3%) | 25 (20.7%) |
| College/Associate Degree | 95 (91.3%) | 9 (8.6%) |
| Bachelor's Degree or higher | 6 (35.3%) | 11 (64.7%) |
Occupancy by Age of Householder in Mount Vernon
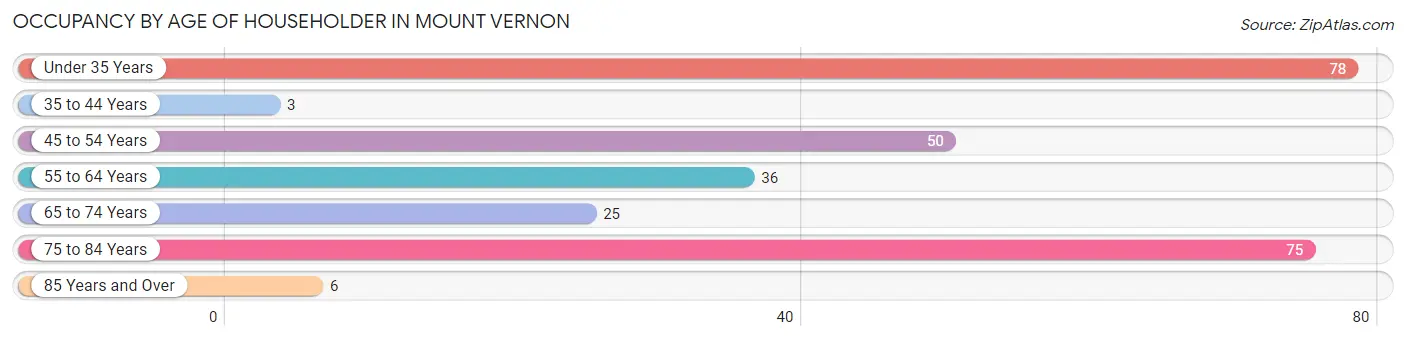
| Age Bracket | # Households | % Households |
| Under 35 Years | 78 | 28.6% |
| 35 to 44 Years | 3 | 1.1% |
| 45 to 54 Years | 50 | 18.3% |
| 55 to 64 Years | 36 | 13.2% |
| 65 to 74 Years | 25 | 9.2% |
| 75 to 84 Years | 75 | 27.5% |
| 85 Years and Over | 6 | 2.2% |
| Total | 273 | 100.0% |
Housing Finances in Mount Vernon
Median Income by Occupancy in Mount Vernon
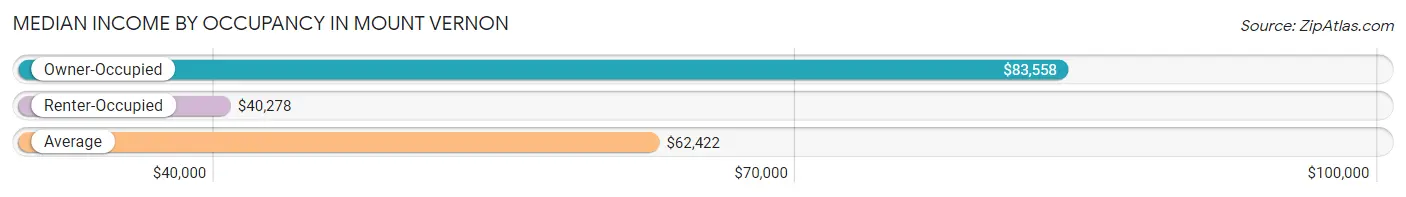
| Occupancy Type | # Households | Median Income |
| Owner-Occupied | 215 (78.7%) | $83,558 |
| Renter-Occupied | 58 (21.2%) | $40,278 |
| Average | 273 (100.0%) | $62,422 |
Occupancy by Householder Income Bracket in Mount Vernon
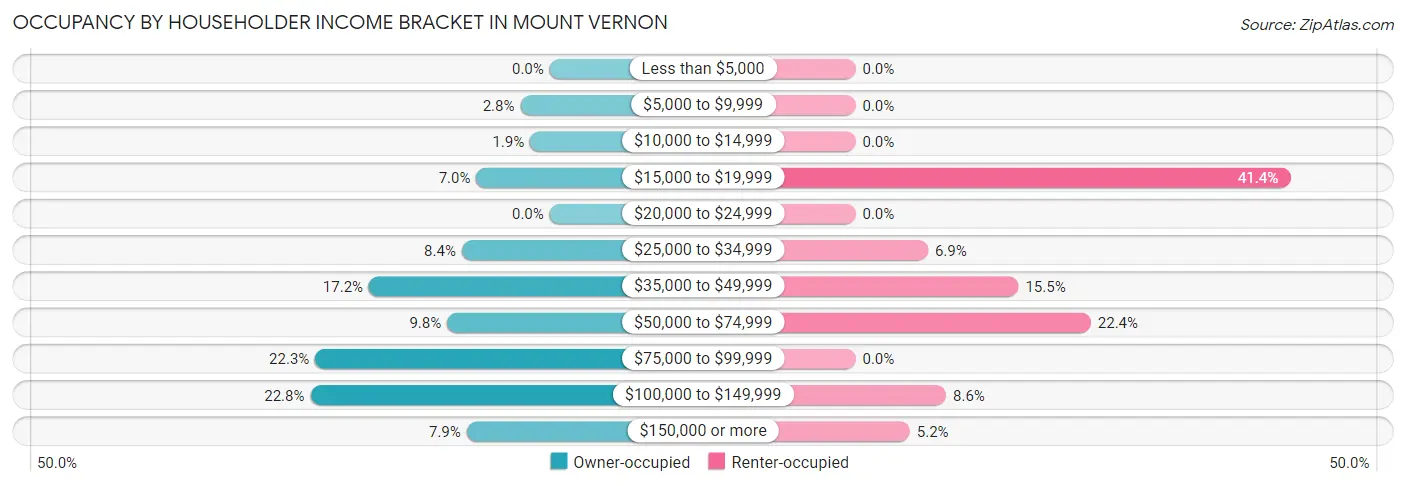
| Income Bracket | Owner-occupied | Renter-occupied |
| Less than $5,000 | 0 (0.0%) | 0 (0.0%) |
| $5,000 to $9,999 | 6 (2.8%) | 0 (0.0%) |
| $10,000 to $14,999 | 4 (1.9%) | 0 (0.0%) |
| $15,000 to $19,999 | 15 (7.0%) | 24 (41.4%) |
| $20,000 to $24,999 | 0 (0.0%) | 0 (0.0%) |
| $25,000 to $34,999 | 18 (8.4%) | 4 (6.9%) |
| $35,000 to $49,999 | 37 (17.2%) | 9 (15.5%) |
| $50,000 to $74,999 | 21 (9.8%) | 13 (22.4%) |
| $75,000 to $99,999 | 48 (22.3%) | 0 (0.0%) |
| $100,000 to $149,999 | 49 (22.8%) | 5 (8.6%) |
| $150,000 or more | 17 (7.9%) | 3 (5.2%) |
| Total | 215 (100.0%) | 58 (100.0%) |
Monthly Housing Cost Tiers in Mount Vernon
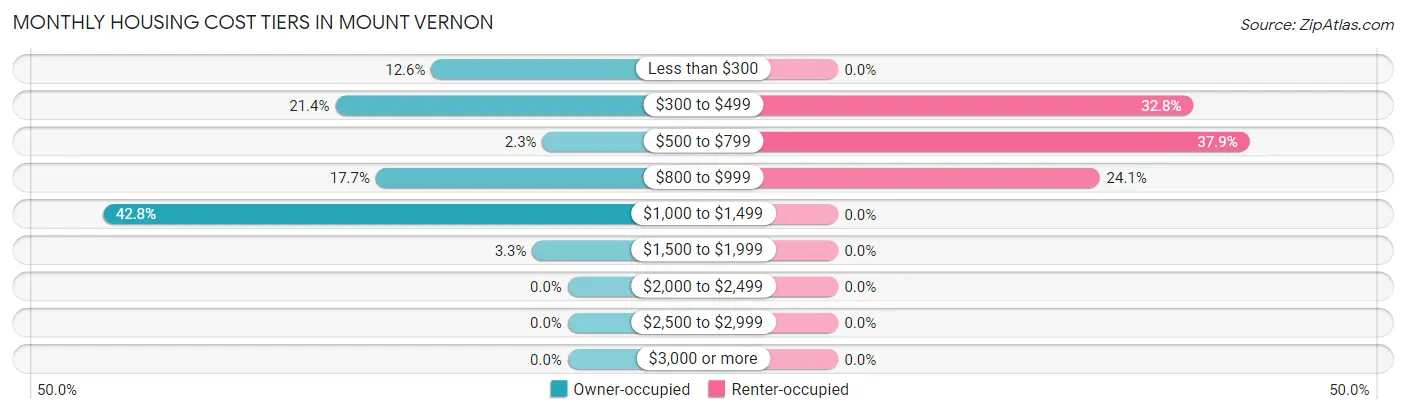
| Monthly Cost | Owner-occupied | Renter-occupied |
| Less than $300 | 27 (12.6%) | 0 (0.0%) |
| $300 to $499 | 46 (21.4%) | 19 (32.8%) |
| $500 to $799 | 5 (2.3%) | 22 (37.9%) |
| $800 to $999 | 38 (17.7%) | 14 (24.1%) |
| $1,000 to $1,499 | 92 (42.8%) | 0 (0.0%) |
| $1,500 to $1,999 | 7 (3.3%) | 0 (0.0%) |
| $2,000 to $2,499 | 0 (0.0%) | 0 (0.0%) |
| $2,500 to $2,999 | 0 (0.0%) | 0 (0.0%) |
| $3,000 or more | 0 (0.0%) | 0 (0.0%) |
| Total | 215 (100.0%) | 58 (100.0%) |
Physical Housing Characteristics in Mount Vernon
Housing Structures in Mount Vernon
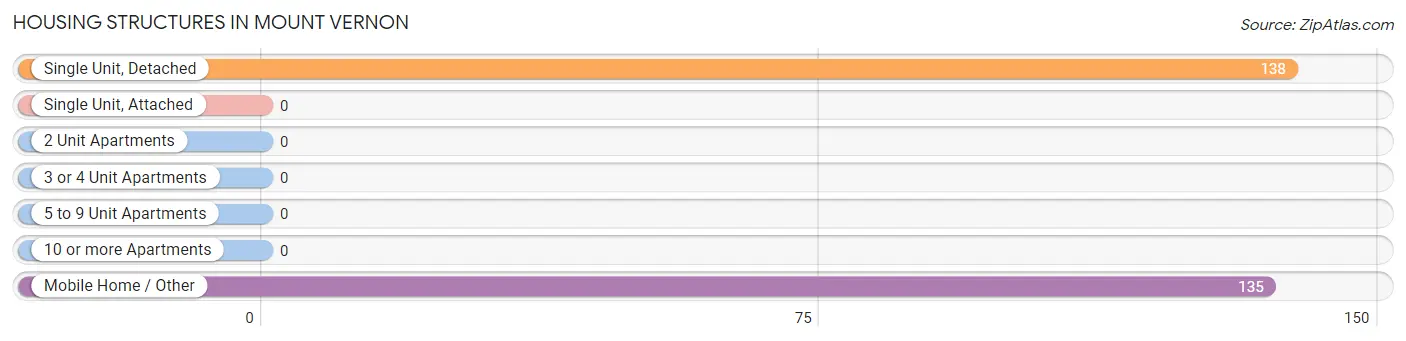
| Structure Type | # Housing Units | % Housing Units |
| Single Unit, Detached | 138 | 50.5% |
| Single Unit, Attached | 0 | 0.0% |
| 2 Unit Apartments | 0 | 0.0% |
| 3 or 4 Unit Apartments | 0 | 0.0% |
| 5 to 9 Unit Apartments | 0 | 0.0% |
| 10 or more Apartments | 0 | 0.0% |
| Mobile Home / Other | 135 | 49.4% |
| Total | 273 | 100.0% |
Housing Structures by Occupancy in Mount Vernon
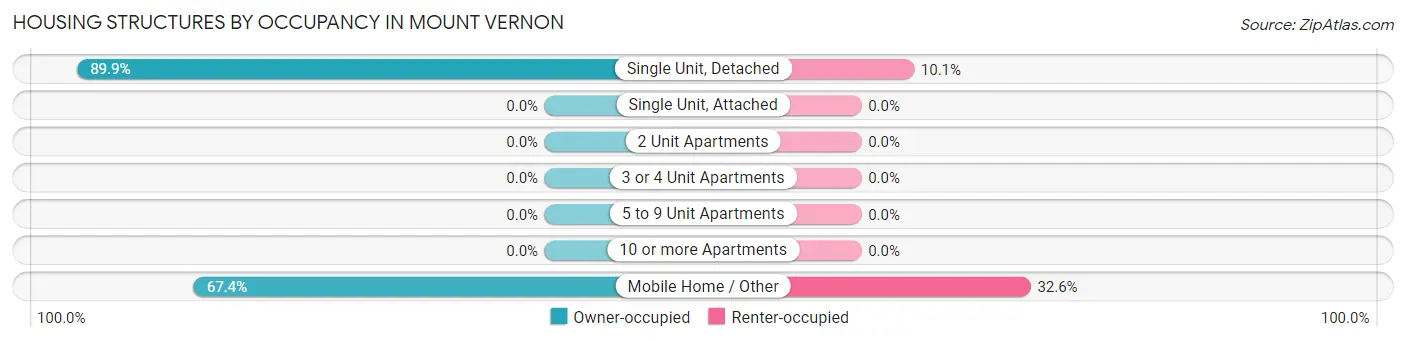
| Structure Type | Owner-occupied | Renter-occupied |
| Single Unit, Detached | 124 (89.9%) | 14 (10.1%) |
| Single Unit, Attached | 0 (0.0%) | 0 (0.0%) |
| 2 Unit Apartments | 0 (0.0%) | 0 (0.0%) |
| 3 or 4 Unit Apartments | 0 (0.0%) | 0 (0.0%) |
| 5 to 9 Unit Apartments | 0 (0.0%) | 0 (0.0%) |
| 10 or more Apartments | 0 (0.0%) | 0 (0.0%) |
| Mobile Home / Other | 91 (67.4%) | 44 (32.6%) |
| Total | 215 (78.7%) | 58 (21.2%) |
Housing Structures by Number of Rooms in Mount Vernon
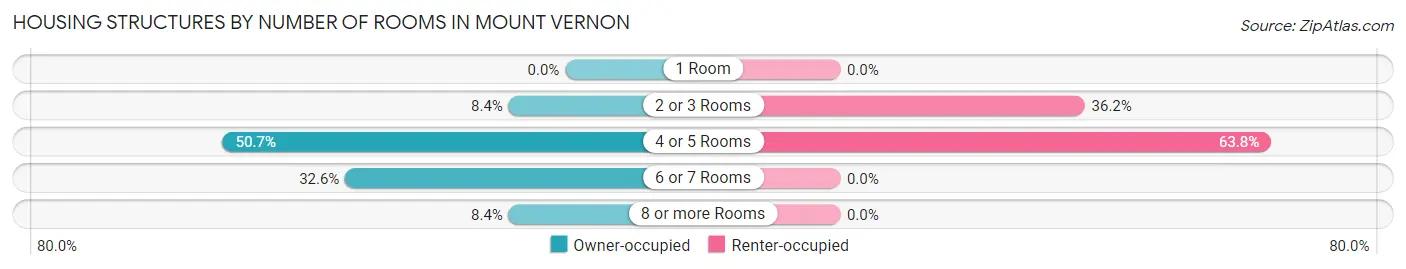
| Number of Rooms | Owner-occupied | Renter-occupied |
| 1 Room | 0 (0.0%) | 0 (0.0%) |
| 2 or 3 Rooms | 18 (8.4%) | 21 (36.2%) |
| 4 or 5 Rooms | 109 (50.7%) | 37 (63.8%) |
| 6 or 7 Rooms | 70 (32.6%) | 0 (0.0%) |
| 8 or more Rooms | 18 (8.4%) | 0 (0.0%) |
| Total | 215 (100.0%) | 58 (100.0%) |
Housing Structure by Heating Type in Mount Vernon
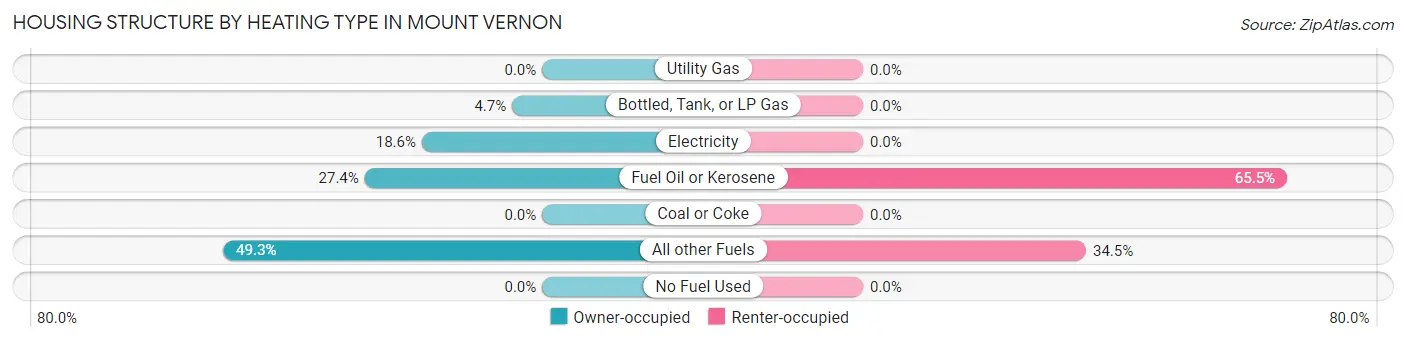
| Heating Type | Owner-occupied | Renter-occupied |
| Utility Gas | 0 (0.0%) | 0 (0.0%) |
| Bottled, Tank, or LP Gas | 10 (4.6%) | 0 (0.0%) |
| Electricity | 40 (18.6%) | 0 (0.0%) |
| Fuel Oil or Kerosene | 59 (27.4%) | 38 (65.5%) |
| Coal or Coke | 0 (0.0%) | 0 (0.0%) |
| All other Fuels | 106 (49.3%) | 20 (34.5%) |
| No Fuel Used | 0 (0.0%) | 0 (0.0%) |
| Total | 215 (100.0%) | 58 (100.0%) |
Household Vehicle Usage in Mount Vernon
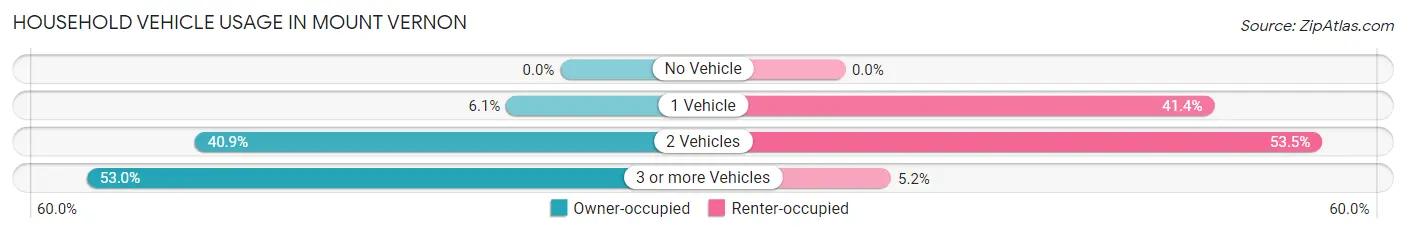
| Vehicles per Household | Owner-occupied | Renter-occupied |
| No Vehicle | 0 (0.0%) | 0 (0.0%) |
| 1 Vehicle | 13 (6.0%) | 24 (41.4%) |
| 2 Vehicles | 88 (40.9%) | 31 (53.4%) |
| 3 or more Vehicles | 114 (53.0%) | 3 (5.2%) |
| Total | 215 (100.0%) | 58 (100.0%) |
Real Estate & Mortgages in Mount Vernon
Real Estate and Mortgage Overview in Mount Vernon
| Characteristic | Without Mortgage | With Mortgage |
| Housing Units | 92 | 123 |
| Median Property Value | $56,300 | $135,500 |
| Median Household Income | - | - |
| Monthly Housing Costs | $343 | $0 |
| Real Estate Taxes | $749 | $0 |
Property Value by Mortgage Status in Mount Vernon
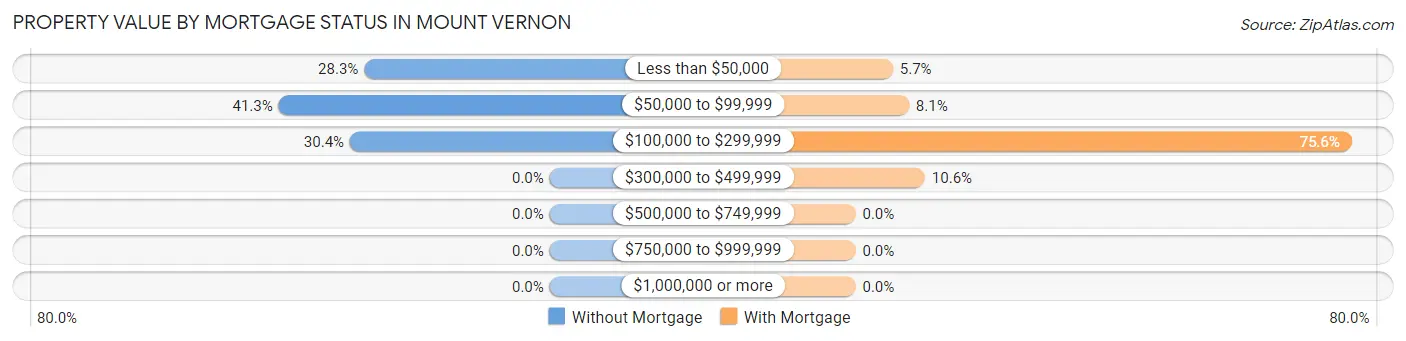
| Property Value | Without Mortgage | With Mortgage |
| Less than $50,000 | 26 (28.3%) | 7 (5.7%) |
| $50,000 to $99,999 | 38 (41.3%) | 10 (8.1%) |
| $100,000 to $299,999 | 28 (30.4%) | 93 (75.6%) |
| $300,000 to $499,999 | 0 (0.0%) | 13 (10.6%) |
| $500,000 to $749,999 | 0 (0.0%) | 0 (0.0%) |
| $750,000 to $999,999 | 0 (0.0%) | 0 (0.0%) |
| $1,000,000 or more | 0 (0.0%) | 0 (0.0%) |
| Total | 92 (100.0%) | 123 (100.0%) |
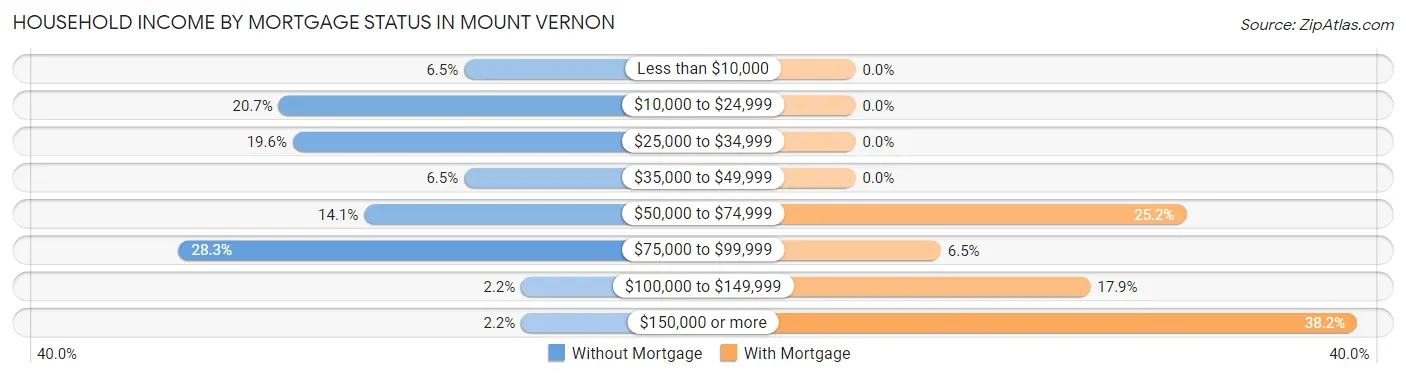
Household Income by Mortgage Status in Mount Vernon
| Household Income | Without Mortgage | With Mortgage |
| Less than $10,000 | 6 (6.5%) | 0 (0.0%) |
| $10,000 to $24,999 | 19 (20.6%) | 0 (0.0%) |
| $25,000 to $34,999 | 18 (19.6%) | 0 (0.0%) |
| $35,000 to $49,999 | 6 (6.5%) | 0 (0.0%) |
| $50,000 to $74,999 | 13 (14.1%) | 31 (25.2%) |
| $75,000 to $99,999 | 26 (28.3%) | 8 (6.5%) |
| $100,000 to $149,999 | 2 (2.2%) | 22 (17.9%) |
| $150,000 or more | 2 (2.2%) | 47 (38.2%) |
| Total | 92 (100.0%) | 123 (100.0%) |
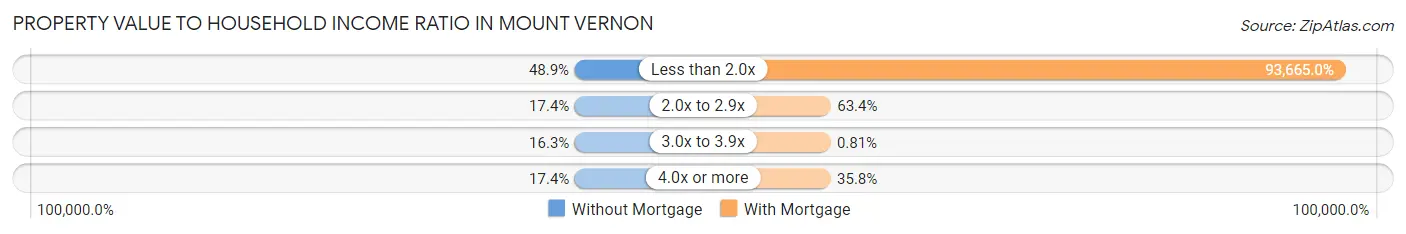
Property Value to Household Income Ratio in Mount Vernon
| Value-to-Income Ratio | Without Mortgage | With Mortgage |
| Less than 2.0x | 45 (48.9%) | 115,208 (93,665.0%) |
| 2.0x to 2.9x | 16 (17.4%) | 78 (63.4%) |
| 3.0x to 3.9x | 15 (16.3%) | 1 (0.8%) |
| 4.0x or more | 16 (17.4%) | 44 (35.8%) |
| Total | 92 (100.0%) | 123 (100.0%) |
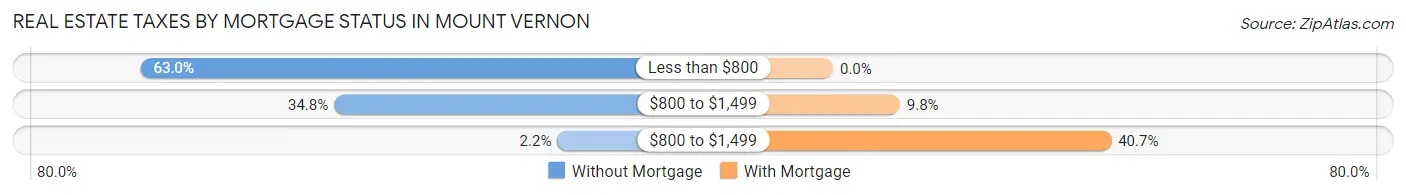
Real Estate Taxes by Mortgage Status in Mount Vernon
| Property Taxes | Without Mortgage | With Mortgage |
| Less than $800 | 58 (63.0%) | 0 (0.0%) |
| $800 to $1,499 | 32 (34.8%) | 12 (9.8%) |
| $800 to $1,499 | 2 (2.2%) | 50 (40.6%) |
| Total | 92 (100.0%) | 123 (100.0%) |
Health & Disability in Mount Vernon
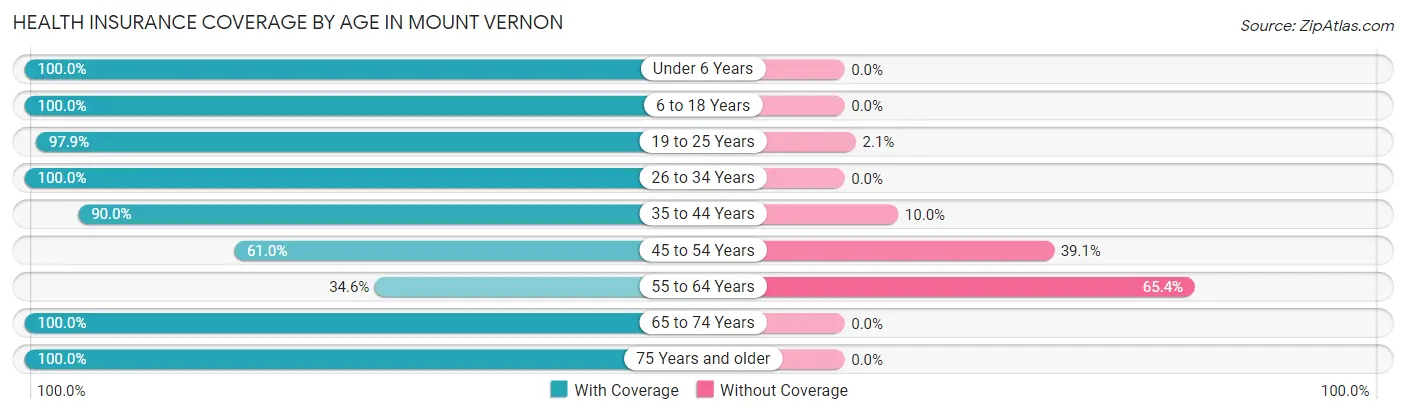
Health Insurance Coverage by Age in Mount Vernon
| Age Bracket | With Coverage | Without Coverage |
| Under 6 Years | 26 (100.0%) | 0 (0.0%) |
| 6 to 18 Years | 84 (100.0%) | 0 (0.0%) |
| 19 to 25 Years | 93 (97.9%) | 2 (2.1%) |
| 26 to 34 Years | 71 (100.0%) | 0 (0.0%) |
| 35 to 44 Years | 27 (90.0%) | 3 (10.0%) |
| 45 to 54 Years | 64 (61.0%) | 41 (39.1%) |
| 55 to 64 Years | 18 (34.6%) | 34 (65.4%) |
| 65 to 74 Years | 39 (100.0%) | 0 (0.0%) |
| 75 Years and older | 93 (100.0%) | 0 (0.0%) |
| Total | 515 (86.6%) | 80 (13.5%) |
Health Insurance Coverage by Citizenship Status in Mount Vernon
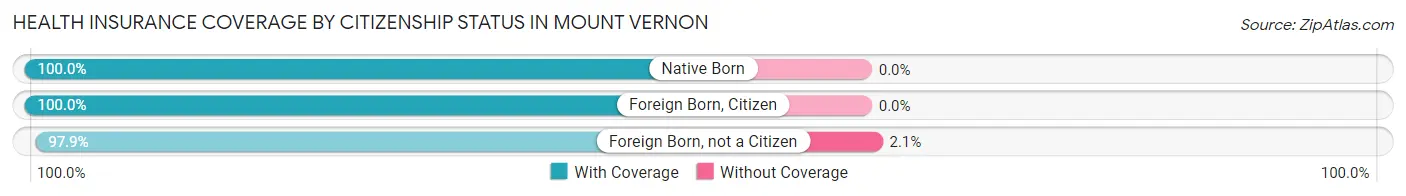
| Citizenship Status | With Coverage | Without Coverage |
| Native Born | 26 (100.0%) | 0 (0.0%) |
| Foreign Born, Citizen | 84 (100.0%) | 0 (0.0%) |
| Foreign Born, not a Citizen | 93 (97.9%) | 2 (2.1%) |
Health Insurance Coverage by Household Income in Mount Vernon
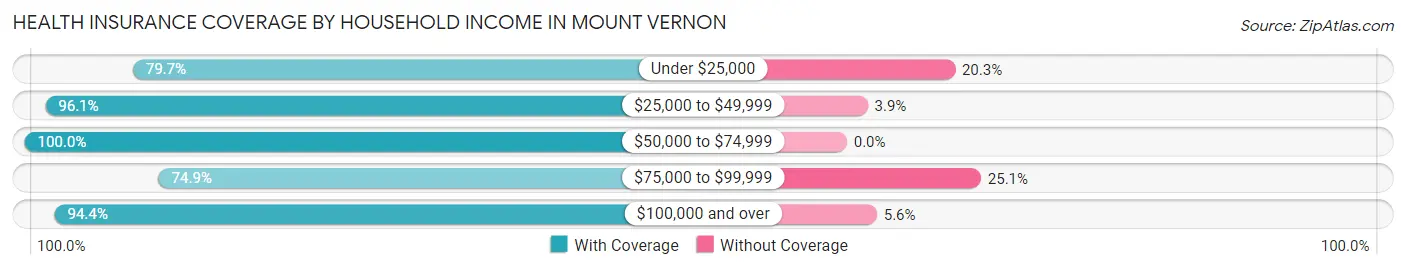
| Household Income | With Coverage | Without Coverage |
| Under $25,000 | 59 (79.7%) | 15 (20.3%) |
| $25,000 to $49,999 | 74 (96.1%) | 3 (3.9%) |
| $50,000 to $74,999 | 59 (100.0%) | 0 (0.0%) |
| $75,000 to $99,999 | 155 (74.9%) | 52 (25.1%) |
| $100,000 and over | 168 (94.4%) | 10 (5.6%) |
Public vs Private Health Insurance Coverage by Age in Mount Vernon
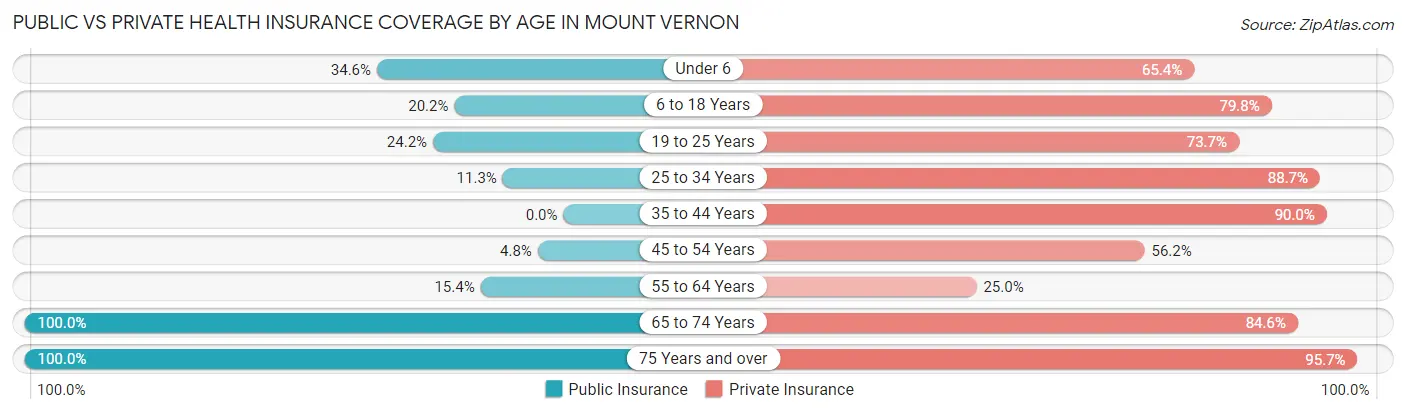
| Age Bracket | Public Insurance | Private Insurance |
| Under 6 | 9 (34.6%) | 17 (65.4%) |
| 6 to 18 Years | 17 (20.2%) | 67 (79.8%) |
| 19 to 25 Years | 23 (24.2%) | 70 (73.7%) |
| 25 to 34 Years | 8 (11.3%) | 63 (88.7%) |
| 35 to 44 Years | 0 (0.0%) | 27 (90.0%) |
| 45 to 54 Years | 5 (4.8%) | 59 (56.2%) |
| 55 to 64 Years | 8 (15.4%) | 13 (25.0%) |
| 65 to 74 Years | 39 (100.0%) | 33 (84.6%) |
| 75 Years and over | 93 (100.0%) | 89 (95.7%) |
| Total | 202 (34.0%) | 438 (73.6%) |
Disability Status by Sex by Age in Mount Vernon
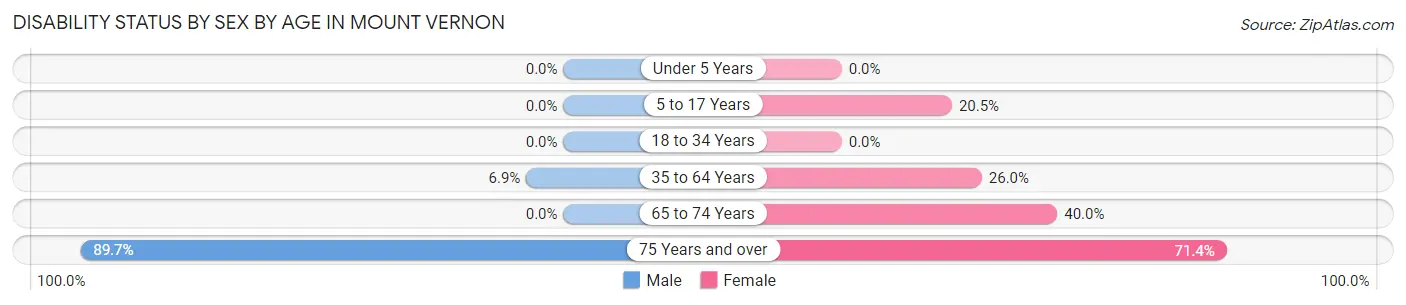
| Age Bracket | Male | Female |
| Under 5 Years | 0 (0.0%) | 0 (0.0%) |
| 5 to 17 Years | 0 (0.0%) | 9 (20.4%) |
| 18 to 34 Years | 0 (0.0%) | 0 (0.0%) |
| 35 to 64 Years | 6 (6.9%) | 26 (26.0%) |
| 65 to 74 Years | 0 (0.0%) | 6 (40.0%) |
| 75 Years and over | 52 (89.7%) | 25 (71.4%) |
Disability Class by Sex by Age in Mount Vernon
Disability Class: Hearing Difficulty
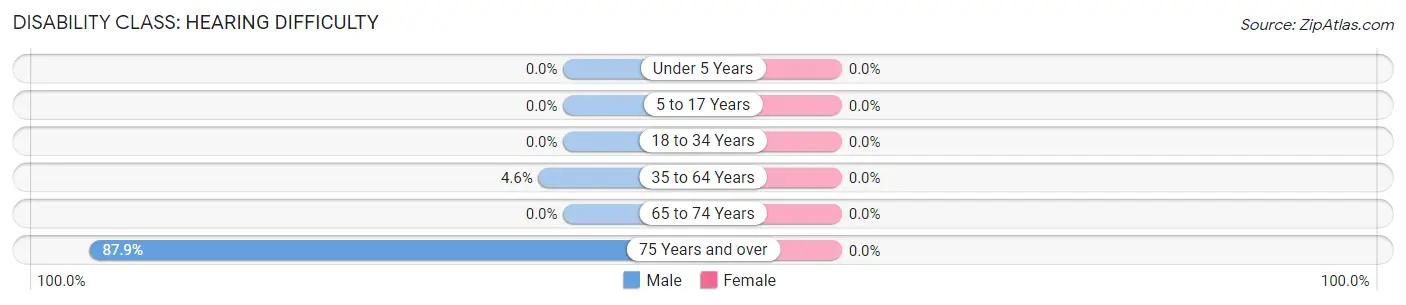
| Age Bracket | Male | Female |
| Under 5 Years | 0 (0.0%) | 0 (0.0%) |
| 5 to 17 Years | 0 (0.0%) | 0 (0.0%) |
| 18 to 34 Years | 0 (0.0%) | 0 (0.0%) |
| 35 to 64 Years | 4 (4.6%) | 0 (0.0%) |
| 65 to 74 Years | 0 (0.0%) | 0 (0.0%) |
| 75 Years and over | 51 (87.9%) | 0 (0.0%) |
Disability Class: Vision Difficulty
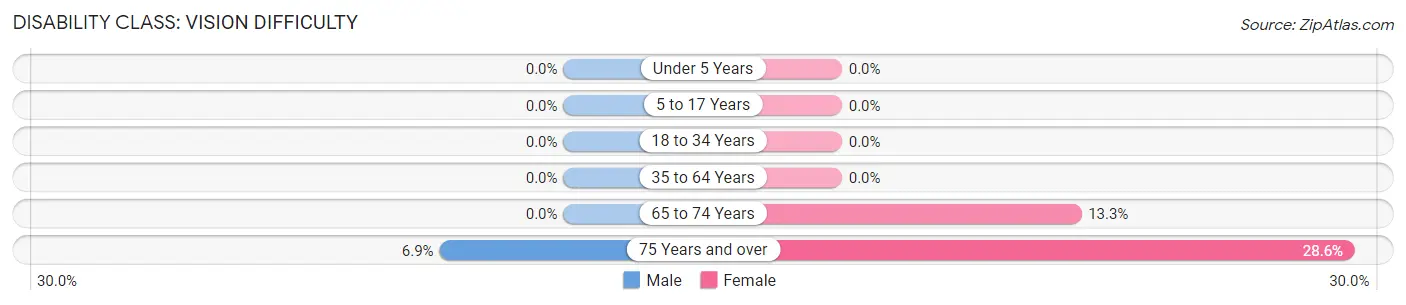
| Age Bracket | Male | Female |
| Under 5 Years | 0 (0.0%) | 0 (0.0%) |
| 5 to 17 Years | 0 (0.0%) | 0 (0.0%) |
| 18 to 34 Years | 0 (0.0%) | 0 (0.0%) |
| 35 to 64 Years | 0 (0.0%) | 0 (0.0%) |
| 65 to 74 Years | 0 (0.0%) | 2 (13.3%) |
| 75 Years and over | 4 (6.9%) | 10 (28.6%) |
Disability Class: Cognitive Difficulty
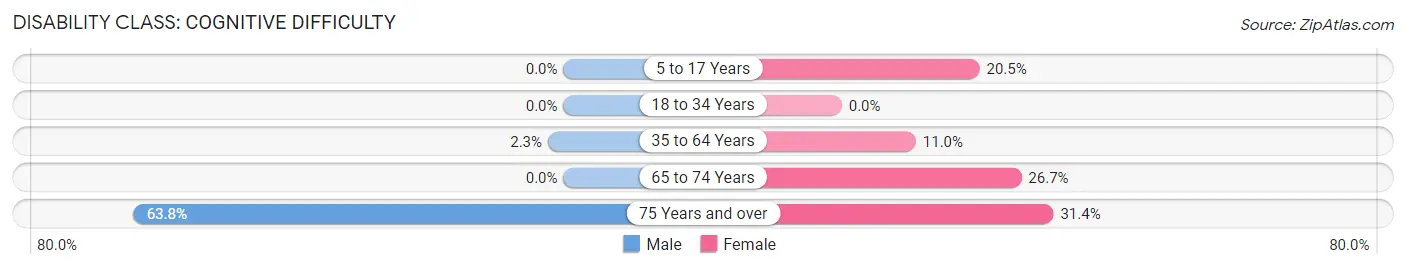
| Age Bracket | Male | Female |
| 5 to 17 Years | 0 (0.0%) | 9 (20.4%) |
| 18 to 34 Years | 0 (0.0%) | 0 (0.0%) |
| 35 to 64 Years | 2 (2.3%) | 11 (11.0%) |
| 65 to 74 Years | 0 (0.0%) | 4 (26.7%) |
| 75 Years and over | 37 (63.8%) | 11 (31.4%) |
Disability Class: Ambulatory Difficulty
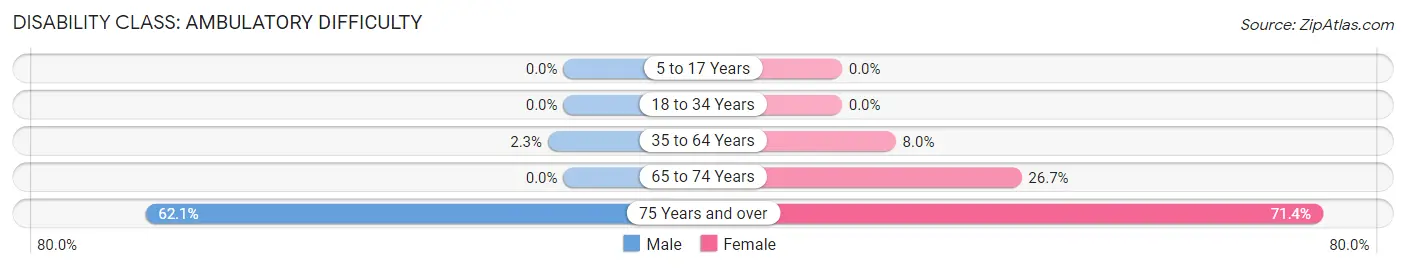
| Age Bracket | Male | Female |
| 5 to 17 Years | 0 (0.0%) | 0 (0.0%) |
| 18 to 34 Years | 0 (0.0%) | 0 (0.0%) |
| 35 to 64 Years | 2 (2.3%) | 8 (8.0%) |
| 65 to 74 Years | 0 (0.0%) | 4 (26.7%) |
| 75 Years and over | 36 (62.1%) | 25 (71.4%) |
Disability Class: Self-Care Difficulty
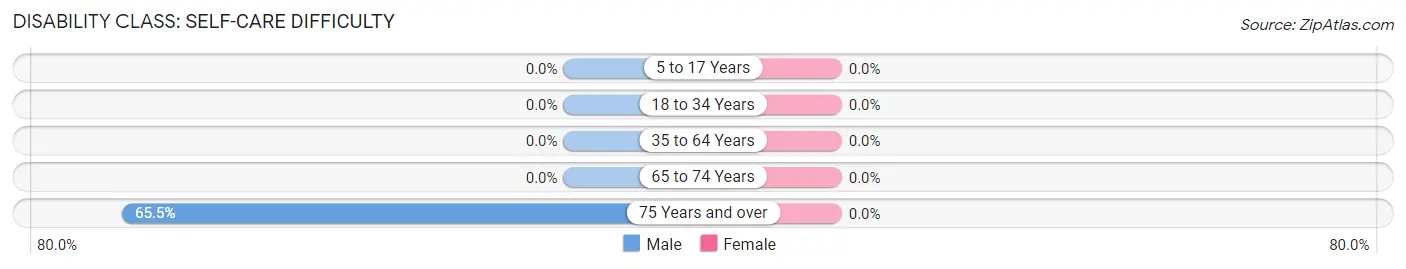
| Age Bracket | Male | Female |
| 5 to 17 Years | 0 (0.0%) | 0 (0.0%) |
| 18 to 34 Years | 0 (0.0%) | 0 (0.0%) |
| 35 to 64 Years | 0 (0.0%) | 0 (0.0%) |
| 65 to 74 Years | 0 (0.0%) | 0 (0.0%) |
| 75 Years and over | 38 (65.5%) | 0 (0.0%) |
Technology Access in Mount Vernon
Computing Device Access in Mount Vernon
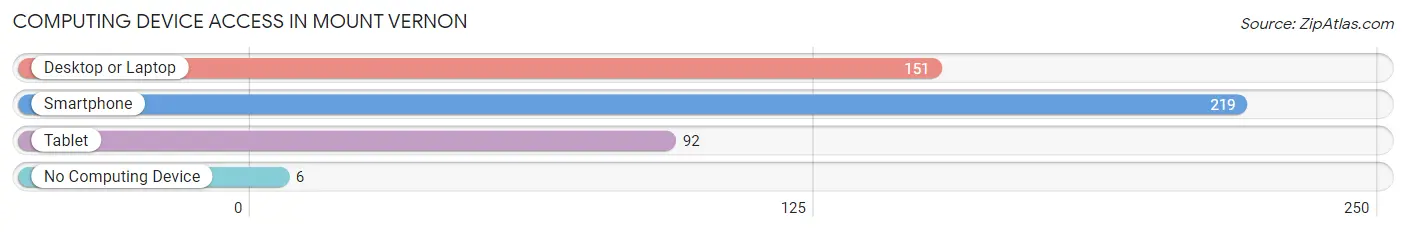
| Device Type | # Households | % Households |
| Desktop or Laptop | 151 | 55.3% |
| Smartphone | 219 | 80.2% |
| Tablet | 92 | 33.7% |
| No Computing Device | 6 | 2.2% |
| Total | 273 | 100.0% |
Internet Access in Mount Vernon
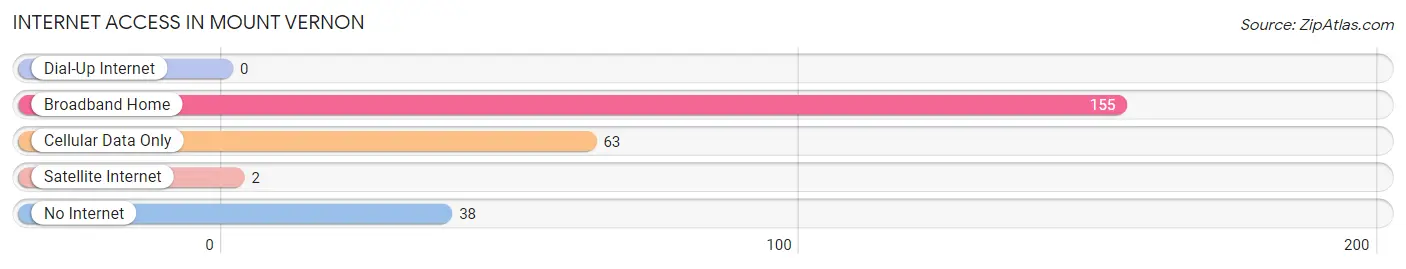
| Internet Type | # Households | % Households |
| Dial-Up Internet | 0 | 0.0% |
| Broadband Home | 155 | 56.8% |
| Cellular Data Only | 63 | 23.1% |
| Satellite Internet | 2 | 0.7% |
| No Internet | 38 | 13.9% |
| Total | 273 | 100.0% |
Mount Vernon Summary
Introduction
Mount Vernon is a small city located in the state of Oregon, United States. It is situated in the Willamette Valley, about 20 miles south of Salem, the state capital. The city is part of the Marion County and has a population of about 2,000 people. Mount Vernon is known for its rich history, diverse geography, vibrant economy, and diverse demographics.
History
Mount Vernon was founded in 1851 by a group of settlers from the Midwest. The city was named after George Washington’s home in Virginia. The settlers were attracted to the area due to its fertile soil and abundant natural resources. The city quickly grew and became a hub for the surrounding agricultural communities.
In the late 19th century, Mount Vernon was a major stop on the Oregon Trail. The city was also a major stop on the Southern Pacific Railroad, which connected the city to the rest of the state.
In the early 20th century, Mount Vernon was a major center for the timber industry. The city was home to several sawmills and lumber yards. The city also had a thriving agricultural industry, with several farms and orchards in the area.
Geography
Mount Vernon is located in the Willamette Valley, about 20 miles south of Salem, the state capital. The city is situated on the banks of the Willamette River, which flows through the city. The city is surrounded by rolling hills and lush forests.
The climate in Mount Vernon is mild and temperate. The average temperature in the summer is around 75 degrees Fahrenheit, and the average temperature in the winter is around 40 degrees Fahrenheit. The city receives an average of 40 inches of rain per year.
Economy
Mount Vernon’s economy is largely based on agriculture and timber. The city is home to several farms and orchards, as well as several sawmills and lumber yards. The city also has a thriving tourism industry, with several wineries, breweries, and other attractions in the area.
The city is also home to several manufacturing companies, including a paper mill and a furniture factory. The city is also home to several retail stores, restaurants, and other businesses.
Demographics
As of the 2010 census, the population of Mount Vernon was 2,000 people. The city is predominantly white, with about 90% of the population identifying as white. The city also has a small Hispanic population, with about 5% of the population identifying as Hispanic.
The median household income in Mount Vernon is $45,000, and the median home value is $150,000. The city has a low unemployment rate, with only about 4% of the population unemployed.
Conclusion
Mount Vernon is a small city located in the state of Oregon, United States. It is situated in the Willamette Valley, about 20 miles south of Salem, the state capital. The city is known for its rich history, diverse geography, vibrant economy, and diverse demographics. The city is predominantly white, with about 90% of the population identifying as white. The city also has a thriving agricultural and timber industry, as well as several manufacturing companies and retail stores. The city has a low unemployment rate, with only about 4% of the population unemployed.
Common Questions
What is the Total Population of Mount Vernon?
Total Population of Mount Vernon is 595.
What is the Total Male Population of Mount Vernon?
Total Male Population of Mount Vernon is 280.
What is the Total Female Population of Mount Vernon?
Total Female Population of Mount Vernon is 315.
What is the Ratio of Males per 100 Females in Mount Vernon?
There are 88.89 Males per 100 Females in Mount Vernon.
What is the Ratio of Females per 100 Males in Mount Vernon?
There are 112.50 Females per 100 Males in Mount Vernon.
What is the Median Population Age in Mount Vernon?
Median Population Age in Mount Vernon is 39.5 Years.
What is the Average Family Size in Mount Vernon
Average Family Size in Mount Vernon is 2.9 People.
What is the Average Household Size in Mount Vernon
Average Household Size in Mount Vernon is 2.2 People.
What is Per Capita Income in Mount Vernon?
Per Capita income in Mount Vernon is $50,232.
What is the Median Family Income in Mount Vernon?
Median Family Income in Mount Vernon is $89,375.
What is the Median Household income in Mount Vernon?
Median Household Income in Mount Vernon is $62,422.
What is Income or Wage Gap in Mount Vernon?
Income or Wage Gap in Mount Vernon is 54.2%.
Women in Mount Vernon earn 45.8 cents for every dollar earned by a man.
What is Inequality or Gini Index in Mount Vernon?
Inequality or Gini Index in Mount Vernon is 0.56.
How Large is the Labor Force in Mount Vernon?
There are 345 People in the Labor Forcein in Mount Vernon.
What is the Percentage of People in the Labor Force in Mount Vernon?
66.9% of People are in the Labor Force in Mount Vernon.
What is the Unemployment Rate in Mount Vernon?
Unemployment Rate in Mount Vernon is 13.0%.