Cities with the Lowest Percentage of Single Mothers in Oregon
RELATED REPORTS & OPTIONS
Fewest Single Mothers
Oregon
Compare Cities
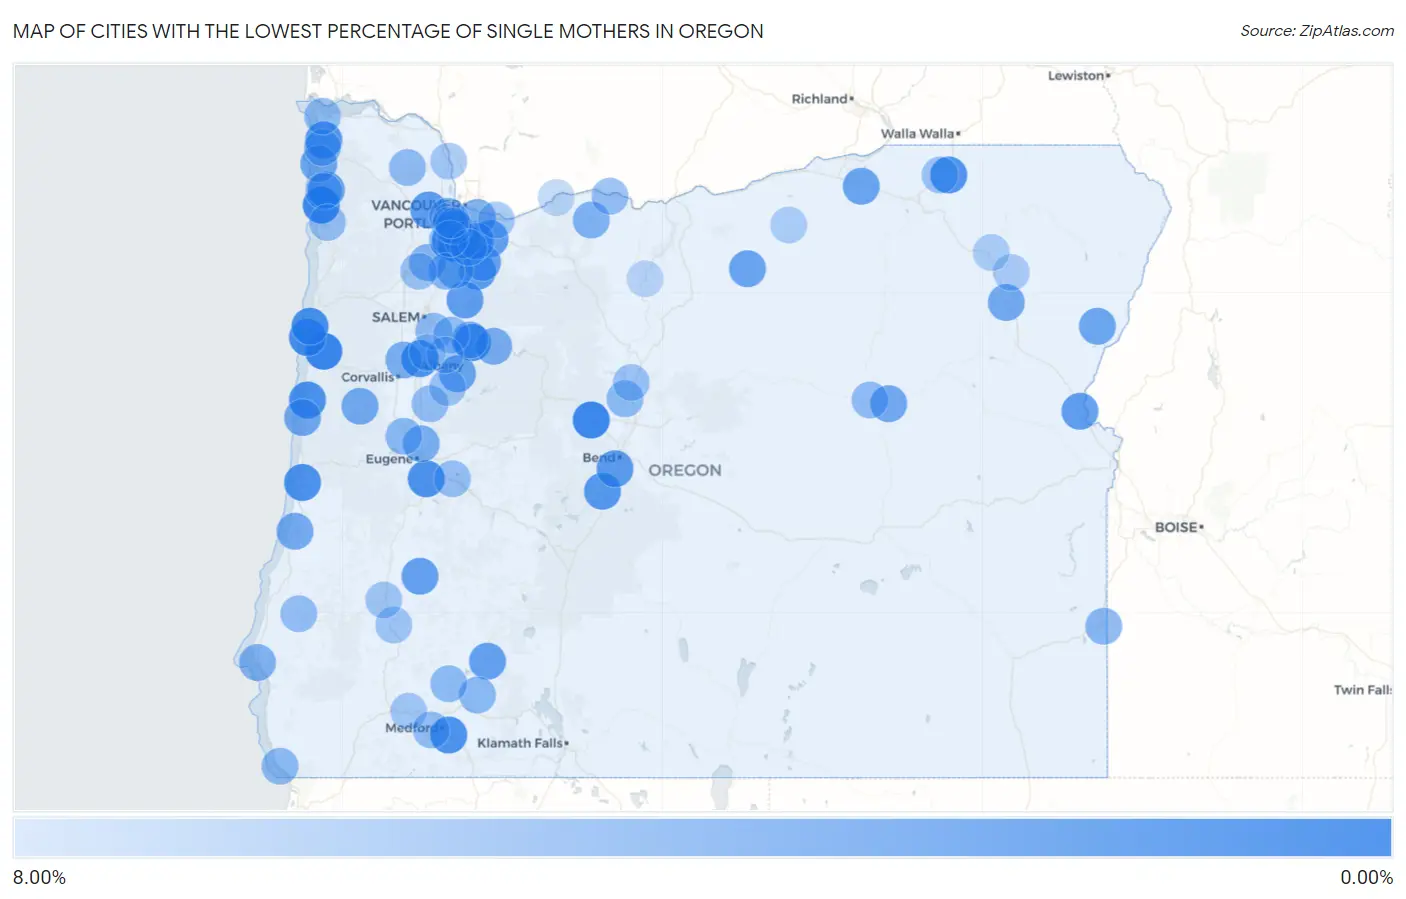
Map of Cities with the Lowest Percentage of Single Mothers in Oregon
8.00%
0.00%
Cities with the Lowest Percentage of Single Mothers in Oregon
| City | % Single Mothers | vs State | vs National | |
| 1. | Siletz | 0.40% | 9.63%(-9.24)#1 | 11.49%(-11.1)#17 |
| 2. | Sisters | 0.62% | 9.63%(-9.01)#2 | 11.49%(-10.9)#59 |
| 3. | Rockaway Beach | 0.63% | 9.63%(-9.00)#3 | 11.49%(-10.9)#62 |
| 4. | Depoe Bay | 1.07% | 9.63%(-8.56)#4 | 11.49%(-10.4)#245 |
| 5. | Lyons | 1.11% | 9.63%(-8.52)#5 | 11.49%(-10.4)#263 |
| 6. | Raleigh Hills | 1.12% | 9.63%(-8.51)#6 | 11.49%(-10.4)#270 |
| 7. | Dunthorpe | 1.14% | 9.63%(-8.49)#7 | 11.49%(-10.3)#288 |
| 8. | Bayshore | 1.28% | 9.63%(-8.35)#8 | 11.49%(-10.2)#378 |
| 9. | Svensen | 1.32% | 9.63%(-8.31)#9 | 11.49%(-10.2)#403 |
| 10. | Lincoln Beach | 1.34% | 9.63%(-8.29)#10 | 11.49%(-10.1)#415 |
| 11. | Millersburg | 1.37% | 9.63%(-8.26)#11 | 11.49%(-10.1)#441 |
| 12. | Waldport | 1.53% | 9.63%(-8.10)#12 | 11.49%(-9.96)#544 |
| 13. | King City | 1.56% | 9.63%(-8.08)#13 | 11.49%(-9.93)#562 |
| 14. | Dunes City | 1.60% | 9.63%(-8.03)#14 | 11.49%(-9.89)#596 |
| 15. | Phoenix | 1.62% | 9.63%(-8.01)#15 | 11.49%(-9.87)#618 |
| 16. | Creswell | 1.64% | 9.63%(-8.00)#16 | 11.49%(-9.85)#635 |
| 17. | Weston | 1.68% | 9.63%(-7.95)#17 | 11.49%(-9.81)#666 |
| 18. | Gearhart | 1.69% | 9.63%(-7.95)#18 | 11.49%(-9.80)#670 |
| 19. | Boring | 1.72% | 9.63%(-7.92)#19 | 11.49%(-9.77)#700 |
| 20. | Three Rivers | 2.25% | 9.63%(-7.39)#20 | 11.49%(-9.24)#1,142 |
| 21. | Mulino | 2.31% | 9.63%(-7.32)#21 | 11.49%(-9.17)#1,213 |
| 22. | Deschutes River Woods | 2.52% | 9.63%(-7.11)#22 | 11.49%(-8.96)#1,408 |
| 23. | North Plains | 2.54% | 9.63%(-7.09)#23 | 11.49%(-8.94)#1,424 |
| 24. | Scotts Mills | 2.65% | 9.63%(-6.98)#24 | 11.49%(-8.83)#1,533 |
| 25. | Oatfield | 2.69% | 9.63%(-6.94)#25 | 11.49%(-8.80)#1,562 |
| 26. | Huntington | 2.70% | 9.63%(-6.93)#26 | 11.49%(-8.78)#1,574 |
| 27. | Stafford | 2.71% | 9.63%(-6.92)#27 | 11.49%(-8.77)#1,593 |
| 28. | Nehalem | 2.74% | 9.63%(-6.89)#28 | 11.49%(-8.75)#1,618 |
| 29. | Damascus | 2.78% | 9.63%(-6.85)#29 | 11.49%(-8.71)#1,675 |
| 30. | Glide | 2.92% | 9.63%(-6.71)#30 | 11.49%(-8.57)#1,828 |
| 31. | Prospect | 3.00% | 9.63%(-6.63)#31 | 11.49%(-8.49)#1,910 |
| 32. | Marlene | 3.15% | 9.63%(-6.48)#32 | 11.49%(-8.34)#2,060 |
| 33. | Condon | 3.29% | 9.63%(-6.34)#33 | 11.49%(-8.20)#2,200 |
| 34. | Beavercreek | 3.29% | 9.63%(-6.34)#34 | 11.49%(-8.20)#2,201 |
| 35. | Echo | 3.36% | 9.63%(-6.28)#35 | 11.49%(-8.13)#2,264 |
| 36. | Lacomb | 3.38% | 9.63%(-6.25)#36 | 11.49%(-8.11)#2,279 |
| 37. | Halfway | 3.41% | 9.63%(-6.22)#37 | 11.49%(-8.08)#2,310 |
| 38. | Rivergrove | 3.49% | 9.63%(-6.14)#38 | 11.49%(-8.00)#2,405 |
| 39. | Cannon Beach | 3.59% | 9.63%(-6.05)#39 | 11.49%(-7.90)#2,515 |
| 40. | Yachats | 3.65% | 9.63%(-5.99)#40 | 11.49%(-7.84)#2,580 |
| 41. | Saunders Lake | 3.65% | 9.63%(-5.98)#41 | 11.49%(-7.84)#2,583 |
| 42. | Canyon City | 3.65% | 9.63%(-5.98)#42 | 11.49%(-7.83)#2,588 |
| 43. | North Powder | 3.83% | 9.63%(-5.80)#43 | 11.49%(-7.66)#2,763 |
| 44. | Alsea | 3.85% | 9.63%(-5.79)#44 | 11.49%(-7.64)#2,801 |
| 45. | Lakeside | 3.87% | 9.63%(-5.76)#45 | 11.49%(-7.61)#2,831 |
| 46. | Gates | 4.23% | 9.63%(-5.41)#46 | 11.49%(-7.26)#3,255 |
| 47. | Aurora | 4.24% | 9.63%(-5.39)#47 | 11.49%(-7.25)#3,272 |
| 48. | Coburg | 4.27% | 9.63%(-5.36)#48 | 11.49%(-7.21)#3,309 |
| 49. | Adair Village | 4.30% | 9.63%(-5.33)#49 | 11.49%(-7.19)#3,342 |
| 50. | Maywood Park | 4.30% | 9.63%(-5.33)#50 | 11.49%(-7.19)#3,345 |
| 51. | Mehama | 4.49% | 9.63%(-5.15)#51 | 11.49%(-7.00)#3,558 |
| 52. | Mount Hood | 4.55% | 9.63%(-5.08)#52 | 11.49%(-6.93)#3,645 |
| 53. | Port Orford | 4.72% | 9.63%(-4.91)#53 | 11.49%(-6.77)#3,847 |
| 54. | Dundee | 4.81% | 9.63%(-4.82)#54 | 11.49%(-6.68)#3,974 |
| 55. | Bull Mountain | 4.98% | 9.63%(-4.65)#55 | 11.49%(-6.51)#4,159 |
| 56. | Durham | 4.99% | 9.63%(-4.64)#56 | 11.49%(-6.50)#4,167 |
| 57. | Jordan Valley | 5.00% | 9.63%(-4.63)#57 | 11.49%(-6.49)#4,195 |
| 58. | Bethany | 5.03% | 9.63%(-4.60)#58 | 11.49%(-6.45)#4,229 |
| 59. | Donald | 5.05% | 9.63%(-4.58)#59 | 11.49%(-6.44)#4,250 |
| 60. | Seaside | 5.07% | 9.63%(-4.57)#60 | 11.49%(-6.42)#4,273 |
| 61. | Butte Falls | 5.15% | 9.63%(-4.48)#61 | 11.49%(-6.33)#4,370 |
| 62. | Junction City | 5.21% | 9.63%(-4.42)#62 | 11.49%(-6.28)#4,425 |
| 63. | Crooked River Ranch | 5.26% | 9.63%(-4.37)#63 | 11.49%(-6.23)#4,467 |
| 64. | Shady Cove | 5.27% | 9.63%(-4.36)#64 | 11.49%(-6.22)#4,509 |
| 65. | Brookings | 5.29% | 9.63%(-4.34)#65 | 11.49%(-6.20)#4,531 |
| 66. | Turner | 5.40% | 9.63%(-4.24)#66 | 11.49%(-6.09)#4,657 |
| 67. | Mount Vernon | 5.47% | 9.63%(-4.16)#67 | 11.49%(-6.02)#4,733 |
| 68. | Vernonia | 5.48% | 9.63%(-4.16)#68 | 11.49%(-6.01)#4,745 |
| 69. | Sublimity | 5.58% | 9.63%(-4.05)#69 | 11.49%(-5.91)#4,879 |
| 70. | Warrenton | 5.63% | 9.63%(-4.01)#70 | 11.49%(-5.86)#4,934 |
| 71. | Brownsville | 5.65% | 9.63%(-3.98)#71 | 11.49%(-5.83)#4,965 |
| 72. | Jacksonville | 5.66% | 9.63%(-3.97)#72 | 11.49%(-5.82)#4,979 |
| 73. | Myrtle Point | 5.71% | 9.63%(-3.92)#73 | 11.49%(-5.77)#5,029 |
| 74. | Bayside Gardens | 5.77% | 9.63%(-3.86)#74 | 11.49%(-5.72)#5,095 |
| 75. | Mosier | 5.81% | 9.63%(-3.82)#75 | 11.49%(-5.67)#5,158 |
| 76. | Lowell | 5.83% | 9.63%(-3.80)#76 | 11.49%(-5.66)#5,180 |
| 77. | Bay City | 5.89% | 9.63%(-3.74)#77 | 11.49%(-5.60)#5,290 |
| 78. | Dayton | 6.00% | 9.63%(-3.63)#78 | 11.49%(-5.48)#5,413 |
| 79. | Culver | 6.14% | 9.63%(-3.49)#79 | 11.49%(-5.34)#5,592 |
| 80. | Lake Oswego | 6.15% | 9.63%(-3.48)#80 | 11.49%(-5.34)#5,597 |
| 81. | Athena | 6.17% | 9.63%(-3.46)#81 | 11.49%(-5.31)#5,623 |
| 82. | Tri City | 6.23% | 9.63%(-3.40)#82 | 11.49%(-5.26)#5,693 |
| 83. | Waterloo | 6.25% | 9.63%(-3.38)#83 | 11.49%(-5.24)#5,736 |
| 84. | Johnson City | 6.36% | 9.63%(-3.27)#84 | 11.49%(-5.12)#5,901 |
| 85. | Troutdale | 6.40% | 9.63%(-3.23)#85 | 11.49%(-5.09)#5,944 |
| 86. | Green | 6.42% | 9.63%(-3.21)#86 | 11.49%(-5.07)#5,978 |
| 87. | Columbia City | 6.44% | 9.63%(-3.19)#87 | 11.49%(-5.04)#6,013 |
| 88. | Cedar Hills | 6.46% | 9.63%(-3.17)#88 | 11.49%(-5.02)#6,049 |
| 89. | Rogue River | 6.54% | 9.63%(-3.09)#89 | 11.49%(-4.95)#6,146 |
| 90. | Scio | 6.77% | 9.63%(-2.86)#90 | 11.49%(-4.71)#6,458 |
| 91. | West Slope | 6.82% | 9.63%(-2.81)#91 | 11.49%(-4.67)#6,521 |
| 92. | Union | 6.93% | 9.63%(-2.70)#92 | 11.49%(-4.56)#6,655 |
| 93. | West Linn | 7.00% | 9.63%(-2.64)#93 | 11.49%(-4.49)#6,736 |
| 94. | Island City | 7.14% | 9.63%(-2.49)#94 | 11.49%(-4.34)#6,925 |
| 95. | Ione | 7.14% | 9.63%(-2.49)#95 | 11.49%(-4.34)#6,933 |
| 96. | Tigard | 7.42% | 9.63%(-2.21)#96 | 11.49%(-4.07)#7,340 |
| 97. | Jefferson | 7.62% | 9.63%(-2.01)#97 | 11.49%(-3.86)#7,576 |
| 98. | Cascade Locks | 7.66% | 9.63%(-1.98)#98 | 11.49%(-3.83)#7,612 |
| 99. | Maupin | 7.69% | 9.63%(-1.94)#99 | 11.49%(-3.79)#7,657 |
| 100. | Cedar Mill | 7.71% | 9.63%(-1.92)#100 | 11.49%(-3.78)#7,690 |
Common Questions
What are the Top 10 Cities with the Lowest Percentage of Single Mothers in Oregon?
Top 10 Cities with the Lowest Percentage of Single Mothers in Oregon are:
#1
0.40%
#2
0.62%
#3
0.63%
#4
1.07%
#5
1.11%
#6
1.12%
#7
1.34%
#8
1.37%
#9
1.53%
#10
1.56%
What city has the Lowest Percentage of Single Mothers in Oregon?
Siletz has the Lowest Percentage of Single Mothers in Oregon with 0.40%.
What is the Percentage of Single Mothers in the State of Oregon?
Percentage of Single Mothers in Oregon is 9.63%.
What is the Percentage of Single Mothers in the United States?
Percentage of Single Mothers in the United States is 11.49%.