Barlow, OR
Barlow Map
Barlow Overview
157
TOTAL POPULATION
77
MALE POPULATION
80
FEMALE POPULATION
96.25
MALES / 100 FEMALES
103.90
FEMALES / 100 MALES
53.8
MEDIAN AGE
2.6
AVG FAMILY SIZE
2.1
AVG HOUSEHOLD SIZE
$32,336
PER CAPITA INCOME
$96,042
AVG FAMILY INCOME
0.44
INEQUALITY / GINI INDEX
119
LABOR FORCE [ PEOPLE ]
82.1%
PERCENT IN LABOR FORCE
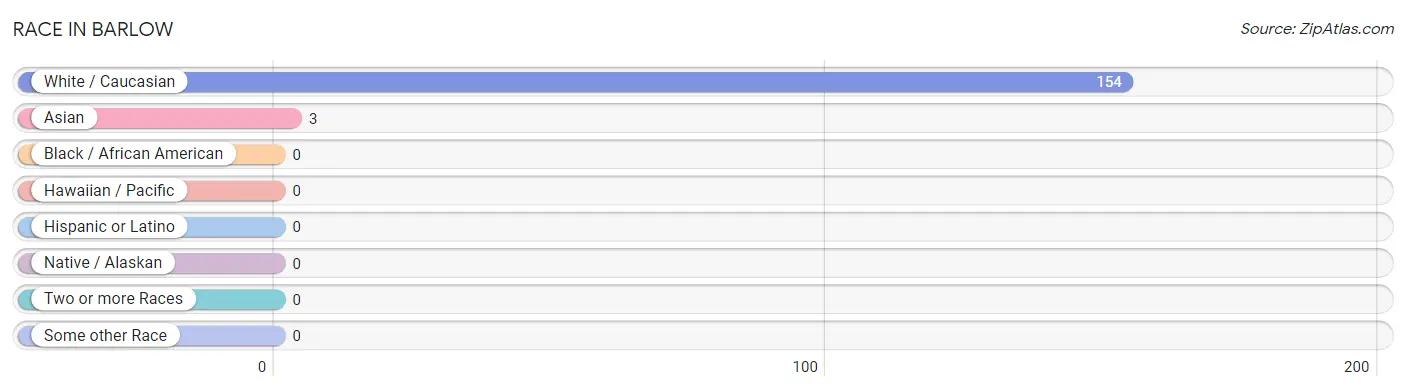
Race in Barlow
The most populous races in Barlow are White / Caucasian (154 | 98.1%), and Asian (3 | 1.9%).
| Race | # Population | % Population |
| Asian | 3 | 1.9% |
| Black / African American | 0 | 0.0% |
| Hawaiian / Pacific | 0 | 0.0% |
| Hispanic or Latino | 0 | 0.0% |
| Native / Alaskan | 0 | 0.0% |
| White / Caucasian | 154 | 98.1% |
| Two or more Races | 0 | 0.0% |
| Some other Race | 0 | 0.0% |
| Total | 157 | 100.0% |
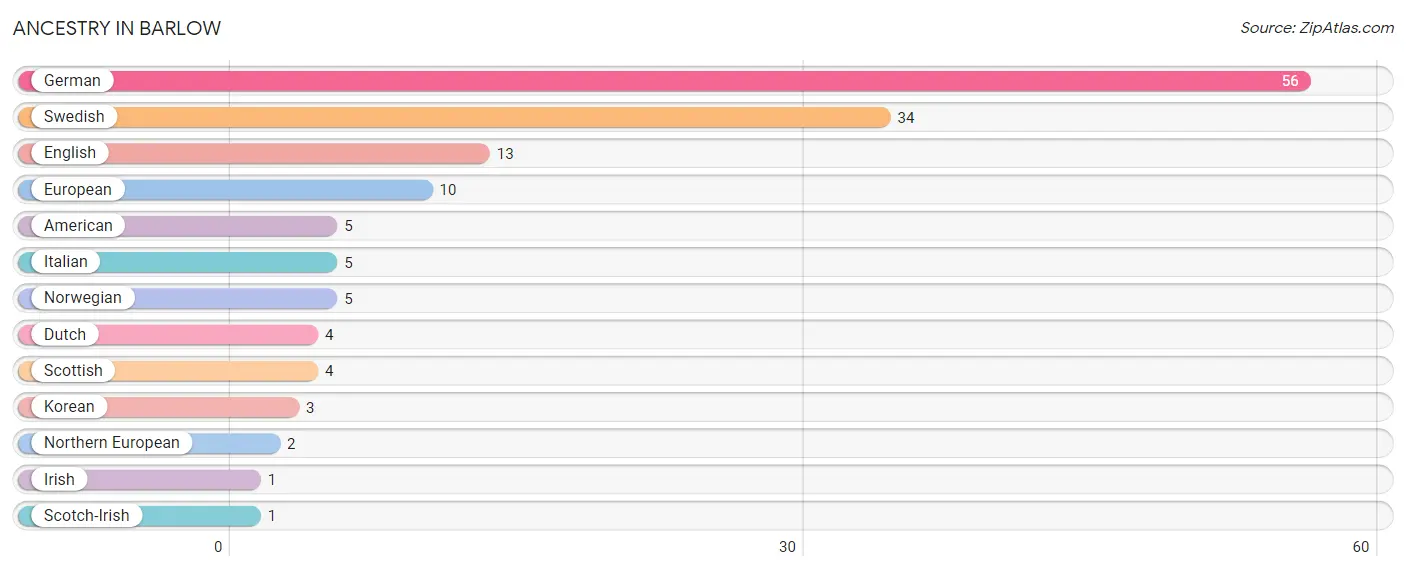
Ancestry in Barlow
The most populous ancestries reported in Barlow are German (56 | 35.7%), Swedish (34 | 21.7%), English (13 | 8.3%), European (10 | 6.4%), and American (5 | 3.2%), together accounting for 75.2% of all Barlow residents.
| Ancestry | # Population | % Population |
| American | 5 | 3.2% |
| Dutch | 4 | 2.5% |
| English | 13 | 8.3% |
| European | 10 | 6.4% |
| German | 56 | 35.7% |
| Irish | 1 | 0.6% |
| Italian | 5 | 3.2% |
| Korean | 3 | 1.9% |
| Northern European | 2 | 1.3% |
| Norwegian | 5 | 3.2% |
| Scotch-Irish | 1 | 0.6% |
| Scottish | 4 | 2.5% |
| Swedish | 34 | 21.7% | View All 13 Rows |
Immigrants in Barlow
The most numerous immigrant groups reported in Barlow came from , and Canada (1 | 0.6%), together accounting for 0.6% of all Barlow residents.

| Immigration Origin | # Population | % Population |
| Canada | 1 | 0.6% | View All 1 Rows |
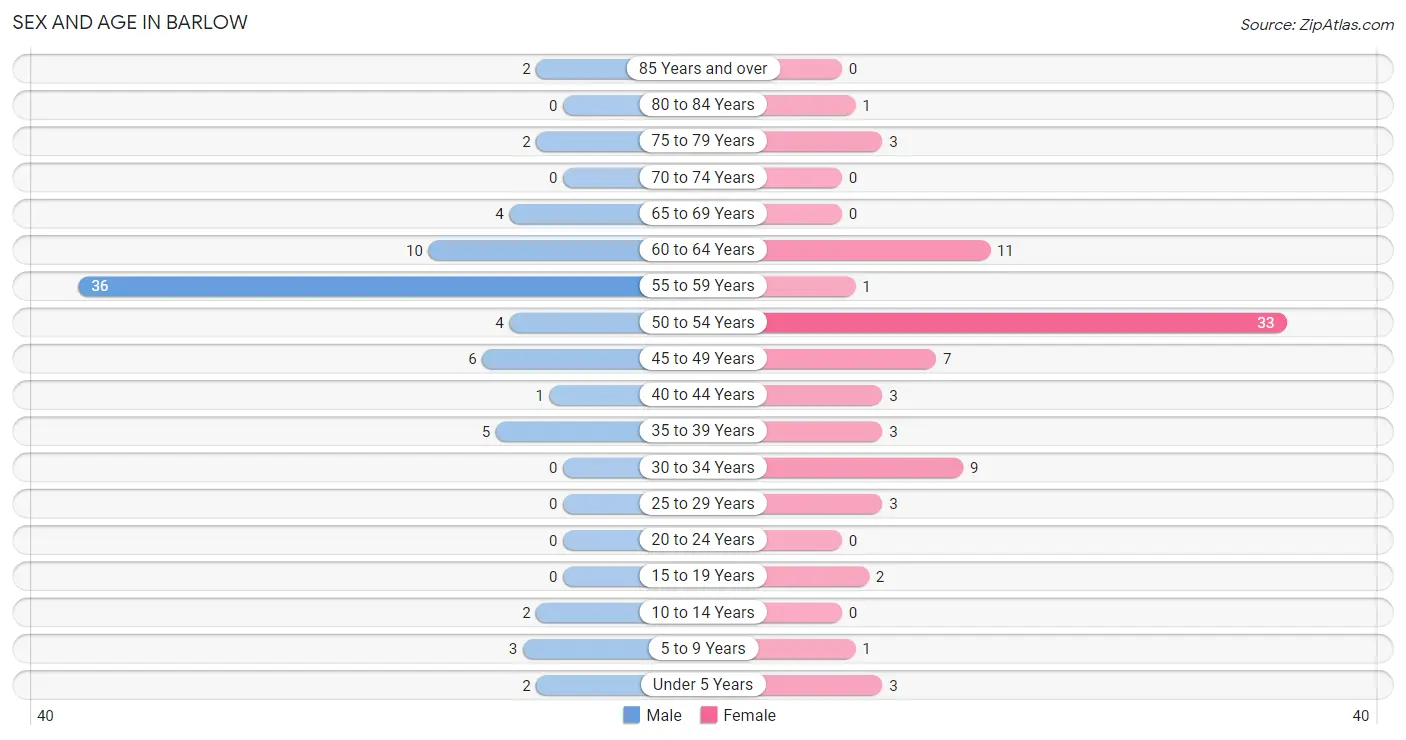
Sex and Age in Barlow
Sex and Age in Barlow
The most populous age groups in Barlow are 55 to 59 Years (36 | 46.8%) for men and 50 to 54 Years (33 | 41.2%) for women.
| Age Bracket | Male | Female |
| Under 5 Years | 2 (2.6%) | 3 (3.7%) |
| 5 to 9 Years | 3 (3.9%) | 1 (1.3%) |
| 10 to 14 Years | 2 (2.6%) | 0 (0.0%) |
| 15 to 19 Years | 0 (0.0%) | 2 (2.5%) |
| 20 to 24 Years | 0 (0.0%) | 0 (0.0%) |
| 25 to 29 Years | 0 (0.0%) | 3 (3.7%) |
| 30 to 34 Years | 0 (0.0%) | 9 (11.3%) |
| 35 to 39 Years | 5 (6.5%) | 3 (3.7%) |
| 40 to 44 Years | 1 (1.3%) | 3 (3.7%) |
| 45 to 49 Years | 6 (7.8%) | 7 (8.7%) |
| 50 to 54 Years | 4 (5.2%) | 33 (41.2%) |
| 55 to 59 Years | 36 (46.8%) | 1 (1.3%) |
| 60 to 64 Years | 10 (13.0%) | 11 (13.8%) |
| 65 to 69 Years | 4 (5.2%) | 0 (0.0%) |
| 70 to 74 Years | 0 (0.0%) | 0 (0.0%) |
| 75 to 79 Years | 2 (2.6%) | 3 (3.7%) |
| 80 to 84 Years | 0 (0.0%) | 1 (1.3%) |
| 85 Years and over | 2 (2.6%) | 0 (0.0%) |
| Total | 77 (100.0%) | 80 (100.0%) |
Families and Households in Barlow
Median Family Size in Barlow
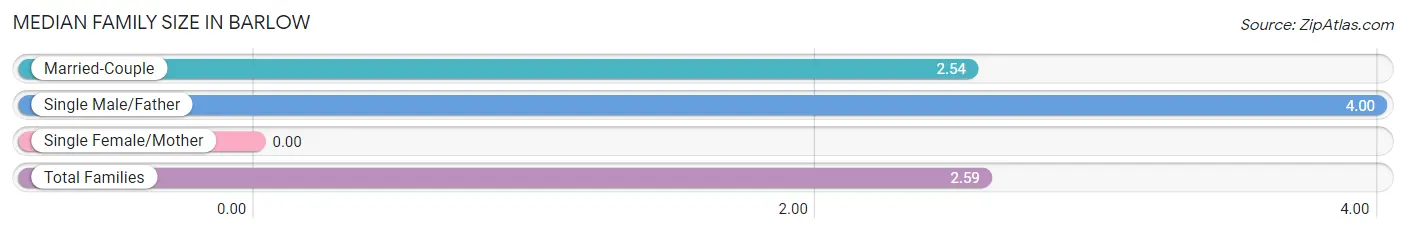
| Family Type | # Families | Family Size |
| Married-Couple | 26 (96.3%) | 2.54 |
| Single Male/Father | 1 (3.7%) | 4.00 |
| Single Female/Mother | 0 (0.0%) | - |
| Total Families | 27 (100.0%) | 2.59 |
Median Household Size in Barlow
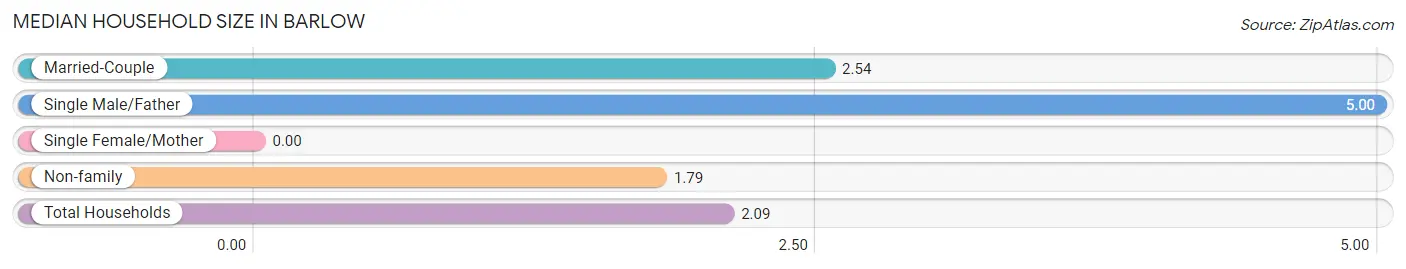
| Household Type | # Households | Household Size |
| Married-Couple | 26 (34.7%) | 2.54 |
| Single Male/Father | 1 (1.3%) | 5.00 |
| Single Female/Mother | 0 (0.0%) | - |
| Non-family | 48 (64.0%) | 1.79 |
| Total Households | 75 (100.0%) | 2.09 |
Household Size by Marriage Status in Barlow
Out of a total of 75 households in Barlow, 27 (36.0%) are family households, while 48 (64.0%) are nonfamily households. The most numerous type of family households are 2-person households, comprising 20, and the most common type of nonfamily households are 2-person households, comprising 36.
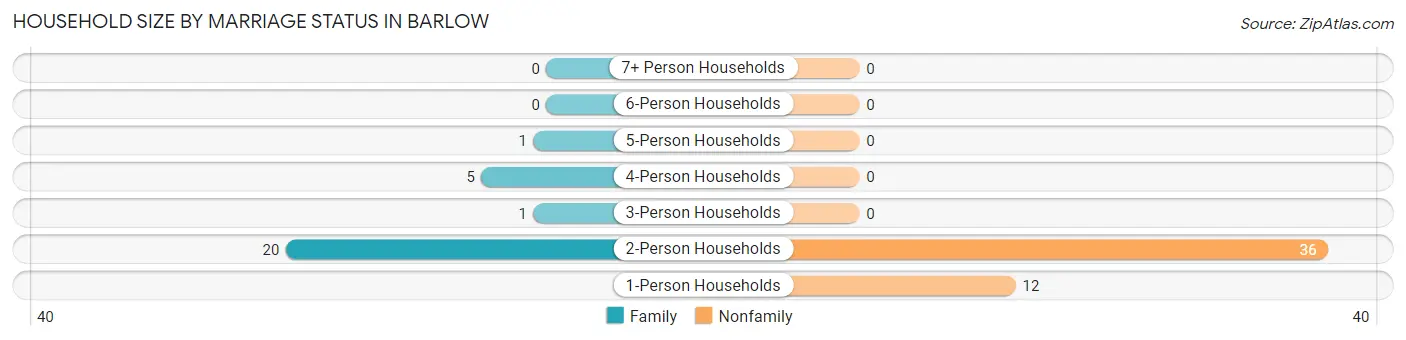
| Household Size | Family Households | Nonfamily Households |
| 1-Person Households | - | 12 (16.0%) |
| 2-Person Households | 20 (26.7%) | 36 (48.0%) |
| 3-Person Households | 1 (1.3%) | 0 (0.0%) |
| 4-Person Households | 5 (6.7%) | 0 (0.0%) |
| 5-Person Households | 1 (1.3%) | 0 (0.0%) |
| 6-Person Households | 0 (0.0%) | 0 (0.0%) |
| 7+ Person Households | 0 (0.0%) | 0 (0.0%) |
| Total | 27 (36.0%) | 48 (64.0%) |
Female Fertility in Barlow
Fertility by Age in Barlow
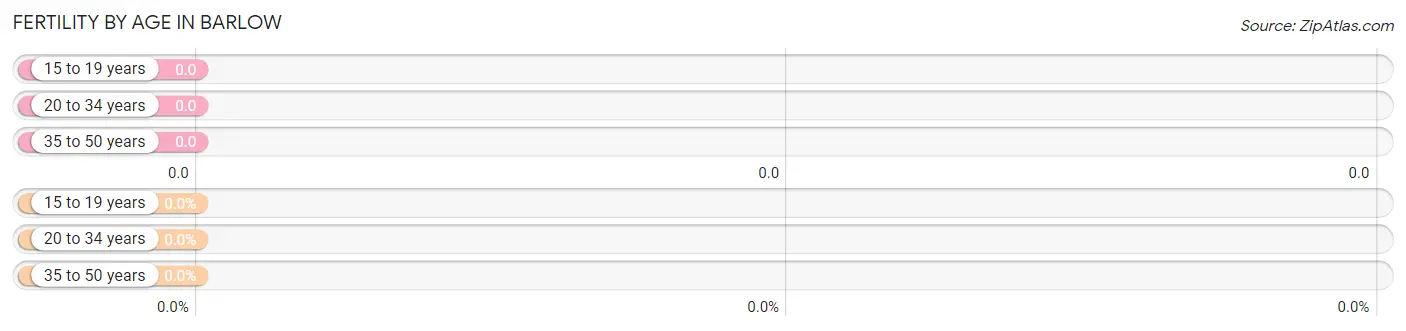
| Age Bracket | Women with Births | Births / 1,000 Women |
| 15 to 19 years | 0 (0.0%) | 0.0 |
| 20 to 34 years | 0 (0.0%) | 0.0 |
| 35 to 50 years | 0 (0.0%) | 0.0 |
| Total | 0 (0.0%) | 0.0 |
Fertility by Age by Marriage Status in Barlow
| Age Bracket | Married | Unmarried |
| 15 to 19 years | 0 (0.0%) | 0 (0.0%) |
| 20 to 34 years | 0 (0.0%) | 0 (0.0%) |
| 35 to 50 years | 0 (0.0%) | 0 (0.0%) |
| Total | 0 (0.0%) | 0 (0.0%) |
Fertility by Education in Barlow
| Educational Attainment | Women with Births | Births / 1,000 Women |
| Less than High School | 0 (0.0%) | 0.0 |
| High School Diploma | 0 (0.0%) | 0.0 |
| College or Associate's Degree | 0 (0.0%) | 0.0 |
| Bachelor's Degree | 0 (0.0%) | 0.0 |
| Graduate Degree | 0 (0.0%) | 0.0 |
| Total | 0 (0.0%) | 0.0 |
Fertility by Education by Marriage Status in Barlow
| Educational Attainment | Married | Unmarried |
| Less than High School | 0 (0.0%) | 0 (0.0%) |
| High School Diploma | 0 (0.0%) | 0 (0.0%) |
| College or Associate's Degree | 0 (0.0%) | 0 (0.0%) |
| Bachelor's Degree | 0 (0.0%) | 0 (0.0%) |
| Graduate Degree | 0 (0.0%) | 0 (0.0%) |
| Total | 0 (0.0%) | 0 (0.0%) |
Income in Barlow
Income Overview in Barlow
| Characteristic | Number | Measure |
| Per Capita Income | 157 | $32,336 |
| Median Family Income | 27 | $96,042 |
| Mean Family Income | 27 | $116,674 |
| Median Household Income | 75 | $0 |
| Mean Household Income | 75 | $65,376 |
| Income Deficit | 27 | $0 |
| Wage / Income Gap (%) | 157 | 0.00% |
| Wage / Income Gap ($) | 157 | 100.00¢ per $1 |
| Gini / Inequality Index | 157 | 0.44 |
Earnings by Sex in Barlow
| Sex | Number | Average Earnings |
| Male | 61 (50.4%) | $0 |
| Female | 60 (49.6%) | $0 |
| Total | 121 (100.0%) | $0 |
Earnings by Sex by Income Bracket in Barlow
The most common earnings brackets in Barlow are $25,000 to $29,999 for men (33 | 54.1%) and $2,500 to $4,999 for women (34 | 56.7%).
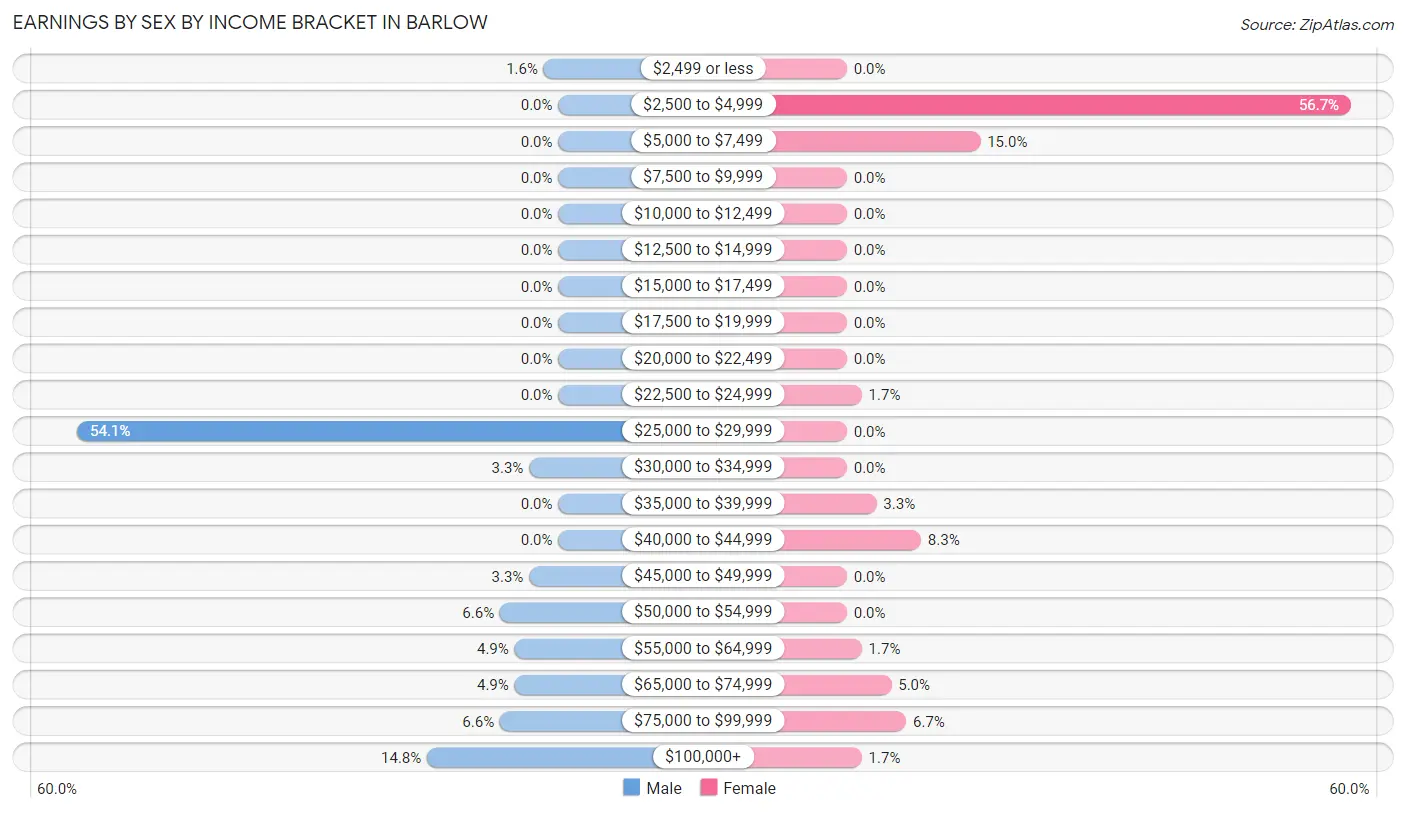
| Income | Male | Female |
| $2,499 or less | 1 (1.6%) | 0 (0.0%) |
| $2,500 to $4,999 | 0 (0.0%) | 34 (56.7%) |
| $5,000 to $7,499 | 0 (0.0%) | 9 (15.0%) |
| $7,500 to $9,999 | 0 (0.0%) | 0 (0.0%) |
| $10,000 to $12,499 | 0 (0.0%) | 0 (0.0%) |
| $12,500 to $14,999 | 0 (0.0%) | 0 (0.0%) |
| $15,000 to $17,499 | 0 (0.0%) | 0 (0.0%) |
| $17,500 to $19,999 | 0 (0.0%) | 0 (0.0%) |
| $20,000 to $22,499 | 0 (0.0%) | 0 (0.0%) |
| $22,500 to $24,999 | 0 (0.0%) | 1 (1.7%) |
| $25,000 to $29,999 | 33 (54.1%) | 0 (0.0%) |
| $30,000 to $34,999 | 2 (3.3%) | 0 (0.0%) |
| $35,000 to $39,999 | 0 (0.0%) | 2 (3.3%) |
| $40,000 to $44,999 | 0 (0.0%) | 5 (8.3%) |
| $45,000 to $49,999 | 2 (3.3%) | 0 (0.0%) |
| $50,000 to $54,999 | 4 (6.6%) | 0 (0.0%) |
| $55,000 to $64,999 | 3 (4.9%) | 1 (1.7%) |
| $65,000 to $74,999 | 3 (4.9%) | 3 (5.0%) |
| $75,000 to $99,999 | 4 (6.6%) | 4 (6.7%) |
| $100,000+ | 9 (14.7%) | 1 (1.7%) |
| Total | 61 (100.0%) | 60 (100.0%) |
Earnings by Sex by Educational Attainment in Barlow
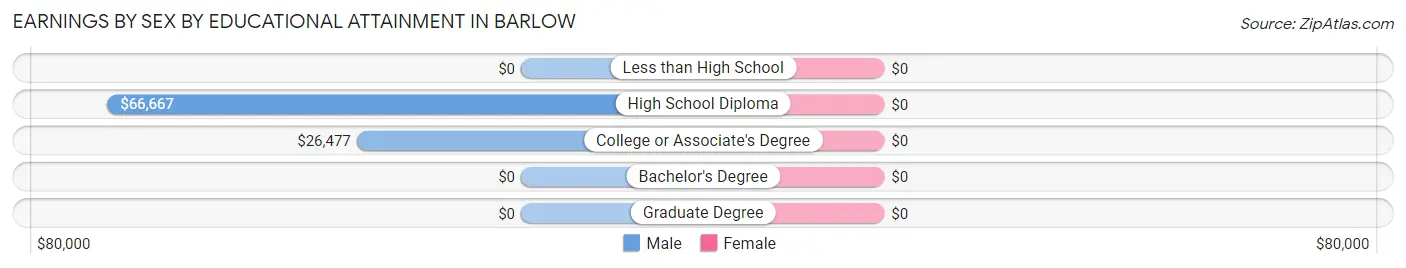
| Educational Attainment | Male Income | Female Income |
| Less than High School | - | - |
| High School Diploma | $66,667 | $0 |
| College or Associate's Degree | $26,477 | $0 |
| Bachelor's Degree | - | - |
| Graduate Degree | - | - |
| Total | - | - |
Family Income in Barlow
Family Income Brackets in Barlow
According to the Barlow family income data, there are 13 families falling into the $75,000 to $99,999 income range, which is the most common income bracket and makes up 48.1% of all families.
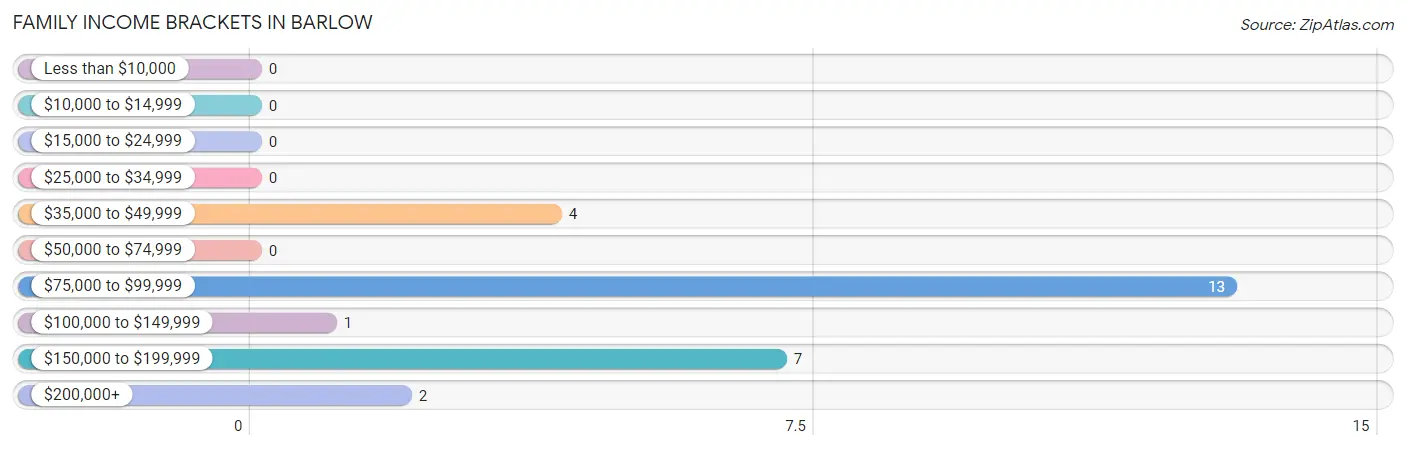
| Income Bracket | # Families | % Families |
| Less than $10,000 | 0 | 0.0% |
| $10,000 to $14,999 | 0 | 0.0% |
| $15,000 to $24,999 | 0 | 0.0% |
| $25,000 to $34,999 | 0 | 0.0% |
| $35,000 to $49,999 | 4 | 14.8% |
| $50,000 to $74,999 | 0 | 0.0% |
| $75,000 to $99,999 | 13 | 48.1% |
| $100,000 to $149,999 | 1 | 3.7% |
| $150,000 to $199,999 | 7 | 25.9% |
| $200,000+ | 2 | 7.4% |
Family Income by Famaliy Size in Barlow
2-person families (20 | 74.1%) account for the highest median family income in Barlow with $96,667 per family, while 2-person families (20 | 74.1%) have the highest median income of $48,334 per family member.
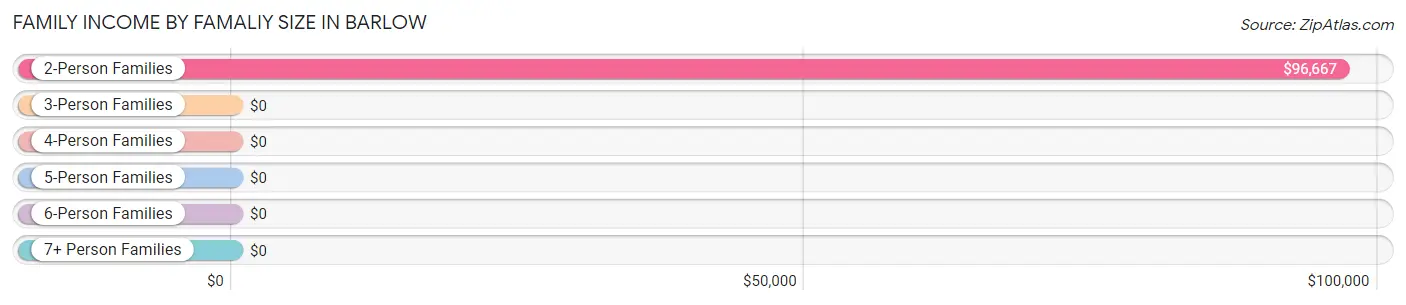
| Income Bracket | # Families | Median Income |
| 2-Person Families | 20 (74.1%) | $96,667 |
| 3-Person Families | 2 (7.4%) | $0 |
| 4-Person Families | 4 (14.8%) | $0 |
| 5-Person Families | 1 (3.7%) | $0 |
| 6-Person Families | 0 (0.0%) | $0 |
| 7+ Person Families | 0 (0.0%) | $0 |
| Total | 27 (100.0%) | $96,042 |
Family Income by Number of Earners in Barlow
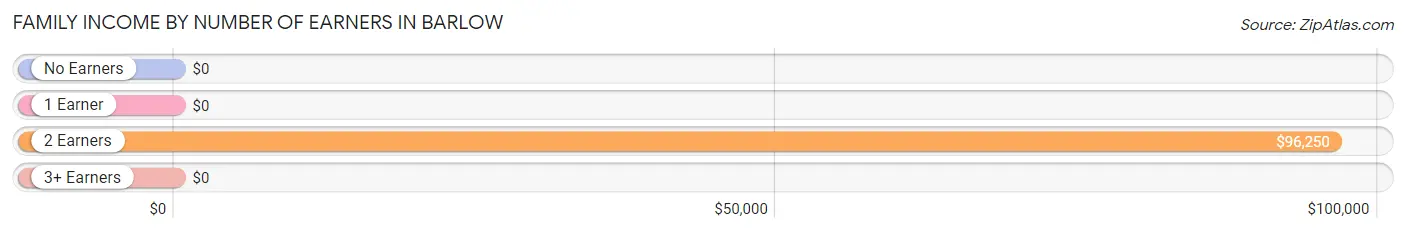
| Number of Earners | # Families | Median Income |
| No Earners | 3 (11.1%) | $0 |
| 1 Earner | 13 (48.1%) | $0 |
| 2 Earners | 10 (37.0%) | $96,250 |
| 3+ Earners | 1 (3.7%) | $0 |
| Total | 27 (100.0%) | $96,042 |
Household Income in Barlow
Household Income Brackets in Barlow
With 32 households falling in the category, the $25,000 to $34,999 income range is the most frequent in Barlow, accounting for 42.7% of all households.
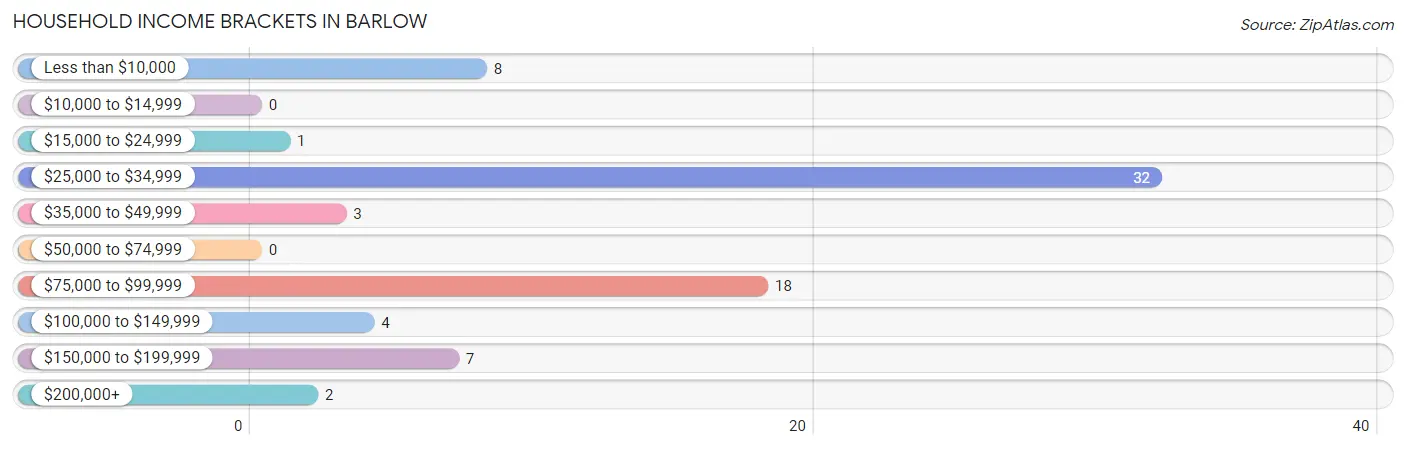
| Income Bracket | # Households | % Households |
| Less than $10,000 | 8 | 10.7% |
| $10,000 to $14,999 | 0 | 0.0% |
| $15,000 to $24,999 | 1 | 1.3% |
| $25,000 to $34,999 | 32 | 42.7% |
| $35,000 to $49,999 | 3 | 4.0% |
| $50,000 to $74,999 | 0 | 0.0% |
| $75,000 to $99,999 | 18 | 24.0% |
| $100,000 to $149,999 | 4 | 5.3% |
| $150,000 to $199,999 | 7 | 9.3% |
| $200,000+ | 2 | 2.7% |
Household Income by Householder Age in Barlow
The median household income in Barlow is $0, with the highest median household income of $82,813 found in the 65+ years age bracket for the primary householder. A total of 7 households (9.3%) fall into this category.
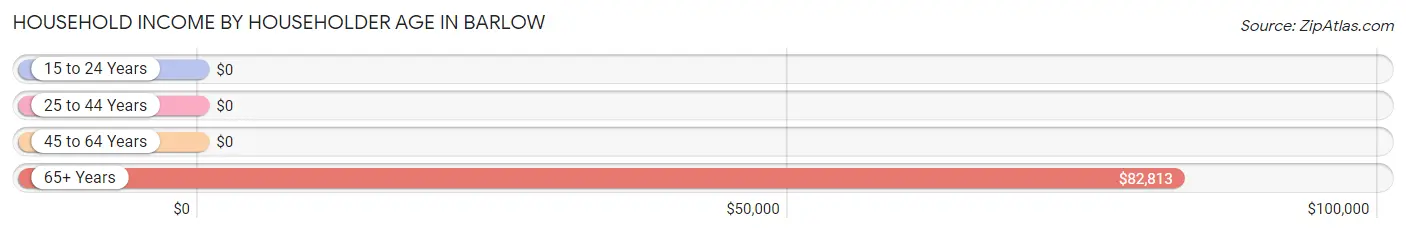
| Income Bracket | # Households | Median Income |
| 15 to 24 Years | 0 (0.0%) | $0 |
| 25 to 44 Years | 18 (24.0%) | $0 |
| 45 to 64 Years | 50 (66.7%) | $0 |
| 65+ Years | 7 (9.3%) | $82,813 |
| Total | 75 (100.0%) | $0 |
Poverty in Barlow
Income Below Poverty by Sex and Age in Barlow
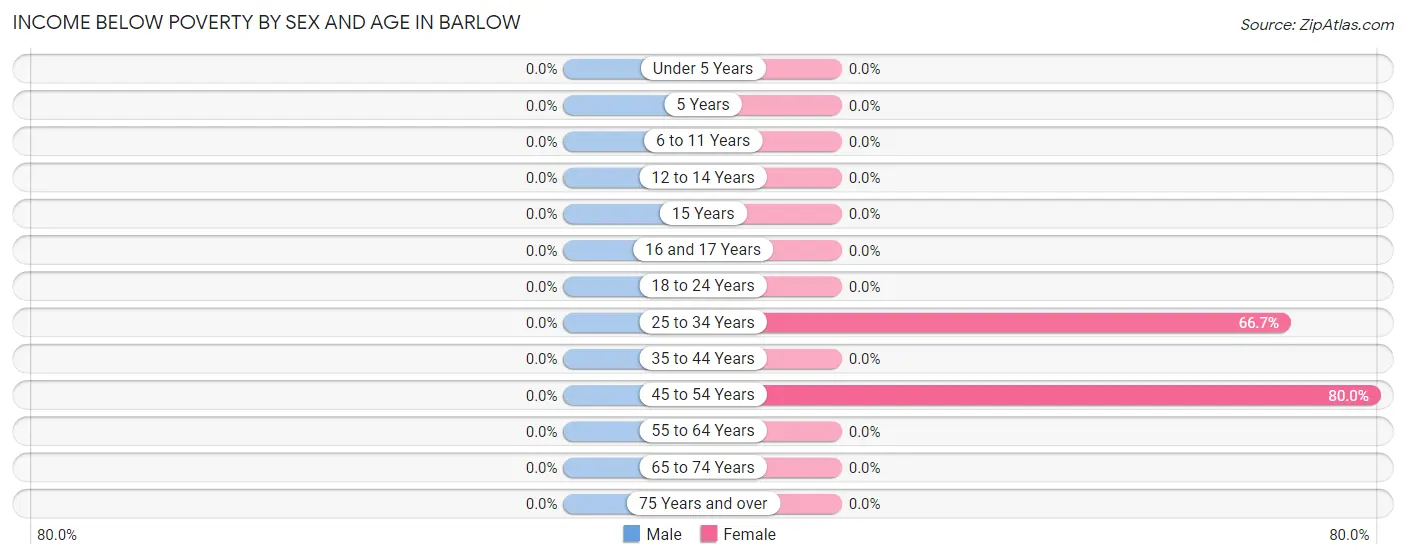
| Age Bracket | Male | Female |
| Under 5 Years | 0 (0.0%) | 0 (0.0%) |
| 5 Years | 0 (0.0%) | 0 (0.0%) |
| 6 to 11 Years | 0 (0.0%) | 0 (0.0%) |
| 12 to 14 Years | 0 (0.0%) | 0 (0.0%) |
| 15 Years | 0 (0.0%) | 0 (0.0%) |
| 16 and 17 Years | 0 (0.0%) | 0 (0.0%) |
| 18 to 24 Years | 0 (0.0%) | 0 (0.0%) |
| 25 to 34 Years | 0 (0.0%) | 8 (66.7%) |
| 35 to 44 Years | 0 (0.0%) | 0 (0.0%) |
| 45 to 54 Years | 0 (0.0%) | 32 (80.0%) |
| 55 to 64 Years | 0 (0.0%) | 0 (0.0%) |
| 65 to 74 Years | 0 (0.0%) | 0 (0.0%) |
| 75 Years and over | 0 (0.0%) | 0 (0.0%) |
| Total | 0 (0.0%) | 40 (50.0%) |
Income Above Poverty by Sex and Age in Barlow
According to the poverty statistics in Barlow, males aged under 5 years and females aged under 5 years are the age groups that are most secure financially, with 100.0% of males and 100.0% of females in these age groups living above the poverty line.
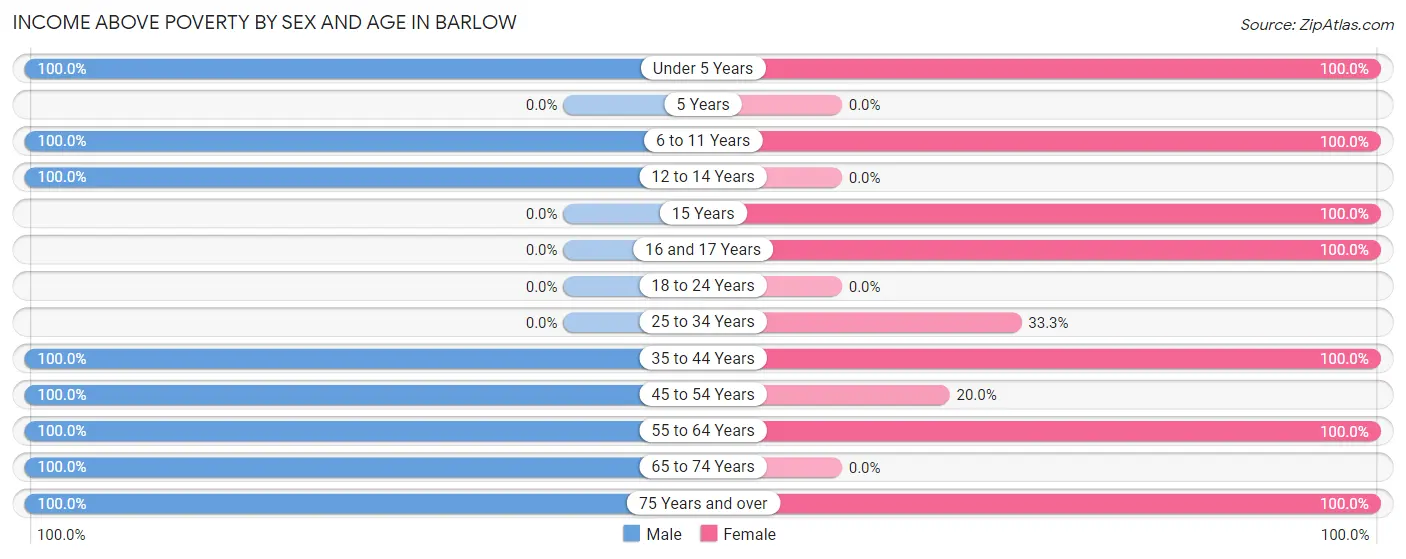
| Age Bracket | Male | Female |
| Under 5 Years | 2 (100.0%) | 3 (100.0%) |
| 5 Years | 0 (0.0%) | 0 (0.0%) |
| 6 to 11 Years | 3 (100.0%) | 1 (100.0%) |
| 12 to 14 Years | 2 (100.0%) | 0 (0.0%) |
| 15 Years | 0 (0.0%) | 1 (100.0%) |
| 16 and 17 Years | 0 (0.0%) | 1 (100.0%) |
| 18 to 24 Years | 0 (0.0%) | 0 (0.0%) |
| 25 to 34 Years | 0 (0.0%) | 4 (33.3%) |
| 35 to 44 Years | 6 (100.0%) | 6 (100.0%) |
| 45 to 54 Years | 10 (100.0%) | 8 (20.0%) |
| 55 to 64 Years | 46 (100.0%) | 12 (100.0%) |
| 65 to 74 Years | 4 (100.0%) | 0 (0.0%) |
| 75 Years and over | 4 (100.0%) | 4 (100.0%) |
| Total | 77 (100.0%) | 40 (50.0%) |
Income Below Poverty Among Married-Couple Families in Barlow
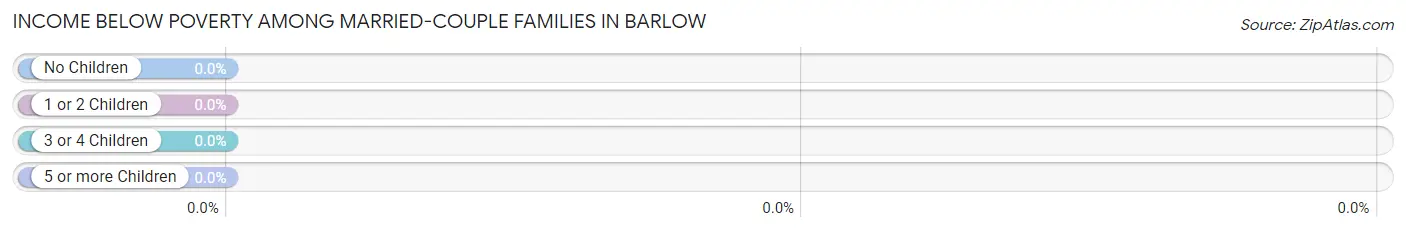
| Children | Above Poverty | Below Poverty |
| No Children | 21 (100.0%) | 0 (0.0%) |
| 1 or 2 Children | 4 (100.0%) | 0 (0.0%) |
| 3 or 4 Children | 1 (100.0%) | 0 (0.0%) |
| 5 or more Children | 0 (0.0%) | 0 (0.0%) |
| Total | 26 (100.0%) | 0 (0.0%) |
Income Below Poverty Among Single-Parent Households in Barlow
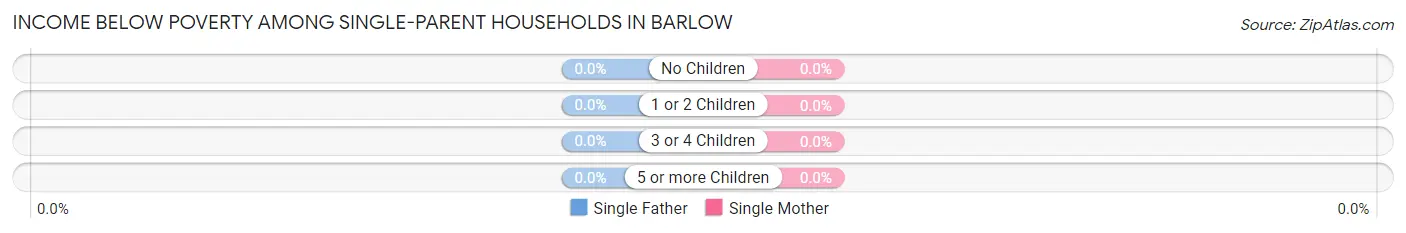
| Children | Single Father | Single Mother |
| No Children | 0 (0.0%) | 0 (0.0%) |
| 1 or 2 Children | 0 (0.0%) | 0 (0.0%) |
| 3 or 4 Children | 0 (0.0%) | 0 (0.0%) |
| 5 or more Children | 0 (0.0%) | 0 (0.0%) |
| Total | 0 (0.0%) | 0 (0.0%) |
Income Below Poverty Among Married-Couple vs Single-Parent Households in Barlow
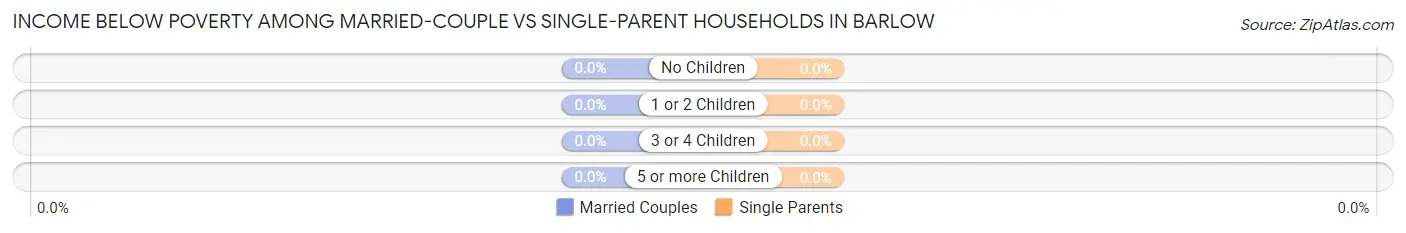
| Children | Married-Couple Families | Single-Parent Households |
| No Children | 0 (0.0%) | 0 (0.0%) |
| 1 or 2 Children | 0 (0.0%) | 0 (0.0%) |
| 3 or 4 Children | 0 (0.0%) | 0 (0.0%) |
| 5 or more Children | 0 (0.0%) | 0 (0.0%) |
| Total | 0 (0.0%) | 0 (0.0%) |
Employment Characteristics in Barlow
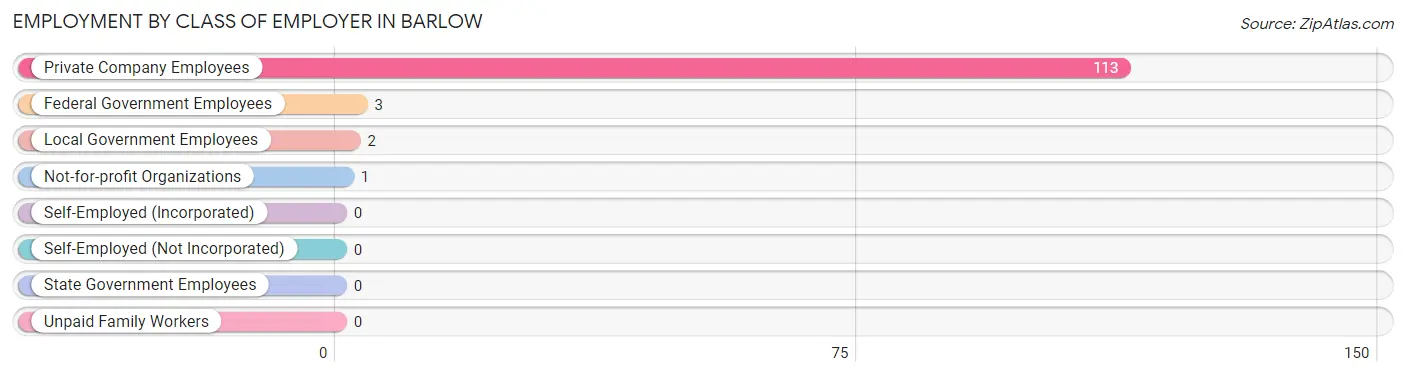
Employment by Class of Employer in Barlow
Among the 119 employed individuals in Barlow, private company employees (113 | 95.0%), federal government employees (3 | 2.5%), and local government employees (2 | 1.7%) make up the most common classes of employment.
| Employer Class | # Employees | % Employees |
| Private Company Employees | 113 | 95.0% |
| Self-Employed (Incorporated) | 0 | 0.0% |
| Self-Employed (Not Incorporated) | 0 | 0.0% |
| Not-for-profit Organizations | 1 | 0.8% |
| Local Government Employees | 2 | 1.7% |
| State Government Employees | 0 | 0.0% |
| Federal Government Employees | 3 | 2.5% |
| Unpaid Family Workers | 0 | 0.0% |
| Total | 119 | 100.0% |
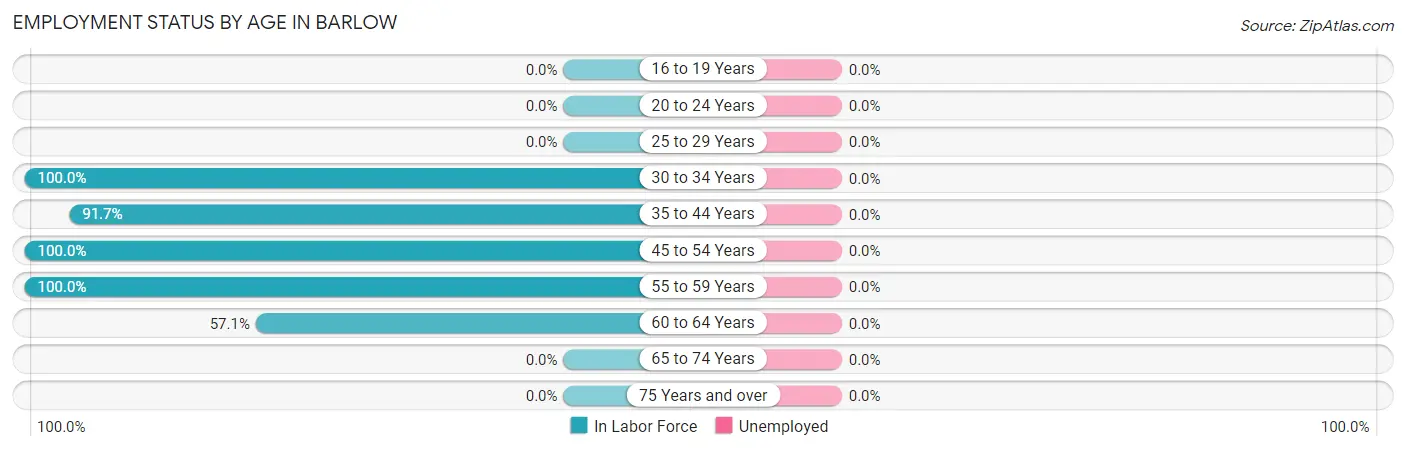
Employment Status by Age in Barlow
| Age Bracket | In Labor Force | Unemployed |
| 16 to 19 Years | 0 (0.0%) | 0 (0.0%) |
| 20 to 24 Years | 0 (0.0%) | 0 (0.0%) |
| 25 to 29 Years | 0 (0.0%) | 0 (0.0%) |
| 30 to 34 Years | 9 (100.0%) | 0 (0.0%) |
| 35 to 44 Years | 11 (91.7%) | 0 (0.0%) |
| 45 to 54 Years | 50 (100.0%) | 0 (0.0%) |
| 55 to 59 Years | 37 (100.0%) | 0 (0.0%) |
| 60 to 64 Years | 12 (57.1%) | 0 (0.0%) |
| 65 to 74 Years | 0 (0.0%) | 0 (0.0%) |
| 75 Years and over | 0 (0.0%) | 0 (0.0%) |
| Total | 119 (82.1%) | 0 (0.0%) |
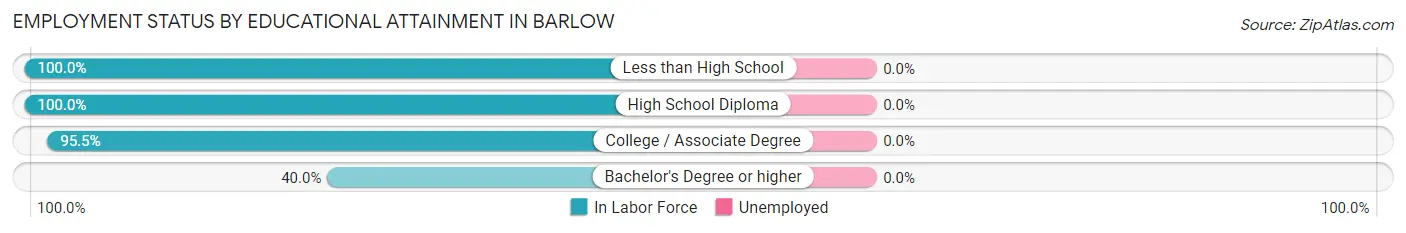
Employment Status by Educational Attainment in Barlow
| Educational Attainment | In Labor Force | Unemployed |
| Less than High School | 3 (100.0%) | 0 (0.0%) |
| High School Diploma | 26 (100.0%) | 0 (0.0%) |
| College / Associate Degree | 84 (95.5%) | 0 (0.0%) |
| Bachelor's Degree or higher | 6 (40.0%) | 0 (0.0%) |
| Total | 119 (90.2%) | 0 (0.0%) |
Employment Occupations by Sex in Barlow
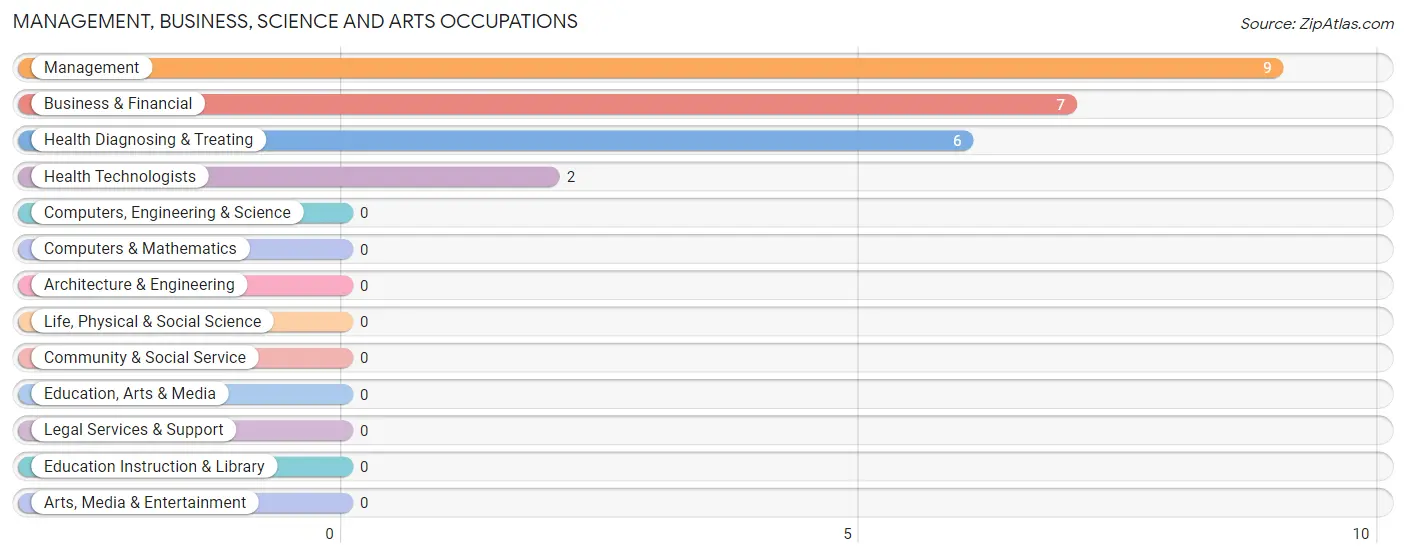
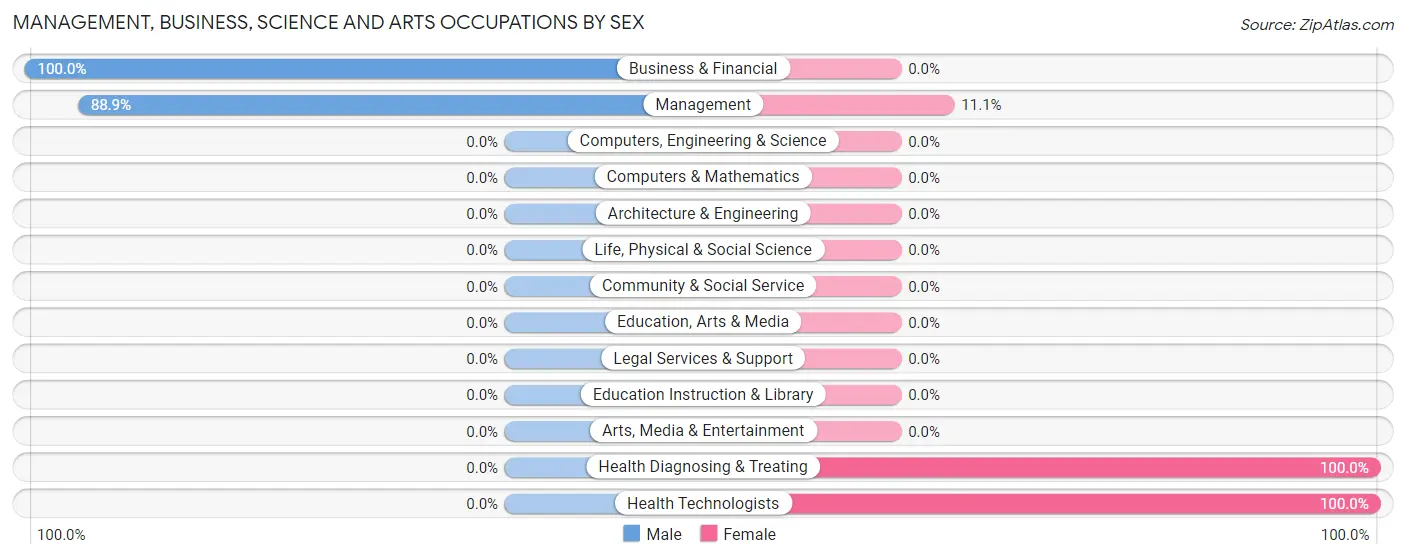
Management, Business, Science and Arts Occupations
The most common Management, Business, Science and Arts occupations in Barlow are Management (9 | 7.6%), Business & Financial (7 | 5.9%), Health Diagnosing & Treating (6 | 5.0%), and Health Technologists (2 | 1.7%).
Management, Business, Science and Arts Occupations by Sex
Within the Management, Business, Science and Arts occupations in Barlow, the most male-oriented occupations are Business & Financial (100.0%), and Management (88.9%), while the most female-oriented occupations are Health Diagnosing & Treating (100.0%), Health Technologists (100.0%), and Management (11.1%).
| Occupation | Male | Female |
| Management | 8 (88.9%) | 1 (11.1%) |
| Business & Financial | 7 (100.0%) | 0 (0.0%) |
| Computers, Engineering & Science | 0 (0.0%) | 0 (0.0%) |
| Computers & Mathematics | 0 (0.0%) | 0 (0.0%) |
| Architecture & Engineering | 0 (0.0%) | 0 (0.0%) |
| Life, Physical & Social Science | 0 (0.0%) | 0 (0.0%) |
| Community & Social Service | 0 (0.0%) | 0 (0.0%) |
| Education, Arts & Media | 0 (0.0%) | 0 (0.0%) |
| Legal Services & Support | 0 (0.0%) | 0 (0.0%) |
| Education Instruction & Library | 0 (0.0%) | 0 (0.0%) |
| Arts, Media & Entertainment | 0 (0.0%) | 0 (0.0%) |
| Health Diagnosing & Treating | 0 (0.0%) | 6 (100.0%) |
| Health Technologists | 0 (0.0%) | 2 (100.0%) |
| Total (Category) | 15 (68.2%) | 7 (31.8%) |
| Total (Overall) | 60 (50.4%) | 59 (49.6%) |
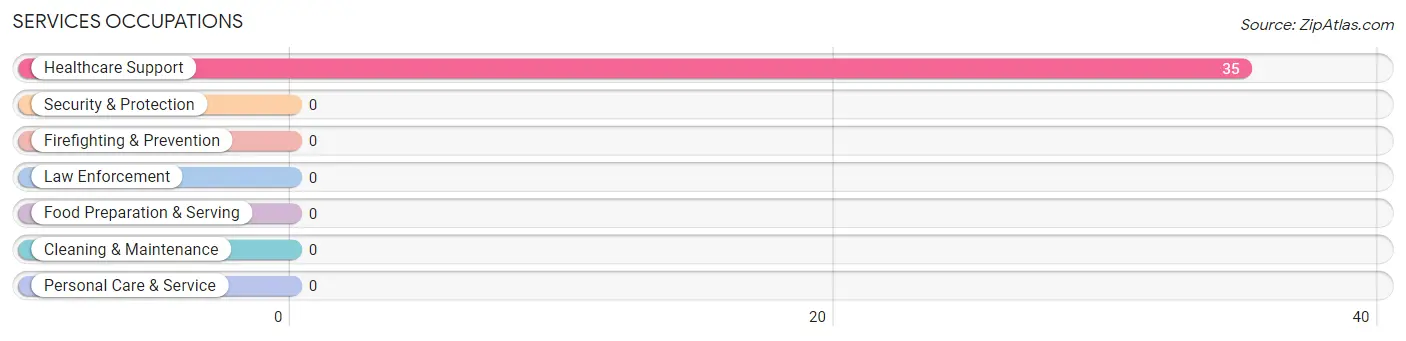
Services Occupations
The most common Services occupations in Barlow are , and Healthcare Support (35 | 29.4%).
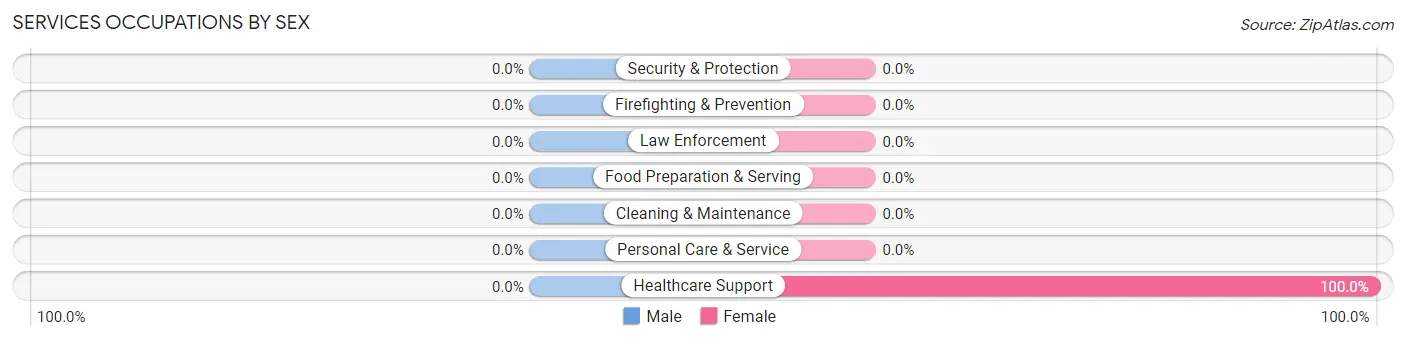
Services Occupations by Sex
| Occupation | Male | Female |
| Healthcare Support | 0 (0.0%) | 35 (100.0%) |
| Security & Protection | 0 (0.0%) | 0 (0.0%) |
| Firefighting & Prevention | 0 (0.0%) | 0 (0.0%) |
| Law Enforcement | 0 (0.0%) | 0 (0.0%) |
| Food Preparation & Serving | 0 (0.0%) | 0 (0.0%) |
| Cleaning & Maintenance | 0 (0.0%) | 0 (0.0%) |
| Personal Care & Service | 0 (0.0%) | 0 (0.0%) |
| Total (Category) | 0 (0.0%) | 35 (100.0%) |
| Total (Overall) | 60 (50.4%) | 59 (49.6%) |
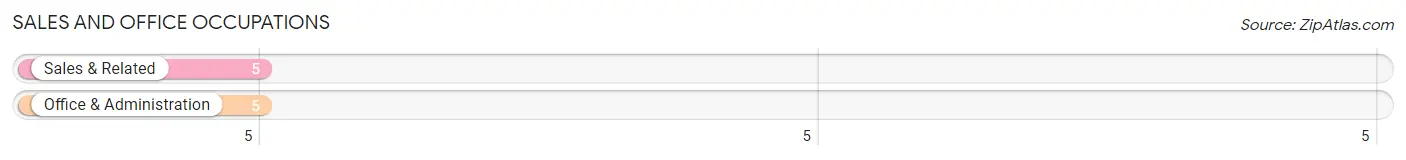
Sales and Office Occupations
The most common Sales and Office occupations in Barlow are Sales & Related (5 | 4.2%), and Office & Administration (5 | 4.2%).
Sales and Office Occupations by Sex

| Occupation | Male | Female |
| Sales & Related | 1 (20.0%) | 4 (80.0%) |
| Office & Administration | 0 (0.0%) | 5 (100.0%) |
| Total (Category) | 1 (10.0%) | 9 (90.0%) |
| Total (Overall) | 60 (50.4%) | 59 (49.6%) |
Natural Resources, Construction and Maintenance Occupations
The most common Natural Resources, Construction and Maintenance occupations in Barlow are Construction & Extraction (3 | 2.5%), and Installation, Maintenance & Repair (3 | 2.5%).
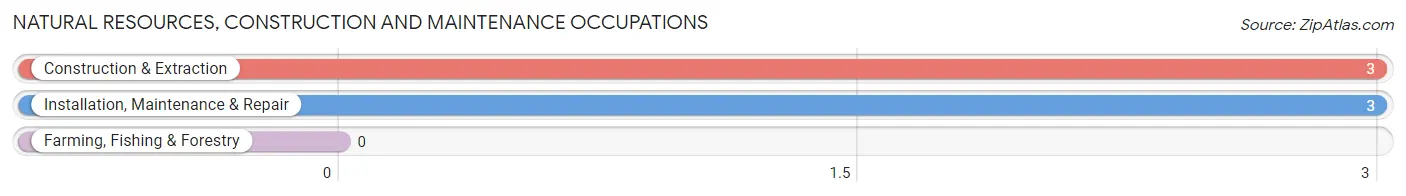
Natural Resources, Construction and Maintenance Occupations by Sex
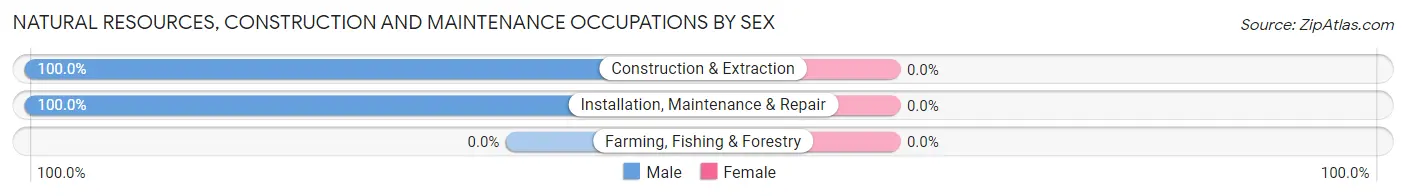
| Occupation | Male | Female |
| Farming, Fishing & Forestry | 0 (0.0%) | 0 (0.0%) |
| Construction & Extraction | 3 (100.0%) | 0 (0.0%) |
| Installation, Maintenance & Repair | 3 (100.0%) | 0 (0.0%) |
| Total (Category) | 6 (100.0%) | 0 (0.0%) |
| Total (Overall) | 60 (50.4%) | 59 (49.6%) |
Production, Transportation and Moving Occupations
The most common Production, Transportation and Moving occupations in Barlow are Material Moving (34 | 28.6%), and Production (12 | 10.1%).
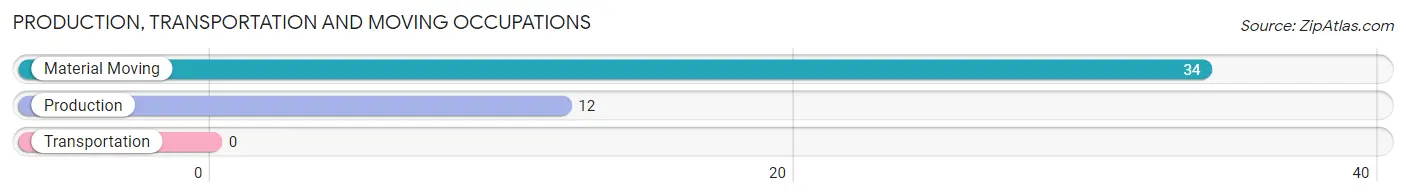
Production, Transportation and Moving Occupations by Sex
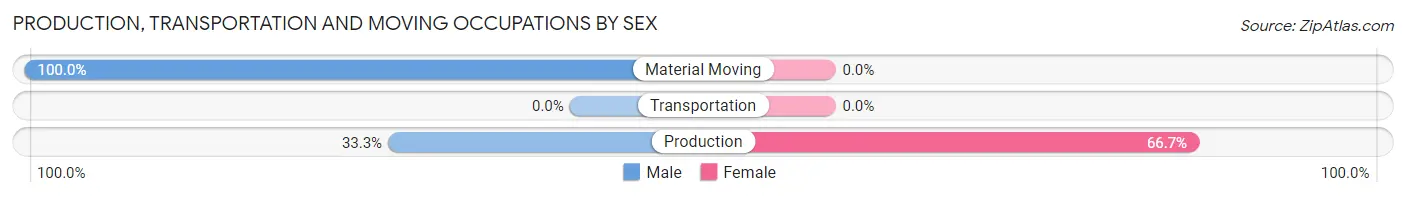
| Occupation | Male | Female |
| Production | 4 (33.3%) | 8 (66.7%) |
| Transportation | 0 (0.0%) | 0 (0.0%) |
| Material Moving | 34 (100.0%) | 0 (0.0%) |
| Total (Category) | 38 (82.6%) | 8 (17.4%) |
| Total (Overall) | 60 (50.4%) | 59 (49.6%) |
Employment Industries by Sex in Barlow
Employment Industries in Barlow
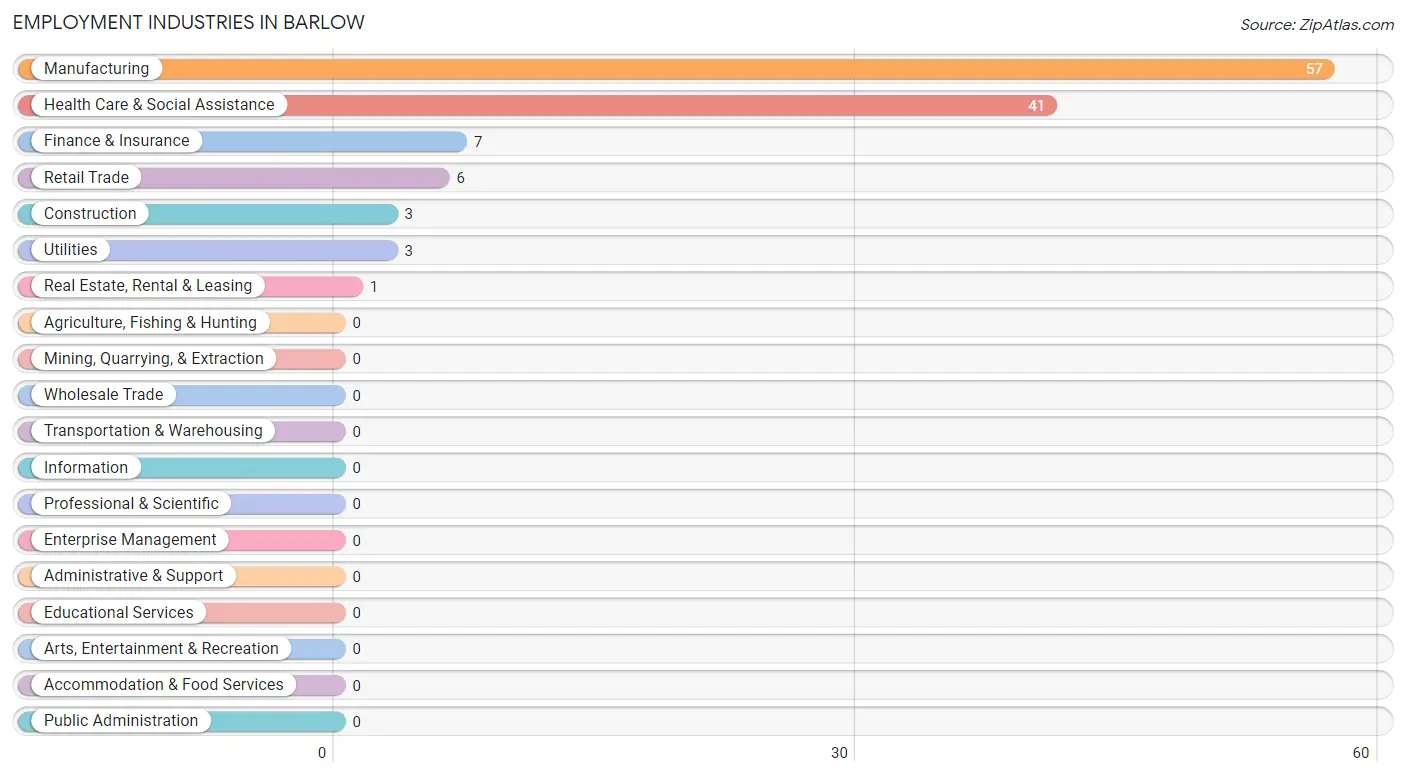
The major employment industries in Barlow include Manufacturing (57 | 47.9%), Health Care & Social Assistance (41 | 34.4%), Finance & Insurance (7 | 5.9%), Retail Trade (6 | 5.0%), and Construction (3 | 2.5%).
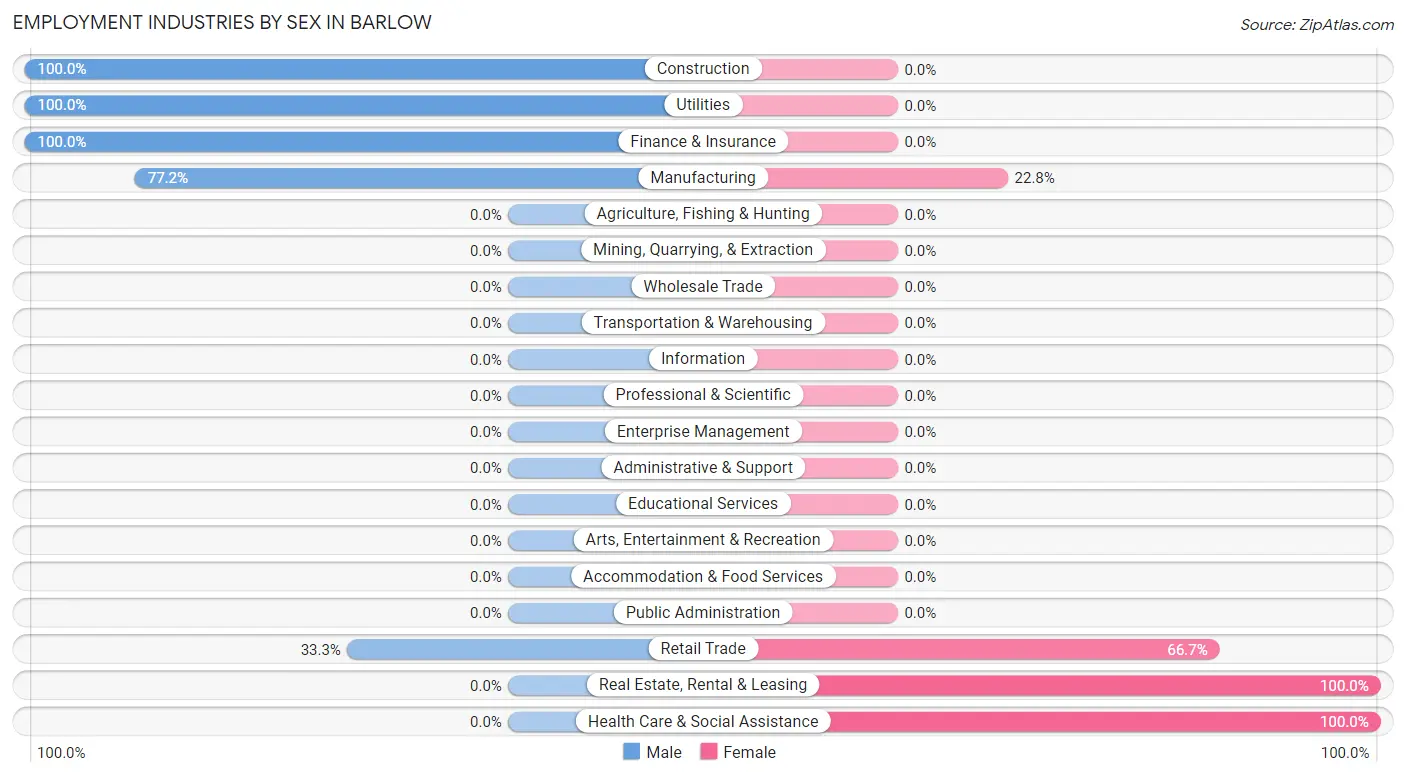
Employment Industries by Sex in Barlow
The Barlow industries that see more men than women are Construction (100.0%), Utilities (100.0%), and Finance & Insurance (100.0%), whereas the industries that tend to have a higher number of women are Real Estate, Rental & Leasing (100.0%), Health Care & Social Assistance (100.0%), and Retail Trade (66.7%).
| Industry | Male | Female |
| Agriculture, Fishing & Hunting | 0 (0.0%) | 0 (0.0%) |
| Mining, Quarrying, & Extraction | 0 (0.0%) | 0 (0.0%) |
| Construction | 3 (100.0%) | 0 (0.0%) |
| Manufacturing | 44 (77.2%) | 13 (22.8%) |
| Wholesale Trade | 0 (0.0%) | 0 (0.0%) |
| Retail Trade | 2 (33.3%) | 4 (66.7%) |
| Transportation & Warehousing | 0 (0.0%) | 0 (0.0%) |
| Utilities | 3 (100.0%) | 0 (0.0%) |
| Information | 0 (0.0%) | 0 (0.0%) |
| Finance & Insurance | 7 (100.0%) | 0 (0.0%) |
| Real Estate, Rental & Leasing | 0 (0.0%) | 1 (100.0%) |
| Professional & Scientific | 0 (0.0%) | 0 (0.0%) |
| Enterprise Management | 0 (0.0%) | 0 (0.0%) |
| Administrative & Support | 0 (0.0%) | 0 (0.0%) |
| Educational Services | 0 (0.0%) | 0 (0.0%) |
| Health Care & Social Assistance | 0 (0.0%) | 41 (100.0%) |
| Arts, Entertainment & Recreation | 0 (0.0%) | 0 (0.0%) |
| Accommodation & Food Services | 0 (0.0%) | 0 (0.0%) |
| Public Administration | 0 (0.0%) | 0 (0.0%) |
| Total | 60 (50.4%) | 59 (49.6%) |
Education in Barlow
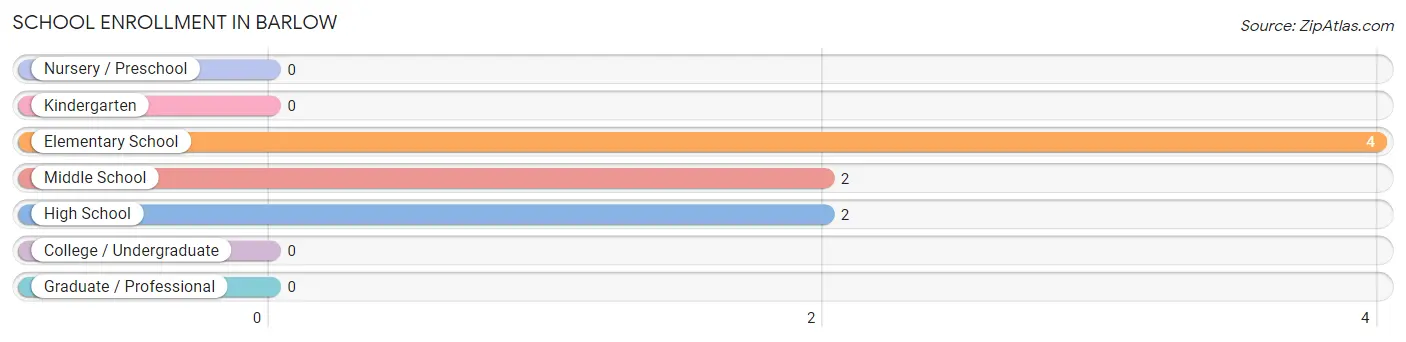
School Enrollment in Barlow
The most common levels of schooling among the 8 students in Barlow are elementary school (4 | 50.0%), middle school (2 | 25.0%), and high school (2 | 25.0%).
| School Level | # Students | % Students |
| Nursery / Preschool | 0 | 0.0% |
| Kindergarten | 0 | 0.0% |
| Elementary School | 4 | 50.0% |
| Middle School | 2 | 25.0% |
| High School | 2 | 25.0% |
| College / Undergraduate | 0 | 0.0% |
| Graduate / Professional | 0 | 0.0% |
| Total | 8 | 100.0% |
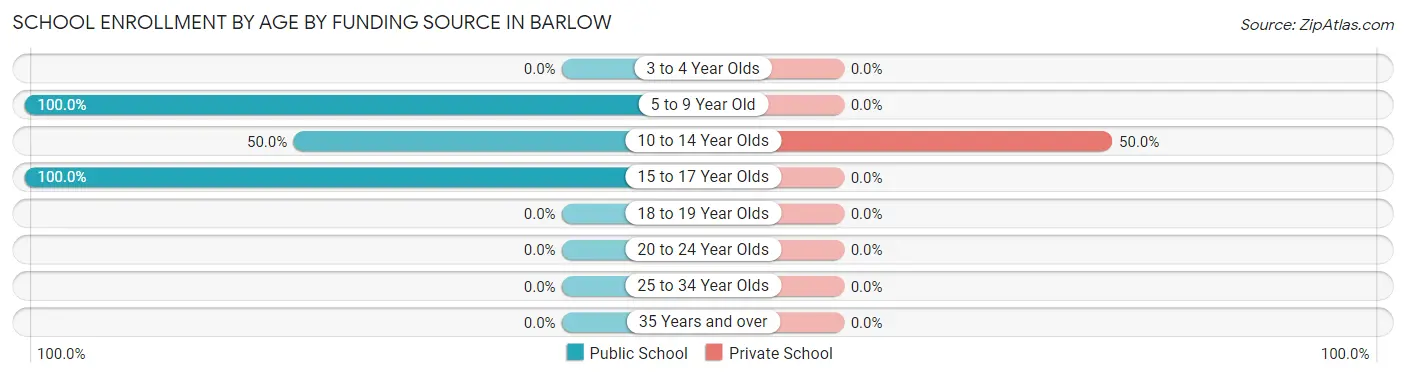
School Enrollment by Age by Funding Source in Barlow
Out of a total of 8 students who are enrolled in schools in Barlow, 1 (12.5%) attend a private institution, while the remaining 7 (87.5%) are enrolled in public schools. The age group of 10 to 14 year olds has the highest likelihood of being enrolled in private schools, with 1 (50.0% in the age bracket) enrolled. Conversely, the age group of 5 to 9 year old has the lowest likelihood of being enrolled in a private school, with 4 (100.0% in the age bracket) attending a public institution.
| Age Bracket | Public School | Private School |
| 3 to 4 Year Olds | 0 (0.0%) | 0 (0.0%) |
| 5 to 9 Year Old | 4 (100.0%) | 0 (0.0%) |
| 10 to 14 Year Olds | 1 (50.0%) | 1 (50.0%) |
| 15 to 17 Year Olds | 2 (100.0%) | 0 (0.0%) |
| 18 to 19 Year Olds | 0 (0.0%) | 0 (0.0%) |
| 20 to 24 Year Olds | 0 (0.0%) | 0 (0.0%) |
| 25 to 34 Year Olds | 0 (0.0%) | 0 (0.0%) |
| 35 Years and over | 0 (0.0%) | 0 (0.0%) |
| Total | 7 (87.5%) | 1 (12.5%) |
Educational Attainment by Field of Study in Barlow
Business (8 | 42.1%), social sciences (2 | 10.5%), liberal arts & history (2 | 10.5%), arts & humanities (2 | 10.5%), and physical & health sciences (1 | 5.3%) are the most common fields of study among 19 individuals in Barlow who have obtained a bachelor's degree or higher.
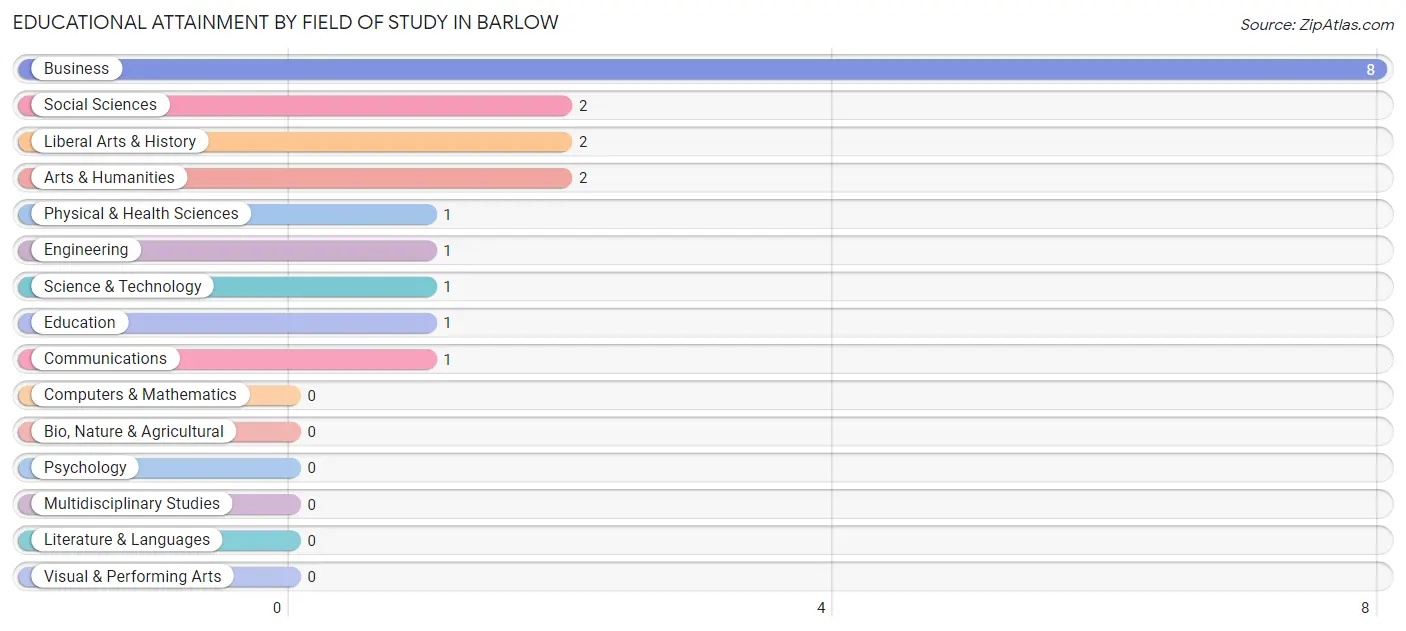
| Field of Study | # Graduates | % Graduates |
| Computers & Mathematics | 0 | 0.0% |
| Bio, Nature & Agricultural | 0 | 0.0% |
| Physical & Health Sciences | 1 | 5.3% |
| Psychology | 0 | 0.0% |
| Social Sciences | 2 | 10.5% |
| Engineering | 1 | 5.3% |
| Multidisciplinary Studies | 0 | 0.0% |
| Science & Technology | 1 | 5.3% |
| Business | 8 | 42.1% |
| Education | 1 | 5.3% |
| Literature & Languages | 0 | 0.0% |
| Liberal Arts & History | 2 | 10.5% |
| Visual & Performing Arts | 0 | 0.0% |
| Communications | 1 | 5.3% |
| Arts & Humanities | 2 | 10.5% |
| Total | 19 | 100.0% |
Transportation & Commute in Barlow
Vehicle Availability by Sex in Barlow
The most prevalent vehicle ownership categories in Barlow are males with 1 vehicle (45, accounting for 75.0%) and females with 1 vehicle (43, making up 76.3%).
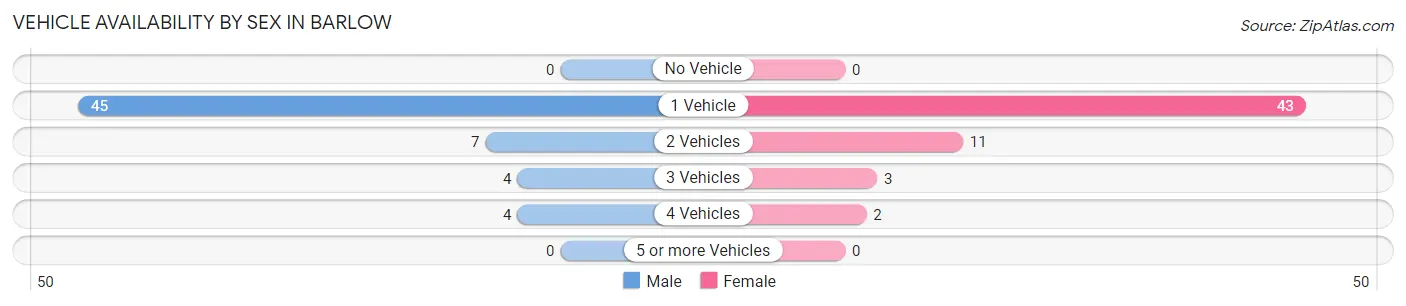
| Vehicles Available | Male | Female |
| No Vehicle | 0 (0.0%) | 0 (0.0%) |
| 1 Vehicle | 45 (75.0%) | 43 (72.9%) |
| 2 Vehicles | 7 (11.7%) | 11 (18.6%) |
| 3 Vehicles | 4 (6.7%) | 3 (5.1%) |
| 4 Vehicles | 4 (6.7%) | 2 (3.4%) |
| 5 or more Vehicles | 0 (0.0%) | 0 (0.0%) |
| Total | 60 (100.0%) | 59 (100.0%) |
Commute Time in Barlow
The most frequently occuring commute durations in Barlow are 30 to 34 minutes (40 commuters, 48.8%), 10 to 14 minutes (11 commuters, 13.4%), and 45 to 59 minutes (11 commuters, 13.4%).
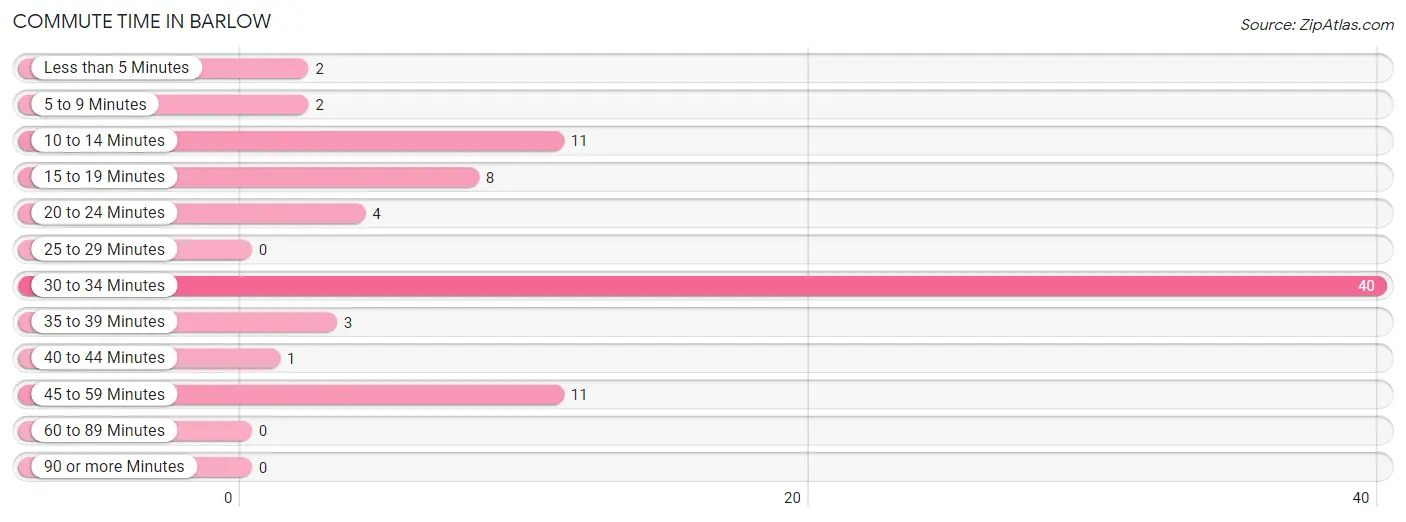
| Commute Time | # Commuters | % Commuters |
| Less than 5 Minutes | 2 | 2.4% |
| 5 to 9 Minutes | 2 | 2.4% |
| 10 to 14 Minutes | 11 | 13.4% |
| 15 to 19 Minutes | 8 | 9.8% |
| 20 to 24 Minutes | 4 | 4.9% |
| 25 to 29 Minutes | 0 | 0.0% |
| 30 to 34 Minutes | 40 | 48.8% |
| 35 to 39 Minutes | 3 | 3.7% |
| 40 to 44 Minutes | 1 | 1.2% |
| 45 to 59 Minutes | 11 | 13.4% |
| 60 to 89 Minutes | 0 | 0.0% |
| 90 or more Minutes | 0 | 0.0% |
Commute Time by Sex in Barlow
The most common commute times in Barlow are 30 to 34 minutes (39 commuters, 66.1%) for males and 15 to 19 minutes (8 commuters, 34.8%) for females.
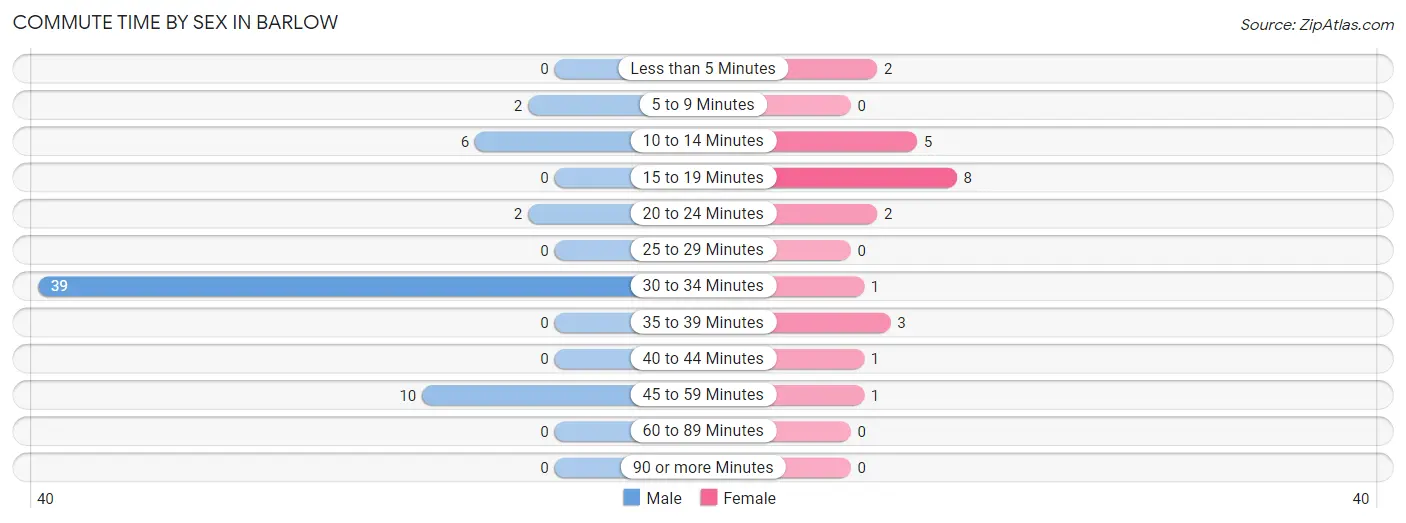
| Commute Time | Male | Female |
| Less than 5 Minutes | 0 (0.0%) | 2 (8.7%) |
| 5 to 9 Minutes | 2 (3.4%) | 0 (0.0%) |
| 10 to 14 Minutes | 6 (10.2%) | 5 (21.7%) |
| 15 to 19 Minutes | 0 (0.0%) | 8 (34.8%) |
| 20 to 24 Minutes | 2 (3.4%) | 2 (8.7%) |
| 25 to 29 Minutes | 0 (0.0%) | 0 (0.0%) |
| 30 to 34 Minutes | 39 (66.1%) | 1 (4.3%) |
| 35 to 39 Minutes | 0 (0.0%) | 3 (13.0%) |
| 40 to 44 Minutes | 0 (0.0%) | 1 (4.3%) |
| 45 to 59 Minutes | 10 (17.0%) | 1 (4.3%) |
| 60 to 89 Minutes | 0 (0.0%) | 0 (0.0%) |
| 90 or more Minutes | 0 (0.0%) | 0 (0.0%) |
Time of Departure to Work by Sex in Barlow
The most frequent times of departure to work in Barlow are 7:00 AM to 7:29 AM (33, 55.9%) for males and 7:30 AM to 7:59 AM (8, 34.8%) for females.
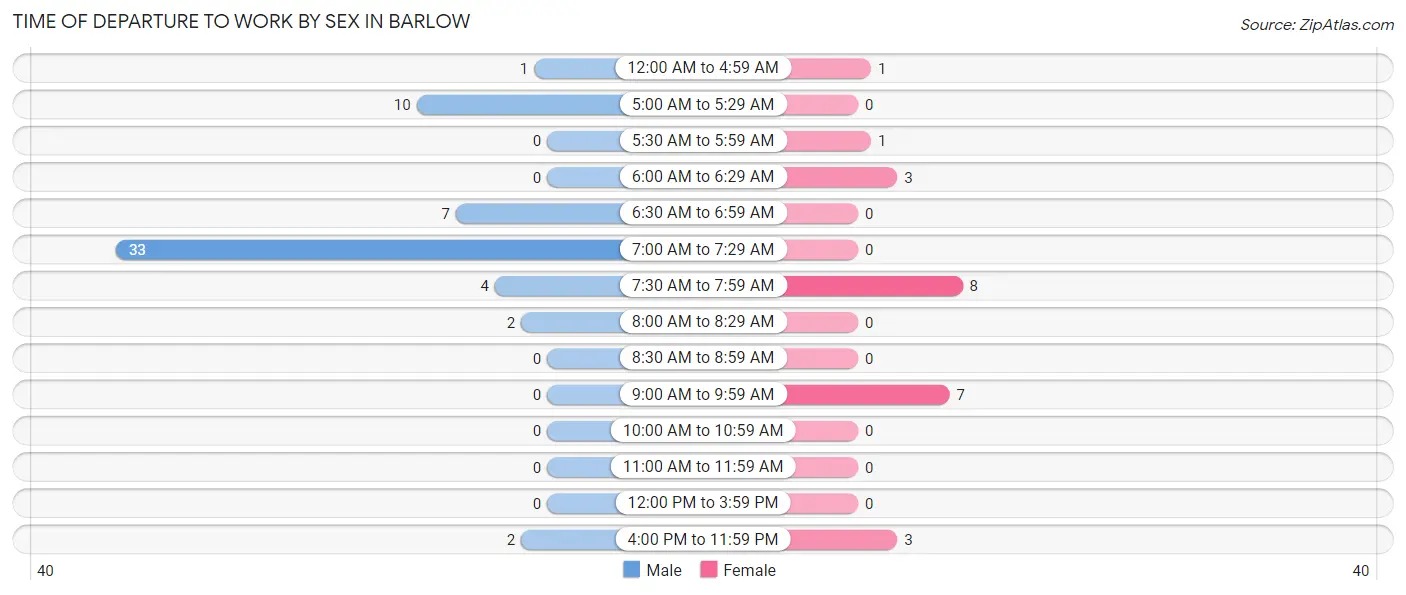
| Time of Departure | Male | Female |
| 12:00 AM to 4:59 AM | 1 (1.7%) | 1 (4.3%) |
| 5:00 AM to 5:29 AM | 10 (17.0%) | 0 (0.0%) |
| 5:30 AM to 5:59 AM | 0 (0.0%) | 1 (4.3%) |
| 6:00 AM to 6:29 AM | 0 (0.0%) | 3 (13.0%) |
| 6:30 AM to 6:59 AM | 7 (11.9%) | 0 (0.0%) |
| 7:00 AM to 7:29 AM | 33 (55.9%) | 0 (0.0%) |
| 7:30 AM to 7:59 AM | 4 (6.8%) | 8 (34.8%) |
| 8:00 AM to 8:29 AM | 2 (3.4%) | 0 (0.0%) |
| 8:30 AM to 8:59 AM | 0 (0.0%) | 0 (0.0%) |
| 9:00 AM to 9:59 AM | 0 (0.0%) | 7 (30.4%) |
| 10:00 AM to 10:59 AM | 0 (0.0%) | 0 (0.0%) |
| 11:00 AM to 11:59 AM | 0 (0.0%) | 0 (0.0%) |
| 12:00 PM to 3:59 PM | 0 (0.0%) | 0 (0.0%) |
| 4:00 PM to 11:59 PM | 2 (3.4%) | 3 (13.0%) |
| Total | 59 (100.0%) | 23 (100.0%) |
Housing Occupancy in Barlow
Occupancy by Ownership in Barlow
Of the total 75 dwellings in Barlow, owner-occupied units account for 75 (100.0%), while renter-occupied units make up 0 (0.0%).
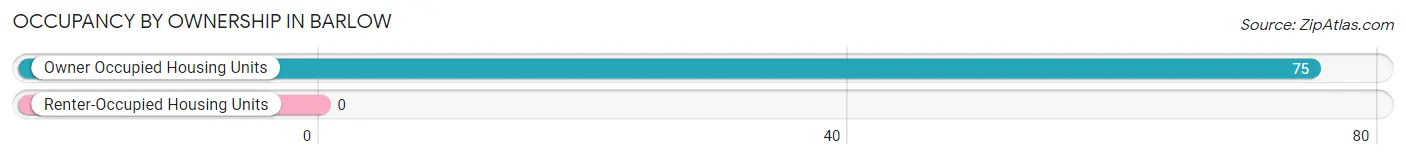
| Occupancy | # Housing Units | % Housing Units |
| Owner Occupied Housing Units | 75 | 100.0% |
| Renter-Occupied Housing Units | 0 | 0.0% |
| Total Occupied Housing Units | 75 | 100.0% |
Occupancy by Household Size in Barlow
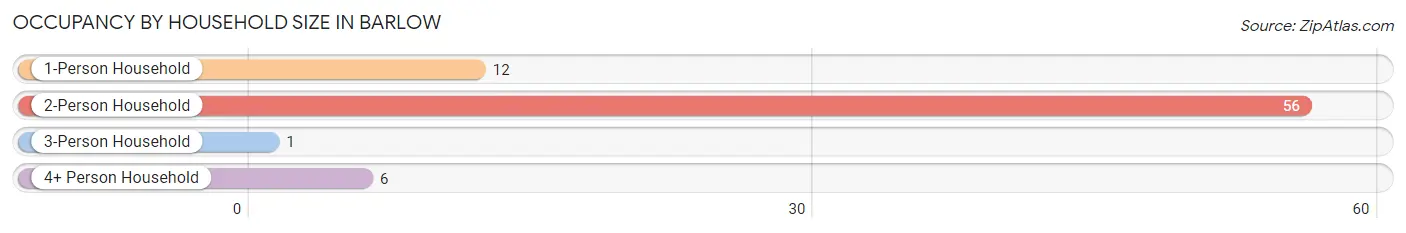
| Household Size | # Housing Units | % Housing Units |
| 1-Person Household | 12 | 16.0% |
| 2-Person Household | 56 | 74.7% |
| 3-Person Household | 1 | 1.3% |
| 4+ Person Household | 6 | 8.0% |
| Total Housing Units | 75 | 100.0% |
Occupancy by Ownership by Household Size in Barlow
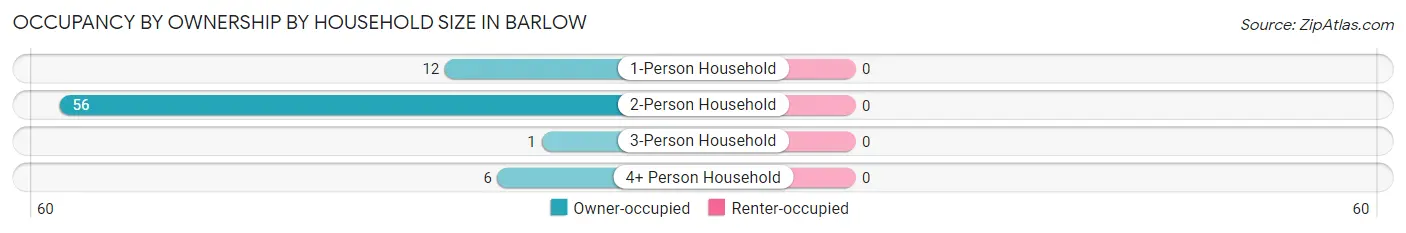
| Household Size | Owner-occupied | Renter-occupied |
| 1-Person Household | 12 (100.0%) | 0 (0.0%) |
| 2-Person Household | 56 (100.0%) | 0 (0.0%) |
| 3-Person Household | 1 (100.0%) | 0 (0.0%) |
| 4+ Person Household | 6 (100.0%) | 0 (0.0%) |
| Total Housing Units | 75 (100.0%) | 0 (0.0%) |
Occupancy by Educational Attainment in Barlow
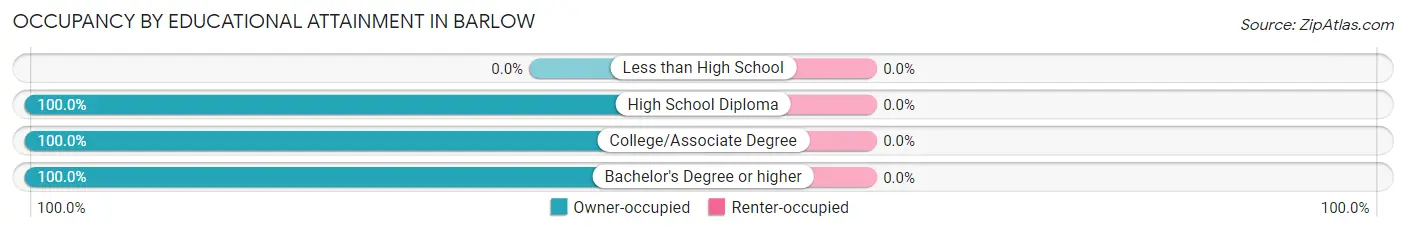
| Household Size | Owner-occupied | Renter-occupied |
| Less than High School | 0 (0.0%) | 0 (0.0%) |
| High School Diploma | 14 (100.0%) | 0 (0.0%) |
| College/Associate Degree | 48 (100.0%) | 0 (0.0%) |
| Bachelor's Degree or higher | 13 (100.0%) | 0 (0.0%) |
Occupancy by Age of Householder in Barlow
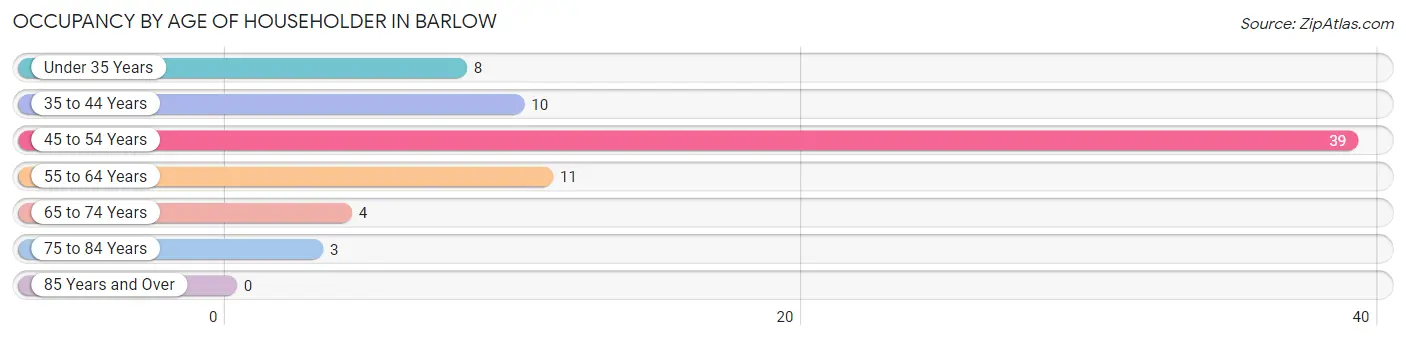
| Age Bracket | # Households | % Households |
| Under 35 Years | 8 | 10.7% |
| 35 to 44 Years | 10 | 13.3% |
| 45 to 54 Years | 39 | 52.0% |
| 55 to 64 Years | 11 | 14.7% |
| 65 to 74 Years | 4 | 5.3% |
| 75 to 84 Years | 3 | 4.0% |
| 85 Years and Over | 0 | 0.0% |
| Total | 75 | 100.0% |
Housing Finances in Barlow
Median Income by Occupancy in Barlow
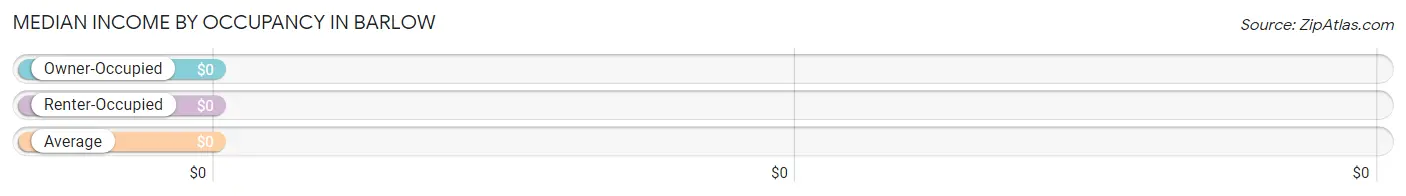
| Occupancy Type | # Households | Median Income |
| Owner-Occupied | 75 (100.0%) | $0 |
| Renter-Occupied | 0 (0.0%) | $0 |
| Average | 75 (100.0%) | $0 |
Occupancy by Householder Income Bracket in Barlow
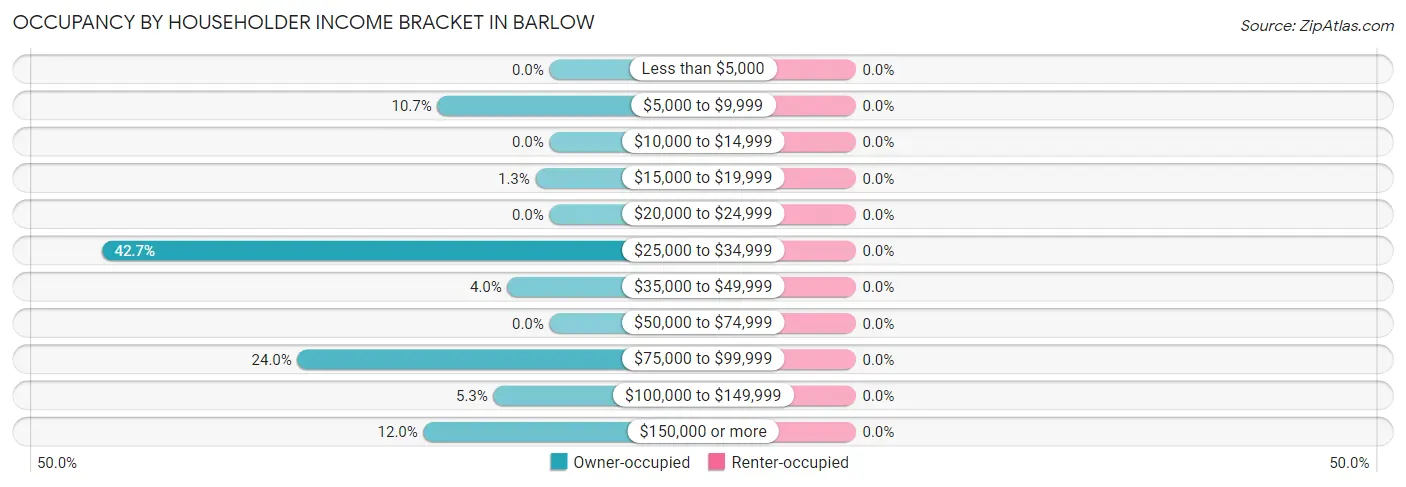
| Income Bracket | Owner-occupied | Renter-occupied |
| Less than $5,000 | 0 (0.0%) | 0 (0.0%) |
| $5,000 to $9,999 | 8 (10.7%) | 0 (0.0%) |
| $10,000 to $14,999 | 0 (0.0%) | 0 (0.0%) |
| $15,000 to $19,999 | 1 (1.3%) | 0 (0.0%) |
| $20,000 to $24,999 | 0 (0.0%) | 0 (0.0%) |
| $25,000 to $34,999 | 32 (42.7%) | 0 (0.0%) |
| $35,000 to $49,999 | 3 (4.0%) | 0 (0.0%) |
| $50,000 to $74,999 | 0 (0.0%) | 0 (0.0%) |
| $75,000 to $99,999 | 18 (24.0%) | 0 (0.0%) |
| $100,000 to $149,999 | 4 (5.3%) | 0 (0.0%) |
| $150,000 or more | 9 (12.0%) | 0 (0.0%) |
| Total | 75 (100.0%) | 0 (0.0%) |
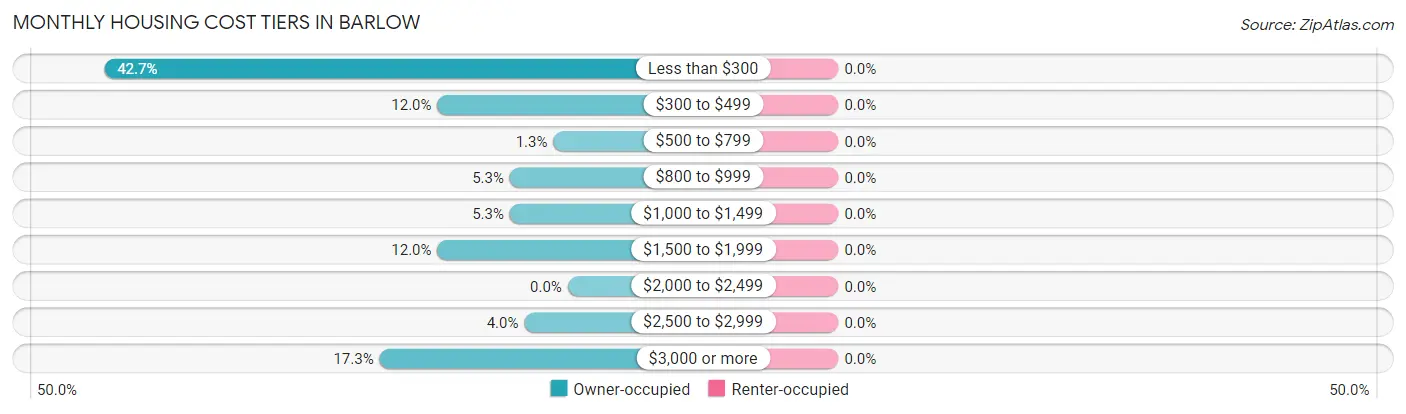
Monthly Housing Cost Tiers in Barlow
| Monthly Cost | Owner-occupied | Renter-occupied |
| Less than $300 | 32 (42.7%) | 0 (0.0%) |
| $300 to $499 | 9 (12.0%) | 0 (0.0%) |
| $500 to $799 | 1 (1.3%) | 0 (0.0%) |
| $800 to $999 | 4 (5.3%) | 0 (0.0%) |
| $1,000 to $1,499 | 4 (5.3%) | 0 (0.0%) |
| $1,500 to $1,999 | 9 (12.0%) | 0 (0.0%) |
| $2,000 to $2,499 | 0 (0.0%) | 0 (0.0%) |
| $2,500 to $2,999 | 3 (4.0%) | 0 (0.0%) |
| $3,000 or more | 13 (17.3%) | 0 (0.0%) |
| Total | 75 (100.0%) | 0 (0.0%) |
Physical Housing Characteristics in Barlow
Housing Structures in Barlow
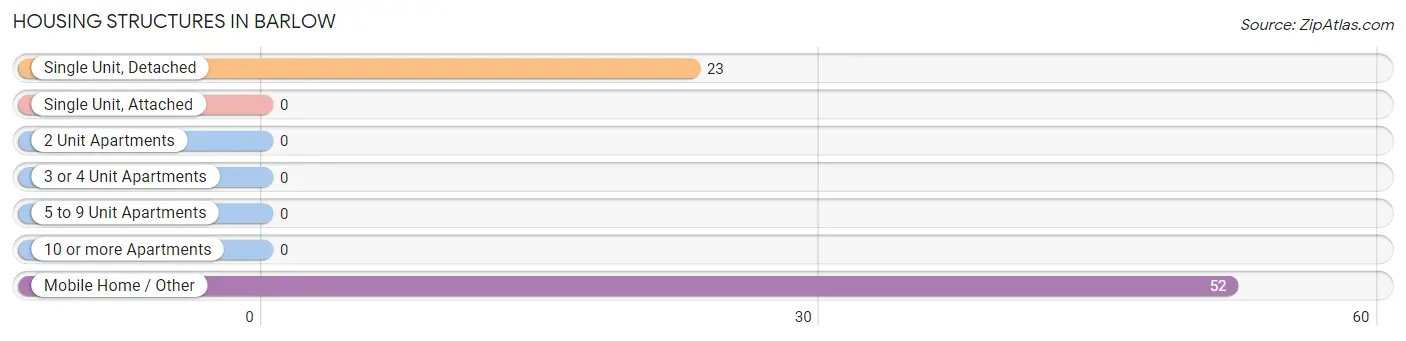
| Structure Type | # Housing Units | % Housing Units |
| Single Unit, Detached | 23 | 30.7% |
| Single Unit, Attached | 0 | 0.0% |
| 2 Unit Apartments | 0 | 0.0% |
| 3 or 4 Unit Apartments | 0 | 0.0% |
| 5 to 9 Unit Apartments | 0 | 0.0% |
| 10 or more Apartments | 0 | 0.0% |
| Mobile Home / Other | 52 | 69.3% |
| Total | 75 | 100.0% |
Housing Structures by Occupancy in Barlow
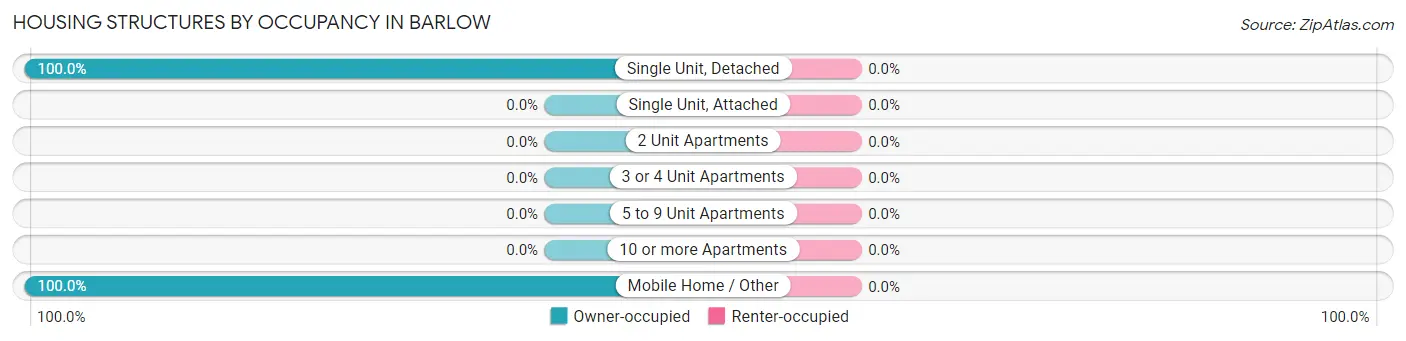
| Structure Type | Owner-occupied | Renter-occupied |
| Single Unit, Detached | 23 (100.0%) | 0 (0.0%) |
| Single Unit, Attached | 0 (0.0%) | 0 (0.0%) |
| 2 Unit Apartments | 0 (0.0%) | 0 (0.0%) |
| 3 or 4 Unit Apartments | 0 (0.0%) | 0 (0.0%) |
| 5 to 9 Unit Apartments | 0 (0.0%) | 0 (0.0%) |
| 10 or more Apartments | 0 (0.0%) | 0 (0.0%) |
| Mobile Home / Other | 52 (100.0%) | 0 (0.0%) |
| Total | 75 (100.0%) | 0 (0.0%) |
Housing Structures by Number of Rooms in Barlow
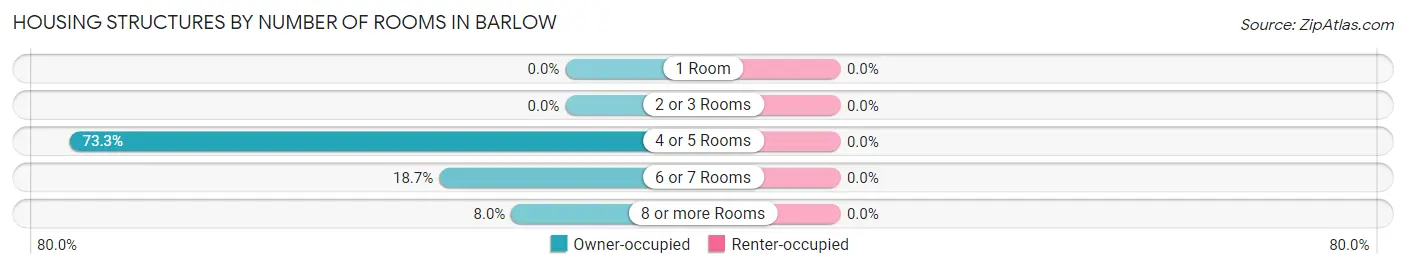
| Number of Rooms | Owner-occupied | Renter-occupied |
| 1 Room | 0 (0.0%) | 0 (0.0%) |
| 2 or 3 Rooms | 0 (0.0%) | 0 (0.0%) |
| 4 or 5 Rooms | 55 (73.3%) | 0 (0.0%) |
| 6 or 7 Rooms | 14 (18.7%) | 0 (0.0%) |
| 8 or more Rooms | 6 (8.0%) | 0 (0.0%) |
| Total | 75 (100.0%) | 0 (0.0%) |
Housing Structure by Heating Type in Barlow
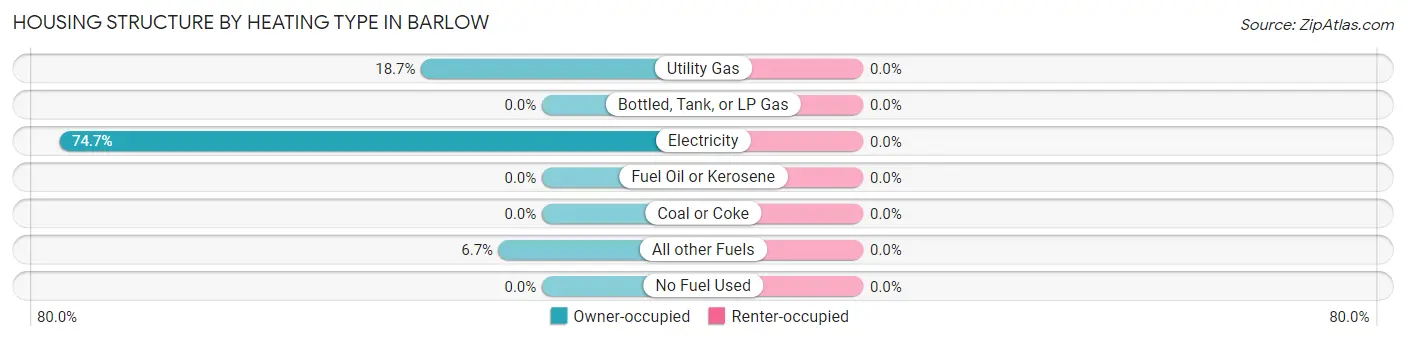
| Heating Type | Owner-occupied | Renter-occupied |
| Utility Gas | 14 (18.7%) | 0 (0.0%) |
| Bottled, Tank, or LP Gas | 0 (0.0%) | 0 (0.0%) |
| Electricity | 56 (74.7%) | 0 (0.0%) |
| Fuel Oil or Kerosene | 0 (0.0%) | 0 (0.0%) |
| Coal or Coke | 0 (0.0%) | 0 (0.0%) |
| All other Fuels | 5 (6.7%) | 0 (0.0%) |
| No Fuel Used | 0 (0.0%) | 0 (0.0%) |
| Total | 75 (100.0%) | 0 (0.0%) |
Household Vehicle Usage in Barlow
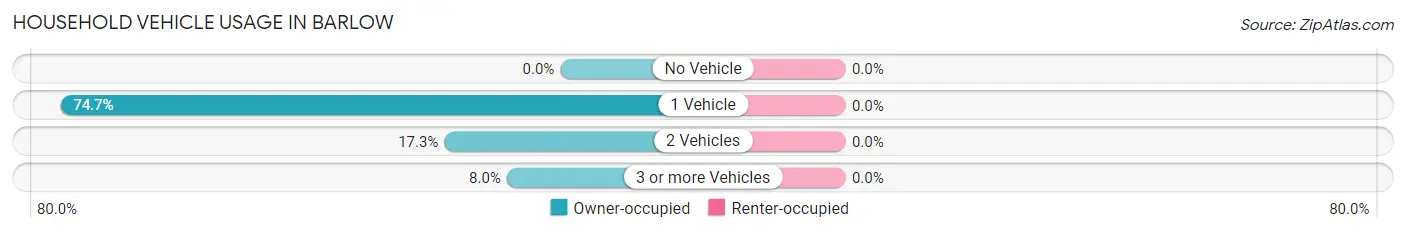
| Vehicles per Household | Owner-occupied | Renter-occupied |
| No Vehicle | 0 (0.0%) | 0 (0.0%) |
| 1 Vehicle | 56 (74.7%) | 0 (0.0%) |
| 2 Vehicles | 13 (17.3%) | 0 (0.0%) |
| 3 or more Vehicles | 6 (8.0%) | 0 (0.0%) |
| Total | 75 (100.0%) | 0 (0.0%) |
Real Estate & Mortgages in Barlow
Real Estate and Mortgage Overview in Barlow
| Characteristic | Without Mortgage | With Mortgage |
| Housing Units | 44 | 31 |
| Median Property Value | $27,800 | $413,600 |
| Median Household Income | $28,594 | $9 |
| Monthly Housing Costs | $234 | $13 |
| Real Estate Taxes | $199 | $0 |
Property Value by Mortgage Status in Barlow
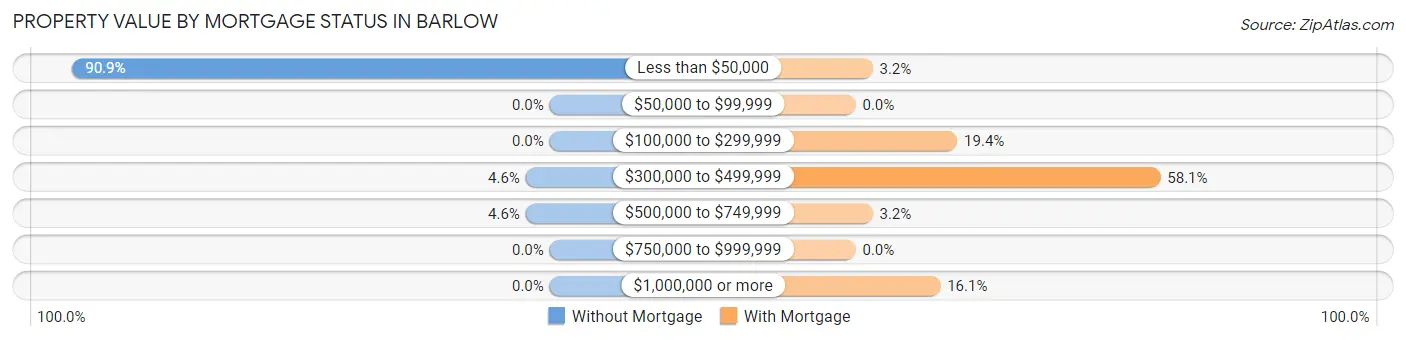
| Property Value | Without Mortgage | With Mortgage |
| Less than $50,000 | 40 (90.9%) | 1 (3.2%) |
| $50,000 to $99,999 | 0 (0.0%) | 0 (0.0%) |
| $100,000 to $299,999 | 0 (0.0%) | 6 (19.4%) |
| $300,000 to $499,999 | 2 (4.5%) | 18 (58.1%) |
| $500,000 to $749,999 | 2 (4.5%) | 1 (3.2%) |
| $750,000 to $999,999 | 0 (0.0%) | 0 (0.0%) |
| $1,000,000 or more | 0 (0.0%) | 5 (16.1%) |
| Total | 44 (100.0%) | 31 (100.0%) |
Household Income by Mortgage Status in Barlow
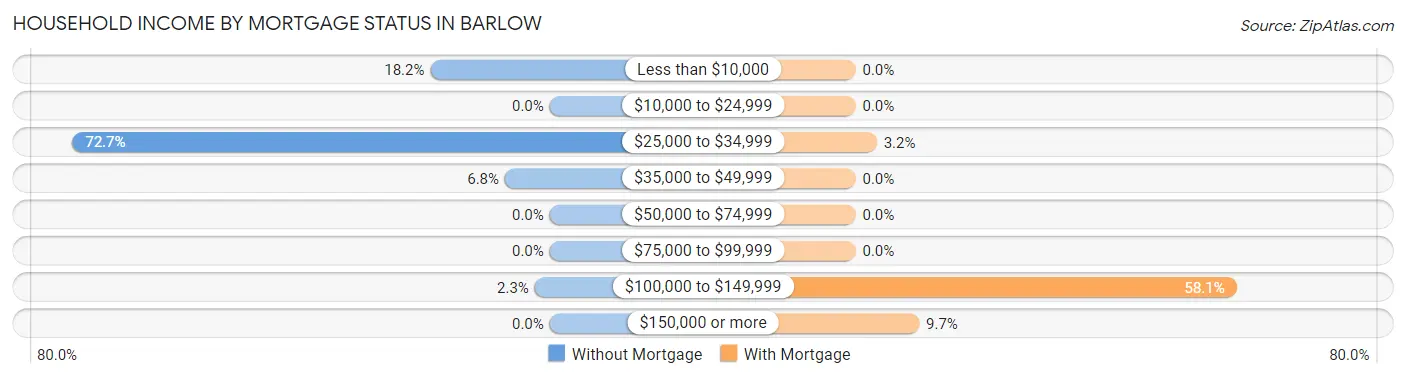
| Household Income | Without Mortgage | With Mortgage |
| Less than $10,000 | 8 (18.2%) | 0 (0.0%) |
| $10,000 to $24,999 | 0 (0.0%) | 0 (0.0%) |
| $25,000 to $34,999 | 32 (72.7%) | 1 (3.2%) |
| $35,000 to $49,999 | 3 (6.8%) | 0 (0.0%) |
| $50,000 to $74,999 | 0 (0.0%) | 0 (0.0%) |
| $75,000 to $99,999 | 0 (0.0%) | 0 (0.0%) |
| $100,000 to $149,999 | 1 (2.3%) | 18 (58.1%) |
| $150,000 or more | 0 (0.0%) | 3 (9.7%) |
| Total | 44 (100.0%) | 31 (100.0%) |
Property Value to Household Income Ratio in Barlow
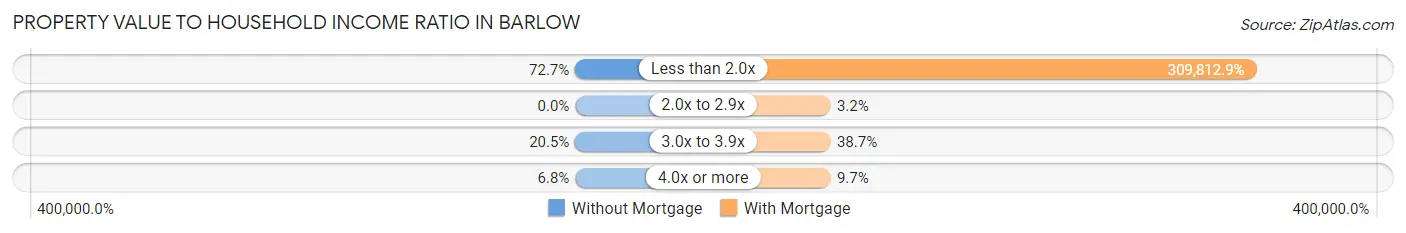
| Value-to-Income Ratio | Without Mortgage | With Mortgage |
| Less than 2.0x | 32 (72.7%) | 96,042 (309,812.9%) |
| 2.0x to 2.9x | 0 (0.0%) | 1 (3.2%) |
| 3.0x to 3.9x | 9 (20.4%) | 12 (38.7%) |
| 4.0x or more | 3 (6.8%) | 3 (9.7%) |
| Total | 44 (100.0%) | 31 (100.0%) |
Real Estate Taxes by Mortgage Status in Barlow
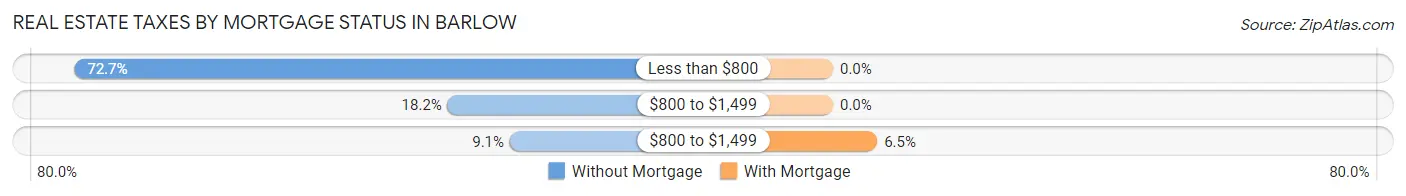
| Property Taxes | Without Mortgage | With Mortgage |
| Less than $800 | 32 (72.7%) | 0 (0.0%) |
| $800 to $1,499 | 8 (18.2%) | 0 (0.0%) |
| $800 to $1,499 | 4 (9.1%) | 2 (6.5%) |
| Total | 44 (100.0%) | 31 (100.0%) |
Health & Disability in Barlow
Health Insurance Coverage by Age in Barlow
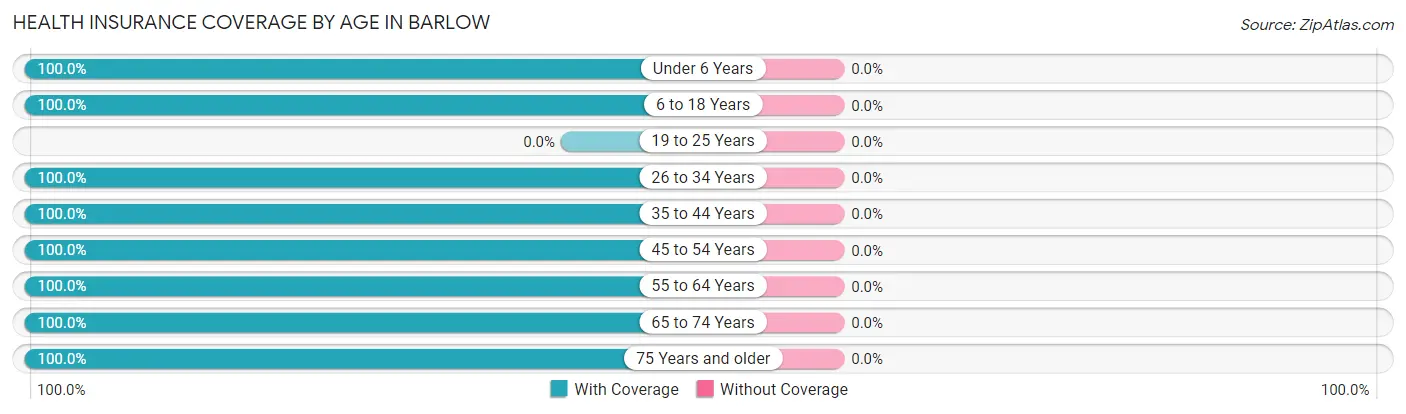
| Age Bracket | With Coverage | Without Coverage |
| Under 6 Years | 5 (100.0%) | 0 (0.0%) |
| 6 to 18 Years | 8 (100.0%) | 0 (0.0%) |
| 19 to 25 Years | 0 (0.0%) | 0 (0.0%) |
| 26 to 34 Years | 12 (100.0%) | 0 (0.0%) |
| 35 to 44 Years | 12 (100.0%) | 0 (0.0%) |
| 45 to 54 Years | 50 (100.0%) | 0 (0.0%) |
| 55 to 64 Years | 58 (100.0%) | 0 (0.0%) |
| 65 to 74 Years | 4 (100.0%) | 0 (0.0%) |
| 75 Years and older | 8 (100.0%) | 0 (0.0%) |
| Total | 157 (100.0%) | 0 (0.0%) |
Health Insurance Coverage by Citizenship Status in Barlow
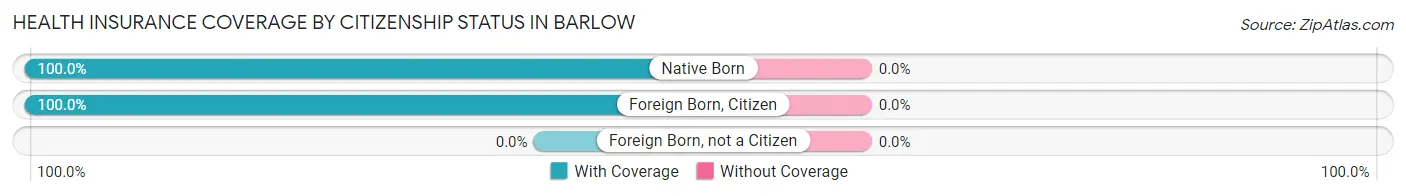
| Citizenship Status | With Coverage | Without Coverage |
| Native Born | 5 (100.0%) | 0 (0.0%) |
| Foreign Born, Citizen | 8 (100.0%) | 0 (0.0%) |
| Foreign Born, not a Citizen | 0 (0.0%) | 0 (0.0%) |
Health Insurance Coverage by Household Income in Barlow
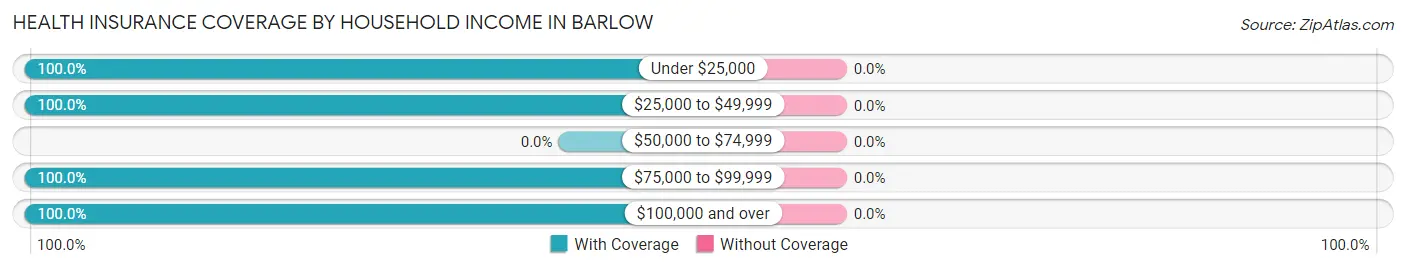
| Household Income | With Coverage | Without Coverage |
| Under $25,000 | 9 (100.0%) | 0 (0.0%) |
| $25,000 to $49,999 | 72 (100.0%) | 0 (0.0%) |
| $50,000 to $74,999 | 0 (0.0%) | 0 (0.0%) |
| $75,000 to $99,999 | 43 (100.0%) | 0 (0.0%) |
| $100,000 and over | 33 (100.0%) | 0 (0.0%) |
Public vs Private Health Insurance Coverage by Age in Barlow
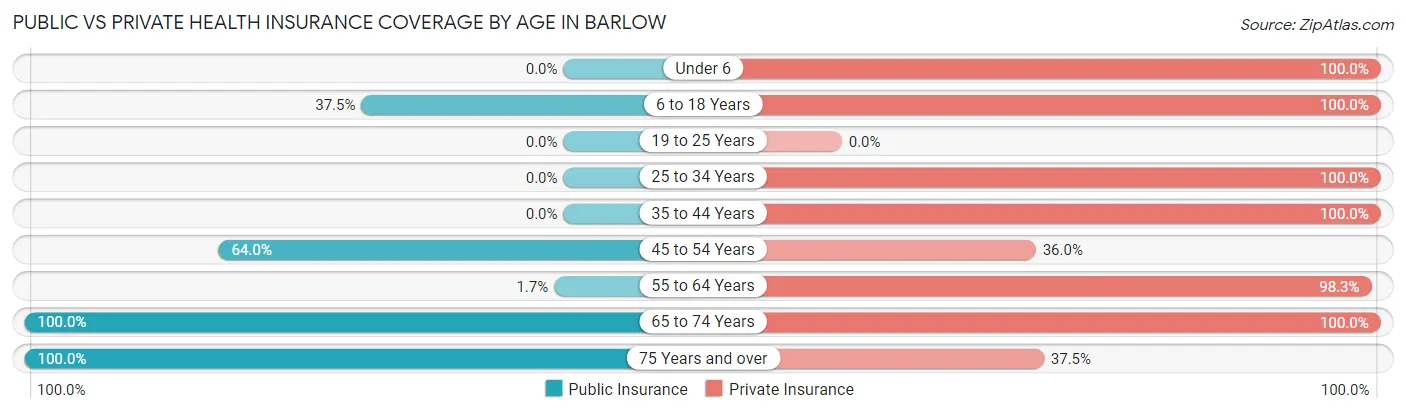
| Age Bracket | Public Insurance | Private Insurance |
| Under 6 | 0 (0.0%) | 5 (100.0%) |
| 6 to 18 Years | 3 (37.5%) | 8 (100.0%) |
| 19 to 25 Years | 0 (0.0%) | 0 (0.0%) |
| 25 to 34 Years | 0 (0.0%) | 12 (100.0%) |
| 35 to 44 Years | 0 (0.0%) | 12 (100.0%) |
| 45 to 54 Years | 32 (64.0%) | 18 (36.0%) |
| 55 to 64 Years | 1 (1.7%) | 57 (98.3%) |
| 65 to 74 Years | 4 (100.0%) | 4 (100.0%) |
| 75 Years and over | 8 (100.0%) | 3 (37.5%) |
| Total | 48 (30.6%) | 119 (75.8%) |
Disability Status by Sex by Age in Barlow
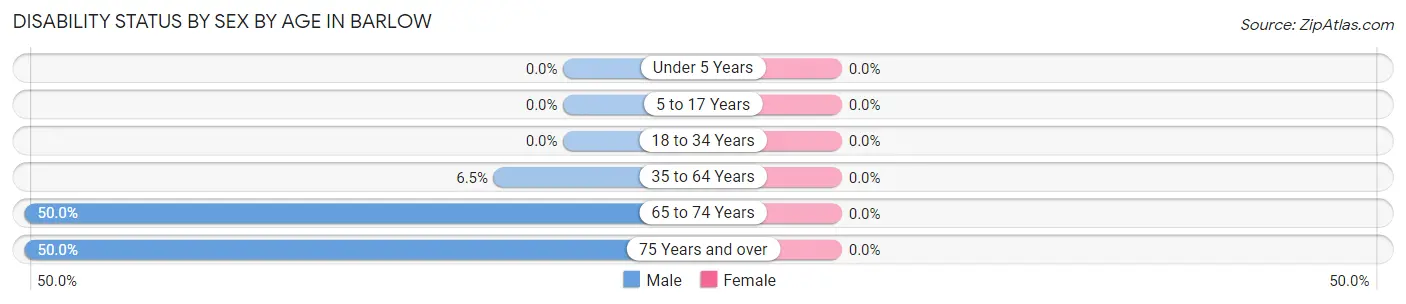
| Age Bracket | Male | Female |
| Under 5 Years | 0 (0.0%) | 0 (0.0%) |
| 5 to 17 Years | 0 (0.0%) | 0 (0.0%) |
| 18 to 34 Years | 0 (0.0%) | 0 (0.0%) |
| 35 to 64 Years | 4 (6.5%) | 0 (0.0%) |
| 65 to 74 Years | 2 (50.0%) | 0 (0.0%) |
| 75 Years and over | 2 (50.0%) | 0 (0.0%) |
Disability Class by Sex by Age in Barlow
Disability Class: Hearing Difficulty
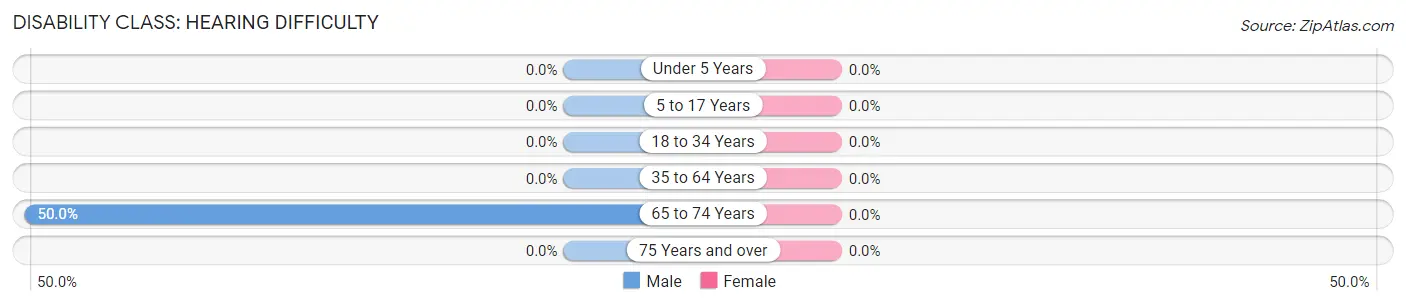
| Age Bracket | Male | Female |
| Under 5 Years | 0 (0.0%) | 0 (0.0%) |
| 5 to 17 Years | 0 (0.0%) | 0 (0.0%) |
| 18 to 34 Years | 0 (0.0%) | 0 (0.0%) |
| 35 to 64 Years | 0 (0.0%) | 0 (0.0%) |
| 65 to 74 Years | 2 (50.0%) | 0 (0.0%) |
| 75 Years and over | 0 (0.0%) | 0 (0.0%) |
Disability Class: Vision Difficulty
| Age Bracket | Male | Female |
| Under 5 Years | 0 (0.0%) | 0 (0.0%) |
| 5 to 17 Years | 0 (0.0%) | 0 (0.0%) |
| 18 to 34 Years | 0 (0.0%) | 0 (0.0%) |
| 35 to 64 Years | 0 (0.0%) | 0 (0.0%) |
| 65 to 74 Years | 0 (0.0%) | 0 (0.0%) |
| 75 Years and over | 0 (0.0%) | 0 (0.0%) |
Disability Class: Cognitive Difficulty
| Age Bracket | Male | Female |
| 5 to 17 Years | 0 (0.0%) | 0 (0.0%) |
| 18 to 34 Years | 0 (0.0%) | 0 (0.0%) |
| 35 to 64 Years | 0 (0.0%) | 0 (0.0%) |
| 65 to 74 Years | 0 (0.0%) | 0 (0.0%) |
| 75 Years and over | 2 (50.0%) | 0 (0.0%) |
Disability Class: Ambulatory Difficulty
| Age Bracket | Male | Female |
| 5 to 17 Years | 0 (0.0%) | 0 (0.0%) |
| 18 to 34 Years | 0 (0.0%) | 0 (0.0%) |
| 35 to 64 Years | 1 (1.6%) | 0 (0.0%) |
| 65 to 74 Years | 0 (0.0%) | 0 (0.0%) |
| 75 Years and over | 0 (0.0%) | 0 (0.0%) |
Disability Class: Self-Care Difficulty
| Age Bracket | Male | Female |
| 5 to 17 Years | 0 (0.0%) | 0 (0.0%) |
| 18 to 34 Years | 0 (0.0%) | 0 (0.0%) |
| 35 to 64 Years | 1 (1.6%) | 0 (0.0%) |
| 65 to 74 Years | 0 (0.0%) | 0 (0.0%) |
| 75 Years and over | 0 (0.0%) | 0 (0.0%) |
Technology Access in Barlow
Computing Device Access in Barlow
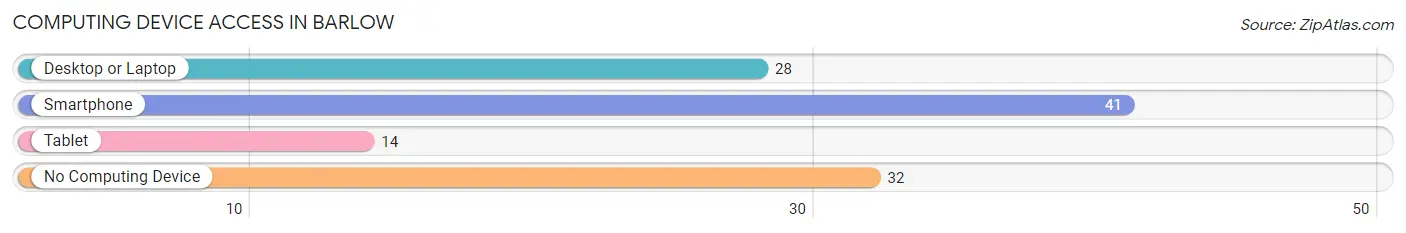
| Device Type | # Households | % Households |
| Desktop or Laptop | 28 | 37.3% |
| Smartphone | 41 | 54.7% |
| Tablet | 14 | 18.7% |
| No Computing Device | 32 | 42.7% |
| Total | 75 | 100.0% |
Internet Access in Barlow
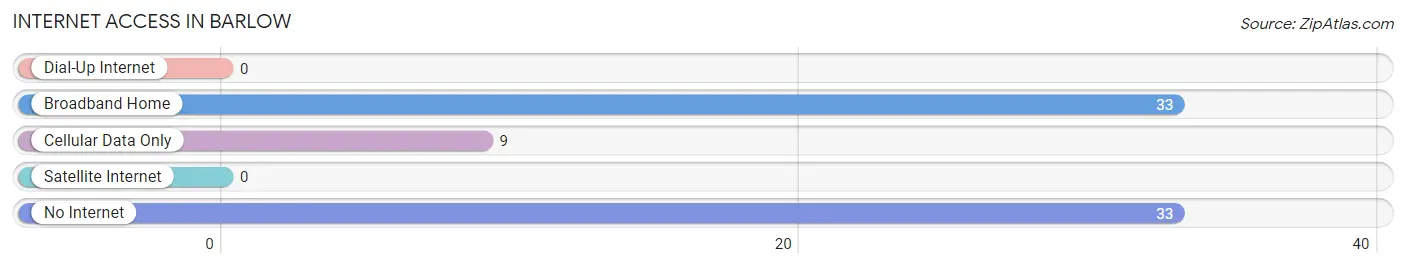
| Internet Type | # Households | % Households |
| Dial-Up Internet | 0 | 0.0% |
| Broadband Home | 33 | 44.0% |
| Cellular Data Only | 9 | 12.0% |
| Satellite Internet | 0 | 0.0% |
| No Internet | 33 | 44.0% |
| Total | 75 | 100.0% |
Barlow Summary
Barlow is a small unincorporated community located in the foothills of the Cascade Mountains in Clackamas County, Oregon. It is situated on the banks of the Clackamas River, about 25 miles southeast of Portland. The community was founded in the late 1800s and has a population of about 1,000 people.
Geography
Barlow is located in the foothills of the Cascade Mountains, at an elevation of about 1,000 feet. The area is characterized by rolling hills, dense forests, and numerous streams and rivers. The Clackamas River runs through the center of the community, providing a source of recreation and transportation. The climate is mild, with temperatures ranging from the mid-30s in the winter to the mid-80s in the summer.
Economy
Barlow’s economy is largely based on agriculture and forestry. The area is home to several small farms, which produce a variety of fruits and vegetables. The forests of the area provide timber for the lumber industry, and the Clackamas River is a popular destination for fishing and boating. The community also has a few small businesses, including a general store, a cafe, and a gas station.
Demographics
As of the 2010 census, the population of Barlow was 1,000 people. The racial makeup of the community was 94.2% White, 0.7% African American, 0.3% Native American, 0.7% Asian, 0.1% Pacific Islander, and 3.9% from other races. The median household income was $45,000, and the median age was 44.
History
Barlow was founded in the late 1800s by settlers from the East Coast. The community was named after a local settler, William Barlow, who was a prominent figure in the area. The area was originally used for logging and farming, and the Clackamas River provided a source of transportation and recreation. In the early 1900s, the community began to grow, and a post office was established in 1910. The area was also home to a number of sawmills, which provided employment for many of the residents.
In the late 20th century, Barlow began to experience a decline in population as many of the residents moved away in search of better economic opportunities. However, the community has seen a resurgence in recent years, as more people have moved to the area in search of a rural lifestyle. Today, Barlow is a small but vibrant community, with a strong sense of community and a commitment to preserving its rural character.
Common Questions
What is the Total Population of Barlow?
Total Population of Barlow is 157.
What is the Total Male Population of Barlow?
Total Male Population of Barlow is 77.
What is the Total Female Population of Barlow?
Total Female Population of Barlow is 80.
What is the Ratio of Males per 100 Females in Barlow?
There are 96.25 Males per 100 Females in Barlow.
What is the Ratio of Females per 100 Males in Barlow?
There are 103.90 Females per 100 Males in Barlow.
What is the Median Population Age in Barlow?
Median Population Age in Barlow is 53.8 Years.
What is the Average Family Size in Barlow
Average Family Size in Barlow is 2.6 People.
What is the Average Household Size in Barlow
Average Household Size in Barlow is 2.1 People.
What is Per Capita Income in Barlow?
Per Capita income in Barlow is $32,336.
What is the Median Family Income in Barlow?
Median Family Income in Barlow is $96,042.
What is Inequality or Gini Index in Barlow?
Inequality or Gini Index in Barlow is 0.44.
How Large is the Labor Force in Barlow?
There are 119 People in the Labor Forcein in Barlow.
What is the Percentage of People in the Labor Force in Barlow?
82.1% of People are in the Labor Force in Barlow.