Keizer, OR
Keizer Map
Keizer Overview
39,122
TOTAL POPULATION
18,006
MALE POPULATION
21,116
FEMALE POPULATION
85.27
MALES / 100 FEMALES
117.27
FEMALES / 100 MALES
35.8
MEDIAN AGE
3.2
AVG FAMILY SIZE
2.7
AVG HOUSEHOLD SIZE
$33,561
PER CAPITA INCOME
$89,069
AVG FAMILY INCOME
$75,753
AVG HOUSEHOLD INCOME
31.2%
WAGE / INCOME GAP [ % ]
68.8¢/ $1
WAGE / INCOME GAP [ $ ]
$9,417
FAMILY INCOME DEFICIT
0.38
INEQUALITY / GINI INDEX
19,441
LABOR FORCE [ PEOPLE ]
63.9%
PERCENT IN LABOR FORCE
4.6%
UNEMPLOYMENT RATE
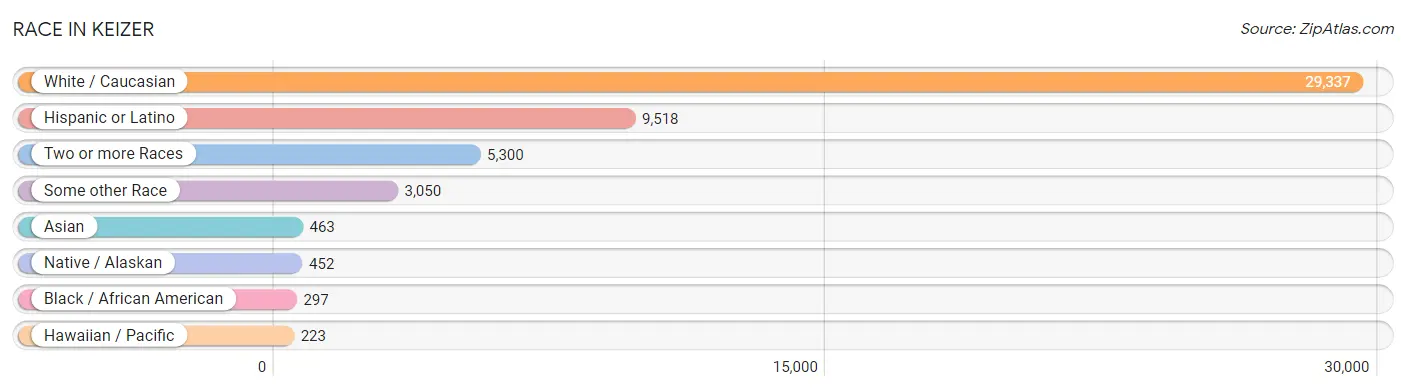
Race in Keizer
The most populous races in Keizer are White / Caucasian (29,337 | 75.0%), Hispanic or Latino (9,518 | 24.3%), and Two or more Races (5,300 | 13.6%).
| Race | # Population | % Population |
| Asian | 463 | 1.2% |
| Black / African American | 297 | 0.8% |
| Hawaiian / Pacific | 223 | 0.6% |
| Hispanic or Latino | 9,518 | 24.3% |
| Native / Alaskan | 452 | 1.2% |
| White / Caucasian | 29,337 | 75.0% |
| Two or more Races | 5,300 | 13.6% |
| Some other Race | 3,050 | 7.8% |
| Total | 39,122 | 100.0% |
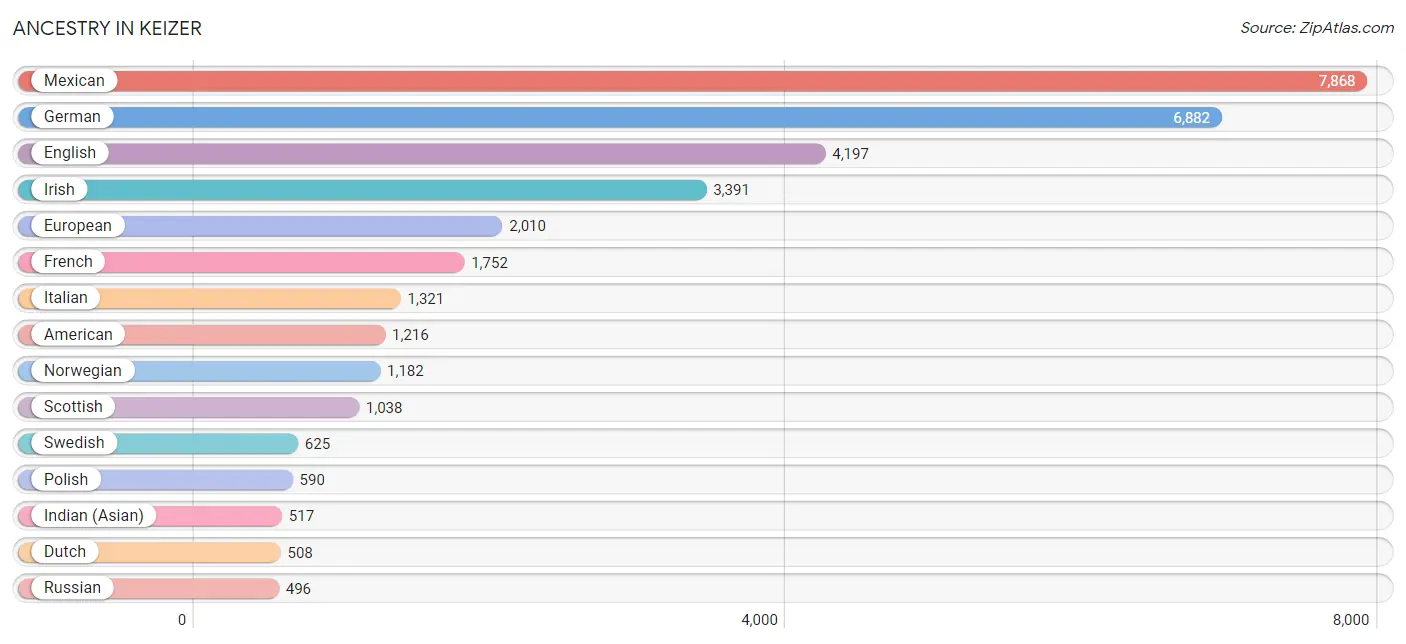
Ancestry in Keizer
The most populous ancestries reported in Keizer are Mexican (7,868 | 20.1%), German (6,882 | 17.6%), English (4,197 | 10.7%), Irish (3,391 | 8.7%), and European (2,010 | 5.1%), together accounting for 62.2% of all Keizer residents.
| Ancestry | # Population | % Population |
| African | 181 | 0.5% |
| Aleut | 3 | 0.0% |
| American | 1,216 | 3.1% |
| Arab | 104 | 0.3% |
| Armenian | 36 | 0.1% |
| Australian | 13 | 0.0% |
| Austrian | 11 | 0.0% |
| Bangladeshi | 76 | 0.2% |
| Basque | 53 | 0.1% |
| Belgian | 53 | 0.1% |
| Bhutanese | 117 | 0.3% |
| Blackfeet | 23 | 0.1% |
| Brazilian | 6 | 0.0% |
| British | 280 | 0.7% |
| Burmese | 40 | 0.1% |
| Canadian | 295 | 0.7% |
| Central American | 350 | 0.9% |
| Central American Indian | 126 | 0.3% |
| Cherokee | 437 | 1.1% |
| Chickasaw | 15 | 0.0% |
| Chinese | 18 | 0.1% |
| Choctaw | 71 | 0.2% |
| Colombian | 84 | 0.2% |
| Comanche | 54 | 0.1% |
| Croatian | 180 | 0.5% |
| Cuban | 17 | 0.0% |
| Czech | 173 | 0.4% |
| Czechoslovakian | 128 | 0.3% |
| Danish | 161 | 0.4% |
| Dominican | 8 | 0.0% |
| Dutch | 508 | 1.3% |
| Eastern European | 148 | 0.4% |
| English | 4,197 | 10.7% |
| European | 2,010 | 5.1% |
| Fijian | 172 | 0.4% |
| Finnish | 64 | 0.2% |
| French | 1,752 | 4.5% |
| French American Indian | 1 | 0.0% |
| French Canadian | 351 | 0.9% |
| German | 6,882 | 17.6% |
| Greek | 128 | 0.3% |
| Guamanian / Chamorro | 112 | 0.3% |
| Guatemalan | 116 | 0.3% |
| Honduran | 10 | 0.0% |
| Hungarian | 97 | 0.3% |
| Icelander | 19 | 0.1% |
| Indian (Asian) | 517 | 1.3% |
| Inupiat | 1 | 0.0% |
| Irish | 3,391 | 8.7% |
| Italian | 1,321 | 3.4% |
| Jamaican | 10 | 0.0% |
| Japanese | 36 | 0.1% |
| Korean | 428 | 1.1% |
| Latvian | 14 | 0.0% |
| Lithuanian | 59 | 0.2% |
| Mexican | 7,868 | 20.1% |
| Mexican American Indian | 238 | 0.6% |
| Native Hawaiian | 195 | 0.5% |
| Northern European | 84 | 0.2% |
| Norwegian | 1,182 | 3.0% |
| Paiute | 25 | 0.1% |
| Peruvian | 10 | 0.0% |
| Polish | 590 | 1.5% |
| Portuguese | 65 | 0.2% |
| Puerto Rican | 45 | 0.1% |
| Romanian | 26 | 0.1% |
| Russian | 496 | 1.3% |
| Salvadoran | 224 | 0.6% |
| Samoan | 19 | 0.1% |
| Scandinavian | 419 | 1.1% |
| Scotch-Irish | 327 | 0.8% |
| Scottish | 1,038 | 2.6% |
| Sioux | 4 | 0.0% |
| Slovak | 27 | 0.1% |
| South American | 94 | 0.2% |
| Spaniard | 62 | 0.2% |
| Spanish | 433 | 1.1% |
| Spanish American | 19 | 0.1% |
| Subsaharan African | 181 | 0.5% |
| Swedish | 625 | 1.6% |
| Swiss | 260 | 0.7% |
| Thai | 11 | 0.0% |
| Tsimshian | 40 | 0.1% |
| Ukrainian | 119 | 0.3% |
| Ute | 67 | 0.2% |
| Welsh | 300 | 0.8% |
| Yakama | 16 | 0.0% | View All 87 Rows |
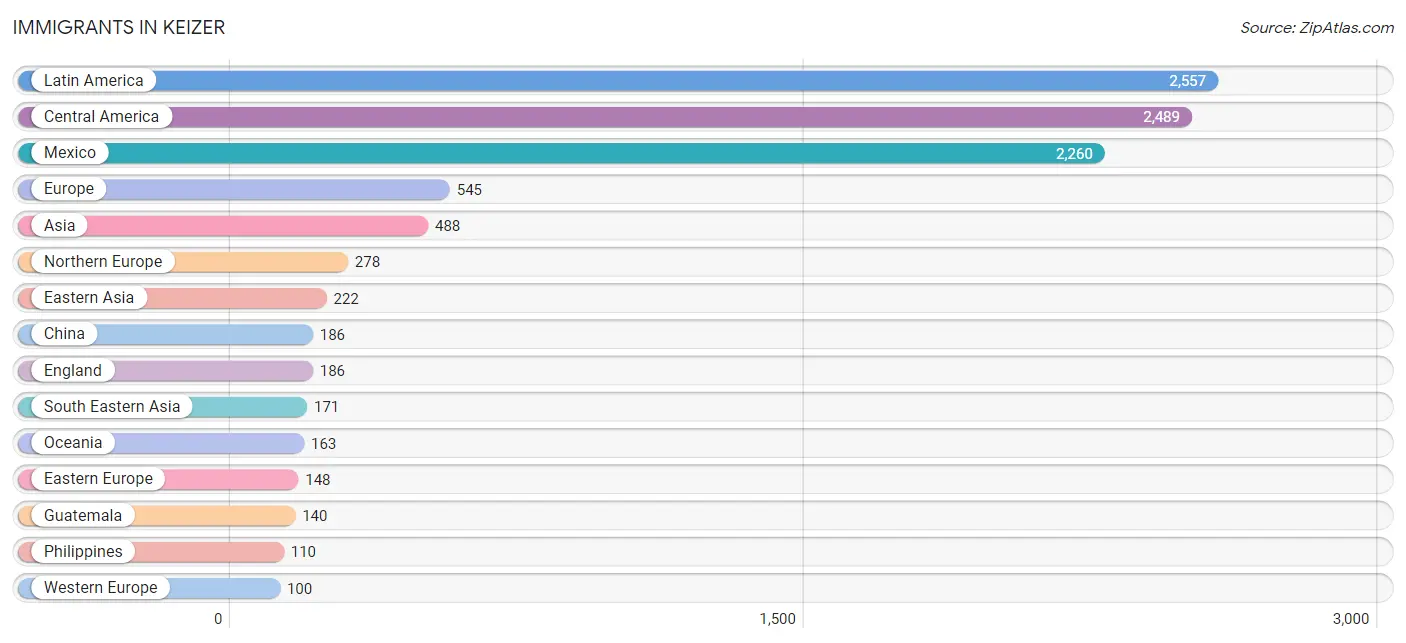
Immigrants in Keizer
The most numerous immigrant groups reported in Keizer came from Latin America (2,557 | 6.5%), Central America (2,489 | 6.4%), Mexico (2,260 | 5.8%), Europe (545 | 1.4%), and Asia (488 | 1.3%), together accounting for 21.3% of all Keizer residents.
| Immigration Origin | # Population | % Population |
| Africa | 98 | 0.3% |
| Asia | 488 | 1.3% |
| Australia | 26 | 0.1% |
| Belarus | 16 | 0.0% |
| Brazil | 14 | 0.0% |
| Cambodia | 13 | 0.0% |
| Canada | 41 | 0.1% |
| Caribbean | 10 | 0.0% |
| Central America | 2,489 | 6.4% |
| China | 186 | 0.5% |
| Eastern Asia | 222 | 0.6% |
| Eastern Europe | 148 | 0.4% |
| El Salvador | 89 | 0.2% |
| England | 186 | 0.5% |
| Europe | 545 | 1.4% |
| France | 70 | 0.2% |
| Germany | 5 | 0.0% |
| Guatemala | 140 | 0.4% |
| Hungary | 13 | 0.0% |
| Italy | 19 | 0.1% |
| Jamaica | 10 | 0.0% |
| Japan | 17 | 0.0% |
| Korea | 19 | 0.1% |
| Laos | 48 | 0.1% |
| Latin America | 2,557 | 6.5% |
| Mexico | 2,260 | 5.8% |
| Micronesia | 12 | 0.0% |
| Middle Africa | 98 | 0.3% |
| Netherlands | 25 | 0.1% |
| Northern Europe | 278 | 0.7% |
| Norway | 26 | 0.1% |
| Oceania | 163 | 0.4% |
| Peru | 44 | 0.1% |
| Philippines | 110 | 0.3% |
| Russia | 35 | 0.1% |
| Scotland | 41 | 0.1% |
| South America | 58 | 0.2% |
| South Eastern Asia | 171 | 0.4% |
| Southern Europe | 19 | 0.1% |
| Syria | 76 | 0.2% |
| Taiwan | 20 | 0.1% |
| Ukraine | 84 | 0.2% |
| Western Asia | 76 | 0.2% |
| Western Europe | 100 | 0.3% | View All 44 Rows |
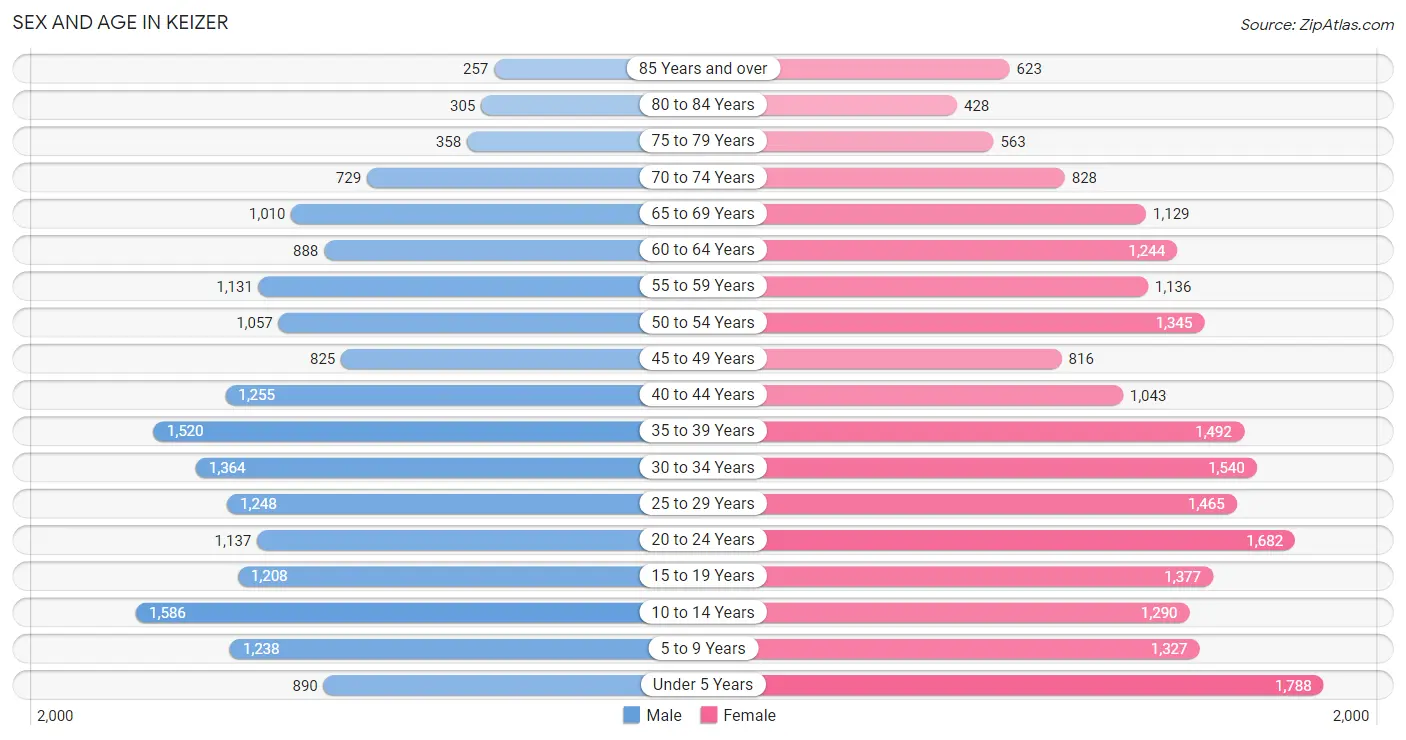
Sex and Age in Keizer
Sex and Age in Keizer
The most populous age groups in Keizer are 10 to 14 Years (1,586 | 8.8%) for men and Under 5 Years (1,788 | 8.5%) for women.
| Age Bracket | Male | Female |
| Under 5 Years | 890 (4.9%) | 1,788 (8.5%) |
| 5 to 9 Years | 1,238 (6.9%) | 1,327 (6.3%) |
| 10 to 14 Years | 1,586 (8.8%) | 1,290 (6.1%) |
| 15 to 19 Years | 1,208 (6.7%) | 1,377 (6.5%) |
| 20 to 24 Years | 1,137 (6.3%) | 1,682 (8.0%) |
| 25 to 29 Years | 1,248 (6.9%) | 1,465 (6.9%) |
| 30 to 34 Years | 1,364 (7.6%) | 1,540 (7.3%) |
| 35 to 39 Years | 1,520 (8.4%) | 1,492 (7.1%) |
| 40 to 44 Years | 1,255 (7.0%) | 1,043 (4.9%) |
| 45 to 49 Years | 825 (4.6%) | 816 (3.9%) |
| 50 to 54 Years | 1,057 (5.9%) | 1,345 (6.4%) |
| 55 to 59 Years | 1,131 (6.3%) | 1,136 (5.4%) |
| 60 to 64 Years | 888 (4.9%) | 1,244 (5.9%) |
| 65 to 69 Years | 1,010 (5.6%) | 1,129 (5.3%) |
| 70 to 74 Years | 729 (4.1%) | 828 (3.9%) |
| 75 to 79 Years | 358 (2.0%) | 563 (2.7%) |
| 80 to 84 Years | 305 (1.7%) | 428 (2.0%) |
| 85 Years and over | 257 (1.4%) | 623 (2.9%) |
| Total | 18,006 (100.0%) | 21,116 (100.0%) |
Families and Households in Keizer
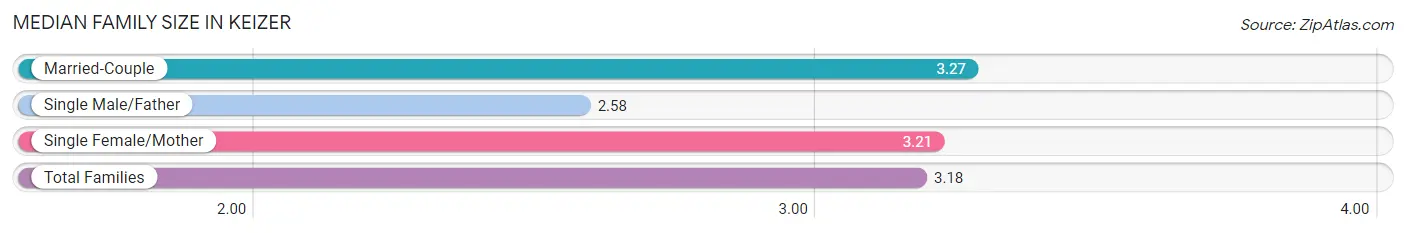
Median Family Size in Keizer
The median family size in Keizer is 3.18 persons per family, with married-couple families (6,759 | 68.8%) accounting for the largest median family size of 3.27 persons per family. On the other hand, single male/father families (1,019 | 10.4%) represent the smallest median family size with 2.58 persons per family.
| Family Type | # Families | Family Size |
| Married-Couple | 6,759 (68.8%) | 3.27 |
| Single Male/Father | 1,019 (10.4%) | 2.58 |
| Single Female/Mother | 2,045 (20.8%) | 3.21 |
| Total Families | 9,823 (100.0%) | 3.18 |
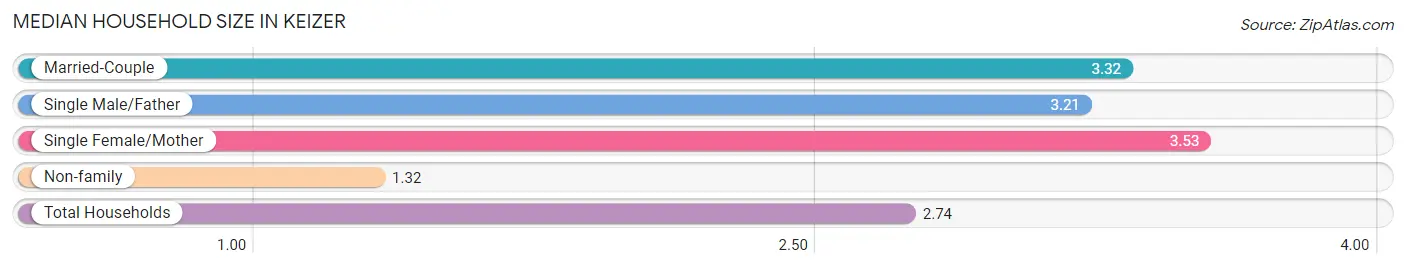
Median Household Size in Keizer
The median household size in Keizer is 2.74 persons per household, with single female/mother households (2,045 | 14.5%) accounting for the largest median household size of 3.53 persons per household. non-family households (4,302 | 30.5%) represent the smallest median household size with 1.32 persons per household.
| Household Type | # Households | Household Size |
| Married-Couple | 6,759 (47.8%) | 3.32 |
| Single Male/Father | 1,019 (7.2%) | 3.21 |
| Single Female/Mother | 2,045 (14.5%) | 3.53 |
| Non-family | 4,302 (30.5%) | 1.32 |
| Total Households | 14,125 (100.0%) | 2.74 |
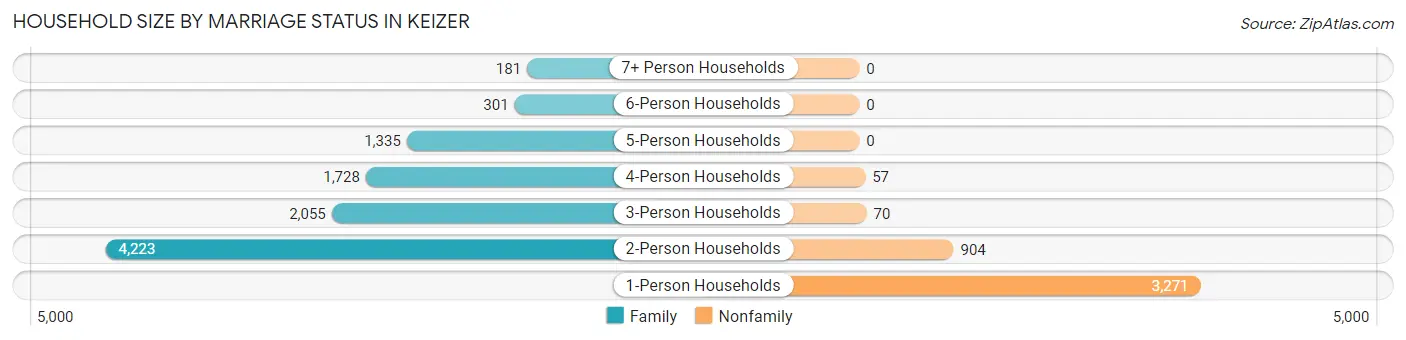
Household Size by Marriage Status in Keizer
Out of a total of 14,125 households in Keizer, 9,823 (69.5%) are family households, while 4,302 (30.5%) are nonfamily households. The most numerous type of family households are 2-person households, comprising 4,223, and the most common type of nonfamily households are 1-person households, comprising 3,271.
| Household Size | Family Households | Nonfamily Households |
| 1-Person Households | - | 3,271 (23.2%) |
| 2-Person Households | 4,223 (29.9%) | 904 (6.4%) |
| 3-Person Households | 2,055 (14.5%) | 70 (0.5%) |
| 4-Person Households | 1,728 (12.2%) | 57 (0.4%) |
| 5-Person Households | 1,335 (9.5%) | 0 (0.0%) |
| 6-Person Households | 301 (2.1%) | 0 (0.0%) |
| 7+ Person Households | 181 (1.3%) | 0 (0.0%) |
| Total | 9,823 (69.5%) | 4,302 (30.5%) |
Female Fertility in Keizer
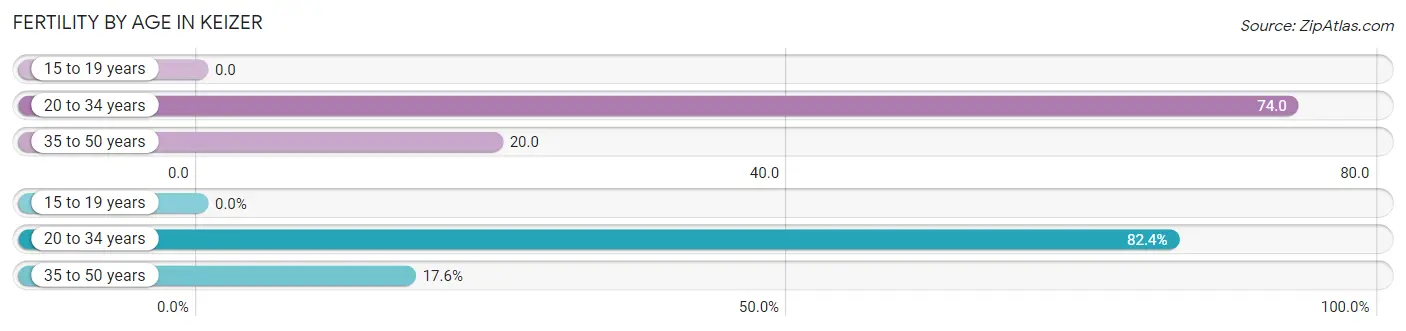
Fertility by Age in Keizer
Average fertility rate in Keizer is 43.0 births per 1,000 women. Women in the age bracket of 20 to 34 years have the highest fertility rate with 74.0 births per 1,000 women. Women in the age bracket of 20 to 34 years acount for 82.4% of all women with births.
| Age Bracket | Women with Births | Births / 1,000 Women |
| 15 to 19 years | 0 (0.0%) | 0.0 |
| 20 to 34 years | 346 (82.4%) | 74.0 |
| 35 to 50 years | 74 (17.6%) | 20.0 |
| Total | 420 (100.0%) | 43.0 |
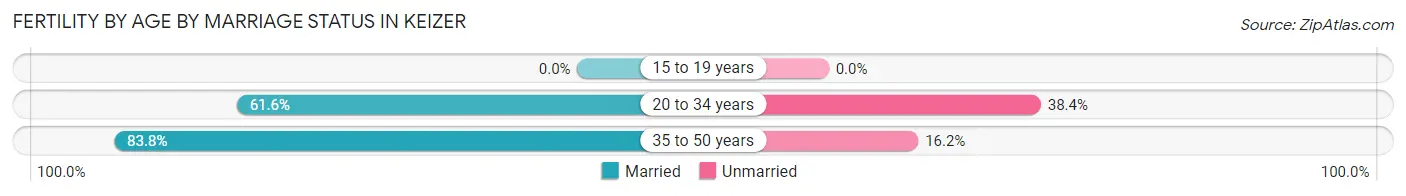
Fertility by Age by Marriage Status in Keizer
65.5% of women with births (420) in Keizer are married. The highest percentage of unmarried women with births falls into 20 to 34 years age bracket with 38.4% of them unmarried at the time of birth, while the lowest percentage of unmarried women with births belong to 35 to 50 years age bracket with 16.2% of them unmarried.
| Age Bracket | Married | Unmarried |
| 15 to 19 years | 0 (0.0%) | 0 (0.0%) |
| 20 to 34 years | 213 (61.6%) | 133 (38.4%) |
| 35 to 50 years | 62 (83.8%) | 12 (16.2%) |
| Total | 275 (65.5%) | 145 (34.5%) |
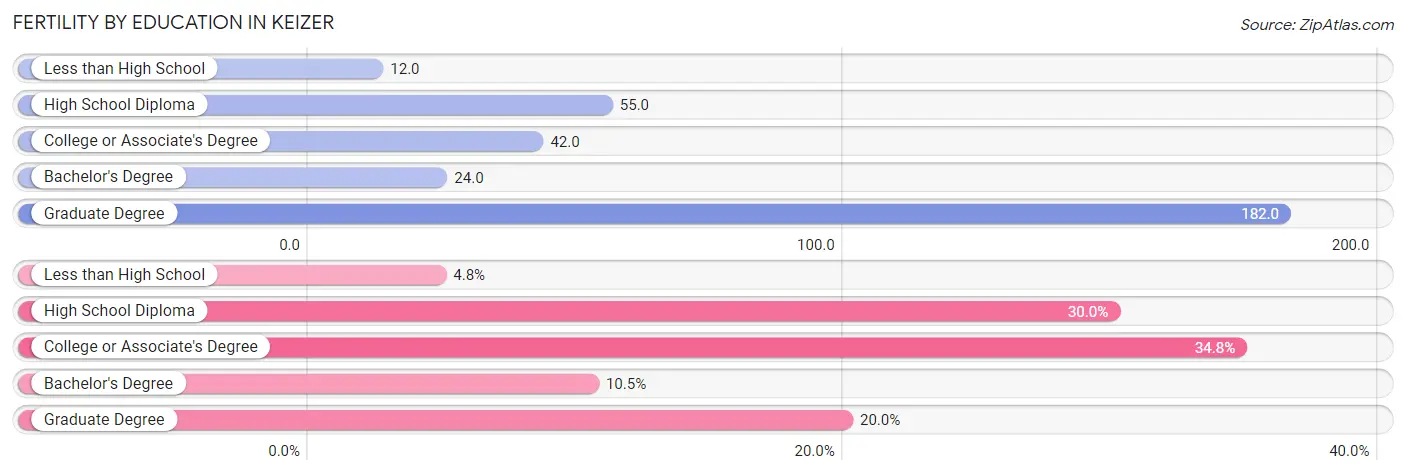
Fertility by Education in Keizer
Average fertility rate in Keizer is 43.0 births per 1,000 women. Women with the education attainment of graduate degree have the highest fertility rate of 182.0 births per 1,000 women, while women with the education attainment of less than high school have the lowest fertility at 12.0 births per 1,000 women. Women with the education attainment of college or associate's degree represent 34.8% of all women with births.
| Educational Attainment | Women with Births | Births / 1,000 Women |
| Less than High School | 20 (4.8%) | 12.0 |
| High School Diploma | 126 (30.0%) | 55.0 |
| College or Associate's Degree | 146 (34.8%) | 42.0 |
| Bachelor's Degree | 44 (10.5%) | 24.0 |
| Graduate Degree | 84 (20.0%) | 182.0 |
| Total | 420 (100.0%) | 43.0 |
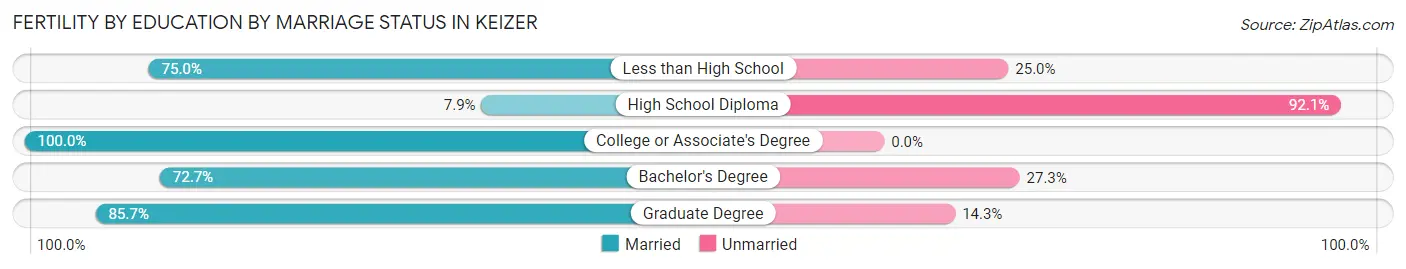
Fertility by Education by Marriage Status in Keizer
34.5% of women with births in Keizer are unmarried. Women with the educational attainment of college or associate's degree are most likely to be married with 100.0% of them married at childbirth, while women with the educational attainment of high school diploma are least likely to be married with 92.1% of them unmarried at childbirth.
| Educational Attainment | Married | Unmarried |
| Less than High School | 15 (75.0%) | 5 (25.0%) |
| High School Diploma | 10 (7.9%) | 116 (92.1%) |
| College or Associate's Degree | 146 (100.0%) | 0 (0.0%) |
| Bachelor's Degree | 32 (72.7%) | 12 (27.3%) |
| Graduate Degree | 72 (85.7%) | 12 (14.3%) |
| Total | 275 (65.5%) | 145 (34.5%) |
Income in Keizer
Income Overview in Keizer
Per Capita Income in Keizer is $33,561, while median incomes of families and households are $89,069 and $75,753 respectively.
| Characteristic | Number | Measure |
| Per Capita Income | 39,122 | $33,561 |
| Median Family Income | 9,823 | $89,069 |
| Mean Family Income | 9,823 | $101,002 |
| Median Household Income | 14,125 | $75,753 |
| Mean Household Income | 14,125 | $90,903 |
| Income Deficit | 9,823 | $9,417 |
| Wage / Income Gap (%) | 39,122 | 31.21% |
| Wage / Income Gap ($) | 39,122 | 68.79¢ per $1 |
| Gini / Inequality Index | 39,122 | 0.38 |
Earnings by Sex in Keizer
Average Earnings in Keizer are $41,144, $49,891 for men and $34,321 for women, a difference of 31.2%.
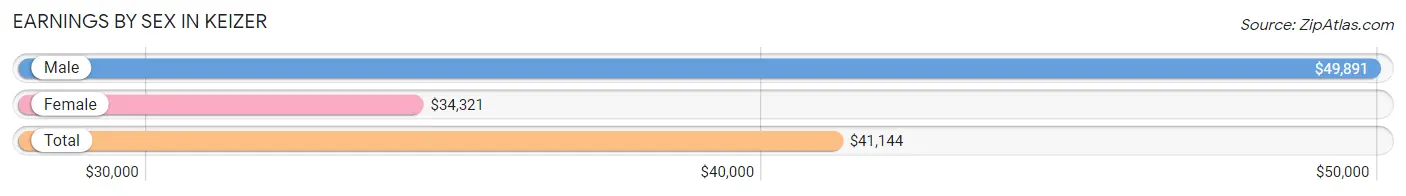
| Sex | Number | Average Earnings |
| Male | 10,124 (50.7%) | $49,891 |
| Female | 9,846 (49.3%) | $34,321 |
| Total | 19,970 (100.0%) | $41,144 |
Earnings by Sex by Income Bracket in Keizer
The most common earnings brackets in Keizer are $100,000+ for men (1,538 | 15.2%) and $25,000 to $29,999 for women (850 | 8.6%).
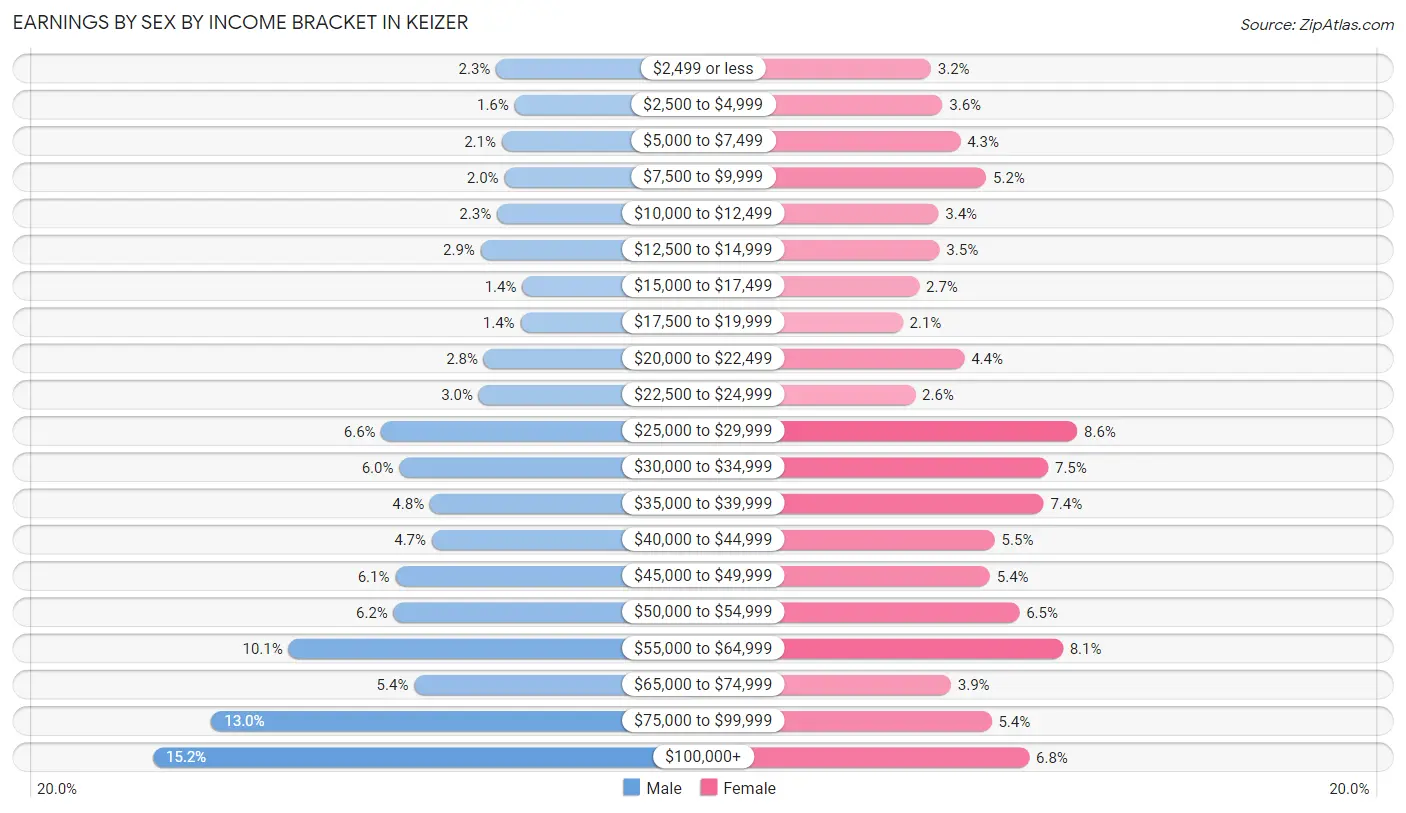
| Income | Male | Female |
| $2,499 or less | 236 (2.3%) | 310 (3.2%) |
| $2,500 to $4,999 | 166 (1.6%) | 352 (3.6%) |
| $5,000 to $7,499 | 215 (2.1%) | 418 (4.3%) |
| $7,500 to $9,999 | 204 (2.0%) | 514 (5.2%) |
| $10,000 to $12,499 | 233 (2.3%) | 338 (3.4%) |
| $12,500 to $14,999 | 295 (2.9%) | 342 (3.5%) |
| $15,000 to $17,499 | 137 (1.3%) | 267 (2.7%) |
| $17,500 to $19,999 | 144 (1.4%) | 206 (2.1%) |
| $20,000 to $22,499 | 282 (2.8%) | 433 (4.4%) |
| $22,500 to $24,999 | 302 (3.0%) | 252 (2.6%) |
| $25,000 to $29,999 | 671 (6.6%) | 850 (8.6%) |
| $30,000 to $34,999 | 603 (6.0%) | 742 (7.5%) |
| $35,000 to $39,999 | 487 (4.8%) | 726 (7.4%) |
| $40,000 to $44,999 | 480 (4.7%) | 545 (5.5%) |
| $45,000 to $49,999 | 619 (6.1%) | 528 (5.4%) |
| $50,000 to $54,999 | 625 (6.2%) | 636 (6.5%) |
| $55,000 to $64,999 | 1,024 (10.1%) | 797 (8.1%) |
| $65,000 to $74,999 | 547 (5.4%) | 384 (3.9%) |
| $75,000 to $99,999 | 1,316 (13.0%) | 534 (5.4%) |
| $100,000+ | 1,538 (15.2%) | 672 (6.8%) |
| Total | 10,124 (100.0%) | 9,846 (100.0%) |
Earnings by Sex by Educational Attainment in Keizer
Average earnings in Keizer are $54,481 for men and $40,164 for women, a difference of 26.3%. Men with an educational attainment of bachelor's degree enjoy the highest average annual earnings of $91,270, while those with less than high school education earn the least with $38,047. Women with an educational attainment of graduate degree earn the most with the average annual earnings of $68,897, while those with less than high school education have the smallest earnings of $16,629.
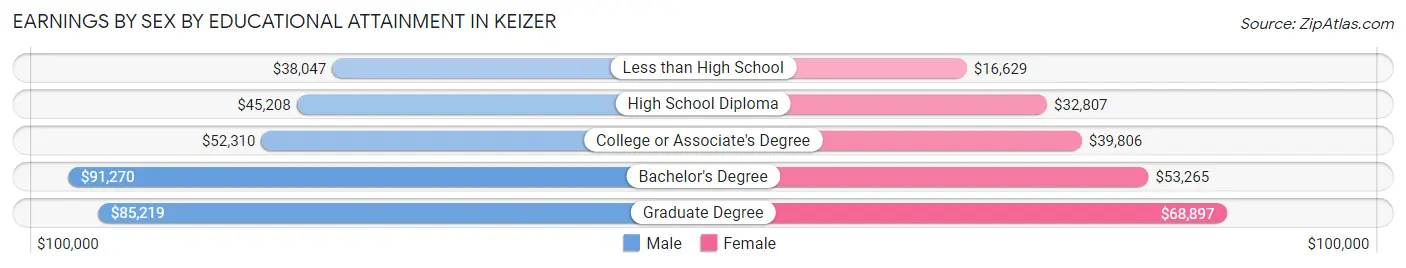
| Educational Attainment | Male Income | Female Income |
| Less than High School | $38,047 | $16,629 |
| High School Diploma | $45,208 | $32,807 |
| College or Associate's Degree | $52,310 | $39,806 |
| Bachelor's Degree | $91,270 | $53,265 |
| Graduate Degree | $85,219 | $68,897 |
| Total | $54,481 | $40,164 |
Family Income in Keizer
Family Income Brackets in Keizer
According to the Keizer family income data, there are 2,456 families falling into the $100,000 to $149,999 income range, which is the most common income bracket and makes up 25.0% of all families. Conversely, the $10,000 to $14,999 income bracket is the least frequent group with only 177 families (1.8%) belonging to this category.
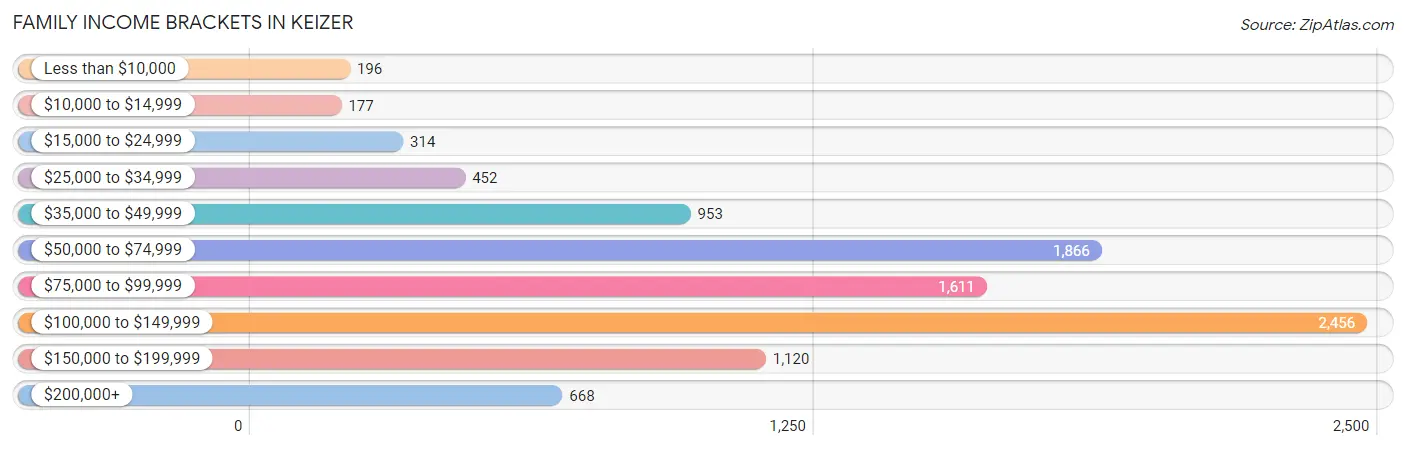
| Income Bracket | # Families | % Families |
| Less than $10,000 | 196 | 2.0% |
| $10,000 to $14,999 | 177 | 1.8% |
| $15,000 to $24,999 | 314 | 3.2% |
| $25,000 to $34,999 | 452 | 4.6% |
| $35,000 to $49,999 | 953 | 9.7% |
| $50,000 to $74,999 | 1,866 | 19.0% |
| $75,000 to $99,999 | 1,611 | 16.4% |
| $100,000 to $149,999 | 2,456 | 25.0% |
| $150,000 to $199,999 | 1,120 | 11.4% |
| $200,000+ | 668 | 6.8% |
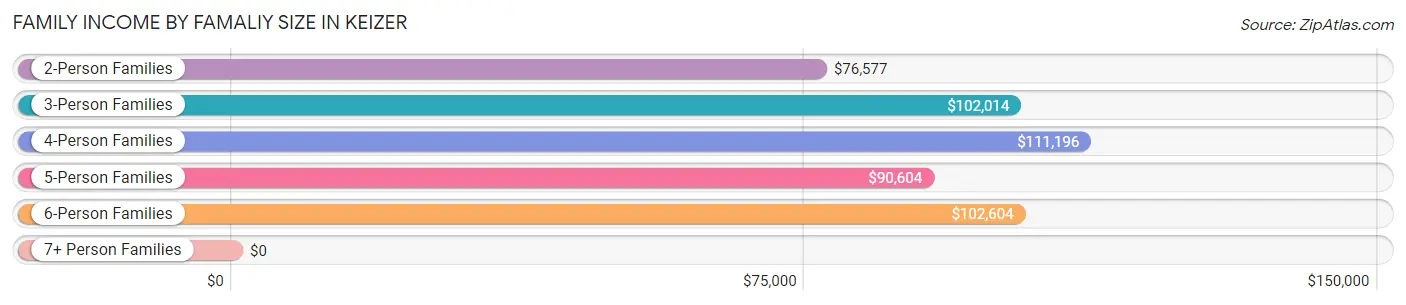
Family Income by Famaliy Size in Keizer
4-person families (1,560 | 15.9%) account for the highest median family income in Keizer with $111,196 per family, while 2-person families (4,753 | 48.4%) have the highest median income of $38,288 per family member.
| Income Bracket | # Families | Median Income |
| 2-Person Families | 4,753 (48.4%) | $76,577 |
| 3-Person Families | 1,939 (19.7%) | $102,014 |
| 4-Person Families | 1,560 (15.9%) | $111,196 |
| 5-Person Families | 1,221 (12.4%) | $90,604 |
| 6-Person Families | 188 (1.9%) | $102,604 |
| 7+ Person Families | 162 (1.7%) | $0 |
| Total | 9,823 (100.0%) | $89,069 |
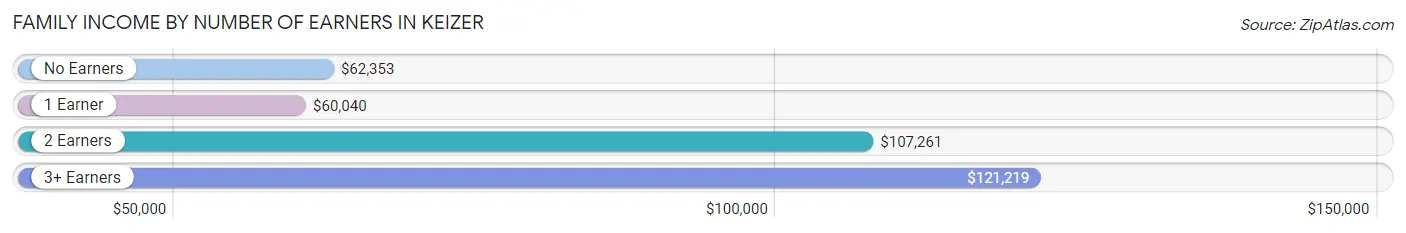
Family Income by Number of Earners in Keizer
The median family income in Keizer is $89,069, with families comprising 3+ earners (1,213) having the highest median family income of $121,219, while families with 1 earner (3,289) have the lowest median family income of $60,040, accounting for 12.3% and 33.5% of families, respectively.
| Number of Earners | # Families | Median Income |
| No Earners | 1,280 (13.0%) | $62,353 |
| 1 Earner | 3,289 (33.5%) | $60,040 |
| 2 Earners | 4,041 (41.1%) | $107,261 |
| 3+ Earners | 1,213 (12.3%) | $121,219 |
| Total | 9,823 (100.0%) | $89,069 |
Household Income in Keizer
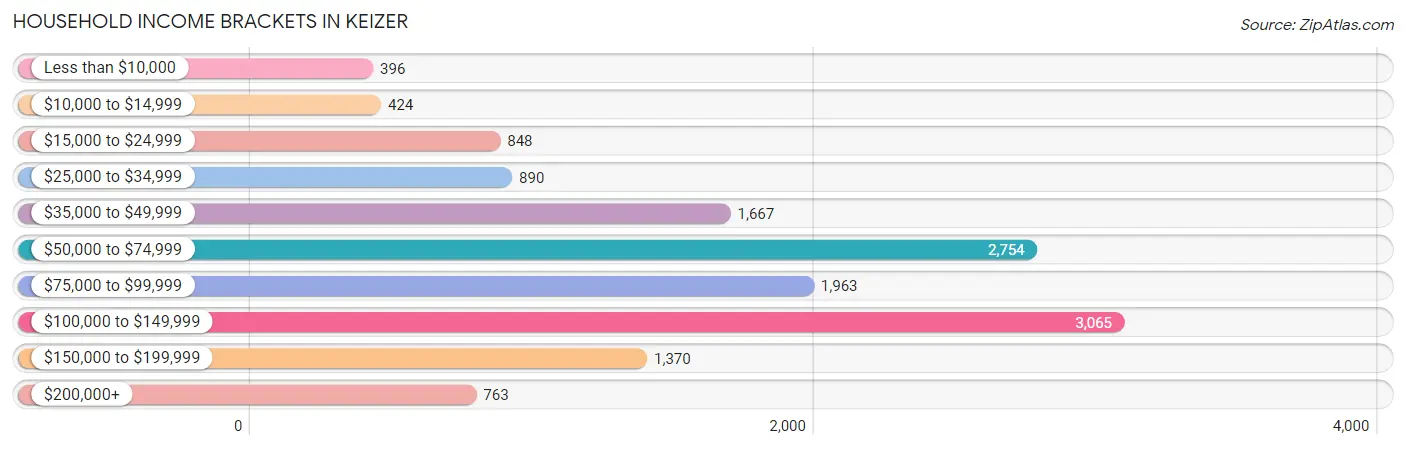
Household Income Brackets in Keizer
With 3,065 households falling in the category, the $100,000 to $149,999 income range is the most frequent in Keizer, accounting for 21.7% of all households. In contrast, only 396 households (2.8%) fall into the less than $10,000 income bracket, making it the least populous group.
| Income Bracket | # Households | % Households |
| Less than $10,000 | 396 | 2.8% |
| $10,000 to $14,999 | 424 | 3.0% |
| $15,000 to $24,999 | 848 | 6.0% |
| $25,000 to $34,999 | 890 | 6.3% |
| $35,000 to $49,999 | 1,667 | 11.8% |
| $50,000 to $74,999 | 2,754 | 19.5% |
| $75,000 to $99,999 | 1,963 | 13.9% |
| $100,000 to $149,999 | 3,065 | 21.7% |
| $150,000 to $199,999 | 1,370 | 9.7% |
| $200,000+ | 763 | 5.4% |
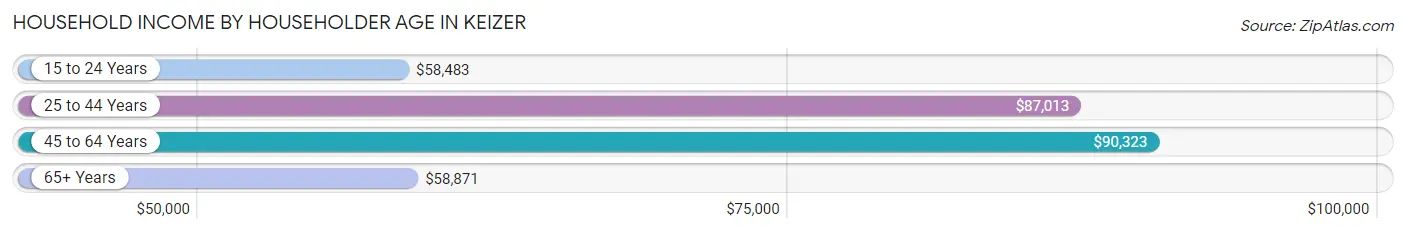
Household Income by Householder Age in Keizer
The median household income in Keizer is $75,753, with the highest median household income of $90,323 found in the 45 to 64 years age bracket for the primary householder. A total of 4,701 households (33.3%) fall into this category. Meanwhile, the 15 to 24 years age bracket for the primary householder has the lowest median household income of $58,483, with 767 households (5.4%) in this group.
| Income Bracket | # Households | Median Income |
| 15 to 24 Years | 767 (5.4%) | $58,483 |
| 25 to 44 Years | 5,043 (35.7%) | $87,013 |
| 45 to 64 Years | 4,701 (33.3%) | $90,323 |
| 65+ Years | 3,614 (25.6%) | $58,871 |
| Total | 14,125 (100.0%) | $75,753 |
Poverty in Keizer
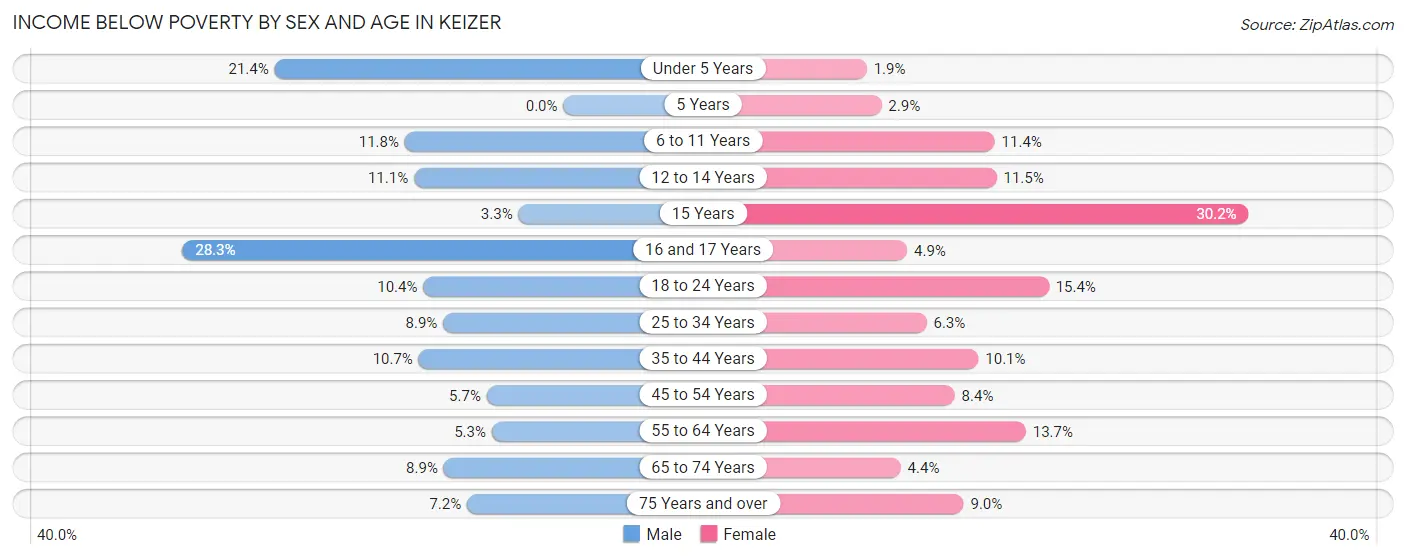
Income Below Poverty by Sex and Age in Keizer
With 9.6% poverty level for males and 9.2% for females among the residents of Keizer, 16 and 17 year old males and 15 year old females are the most vulnerable to poverty, with 101 males (28.3%) and 48 females (30.2%) in their respective age groups living below the poverty level.
| Age Bracket | Male | Female |
| Under 5 Years | 185 (21.4%) | 28 (1.8%) |
| 5 Years | 0 (0.0%) | 4 (2.9%) |
| 6 to 11 Years | 202 (11.8%) | 181 (11.4%) |
| 12 to 14 Years | 97 (11.1%) | 92 (11.5%) |
| 15 Years | 14 (3.3%) | 48 (30.2%) |
| 16 and 17 Years | 101 (28.3%) | 33 (4.9%) |
| 18 to 24 Years | 163 (10.4%) | 341 (15.4%) |
| 25 to 34 Years | 233 (8.9%) | 189 (6.3%) |
| 35 to 44 Years | 298 (10.7%) | 257 (10.1%) |
| 45 to 54 Years | 107 (5.7%) | 181 (8.4%) |
| 55 to 64 Years | 107 (5.3%) | 325 (13.7%) |
| 65 to 74 Years | 149 (8.9%) | 85 (4.4%) |
| 75 Years and over | 64 (7.1%) | 137 (9.0%) |
| Total | 1,720 (9.6%) | 1,901 (9.2%) |
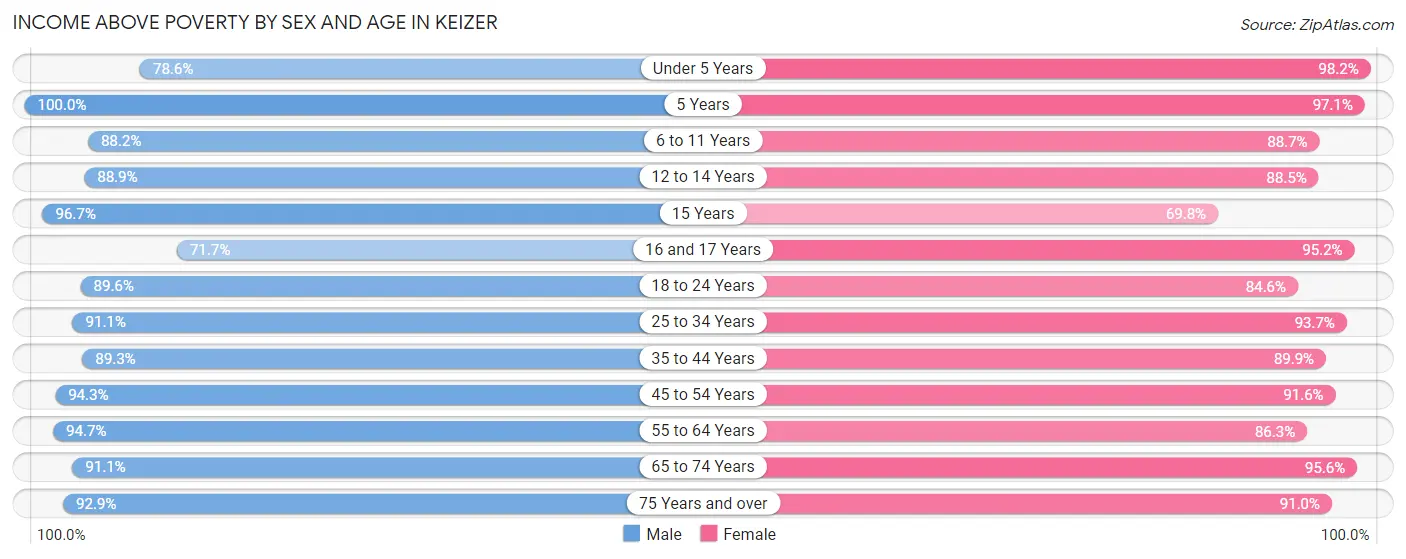
Income Above Poverty by Sex and Age in Keizer
According to the poverty statistics in Keizer, males aged 5 years and females aged under 5 years are the age groups that are most secure financially, with 100.0% of males and 98.2% of females in these age groups living above the poverty line.
| Age Bracket | Male | Female |
| Under 5 Years | 678 (78.6%) | 1,486 (98.2%) |
| 5 Years | 222 (100.0%) | 132 (97.1%) |
| 6 to 11 Years | 1,514 (88.2%) | 1,414 (88.6%) |
| 12 to 14 Years | 778 (88.9%) | 709 (88.5%) |
| 15 Years | 406 (96.7%) | 111 (69.8%) |
| 16 and 17 Years | 256 (71.7%) | 647 (95.2%) |
| 18 to 24 Years | 1,404 (89.6%) | 1,879 (84.6%) |
| 25 to 34 Years | 2,379 (91.1%) | 2,816 (93.7%) |
| 35 to 44 Years | 2,477 (89.3%) | 2,278 (89.9%) |
| 45 to 54 Years | 1,775 (94.3%) | 1,980 (91.6%) |
| 55 to 64 Years | 1,908 (94.7%) | 2,055 (86.3%) |
| 65 to 74 Years | 1,528 (91.1%) | 1,859 (95.6%) |
| 75 Years and over | 831 (92.8%) | 1,379 (91.0%) |
| Total | 16,156 (90.4%) | 18,745 (90.8%) |
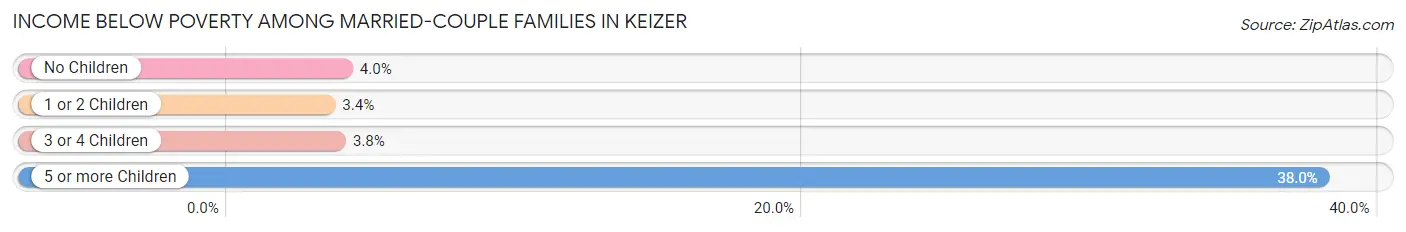
Income Below Poverty Among Married-Couple Families in Keizer
The poverty statistics for married-couple families in Keizer show that 4.0% or 273 of the total 6,759 families live below the poverty line. Families with 5 or more children have the highest poverty rate of 38.0%, comprising of 19 families. On the other hand, families with 1 or 2 children have the lowest poverty rate of 3.4%, which includes 68 families.
| Children | Above Poverty | Below Poverty |
| No Children | 3,747 (96.0%) | 156 (4.0%) |
| 1 or 2 Children | 1,940 (96.6%) | 68 (3.4%) |
| 3 or 4 Children | 768 (96.2%) | 30 (3.8%) |
| 5 or more Children | 31 (62.0%) | 19 (38.0%) |
| Total | 6,486 (96.0%) | 273 (4.0%) |
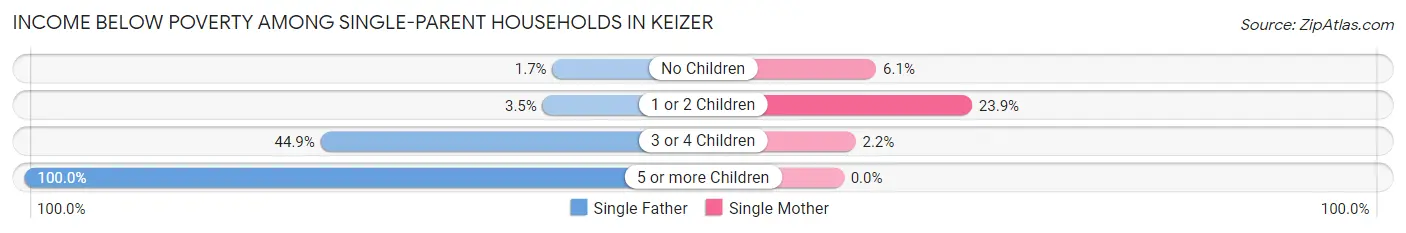
Income Below Poverty Among Single-Parent Households in Keizer
According to the poverty data in Keizer, 8.4% or 86 single-father households and 13.1% or 267 single-mother households are living below the poverty line. Among single-father households, those with 5 or more children have the highest poverty rate, with 14 households (100.0%) experiencing poverty. Likewise, among single-mother households, those with 1 or 2 children have the highest poverty rate, with 204 households (23.9%) falling below the poverty line.
| Children | Single Father | Single Mother |
| No Children | 7 (1.7%) | 58 (6.0%) |
| 1 or 2 Children | 17 (3.5%) | 204 (23.9%) |
| 3 or 4 Children | 48 (44.9%) | 5 (2.2%) |
| 5 or more Children | 14 (100.0%) | 0 (0.0%) |
| Total | 86 (8.4%) | 267 (13.1%) |
Income Below Poverty Among Married-Couple vs Single-Parent Households in Keizer
The poverty data for Keizer shows that 273 of the married-couple family households (4.0%) and 353 of the single-parent households (11.5%) are living below the poverty level. Within the married-couple family households, those with 5 or more children have the highest poverty rate, with 19 households (38.0%) falling below the poverty line. Among the single-parent households, those with 5 or more children have the highest poverty rate, with 14 household (66.7%) living below poverty.
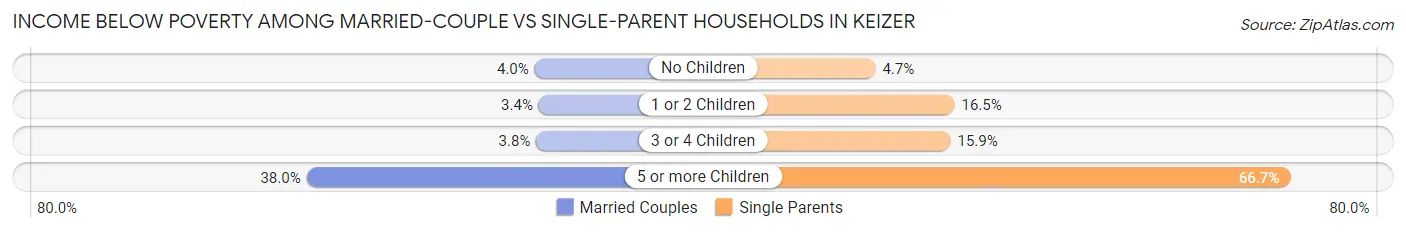
| Children | Married-Couple Families | Single-Parent Households |
| No Children | 156 (4.0%) | 65 (4.7%) |
| 1 or 2 Children | 68 (3.4%) | 221 (16.5%) |
| 3 or 4 Children | 30 (3.8%) | 53 (15.9%) |
| 5 or more Children | 19 (38.0%) | 14 (66.7%) |
| Total | 273 (4.0%) | 353 (11.5%) |
Employment Characteristics in Keizer
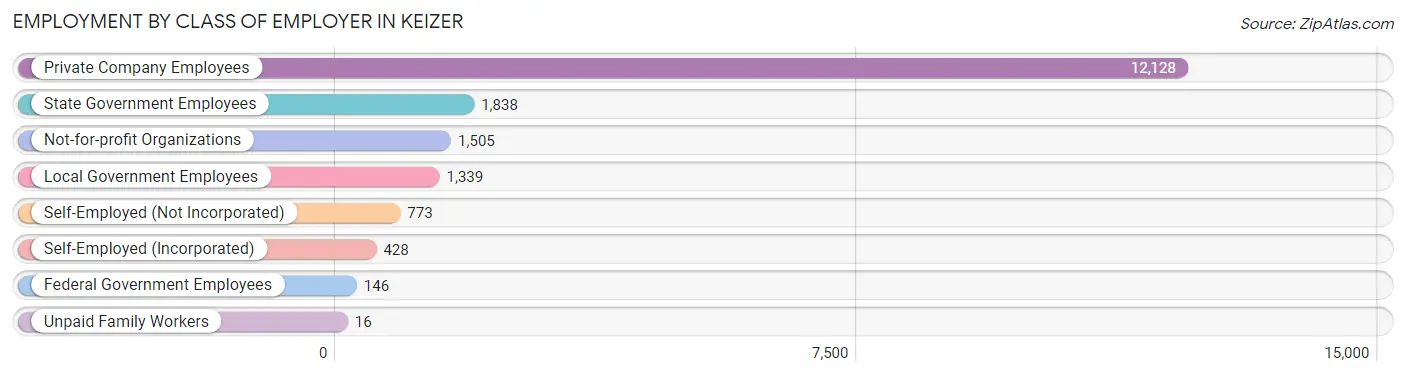
Employment by Class of Employer in Keizer
Among the 18,173 employed individuals in Keizer, private company employees (12,128 | 66.7%), state government employees (1,838 | 10.1%), and not-for-profit organizations (1,505 | 8.3%) make up the most common classes of employment.
| Employer Class | # Employees | % Employees |
| Private Company Employees | 12,128 | 66.7% |
| Self-Employed (Incorporated) | 428 | 2.4% |
| Self-Employed (Not Incorporated) | 773 | 4.3% |
| Not-for-profit Organizations | 1,505 | 8.3% |
| Local Government Employees | 1,339 | 7.4% |
| State Government Employees | 1,838 | 10.1% |
| Federal Government Employees | 146 | 0.8% |
| Unpaid Family Workers | 16 | 0.1% |
| Total | 18,173 | 100.0% |
Employment Status by Age in Keizer
According to the labor force statistics for Keizer, out of the total population over 16 years of age (30,424), 63.9% or 19,441 individuals are in the labor force, with 4.6% or 894 of them unemployed. The age group with the highest labor force participation rate is 30 to 34 years, with 86.3% or 2,506 individuals in the labor force. Within the labor force, the 16 to 19 years age range has the highest percentage of unemployed individuals, with 24.3% or 218 of them being unemployed.
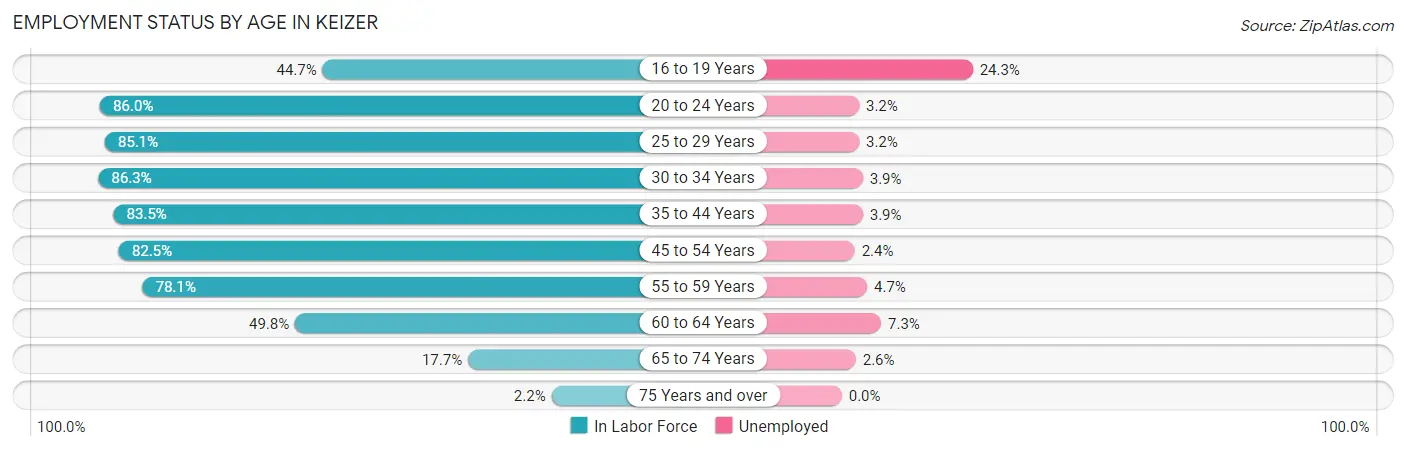
| Age Bracket | In Labor Force | Unemployed |
| 16 to 19 Years | 897 (44.7%) | 218 (24.3%) |
| 20 to 24 Years | 2,424 (86.0%) | 78 (3.2%) |
| 25 to 29 Years | 2,309 (85.1%) | 74 (3.2%) |
| 30 to 34 Years | 2,506 (86.3%) | 98 (3.9%) |
| 35 to 44 Years | 4,434 (83.5%) | 173 (3.9%) |
| 45 to 54 Years | 3,335 (82.5%) | 80 (2.4%) |
| 55 to 59 Years | 1,771 (78.1%) | 83 (4.7%) |
| 60 to 64 Years | 1,062 (49.8%) | 78 (7.3%) |
| 65 to 74 Years | 654 (17.7%) | 17 (2.6%) |
| 75 Years and over | 56 (2.2%) | 0 (0.0%) |
| Total | 19,441 (63.9%) | 894 (4.6%) |
Employment Status by Educational Attainment in Keizer
According to labor force statistics for Keizer, 79.6% of individuals (15,418) out of the total population between 25 and 64 years of age (19,369) are in the labor force, with 3.8% or 586 of them being unemployed. The group with the highest labor force participation rate are those with the educational attainment of bachelor's degree or higher, with 86.8% or 4,335 individuals in the labor force. Within the labor force, individuals with less than high school education have the highest percentage of unemployment, with 5.5% or 80 of them being unemployed.
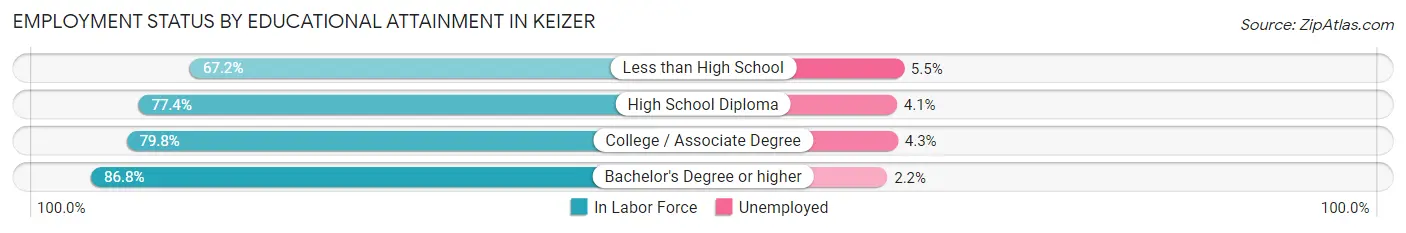
| Educational Attainment | In Labor Force | Unemployed |
| Less than High School | 1,462 (67.2%) | 120 (5.5%) |
| High School Diploma | 3,781 (77.4%) | 200 (4.1%) |
| College / Associate Degree | 5,837 (79.8%) | 315 (4.3%) |
| Bachelor's Degree or higher | 4,335 (86.8%) | 110 (2.2%) |
| Total | 15,418 (79.6%) | 736 (3.8%) |
Employment Occupations by Sex in Keizer
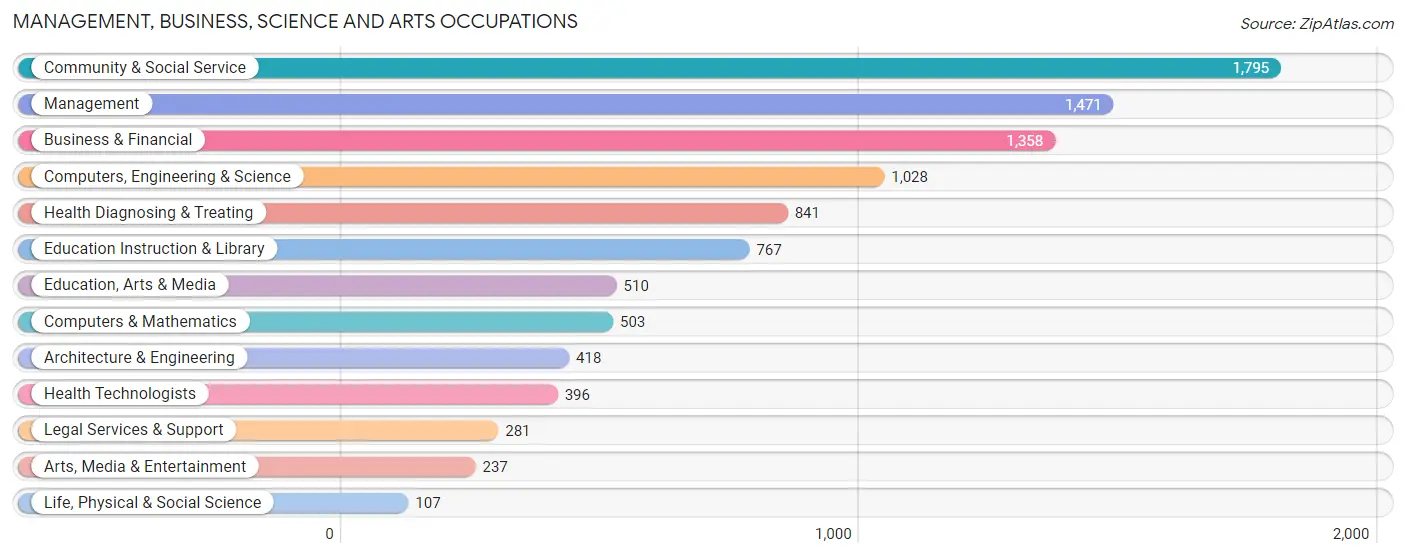
Management, Business, Science and Arts Occupations
The most common Management, Business, Science and Arts occupations in Keizer are Community & Social Service (1,795 | 9.7%), Management (1,471 | 7.9%), Business & Financial (1,358 | 7.3%), Computers, Engineering & Science (1,028 | 5.6%), and Health Diagnosing & Treating (841 | 4.5%).
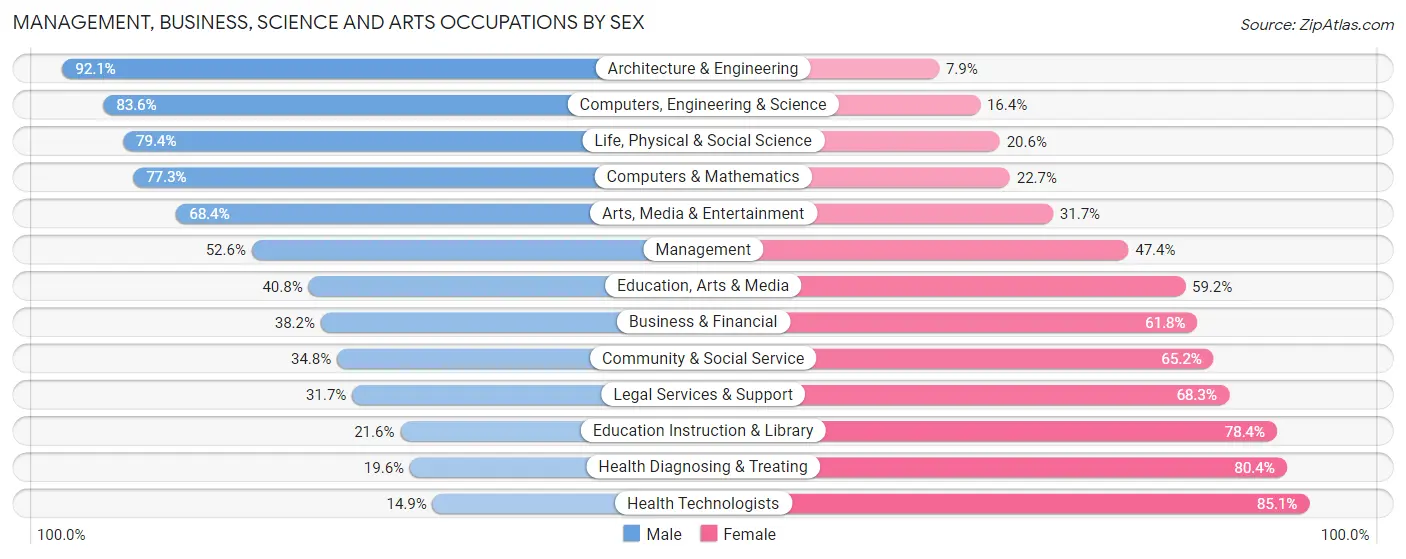
Management, Business, Science and Arts Occupations by Sex
Within the Management, Business, Science and Arts occupations in Keizer, the most male-oriented occupations are Architecture & Engineering (92.1%), Computers, Engineering & Science (83.6%), and Life, Physical & Social Science (79.4%), while the most female-oriented occupations are Health Technologists (85.1%), Health Diagnosing & Treating (80.4%), and Education Instruction & Library (78.4%).
| Occupation | Male | Female |
| Management | 774 (52.6%) | 697 (47.4%) |
| Business & Financial | 519 (38.2%) | 839 (61.8%) |
| Computers, Engineering & Science | 859 (83.6%) | 169 (16.4%) |
| Computers & Mathematics | 389 (77.3%) | 114 (22.7%) |
| Architecture & Engineering | 385 (92.1%) | 33 (7.9%) |
| Life, Physical & Social Science | 85 (79.4%) | 22 (20.6%) |
| Community & Social Service | 625 (34.8%) | 1,170 (65.2%) |
| Education, Arts & Media | 208 (40.8%) | 302 (59.2%) |
| Legal Services & Support | 89 (31.7%) | 192 (68.3%) |
| Education Instruction & Library | 166 (21.6%) | 601 (78.4%) |
| Arts, Media & Entertainment | 162 (68.3%) | 75 (31.7%) |
| Health Diagnosing & Treating | 165 (19.6%) | 676 (80.4%) |
| Health Technologists | 59 (14.9%) | 337 (85.1%) |
| Total (Category) | 2,942 (45.3%) | 3,551 (54.7%) |
| Total (Overall) | 9,429 (50.9%) | 9,105 (49.1%) |
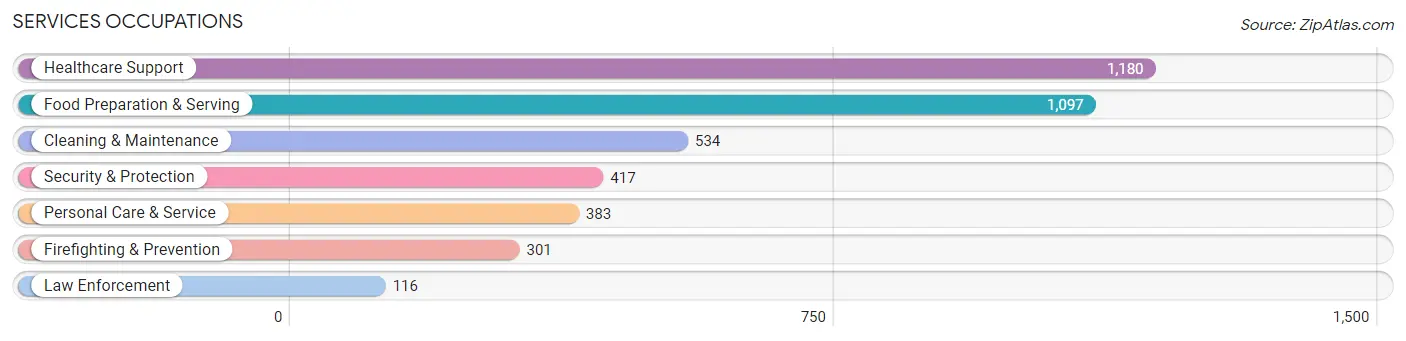
Services Occupations
The most common Services occupations in Keizer are Healthcare Support (1,180 | 6.4%), Food Preparation & Serving (1,097 | 5.9%), Cleaning & Maintenance (534 | 2.9%), Security & Protection (417 | 2.2%), and Personal Care & Service (383 | 2.1%).
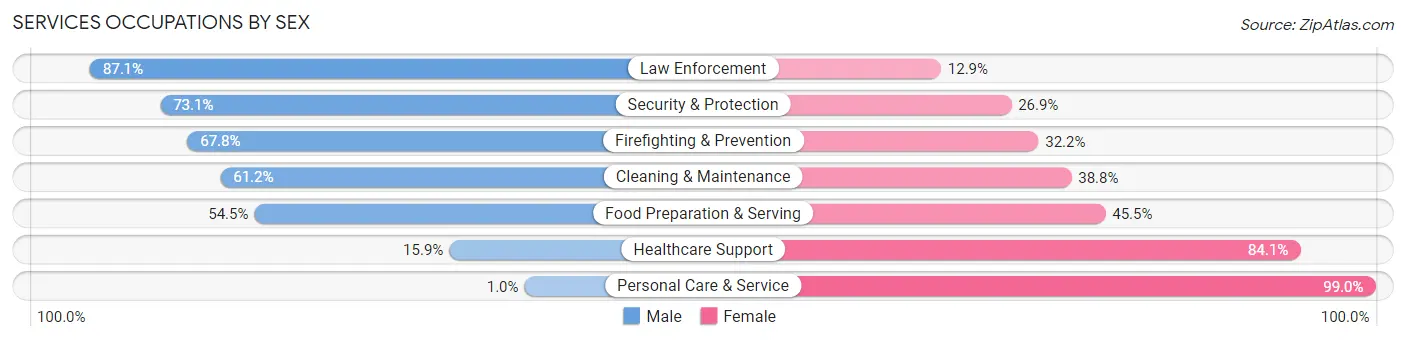
Services Occupations by Sex
Within the Services occupations in Keizer, the most male-oriented occupations are Law Enforcement (87.1%), Security & Protection (73.1%), and Firefighting & Prevention (67.8%), while the most female-oriented occupations are Personal Care & Service (99.0%), Healthcare Support (84.1%), and Food Preparation & Serving (45.5%).
| Occupation | Male | Female |
| Healthcare Support | 188 (15.9%) | 992 (84.1%) |
| Security & Protection | 305 (73.1%) | 112 (26.9%) |
| Firefighting & Prevention | 204 (67.8%) | 97 (32.2%) |
| Law Enforcement | 101 (87.1%) | 15 (12.9%) |
| Food Preparation & Serving | 598 (54.5%) | 499 (45.5%) |
| Cleaning & Maintenance | 327 (61.2%) | 207 (38.8%) |
| Personal Care & Service | 4 (1.0%) | 379 (99.0%) |
| Total (Category) | 1,422 (39.4%) | 2,189 (60.6%) |
| Total (Overall) | 9,429 (50.9%) | 9,105 (49.1%) |
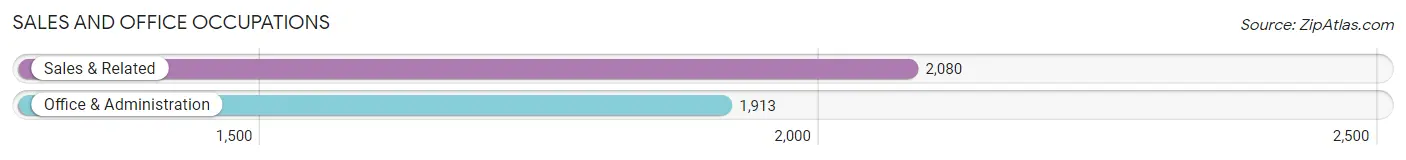
Sales and Office Occupations
The most common Sales and Office occupations in Keizer are Sales & Related (2,080 | 11.2%), and Office & Administration (1,913 | 10.3%).
Sales and Office Occupations by Sex
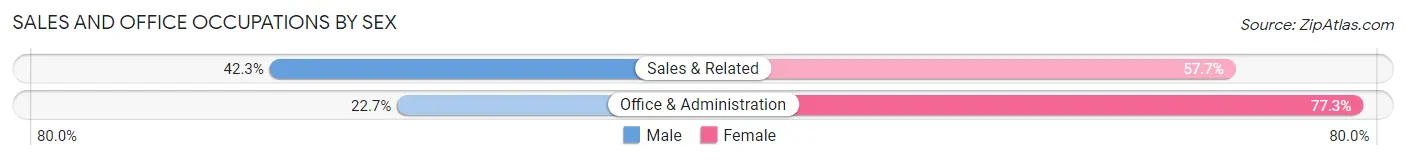
| Occupation | Male | Female |
| Sales & Related | 880 (42.3%) | 1,200 (57.7%) |
| Office & Administration | 434 (22.7%) | 1,479 (77.3%) |
| Total (Category) | 1,314 (32.9%) | 2,679 (67.1%) |
| Total (Overall) | 9,429 (50.9%) | 9,105 (49.1%) |
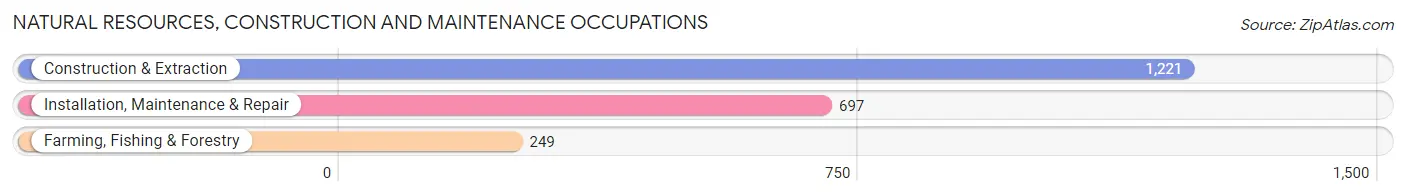
Natural Resources, Construction and Maintenance Occupations
The most common Natural Resources, Construction and Maintenance occupations in Keizer are Construction & Extraction (1,221 | 6.6%), Installation, Maintenance & Repair (697 | 3.8%), and Farming, Fishing & Forestry (249 | 1.3%).
Natural Resources, Construction and Maintenance Occupations by Sex
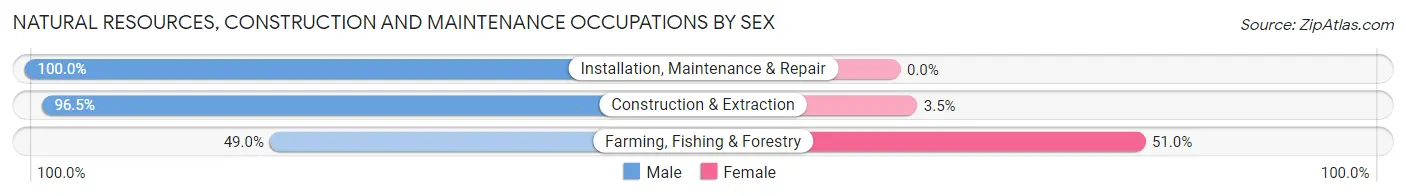
| Occupation | Male | Female |
| Farming, Fishing & Forestry | 122 (49.0%) | 127 (51.0%) |
| Construction & Extraction | 1,178 (96.5%) | 43 (3.5%) |
| Installation, Maintenance & Repair | 697 (100.0%) | 0 (0.0%) |
| Total (Category) | 1,997 (92.2%) | 170 (7.8%) |
| Total (Overall) | 9,429 (50.9%) | 9,105 (49.1%) |
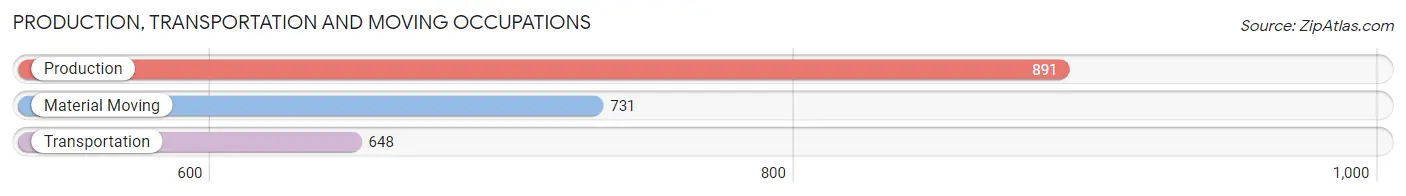
Production, Transportation and Moving Occupations
The most common Production, Transportation and Moving occupations in Keizer are Production (891 | 4.8%), Material Moving (731 | 3.9%), and Transportation (648 | 3.5%).
Production, Transportation and Moving Occupations by Sex
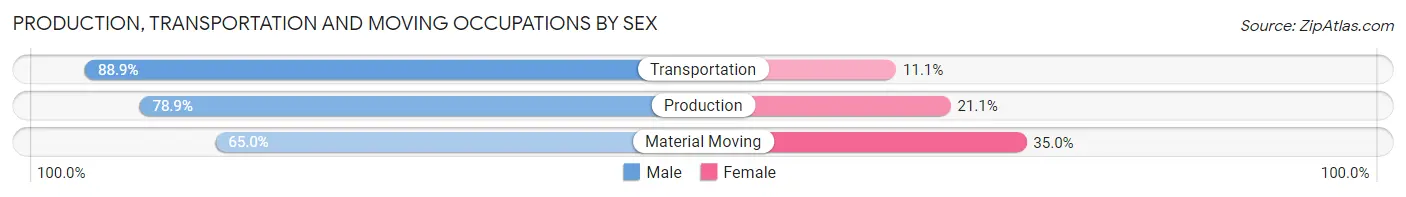
| Occupation | Male | Female |
| Production | 703 (78.9%) | 188 (21.1%) |
| Transportation | 576 (88.9%) | 72 (11.1%) |
| Material Moving | 475 (65.0%) | 256 (35.0%) |
| Total (Category) | 1,754 (77.3%) | 516 (22.7%) |
| Total (Overall) | 9,429 (50.9%) | 9,105 (49.1%) |
Employment Industries by Sex in Keizer
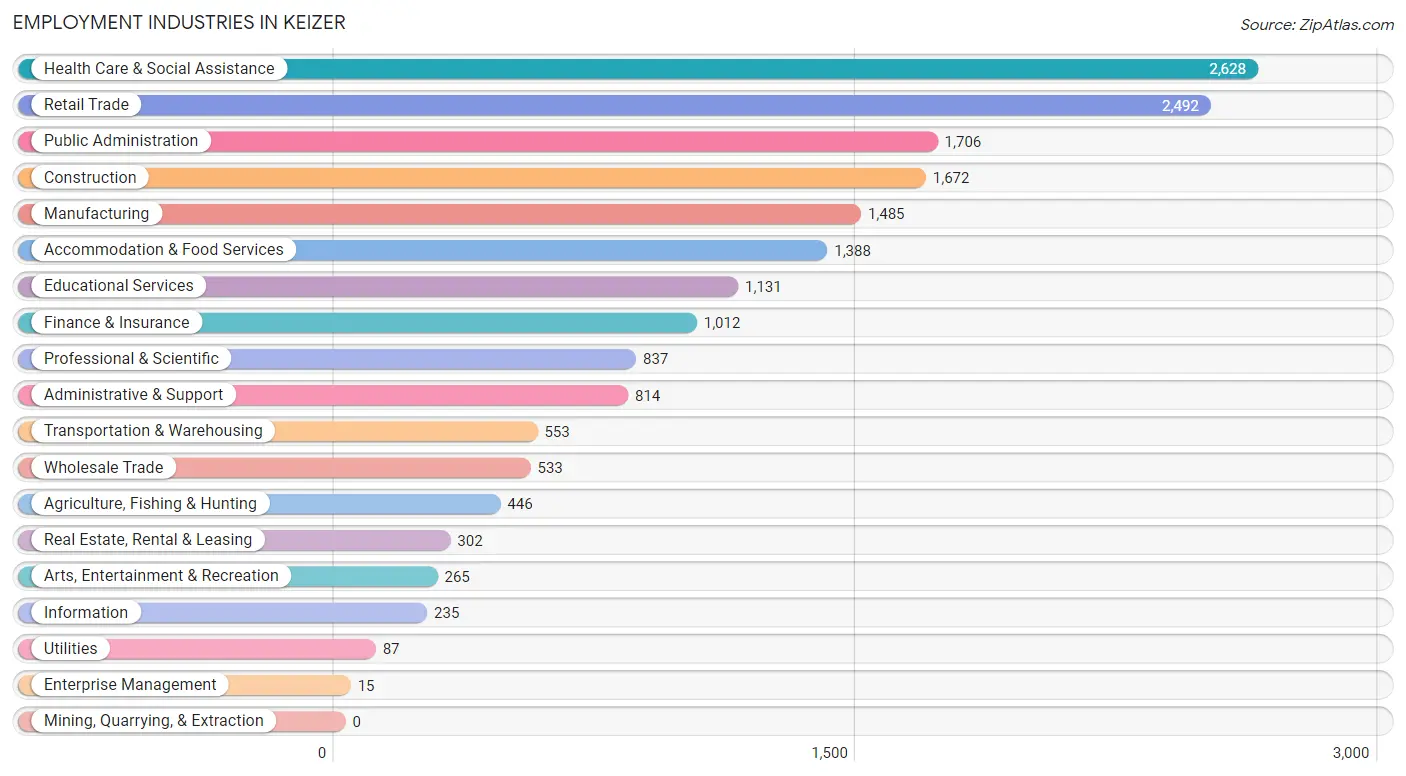
Employment Industries in Keizer
The major employment industries in Keizer include Health Care & Social Assistance (2,628 | 14.2%), Retail Trade (2,492 | 13.5%), Public Administration (1,706 | 9.2%), Construction (1,672 | 9.0%), and Manufacturing (1,485 | 8.0%).
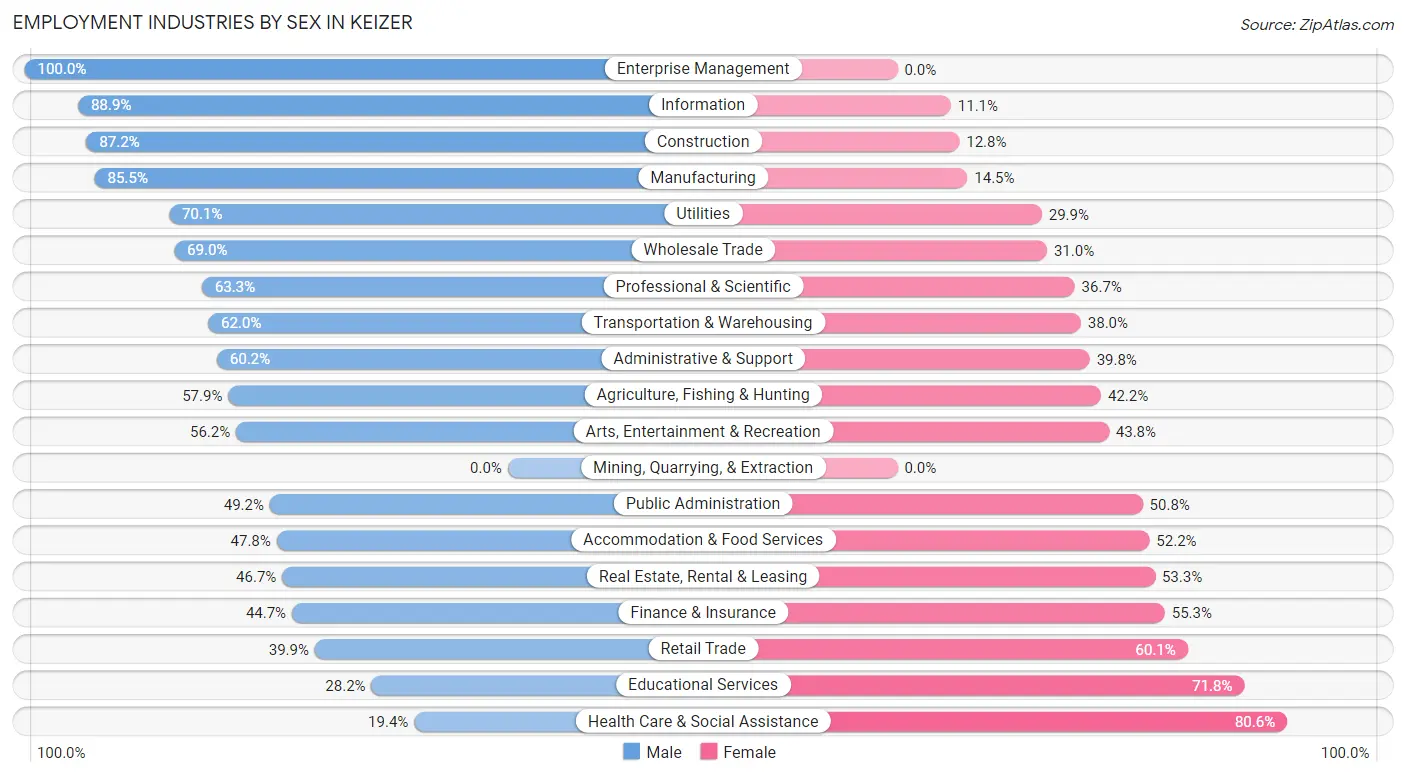
Employment Industries by Sex in Keizer
The Keizer industries that see more men than women are Enterprise Management (100.0%), Information (88.9%), and Construction (87.2%), whereas the industries that tend to have a higher number of women are Health Care & Social Assistance (80.6%), Educational Services (71.8%), and Retail Trade (60.1%).
| Industry | Male | Female |
| Agriculture, Fishing & Hunting | 258 (57.9%) | 188 (42.1%) |
| Mining, Quarrying, & Extraction | 0 (0.0%) | 0 (0.0%) |
| Construction | 1,458 (87.2%) | 214 (12.8%) |
| Manufacturing | 1,270 (85.5%) | 215 (14.5%) |
| Wholesale Trade | 368 (69.0%) | 165 (31.0%) |
| Retail Trade | 995 (39.9%) | 1,497 (60.1%) |
| Transportation & Warehousing | 343 (62.0%) | 210 (38.0%) |
| Utilities | 61 (70.1%) | 26 (29.9%) |
| Information | 209 (88.9%) | 26 (11.1%) |
| Finance & Insurance | 452 (44.7%) | 560 (55.3%) |
| Real Estate, Rental & Leasing | 141 (46.7%) | 161 (53.3%) |
| Professional & Scientific | 530 (63.3%) | 307 (36.7%) |
| Enterprise Management | 15 (100.0%) | 0 (0.0%) |
| Administrative & Support | 490 (60.2%) | 324 (39.8%) |
| Educational Services | 319 (28.2%) | 812 (71.8%) |
| Health Care & Social Assistance | 509 (19.4%) | 2,119 (80.6%) |
| Arts, Entertainment & Recreation | 149 (56.2%) | 116 (43.8%) |
| Accommodation & Food Services | 664 (47.8%) | 724 (52.2%) |
| Public Administration | 840 (49.2%) | 866 (50.8%) |
| Total | 9,429 (50.9%) | 9,105 (49.1%) |
Education in Keizer
School Enrollment in Keizer
The most common levels of schooling among the 9,376 students in Keizer are elementary school (2,374 | 25.3%), middle school (2,258 | 24.1%), and high school (2,000 | 21.3%).
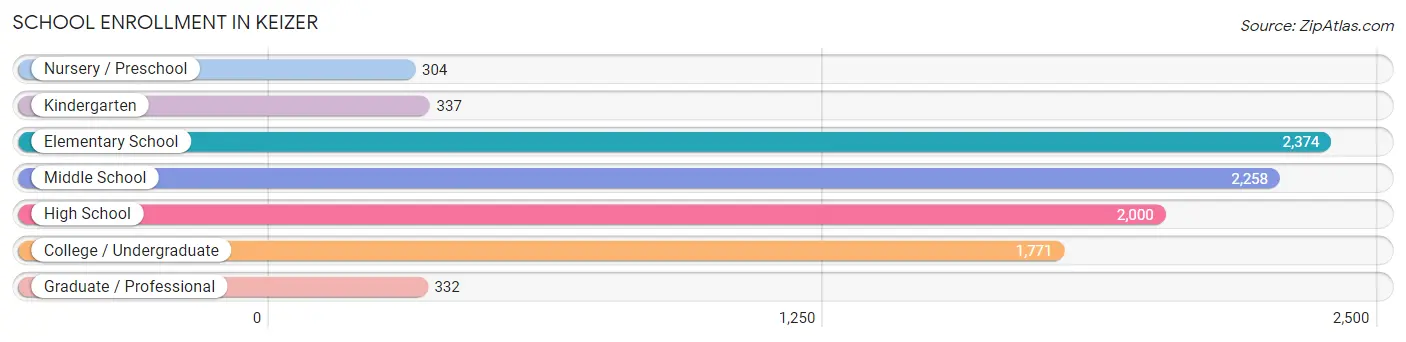
| School Level | # Students | % Students |
| Nursery / Preschool | 304 | 3.2% |
| Kindergarten | 337 | 3.6% |
| Elementary School | 2,374 | 25.3% |
| Middle School | 2,258 | 24.1% |
| High School | 2,000 | 21.3% |
| College / Undergraduate | 1,771 | 18.9% |
| Graduate / Professional | 332 | 3.5% |
| Total | 9,376 | 100.0% |
School Enrollment by Age by Funding Source in Keizer
Out of a total of 9,376 students who are enrolled in schools in Keizer, 1,181 (12.6%) attend a private institution, while the remaining 8,195 (87.4%) are enrolled in public schools. The age group of 35 years and over has the highest likelihood of being enrolled in private schools, with 161 (56.1% in the age bracket) enrolled. Conversely, the age group of 10 to 14 year olds has the lowest likelihood of being enrolled in a private school, with 2,741 (95.3% in the age bracket) attending a public institution.
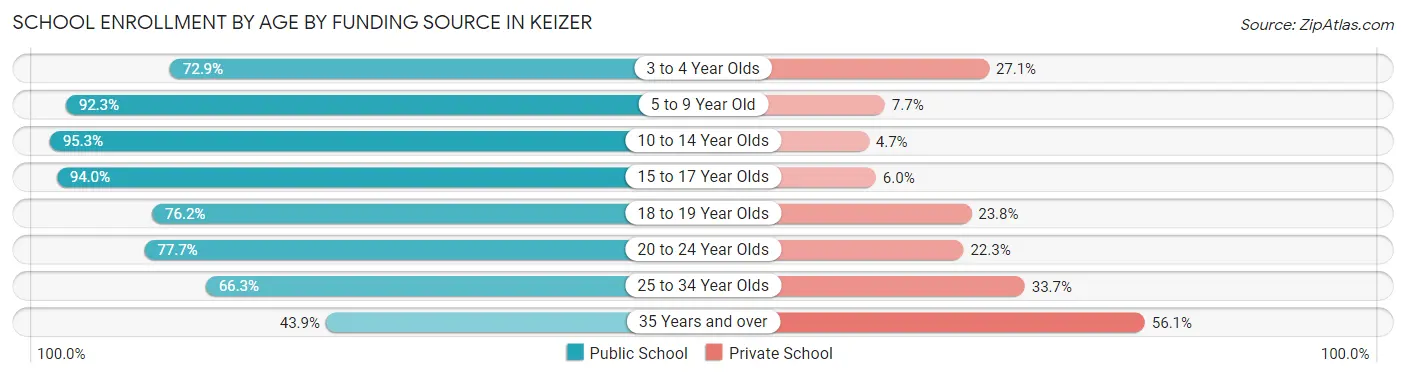
| Age Bracket | Public School | Private School |
| 3 to 4 Year Olds | 186 (72.9%) | 69 (27.1%) |
| 5 to 9 Year Old | 2,163 (92.3%) | 180 (7.7%) |
| 10 to 14 Year Olds | 2,741 (95.3%) | 135 (4.7%) |
| 15 to 17 Year Olds | 1,473 (94.0%) | 94 (6.0%) |
| 18 to 19 Year Olds | 356 (76.2%) | 111 (23.8%) |
| 20 to 24 Year Olds | 724 (77.7%) | 208 (22.3%) |
| 25 to 34 Year Olds | 430 (66.3%) | 219 (33.7%) |
| 35 Years and over | 126 (43.9%) | 161 (56.1%) |
| Total | 8,195 (87.4%) | 1,181 (12.6%) |
Educational Attainment by Field of Study in Keizer
Business (1,434 | 19.8%), education (925 | 12.8%), social sciences (815 | 11.3%), science & technology (552 | 7.6%), and arts & humanities (546 | 7.5%) are the most common fields of study among 7,229 individuals in Keizer who have obtained a bachelor's degree or higher.
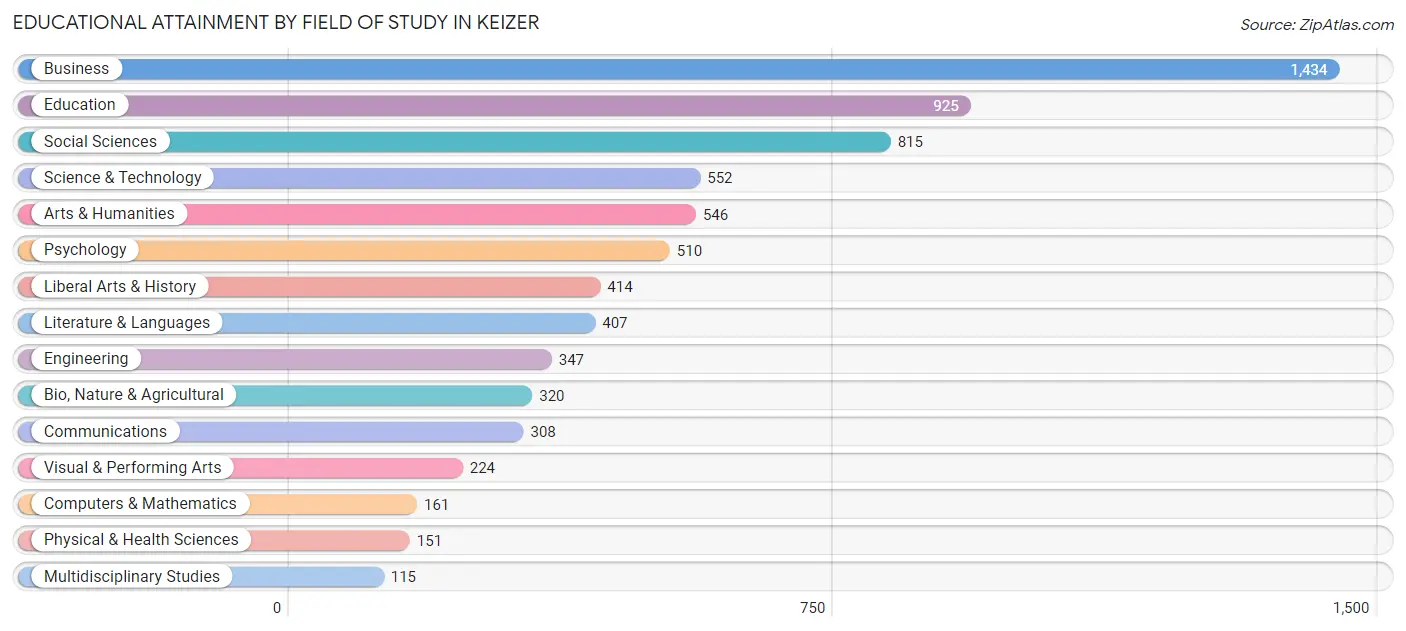
| Field of Study | # Graduates | % Graduates |
| Computers & Mathematics | 161 | 2.2% |
| Bio, Nature & Agricultural | 320 | 4.4% |
| Physical & Health Sciences | 151 | 2.1% |
| Psychology | 510 | 7.0% |
| Social Sciences | 815 | 11.3% |
| Engineering | 347 | 4.8% |
| Multidisciplinary Studies | 115 | 1.6% |
| Science & Technology | 552 | 7.6% |
| Business | 1,434 | 19.8% |
| Education | 925 | 12.8% |
| Literature & Languages | 407 | 5.6% |
| Liberal Arts & History | 414 | 5.7% |
| Visual & Performing Arts | 224 | 3.1% |
| Communications | 308 | 4.3% |
| Arts & Humanities | 546 | 7.5% |
| Total | 7,229 | 100.0% |
Transportation & Commute in Keizer
Vehicle Availability by Sex in Keizer
The most prevalent vehicle ownership categories in Keizer are males with 2 vehicles (4,770, accounting for 51.1%) and females with 2 vehicles (4,793, making up 54.0%).
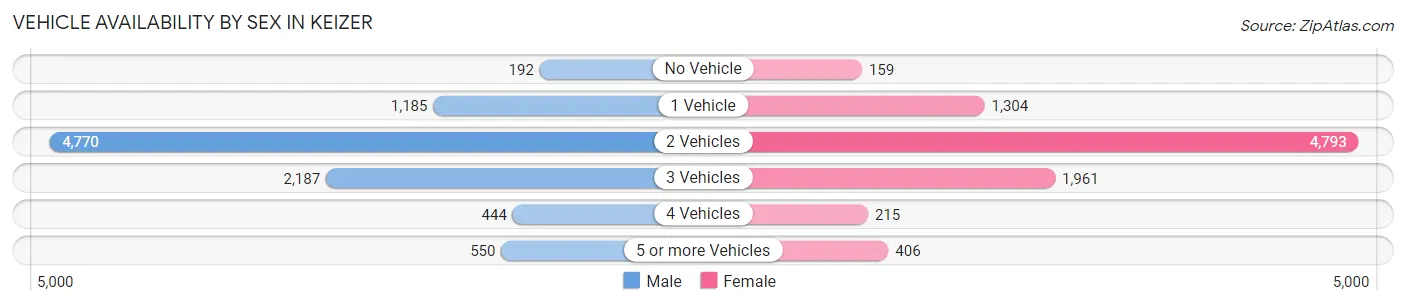
| Vehicles Available | Male | Female |
| No Vehicle | 192 (2.1%) | 159 (1.8%) |
| 1 Vehicle | 1,185 (12.7%) | 1,304 (14.7%) |
| 2 Vehicles | 4,770 (51.1%) | 4,793 (54.2%) |
| 3 Vehicles | 2,187 (23.4%) | 1,961 (22.2%) |
| 4 Vehicles | 444 (4.8%) | 215 (2.4%) |
| 5 or more Vehicles | 550 (5.9%) | 406 (4.6%) |
| Total | 9,328 (100.0%) | 8,838 (100.0%) |
Commute Time in Keizer
The most frequently occuring commute durations in Keizer are 15 to 19 minutes (3,318 commuters, 20.5%), 20 to 24 minutes (2,921 commuters, 18.1%), and 10 to 14 minutes (1,866 commuters, 11.5%).
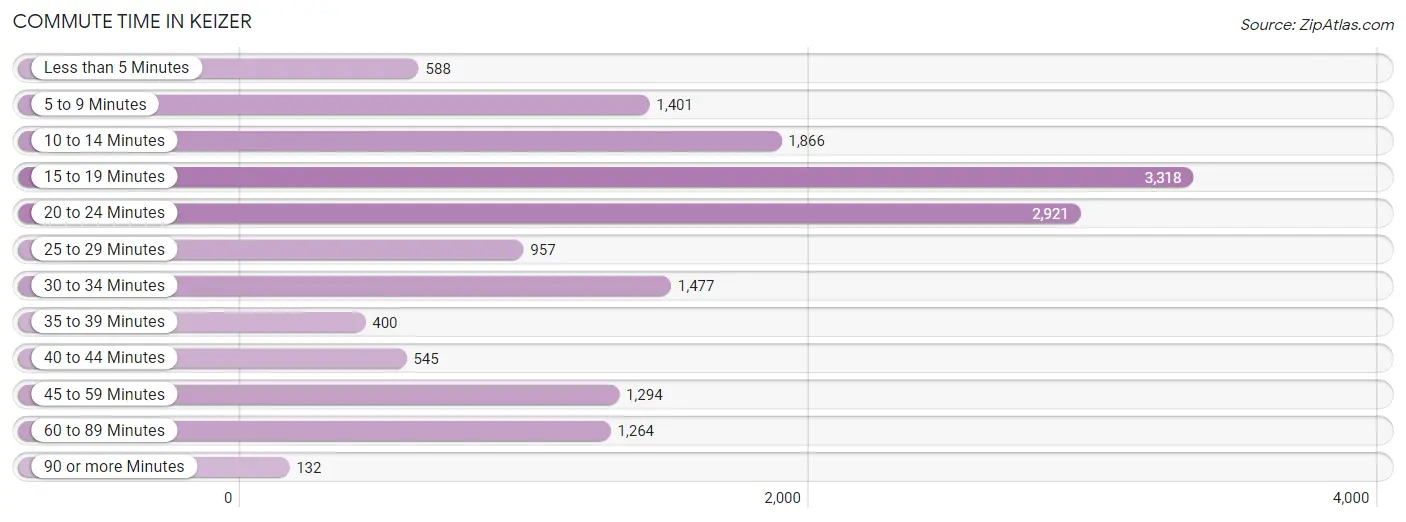
| Commute Time | # Commuters | % Commuters |
| Less than 5 Minutes | 588 | 3.6% |
| 5 to 9 Minutes | 1,401 | 8.7% |
| 10 to 14 Minutes | 1,866 | 11.5% |
| 15 to 19 Minutes | 3,318 | 20.5% |
| 20 to 24 Minutes | 2,921 | 18.1% |
| 25 to 29 Minutes | 957 | 5.9% |
| 30 to 34 Minutes | 1,477 | 9.1% |
| 35 to 39 Minutes | 400 | 2.5% |
| 40 to 44 Minutes | 545 | 3.4% |
| 45 to 59 Minutes | 1,294 | 8.0% |
| 60 to 89 Minutes | 1,264 | 7.8% |
| 90 or more Minutes | 132 | 0.8% |
Commute Time by Sex in Keizer
The most common commute times in Keizer are 15 to 19 minutes (1,719 commuters, 20.2%) for males and 20 to 24 minutes (1,668 commuters, 21.8%) for females.
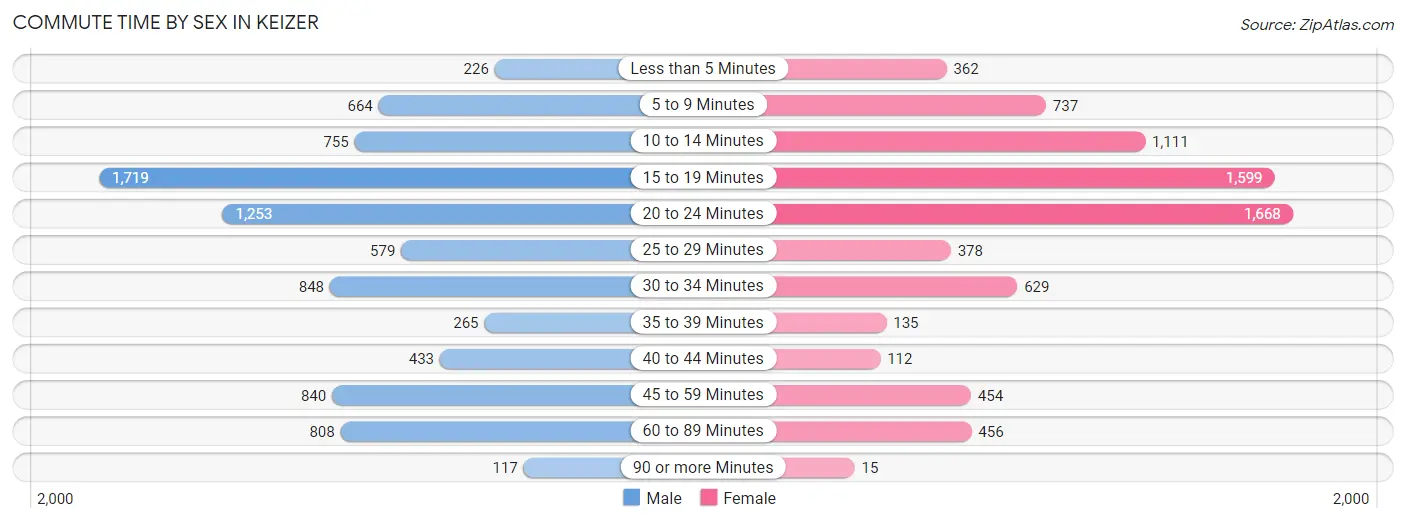
| Commute Time | Male | Female |
| Less than 5 Minutes | 226 (2.7%) | 362 (4.7%) |
| 5 to 9 Minutes | 664 (7.8%) | 737 (9.6%) |
| 10 to 14 Minutes | 755 (8.9%) | 1,111 (14.5%) |
| 15 to 19 Minutes | 1,719 (20.2%) | 1,599 (20.9%) |
| 20 to 24 Minutes | 1,253 (14.7%) | 1,668 (21.8%) |
| 25 to 29 Minutes | 579 (6.8%) | 378 (4.9%) |
| 30 to 34 Minutes | 848 (10.0%) | 629 (8.2%) |
| 35 to 39 Minutes | 265 (3.1%) | 135 (1.8%) |
| 40 to 44 Minutes | 433 (5.1%) | 112 (1.5%) |
| 45 to 59 Minutes | 840 (9.9%) | 454 (5.9%) |
| 60 to 89 Minutes | 808 (9.5%) | 456 (6.0%) |
| 90 or more Minutes | 117 (1.4%) | 15 (0.2%) |
Time of Departure to Work by Sex in Keizer
The most frequent times of departure to work in Keizer are 7:30 AM to 7:59 AM (1,230, 14.5%) for males and 7:00 AM to 7:29 AM (1,486, 19.4%) for females.
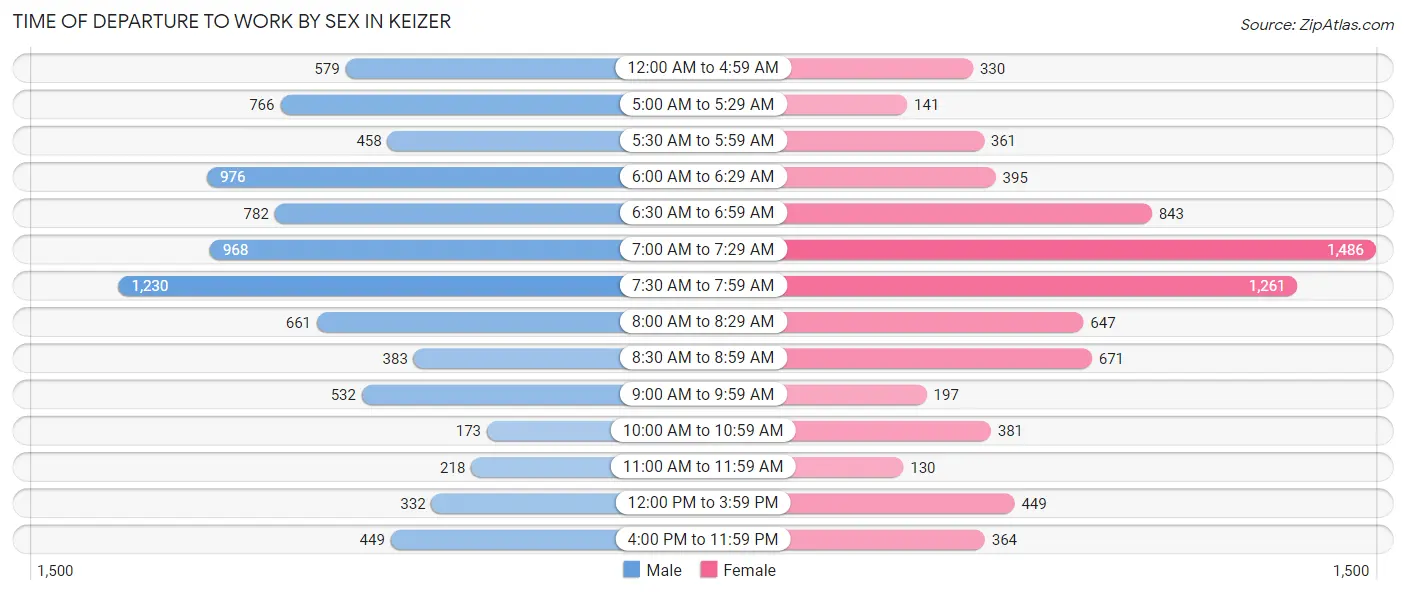
| Time of Departure | Male | Female |
| 12:00 AM to 4:59 AM | 579 (6.8%) | 330 (4.3%) |
| 5:00 AM to 5:29 AM | 766 (9.0%) | 141 (1.8%) |
| 5:30 AM to 5:59 AM | 458 (5.4%) | 361 (4.7%) |
| 6:00 AM to 6:29 AM | 976 (11.5%) | 395 (5.2%) |
| 6:30 AM to 6:59 AM | 782 (9.2%) | 843 (11.0%) |
| 7:00 AM to 7:29 AM | 968 (11.4%) | 1,486 (19.4%) |
| 7:30 AM to 7:59 AM | 1,230 (14.5%) | 1,261 (16.5%) |
| 8:00 AM to 8:29 AM | 661 (7.8%) | 647 (8.5%) |
| 8:30 AM to 8:59 AM | 383 (4.5%) | 671 (8.8%) |
| 9:00 AM to 9:59 AM | 532 (6.2%) | 197 (2.6%) |
| 10:00 AM to 10:59 AM | 173 (2.0%) | 381 (5.0%) |
| 11:00 AM to 11:59 AM | 218 (2.6%) | 130 (1.7%) |
| 12:00 PM to 3:59 PM | 332 (3.9%) | 449 (5.9%) |
| 4:00 PM to 11:59 PM | 449 (5.3%) | 364 (4.8%) |
| Total | 8,507 (100.0%) | 7,656 (100.0%) |
Housing Occupancy in Keizer
Occupancy by Ownership in Keizer
Of the total 14,125 dwellings in Keizer, owner-occupied units account for 8,932 (63.2%), while renter-occupied units make up 5,193 (36.8%).
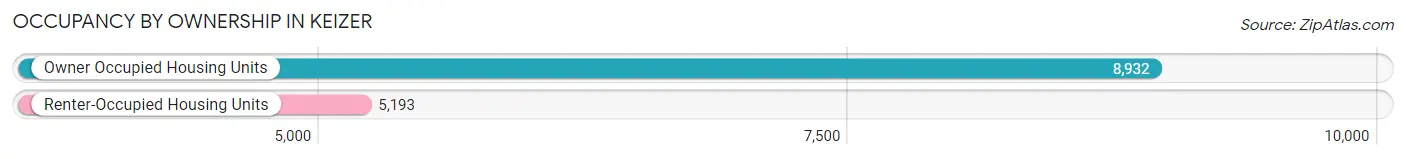
| Occupancy | # Housing Units | % Housing Units |
| Owner Occupied Housing Units | 8,932 | 63.2% |
| Renter-Occupied Housing Units | 5,193 | 36.8% |
| Total Occupied Housing Units | 14,125 | 100.0% |
Occupancy by Household Size in Keizer
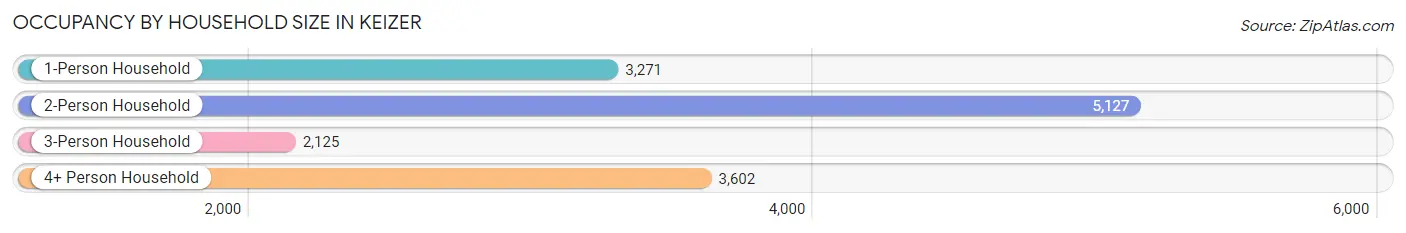
| Household Size | # Housing Units | % Housing Units |
| 1-Person Household | 3,271 | 23.2% |
| 2-Person Household | 5,127 | 36.3% |
| 3-Person Household | 2,125 | 15.0% |
| 4+ Person Household | 3,602 | 25.5% |
| Total Housing Units | 14,125 | 100.0% |
Occupancy by Ownership by Household Size in Keizer
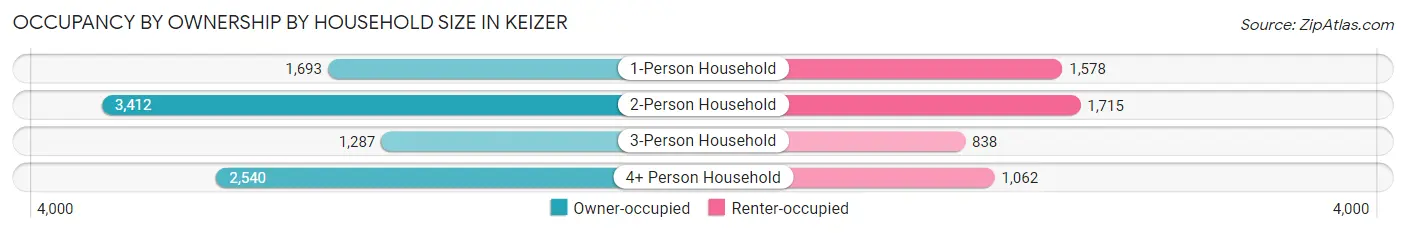
| Household Size | Owner-occupied | Renter-occupied |
| 1-Person Household | 1,693 (51.8%) | 1,578 (48.2%) |
| 2-Person Household | 3,412 (66.5%) | 1,715 (33.5%) |
| 3-Person Household | 1,287 (60.6%) | 838 (39.4%) |
| 4+ Person Household | 2,540 (70.5%) | 1,062 (29.5%) |
| Total Housing Units | 8,932 (63.2%) | 5,193 (36.8%) |
Occupancy by Educational Attainment in Keizer
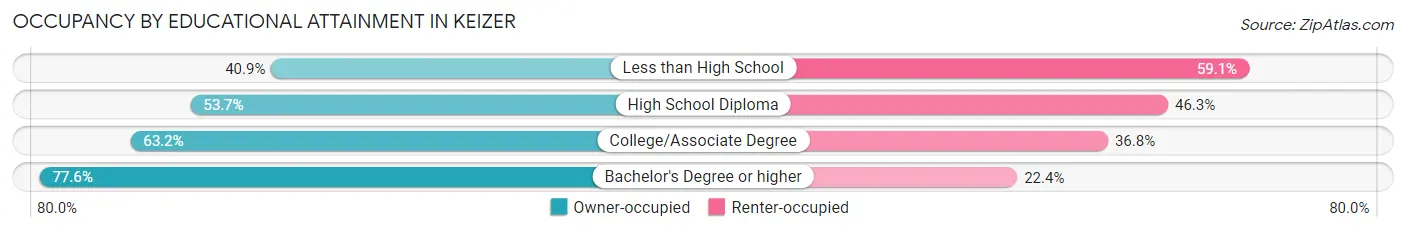
| Household Size | Owner-occupied | Renter-occupied |
| Less than High School | 484 (40.9%) | 700 (59.1%) |
| High School Diploma | 1,718 (53.7%) | 1,481 (46.3%) |
| College/Associate Degree | 3,656 (63.2%) | 2,126 (36.8%) |
| Bachelor's Degree or higher | 3,074 (77.6%) | 886 (22.4%) |
Occupancy by Age of Householder in Keizer
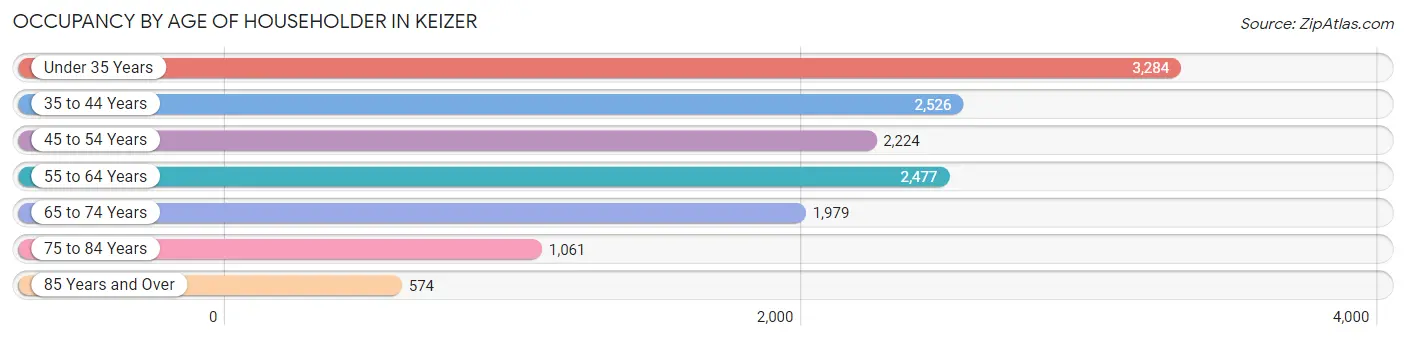
| Age Bracket | # Households | % Households |
| Under 35 Years | 3,284 | 23.3% |
| 35 to 44 Years | 2,526 | 17.9% |
| 45 to 54 Years | 2,224 | 15.8% |
| 55 to 64 Years | 2,477 | 17.5% |
| 65 to 74 Years | 1,979 | 14.0% |
| 75 to 84 Years | 1,061 | 7.5% |
| 85 Years and Over | 574 | 4.1% |
| Total | 14,125 | 100.0% |
Housing Finances in Keizer
Median Income by Occupancy in Keizer
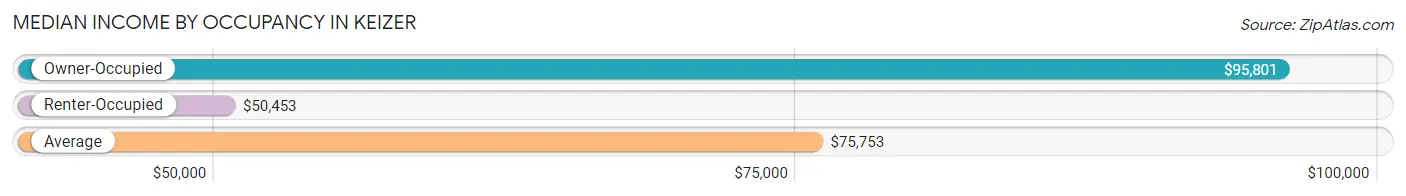
| Occupancy Type | # Households | Median Income |
| Owner-Occupied | 8,932 (63.2%) | $95,801 |
| Renter-Occupied | 5,193 (36.8%) | $50,453 |
| Average | 14,125 (100.0%) | $75,753 |
Occupancy by Householder Income Bracket in Keizer
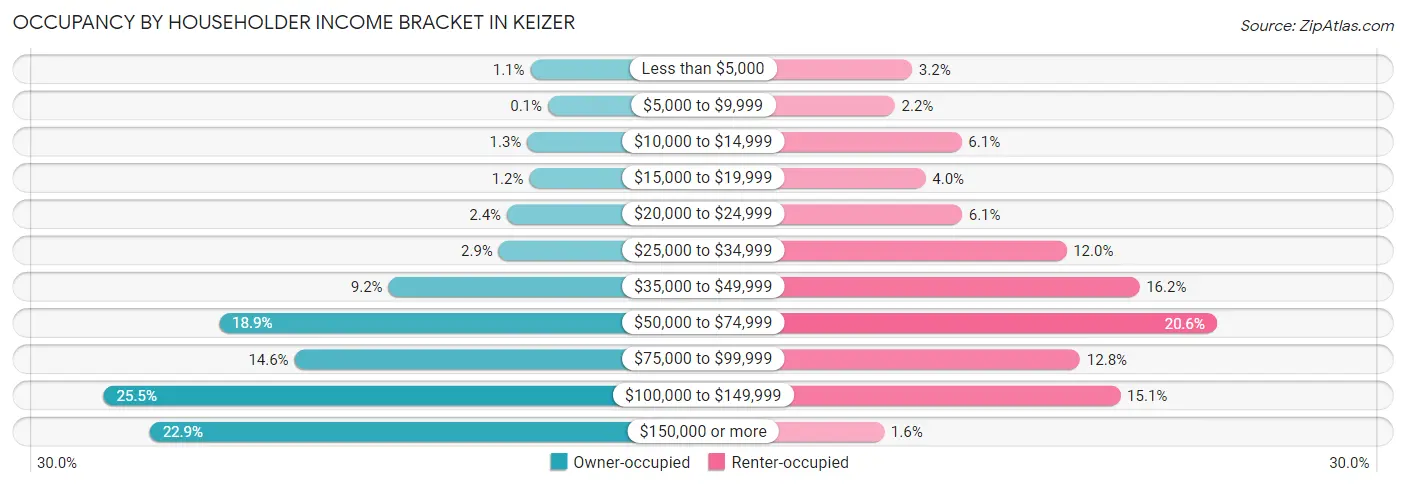
| Income Bracket | Owner-occupied | Renter-occupied |
| Less than $5,000 | 98 (1.1%) | 167 (3.2%) |
| $5,000 to $9,999 | 9 (0.1%) | 116 (2.2%) |
| $10,000 to $14,999 | 114 (1.3%) | 314 (6.0%) |
| $15,000 to $19,999 | 104 (1.2%) | 207 (4.0%) |
| $20,000 to $24,999 | 218 (2.4%) | 315 (6.1%) |
| $25,000 to $34,999 | 260 (2.9%) | 625 (12.0%) |
| $35,000 to $49,999 | 823 (9.2%) | 842 (16.2%) |
| $50,000 to $74,999 | 1,686 (18.9%) | 1,072 (20.6%) |
| $75,000 to $99,999 | 1,302 (14.6%) | 666 (12.8%) |
| $100,000 to $149,999 | 2,277 (25.5%) | 785 (15.1%) |
| $150,000 or more | 2,041 (22.9%) | 84 (1.6%) |
| Total | 8,932 (100.0%) | 5,193 (100.0%) |
Monthly Housing Cost Tiers in Keizer
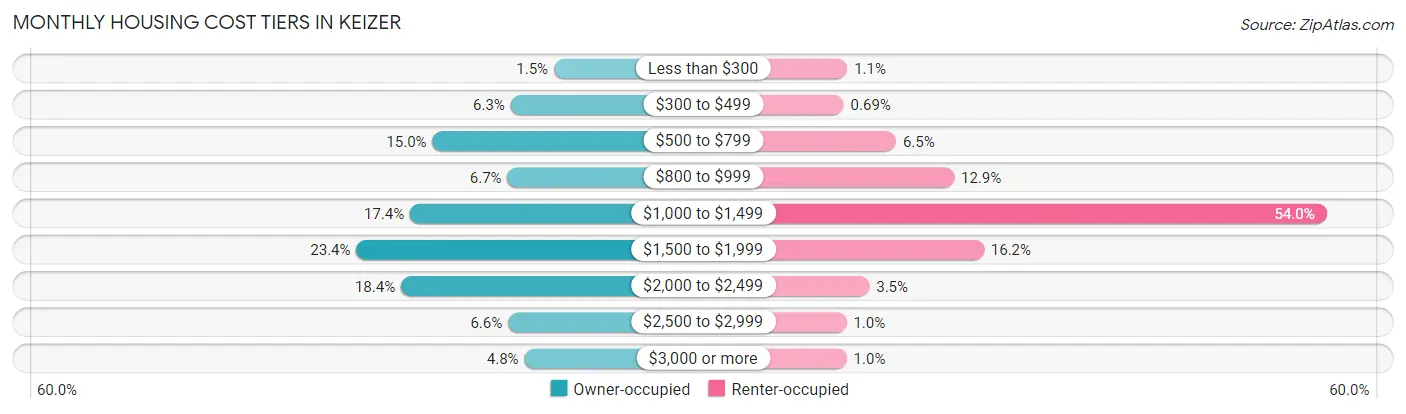
| Monthly Cost | Owner-occupied | Renter-occupied |
| Less than $300 | 136 (1.5%) | 56 (1.1%) |
| $300 to $499 | 563 (6.3%) | 36 (0.7%) |
| $500 to $799 | 1,335 (14.9%) | 336 (6.5%) |
| $800 to $999 | 595 (6.7%) | 669 (12.9%) |
| $1,000 to $1,499 | 1,556 (17.4%) | 2,806 (54.0%) |
| $1,500 to $1,999 | 2,086 (23.4%) | 840 (16.2%) |
| $2,000 to $2,499 | 1,645 (18.4%) | 183 (3.5%) |
| $2,500 to $2,999 | 589 (6.6%) | 52 (1.0%) |
| $3,000 or more | 427 (4.8%) | 53 (1.0%) |
| Total | 8,932 (100.0%) | 5,193 (100.0%) |
Physical Housing Characteristics in Keizer
Housing Structures in Keizer
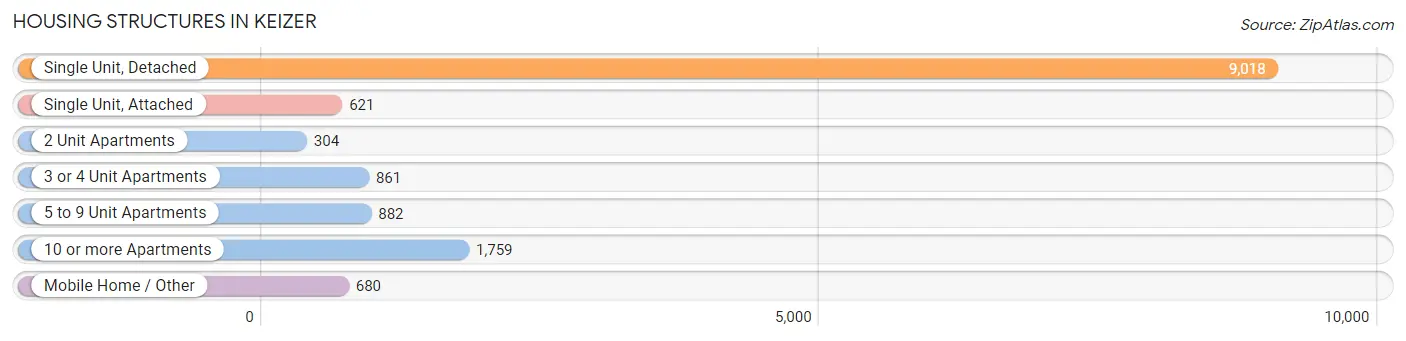
| Structure Type | # Housing Units | % Housing Units |
| Single Unit, Detached | 9,018 | 63.8% |
| Single Unit, Attached | 621 | 4.4% |
| 2 Unit Apartments | 304 | 2.1% |
| 3 or 4 Unit Apartments | 861 | 6.1% |
| 5 to 9 Unit Apartments | 882 | 6.2% |
| 10 or more Apartments | 1,759 | 12.4% |
| Mobile Home / Other | 680 | 4.8% |
| Total | 14,125 | 100.0% |
Housing Structures by Occupancy in Keizer
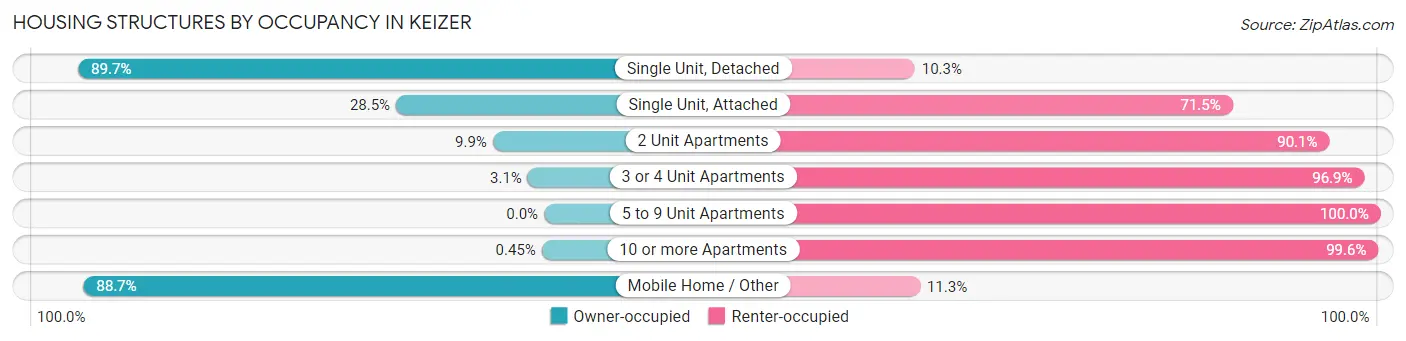
| Structure Type | Owner-occupied | Renter-occupied |
| Single Unit, Detached | 8,087 (89.7%) | 931 (10.3%) |
| Single Unit, Attached | 177 (28.5%) | 444 (71.5%) |
| 2 Unit Apartments | 30 (9.9%) | 274 (90.1%) |
| 3 or 4 Unit Apartments | 27 (3.1%) | 834 (96.9%) |
| 5 to 9 Unit Apartments | 0 (0.0%) | 882 (100.0%) |
| 10 or more Apartments | 8 (0.4%) | 1,751 (99.6%) |
| Mobile Home / Other | 603 (88.7%) | 77 (11.3%) |
| Total | 8,932 (63.2%) | 5,193 (36.8%) |
Housing Structures by Number of Rooms in Keizer
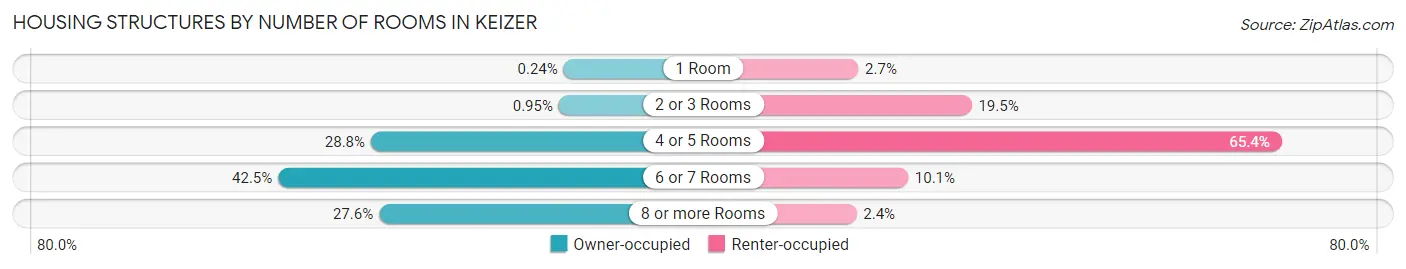
| Number of Rooms | Owner-occupied | Renter-occupied |
| 1 Room | 21 (0.2%) | 140 (2.7%) |
| 2 or 3 Rooms | 85 (0.9%) | 1,011 (19.5%) |
| 4 or 5 Rooms | 2,569 (28.8%) | 3,394 (65.4%) |
| 6 or 7 Rooms | 3,795 (42.5%) | 522 (10.1%) |
| 8 or more Rooms | 2,462 (27.6%) | 126 (2.4%) |
| Total | 8,932 (100.0%) | 5,193 (100.0%) |
Housing Structure by Heating Type in Keizer
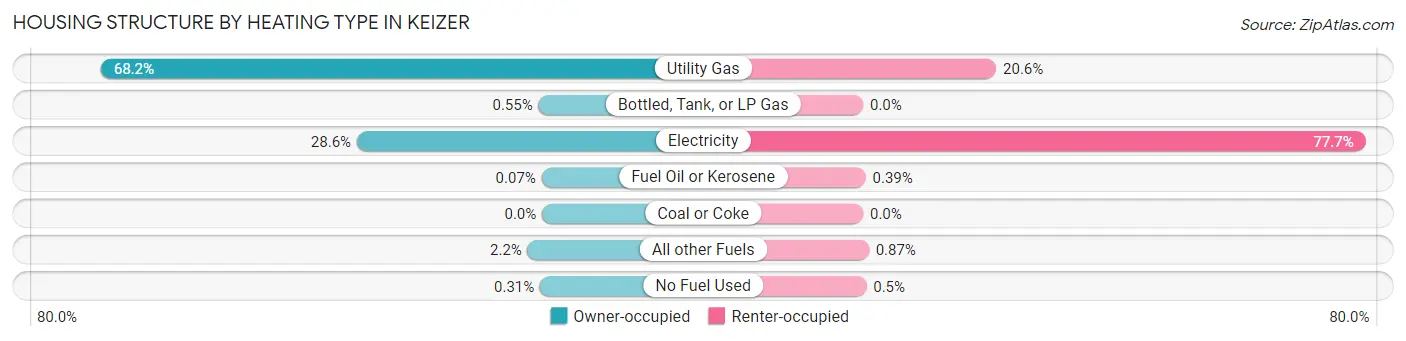
| Heating Type | Owner-occupied | Renter-occupied |
| Utility Gas | 6,093 (68.2%) | 1,068 (20.6%) |
| Bottled, Tank, or LP Gas | 49 (0.5%) | 0 (0.0%) |
| Electricity | 2,557 (28.6%) | 4,034 (77.7%) |
| Fuel Oil or Kerosene | 6 (0.1%) | 20 (0.4%) |
| Coal or Coke | 0 (0.0%) | 0 (0.0%) |
| All other Fuels | 199 (2.2%) | 45 (0.9%) |
| No Fuel Used | 28 (0.3%) | 26 (0.5%) |
| Total | 8,932 (100.0%) | 5,193 (100.0%) |
Household Vehicle Usage in Keizer
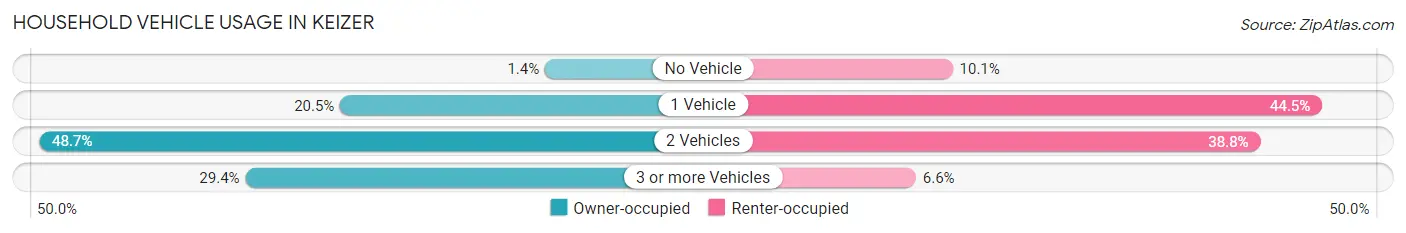
| Vehicles per Household | Owner-occupied | Renter-occupied |
| No Vehicle | 127 (1.4%) | 522 (10.1%) |
| 1 Vehicle | 1,835 (20.5%) | 2,313 (44.5%) |
| 2 Vehicles | 4,345 (48.6%) | 2,014 (38.8%) |
| 3 or more Vehicles | 2,625 (29.4%) | 344 (6.6%) |
| Total | 8,932 (100.0%) | 5,193 (100.0%) |
Real Estate & Mortgages in Keizer
Real Estate and Mortgage Overview in Keizer
| Characteristic | Without Mortgage | With Mortgage |
| Housing Units | 2,491 | 6,441 |
| Median Property Value | $366,700 | $362,700 |
| Median Household Income | $62,098 | $1,663 |
| Monthly Housing Costs | $630 | $427 |
| Real Estate Taxes | $3,460 | $79 |
Property Value by Mortgage Status in Keizer
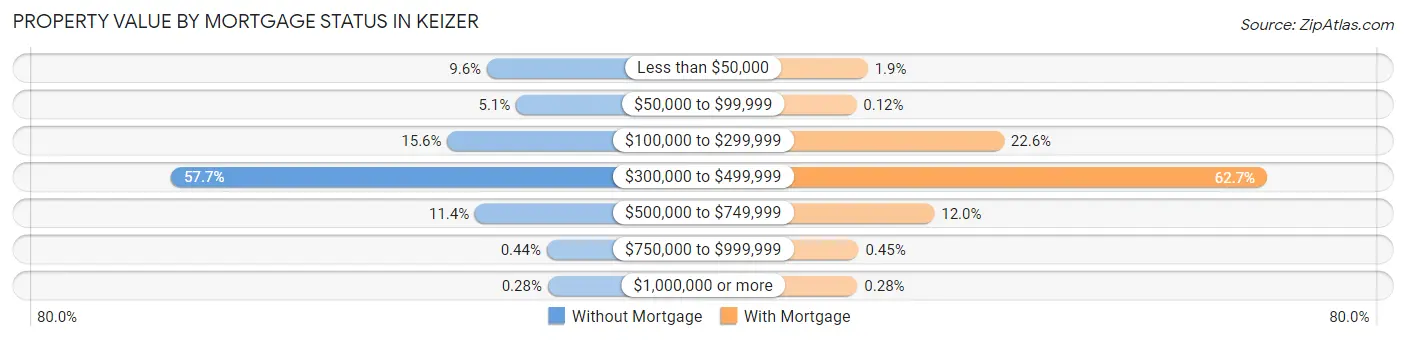
| Property Value | Without Mortgage | With Mortgage |
| Less than $50,000 | 238 (9.6%) | 120 (1.9%) |
| $50,000 to $99,999 | 127 (5.1%) | 8 (0.1%) |
| $100,000 to $299,999 | 388 (15.6%) | 1,456 (22.6%) |
| $300,000 to $499,999 | 1,437 (57.7%) | 4,037 (62.7%) |
| $500,000 to $749,999 | 283 (11.4%) | 773 (12.0%) |
| $750,000 to $999,999 | 11 (0.4%) | 29 (0.4%) |
| $1,000,000 or more | 7 (0.3%) | 18 (0.3%) |
| Total | 2,491 (100.0%) | 6,441 (100.0%) |
Household Income by Mortgage Status in Keizer
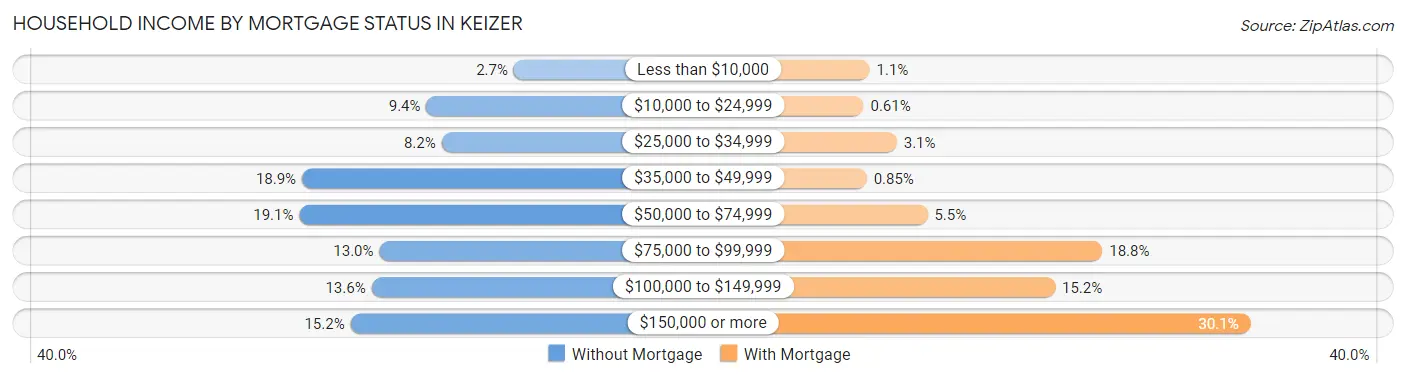
| Household Income | Without Mortgage | With Mortgage |
| Less than $10,000 | 68 (2.7%) | 69 (1.1%) |
| $10,000 to $24,999 | 234 (9.4%) | 39 (0.6%) |
| $25,000 to $34,999 | 205 (8.2%) | 202 (3.1%) |
| $35,000 to $49,999 | 470 (18.9%) | 55 (0.9%) |
| $50,000 to $74,999 | 475 (19.1%) | 353 (5.5%) |
| $75,000 to $99,999 | 323 (13.0%) | 1,211 (18.8%) |
| $100,000 to $149,999 | 338 (13.6%) | 979 (15.2%) |
| $150,000 or more | 378 (15.2%) | 1,939 (30.1%) |
| Total | 2,491 (100.0%) | 6,441 (100.0%) |
Property Value to Household Income Ratio in Keizer
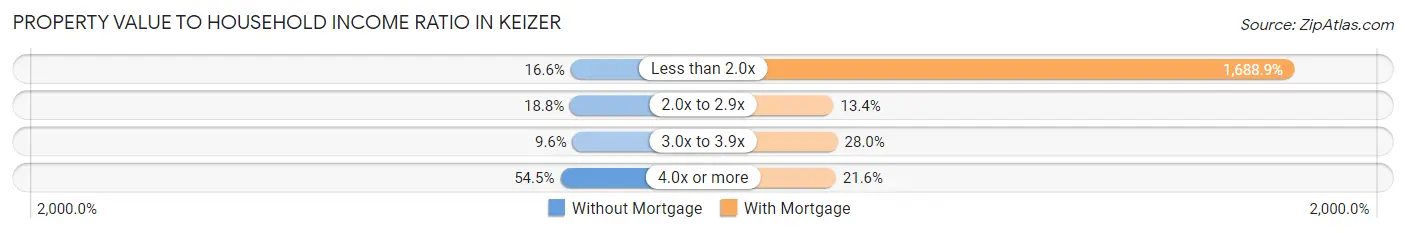
| Value-to-Income Ratio | Without Mortgage | With Mortgage |
| Less than 2.0x | 414 (16.6%) | 108,780 (1,688.9%) |
| 2.0x to 2.9x | 468 (18.8%) | 862 (13.4%) |
| 3.0x to 3.9x | 238 (9.6%) | 1,800 (28.0%) |
| 4.0x or more | 1,357 (54.5%) | 1,390 (21.6%) |
| Total | 2,491 (100.0%) | 6,441 (100.0%) |
Real Estate Taxes by Mortgage Status in Keizer
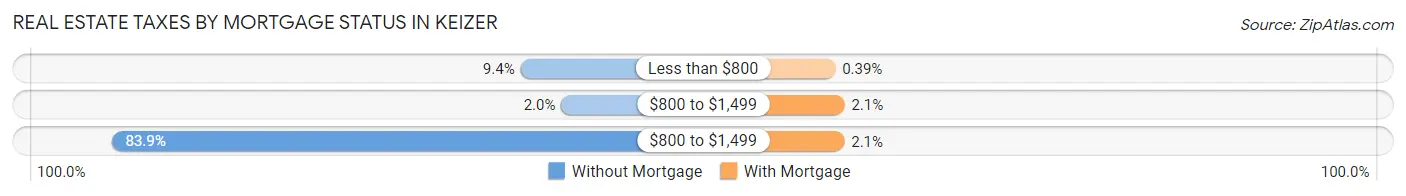
| Property Taxes | Without Mortgage | With Mortgage |
| Less than $800 | 235 (9.4%) | 25 (0.4%) |
| $800 to $1,499 | 49 (2.0%) | 134 (2.1%) |
| $800 to $1,499 | 2,091 (83.9%) | 132 (2.1%) |
| Total | 2,491 (100.0%) | 6,441 (100.0%) |
Health & Disability in Keizer
Health Insurance Coverage by Age in Keizer
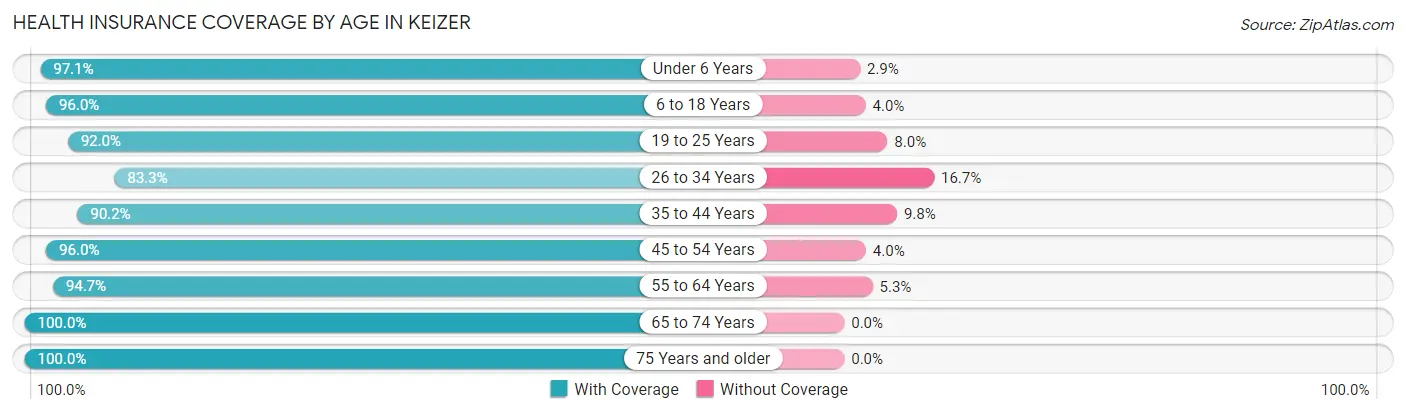
| Age Bracket | With Coverage | Without Coverage |
| Under 6 Years | 2,977 (97.1%) | 90 (2.9%) |
| 6 to 18 Years | 6,918 (96.0%) | 287 (4.0%) |
| 19 to 25 Years | 3,475 (92.0%) | 304 (8.0%) |
| 26 to 34 Years | 4,222 (83.3%) | 848 (16.7%) |
| 35 to 44 Years | 4,788 (90.2%) | 522 (9.8%) |
| 45 to 54 Years | 3,880 (96.0%) | 163 (4.0%) |
| 55 to 64 Years | 4,163 (94.7%) | 232 (5.3%) |
| 65 to 74 Years | 3,621 (100.0%) | 0 (0.0%) |
| 75 Years and older | 2,411 (100.0%) | 0 (0.0%) |
| Total | 36,455 (93.7%) | 2,446 (6.3%) |
Health Insurance Coverage by Citizenship Status in Keizer
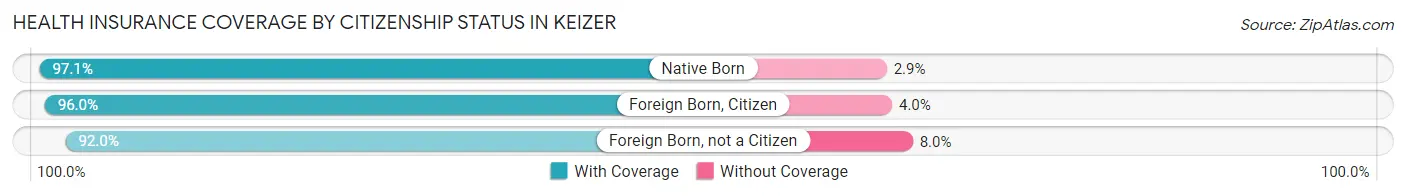
| Citizenship Status | With Coverage | Without Coverage |
| Native Born | 2,977 (97.1%) | 90 (2.9%) |
| Foreign Born, Citizen | 6,918 (96.0%) | 287 (4.0%) |
| Foreign Born, not a Citizen | 3,475 (92.0%) | 304 (8.0%) |
Health Insurance Coverage by Household Income in Keizer
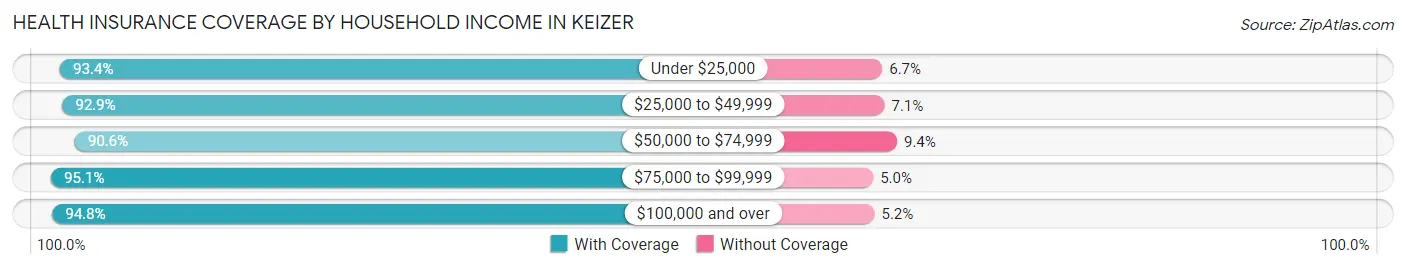
| Household Income | With Coverage | Without Coverage |
| Under $25,000 | 2,922 (93.3%) | 208 (6.7%) |
| $25,000 to $49,999 | 5,050 (92.9%) | 384 (7.1%) |
| $50,000 to $74,999 | 6,516 (90.6%) | 677 (9.4%) |
| $75,000 to $99,999 | 5,416 (95.1%) | 282 (5.0%) |
| $100,000 and over | 16,271 (94.8%) | 893 (5.2%) |
Public vs Private Health Insurance Coverage by Age in Keizer
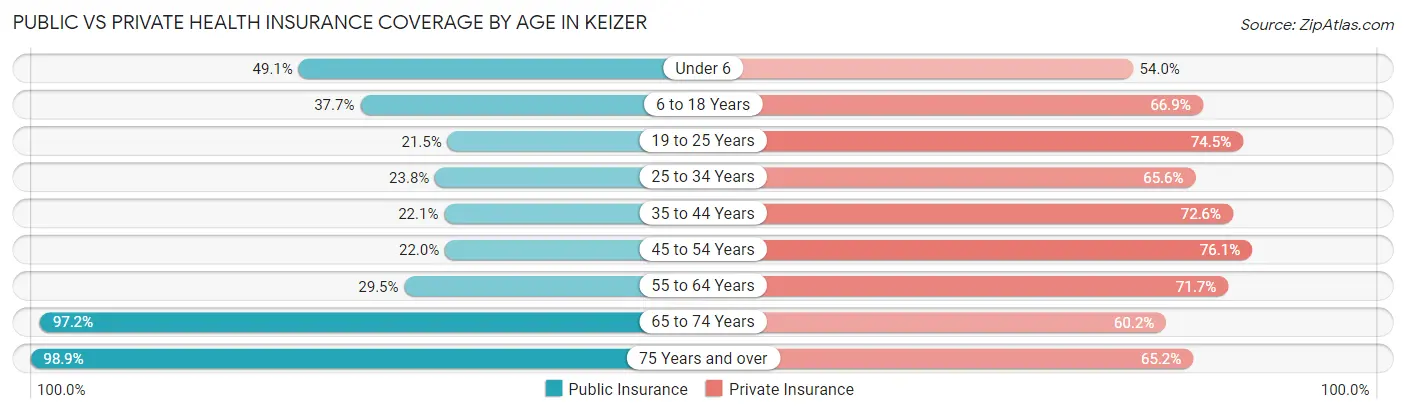
| Age Bracket | Public Insurance | Private Insurance |
| Under 6 | 1,507 (49.1%) | 1,656 (54.0%) |
| 6 to 18 Years | 2,716 (37.7%) | 4,823 (66.9%) |
| 19 to 25 Years | 812 (21.5%) | 2,814 (74.5%) |
| 25 to 34 Years | 1,206 (23.8%) | 3,326 (65.6%) |
| 35 to 44 Years | 1,174 (22.1%) | 3,854 (72.6%) |
| 45 to 54 Years | 888 (22.0%) | 3,078 (76.1%) |
| 55 to 64 Years | 1,297 (29.5%) | 3,151 (71.7%) |
| 65 to 74 Years | 3,518 (97.2%) | 2,180 (60.2%) |
| 75 Years and over | 2,385 (98.9%) | 1,572 (65.2%) |
| Total | 15,503 (39.9%) | 26,454 (68.0%) |
Disability Status by Sex by Age in Keizer
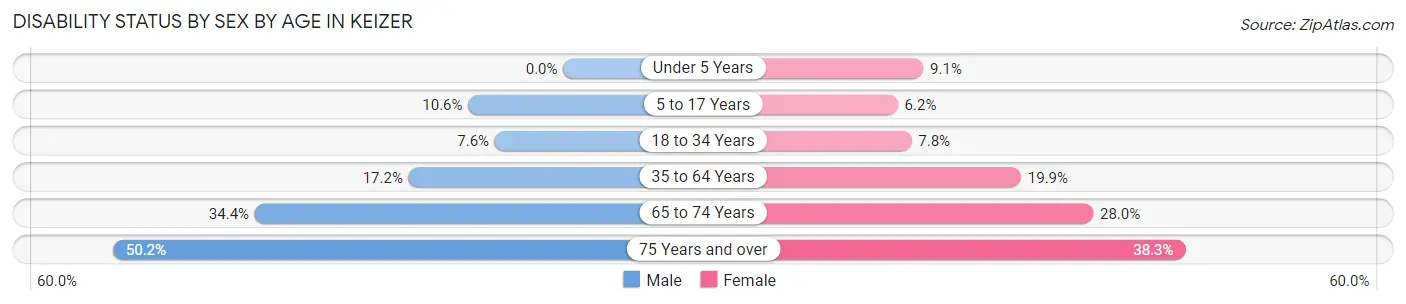
| Age Bracket | Male | Female |
| Under 5 Years | 0 (0.0%) | 162 (9.1%) |
| 5 to 17 Years | 381 (10.6%) | 215 (6.2%) |
| 18 to 34 Years | 317 (7.6%) | 405 (7.7%) |
| 35 to 64 Years | 1,149 (17.2%) | 1,411 (19.9%) |
| 65 to 74 Years | 576 (34.4%) | 544 (28.0%) |
| 75 Years and over | 449 (50.2%) | 580 (38.3%) |
Disability Class by Sex by Age in Keizer
Disability Class: Hearing Difficulty
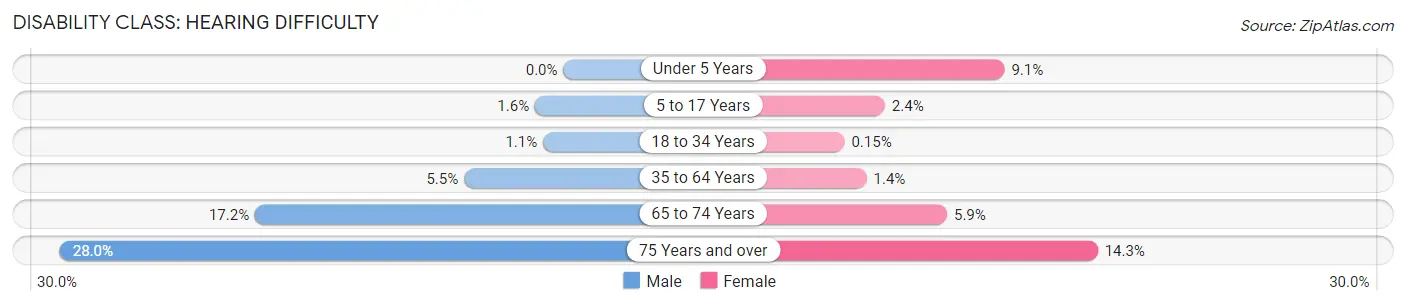
| Age Bracket | Male | Female |
| Under 5 Years | 0 (0.0%) | 162 (9.1%) |
| 5 to 17 Years | 57 (1.6%) | 83 (2.4%) |
| 18 to 34 Years | 47 (1.1%) | 8 (0.2%) |
| 35 to 64 Years | 369 (5.5%) | 98 (1.4%) |
| 65 to 74 Years | 288 (17.2%) | 114 (5.9%) |
| 75 Years and over | 251 (28.0%) | 216 (14.2%) |
Disability Class: Vision Difficulty
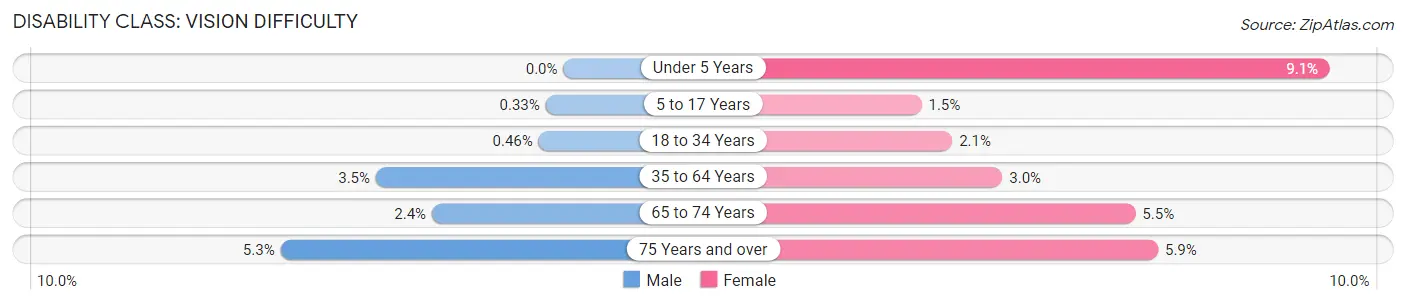
| Age Bracket | Male | Female |
| Under 5 Years | 0 (0.0%) | 162 (9.1%) |
| 5 to 17 Years | 12 (0.3%) | 51 (1.5%) |
| 18 to 34 Years | 19 (0.5%) | 107 (2.1%) |
| 35 to 64 Years | 232 (3.5%) | 211 (3.0%) |
| 65 to 74 Years | 41 (2.4%) | 106 (5.4%) |
| 75 Years and over | 47 (5.2%) | 89 (5.9%) |
Disability Class: Cognitive Difficulty
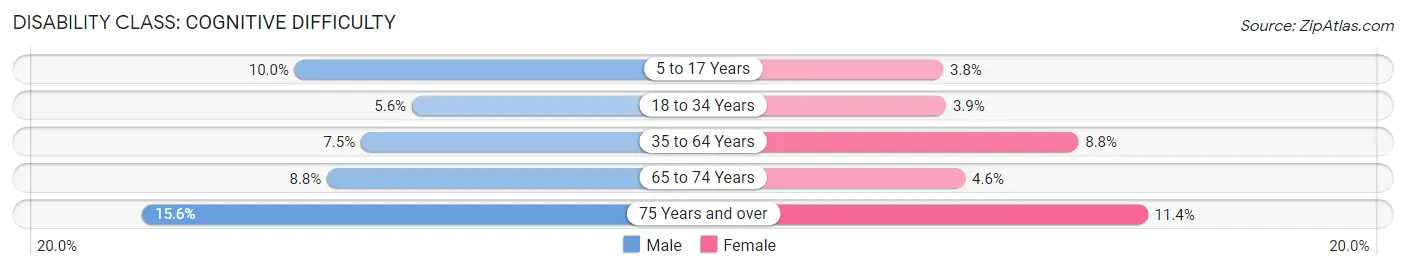
| Age Bracket | Male | Female |
| 5 to 17 Years | 359 (10.0%) | 130 (3.8%) |
| 18 to 34 Years | 234 (5.6%) | 202 (3.9%) |
| 35 to 64 Years | 501 (7.5%) | 621 (8.8%) |
| 65 to 74 Years | 147 (8.8%) | 89 (4.6%) |
| 75 Years and over | 140 (15.6%) | 172 (11.4%) |
Disability Class: Ambulatory Difficulty
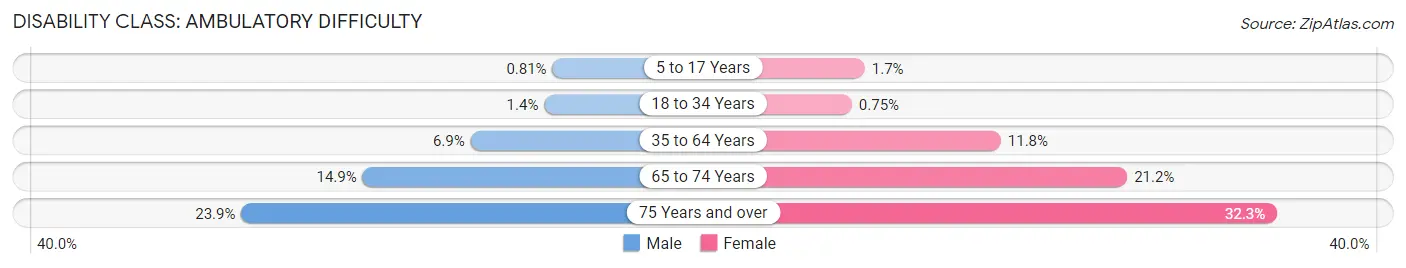
| Age Bracket | Male | Female |
| 5 to 17 Years | 29 (0.8%) | 59 (1.7%) |
| 18 to 34 Years | 59 (1.4%) | 39 (0.7%) |
| 35 to 64 Years | 460 (6.9%) | 836 (11.8%) |
| 65 to 74 Years | 250 (14.9%) | 412 (21.2%) |
| 75 Years and over | 214 (23.9%) | 490 (32.3%) |
Disability Class: Self-Care Difficulty
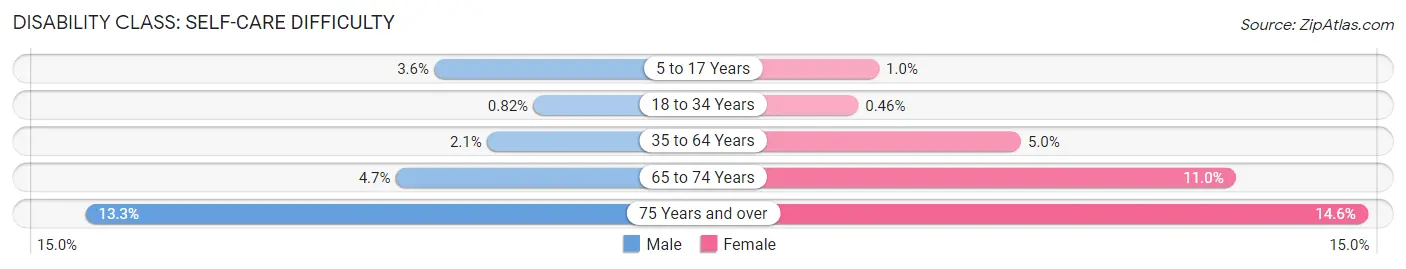
| Age Bracket | Male | Female |
| 5 to 17 Years | 129 (3.6%) | 36 (1.0%) |
| 18 to 34 Years | 34 (0.8%) | 24 (0.5%) |
| 35 to 64 Years | 141 (2.1%) | 353 (5.0%) |
| 65 to 74 Years | 78 (4.6%) | 213 (11.0%) |
| 75 Years and over | 119 (13.3%) | 222 (14.6%) |
Technology Access in Keizer
Computing Device Access in Keizer
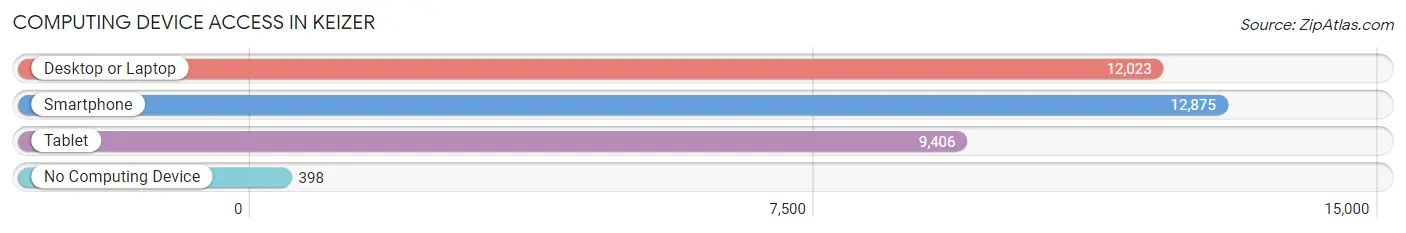
| Device Type | # Households | % Households |
| Desktop or Laptop | 12,023 | 85.1% |
| Smartphone | 12,875 | 91.1% |
| Tablet | 9,406 | 66.6% |
| No Computing Device | 398 | 2.8% |
| Total | 14,125 | 100.0% |
Internet Access in Keizer
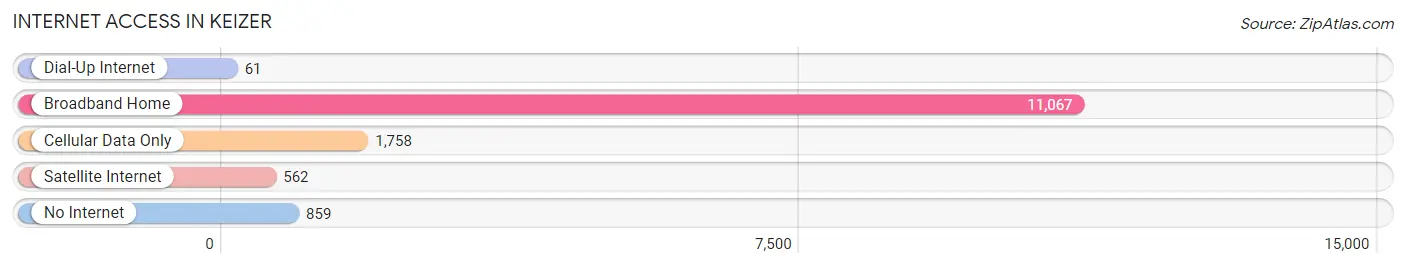
| Internet Type | # Households | % Households |
| Dial-Up Internet | 61 | 0.4% |
| Broadband Home | 11,067 | 78.3% |
| Cellular Data Only | 1,758 | 12.4% |
| Satellite Internet | 562 | 4.0% |
| No Internet | 859 | 6.1% |
| Total | 14,125 | 100.0% |
Keizer Summary
Keizer, Oregon is a city located in Marion County, Oregon, United States. It is located along the 45th parallel, about 45 miles (72 km) south of Portland. The population was 36,478 at the 2010 census, making it the second-largest city in the county after Salem, the state capital.
History
Keizer was founded in 1982 by a group of settlers led by William Keizur, who named the city after himself. The city was incorporated in 1982 and has since grown to become the second-largest city in Marion County.
Geography
Keizer is located at the confluence of the Willamette and Santiam Rivers, about 45 miles (72 km) south of Portland. The city is situated in the Willamette Valley, a fertile agricultural region. The city is bordered by the cities of Salem to the north, Woodburn to the east, and Gervais to the south.
The city has a total area of 8.3 square miles (21.5 km2), of which 8.2 square miles (21.3 km2) is land and 0.1 square miles (0.2 km2) is water.
Economy
Keizer is a major economic center in the Willamette Valley. The city is home to a variety of businesses, including manufacturing, retail, and service industries. The city is also home to several large employers, including the Oregon State Hospital, the Oregon Department of Corrections, and the Oregon State Penitentiary.
Demographics
As of the 2010 census, there were 36,478 people, 13,845 households, and 9,845 families residing in the city. The population density was 4,444.3 people per square mile (1,717.2/km2). There were 14,717 housing units at an average density of 1,785.3 per square mile (692.2/km2). The racial makeup of the city was 79.2% White, 1.2% African American, 0.9% Native American, 1.7% Asian, 0.2% Pacific Islander, 13.2% from other races, and 3.8% from two or more races. Hispanic or Latino of any race were 20.2% of the population.
The median income for a household in the city was $45,945, and the median income for a family was $54,945. Males had a median income of $41,945 versus $30,945 for females. The per capita income for the city was $21,945. About 8.2% of families and 11.2% of the population were below the poverty line, including 15.2% of those under age 18 and 6.2% of those age 65 or over.
Common Questions
What is the Total Population of Keizer?
Total Population of Keizer is 39,122.
What is the Total Male Population of Keizer?
Total Male Population of Keizer is 18,006.
What is the Total Female Population of Keizer?
Total Female Population of Keizer is 21,116.
What is the Ratio of Males per 100 Females in Keizer?
There are 85.27 Males per 100 Females in Keizer.
What is the Ratio of Females per 100 Males in Keizer?
There are 117.27 Females per 100 Males in Keizer.
What is the Median Population Age in Keizer?
Median Population Age in Keizer is 35.8 Years.
What is the Average Family Size in Keizer
Average Family Size in Keizer is 3.2 People.
What is the Average Household Size in Keizer
Average Household Size in Keizer is 2.7 People.
What is Per Capita Income in Keizer?
Per Capita income in Keizer is $33,561.
What is the Median Family Income in Keizer?
Median Family Income in Keizer is $89,069.
What is the Median Household income in Keizer?
Median Household Income in Keizer is $75,753.
What is Income or Wage Gap in Keizer?
Income or Wage Gap in Keizer is 31.2%.
Women in Keizer earn 68.8 cents for every dollar earned by a man.
What is Family Income Deficit in Keizer?
Family Income Deficit in Keizer is $9,417.
Families that are below poverty line in Keizer earn $9,417 less on average than the poverty threshold level.
What is Inequality or Gini Index in Keizer?
Inequality or Gini Index in Keizer is 0.38.
How Large is the Labor Force in Keizer?
There are 19,441 People in the Labor Forcein in Keizer.
What is the Percentage of People in the Labor Force in Keizer?
63.9% of People are in the Labor Force in Keizer.
What is the Unemployment Rate in Keizer?
Unemployment Rate in Keizer is 4.6%.