Cedar Mill, OR
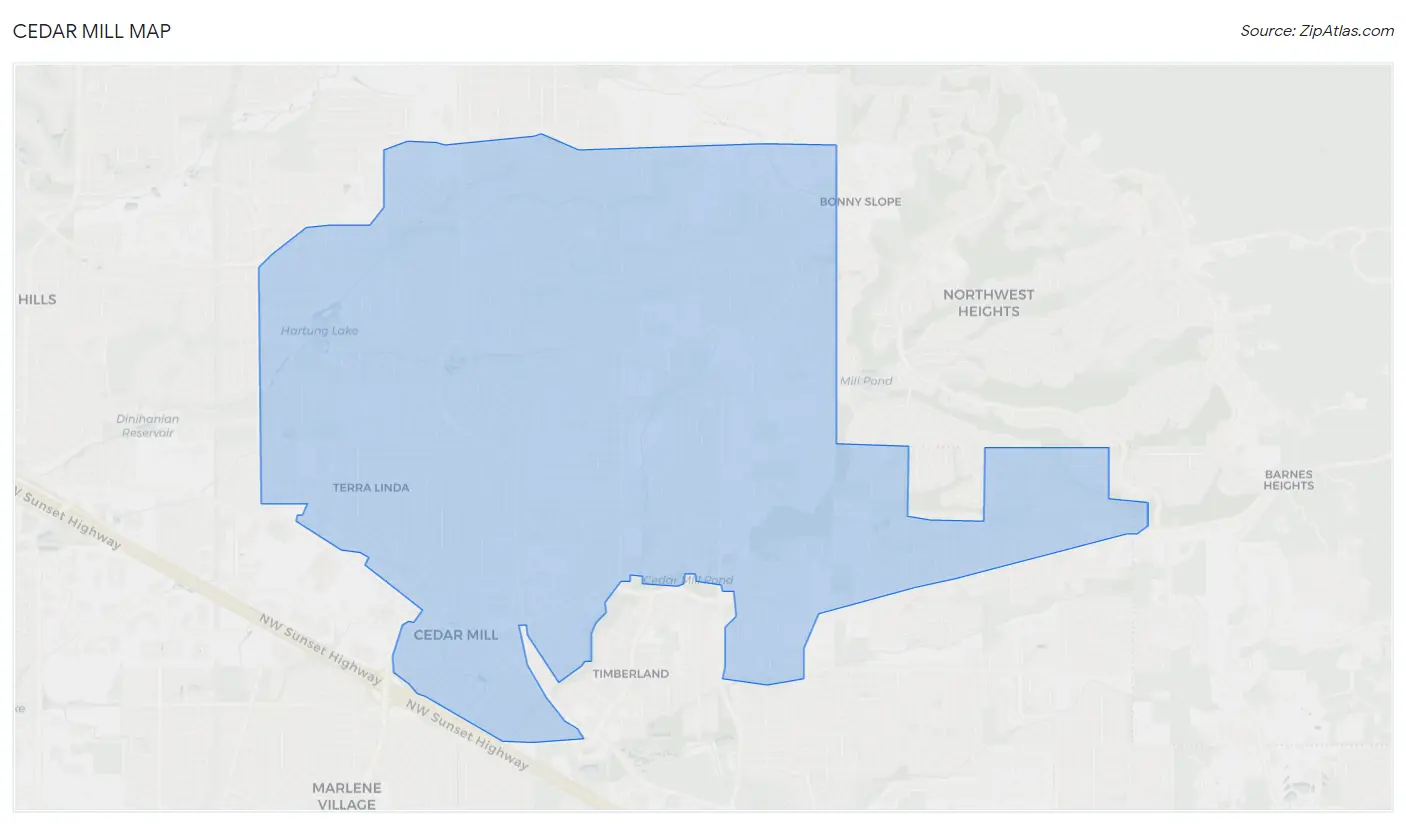
Cedar Mill Map
Cedar Mill Overview
19,151
TOTAL POPULATION
9,576
MALE POPULATION
9,575
FEMALE POPULATION
100.01
MALES / 100 FEMALES
99.99
FEMALES / 100 MALES
38.3
MEDIAN AGE
3.4
AVG FAMILY SIZE
2.9
AVG HOUSEHOLD SIZE
$76,372
PER CAPITA INCOME
$208,787
AVG FAMILY INCOME
$165,184
AVG HOUSEHOLD INCOME
45.8%
WAGE / INCOME GAP [ % ]
54.2¢/ $1
WAGE / INCOME GAP [ $ ]
0.50
INEQUALITY / GINI INDEX
9,782
LABOR FORCE [ PEOPLE ]
69.1%
PERCENT IN LABOR FORCE
6.8%
UNEMPLOYMENT RATE
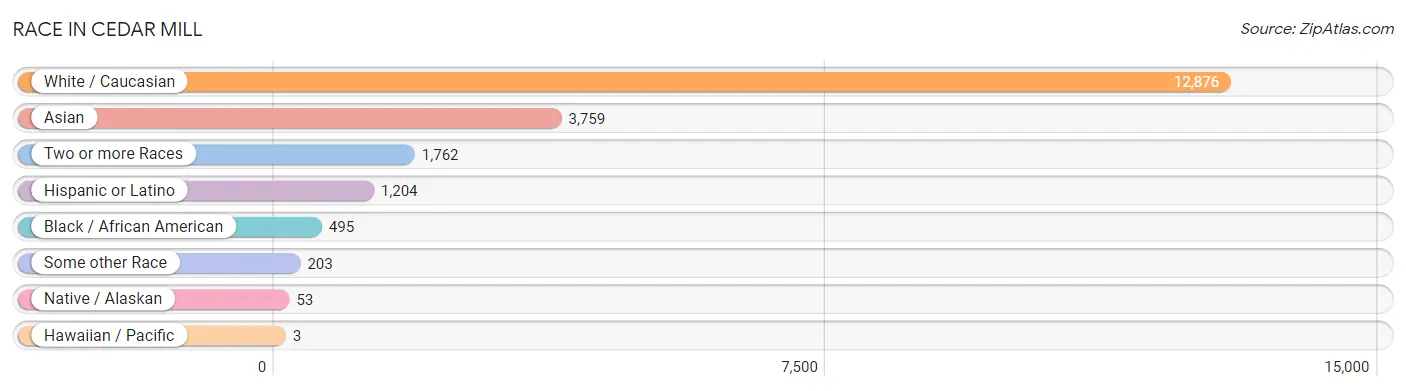
Race in Cedar Mill
The most populous races in Cedar Mill are White / Caucasian (12,876 | 67.2%), Asian (3,759 | 19.6%), and Two or more Races (1,762 | 9.2%).
| Race | # Population | % Population |
| Asian | 3,759 | 19.6% |
| Black / African American | 495 | 2.6% |
| Hawaiian / Pacific | 3 | 0.0% |
| Hispanic or Latino | 1,204 | 6.3% |
| Native / Alaskan | 53 | 0.3% |
| White / Caucasian | 12,876 | 67.2% |
| Two or more Races | 1,762 | 9.2% |
| Some other Race | 203 | 1.1% |
| Total | 19,151 | 100.0% |
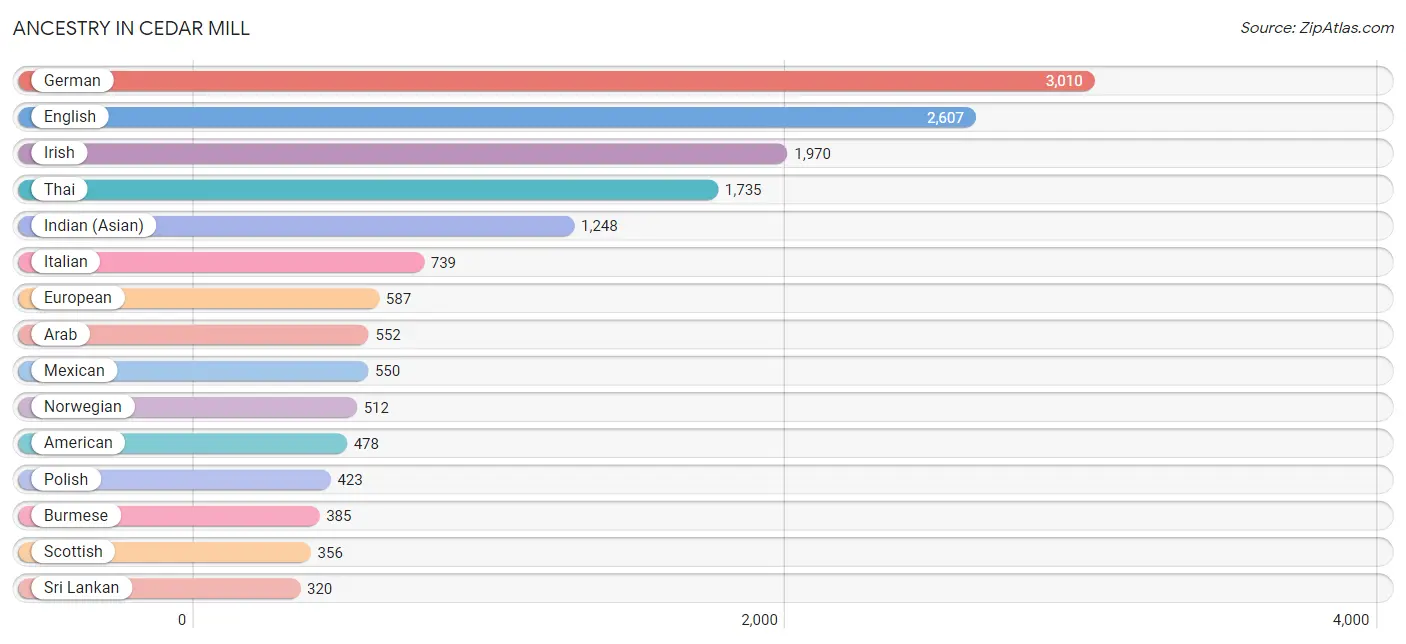
Ancestry in Cedar Mill
The most populous ancestries reported in Cedar Mill are German (3,010 | 15.7%), English (2,607 | 13.6%), Irish (1,970 | 10.3%), Thai (1,735 | 9.1%), and Indian (Asian) (1,248 | 6.5%), together accounting for 55.2% of all Cedar Mill residents.
| Ancestry | # Population | % Population |
| African | 3 | 0.0% |
| American | 478 | 2.5% |
| Arab | 552 | 2.9% |
| Austrian | 34 | 0.2% |
| Bangladeshi | 10 | 0.1% |
| Belgian | 45 | 0.2% |
| Bhutanese | 296 | 1.5% |
| Brazilian | 9 | 0.1% |
| British | 211 | 1.1% |
| Burmese | 385 | 2.0% |
| Canadian | 121 | 0.6% |
| Central American | 93 | 0.5% |
| Cherokee | 14 | 0.1% |
| Chippewa | 5 | 0.0% |
| Colombian | 35 | 0.2% |
| Costa Rican | 15 | 0.1% |
| Cuban | 33 | 0.2% |
| Czech | 71 | 0.4% |
| Danish | 194 | 1.0% |
| Dominican | 43 | 0.2% |
| Dutch | 264 | 1.4% |
| Eastern European | 61 | 0.3% |
| Egyptian | 34 | 0.2% |
| English | 2,607 | 13.6% |
| European | 587 | 3.1% |
| Filipino | 211 | 1.1% |
| Finnish | 13 | 0.1% |
| French | 294 | 1.5% |
| French Canadian | 46 | 0.2% |
| German | 3,010 | 15.7% |
| Greek | 162 | 0.9% |
| Guatemalan | 78 | 0.4% |
| Hungarian | 125 | 0.6% |
| Indian (Asian) | 1,248 | 6.5% |
| Iranian | 84 | 0.4% |
| Irish | 1,970 | 10.3% |
| Italian | 739 | 3.9% |
| Japanese | 19 | 0.1% |
| Kenyan | 79 | 0.4% |
| Korean | 213 | 1.1% |
| Lebanese | 211 | 1.1% |
| Lithuanian | 227 | 1.2% |
| Mexican | 550 | 2.9% |
| Native Hawaiian | 59 | 0.3% |
| Navajo | 34 | 0.2% |
| New Zealander | 94 | 0.5% |
| Nigerian | 18 | 0.1% |
| Northern European | 40 | 0.2% |
| Norwegian | 512 | 2.7% |
| Pakistani | 22 | 0.1% |
| Pennsylvania German | 14 | 0.1% |
| Peruvian | 10 | 0.1% |
| Polish | 423 | 2.2% |
| Portuguese | 37 | 0.2% |
| Puerto Rican | 140 | 0.7% |
| Russian | 89 | 0.5% |
| Samoan | 21 | 0.1% |
| Scandinavian | 177 | 0.9% |
| Scotch-Irish | 92 | 0.5% |
| Scottish | 356 | 1.9% |
| Slovak | 27 | 0.1% |
| Slovene | 33 | 0.2% |
| South African | 9 | 0.1% |
| South American | 45 | 0.2% |
| Spaniard | 199 | 1.0% |
| Spanish | 57 | 0.3% |
| Sri Lankan | 320 | 1.7% |
| Subsaharan African | 126 | 0.7% |
| Swedish | 161 | 0.8% |
| Swiss | 83 | 0.4% |
| Thai | 1,735 | 9.1% |
| Turkish | 9 | 0.1% |
| Ukrainian | 19 | 0.1% |
| Vietnamese | 18 | 0.1% |
| Welsh | 103 | 0.5% |
| Yugoslavian | 31 | 0.2% | View All 76 Rows |
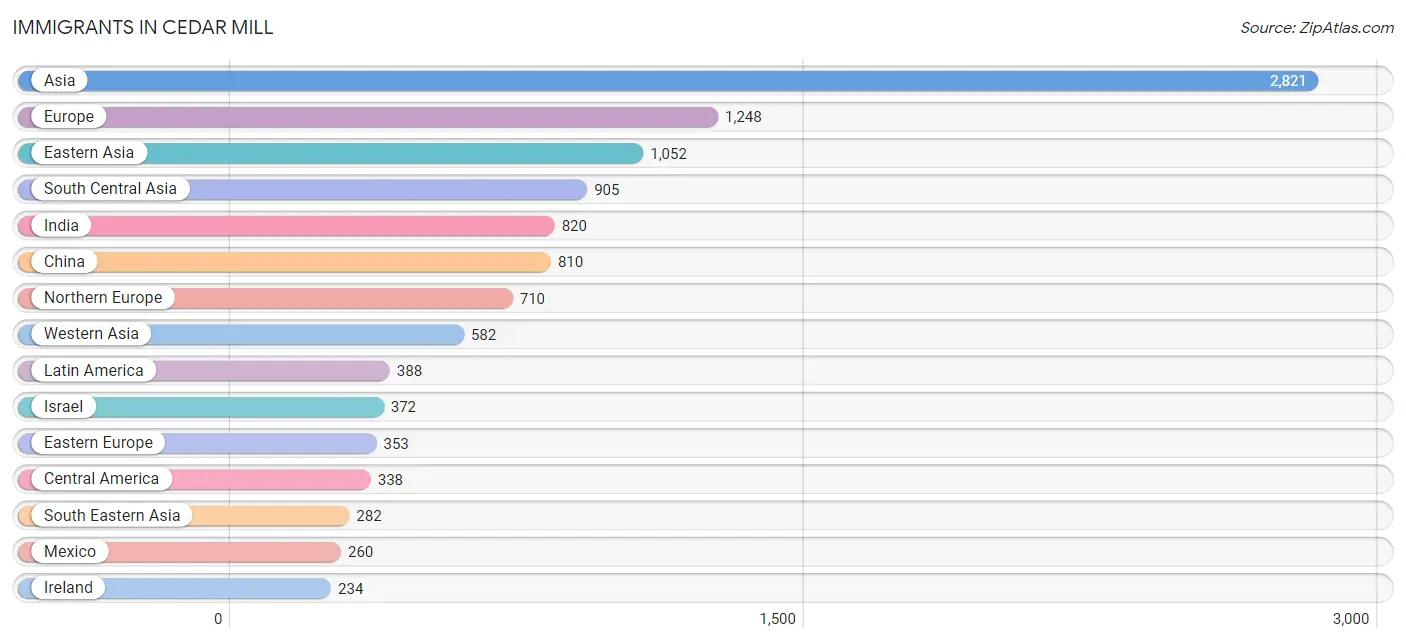
Immigrants in Cedar Mill
The most numerous immigrant groups reported in Cedar Mill came from Asia (2,821 | 14.7%), Europe (1,248 | 6.5%), Eastern Asia (1,052 | 5.5%), South Central Asia (905 | 4.7%), and India (820 | 4.3%), together accounting for 35.7% of all Cedar Mill residents.
| Immigration Origin | # Population | % Population |
| Africa | 141 | 0.7% |
| Asia | 2,821 | 14.7% |
| Australia | 31 | 0.2% |
| Bangladesh | 6 | 0.0% |
| Belarus | 19 | 0.1% |
| Belgium | 30 | 0.2% |
| Brazil | 25 | 0.1% |
| Canada | 82 | 0.4% |
| Central America | 338 | 1.8% |
| China | 810 | 4.2% |
| Czechoslovakia | 17 | 0.1% |
| Denmark | 15 | 0.1% |
| Eastern Africa | 79 | 0.4% |
| Eastern Asia | 1,052 | 5.5% |
| Eastern Europe | 353 | 1.8% |
| Egypt | 15 | 0.1% |
| England | 146 | 0.8% |
| Europe | 1,248 | 6.5% |
| France | 11 | 0.1% |
| Germany | 109 | 0.6% |
| Guatemala | 78 | 0.4% |
| Hong Kong | 93 | 0.5% |
| Hungary | 18 | 0.1% |
| India | 820 | 4.3% |
| Iran | 43 | 0.2% |
| Ireland | 234 | 1.2% |
| Israel | 372 | 1.9% |
| Japan | 33 | 0.2% |
| Jordan | 175 | 0.9% |
| Kenya | 79 | 0.4% |
| Korea | 209 | 1.1% |
| Kuwait | 8 | 0.0% |
| Latin America | 388 | 2.0% |
| Lithuania | 214 | 1.1% |
| Mexico | 260 | 1.4% |
| Moldova | 18 | 0.1% |
| Nepal | 18 | 0.1% |
| Netherlands | 30 | 0.2% |
| Northern Africa | 15 | 0.1% |
| Northern Europe | 710 | 3.7% |
| Oceania | 54 | 0.3% |
| Peru | 25 | 0.1% |
| Philippines | 94 | 0.5% |
| Poland | 17 | 0.1% |
| Russia | 31 | 0.2% |
| South Africa | 44 | 0.2% |
| South America | 50 | 0.3% |
| South Central Asia | 905 | 4.7% |
| South Eastern Asia | 282 | 1.5% |
| Sri Lanka | 18 | 0.1% |
| Sweden | 16 | 0.1% |
| Switzerland | 5 | 0.0% |
| Taiwan | 121 | 0.6% |
| Thailand | 21 | 0.1% |
| Turkey | 9 | 0.1% |
| Ukraine | 19 | 0.1% |
| Vietnam | 167 | 0.9% |
| Western Africa | 3 | 0.0% |
| Western Asia | 582 | 3.0% |
| Western Europe | 185 | 1.0% |
| Yemen | 18 | 0.1% | View All 61 Rows |
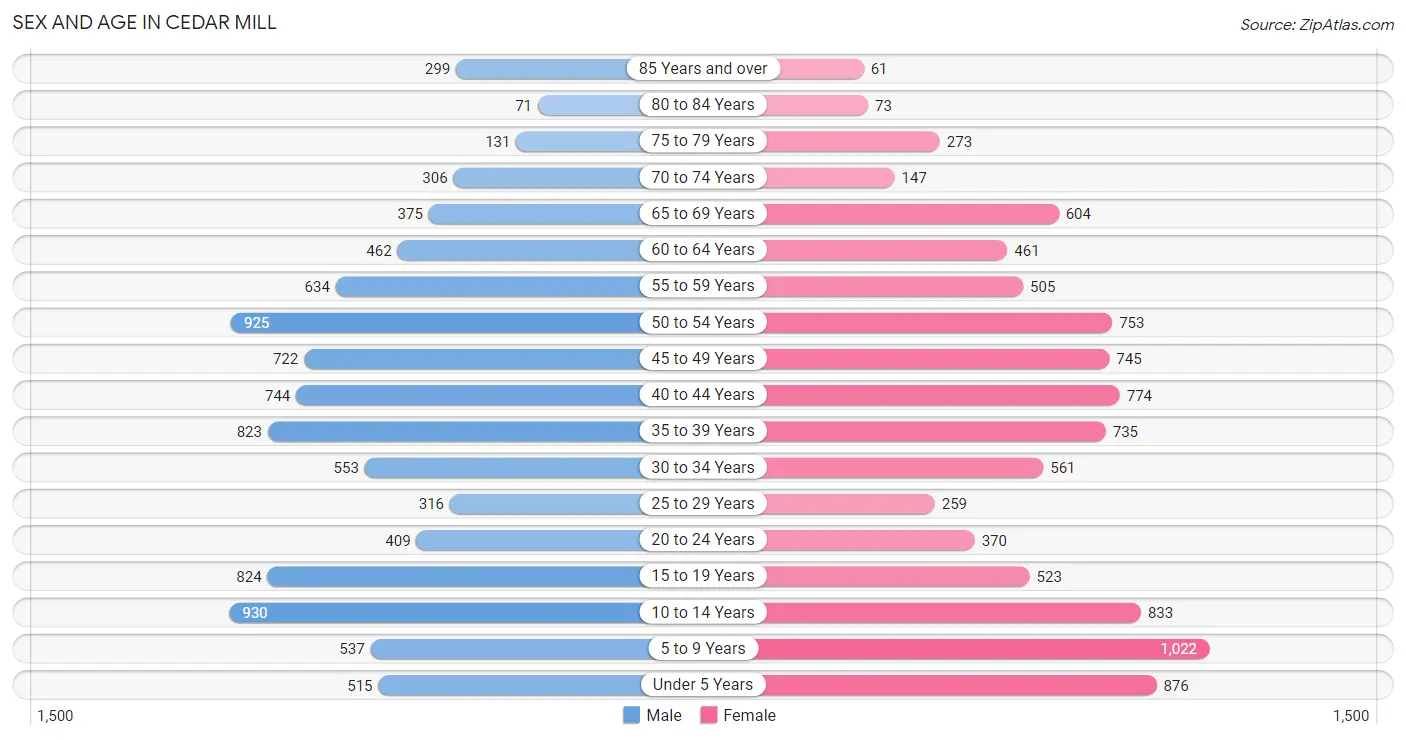
Sex and Age in Cedar Mill
Sex and Age in Cedar Mill
The most populous age groups in Cedar Mill are 10 to 14 Years (930 | 9.7%) for men and 5 to 9 Years (1,022 | 10.7%) for women.
| Age Bracket | Male | Female |
| Under 5 Years | 515 (5.4%) | 876 (9.1%) |
| 5 to 9 Years | 537 (5.6%) | 1,022 (10.7%) |
| 10 to 14 Years | 930 (9.7%) | 833 (8.7%) |
| 15 to 19 Years | 824 (8.6%) | 523 (5.5%) |
| 20 to 24 Years | 409 (4.3%) | 370 (3.9%) |
| 25 to 29 Years | 316 (3.3%) | 259 (2.7%) |
| 30 to 34 Years | 553 (5.8%) | 561 (5.9%) |
| 35 to 39 Years | 823 (8.6%) | 735 (7.7%) |
| 40 to 44 Years | 744 (7.8%) | 774 (8.1%) |
| 45 to 49 Years | 722 (7.5%) | 745 (7.8%) |
| 50 to 54 Years | 925 (9.7%) | 753 (7.9%) |
| 55 to 59 Years | 634 (6.6%) | 505 (5.3%) |
| 60 to 64 Years | 462 (4.8%) | 461 (4.8%) |
| 65 to 69 Years | 375 (3.9%) | 604 (6.3%) |
| 70 to 74 Years | 306 (3.2%) | 147 (1.5%) |
| 75 to 79 Years | 131 (1.4%) | 273 (2.9%) |
| 80 to 84 Years | 71 (0.7%) | 73 (0.8%) |
| 85 Years and over | 299 (3.1%) | 61 (0.6%) |
| Total | 9,576 (100.0%) | 9,575 (100.0%) |
Families and Households in Cedar Mill
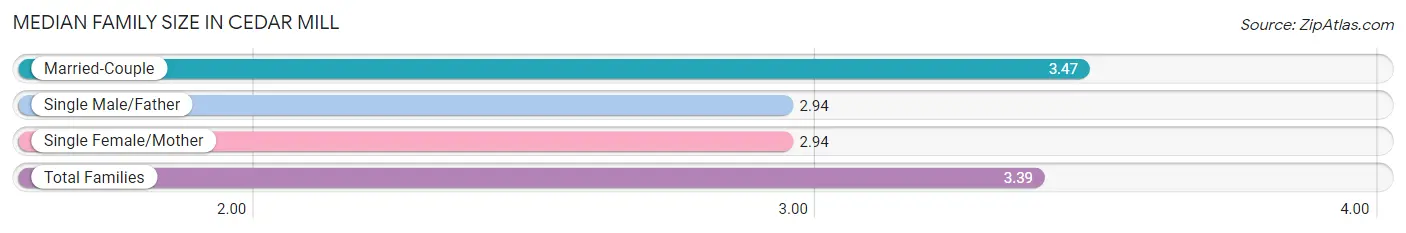
Median Family Size in Cedar Mill
The median family size in Cedar Mill is 3.39 persons per family, with married-couple families (4,142 | 84.5%) accounting for the largest median family size of 3.47 persons per family. On the other hand, single male/father families (232 | 4.7%) represent the smallest median family size with 2.94 persons per family.
| Family Type | # Families | Family Size |
| Married-Couple | 4,142 (84.5%) | 3.47 |
| Single Male/Father | 232 (4.7%) | 2.94 |
| Single Female/Mother | 529 (10.8%) | 2.94 |
| Total Families | 4,903 (100.0%) | 3.39 |
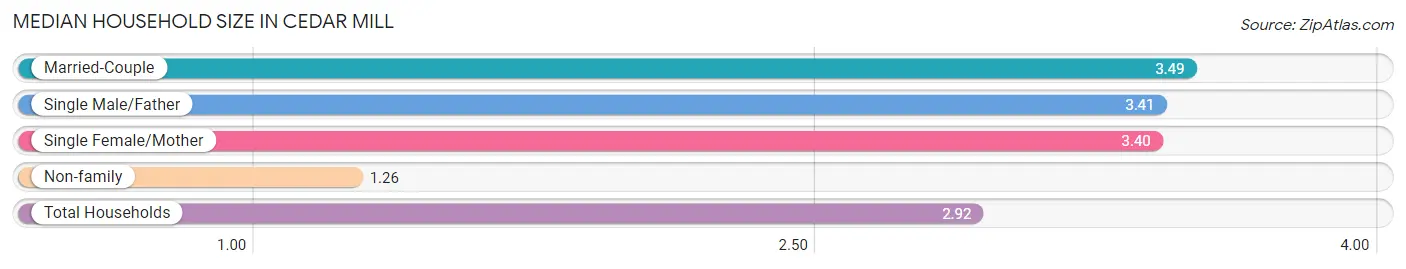
Median Household Size in Cedar Mill
The median household size in Cedar Mill is 2.92 persons per household, with married-couple households (4,142 | 63.2%) accounting for the largest median household size of 3.49 persons per household. non-family households (1,652 | 25.2%) represent the smallest median household size with 1.26 persons per household.
| Household Type | # Households | Household Size |
| Married-Couple | 4,142 (63.2%) | 3.49 |
| Single Male/Father | 232 (3.5%) | 3.41 |
| Single Female/Mother | 529 (8.1%) | 3.40 |
| Non-family | 1,652 (25.2%) | 1.26 |
| Total Households | 6,555 (100.0%) | 2.92 |
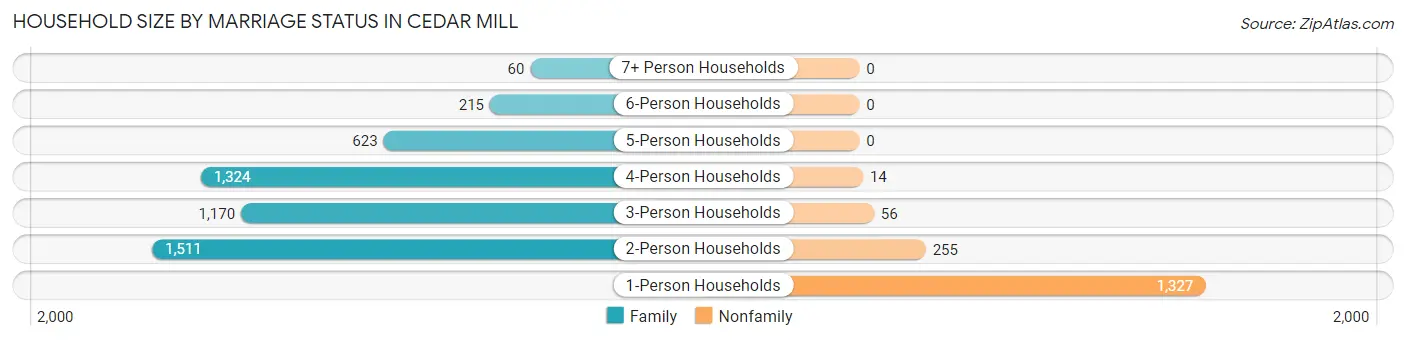
Household Size by Marriage Status in Cedar Mill
Out of a total of 6,555 households in Cedar Mill, 4,903 (74.8%) are family households, while 1,652 (25.2%) are nonfamily households. The most numerous type of family households are 2-person households, comprising 1,511, and the most common type of nonfamily households are 1-person households, comprising 1,327.
| Household Size | Family Households | Nonfamily Households |
| 1-Person Households | - | 1,327 (20.2%) |
| 2-Person Households | 1,511 (23.1%) | 255 (3.9%) |
| 3-Person Households | 1,170 (17.8%) | 56 (0.9%) |
| 4-Person Households | 1,324 (20.2%) | 14 (0.2%) |
| 5-Person Households | 623 (9.5%) | 0 (0.0%) |
| 6-Person Households | 215 (3.3%) | 0 (0.0%) |
| 7+ Person Households | 60 (0.9%) | 0 (0.0%) |
| Total | 4,903 (74.8%) | 1,652 (25.2%) |
Female Fertility in Cedar Mill
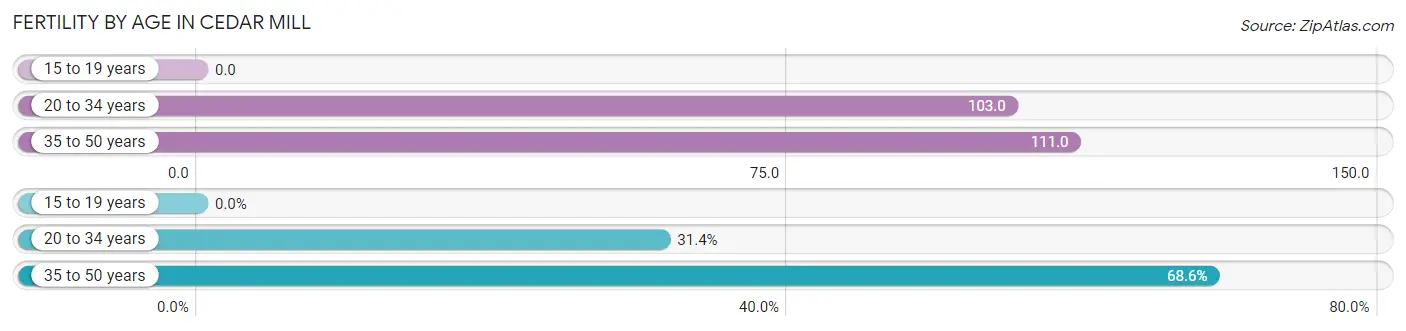
Fertility by Age in Cedar Mill
Average fertility rate in Cedar Mill is 95.0 births per 1,000 women. Women in the age bracket of 35 to 50 years have the highest fertility rate with 111.0 births per 1,000 women. Women in the age bracket of 35 to 50 years acount for 68.6% of all women with births.
| Age Bracket | Women with Births | Births / 1,000 Women |
| 15 to 19 years | 0 (0.0%) | 0.0 |
| 20 to 34 years | 123 (31.4%) | 103.0 |
| 35 to 50 years | 269 (68.6%) | 111.0 |
| Total | 392 (100.0%) | 95.0 |
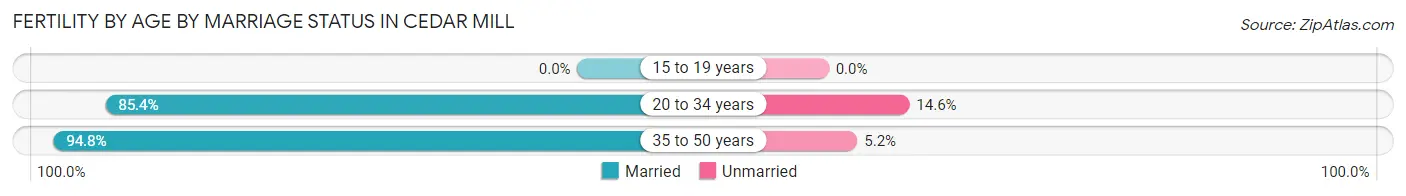
Fertility by Age by Marriage Status in Cedar Mill
91.8% of women with births (392) in Cedar Mill are married. The highest percentage of unmarried women with births falls into 20 to 34 years age bracket with 14.6% of them unmarried at the time of birth, while the lowest percentage of unmarried women with births belong to 35 to 50 years age bracket with 5.2% of them unmarried.
| Age Bracket | Married | Unmarried |
| 15 to 19 years | 0 (0.0%) | 0 (0.0%) |
| 20 to 34 years | 105 (85.4%) | 18 (14.6%) |
| 35 to 50 years | 255 (94.8%) | 14 (5.2%) |
| Total | 360 (91.8%) | 32 (8.2%) |
Fertility by Education in Cedar Mill
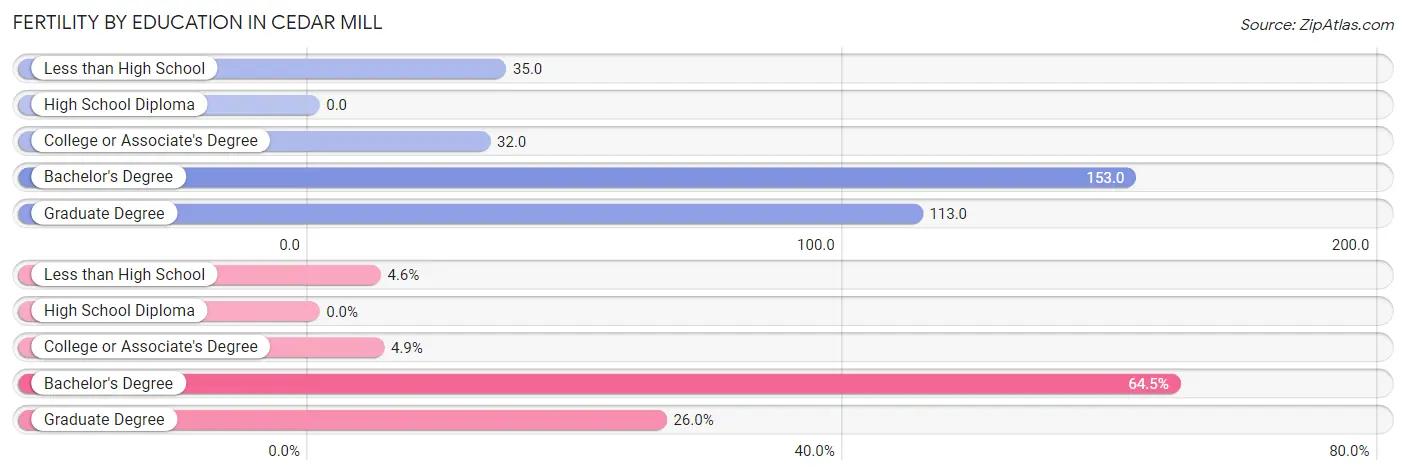
| Educational Attainment | Women with Births | Births / 1,000 Women |
| Less than High School | 18 (4.6%) | 35.0 |
| High School Diploma | 0 (0.0%) | 0.0 |
| College or Associate's Degree | 19 (4.9%) | 32.0 |
| Bachelor's Degree | 253 (64.5%) | 153.0 |
| Graduate Degree | 102 (26.0%) | 113.0 |
| Total | 392 (100.0%) | 95.0 |
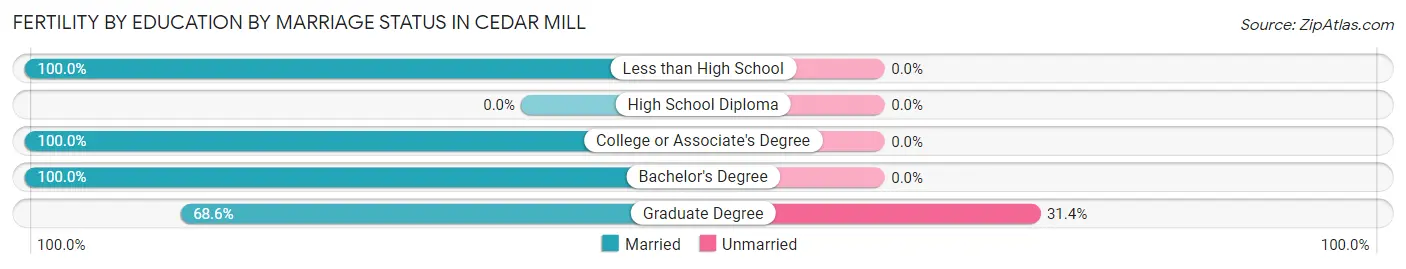
Fertility by Education by Marriage Status in Cedar Mill
8.2% of women with births in Cedar Mill are unmarried. Women with the educational attainment of less than high school are most likely to be married with 100.0% of them married at childbirth, while women with the educational attainment of graduate degree are least likely to be married with 31.4% of them unmarried at childbirth.
| Educational Attainment | Married | Unmarried |
| Less than High School | 18 (100.0%) | 0 (0.0%) |
| High School Diploma | 0 (0.0%) | 0 (0.0%) |
| College or Associate's Degree | 19 (100.0%) | 0 (0.0%) |
| Bachelor's Degree | 253 (100.0%) | 0 (0.0%) |
| Graduate Degree | 70 (68.6%) | 32 (31.4%) |
| Total | 360 (91.8%) | 32 (8.2%) |
Income in Cedar Mill
Income Overview in Cedar Mill
Per Capita Income in Cedar Mill is $76,372, while median incomes of families and households are $208,787 and $165,184 respectively.
| Characteristic | Number | Measure |
| Per Capita Income | 19,151 | $76,372 |
| Median Family Income | 4,903 | $208,787 |
| Mean Family Income | 4,903 | $261,523 |
| Median Household Income | 6,555 | $165,184 |
| Mean Household Income | 6,555 | $220,736 |
| Income Deficit | 4,903 | $0 |
| Wage / Income Gap (%) | 19,151 | 45.82% |
| Wage / Income Gap ($) | 19,151 | 54.18¢ per $1 |
| Gini / Inequality Index | 19,151 | 0.50 |
Earnings by Sex in Cedar Mill
Average Earnings in Cedar Mill are $73,960, $105,207 for men and $56,998 for women, a difference of 45.8%.
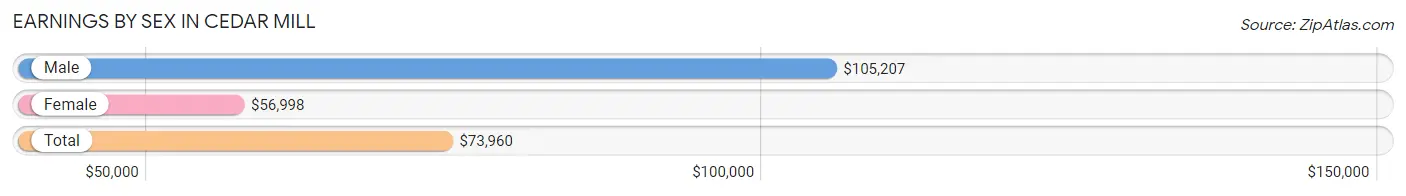
| Sex | Number | Average Earnings |
| Male | 5,626 (56.7%) | $105,207 |
| Female | 4,305 (43.3%) | $56,998 |
| Total | 9,931 (100.0%) | $73,960 |
Earnings by Sex by Income Bracket in Cedar Mill
The most common earnings brackets in Cedar Mill are $100,000+ for men (2,909 | 51.7%) and $100,000+ for women (1,490 | 34.6%).
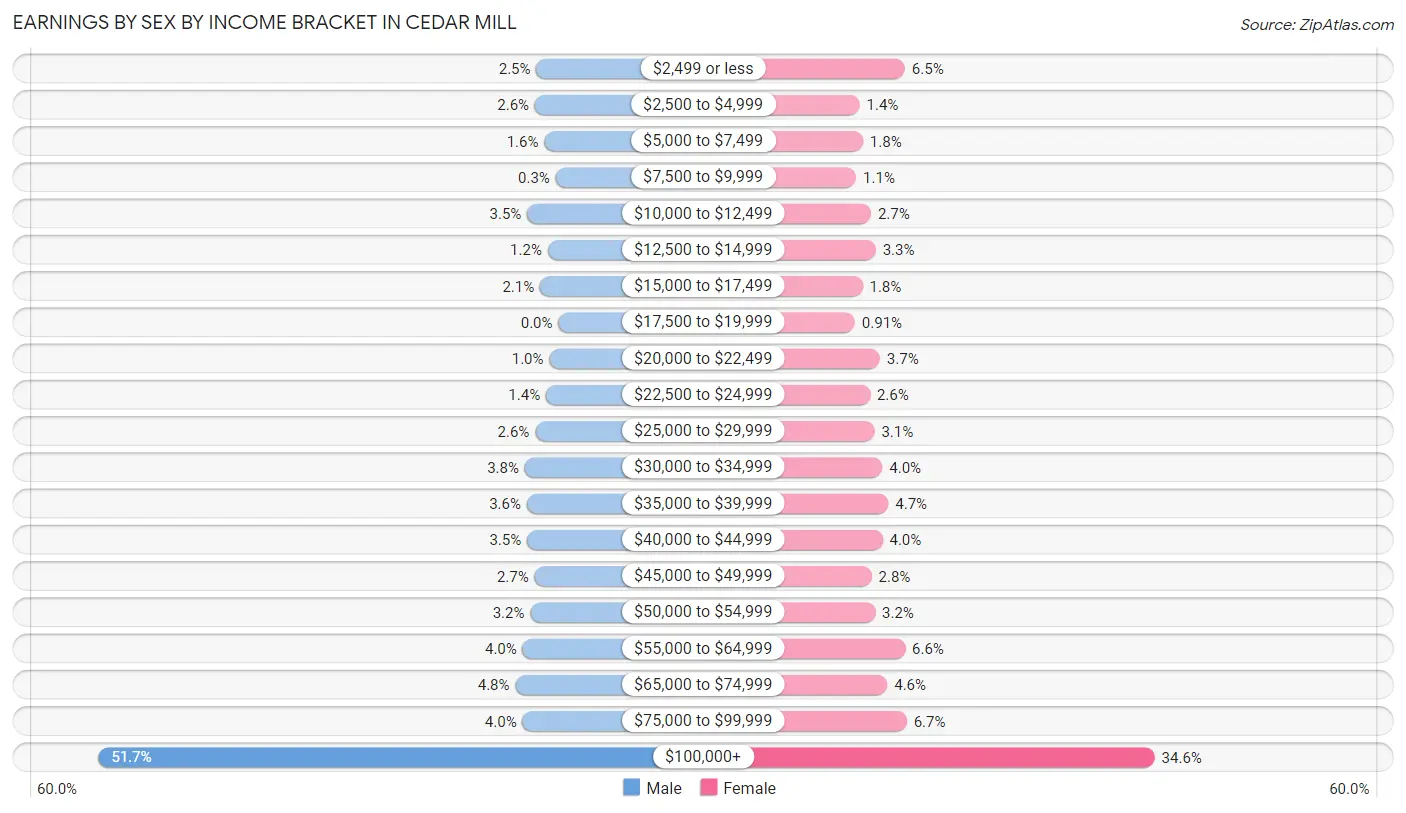
| Income | Male | Female |
| $2,499 or less | 139 (2.5%) | 281 (6.5%) |
| $2,500 to $4,999 | 148 (2.6%) | 62 (1.4%) |
| $5,000 to $7,499 | 89 (1.6%) | 78 (1.8%) |
| $7,500 to $9,999 | 17 (0.3%) | 45 (1.1%) |
| $10,000 to $12,499 | 197 (3.5%) | 117 (2.7%) |
| $12,500 to $14,999 | 67 (1.2%) | 140 (3.3%) |
| $15,000 to $17,499 | 116 (2.1%) | 76 (1.8%) |
| $17,500 to $19,999 | 0 (0.0%) | 39 (0.9%) |
| $20,000 to $22,499 | 57 (1.0%) | 160 (3.7%) |
| $22,500 to $24,999 | 78 (1.4%) | 112 (2.6%) |
| $25,000 to $29,999 | 146 (2.6%) | 134 (3.1%) |
| $30,000 to $34,999 | 212 (3.8%) | 172 (4.0%) |
| $35,000 to $39,999 | 200 (3.5%) | 201 (4.7%) |
| $40,000 to $44,999 | 198 (3.5%) | 173 (4.0%) |
| $45,000 to $49,999 | 151 (2.7%) | 120 (2.8%) |
| $50,000 to $54,999 | 177 (3.2%) | 137 (3.2%) |
| $55,000 to $64,999 | 226 (4.0%) | 282 (6.6%) |
| $65,000 to $74,999 | 272 (4.8%) | 196 (4.5%) |
| $75,000 to $99,999 | 227 (4.0%) | 290 (6.7%) |
| $100,000+ | 2,909 (51.7%) | 1,490 (34.6%) |
| Total | 5,626 (100.0%) | 4,305 (100.0%) |
Earnings by Sex by Educational Attainment in Cedar Mill
Average earnings in Cedar Mill are $117,864 for men and $70,299 for women, a difference of 40.4%. Men with an educational attainment of graduate degree enjoy the highest average annual earnings of $164,565, while those with less than high school education earn the least with $32,830. Women with an educational attainment of graduate degree earn the most with the average annual earnings of $133,967, while those with less than high school education have the smallest earnings of $11,987.
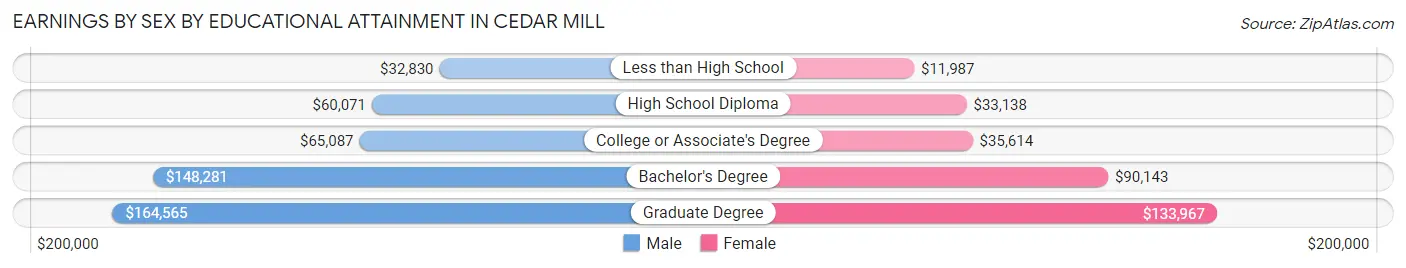
| Educational Attainment | Male Income | Female Income |
| Less than High School | $32,830 | $11,987 |
| High School Diploma | $60,071 | $33,138 |
| College or Associate's Degree | $65,087 | $35,614 |
| Bachelor's Degree | $148,281 | $90,143 |
| Graduate Degree | $164,565 | $133,967 |
| Total | $117,864 | $70,299 |
Family Income in Cedar Mill
Family Income Brackets in Cedar Mill
According to the Cedar Mill family income data, there are 2,564 families falling into the $200,000+ income range, which is the most common income bracket and makes up 52.3% of all families. Conversely, the $10,000 to $14,999 income bracket is the least frequent group with only 5 families (0.1%) belonging to this category.
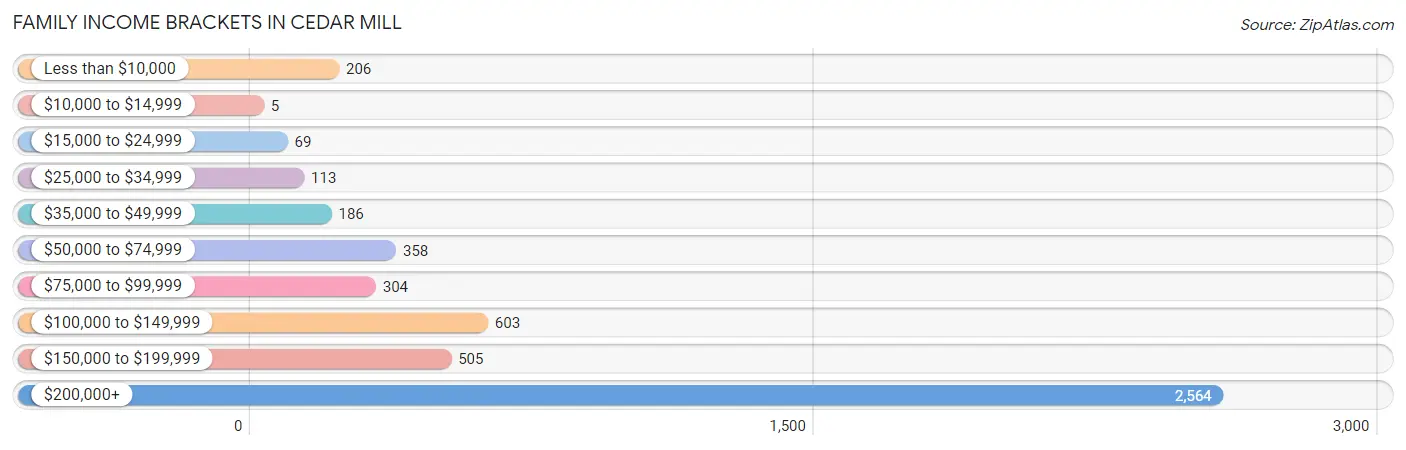
| Income Bracket | # Families | % Families |
| Less than $10,000 | 206 | 4.2% |
| $10,000 to $14,999 | 5 | 0.1% |
| $15,000 to $24,999 | 69 | 1.4% |
| $25,000 to $34,999 | 113 | 2.3% |
| $35,000 to $49,999 | 186 | 3.8% |
| $50,000 to $74,999 | 358 | 7.3% |
| $75,000 to $99,999 | 304 | 6.2% |
| $100,000 to $149,999 | 603 | 12.3% |
| $150,000 to $199,999 | 505 | 10.3% |
| $200,000+ | 2,564 | 52.3% |
Family Income by Famaliy Size in Cedar Mill
5-person families (511 | 10.4%) account for the highest median family income in Cedar Mill with $250,001 per family, while 3-person families (1,046 | 21.3%) have the highest median income of $81,364 per family member.
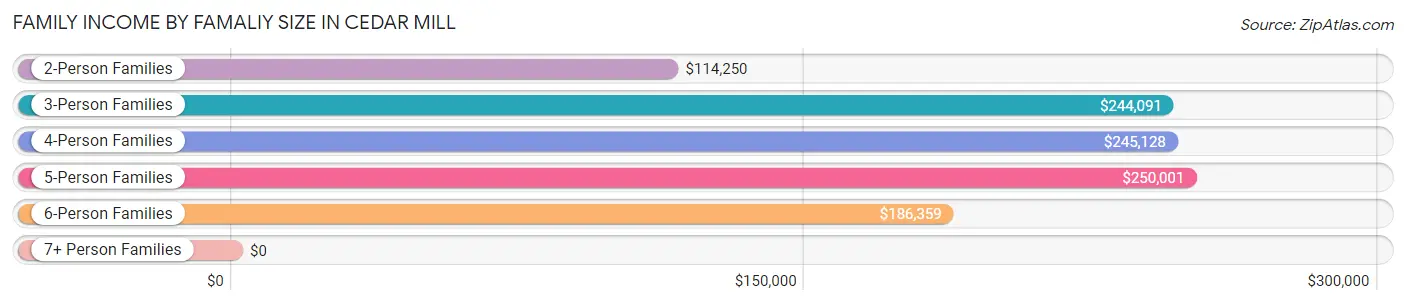
| Income Bracket | # Families | Median Income |
| 2-Person Families | 1,685 (34.4%) | $114,250 |
| 3-Person Families | 1,046 (21.3%) | $244,091 |
| 4-Person Families | 1,405 (28.7%) | $245,128 |
| 5-Person Families | 511 (10.4%) | $250,001 |
| 6-Person Families | 207 (4.2%) | $186,359 |
| 7+ Person Families | 49 (1.0%) | $0 |
| Total | 4,903 (100.0%) | $208,787 |
Family Income by Number of Earners in Cedar Mill
The median family income in Cedar Mill is $208,787, with families comprising 2 earners (2,646) having the highest median family income of $245,920, while families with no earners (576) have the lowest median family income of $82,188, accounting for 54.0% and 11.7% of families, respectively.
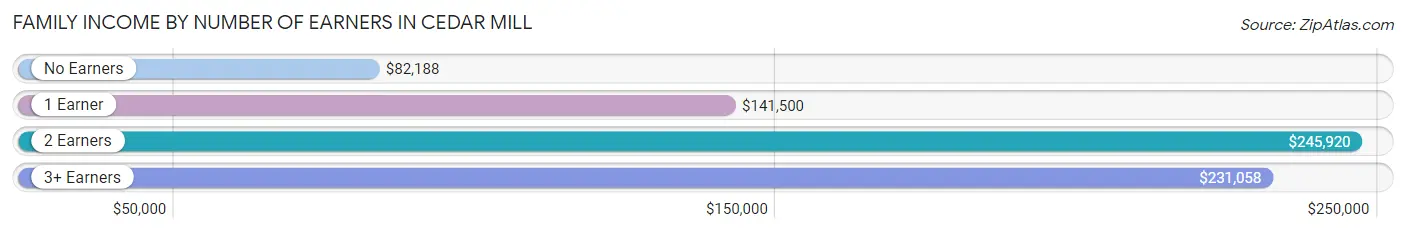
| Number of Earners | # Families | Median Income |
| No Earners | 576 (11.7%) | $82,188 |
| 1 Earner | 1,172 (23.9%) | $141,500 |
| 2 Earners | 2,646 (54.0%) | $245,920 |
| 3+ Earners | 509 (10.4%) | $231,058 |
| Total | 4,903 (100.0%) | $208,787 |
Household Income in Cedar Mill
Household Income Brackets in Cedar Mill
With 2,773 households falling in the category, the $200,000+ income range is the most frequent in Cedar Mill, accounting for 42.3% of all households. In contrast, only 52 households (0.8%) fall into the $10,000 to $14,999 income bracket, making it the least populous group.
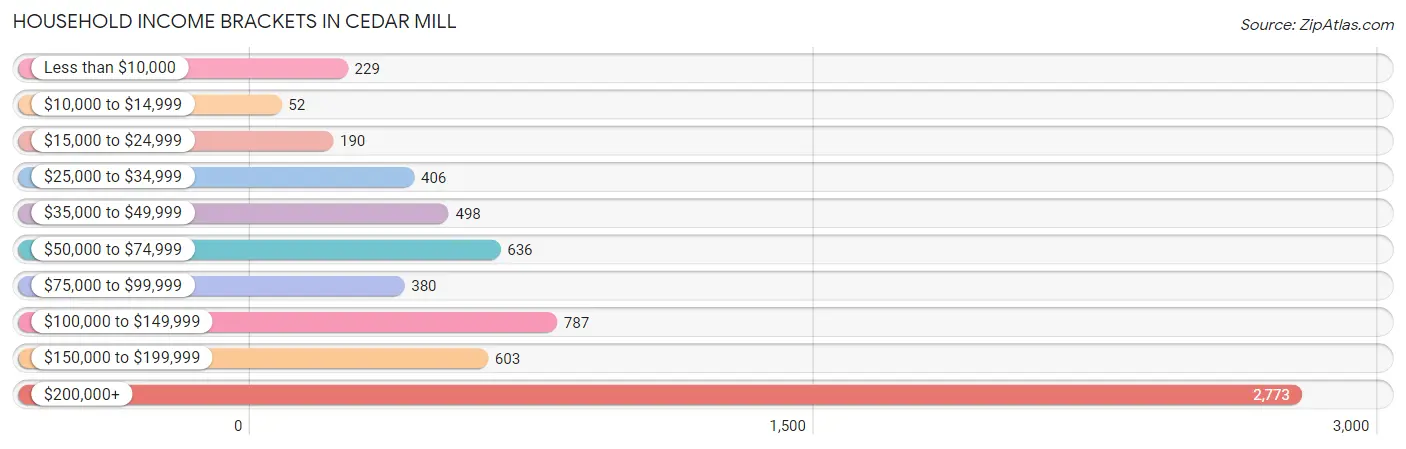
| Income Bracket | # Households | % Households |
| Less than $10,000 | 229 | 3.5% |
| $10,000 to $14,999 | 52 | 0.8% |
| $15,000 to $24,999 | 190 | 2.9% |
| $25,000 to $34,999 | 406 | 6.2% |
| $35,000 to $49,999 | 498 | 7.6% |
| $50,000 to $74,999 | 636 | 9.7% |
| $75,000 to $99,999 | 380 | 5.8% |
| $100,000 to $149,999 | 787 | 12.0% |
| $150,000 to $199,999 | 603 | 9.2% |
| $200,000+ | 2,773 | 42.3% |
Household Income by Householder Age in Cedar Mill
The median household income in Cedar Mill is $165,184, with the highest median household income of $208,261 found in the 45 to 64 years age bracket for the primary householder. A total of 3,075 households (46.9%) fall into this category. Meanwhile, the 65+ years age bracket for the primary householder has the lowest median household income of $55,559, with 1,403 households (21.4%) in this group.
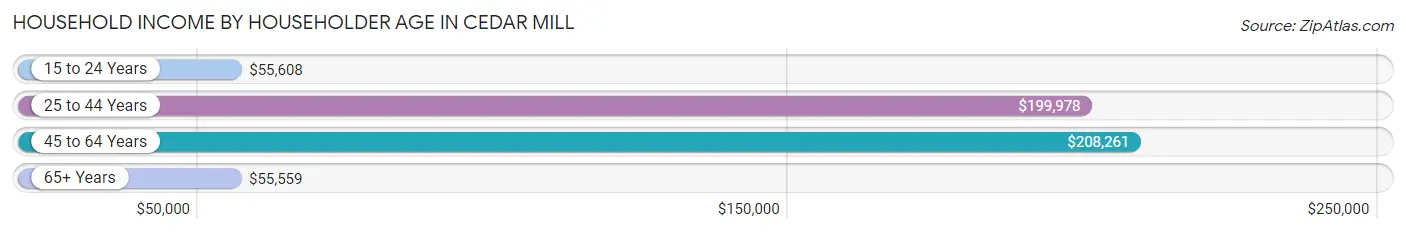
| Income Bracket | # Households | Median Income |
| 15 to 24 Years | 98 (1.5%) | $55,608 |
| 25 to 44 Years | 1,979 (30.2%) | $199,978 |
| 45 to 64 Years | 3,075 (46.9%) | $208,261 |
| 65+ Years | 1,403 (21.4%) | $55,559 |
| Total | 6,555 (100.0%) | $165,184 |
Poverty in Cedar Mill
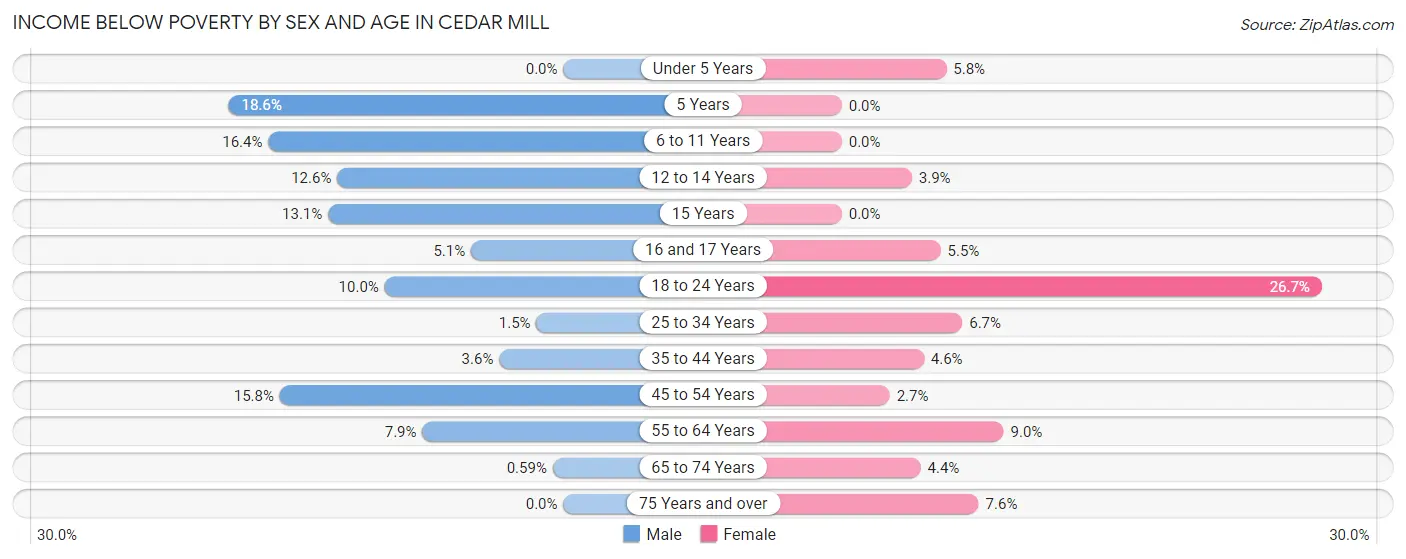
Income Below Poverty by Sex and Age in Cedar Mill
With 7.7% poverty level for males and 5.7% for females among the residents of Cedar Mill, 5 year old males and 18 to 24 year old females are the most vulnerable to poverty, with 11 males (18.6%) and 144 females (26.7%) in their respective age groups living below the poverty level.
| Age Bracket | Male | Female |
| Under 5 Years | 0 (0.0%) | 51 (5.8%) |
| 5 Years | 11 (18.6%) | 0 (0.0%) |
| 6 to 11 Years | 136 (16.4%) | 0 (0.0%) |
| 12 to 14 Years | 73 (12.6%) | 19 (3.9%) |
| 15 Years | 19 (13.1%) | 0 (0.0%) |
| 16 and 17 Years | 27 (5.1%) | 12 (5.5%) |
| 18 to 24 Years | 56 (10.0%) | 144 (26.7%) |
| 25 to 34 Years | 13 (1.5%) | 55 (6.7%) |
| 35 to 44 Years | 56 (3.6%) | 69 (4.6%) |
| 45 to 54 Years | 260 (15.8%) | 40 (2.7%) |
| 55 to 64 Years | 86 (7.9%) | 87 (9.0%) |
| 65 to 74 Years | 4 (0.6%) | 33 (4.4%) |
| 75 Years and over | 0 (0.0%) | 31 (7.6%) |
| Total | 741 (7.7%) | 541 (5.7%) |
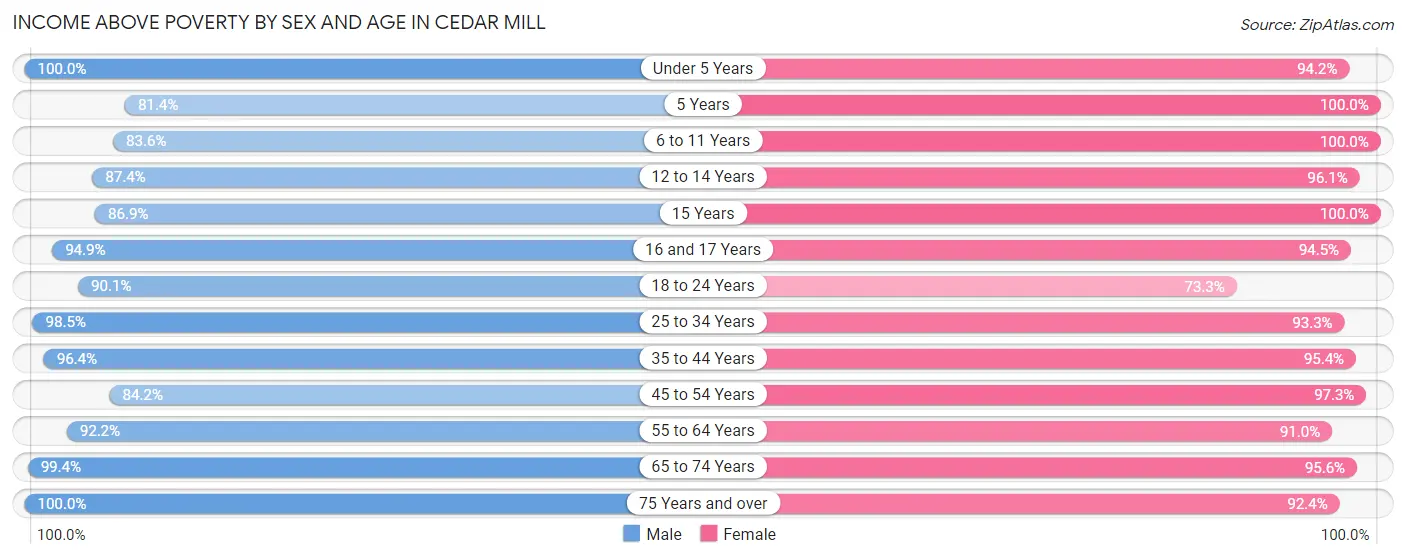
Income Above Poverty by Sex and Age in Cedar Mill
According to the poverty statistics in Cedar Mill, males aged under 5 years and females aged 5 years are the age groups that are most secure financially, with 100.0% of males and 100.0% of females in these age groups living above the poverty line.
| Age Bracket | Male | Female |
| Under 5 Years | 515 (100.0%) | 825 (94.2%) |
| 5 Years | 48 (81.4%) | 408 (100.0%) |
| 6 to 11 Years | 692 (83.6%) | 960 (100.0%) |
| 12 to 14 Years | 507 (87.4%) | 468 (96.1%) |
| 15 Years | 126 (86.9%) | 136 (100.0%) |
| 16 and 17 Years | 498 (94.9%) | 206 (94.5%) |
| 18 to 24 Years | 507 (90.0%) | 395 (73.3%) |
| 25 to 34 Years | 856 (98.5%) | 765 (93.3%) |
| 35 to 44 Years | 1,511 (96.4%) | 1,440 (95.4%) |
| 45 to 54 Years | 1,387 (84.2%) | 1,458 (97.3%) |
| 55 to 64 Years | 1,010 (92.1%) | 879 (91.0%) |
| 65 to 74 Years | 677 (99.4%) | 718 (95.6%) |
| 75 Years and over | 501 (100.0%) | 376 (92.4%) |
| Total | 8,835 (92.3%) | 9,034 (94.4%) |
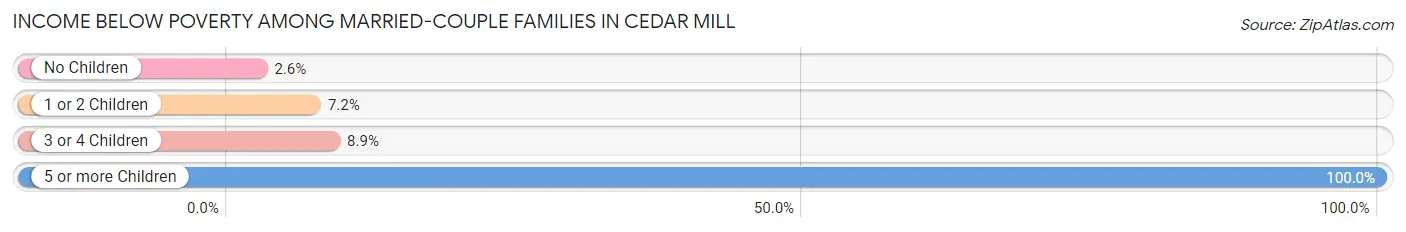
Income Below Poverty Among Married-Couple Families in Cedar Mill
The poverty statistics for married-couple families in Cedar Mill show that 5.8% or 241 of the total 4,142 families live below the poverty line. Families with 5 or more children have the highest poverty rate of 100.0%, comprising of 11 families. On the other hand, families with no children have the lowest poverty rate of 2.6%, which includes 43 families.
| Children | Above Poverty | Below Poverty |
| No Children | 1,635 (97.4%) | 43 (2.6%) |
| 1 or 2 Children | 1,723 (92.8%) | 134 (7.2%) |
| 3 or 4 Children | 543 (91.1%) | 53 (8.9%) |
| 5 or more Children | 0 (0.0%) | 11 (100.0%) |
| Total | 3,901 (94.2%) | 241 (5.8%) |
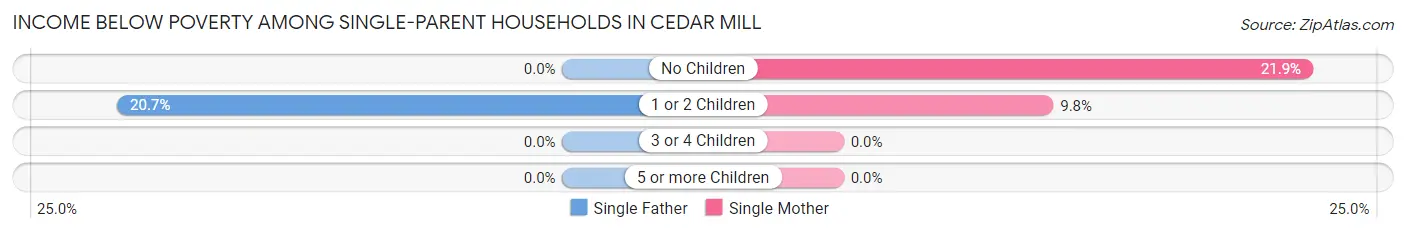
Income Below Poverty Among Single-Parent Households in Cedar Mill
According to the poverty data in Cedar Mill, 7.8% or 18 single-father households and 11.5% or 61 single-mother households are living below the poverty line. Among single-father households, those with 1 or 2 children have the highest poverty rate, with 18 households (20.7%) experiencing poverty. Likewise, among single-mother households, those with no children have the highest poverty rate, with 33 households (21.8%) falling below the poverty line.
| Children | Single Father | Single Mother |
| No Children | 0 (0.0%) | 33 (21.8%) |
| 1 or 2 Children | 18 (20.7%) | 28 (9.8%) |
| 3 or 4 Children | 0 (0.0%) | 0 (0.0%) |
| 5 or more Children | 0 (0.0%) | 0 (0.0%) |
| Total | 18 (7.8%) | 61 (11.5%) |
Income Below Poverty Among Married-Couple vs Single-Parent Households in Cedar Mill
The poverty data for Cedar Mill shows that 241 of the married-couple family households (5.8%) and 79 of the single-parent households (10.4%) are living below the poverty level. Within the married-couple family households, those with 5 or more children have the highest poverty rate, with 11 households (100.0%) falling below the poverty line. Among the single-parent households, those with 1 or 2 children have the highest poverty rate, with 46 household (12.3%) living below poverty.
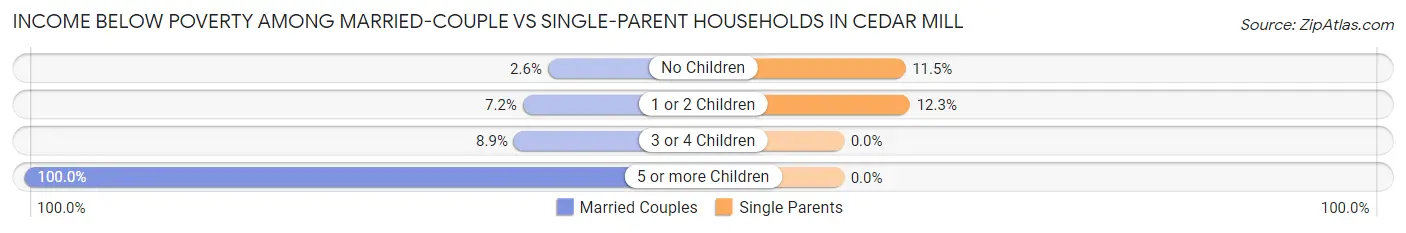
| Children | Married-Couple Families | Single-Parent Households |
| No Children | 43 (2.6%) | 33 (11.5%) |
| 1 or 2 Children | 134 (7.2%) | 46 (12.3%) |
| 3 or 4 Children | 53 (8.9%) | 0 (0.0%) |
| 5 or more Children | 11 (100.0%) | 0 (0.0%) |
| Total | 241 (5.8%) | 79 (10.4%) |
Employment Characteristics in Cedar Mill
Employment by Class of Employer in Cedar Mill
Among the 9,018 employed individuals in Cedar Mill, private company employees (6,254 | 69.4%), not-for-profit organizations (912 | 10.1%), and self-employed (incorporated) (631 | 7.0%) make up the most common classes of employment.
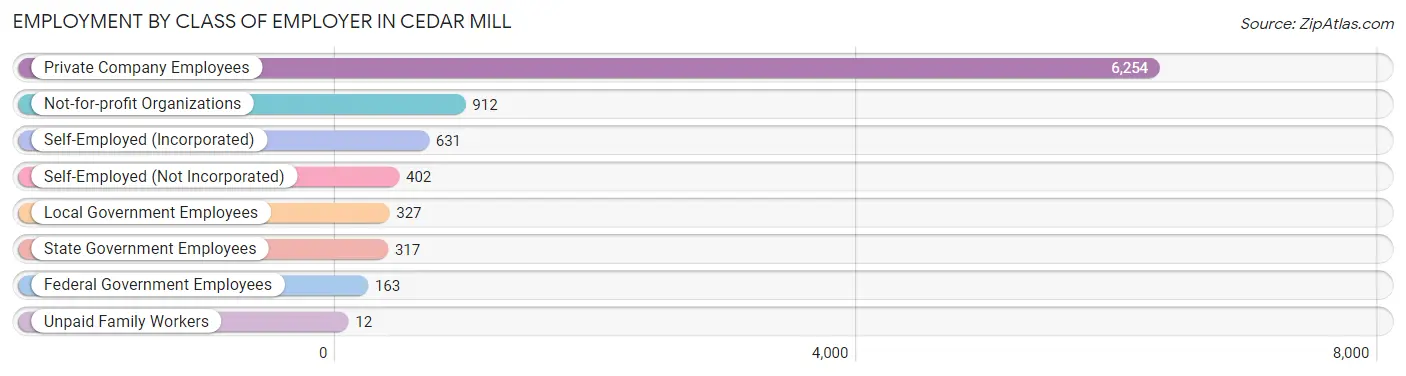
| Employer Class | # Employees | % Employees |
| Private Company Employees | 6,254 | 69.4% |
| Self-Employed (Incorporated) | 631 | 7.0% |
| Self-Employed (Not Incorporated) | 402 | 4.5% |
| Not-for-profit Organizations | 912 | 10.1% |
| Local Government Employees | 327 | 3.6% |
| State Government Employees | 317 | 3.5% |
| Federal Government Employees | 163 | 1.8% |
| Unpaid Family Workers | 12 | 0.1% |
| Total | 9,018 | 100.0% |
Employment Status by Age in Cedar Mill
According to the labor force statistics for Cedar Mill, out of the total population over 16 years of age (14,157), 69.1% or 9,782 individuals are in the labor force, with 6.8% or 665 of them unemployed. The age group with the highest labor force participation rate is 25 to 29 years, with 97.2% or 559 individuals in the labor force. Within the labor force, the 20 to 24 years age range has the highest percentage of unemployed individuals, with 24.5% or 130 of them being unemployed.
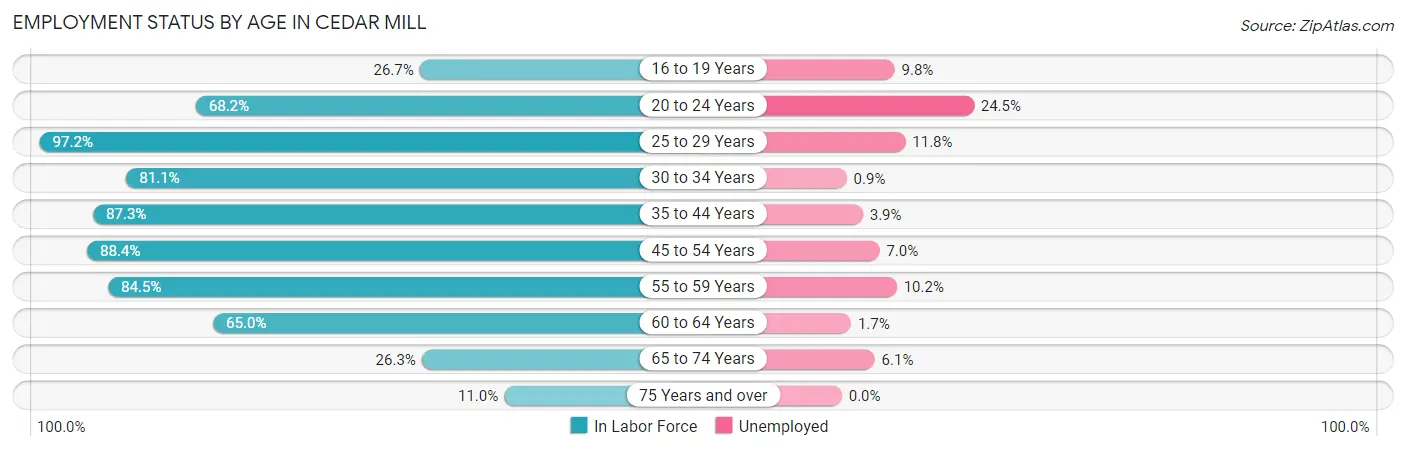
| Age Bracket | In Labor Force | Unemployed |
| 16 to 19 Years | 285 (26.7%) | 28 (9.8%) |
| 20 to 24 Years | 531 (68.2%) | 130 (24.5%) |
| 25 to 29 Years | 559 (97.2%) | 66 (11.8%) |
| 30 to 34 Years | 903 (81.1%) | 8 (0.9%) |
| 35 to 44 Years | 2,685 (87.3%) | 105 (3.9%) |
| 45 to 54 Years | 2,780 (88.4%) | 195 (7.0%) |
| 55 to 59 Years | 962 (84.5%) | 98 (10.2%) |
| 60 to 64 Years | 600 (65.0%) | 10 (1.7%) |
| 65 to 74 Years | 377 (26.3%) | 23 (6.1%) |
| 75 Years and over | 100 (11.0%) | 0 (0.0%) |
| Total | 9,782 (69.1%) | 665 (6.8%) |
Employment Status by Educational Attainment in Cedar Mill
According to labor force statistics for Cedar Mill, 85.1% of individuals (8,486) out of the total population between 25 and 64 years of age (9,972) are in the labor force, with 5.7% or 484 of them being unemployed. The group with the highest labor force participation rate are those with the educational attainment of bachelor's degree or higher, with 87.3% or 6,129 individuals in the labor force. Within the labor force, individuals with college / associate degree education have the highest percentage of unemployment, with 7.1% or 99 of them being unemployed.
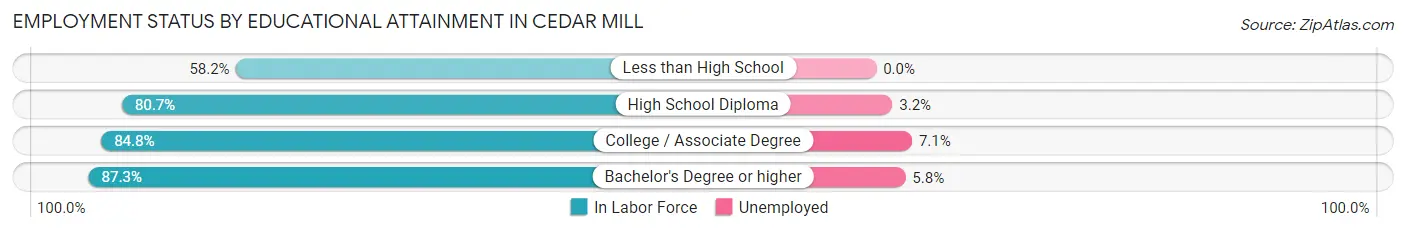
| Educational Attainment | In Labor Force | Unemployed |
| Less than High School | 241 (58.2%) | 0 (0.0%) |
| High School Diploma | 717 (80.7%) | 28 (3.2%) |
| College / Associate Degree | 1,398 (84.8%) | 117 (7.1%) |
| Bachelor's Degree or higher | 6,129 (87.3%) | 407 (5.8%) |
| Total | 8,486 (85.1%) | 568 (5.7%) |
Employment Occupations by Sex in Cedar Mill
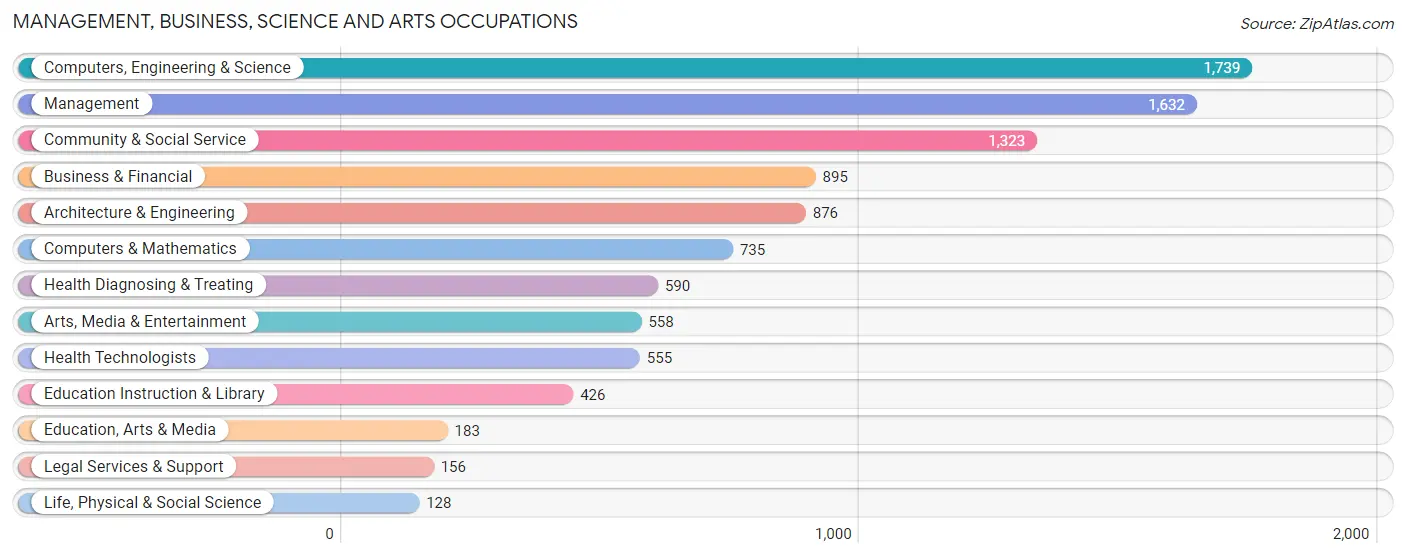
Management, Business, Science and Arts Occupations
The most common Management, Business, Science and Arts occupations in Cedar Mill are Computers, Engineering & Science (1,739 | 19.1%), Management (1,632 | 17.9%), Community & Social Service (1,323 | 14.5%), Business & Financial (895 | 9.8%), and Architecture & Engineering (876 | 9.6%).
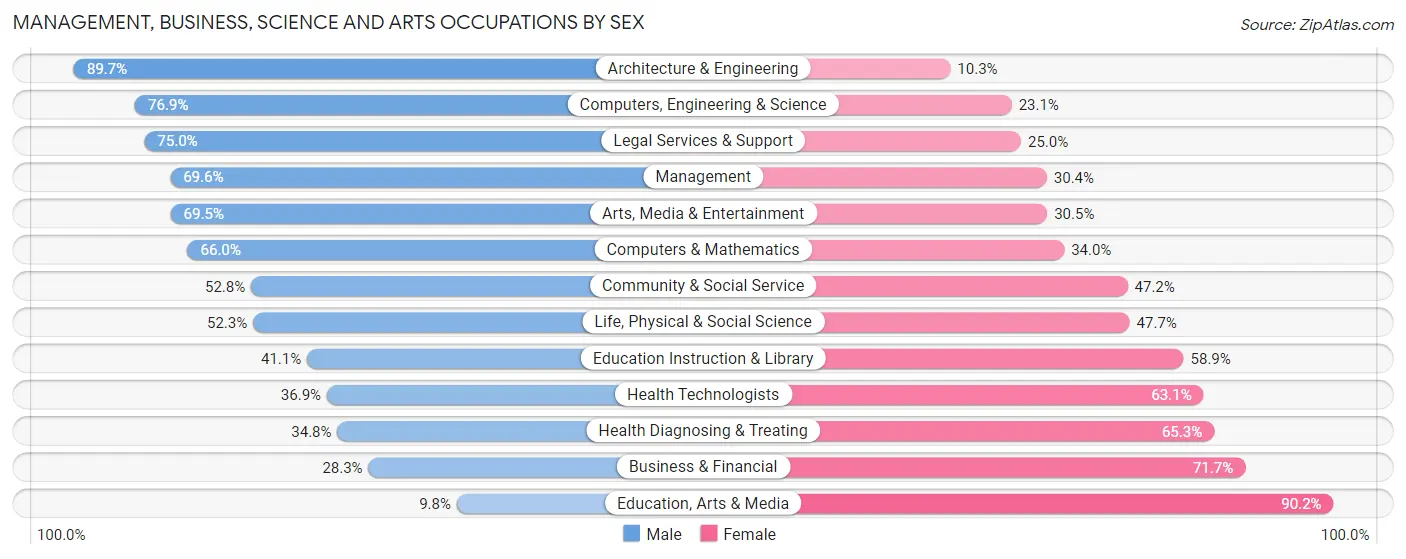
Management, Business, Science and Arts Occupations by Sex
Within the Management, Business, Science and Arts occupations in Cedar Mill, the most male-oriented occupations are Architecture & Engineering (89.7%), Computers, Engineering & Science (76.9%), and Legal Services & Support (75.0%), while the most female-oriented occupations are Education, Arts & Media (90.2%), Business & Financial (71.7%), and Health Diagnosing & Treating (65.2%).
| Occupation | Male | Female |
| Management | 1,136 (69.6%) | 496 (30.4%) |
| Business & Financial | 253 (28.3%) | 642 (71.7%) |
| Computers, Engineering & Science | 1,338 (76.9%) | 401 (23.1%) |
| Computers & Mathematics | 485 (66.0%) | 250 (34.0%) |
| Architecture & Engineering | 786 (89.7%) | 90 (10.3%) |
| Life, Physical & Social Science | 67 (52.3%) | 61 (47.7%) |
| Community & Social Service | 698 (52.8%) | 625 (47.2%) |
| Education, Arts & Media | 18 (9.8%) | 165 (90.2%) |
| Legal Services & Support | 117 (75.0%) | 39 (25.0%) |
| Education Instruction & Library | 175 (41.1%) | 251 (58.9%) |
| Arts, Media & Entertainment | 388 (69.5%) | 170 (30.5%) |
| Health Diagnosing & Treating | 205 (34.7%) | 385 (65.2%) |
| Health Technologists | 205 (36.9%) | 350 (63.1%) |
| Total (Category) | 3,630 (58.8%) | 2,549 (41.2%) |
| Total (Overall) | 5,178 (56.8%) | 3,941 (43.2%) |
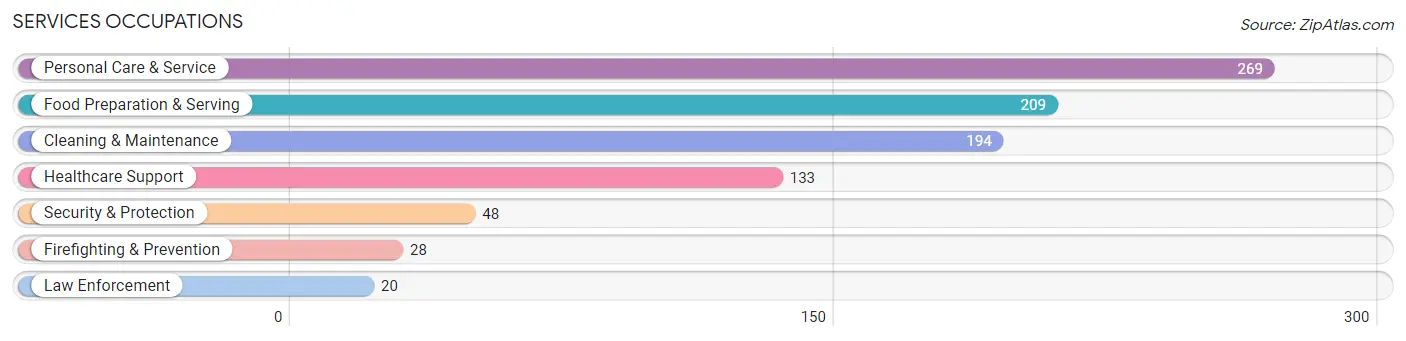
Services Occupations
The most common Services occupations in Cedar Mill are Personal Care & Service (269 | 2.9%), Food Preparation & Serving (209 | 2.3%), Cleaning & Maintenance (194 | 2.1%), Healthcare Support (133 | 1.5%), and Security & Protection (48 | 0.5%).
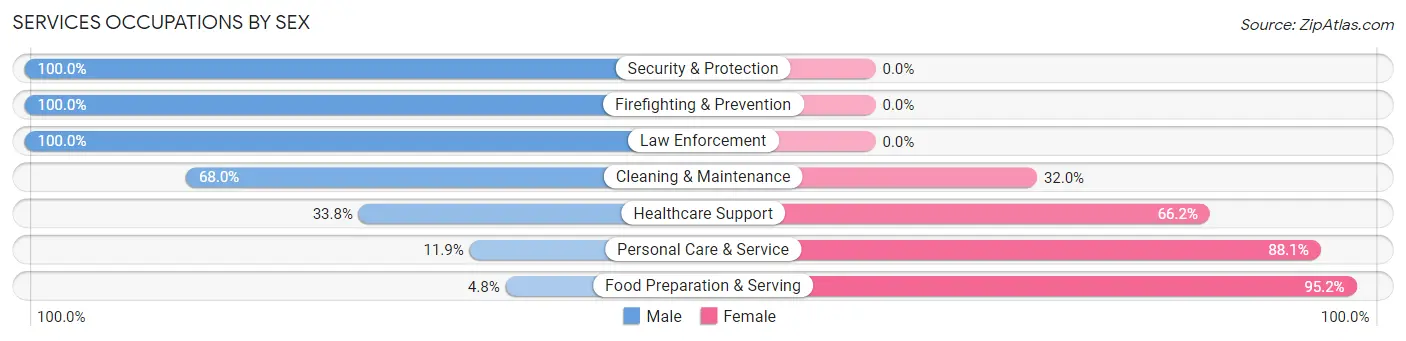
Services Occupations by Sex
Within the Services occupations in Cedar Mill, the most male-oriented occupations are Security & Protection (100.0%), Firefighting & Prevention (100.0%), and Law Enforcement (100.0%), while the most female-oriented occupations are Food Preparation & Serving (95.2%), Personal Care & Service (88.1%), and Healthcare Support (66.2%).
| Occupation | Male | Female |
| Healthcare Support | 45 (33.8%) | 88 (66.2%) |
| Security & Protection | 48 (100.0%) | 0 (0.0%) |
| Firefighting & Prevention | 28 (100.0%) | 0 (0.0%) |
| Law Enforcement | 20 (100.0%) | 0 (0.0%) |
| Food Preparation & Serving | 10 (4.8%) | 199 (95.2%) |
| Cleaning & Maintenance | 132 (68.0%) | 62 (32.0%) |
| Personal Care & Service | 32 (11.9%) | 237 (88.1%) |
| Total (Category) | 267 (31.3%) | 586 (68.7%) |
| Total (Overall) | 5,178 (56.8%) | 3,941 (43.2%) |
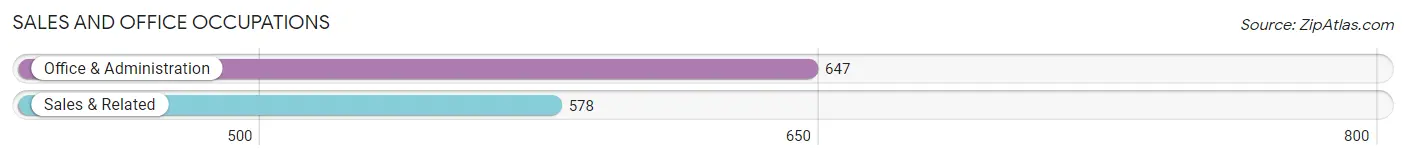
Sales and Office Occupations
The most common Sales and Office occupations in Cedar Mill are Office & Administration (647 | 7.1%), and Sales & Related (578 | 6.3%).
Sales and Office Occupations by Sex
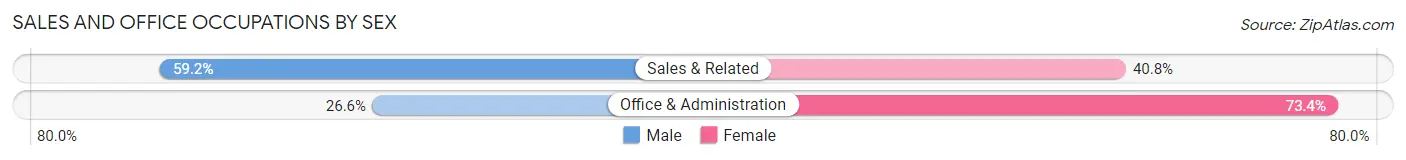
| Occupation | Male | Female |
| Sales & Related | 342 (59.2%) | 236 (40.8%) |
| Office & Administration | 172 (26.6%) | 475 (73.4%) |
| Total (Category) | 514 (42.0%) | 711 (58.0%) |
| Total (Overall) | 5,178 (56.8%) | 3,941 (43.2%) |
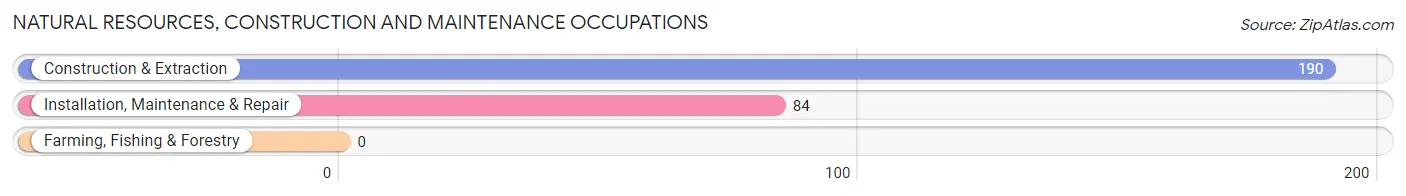
Natural Resources, Construction and Maintenance Occupations
The most common Natural Resources, Construction and Maintenance occupations in Cedar Mill are Construction & Extraction (190 | 2.1%), and Installation, Maintenance & Repair (84 | 0.9%).
Natural Resources, Construction and Maintenance Occupations by Sex
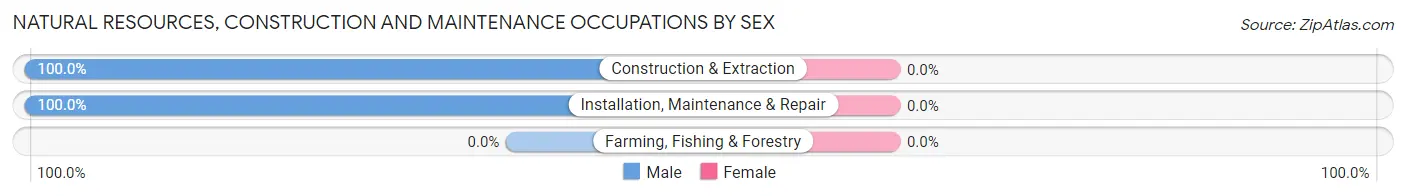
| Occupation | Male | Female |
| Farming, Fishing & Forestry | 0 (0.0%) | 0 (0.0%) |
| Construction & Extraction | 190 (100.0%) | 0 (0.0%) |
| Installation, Maintenance & Repair | 84 (100.0%) | 0 (0.0%) |
| Total (Category) | 274 (100.0%) | 0 (0.0%) |
| Total (Overall) | 5,178 (56.8%) | 3,941 (43.2%) |
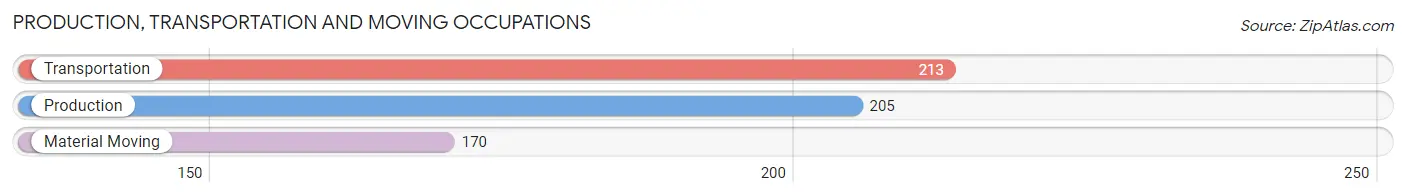
Production, Transportation and Moving Occupations
The most common Production, Transportation and Moving occupations in Cedar Mill are Transportation (213 | 2.3%), Production (205 | 2.2%), and Material Moving (170 | 1.9%).
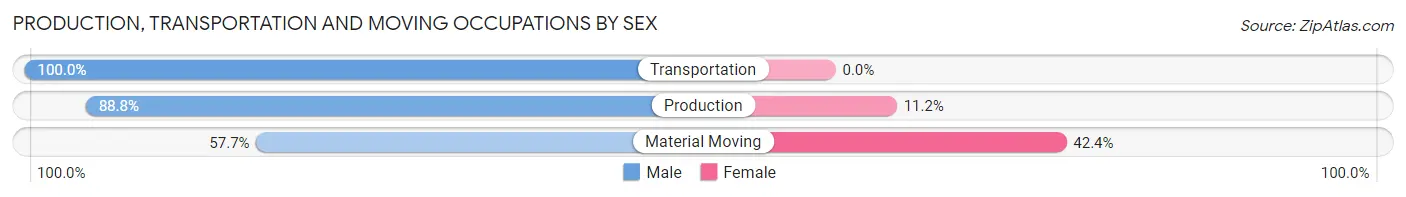
Production, Transportation and Moving Occupations by Sex
| Occupation | Male | Female |
| Production | 182 (88.8%) | 23 (11.2%) |
| Transportation | 213 (100.0%) | 0 (0.0%) |
| Material Moving | 98 (57.7%) | 72 (42.3%) |
| Total (Category) | 493 (83.8%) | 95 (16.2%) |
| Total (Overall) | 5,178 (56.8%) | 3,941 (43.2%) |
Employment Industries by Sex in Cedar Mill
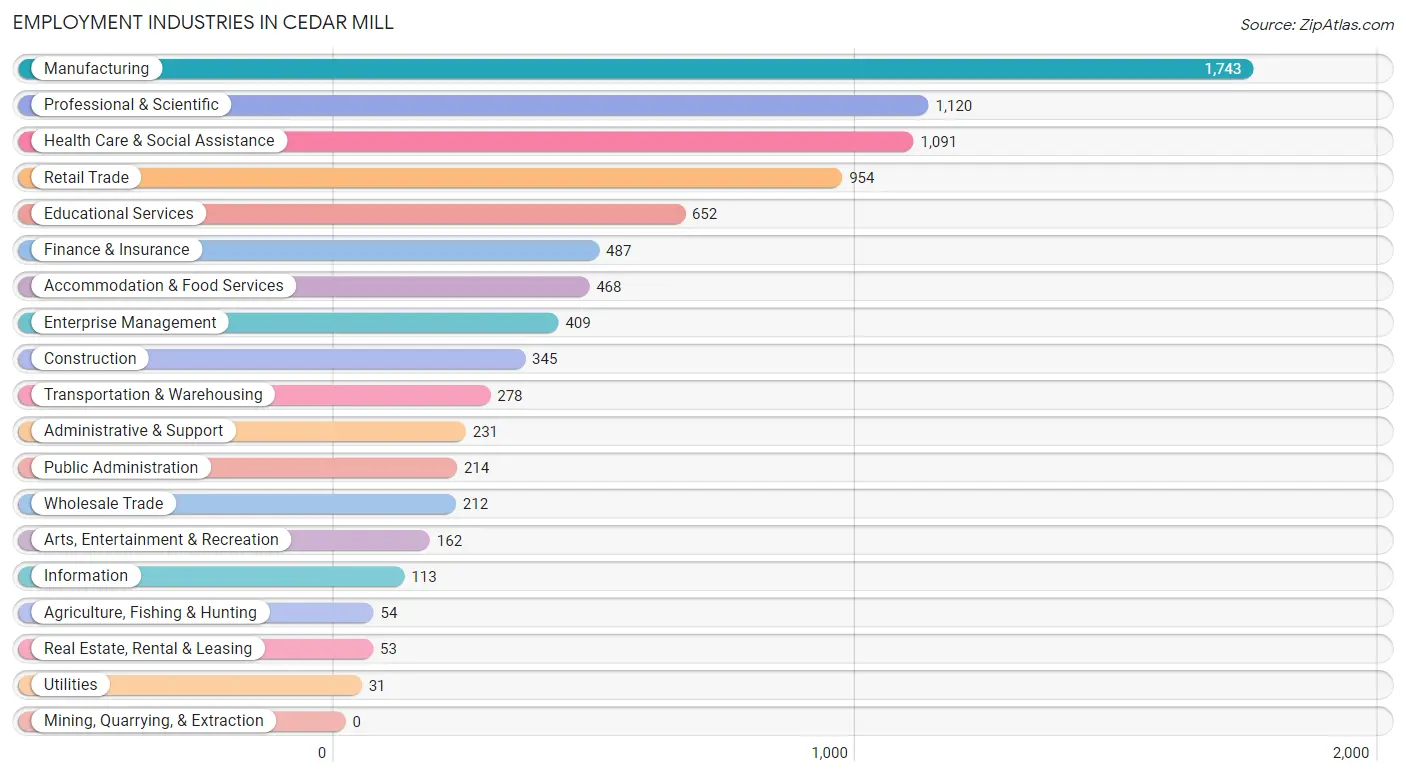
Employment Industries in Cedar Mill
The major employment industries in Cedar Mill include Manufacturing (1,743 | 19.1%), Professional & Scientific (1,120 | 12.3%), Health Care & Social Assistance (1,091 | 12.0%), Retail Trade (954 | 10.5%), and Educational Services (652 | 7.1%).
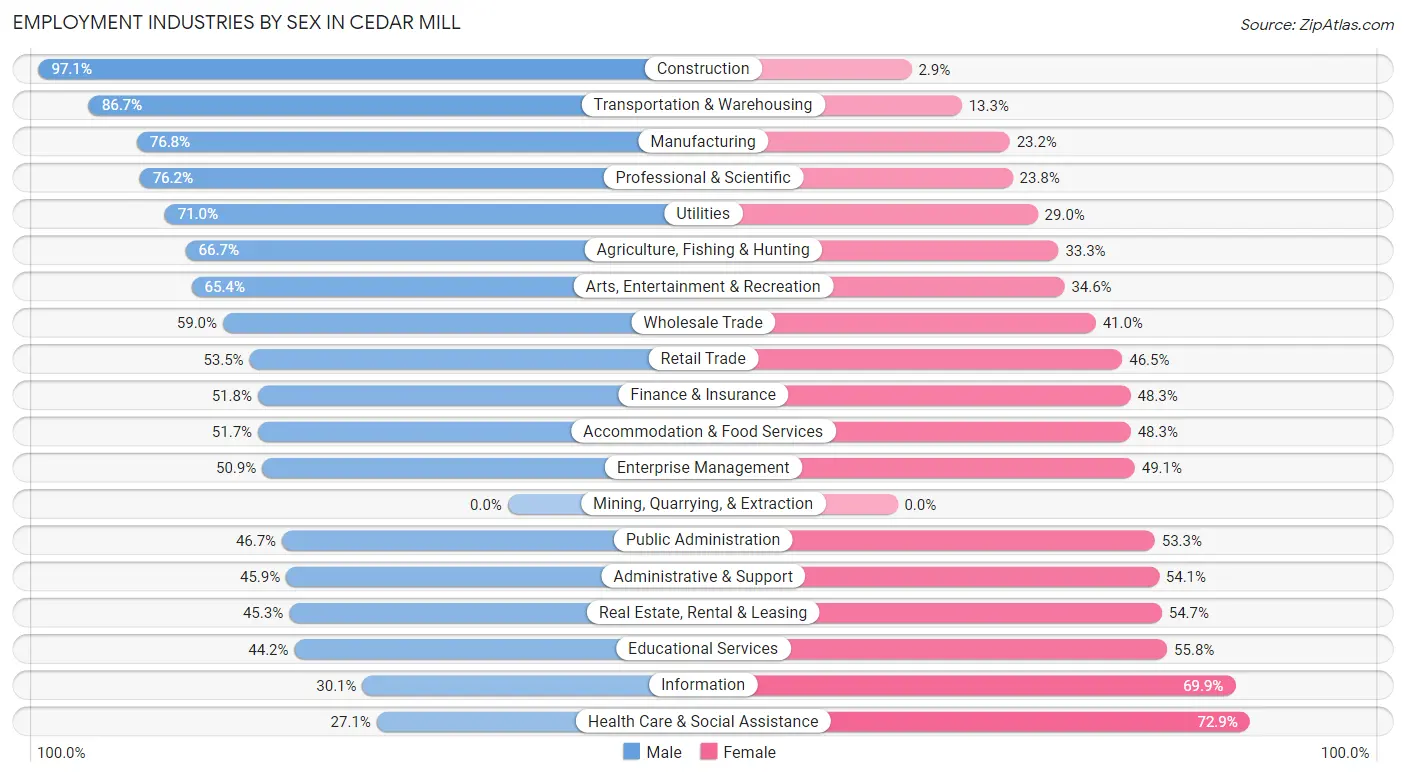
Employment Industries by Sex in Cedar Mill
The Cedar Mill industries that see more men than women are Construction (97.1%), Transportation & Warehousing (86.7%), and Manufacturing (76.8%), whereas the industries that tend to have a higher number of women are Health Care & Social Assistance (72.9%), Information (69.9%), and Educational Services (55.8%).
| Industry | Male | Female |
| Agriculture, Fishing & Hunting | 36 (66.7%) | 18 (33.3%) |
| Mining, Quarrying, & Extraction | 0 (0.0%) | 0 (0.0%) |
| Construction | 335 (97.1%) | 10 (2.9%) |
| Manufacturing | 1,338 (76.8%) | 405 (23.2%) |
| Wholesale Trade | 125 (59.0%) | 87 (41.0%) |
| Retail Trade | 510 (53.5%) | 444 (46.5%) |
| Transportation & Warehousing | 241 (86.7%) | 37 (13.3%) |
| Utilities | 22 (71.0%) | 9 (29.0%) |
| Information | 34 (30.1%) | 79 (69.9%) |
| Finance & Insurance | 252 (51.7%) | 235 (48.2%) |
| Real Estate, Rental & Leasing | 24 (45.3%) | 29 (54.7%) |
| Professional & Scientific | 853 (76.2%) | 267 (23.8%) |
| Enterprise Management | 208 (50.9%) | 201 (49.1%) |
| Administrative & Support | 106 (45.9%) | 125 (54.1%) |
| Educational Services | 288 (44.2%) | 364 (55.8%) |
| Health Care & Social Assistance | 296 (27.1%) | 795 (72.9%) |
| Arts, Entertainment & Recreation | 106 (65.4%) | 56 (34.6%) |
| Accommodation & Food Services | 242 (51.7%) | 226 (48.3%) |
| Public Administration | 100 (46.7%) | 114 (53.3%) |
| Total | 5,178 (56.8%) | 3,941 (43.2%) |
Education in Cedar Mill
School Enrollment in Cedar Mill
The most common levels of schooling among the 5,663 students in Cedar Mill are middle school (1,538 | 27.2%), high school (1,342 | 23.7%), and elementary school (1,072 | 18.9%).
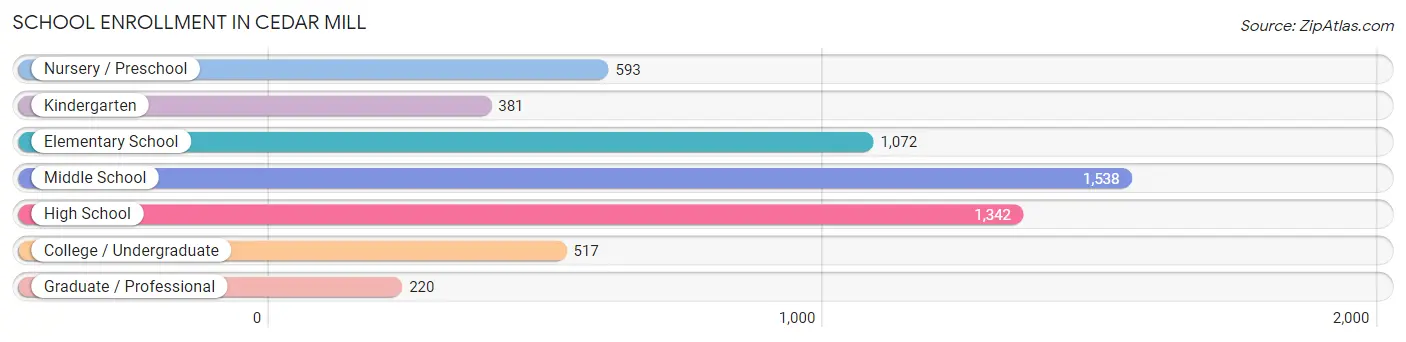
| School Level | # Students | % Students |
| Nursery / Preschool | 593 | 10.5% |
| Kindergarten | 381 | 6.7% |
| Elementary School | 1,072 | 18.9% |
| Middle School | 1,538 | 27.2% |
| High School | 1,342 | 23.7% |
| College / Undergraduate | 517 | 9.1% |
| Graduate / Professional | 220 | 3.9% |
| Total | 5,663 | 100.0% |
School Enrollment by Age by Funding Source in Cedar Mill
Out of a total of 5,663 students who are enrolled in schools in Cedar Mill, 1,291 (22.8%) attend a private institution, while the remaining 4,372 (77.2%) are enrolled in public schools. The age group of 3 to 4 year olds has the highest likelihood of being enrolled in private schools, with 184 (46.9% in the age bracket) enrolled. Conversely, the age group of 15 to 17 year olds has the lowest likelihood of being enrolled in a private school, with 909 (88.8% in the age bracket) attending a public institution.
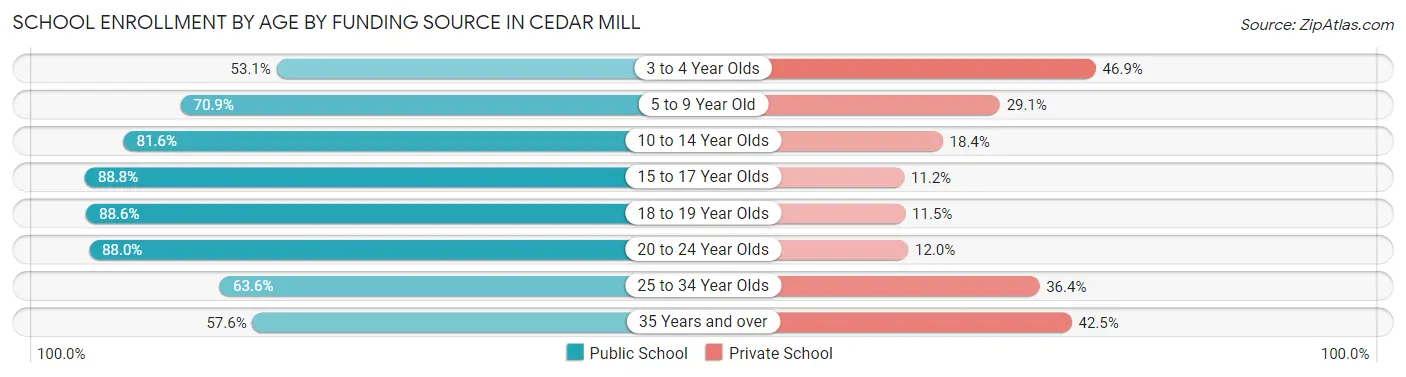
| Age Bracket | Public School | Private School |
| 3 to 4 Year Olds | 208 (53.1%) | 184 (46.9%) |
| 5 to 9 Year Old | 1,089 (70.9%) | 446 (29.1%) |
| 10 to 14 Year Olds | 1,438 (81.6%) | 325 (18.4%) |
| 15 to 17 Year Olds | 909 (88.8%) | 115 (11.2%) |
| 18 to 19 Year Olds | 263 (88.5%) | 34 (11.5%) |
| 20 to 24 Year Olds | 235 (88.0%) | 32 (12.0%) |
| 25 to 34 Year Olds | 89 (63.6%) | 51 (36.4%) |
| 35 Years and over | 141 (57.6%) | 104 (42.4%) |
| Total | 4,372 (77.2%) | 1,291 (22.8%) |
Educational Attainment by Field of Study in Cedar Mill
Business (1,711 | 18.5%), engineering (1,506 | 16.3%), bio, nature & agricultural (828 | 8.9%), visual & performing arts (821 | 8.9%), and computers & mathematics (728 | 7.9%) are the most common fields of study among 9,263 individuals in Cedar Mill who have obtained a bachelor's degree or higher.
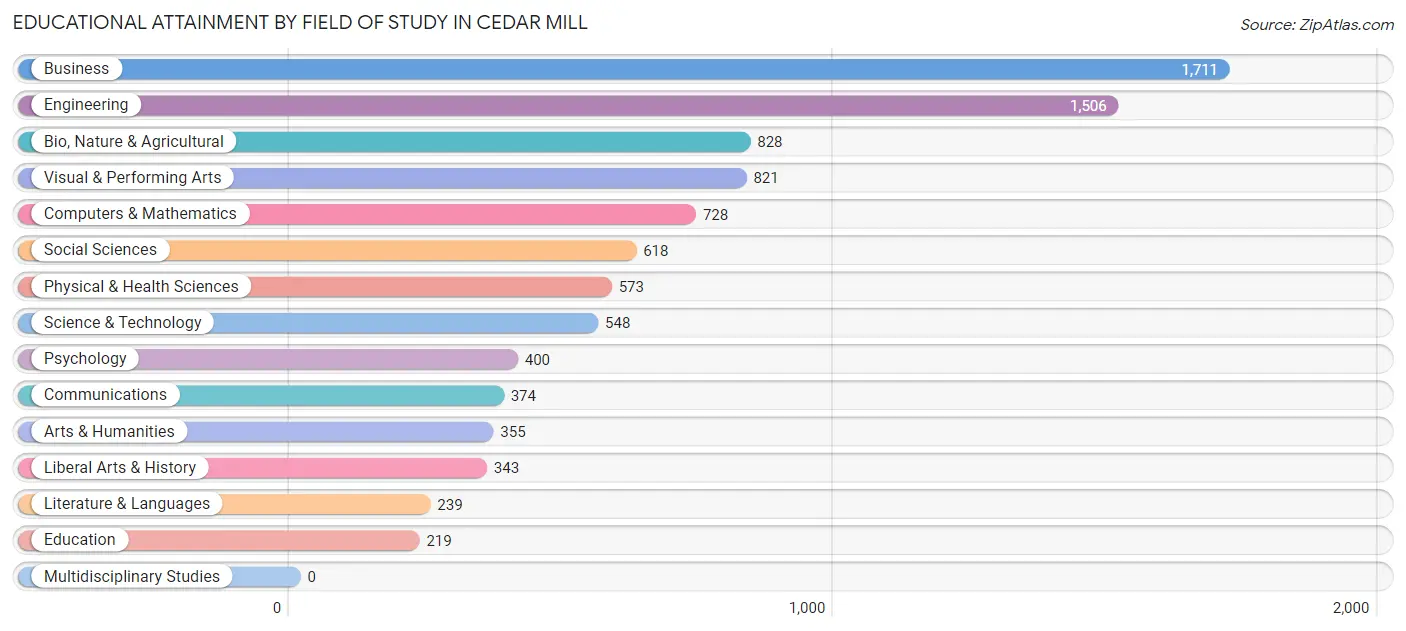
| Field of Study | # Graduates | % Graduates |
| Computers & Mathematics | 728 | 7.9% |
| Bio, Nature & Agricultural | 828 | 8.9% |
| Physical & Health Sciences | 573 | 6.2% |
| Psychology | 400 | 4.3% |
| Social Sciences | 618 | 6.7% |
| Engineering | 1,506 | 16.3% |
| Multidisciplinary Studies | 0 | 0.0% |
| Science & Technology | 548 | 5.9% |
| Business | 1,711 | 18.5% |
| Education | 219 | 2.4% |
| Literature & Languages | 239 | 2.6% |
| Liberal Arts & History | 343 | 3.7% |
| Visual & Performing Arts | 821 | 8.9% |
| Communications | 374 | 4.0% |
| Arts & Humanities | 355 | 3.8% |
| Total | 9,263 | 100.0% |
Transportation & Commute in Cedar Mill
Vehicle Availability by Sex in Cedar Mill
The most prevalent vehicle ownership categories in Cedar Mill are males with 2 vehicles (2,847, accounting for 55.4%) and females with 2 vehicles (1,987, making up 73.5%).
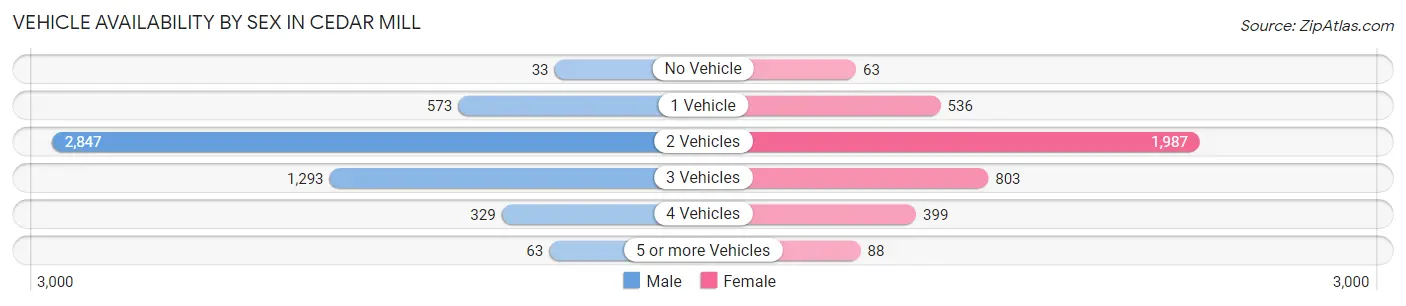
| Vehicles Available | Male | Female |
| No Vehicle | 33 (0.6%) | 63 (1.6%) |
| 1 Vehicle | 573 (11.2%) | 536 (13.8%) |
| 2 Vehicles | 2,847 (55.4%) | 1,987 (51.3%) |
| 3 Vehicles | 1,293 (25.2%) | 803 (20.7%) |
| 4 Vehicles | 329 (6.4%) | 399 (10.3%) |
| 5 or more Vehicles | 63 (1.2%) | 88 (2.3%) |
| Total | 5,138 (100.0%) | 3,876 (100.0%) |
Commute Time in Cedar Mill
The most frequently occuring commute durations in Cedar Mill are 20 to 24 minutes (1,514 commuters, 23.5%), 15 to 19 minutes (1,225 commuters, 19.0%), and 30 to 34 minutes (822 commuters, 12.8%).
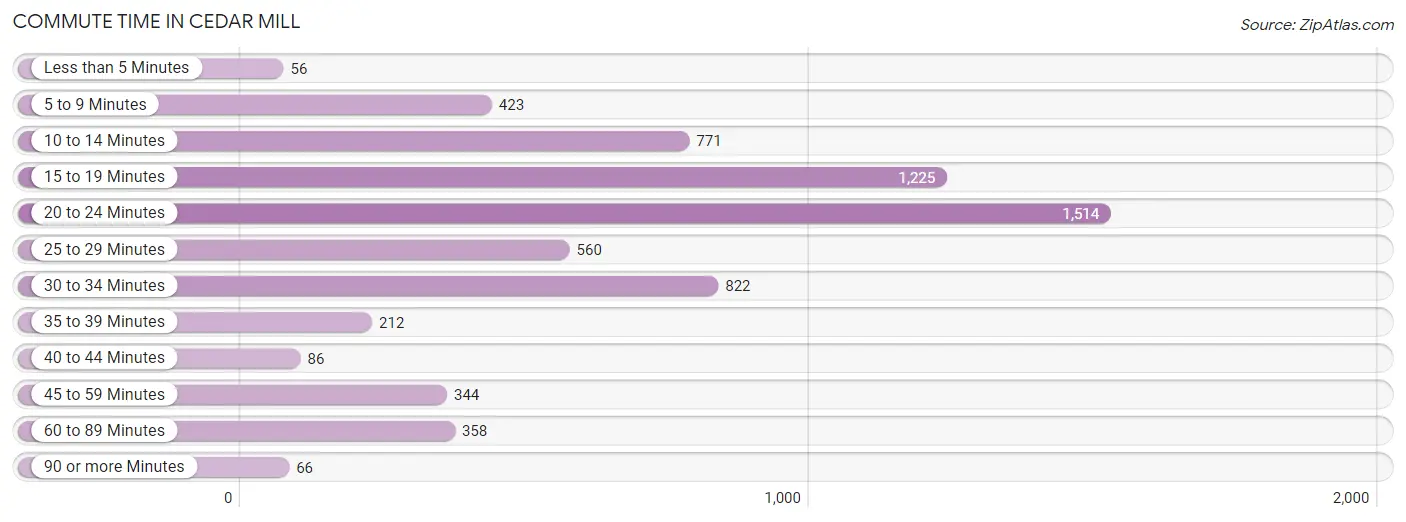
| Commute Time | # Commuters | % Commuters |
| Less than 5 Minutes | 56 | 0.9% |
| 5 to 9 Minutes | 423 | 6.6% |
| 10 to 14 Minutes | 771 | 12.0% |
| 15 to 19 Minutes | 1,225 | 19.0% |
| 20 to 24 Minutes | 1,514 | 23.5% |
| 25 to 29 Minutes | 560 | 8.7% |
| 30 to 34 Minutes | 822 | 12.8% |
| 35 to 39 Minutes | 212 | 3.3% |
| 40 to 44 Minutes | 86 | 1.3% |
| 45 to 59 Minutes | 344 | 5.3% |
| 60 to 89 Minutes | 358 | 5.6% |
| 90 or more Minutes | 66 | 1.0% |
Commute Time by Sex in Cedar Mill
The most common commute times in Cedar Mill are 20 to 24 minutes (1,037 commuters, 28.8%) for males and 20 to 24 minutes (477 commuters, 16.8%) for females.
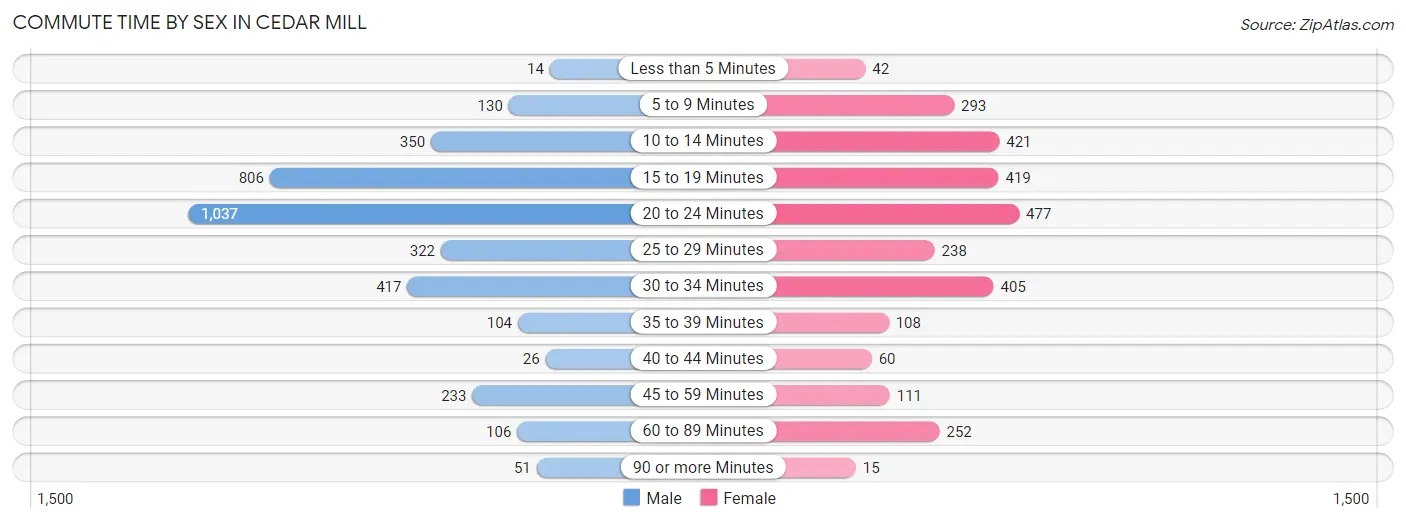
| Commute Time | Male | Female |
| Less than 5 Minutes | 14 (0.4%) | 42 (1.5%) |
| 5 to 9 Minutes | 130 (3.6%) | 293 (10.3%) |
| 10 to 14 Minutes | 350 (9.7%) | 421 (14.8%) |
| 15 to 19 Minutes | 806 (22.4%) | 419 (14.7%) |
| 20 to 24 Minutes | 1,037 (28.8%) | 477 (16.8%) |
| 25 to 29 Minutes | 322 (8.9%) | 238 (8.4%) |
| 30 to 34 Minutes | 417 (11.6%) | 405 (14.3%) |
| 35 to 39 Minutes | 104 (2.9%) | 108 (3.8%) |
| 40 to 44 Minutes | 26 (0.7%) | 60 (2.1%) |
| 45 to 59 Minutes | 233 (6.5%) | 111 (3.9%) |
| 60 to 89 Minutes | 106 (2.9%) | 252 (8.9%) |
| 90 or more Minutes | 51 (1.4%) | 15 (0.5%) |
Time of Departure to Work by Sex in Cedar Mill
The most frequent times of departure to work in Cedar Mill are 7:00 AM to 7:29 AM (659, 18.3%) for males and 8:00 AM to 8:29 AM (463, 16.3%) for females.
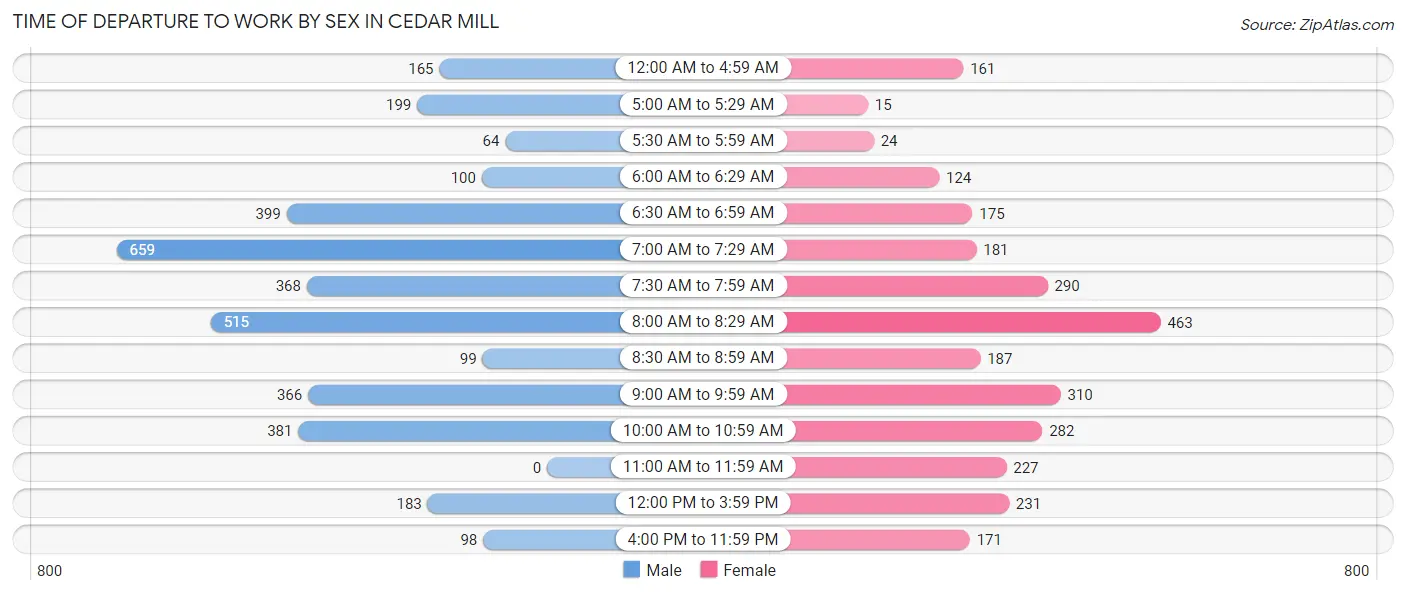
| Time of Departure | Male | Female |
| 12:00 AM to 4:59 AM | 165 (4.6%) | 161 (5.7%) |
| 5:00 AM to 5:29 AM | 199 (5.5%) | 15 (0.5%) |
| 5:30 AM to 5:59 AM | 64 (1.8%) | 24 (0.8%) |
| 6:00 AM to 6:29 AM | 100 (2.8%) | 124 (4.4%) |
| 6:30 AM to 6:59 AM | 399 (11.1%) | 175 (6.2%) |
| 7:00 AM to 7:29 AM | 659 (18.3%) | 181 (6.4%) |
| 7:30 AM to 7:59 AM | 368 (10.2%) | 290 (10.2%) |
| 8:00 AM to 8:29 AM | 515 (14.3%) | 463 (16.3%) |
| 8:30 AM to 8:59 AM | 99 (2.8%) | 187 (6.6%) |
| 9:00 AM to 9:59 AM | 366 (10.2%) | 310 (10.9%) |
| 10:00 AM to 10:59 AM | 381 (10.6%) | 282 (9.9%) |
| 11:00 AM to 11:59 AM | 0 (0.0%) | 227 (8.0%) |
| 12:00 PM to 3:59 PM | 183 (5.1%) | 231 (8.1%) |
| 4:00 PM to 11:59 PM | 98 (2.7%) | 171 (6.0%) |
| Total | 3,596 (100.0%) | 2,841 (100.0%) |
Housing Occupancy in Cedar Mill
Occupancy by Ownership in Cedar Mill
Of the total 6,555 dwellings in Cedar Mill, owner-occupied units account for 4,996 (76.2%), while renter-occupied units make up 1,559 (23.8%).
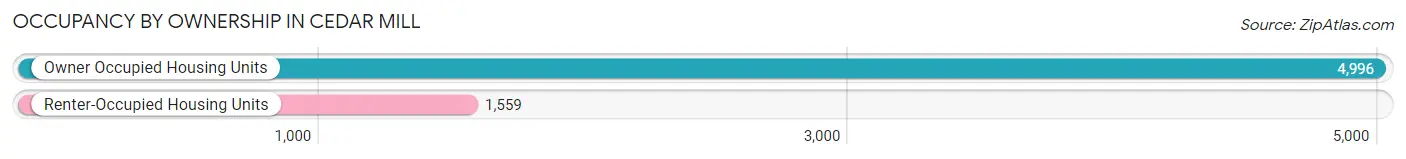
| Occupancy | # Housing Units | % Housing Units |
| Owner Occupied Housing Units | 4,996 | 76.2% |
| Renter-Occupied Housing Units | 1,559 | 23.8% |
| Total Occupied Housing Units | 6,555 | 100.0% |
Occupancy by Household Size in Cedar Mill
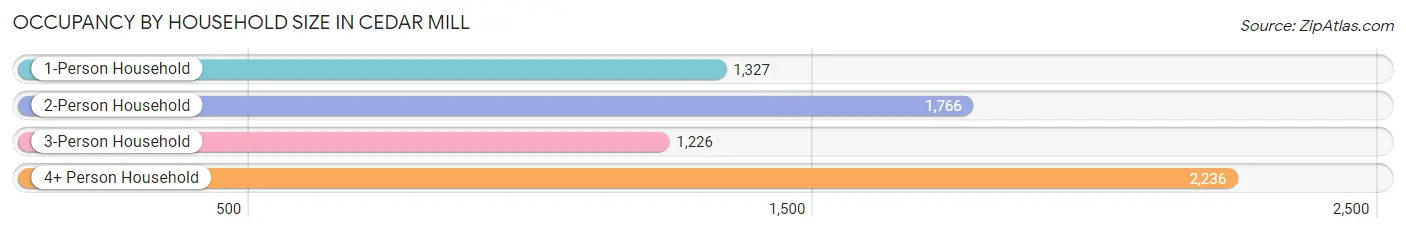
| Household Size | # Housing Units | % Housing Units |
| 1-Person Household | 1,327 | 20.2% |
| 2-Person Household | 1,766 | 26.9% |
| 3-Person Household | 1,226 | 18.7% |
| 4+ Person Household | 2,236 | 34.1% |
| Total Housing Units | 6,555 | 100.0% |
Occupancy by Ownership by Household Size in Cedar Mill
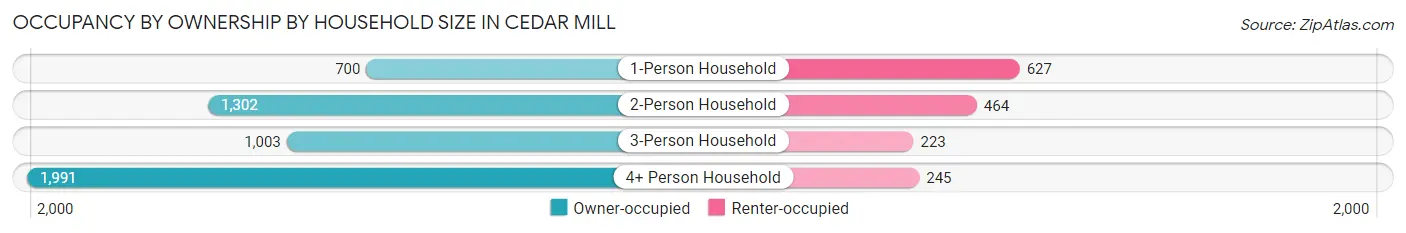
| Household Size | Owner-occupied | Renter-occupied |
| 1-Person Household | 700 (52.7%) | 627 (47.2%) |
| 2-Person Household | 1,302 (73.7%) | 464 (26.3%) |
| 3-Person Household | 1,003 (81.8%) | 223 (18.2%) |
| 4+ Person Household | 1,991 (89.0%) | 245 (11.0%) |
| Total Housing Units | 4,996 (76.2%) | 1,559 (23.8%) |
Occupancy by Educational Attainment in Cedar Mill
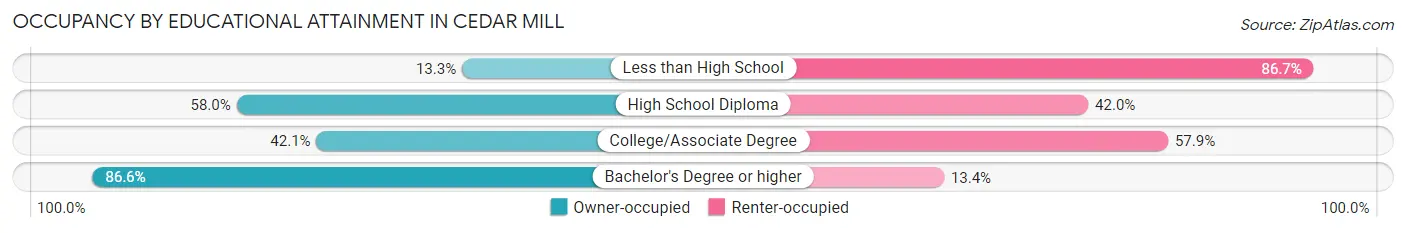
| Household Size | Owner-occupied | Renter-occupied |
| Less than High School | 17 (13.3%) | 111 (86.7%) |
| High School Diploma | 291 (58.0%) | 211 (42.0%) |
| College/Associate Degree | 418 (42.1%) | 574 (57.9%) |
| Bachelor's Degree or higher | 4,270 (86.6%) | 663 (13.4%) |
Occupancy by Age of Householder in Cedar Mill
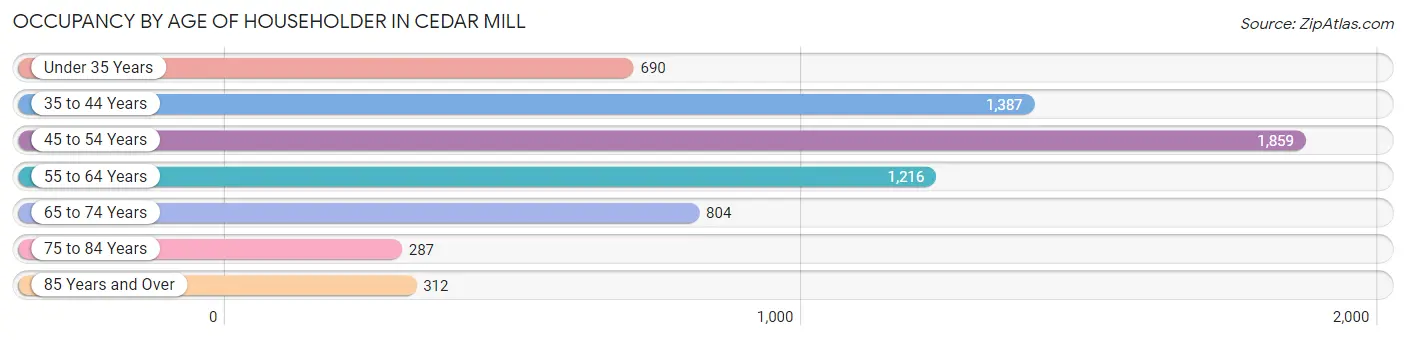
| Age Bracket | # Households | % Households |
| Under 35 Years | 690 | 10.5% |
| 35 to 44 Years | 1,387 | 21.2% |
| 45 to 54 Years | 1,859 | 28.4% |
| 55 to 64 Years | 1,216 | 18.5% |
| 65 to 74 Years | 804 | 12.3% |
| 75 to 84 Years | 287 | 4.4% |
| 85 Years and Over | 312 | 4.8% |
| Total | 6,555 | 100.0% |
Housing Finances in Cedar Mill
Median Income by Occupancy in Cedar Mill
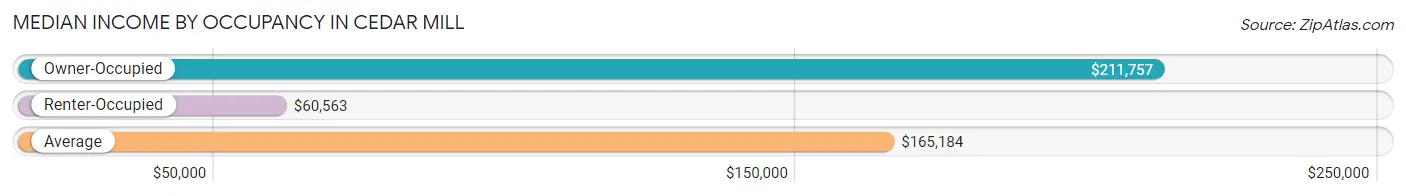
| Occupancy Type | # Households | Median Income |
| Owner-Occupied | 4,996 (76.2%) | $211,757 |
| Renter-Occupied | 1,559 (23.8%) | $60,563 |
| Average | 6,555 (100.0%) | $165,184 |
Occupancy by Householder Income Bracket in Cedar Mill
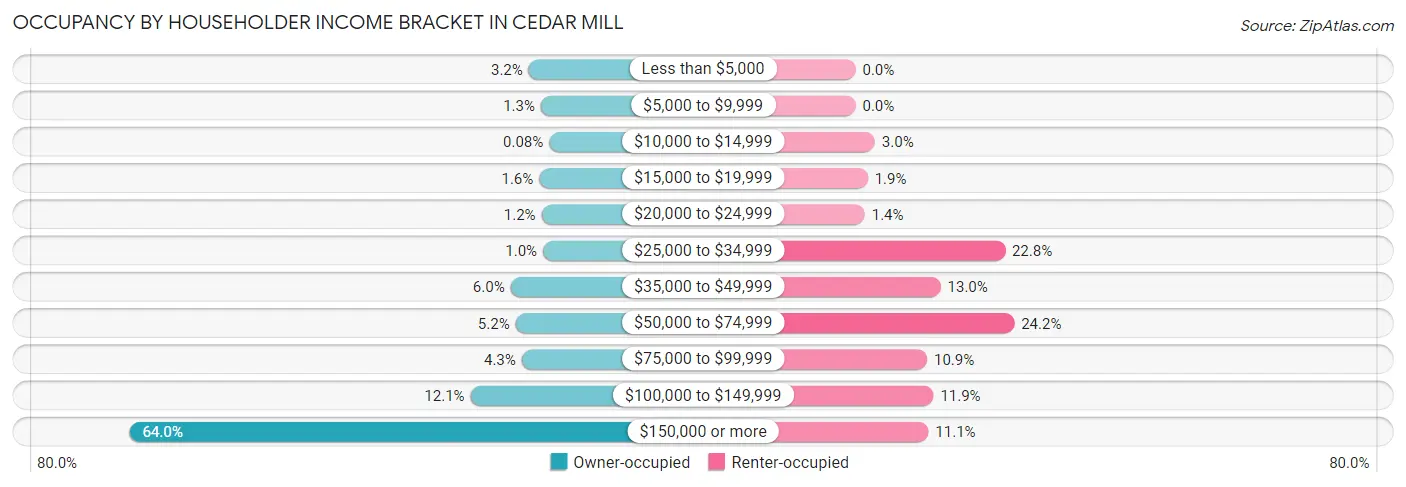
| Income Bracket | Owner-occupied | Renter-occupied |
| Less than $5,000 | 160 (3.2%) | 0 (0.0%) |
| $5,000 to $9,999 | 67 (1.3%) | 0 (0.0%) |
| $10,000 to $14,999 | 4 (0.1%) | 46 (2.9%) |
| $15,000 to $19,999 | 80 (1.6%) | 29 (1.9%) |
| $20,000 to $24,999 | 62 (1.2%) | 22 (1.4%) |
| $25,000 to $34,999 | 51 (1.0%) | 355 (22.8%) |
| $35,000 to $49,999 | 298 (6.0%) | 202 (13.0%) |
| $50,000 to $74,999 | 260 (5.2%) | 377 (24.2%) |
| $75,000 to $99,999 | 213 (4.3%) | 170 (10.9%) |
| $100,000 to $149,999 | 603 (12.1%) | 185 (11.9%) |
| $150,000 or more | 3,198 (64.0%) | 173 (11.1%) |
| Total | 4,996 (100.0%) | 1,559 (100.0%) |
Monthly Housing Cost Tiers in Cedar Mill
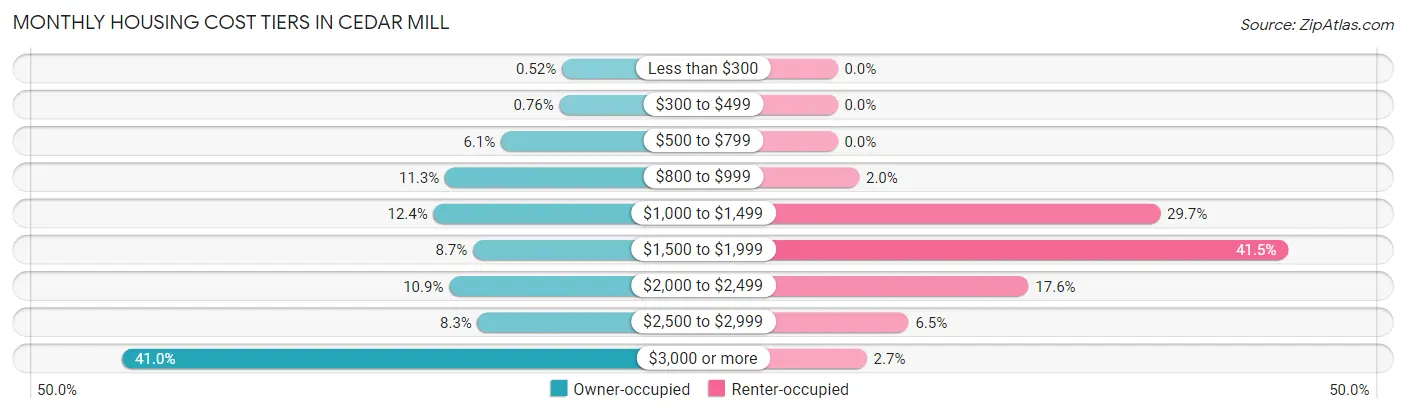
| Monthly Cost | Owner-occupied | Renter-occupied |
| Less than $300 | 26 (0.5%) | 0 (0.0%) |
| $300 to $499 | 38 (0.8%) | 0 (0.0%) |
| $500 to $799 | 307 (6.1%) | 0 (0.0%) |
| $800 to $999 | 564 (11.3%) | 31 (2.0%) |
| $1,000 to $1,499 | 617 (12.3%) | 463 (29.7%) |
| $1,500 to $1,999 | 435 (8.7%) | 647 (41.5%) |
| $2,000 to $2,499 | 545 (10.9%) | 274 (17.6%) |
| $2,500 to $2,999 | 414 (8.3%) | 102 (6.5%) |
| $3,000 or more | 2,050 (41.0%) | 42 (2.7%) |
| Total | 4,996 (100.0%) | 1,559 (100.0%) |
Physical Housing Characteristics in Cedar Mill
Housing Structures in Cedar Mill
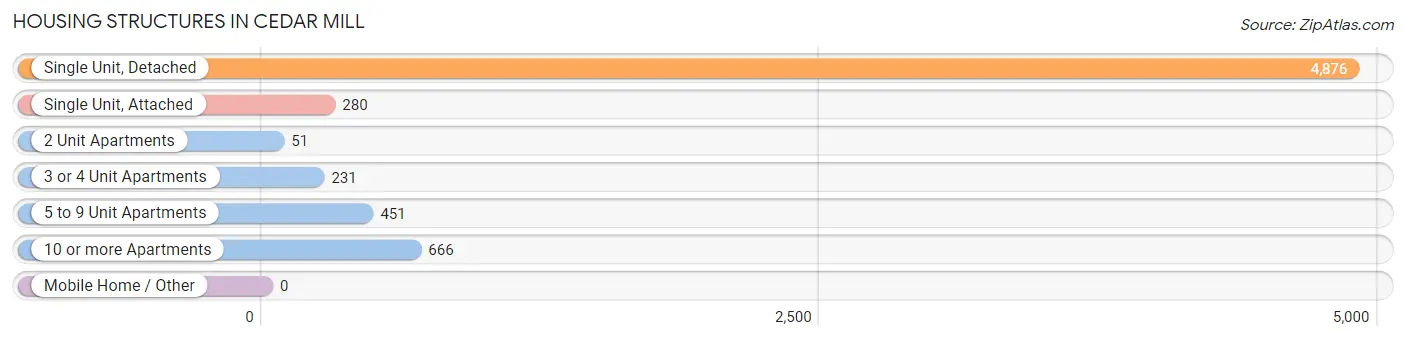
| Structure Type | # Housing Units | % Housing Units |
| Single Unit, Detached | 4,876 | 74.4% |
| Single Unit, Attached | 280 | 4.3% |
| 2 Unit Apartments | 51 | 0.8% |
| 3 or 4 Unit Apartments | 231 | 3.5% |
| 5 to 9 Unit Apartments | 451 | 6.9% |
| 10 or more Apartments | 666 | 10.2% |
| Mobile Home / Other | 0 | 0.0% |
| Total | 6,555 | 100.0% |
Housing Structures by Occupancy in Cedar Mill
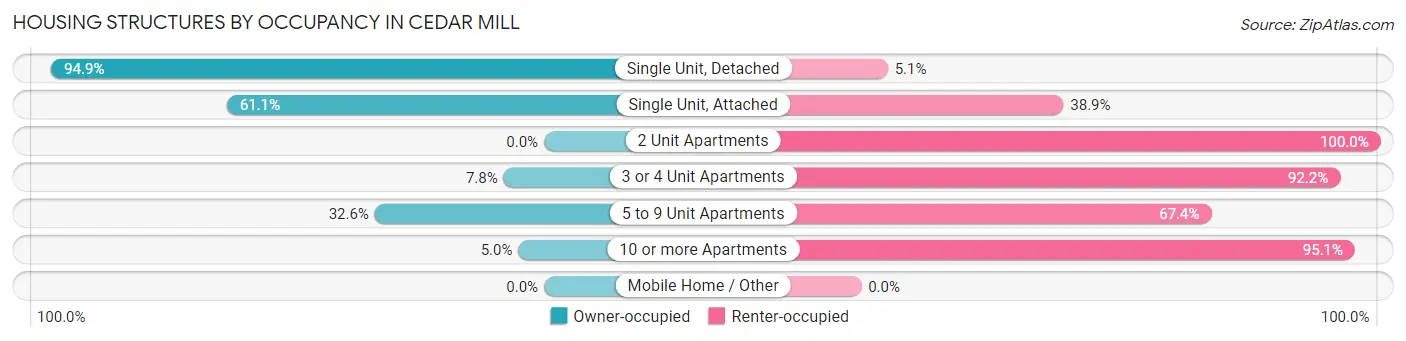
| Structure Type | Owner-occupied | Renter-occupied |
| Single Unit, Detached | 4,627 (94.9%) | 249 (5.1%) |
| Single Unit, Attached | 171 (61.1%) | 109 (38.9%) |
| 2 Unit Apartments | 0 (0.0%) | 51 (100.0%) |
| 3 or 4 Unit Apartments | 18 (7.8%) | 213 (92.2%) |
| 5 to 9 Unit Apartments | 147 (32.6%) | 304 (67.4%) |
| 10 or more Apartments | 33 (5.0%) | 633 (95.1%) |
| Mobile Home / Other | 0 (0.0%) | 0 (0.0%) |
| Total | 4,996 (76.2%) | 1,559 (23.8%) |
Housing Structures by Number of Rooms in Cedar Mill
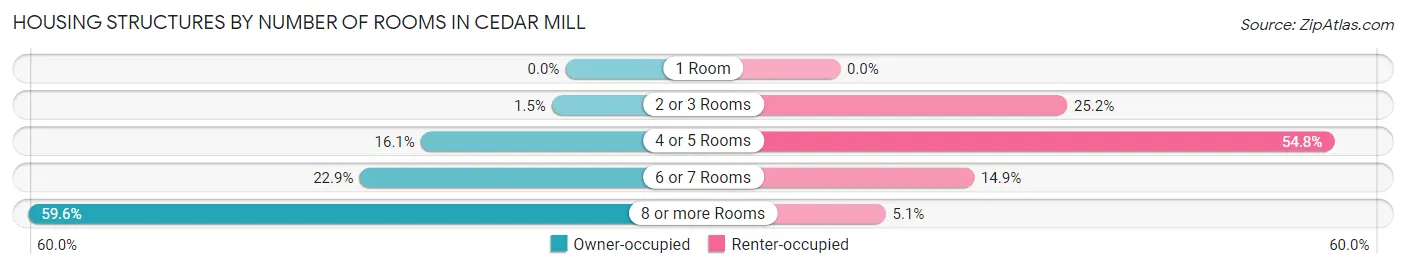
| Number of Rooms | Owner-occupied | Renter-occupied |
| 1 Room | 0 (0.0%) | 0 (0.0%) |
| 2 or 3 Rooms | 75 (1.5%) | 393 (25.2%) |
| 4 or 5 Rooms | 802 (16.1%) | 855 (54.8%) |
| 6 or 7 Rooms | 1,142 (22.9%) | 232 (14.9%) |
| 8 or more Rooms | 2,977 (59.6%) | 79 (5.1%) |
| Total | 4,996 (100.0%) | 1,559 (100.0%) |
Housing Structure by Heating Type in Cedar Mill
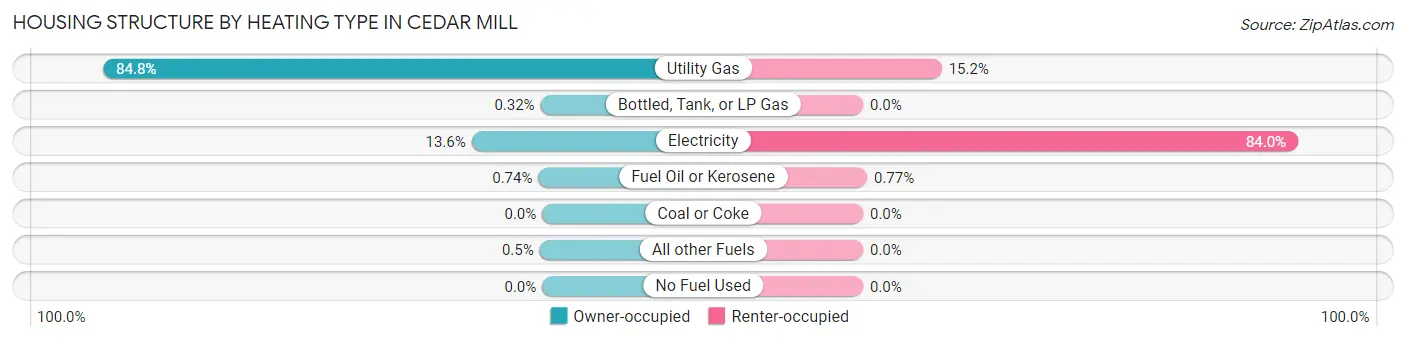
| Heating Type | Owner-occupied | Renter-occupied |
| Utility Gas | 4,237 (84.8%) | 237 (15.2%) |
| Bottled, Tank, or LP Gas | 16 (0.3%) | 0 (0.0%) |
| Electricity | 681 (13.6%) | 1,310 (84.0%) |
| Fuel Oil or Kerosene | 37 (0.7%) | 12 (0.8%) |
| Coal or Coke | 0 (0.0%) | 0 (0.0%) |
| All other Fuels | 25 (0.5%) | 0 (0.0%) |
| No Fuel Used | 0 (0.0%) | 0 (0.0%) |
| Total | 4,996 (100.0%) | 1,559 (100.0%) |
Household Vehicle Usage in Cedar Mill
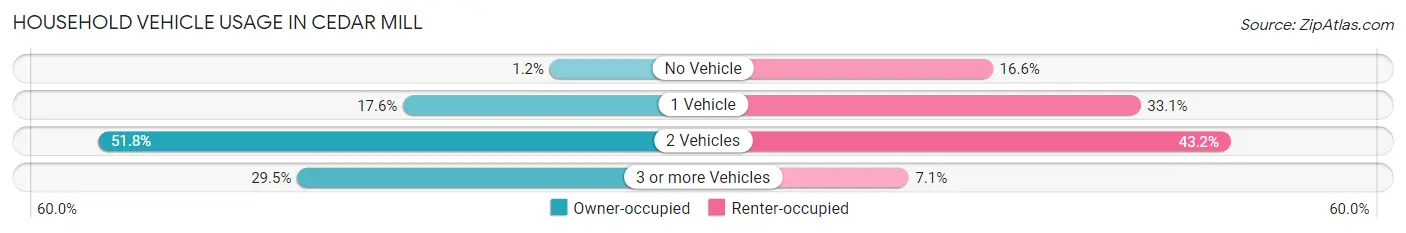
| Vehicles per Household | Owner-occupied | Renter-occupied |
| No Vehicle | 58 (1.2%) | 258 (16.6%) |
| 1 Vehicle | 879 (17.6%) | 516 (33.1%) |
| 2 Vehicles | 2,587 (51.8%) | 674 (43.2%) |
| 3 or more Vehicles | 1,472 (29.5%) | 111 (7.1%) |
| Total | 4,996 (100.0%) | 1,559 (100.0%) |
Real Estate & Mortgages in Cedar Mill
Real Estate and Mortgage Overview in Cedar Mill
| Characteristic | Without Mortgage | With Mortgage |
| Housing Units | 1,643 | 3,353 |
| Median Property Value | $776,100 | $829,500 |
| Median Household Income | $186,467 | $2,315 |
| Monthly Housing Costs | $970 | $2,039 |
| Real Estate Taxes | $7,079 | $9 |
Property Value by Mortgage Status in Cedar Mill
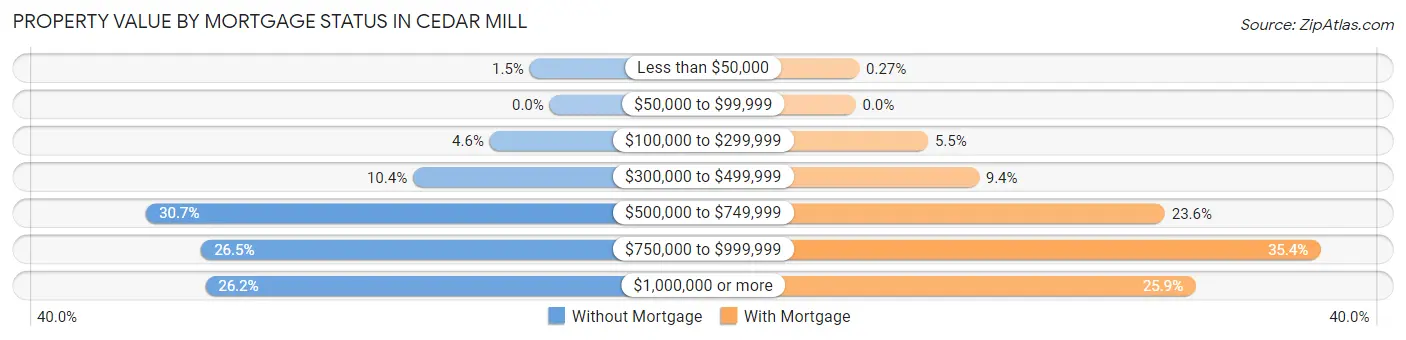
| Property Value | Without Mortgage | With Mortgage |
| Less than $50,000 | 25 (1.5%) | 9 (0.3%) |
| $50,000 to $99,999 | 0 (0.0%) | 0 (0.0%) |
| $100,000 to $299,999 | 75 (4.6%) | 185 (5.5%) |
| $300,000 to $499,999 | 171 (10.4%) | 315 (9.4%) |
| $500,000 to $749,999 | 505 (30.7%) | 790 (23.6%) |
| $750,000 to $999,999 | 436 (26.5%) | 1,187 (35.4%) |
| $1,000,000 or more | 431 (26.2%) | 867 (25.9%) |
| Total | 1,643 (100.0%) | 3,353 (100.0%) |
Household Income by Mortgage Status in Cedar Mill
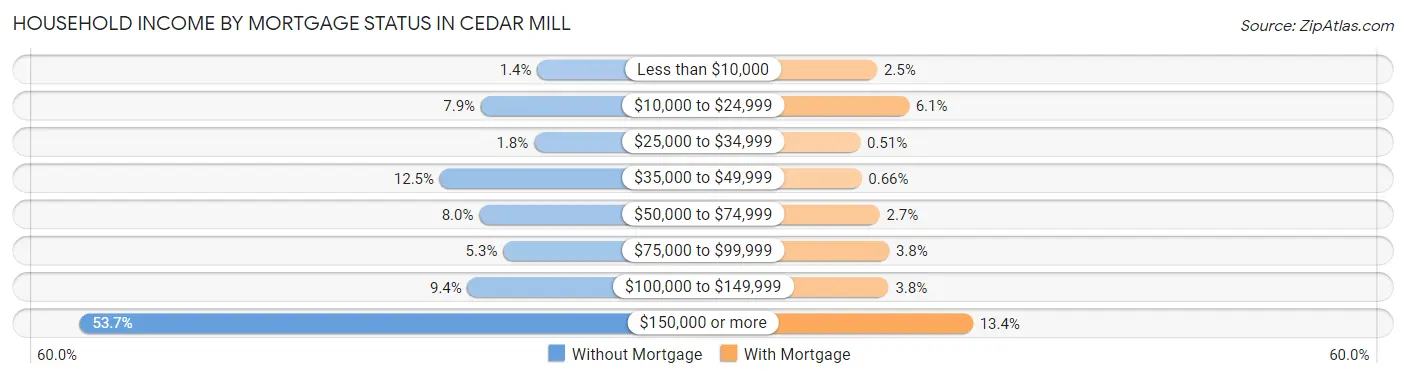
| Household Income | Without Mortgage | With Mortgage |
| Less than $10,000 | 23 (1.4%) | 82 (2.5%) |
| $10,000 to $24,999 | 129 (7.9%) | 204 (6.1%) |
| $25,000 to $34,999 | 29 (1.8%) | 17 (0.5%) |
| $35,000 to $49,999 | 206 (12.5%) | 22 (0.7%) |
| $50,000 to $74,999 | 132 (8.0%) | 92 (2.7%) |
| $75,000 to $99,999 | 87 (5.3%) | 128 (3.8%) |
| $100,000 to $149,999 | 154 (9.4%) | 126 (3.8%) |
| $150,000 or more | 883 (53.7%) | 449 (13.4%) |
| Total | 1,643 (100.0%) | 3,353 (100.0%) |
Property Value to Household Income Ratio in Cedar Mill
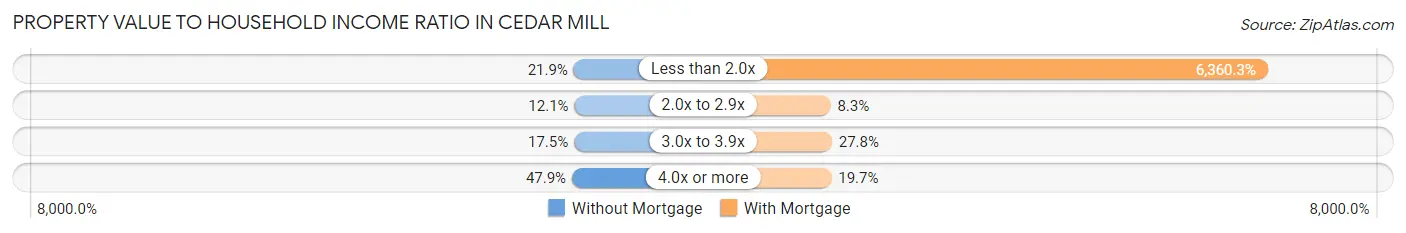
| Value-to-Income Ratio | Without Mortgage | With Mortgage |
| Less than 2.0x | 360 (21.9%) | 213,260 (6,360.3%) |
| 2.0x to 2.9x | 199 (12.1%) | 279 (8.3%) |
| 3.0x to 3.9x | 287 (17.5%) | 932 (27.8%) |
| 4.0x or more | 787 (47.9%) | 662 (19.7%) |
| Total | 1,643 (100.0%) | 3,353 (100.0%) |
Real Estate Taxes by Mortgage Status in Cedar Mill
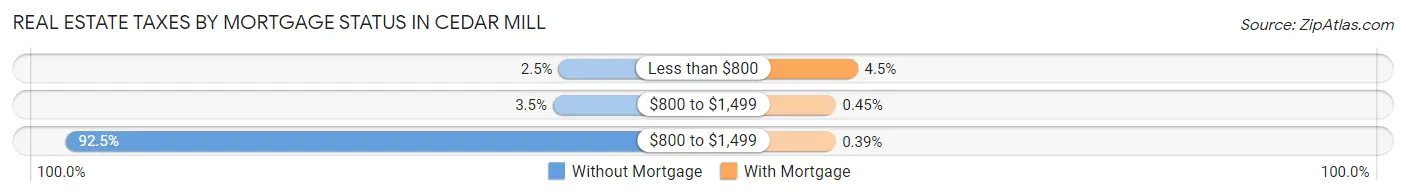
| Property Taxes | Without Mortgage | With Mortgage |
| Less than $800 | 41 (2.5%) | 150 (4.5%) |
| $800 to $1,499 | 58 (3.5%) | 15 (0.4%) |
| $800 to $1,499 | 1,520 (92.5%) | 13 (0.4%) |
| Total | 1,643 (100.0%) | 3,353 (100.0%) |
Health & Disability in Cedar Mill
Health Insurance Coverage by Age in Cedar Mill
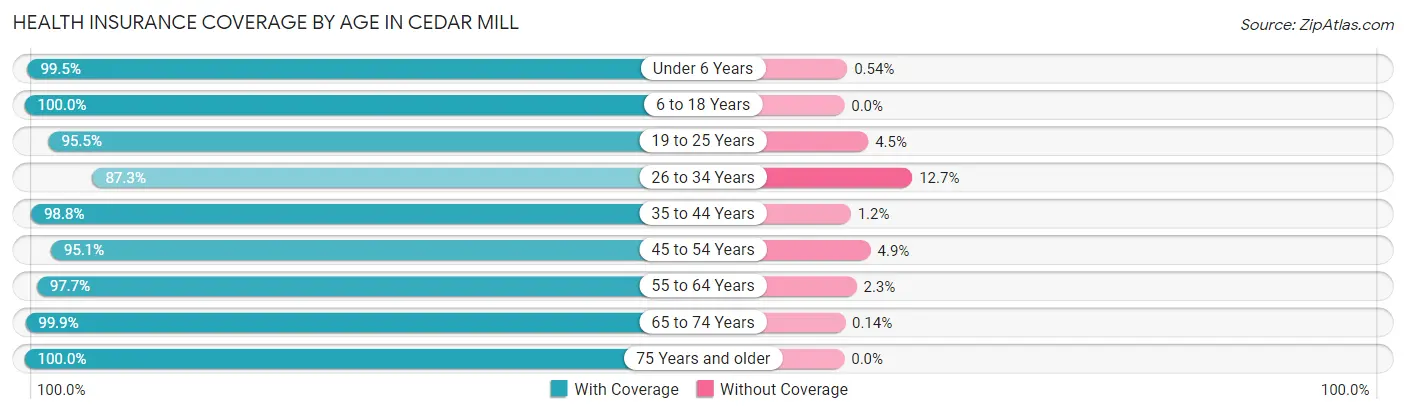
| Age Bracket | With Coverage | Without Coverage |
| Under 6 Years | 1,848 (99.5%) | 10 (0.5%) |
| 6 to 18 Years | 4,121 (100.0%) | 0 (0.0%) |
| 19 to 25 Years | 942 (95.5%) | 44 (4.5%) |
| 26 to 34 Years | 1,365 (87.3%) | 198 (12.7%) |
| 35 to 44 Years | 3,039 (98.8%) | 37 (1.2%) |
| 45 to 54 Years | 2,991 (95.1%) | 154 (4.9%) |
| 55 to 64 Years | 2,015 (97.7%) | 47 (2.3%) |
| 65 to 74 Years | 1,430 (99.9%) | 2 (0.1%) |
| 75 Years and older | 908 (100.0%) | 0 (0.0%) |
| Total | 18,659 (97.4%) | 492 (2.6%) |
Health Insurance Coverage by Citizenship Status in Cedar Mill
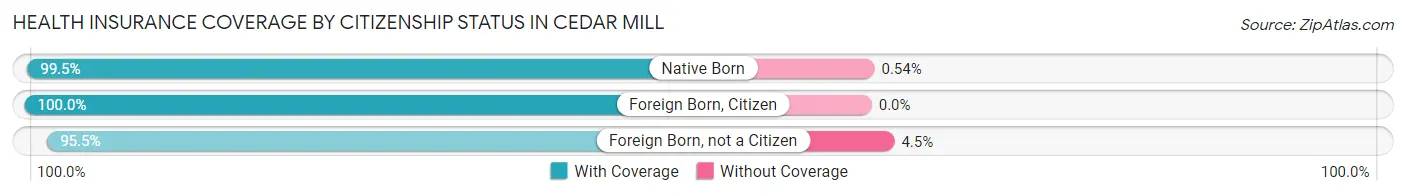
| Citizenship Status | With Coverage | Without Coverage |
| Native Born | 1,848 (99.5%) | 10 (0.5%) |
| Foreign Born, Citizen | 4,121 (100.0%) | 0 (0.0%) |
| Foreign Born, not a Citizen | 942 (95.5%) | 44 (4.5%) |
Health Insurance Coverage by Household Income in Cedar Mill
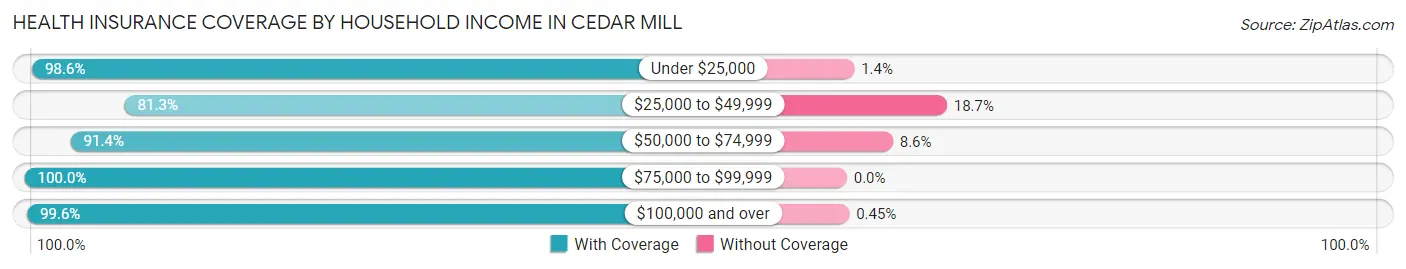
| Household Income | With Coverage | Without Coverage |
| Under $25,000 | 781 (98.6%) | 11 (1.4%) |
| $25,000 to $49,999 | 1,214 (81.3%) | 280 (18.7%) |
| $50,000 to $74,999 | 1,452 (91.4%) | 137 (8.6%) |
| $75,000 to $99,999 | 895 (100.0%) | 0 (0.0%) |
| $100,000 and over | 14,285 (99.6%) | 64 (0.4%) |
Public vs Private Health Insurance Coverage by Age in Cedar Mill
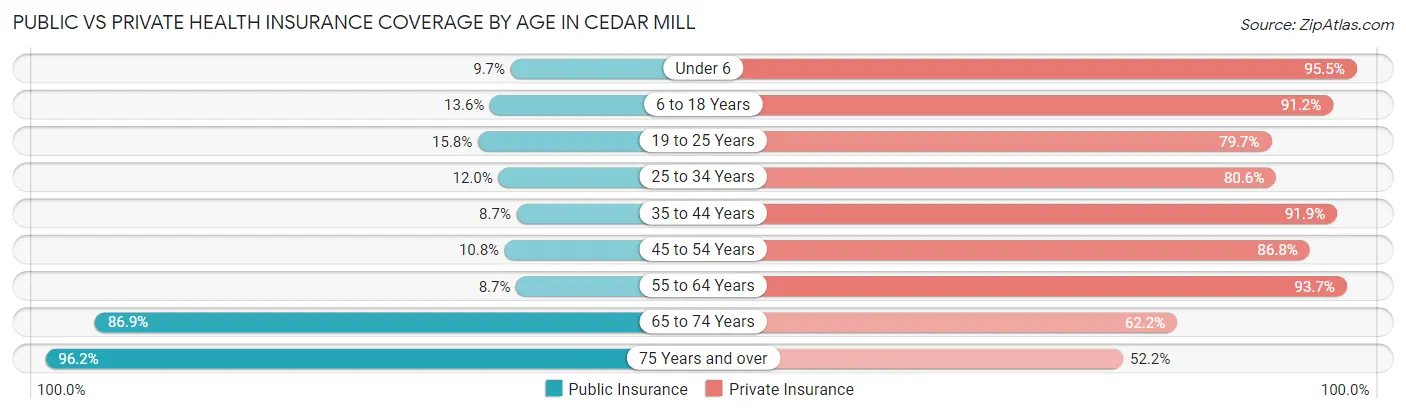
| Age Bracket | Public Insurance | Private Insurance |
| Under 6 | 181 (9.7%) | 1,775 (95.5%) |
| 6 to 18 Years | 560 (13.6%) | 3,758 (91.2%) |
| 19 to 25 Years | 156 (15.8%) | 786 (79.7%) |
| 25 to 34 Years | 188 (12.0%) | 1,260 (80.6%) |
| 35 to 44 Years | 266 (8.6%) | 2,827 (91.9%) |
| 45 to 54 Years | 341 (10.8%) | 2,731 (86.8%) |
| 55 to 64 Years | 180 (8.7%) | 1,932 (93.7%) |
| 65 to 74 Years | 1,245 (86.9%) | 891 (62.2%) |
| 75 Years and over | 873 (96.2%) | 474 (52.2%) |
| Total | 3,990 (20.8%) | 16,434 (85.8%) |
Disability Status by Sex by Age in Cedar Mill
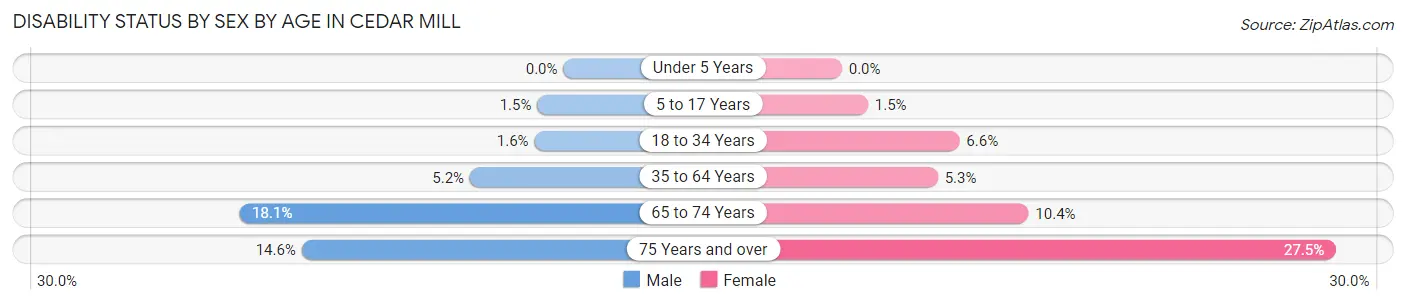
| Age Bracket | Male | Female |
| Under 5 Years | 0 (0.0%) | 0 (0.0%) |
| 5 to 17 Years | 31 (1.5%) | 32 (1.5%) |
| 18 to 34 Years | 23 (1.6%) | 89 (6.6%) |
| 35 to 64 Years | 224 (5.2%) | 212 (5.3%) |
| 65 to 74 Years | 123 (18.1%) | 78 (10.4%) |
| 75 Years and over | 73 (14.6%) | 112 (27.5%) |
Disability Class by Sex by Age in Cedar Mill
Disability Class: Hearing Difficulty
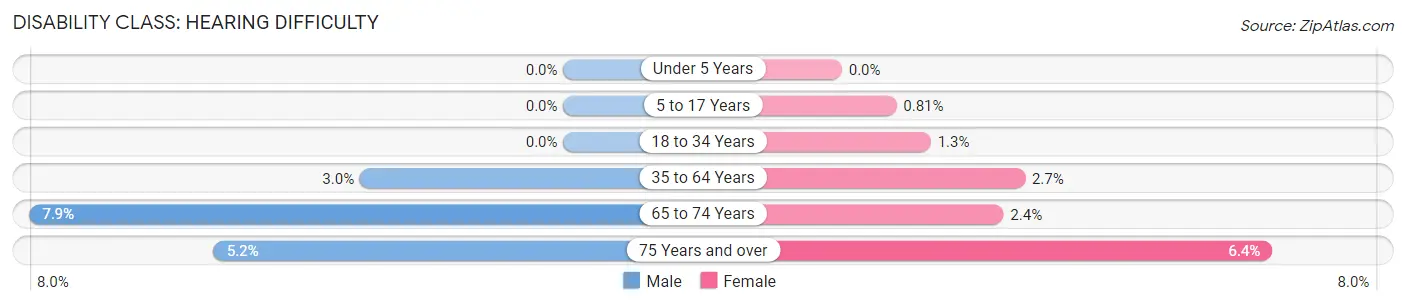
| Age Bracket | Male | Female |
| Under 5 Years | 0 (0.0%) | 0 (0.0%) |
| 5 to 17 Years | 0 (0.0%) | 18 (0.8%) |
| 18 to 34 Years | 0 (0.0%) | 18 (1.3%) |
| 35 to 64 Years | 130 (3.0%) | 108 (2.7%) |
| 65 to 74 Years | 54 (7.9%) | 18 (2.4%) |
| 75 Years and over | 26 (5.2%) | 26 (6.4%) |
Disability Class: Vision Difficulty
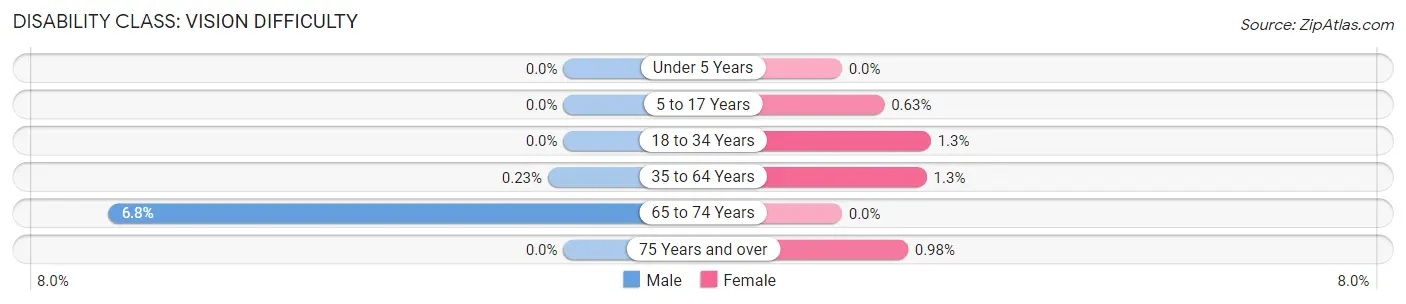
| Age Bracket | Male | Female |
| Under 5 Years | 0 (0.0%) | 0 (0.0%) |
| 5 to 17 Years | 0 (0.0%) | 14 (0.6%) |
| 18 to 34 Years | 0 (0.0%) | 18 (1.3%) |
| 35 to 64 Years | 10 (0.2%) | 50 (1.3%) |
| 65 to 74 Years | 46 (6.8%) | 0 (0.0%) |
| 75 Years and over | 0 (0.0%) | 4 (1.0%) |
Disability Class: Cognitive Difficulty
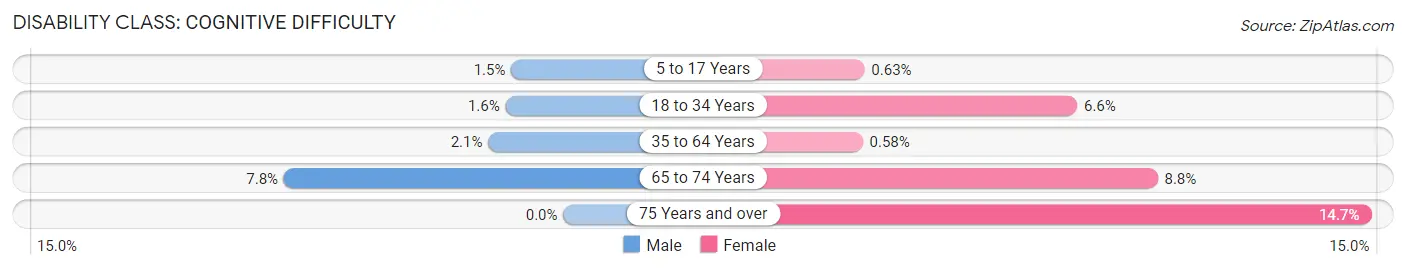
| Age Bracket | Male | Female |
| 5 to 17 Years | 31 (1.5%) | 14 (0.6%) |
| 18 to 34 Years | 23 (1.6%) | 89 (6.6%) |
| 35 to 64 Years | 90 (2.1%) | 23 (0.6%) |
| 65 to 74 Years | 53 (7.8%) | 66 (8.8%) |
| 75 Years and over | 0 (0.0%) | 60 (14.7%) |
Disability Class: Ambulatory Difficulty
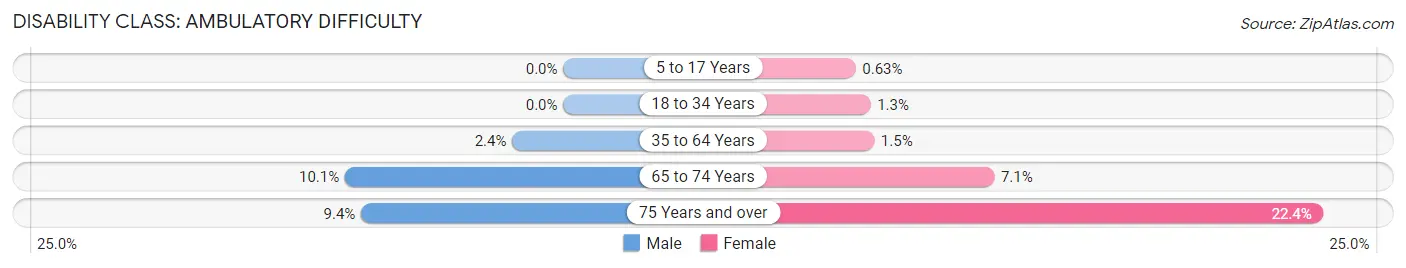
| Age Bracket | Male | Female |
| 5 to 17 Years | 0 (0.0%) | 14 (0.6%) |
| 18 to 34 Years | 0 (0.0%) | 18 (1.3%) |
| 35 to 64 Years | 102 (2.4%) | 59 (1.5%) |
| 65 to 74 Years | 69 (10.1%) | 53 (7.1%) |
| 75 Years and over | 47 (9.4%) | 91 (22.4%) |
Disability Class: Self-Care Difficulty
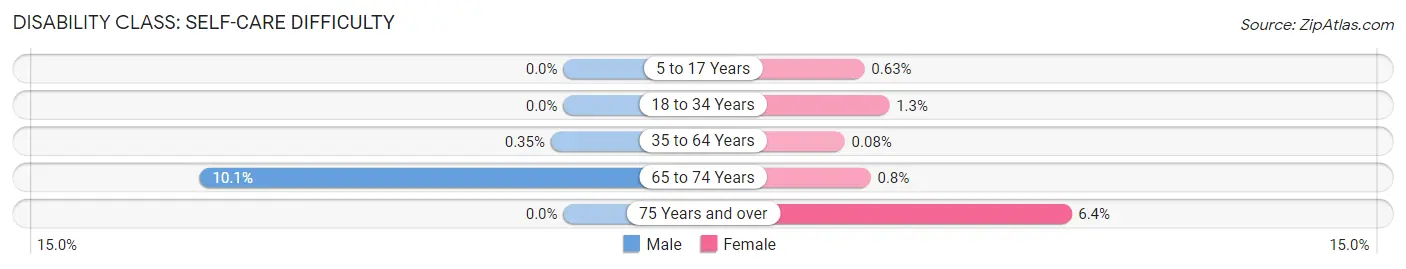
| Age Bracket | Male | Female |
| 5 to 17 Years | 0 (0.0%) | 14 (0.6%) |
| 18 to 34 Years | 0 (0.0%) | 18 (1.3%) |
| 35 to 64 Years | 15 (0.4%) | 3 (0.1%) |
| 65 to 74 Years | 69 (10.1%) | 6 (0.8%) |
| 75 Years and over | 0 (0.0%) | 26 (6.4%) |
Technology Access in Cedar Mill
Computing Device Access in Cedar Mill
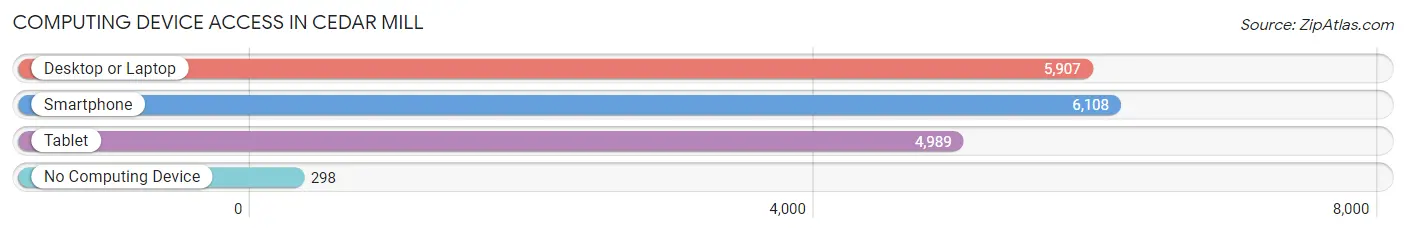
| Device Type | # Households | % Households |
| Desktop or Laptop | 5,907 | 90.1% |
| Smartphone | 6,108 | 93.2% |
| Tablet | 4,989 | 76.1% |
| No Computing Device | 298 | 4.5% |
| Total | 6,555 | 100.0% |
Internet Access in Cedar Mill
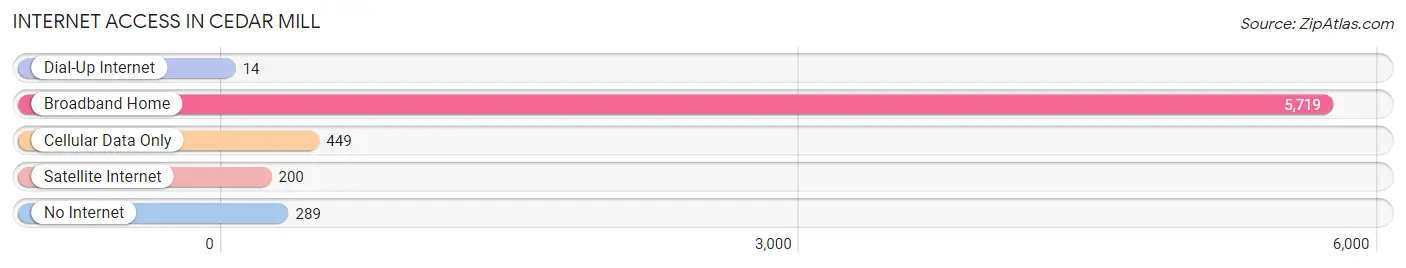
| Internet Type | # Households | % Households |
| Dial-Up Internet | 14 | 0.2% |
| Broadband Home | 5,719 | 87.3% |
| Cellular Data Only | 449 | 6.9% |
| Satellite Internet | 200 | 3.0% |
| No Internet | 289 | 4.4% |
| Total | 6,555 | 100.0% |
Cedar Mill Summary
Cedar Mill is an unincorporated community located in Washington County, Oregon, United States. It is located in the Tualatin Valley, just west of the city of Portland. The community is named after a sawmill that was built in the area in the late 19th century.
Geography
Cedar Mill is located in the Tualatin Valley, just west of the city of Portland. It is bordered by the cities of Beaverton to the north, Hillsboro to the west, and Portland to the east. The community is situated on the western edge of the Tualatin Mountains, which form the eastern boundary of the Tualatin Valley. The area is characterized by rolling hills and valleys, with elevations ranging from 200 to 500 feet above sea level.
The climate in Cedar Mill is mild and temperate, with warm summers and cool winters. The average annual temperature is around 50°F, with average highs in the summer months reaching into the mid-80s and lows in the winter months dipping into the mid-30s. The area receives an average of 37 inches of precipitation per year, with most of it falling in the winter months.
Demographics
As of the 2010 census, the population of Cedar Mill was 8,845. The population is predominantly white (90.2%), with a small minority population (9.8%). The median household income is $90,845, and the median age is 40.
Economy
Cedar Mill is home to a variety of businesses, including retail stores, restaurants, and professional services. The area is also home to several technology companies, including Intel, which has a large campus in the area. The area is also home to several medical facilities, including the Oregon Health & Science University, which is located just outside of the community.
The area is served by several major highways, including Interstate 5, which runs through the center of the community. The area is also served by TriMet, the regional public transportation system, which provides bus and light rail service to the area.
Conclusion
Cedar Mill is a small, unincorporated community located in Washington County, Oregon. It is situated in the Tualatin Valley, just west of the city of Portland. The area is characterized by rolling hills and valleys, with elevations ranging from 200 to 500 feet above sea level. The population of Cedar Mill is predominantly white, with a median household income of $90,845 and a median age of 40. The area is home to a variety of businesses, including retail stores, restaurants, and professional services. It is also served by several major highways, including Interstate 5, and is served by TriMet, the regional public transportation system.
Common Questions
What is the Total Population of Cedar Mill?
Total Population of Cedar Mill is 19,151.
What is the Total Male Population of Cedar Mill?
Total Male Population of Cedar Mill is 9,576.
What is the Total Female Population of Cedar Mill?
Total Female Population of Cedar Mill is 9,575.
What is the Ratio of Males per 100 Females in Cedar Mill?
There are 100.01 Males per 100 Females in Cedar Mill.
What is the Ratio of Females per 100 Males in Cedar Mill?
There are 99.99 Females per 100 Males in Cedar Mill.
What is the Median Population Age in Cedar Mill?
Median Population Age in Cedar Mill is 38.3 Years.
What is the Average Family Size in Cedar Mill
Average Family Size in Cedar Mill is 3.4 People.
What is the Average Household Size in Cedar Mill
Average Household Size in Cedar Mill is 2.9 People.
What is Per Capita Income in Cedar Mill?
Per Capita income in Cedar Mill is $76,372.
What is the Median Family Income in Cedar Mill?
Median Family Income in Cedar Mill is $208,787.
What is the Median Household income in Cedar Mill?
Median Household Income in Cedar Mill is $165,184.
What is Income or Wage Gap in Cedar Mill?
Income or Wage Gap in Cedar Mill is 45.8%.
Women in Cedar Mill earn 54.2 cents for every dollar earned by a man.
What is Inequality or Gini Index in Cedar Mill?
Inequality or Gini Index in Cedar Mill is 0.50.
How Large is the Labor Force in Cedar Mill?
There are 9,782 People in the Labor Forcein in Cedar Mill.
What is the Percentage of People in the Labor Force in Cedar Mill?
69.1% of People are in the Labor Force in Cedar Mill.
What is the Unemployment Rate in Cedar Mill?
Unemployment Rate in Cedar Mill is 6.8%.