Canyon City, OR
Canyon City Map
Canyon City Overview
834
TOTAL POPULATION
385
MALE POPULATION
449
FEMALE POPULATION
85.75
MALES / 100 FEMALES
116.62
FEMALES / 100 MALES
43.0
MEDIAN AGE
2.7
AVG FAMILY SIZE
2.1
AVG HOUSEHOLD SIZE
$33,843
PER CAPITA INCOME
$103,024
AVG FAMILY INCOME
$62,125
AVG HOUSEHOLD INCOME
31.3%
WAGE / INCOME GAP [ % ]
68.7¢/ $1
WAGE / INCOME GAP [ $ ]
0.40
INEQUALITY / GINI INDEX
384
LABOR FORCE [ PEOPLE ]
57.1%
PERCENT IN LABOR FORCE
5.5%
UNEMPLOYMENT RATE
Canyon City Zip Codes
Canyon City Area Codes
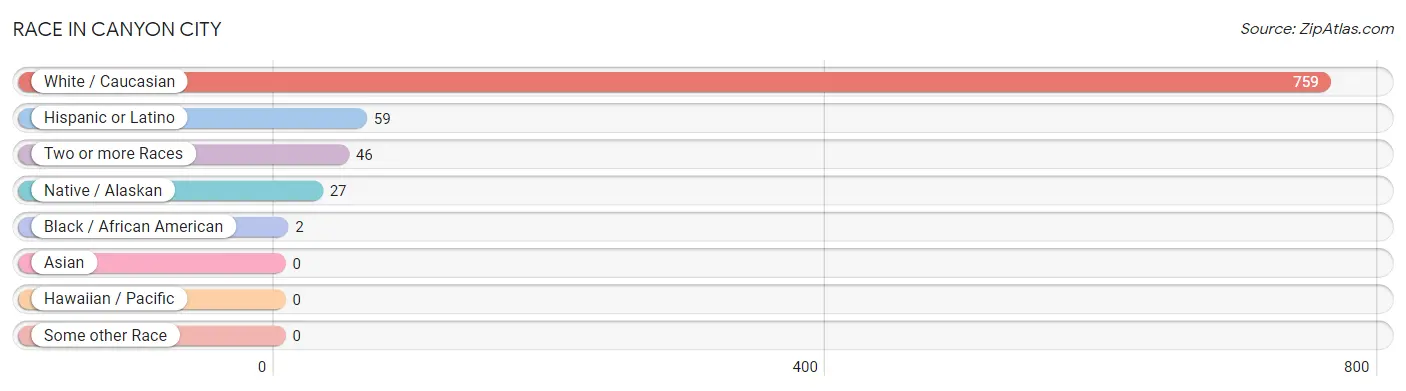
Race in Canyon City
The most populous races in Canyon City are White / Caucasian (759 | 91.0%), Hispanic or Latino (59 | 7.1%), and Two or more Races (46 | 5.5%).
| Race | # Population | % Population |
| Asian | 0 | 0.0% |
| Black / African American | 2 | 0.2% |
| Hawaiian / Pacific | 0 | 0.0% |
| Hispanic or Latino | 59 | 7.1% |
| Native / Alaskan | 27 | 3.2% |
| White / Caucasian | 759 | 91.0% |
| Two or more Races | 46 | 5.5% |
| Some other Race | 0 | 0.0% |
| Total | 834 | 100.0% |
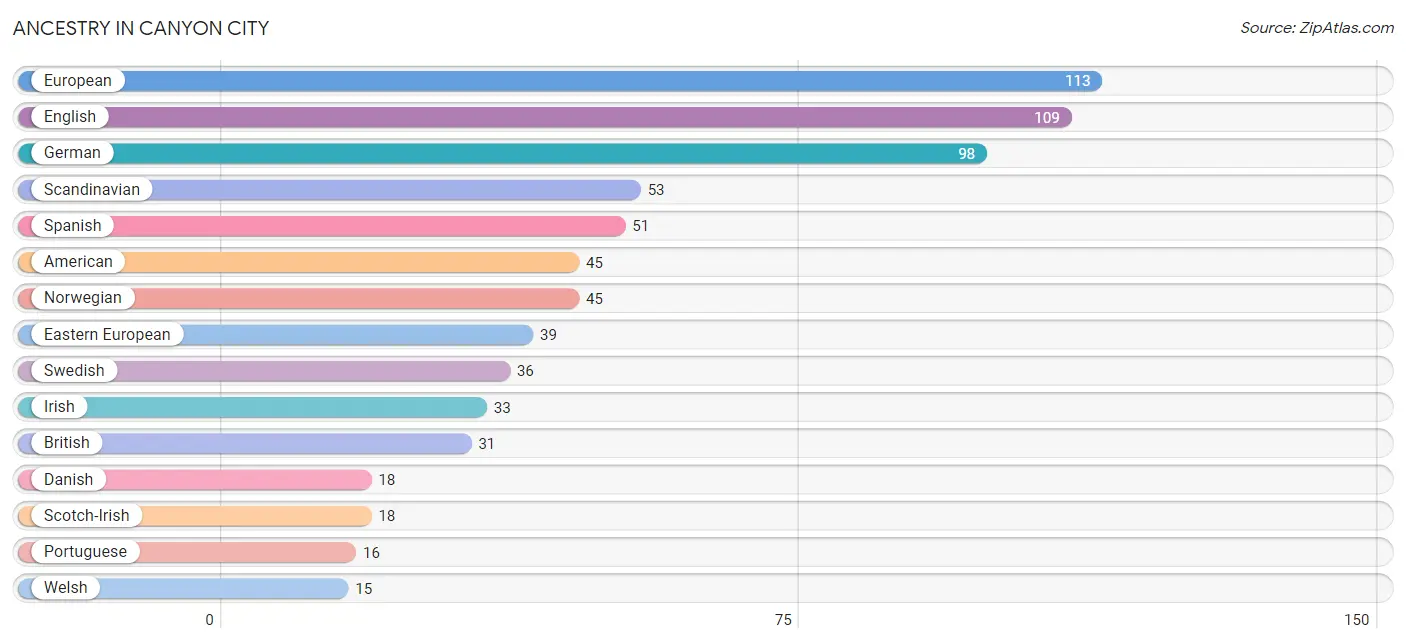
Ancestry in Canyon City
The most populous ancestries reported in Canyon City are European (113 | 13.6%), English (109 | 13.1%), German (98 | 11.7%), Scandinavian (53 | 6.4%), and Spanish (51 | 6.1%), together accounting for 50.8% of all Canyon City residents.
| Ancestry | # Population | % Population |
| American | 45 | 5.4% |
| Armenian | 8 | 1.0% |
| Bhutanese | 5 | 0.6% |
| British | 31 | 3.7% |
| Cherokee | 6 | 0.7% |
| Croatian | 12 | 1.4% |
| Czech | 3 | 0.4% |
| Danish | 18 | 2.2% |
| Dutch | 5 | 0.6% |
| Eastern European | 39 | 4.7% |
| English | 109 | 13.1% |
| European | 113 | 13.6% |
| French | 11 | 1.3% |
| German | 98 | 11.7% |
| Irish | 33 | 4.0% |
| Mexican | 6 | 0.7% |
| Navajo | 12 | 1.4% |
| Norwegian | 45 | 5.4% |
| Polish | 3 | 0.4% |
| Portuguese | 16 | 1.9% |
| Puerto Rican | 2 | 0.2% |
| Samoan | 2 | 0.2% |
| Scandinavian | 53 | 6.4% |
| Scotch-Irish | 18 | 2.2% |
| Scottish | 3 | 0.4% |
| Sioux | 5 | 0.6% |
| Slavic | 8 | 1.0% |
| Spanish | 51 | 6.1% |
| Swedish | 36 | 4.3% |
| Swiss | 5 | 0.6% |
| Thai | 1 | 0.1% |
| Ukrainian | 4 | 0.5% |
| Welsh | 15 | 1.8% | View All 33 Rows |
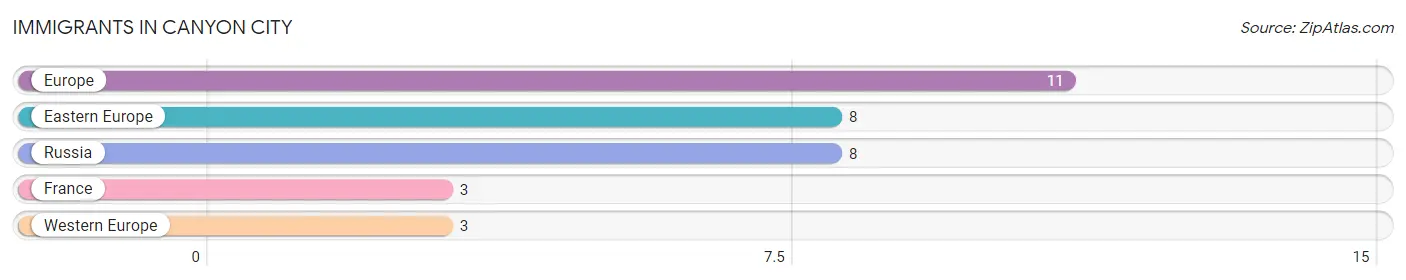
Immigrants in Canyon City
The most numerous immigrant groups reported in Canyon City came from Europe (11 | 1.3%), Eastern Europe (8 | 1.0%), Russia (8 | 1.0%), France (3 | 0.4%), and Western Europe (3 | 0.4%), together accounting for 4.0% of all Canyon City residents.
| Immigration Origin | # Population | % Population |
| Eastern Europe | 8 | 1.0% |
| Europe | 11 | 1.3% |
| France | 3 | 0.4% |
| Russia | 8 | 1.0% |
| Western Europe | 3 | 0.4% | View All 5 Rows |
Sex and Age in Canyon City
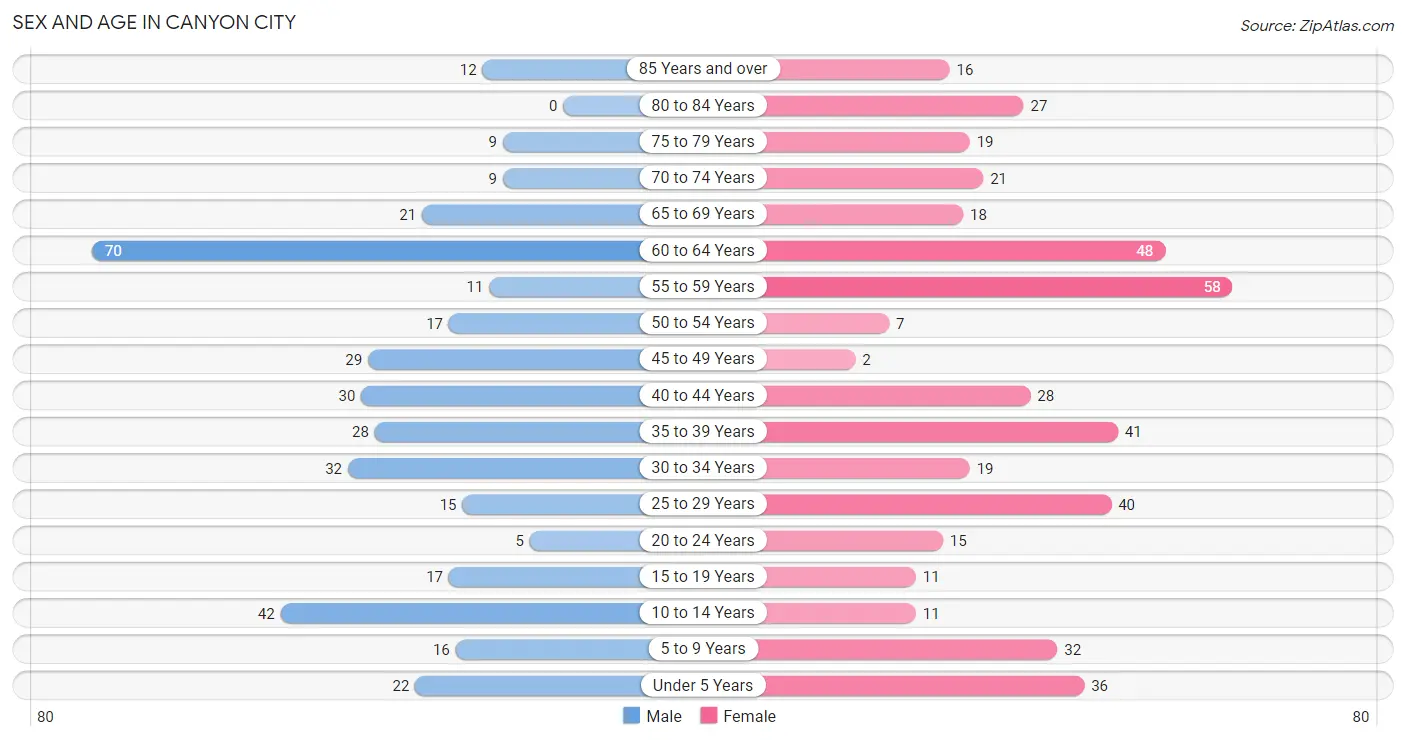
Sex and Age in Canyon City
The most populous age groups in Canyon City are 60 to 64 Years (70 | 18.2%) for men and 55 to 59 Years (58 | 12.9%) for women.
| Age Bracket | Male | Female |
| Under 5 Years | 22 (5.7%) | 36 (8.0%) |
| 5 to 9 Years | 16 (4.2%) | 32 (7.1%) |
| 10 to 14 Years | 42 (10.9%) | 11 (2.5%) |
| 15 to 19 Years | 17 (4.4%) | 11 (2.5%) |
| 20 to 24 Years | 5 (1.3%) | 15 (3.3%) |
| 25 to 29 Years | 15 (3.9%) | 40 (8.9%) |
| 30 to 34 Years | 32 (8.3%) | 19 (4.2%) |
| 35 to 39 Years | 28 (7.3%) | 41 (9.1%) |
| 40 to 44 Years | 30 (7.8%) | 28 (6.2%) |
| 45 to 49 Years | 29 (7.5%) | 2 (0.4%) |
| 50 to 54 Years | 17 (4.4%) | 7 (1.6%) |
| 55 to 59 Years | 11 (2.9%) | 58 (12.9%) |
| 60 to 64 Years | 70 (18.2%) | 48 (10.7%) |
| 65 to 69 Years | 21 (5.4%) | 18 (4.0%) |
| 70 to 74 Years | 9 (2.3%) | 21 (4.7%) |
| 75 to 79 Years | 9 (2.3%) | 19 (4.2%) |
| 80 to 84 Years | 0 (0.0%) | 27 (6.0%) |
| 85 Years and over | 12 (3.1%) | 16 (3.6%) |
| Total | 385 (100.0%) | 449 (100.0%) |
Families and Households in Canyon City
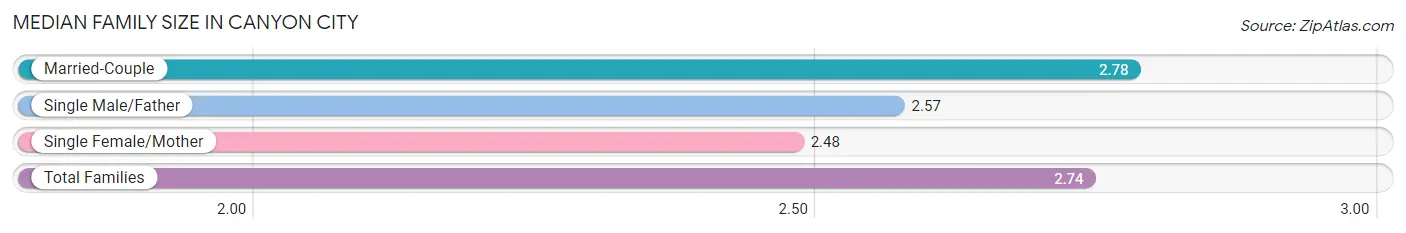
Median Family Size in Canyon City
The median family size in Canyon City is 2.74 persons per family, with married-couple families (187 | 85.4%) accounting for the largest median family size of 2.78 persons per family. On the other hand, single female/mother families (25 | 11.4%) represent the smallest median family size with 2.48 persons per family.
| Family Type | # Families | Family Size |
| Married-Couple | 187 (85.4%) | 2.78 |
| Single Male/Father | 7 (3.2%) | 2.57 |
| Single Female/Mother | 25 (11.4%) | 2.48 |
| Total Families | 219 (100.0%) | 2.74 |
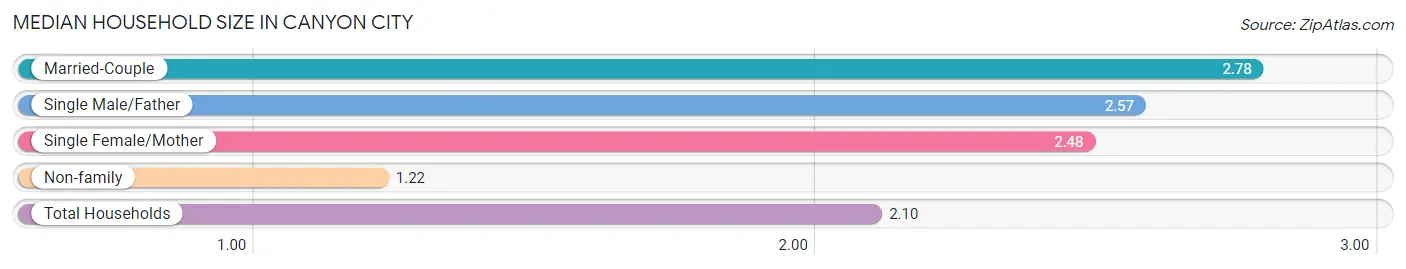
Median Household Size in Canyon City
The median household size in Canyon City is 2.10 persons per household, with married-couple households (187 | 49.9%) accounting for the largest median household size of 2.78 persons per household. non-family households (156 | 41.6%) represent the smallest median household size with 1.22 persons per household.
| Household Type | # Households | Household Size |
| Married-Couple | 187 (49.9%) | 2.78 |
| Single Male/Father | 7 (1.9%) | 2.57 |
| Single Female/Mother | 25 (6.7%) | 2.48 |
| Non-family | 156 (41.6%) | 1.22 |
| Total Households | 375 (100.0%) | 2.10 |
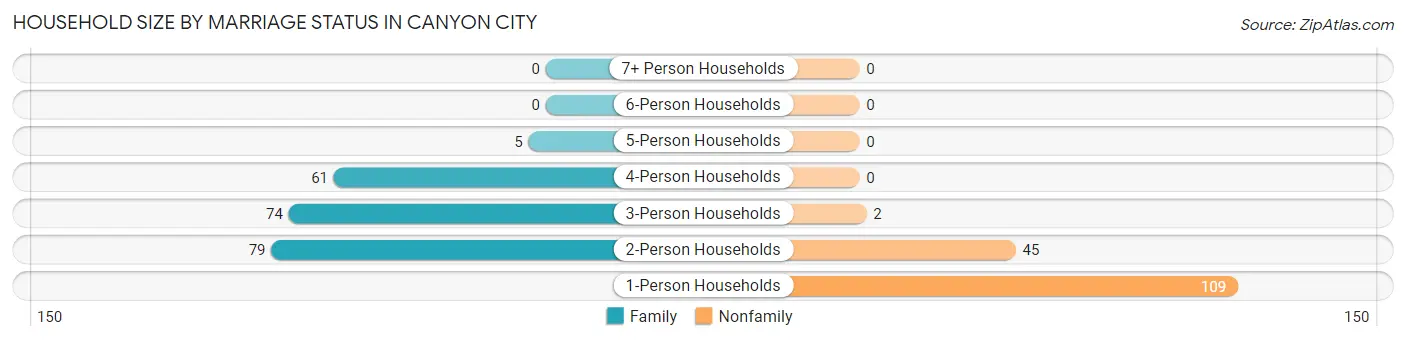
Household Size by Marriage Status in Canyon City
Out of a total of 375 households in Canyon City, 219 (58.4%) are family households, while 156 (41.6%) are nonfamily households. The most numerous type of family households are 2-person households, comprising 79, and the most common type of nonfamily households are 1-person households, comprising 109.
| Household Size | Family Households | Nonfamily Households |
| 1-Person Households | - | 109 (29.1%) |
| 2-Person Households | 79 (21.1%) | 45 (12.0%) |
| 3-Person Households | 74 (19.7%) | 2 (0.5%) |
| 4-Person Households | 61 (16.3%) | 0 (0.0%) |
| 5-Person Households | 5 (1.3%) | 0 (0.0%) |
| 6-Person Households | 0 (0.0%) | 0 (0.0%) |
| 7+ Person Households | 0 (0.0%) | 0 (0.0%) |
| Total | 219 (58.4%) | 156 (41.6%) |
Female Fertility in Canyon City
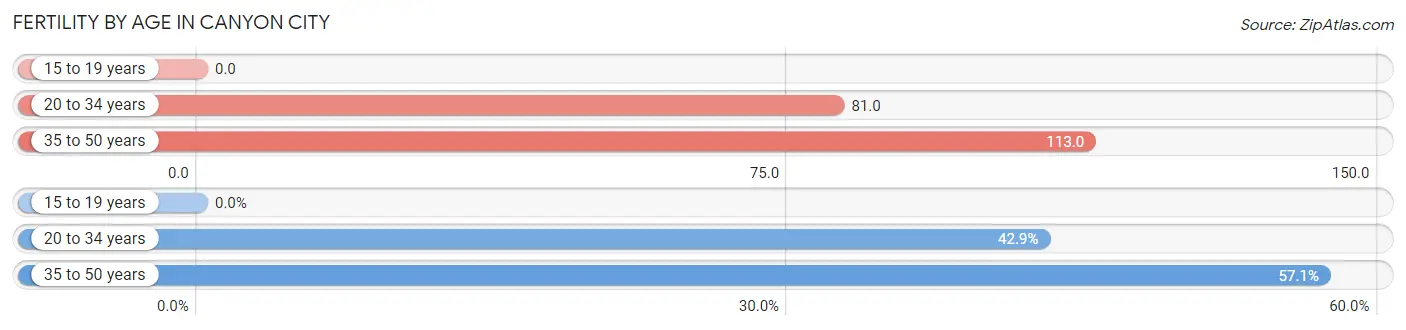
Fertility by Age in Canyon City
Average fertility rate in Canyon City is 90.0 births per 1,000 women. Women in the age bracket of 35 to 50 years have the highest fertility rate with 113.0 births per 1,000 women. Women in the age bracket of 35 to 50 years acount for 57.1% of all women with births.
| Age Bracket | Women with Births | Births / 1,000 Women |
| 15 to 19 years | 0 (0.0%) | 0.0 |
| 20 to 34 years | 6 (42.9%) | 81.0 |
| 35 to 50 years | 8 (57.1%) | 113.0 |
| Total | 14 (100.0%) | 90.0 |
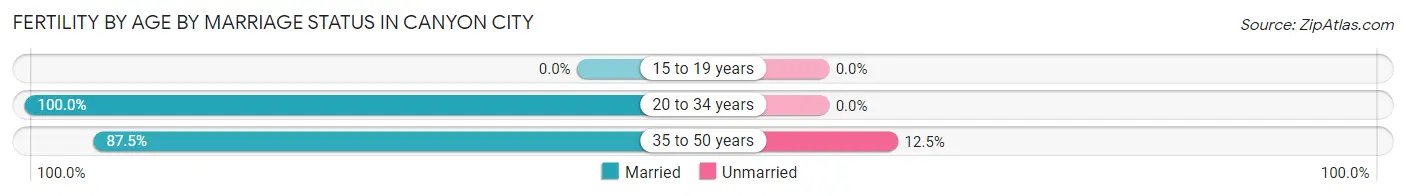
Fertility by Age by Marriage Status in Canyon City
92.9% of women with births (14) in Canyon City are married. The highest percentage of unmarried women with births falls into 35 to 50 years age bracket with 12.5% of them unmarried at the time of birth, while the lowest percentage of unmarried women with births belong to 20 to 34 years age bracket with 0.0% of them unmarried.
| Age Bracket | Married | Unmarried |
| 15 to 19 years | 0 (0.0%) | 0 (0.0%) |
| 20 to 34 years | 6 (100.0%) | 0 (0.0%) |
| 35 to 50 years | 7 (87.5%) | 1 (12.5%) |
| Total | 13 (92.9%) | 1 (7.1%) |
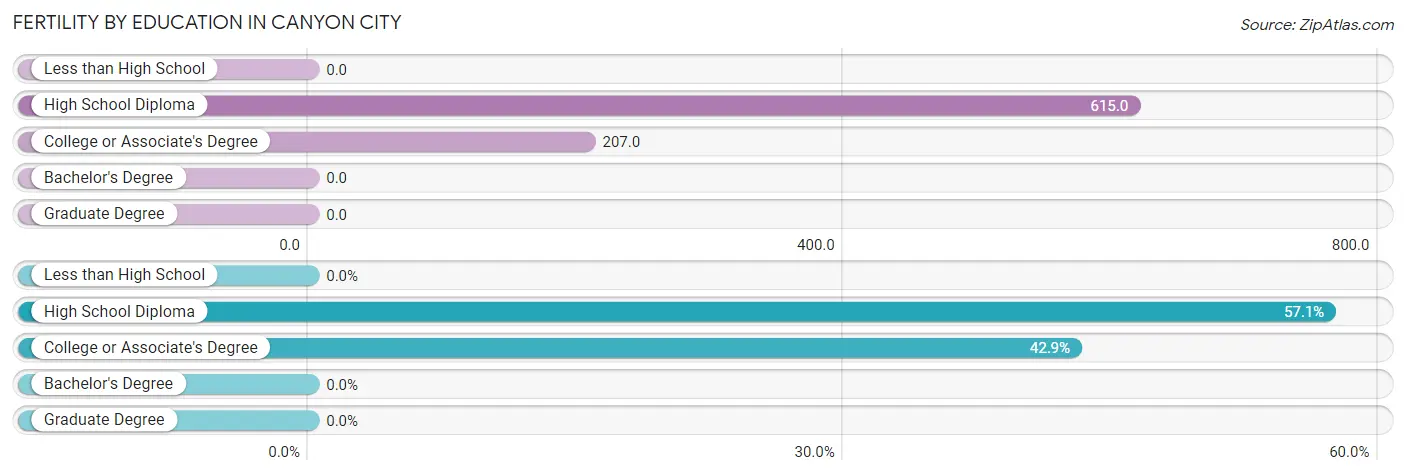
Fertility by Education in Canyon City
| Educational Attainment | Women with Births | Births / 1,000 Women |
| Less than High School | 0 (0.0%) | 0.0 |
| High School Diploma | 8 (57.1%) | 615.0 |
| College or Associate's Degree | 6 (42.9%) | 207.0 |
| Bachelor's Degree | 0 (0.0%) | 0.0 |
| Graduate Degree | 0 (0.0%) | 0.0 |
| Total | 14 (100.0%) | 90.0 |
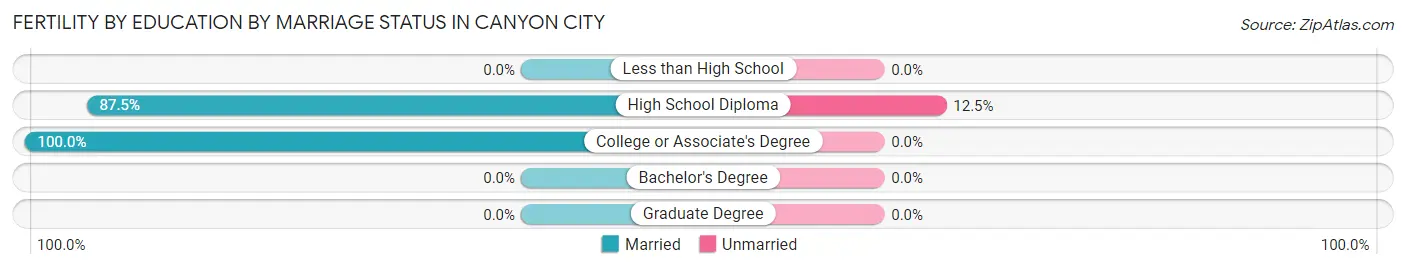
Fertility by Education by Marriage Status in Canyon City
7.1% of women with births in Canyon City are unmarried. Women with the educational attainment of college or associate's degree are most likely to be married with 100.0% of them married at childbirth, while women with the educational attainment of high school diploma are least likely to be married with 12.5% of them unmarried at childbirth.
| Educational Attainment | Married | Unmarried |
| Less than High School | 0 (0.0%) | 0 (0.0%) |
| High School Diploma | 7 (87.5%) | 1 (12.5%) |
| College or Associate's Degree | 6 (100.0%) | 0 (0.0%) |
| Bachelor's Degree | 0 (0.0%) | 0 (0.0%) |
| Graduate Degree | 0 (0.0%) | 0 (0.0%) |
| Total | 13 (92.9%) | 1 (7.1%) |
Income in Canyon City
Income Overview in Canyon City
Per Capita Income in Canyon City is $33,843, while median incomes of families and households are $103,024 and $62,125 respectively.
| Characteristic | Number | Measure |
| Per Capita Income | 834 | $33,843 |
| Median Family Income | 219 | $103,024 |
| Mean Family Income | 219 | $100,617 |
| Median Household Income | 375 | $62,125 |
| Mean Household Income | 375 | $79,779 |
| Income Deficit | 219 | $0 |
| Wage / Income Gap (%) | 834 | 31.29% |
| Wage / Income Gap ($) | 834 | 68.71¢ per $1 |
| Gini / Inequality Index | 834 | 0.40 |
Earnings by Sex in Canyon City
Average Earnings in Canyon City are $41,964, $50,530 for men and $34,719 for women, a difference of 31.3%.
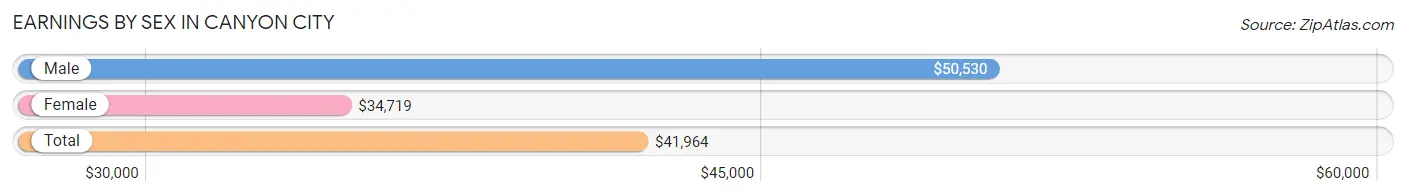
| Sex | Number | Average Earnings |
| Male | 232 (49.0%) | $50,530 |
| Female | 241 (50.9%) | $34,719 |
| Total | 473 (100.0%) | $41,964 |
Earnings by Sex by Income Bracket in Canyon City
The most common earnings brackets in Canyon City are $50,000 to $54,999 for men (47 | 20.3%) and $30,000 to $34,999 for women (46 | 19.1%).
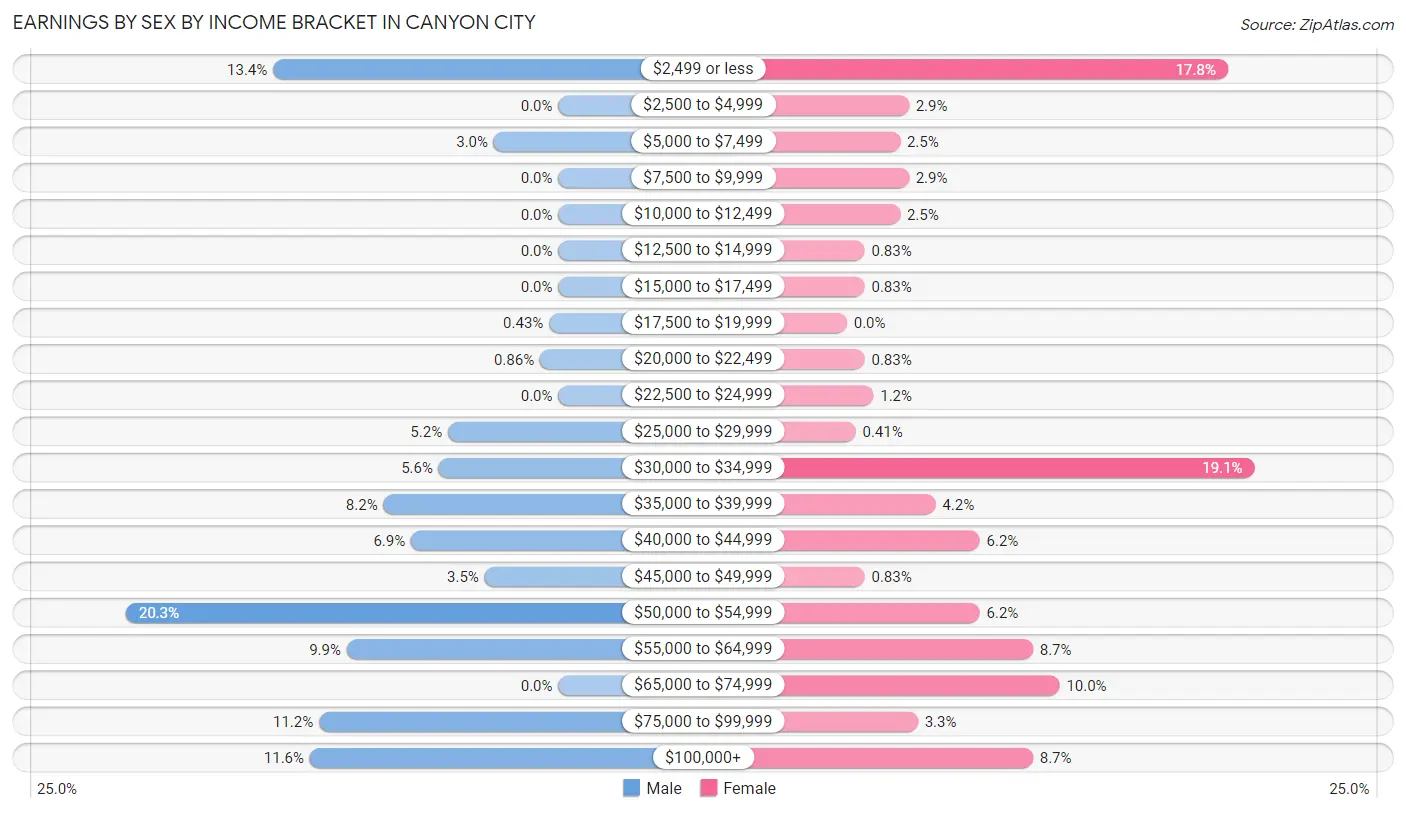
| Income | Male | Female |
| $2,499 or less | 31 (13.4%) | 43 (17.8%) |
| $2,500 to $4,999 | 0 (0.0%) | 7 (2.9%) |
| $5,000 to $7,499 | 7 (3.0%) | 6 (2.5%) |
| $7,500 to $9,999 | 0 (0.0%) | 7 (2.9%) |
| $10,000 to $12,499 | 0 (0.0%) | 6 (2.5%) |
| $12,500 to $14,999 | 0 (0.0%) | 2 (0.8%) |
| $15,000 to $17,499 | 0 (0.0%) | 2 (0.8%) |
| $17,500 to $19,999 | 1 (0.4%) | 0 (0.0%) |
| $20,000 to $22,499 | 2 (0.9%) | 2 (0.8%) |
| $22,500 to $24,999 | 0 (0.0%) | 3 (1.2%) |
| $25,000 to $29,999 | 12 (5.2%) | 1 (0.4%) |
| $30,000 to $34,999 | 13 (5.6%) | 46 (19.1%) |
| $35,000 to $39,999 | 19 (8.2%) | 10 (4.2%) |
| $40,000 to $44,999 | 16 (6.9%) | 15 (6.2%) |
| $45,000 to $49,999 | 8 (3.5%) | 2 (0.8%) |
| $50,000 to $54,999 | 47 (20.3%) | 15 (6.2%) |
| $55,000 to $64,999 | 23 (9.9%) | 21 (8.7%) |
| $65,000 to $74,999 | 0 (0.0%) | 24 (10.0%) |
| $75,000 to $99,999 | 26 (11.2%) | 8 (3.3%) |
| $100,000+ | 27 (11.6%) | 21 (8.7%) |
| Total | 232 (100.0%) | 241 (100.0%) |
Earnings by Sex by Educational Attainment in Canyon City
Average earnings in Canyon City are $50,341 for men and $36,625 for women, a difference of 27.3%. Men with an educational attainment of bachelor's degree enjoy the highest average annual earnings of $51,212, while those with college or associate's degree education earn the least with $48,500. Women with an educational attainment of graduate degree earn the most with the average annual earnings of $71,875, while those with bachelor's degree education have the smallest earnings of $40,938.
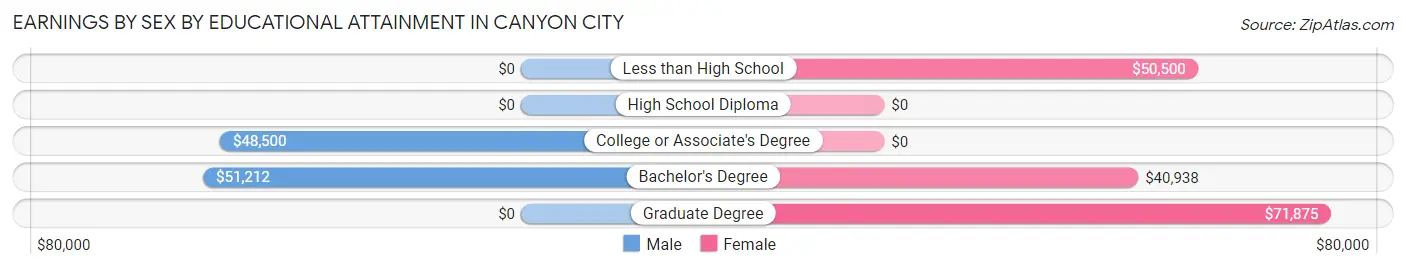
| Educational Attainment | Male Income | Female Income |
| Less than High School | - | - |
| High School Diploma | - | - |
| College or Associate's Degree | $48,500 | $0 |
| Bachelor's Degree | $51,212 | $40,938 |
| Graduate Degree | - | - |
| Total | $50,341 | $36,625 |
Family Income in Canyon City
Family Income Brackets in Canyon City
According to the Canyon City family income data, there are 68 families falling into the $100,000 to $149,999 income range, which is the most common income bracket and makes up 31.0% of all families.
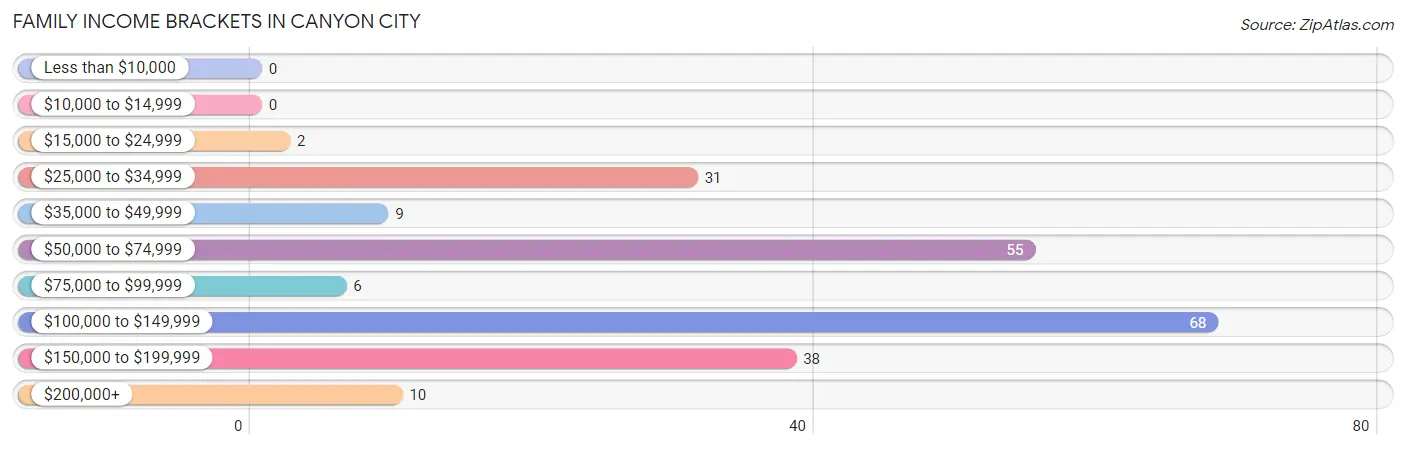
| Income Bracket | # Families | % Families |
| Less than $10,000 | 0 | 0.0% |
| $10,000 to $14,999 | 0 | 0.0% |
| $15,000 to $24,999 | 2 | 0.9% |
| $25,000 to $34,999 | 31 | 14.2% |
| $35,000 to $49,999 | 9 | 4.1% |
| $50,000 to $74,999 | 55 | 25.1% |
| $75,000 to $99,999 | 6 | 2.7% |
| $100,000 to $149,999 | 68 | 31.1% |
| $150,000 to $199,999 | 38 | 17.4% |
| $200,000+ | 10 | 4.6% |
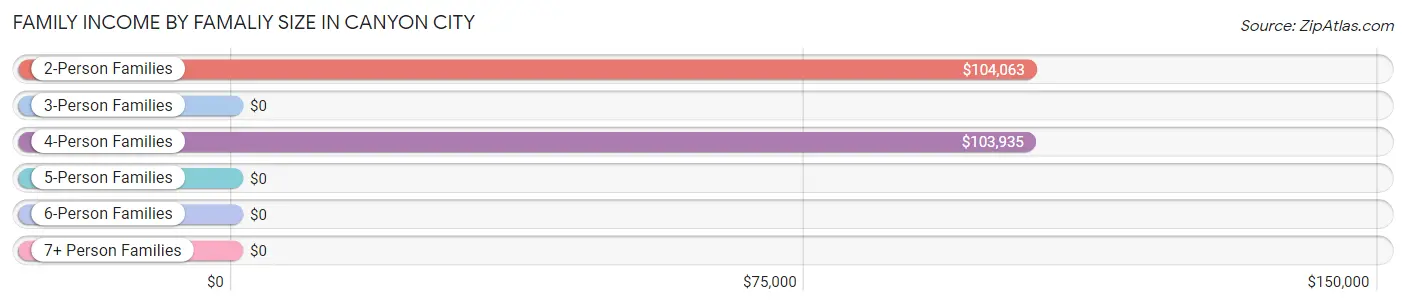
Family Income by Famaliy Size in Canyon City
2-person families (79 | 36.1%) account for the highest median family income in Canyon City with $104,063 per family, while 2-person families (79 | 36.1%) have the highest median income of $52,032 per family member.
| Income Bracket | # Families | Median Income |
| 2-Person Families | 79 (36.1%) | $104,063 |
| 3-Person Families | 74 (33.8%) | $0 |
| 4-Person Families | 61 (27.9%) | $103,935 |
| 5-Person Families | 5 (2.3%) | $0 |
| 6-Person Families | 0 (0.0%) | $0 |
| 7+ Person Families | 0 (0.0%) | $0 |
| Total | 219 (100.0%) | $103,024 |
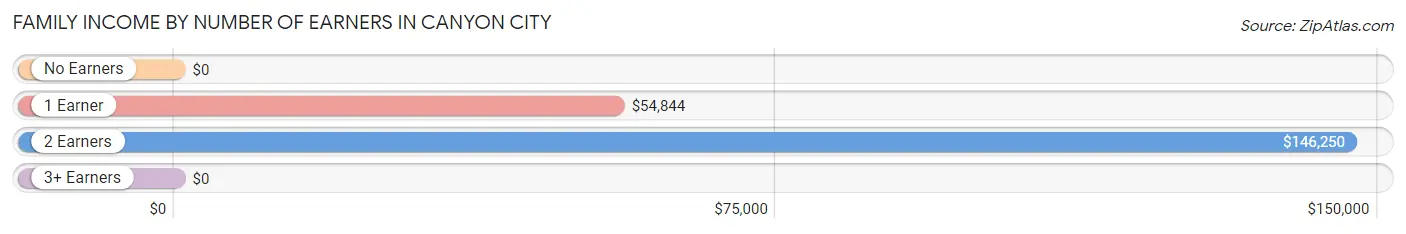
Family Income by Number of Earners in Canyon City
| Number of Earners | # Families | Median Income |
| No Earners | 15 (6.9%) | $0 |
| 1 Earner | 49 (22.4%) | $54,844 |
| 2 Earners | 99 (45.2%) | $146,250 |
| 3+ Earners | 56 (25.6%) | $0 |
| Total | 219 (100.0%) | $103,024 |
Household Income in Canyon City
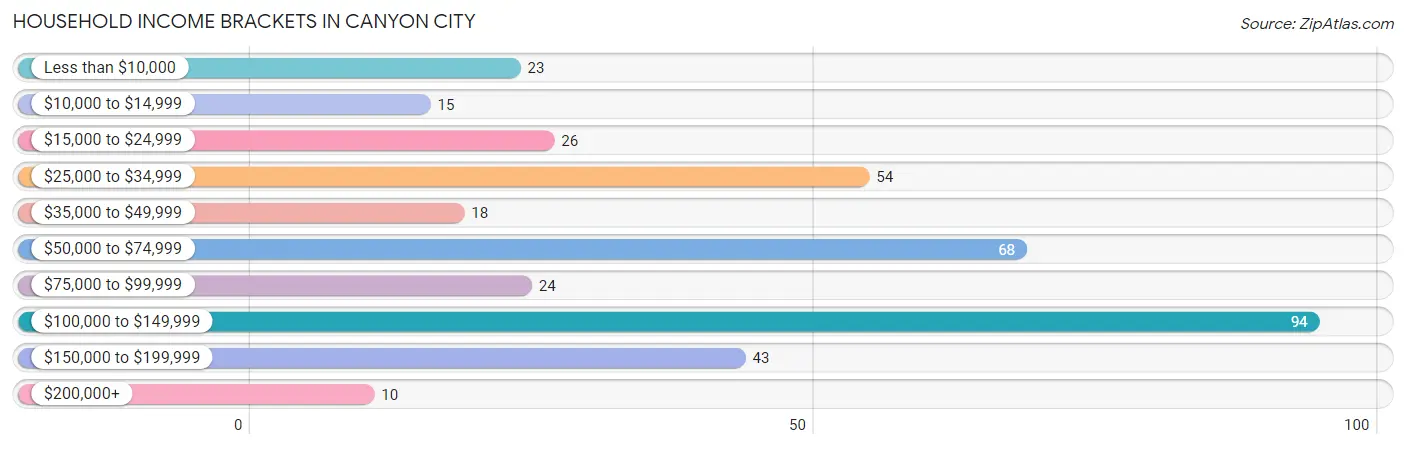
Household Income Brackets in Canyon City
With 94 households falling in the category, the $100,000 to $149,999 income range is the most frequent in Canyon City, accounting for 25.1% of all households. In contrast, only 10 households (2.7%) fall into the $200,000+ income bracket, making it the least populous group.
| Income Bracket | # Households | % Households |
| Less than $10,000 | 23 | 6.1% |
| $10,000 to $14,999 | 15 | 4.0% |
| $15,000 to $24,999 | 26 | 6.9% |
| $25,000 to $34,999 | 54 | 14.4% |
| $35,000 to $49,999 | 18 | 4.8% |
| $50,000 to $74,999 | 68 | 18.1% |
| $75,000 to $99,999 | 24 | 6.4% |
| $100,000 to $149,999 | 94 | 25.1% |
| $150,000 to $199,999 | 43 | 11.5% |
| $200,000+ | 10 | 2.7% |
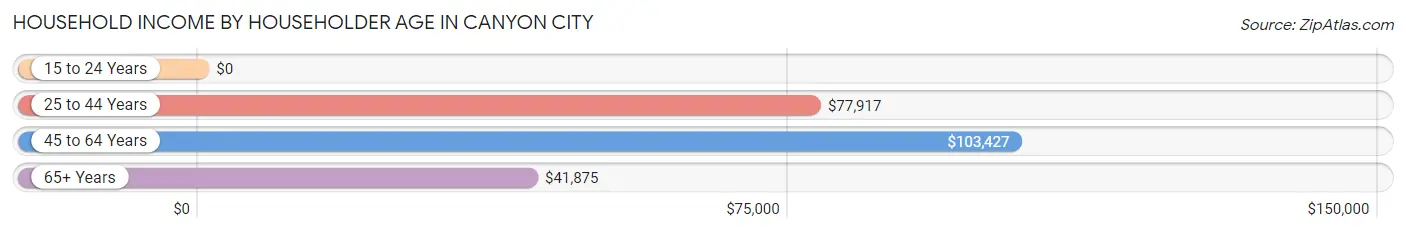
Household Income by Householder Age in Canyon City
The median household income in Canyon City is $62,125, with the highest median household income of $103,427 found in the 45 to 64 years age bracket for the primary householder. A total of 139 households (37.1%) fall into this category. Meanwhile, the 15 to 24 years age bracket for the primary householder has the lowest median household income of $0, with 15 households (4.0%) in this group.
| Income Bracket | # Households | Median Income |
| 15 to 24 Years | 15 (4.0%) | $0 |
| 25 to 44 Years | 95 (25.3%) | $77,917 |
| 45 to 64 Years | 139 (37.1%) | $103,427 |
| 65+ Years | 126 (33.6%) | $41,875 |
| Total | 375 (100.0%) | $62,125 |
Poverty in Canyon City
Income Below Poverty by Sex and Age in Canyon City
With 2.0% poverty level for males and 11.4% for females among the residents of Canyon City, 6 to 11 year old males and 75 year old and over females are the most vulnerable to poverty, with 4 males (8.2%) and 21 females (33.9%) in their respective age groups living below the poverty level.
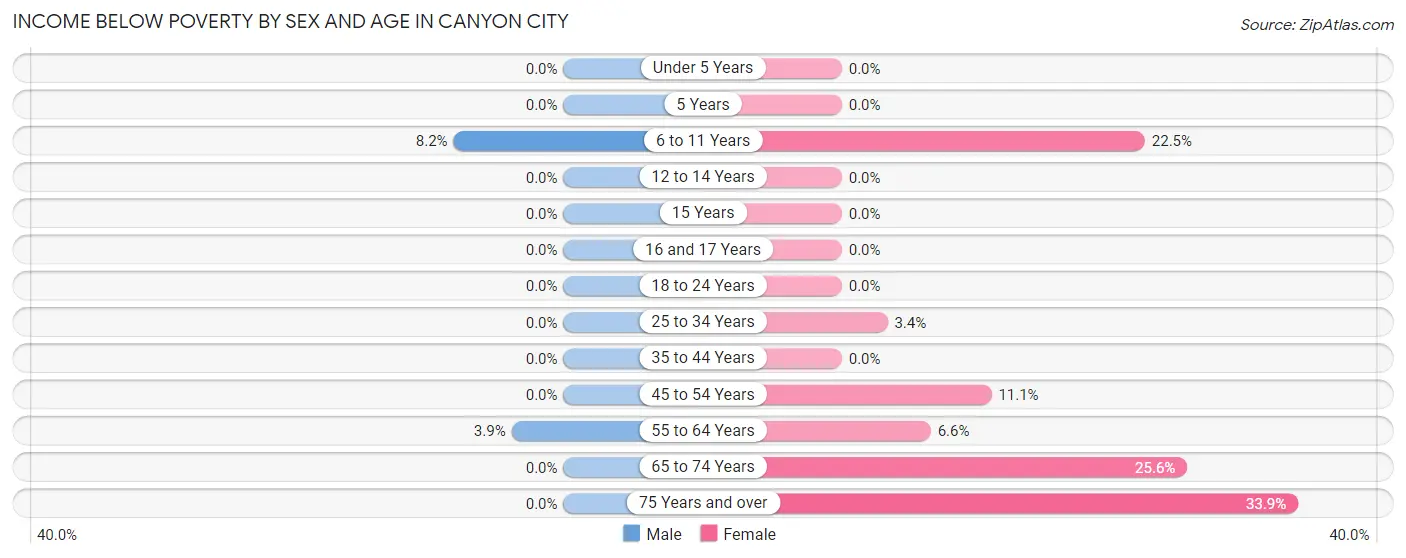
| Age Bracket | Male | Female |
| Under 5 Years | 0 (0.0%) | 0 (0.0%) |
| 5 Years | 0 (0.0%) | 0 (0.0%) |
| 6 to 11 Years | 4 (8.2%) | 9 (22.5%) |
| 12 to 14 Years | 0 (0.0%) | 0 (0.0%) |
| 15 Years | 0 (0.0%) | 0 (0.0%) |
| 16 and 17 Years | 0 (0.0%) | 0 (0.0%) |
| 18 to 24 Years | 0 (0.0%) | 0 (0.0%) |
| 25 to 34 Years | 0 (0.0%) | 2 (3.4%) |
| 35 to 44 Years | 0 (0.0%) | 0 (0.0%) |
| 45 to 54 Years | 0 (0.0%) | 1 (11.1%) |
| 55 to 64 Years | 3 (3.8%) | 7 (6.6%) |
| 65 to 74 Years | 0 (0.0%) | 10 (25.6%) |
| 75 Years and over | 0 (0.0%) | 21 (33.9%) |
| Total | 7 (2.0%) | 50 (11.4%) |
Income Above Poverty by Sex and Age in Canyon City
According to the poverty statistics in Canyon City, males aged under 5 years and females aged under 5 years are the age groups that are most secure financially, with 100.0% of males and 100.0% of females in these age groups living above the poverty line.
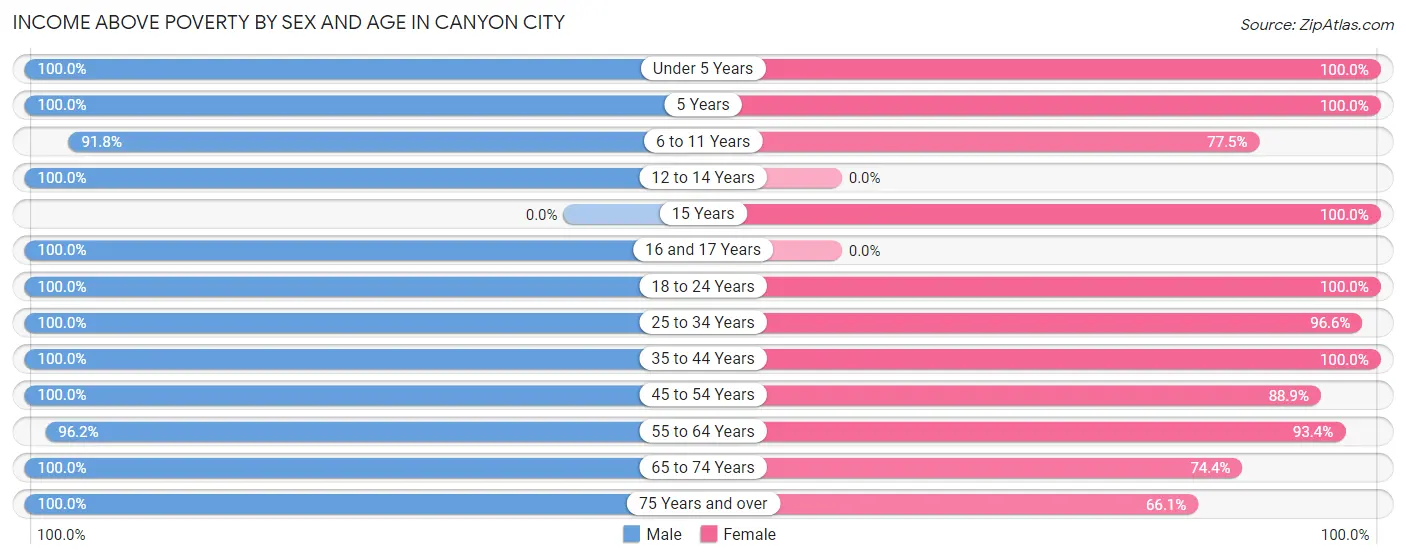
| Age Bracket | Male | Female |
| Under 5 Years | 22 (100.0%) | 36 (100.0%) |
| 5 Years | 6 (100.0%) | 3 (100.0%) |
| 6 to 11 Years | 45 (91.8%) | 31 (77.5%) |
| 12 to 14 Years | 3 (100.0%) | 0 (0.0%) |
| 15 Years | 0 (0.0%) | 2 (100.0%) |
| 16 and 17 Years | 17 (100.0%) | 0 (0.0%) |
| 18 to 24 Years | 5 (100.0%) | 24 (100.0%) |
| 25 to 34 Years | 43 (100.0%) | 57 (96.6%) |
| 35 to 44 Years | 44 (100.0%) | 57 (100.0%) |
| 45 to 54 Years | 34 (100.0%) | 8 (88.9%) |
| 55 to 64 Years | 75 (96.2%) | 99 (93.4%) |
| 65 to 74 Years | 30 (100.0%) | 29 (74.4%) |
| 75 Years and over | 21 (100.0%) | 41 (66.1%) |
| Total | 345 (98.0%) | 387 (88.6%) |
Income Below Poverty Among Married-Couple Families in Canyon City
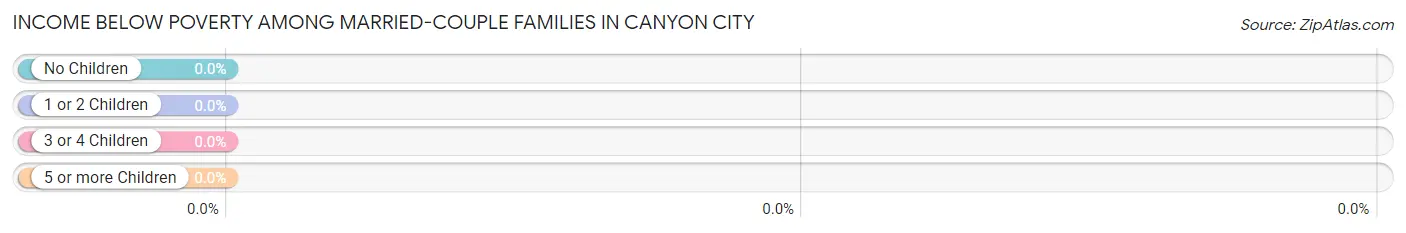
| Children | Above Poverty | Below Poverty |
| No Children | 108 (100.0%) | 0 (0.0%) |
| 1 or 2 Children | 76 (100.0%) | 0 (0.0%) |
| 3 or 4 Children | 3 (100.0%) | 0 (0.0%) |
| 5 or more Children | 0 (0.0%) | 0 (0.0%) |
| Total | 187 (100.0%) | 0 (0.0%) |
Income Below Poverty Among Single-Parent Households in Canyon City
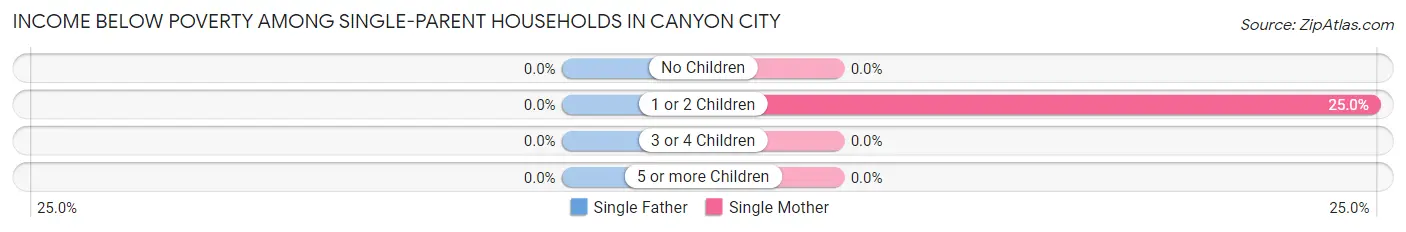
| Children | Single Father | Single Mother |
| No Children | 0 (0.0%) | 0 (0.0%) |
| 1 or 2 Children | 0 (0.0%) | 2 (25.0%) |
| 3 or 4 Children | 0 (0.0%) | 0 (0.0%) |
| 5 or more Children | 0 (0.0%) | 0 (0.0%) |
| Total | 0 (0.0%) | 2 (8.0%) |
Income Below Poverty Among Married-Couple vs Single-Parent Households in Canyon City
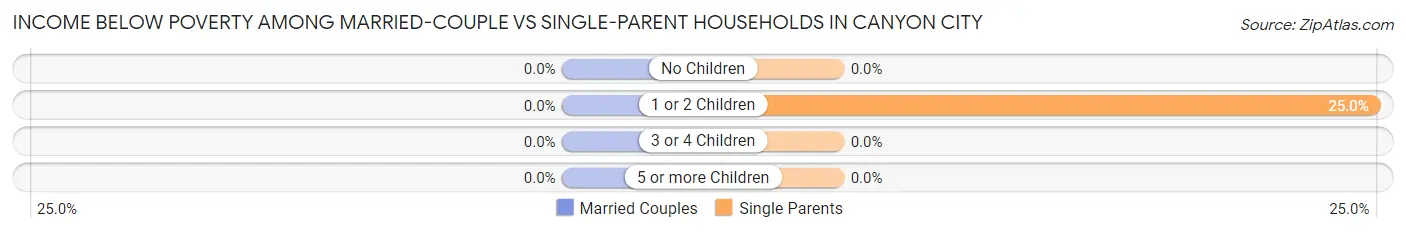
| Children | Married-Couple Families | Single-Parent Households |
| No Children | 0 (0.0%) | 0 (0.0%) |
| 1 or 2 Children | 0 (0.0%) | 2 (25.0%) |
| 3 or 4 Children | 0 (0.0%) | 0 (0.0%) |
| 5 or more Children | 0 (0.0%) | 0 (0.0%) |
| Total | 0 (0.0%) | 2 (6.2%) |
Employment Characteristics in Canyon City
Employment by Class of Employer in Canyon City
Among the 363 employed individuals in Canyon City, private company employees (115 | 31.7%), state government employees (75 | 20.7%), and local government employees (74 | 20.4%) make up the most common classes of employment.
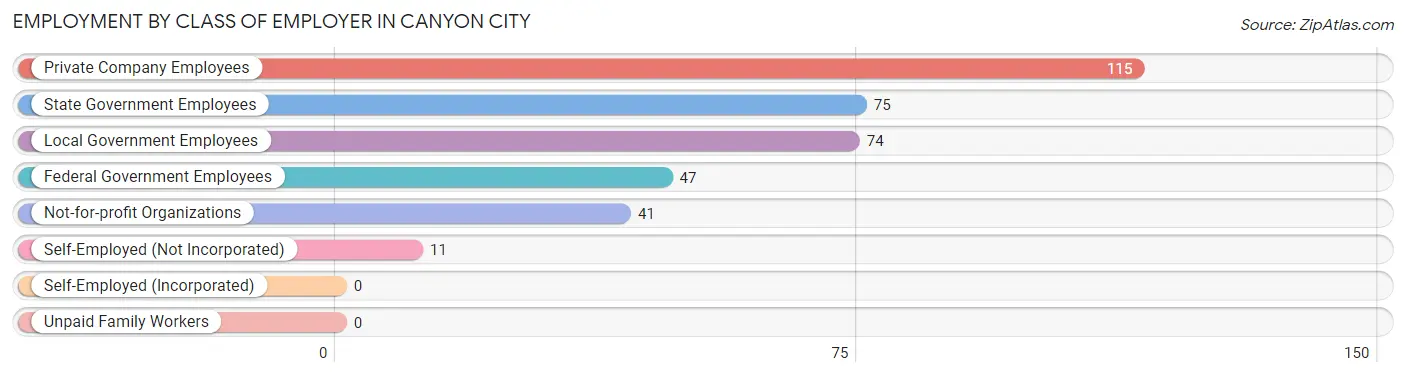
| Employer Class | # Employees | % Employees |
| Private Company Employees | 115 | 31.7% |
| Self-Employed (Incorporated) | 0 | 0.0% |
| Self-Employed (Not Incorporated) | 11 | 3.0% |
| Not-for-profit Organizations | 41 | 11.3% |
| Local Government Employees | 74 | 20.4% |
| State Government Employees | 75 | 20.7% |
| Federal Government Employees | 47 | 13.0% |
| Unpaid Family Workers | 0 | 0.0% |
| Total | 363 | 100.0% |
Employment Status by Age in Canyon City
According to the labor force statistics for Canyon City, out of the total population over 16 years of age (673), 57.1% or 384 individuals are in the labor force, with 5.5% or 21 of them unemployed. The age group with the highest labor force participation rate is 20 to 24 years, with 100.0% or 20 individuals in the labor force. Within the labor force, the 60 to 64 years age range has the highest percentage of unemployed individuals, with 20.2% or 17 of them being unemployed.
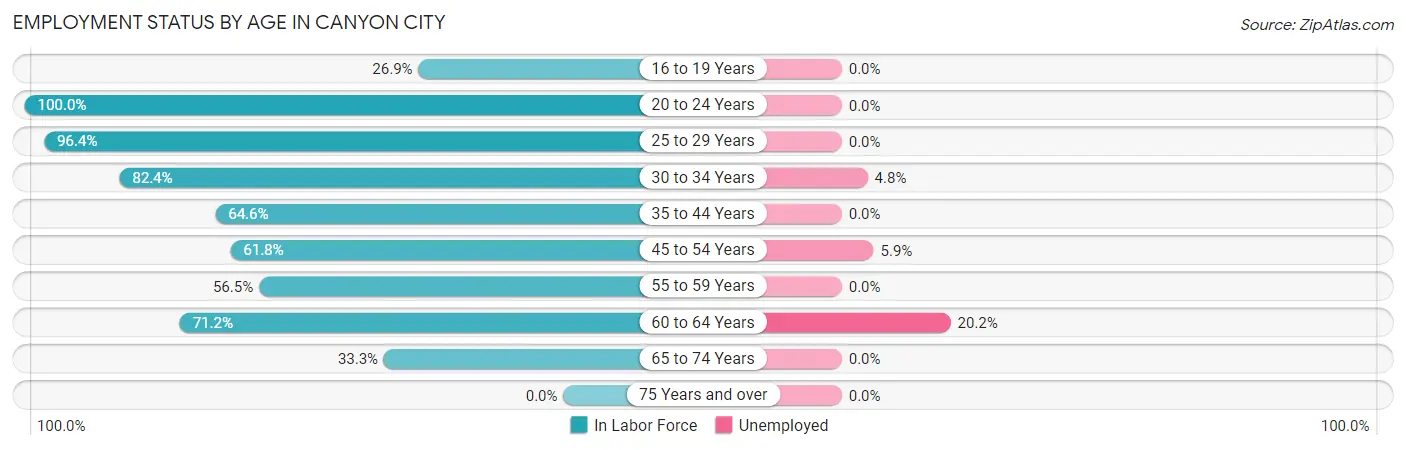
| Age Bracket | In Labor Force | Unemployed |
| 16 to 19 Years | 7 (26.9%) | 0 (0.0%) |
| 20 to 24 Years | 20 (100.0%) | 0 (0.0%) |
| 25 to 29 Years | 53 (96.4%) | 0 (0.0%) |
| 30 to 34 Years | 42 (82.4%) | 2 (4.8%) |
| 35 to 44 Years | 82 (64.6%) | 0 (0.0%) |
| 45 to 54 Years | 34 (61.8%) | 2 (5.9%) |
| 55 to 59 Years | 39 (56.5%) | 0 (0.0%) |
| 60 to 64 Years | 84 (71.2%) | 17 (20.2%) |
| 65 to 74 Years | 23 (33.3%) | 0 (0.0%) |
| 75 Years and over | 0 (0.0%) | 0 (0.0%) |
| Total | 384 (57.1%) | 21 (5.5%) |
Employment Status by Educational Attainment in Canyon City
According to labor force statistics for Canyon City, 70.3% of individuals (334) out of the total population between 25 and 64 years of age (475) are in the labor force, with 6.3% or 21 of them being unemployed. The group with the highest labor force participation rate are those with the educational attainment of bachelor's degree or higher, with 95.1% or 174 individuals in the labor force. Within the labor force, individuals with high school diploma education have the highest percentage of unemployment, with 19.0% or 19 of them being unemployed.
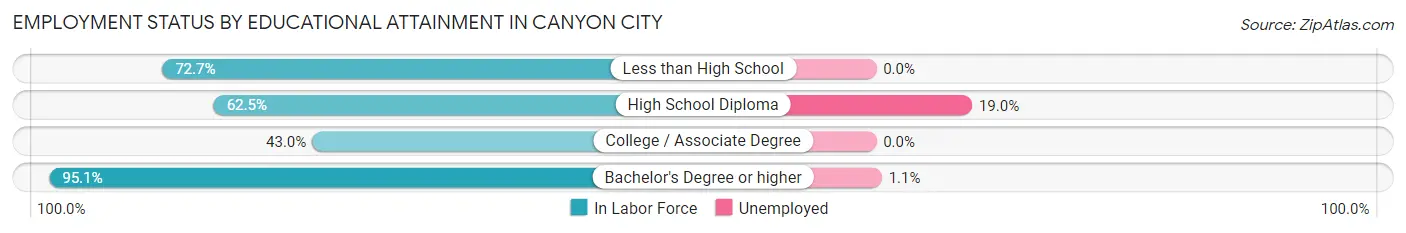
| Educational Attainment | In Labor Force | Unemployed |
| Less than High School | 8 (72.7%) | 0 (0.0%) |
| High School Diploma | 100 (62.5%) | 30 (19.0%) |
| College / Associate Degree | 52 (43.0%) | 0 (0.0%) |
| Bachelor's Degree or higher | 174 (95.1%) | 2 (1.1%) |
| Total | 334 (70.3%) | 30 (6.3%) |
Employment Occupations by Sex in Canyon City
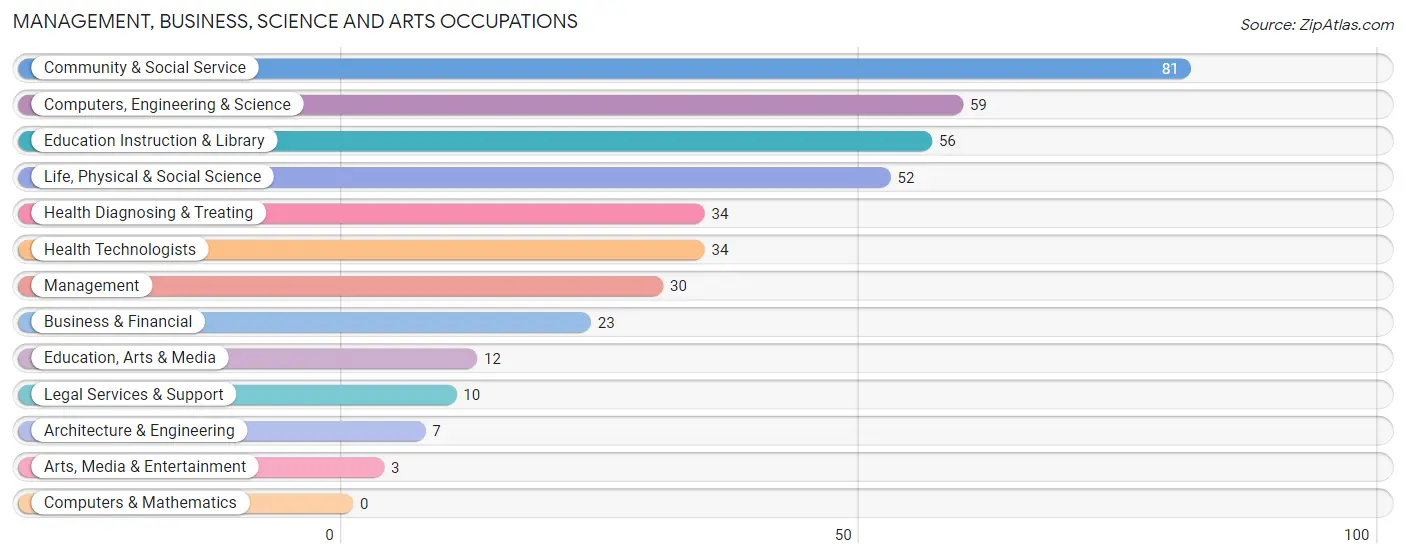
Management, Business, Science and Arts Occupations
The most common Management, Business, Science and Arts occupations in Canyon City are Community & Social Service (81 | 22.3%), Computers, Engineering & Science (59 | 16.3%), Education Instruction & Library (56 | 15.4%), Life, Physical & Social Science (52 | 14.3%), and Health Diagnosing & Treating (34 | 9.4%).
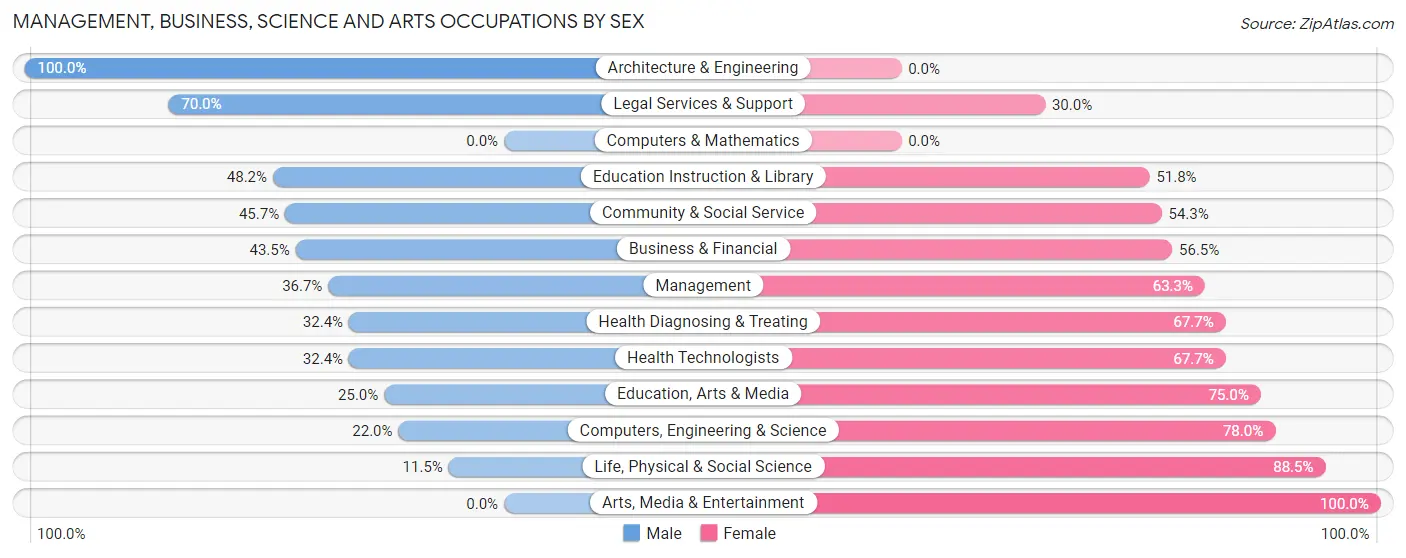
Management, Business, Science and Arts Occupations by Sex
Within the Management, Business, Science and Arts occupations in Canyon City, the most male-oriented occupations are Architecture & Engineering (100.0%), Legal Services & Support (70.0%), and Education Instruction & Library (48.2%), while the most female-oriented occupations are Arts, Media & Entertainment (100.0%), Life, Physical & Social Science (88.5%), and Computers, Engineering & Science (78.0%).
| Occupation | Male | Female |
| Management | 11 (36.7%) | 19 (63.3%) |
| Business & Financial | 10 (43.5%) | 13 (56.5%) |
| Computers, Engineering & Science | 13 (22.0%) | 46 (78.0%) |
| Computers & Mathematics | 0 (0.0%) | 0 (0.0%) |
| Architecture & Engineering | 7 (100.0%) | 0 (0.0%) |
| Life, Physical & Social Science | 6 (11.5%) | 46 (88.5%) |
| Community & Social Service | 37 (45.7%) | 44 (54.3%) |
| Education, Arts & Media | 3 (25.0%) | 9 (75.0%) |
| Legal Services & Support | 7 (70.0%) | 3 (30.0%) |
| Education Instruction & Library | 27 (48.2%) | 29 (51.8%) |
| Arts, Media & Entertainment | 0 (0.0%) | 3 (100.0%) |
| Health Diagnosing & Treating | 11 (32.4%) | 23 (67.6%) |
| Health Technologists | 11 (32.4%) | 23 (67.6%) |
| Total (Category) | 82 (36.1%) | 145 (63.9%) |
| Total (Overall) | 162 (44.6%) | 201 (55.4%) |
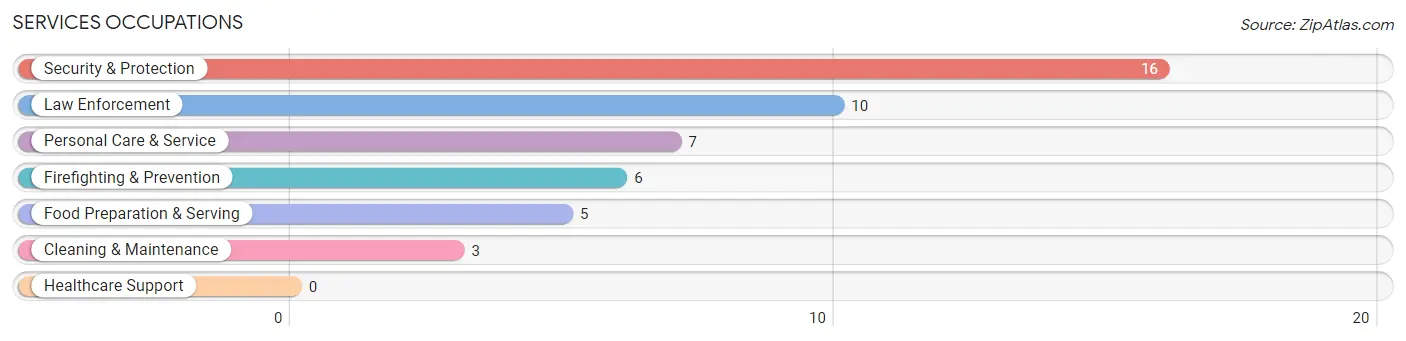
Services Occupations
The most common Services occupations in Canyon City are Security & Protection (16 | 4.4%), Law Enforcement (10 | 2.8%), Personal Care & Service (7 | 1.9%), Firefighting & Prevention (6 | 1.7%), and Food Preparation & Serving (5 | 1.4%).
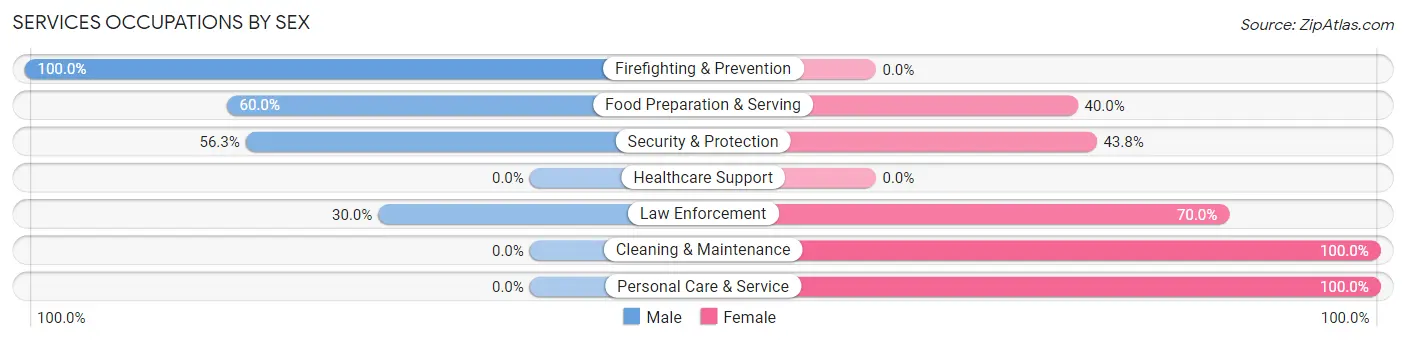
Services Occupations by Sex
Within the Services occupations in Canyon City, the most male-oriented occupations are Firefighting & Prevention (100.0%), Food Preparation & Serving (60.0%), and Security & Protection (56.2%), while the most female-oriented occupations are Cleaning & Maintenance (100.0%), Personal Care & Service (100.0%), and Law Enforcement (70.0%).
| Occupation | Male | Female |
| Healthcare Support | 0 (0.0%) | 0 (0.0%) |
| Security & Protection | 9 (56.2%) | 7 (43.8%) |
| Firefighting & Prevention | 6 (100.0%) | 0 (0.0%) |
| Law Enforcement | 3 (30.0%) | 7 (70.0%) |
| Food Preparation & Serving | 3 (60.0%) | 2 (40.0%) |
| Cleaning & Maintenance | 0 (0.0%) | 3 (100.0%) |
| Personal Care & Service | 0 (0.0%) | 7 (100.0%) |
| Total (Category) | 12 (38.7%) | 19 (61.3%) |
| Total (Overall) | 162 (44.6%) | 201 (55.4%) |
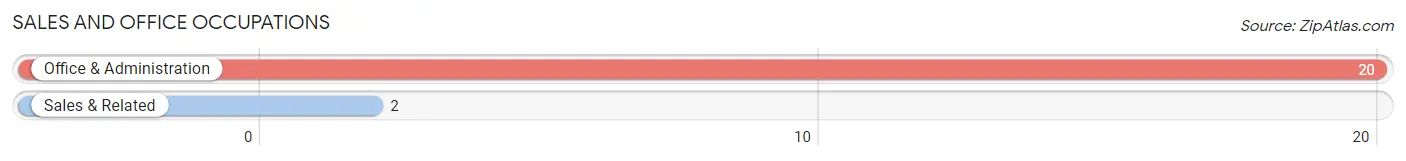
Sales and Office Occupations
The most common Sales and Office occupations in Canyon City are Office & Administration (20 | 5.5%), and Sales & Related (2 | 0.5%).
Sales and Office Occupations by Sex
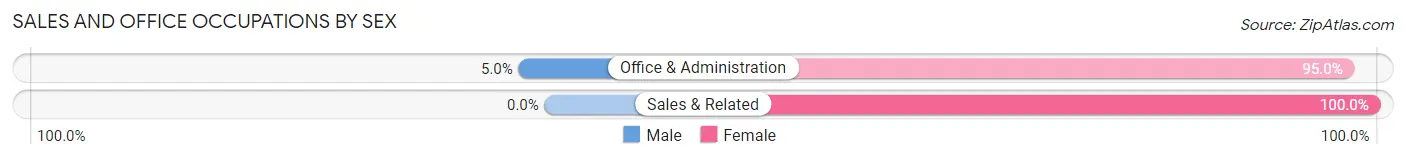
| Occupation | Male | Female |
| Sales & Related | 0 (0.0%) | 2 (100.0%) |
| Office & Administration | 1 (5.0%) | 19 (95.0%) |
| Total (Category) | 1 (4.5%) | 21 (95.5%) |
| Total (Overall) | 162 (44.6%) | 201 (55.4%) |
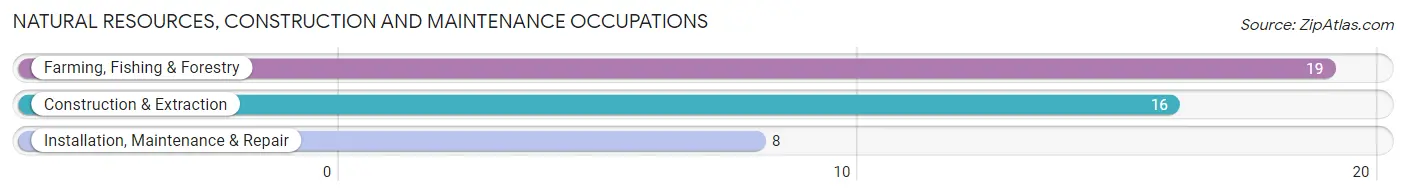
Natural Resources, Construction and Maintenance Occupations
The most common Natural Resources, Construction and Maintenance occupations in Canyon City are Farming, Fishing & Forestry (19 | 5.2%), Construction & Extraction (16 | 4.4%), and Installation, Maintenance & Repair (8 | 2.2%).
Natural Resources, Construction and Maintenance Occupations by Sex
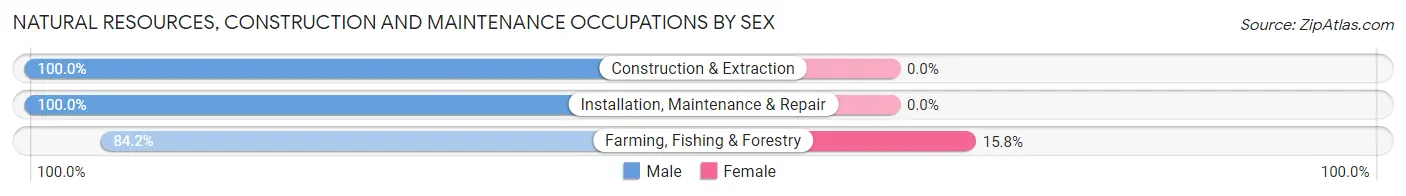
| Occupation | Male | Female |
| Farming, Fishing & Forestry | 16 (84.2%) | 3 (15.8%) |
| Construction & Extraction | 16 (100.0%) | 0 (0.0%) |
| Installation, Maintenance & Repair | 8 (100.0%) | 0 (0.0%) |
| Total (Category) | 40 (93.0%) | 3 (7.0%) |
| Total (Overall) | 162 (44.6%) | 201 (55.4%) |
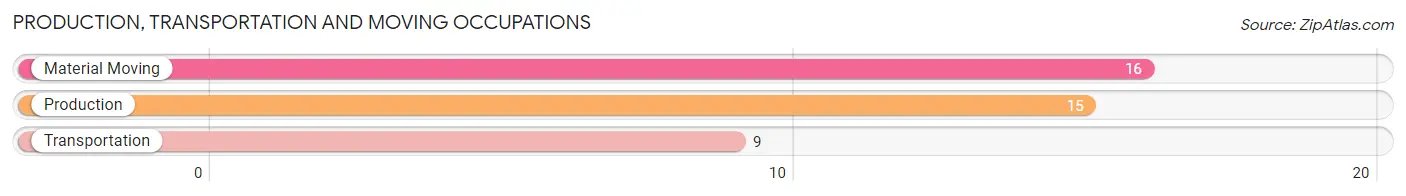
Production, Transportation and Moving Occupations
The most common Production, Transportation and Moving occupations in Canyon City are Material Moving (16 | 4.4%), Production (15 | 4.1%), and Transportation (9 | 2.5%).
Production, Transportation and Moving Occupations by Sex
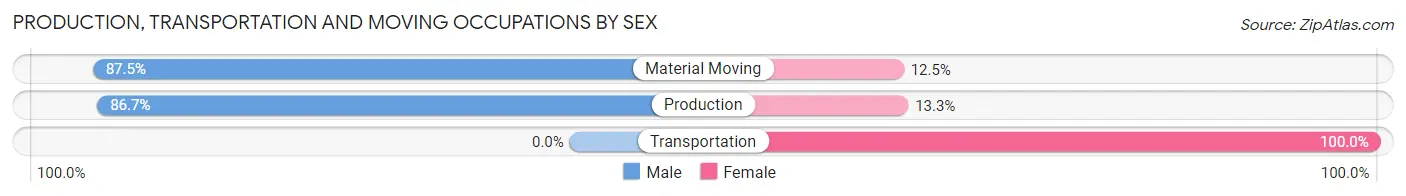
| Occupation | Male | Female |
| Production | 13 (86.7%) | 2 (13.3%) |
| Transportation | 0 (0.0%) | 9 (100.0%) |
| Material Moving | 14 (87.5%) | 2 (12.5%) |
| Total (Category) | 27 (67.5%) | 13 (32.5%) |
| Total (Overall) | 162 (44.6%) | 201 (55.4%) |
Employment Industries by Sex in Canyon City
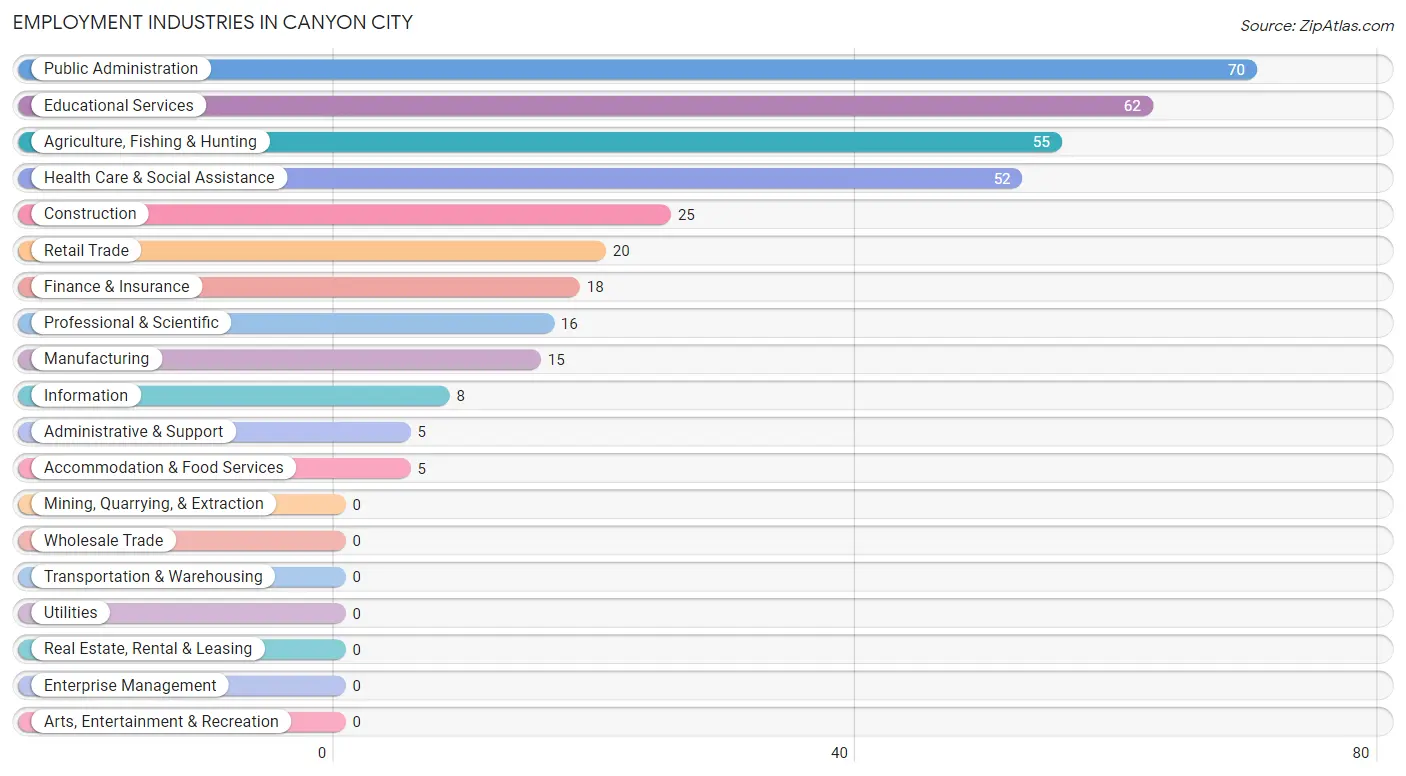
Employment Industries in Canyon City
The major employment industries in Canyon City include Public Administration (70 | 19.3%), Educational Services (62 | 17.1%), Agriculture, Fishing & Hunting (55 | 15.1%), Health Care & Social Assistance (52 | 14.3%), and Construction (25 | 6.9%).
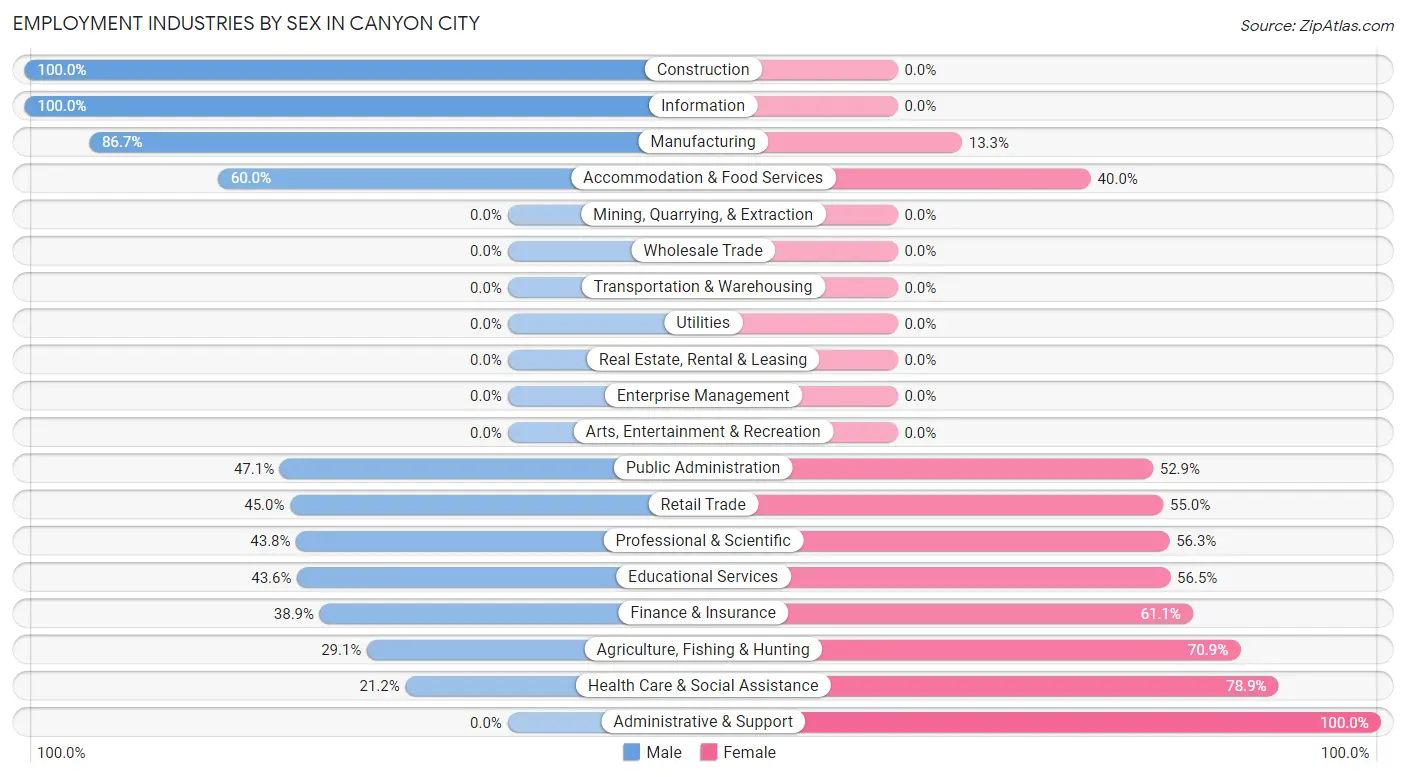
Employment Industries by Sex in Canyon City
The Canyon City industries that see more men than women are Construction (100.0%), Information (100.0%), and Manufacturing (86.7%), whereas the industries that tend to have a higher number of women are Administrative & Support (100.0%), Health Care & Social Assistance (78.8%), and Agriculture, Fishing & Hunting (70.9%).
| Industry | Male | Female |
| Agriculture, Fishing & Hunting | 16 (29.1%) | 39 (70.9%) |
| Mining, Quarrying, & Extraction | 0 (0.0%) | 0 (0.0%) |
| Construction | 25 (100.0%) | 0 (0.0%) |
| Manufacturing | 13 (86.7%) | 2 (13.3%) |
| Wholesale Trade | 0 (0.0%) | 0 (0.0%) |
| Retail Trade | 9 (45.0%) | 11 (55.0%) |
| Transportation & Warehousing | 0 (0.0%) | 0 (0.0%) |
| Utilities | 0 (0.0%) | 0 (0.0%) |
| Information | 8 (100.0%) | 0 (0.0%) |
| Finance & Insurance | 7 (38.9%) | 11 (61.1%) |
| Real Estate, Rental & Leasing | 0 (0.0%) | 0 (0.0%) |
| Professional & Scientific | 7 (43.8%) | 9 (56.2%) |
| Enterprise Management | 0 (0.0%) | 0 (0.0%) |
| Administrative & Support | 0 (0.0%) | 5 (100.0%) |
| Educational Services | 27 (43.5%) | 35 (56.5%) |
| Health Care & Social Assistance | 11 (21.1%) | 41 (78.8%) |
| Arts, Entertainment & Recreation | 0 (0.0%) | 0 (0.0%) |
| Accommodation & Food Services | 3 (60.0%) | 2 (40.0%) |
| Public Administration | 33 (47.1%) | 37 (52.9%) |
| Total | 162 (44.6%) | 201 (55.4%) |
Education in Canyon City
School Enrollment in Canyon City
The most common levels of schooling among the 181 students in Canyon City are elementary school (64 | 35.4%), middle school (28 | 15.5%), and high school (28 | 15.5%).
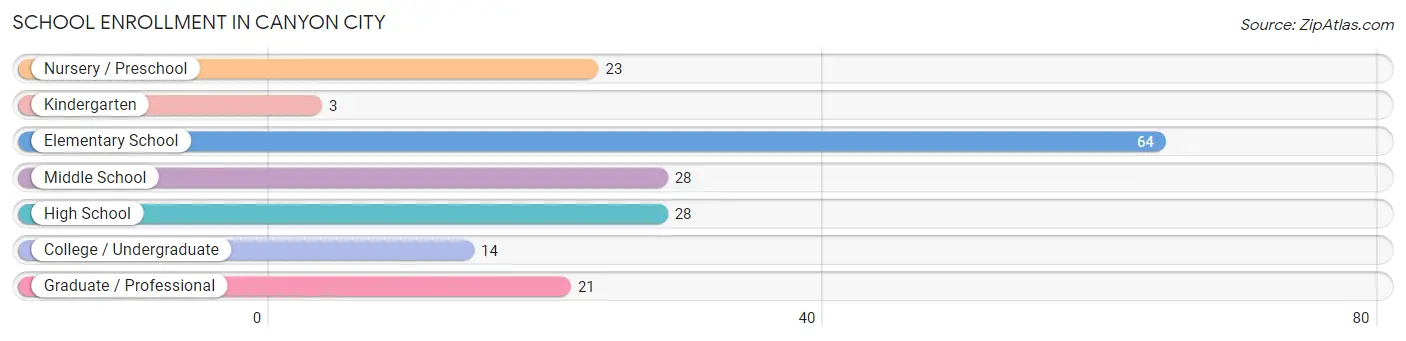
| School Level | # Students | % Students |
| Nursery / Preschool | 23 | 12.7% |
| Kindergarten | 3 | 1.7% |
| Elementary School | 64 | 35.4% |
| Middle School | 28 | 15.5% |
| High School | 28 | 15.5% |
| College / Undergraduate | 14 | 7.7% |
| Graduate / Professional | 21 | 11.6% |
| Total | 181 | 100.0% |
School Enrollment by Age by Funding Source in Canyon City
Out of a total of 181 students who are enrolled in schools in Canyon City, 15 (8.3%) attend a private institution, while the remaining 166 (91.7%) are enrolled in public schools. The age group of 35 years and over has the highest likelihood of being enrolled in private schools, with 10 (55.6% in the age bracket) enrolled. Conversely, the age group of 5 to 9 year old has the lowest likelihood of being enrolled in a private school, with 42 (100.0% in the age bracket) attending a public institution.
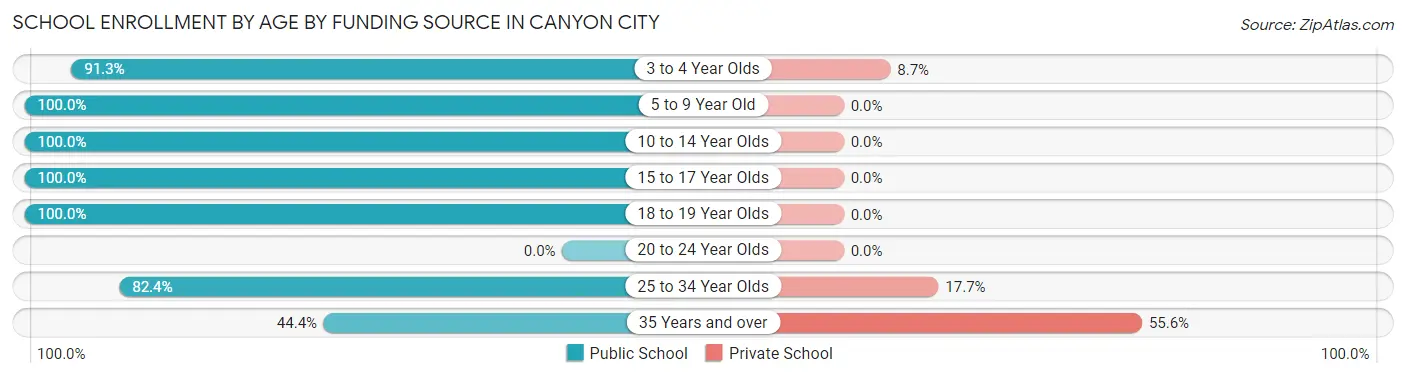
| Age Bracket | Public School | Private School |
| 3 to 4 Year Olds | 21 (91.3%) | 2 (8.7%) |
| 5 to 9 Year Old | 42 (100.0%) | 0 (0.0%) |
| 10 to 14 Year Olds | 53 (100.0%) | 0 (0.0%) |
| 15 to 17 Year Olds | 19 (100.0%) | 0 (0.0%) |
| 18 to 19 Year Olds | 9 (100.0%) | 0 (0.0%) |
| 20 to 24 Year Olds | 0 (0.0%) | 0 (0.0%) |
| 25 to 34 Year Olds | 14 (82.4%) | 3 (17.6%) |
| 35 Years and over | 8 (44.4%) | 10 (55.6%) |
| Total | 166 (91.7%) | 15 (8.3%) |
Educational Attainment by Field of Study in Canyon City
Bio, nature & agricultural (56 | 24.6%), science & technology (31 | 13.6%), computers & mathematics (29 | 12.7%), education (28 | 12.3%), and social sciences (18 | 7.9%) are the most common fields of study among 228 individuals in Canyon City who have obtained a bachelor's degree or higher.
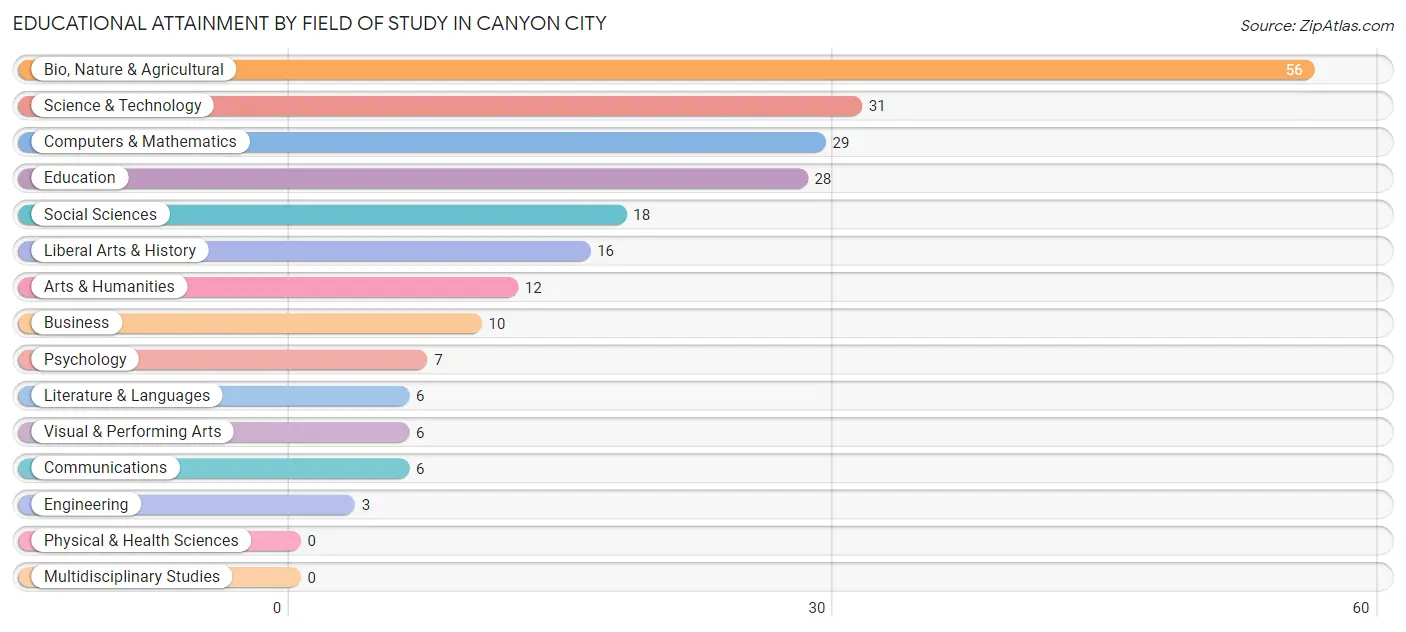
| Field of Study | # Graduates | % Graduates |
| Computers & Mathematics | 29 | 12.7% |
| Bio, Nature & Agricultural | 56 | 24.6% |
| Physical & Health Sciences | 0 | 0.0% |
| Psychology | 7 | 3.1% |
| Social Sciences | 18 | 7.9% |
| Engineering | 3 | 1.3% |
| Multidisciplinary Studies | 0 | 0.0% |
| Science & Technology | 31 | 13.6% |
| Business | 10 | 4.4% |
| Education | 28 | 12.3% |
| Literature & Languages | 6 | 2.6% |
| Liberal Arts & History | 16 | 7.0% |
| Visual & Performing Arts | 6 | 2.6% |
| Communications | 6 | 2.6% |
| Arts & Humanities | 12 | 5.3% |
| Total | 228 | 100.0% |
Transportation & Commute in Canyon City
Vehicle Availability by Sex in Canyon City
The most prevalent vehicle ownership categories in Canyon City are males with 2 vehicles (57, accounting for 35.2%) and females with 2 vehicles (65, making up 28.4%).
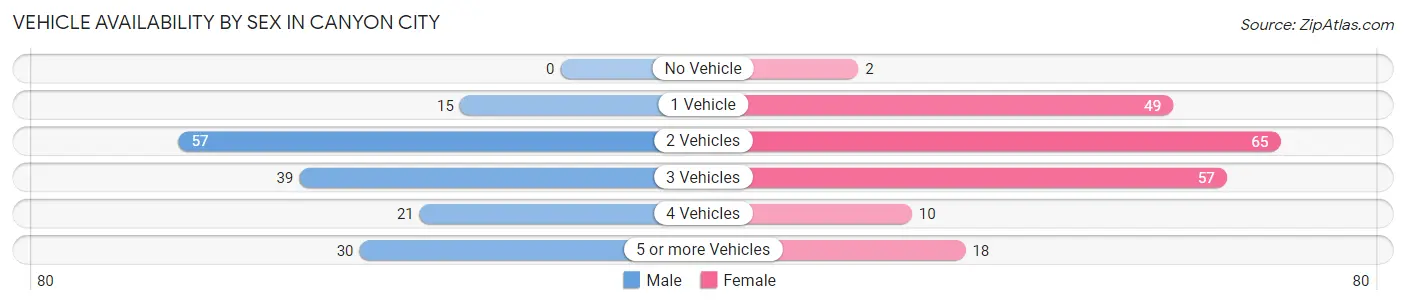
| Vehicles Available | Male | Female |
| No Vehicle | 0 (0.0%) | 2 (1.0%) |
| 1 Vehicle | 15 (9.3%) | 49 (24.4%) |
| 2 Vehicles | 57 (35.2%) | 65 (32.3%) |
| 3 Vehicles | 39 (24.1%) | 57 (28.4%) |
| 4 Vehicles | 21 (13.0%) | 10 (5.0%) |
| 5 or more Vehicles | 30 (18.5%) | 18 (9.0%) |
| Total | 162 (100.0%) | 201 (100.0%) |
Commute Time in Canyon City
The most frequently occuring commute durations in Canyon City are 5 to 9 minutes (126 commuters, 38.8%), less than 5 minutes (94 commuters, 28.9%), and 10 to 14 minutes (49 commuters, 15.1%).
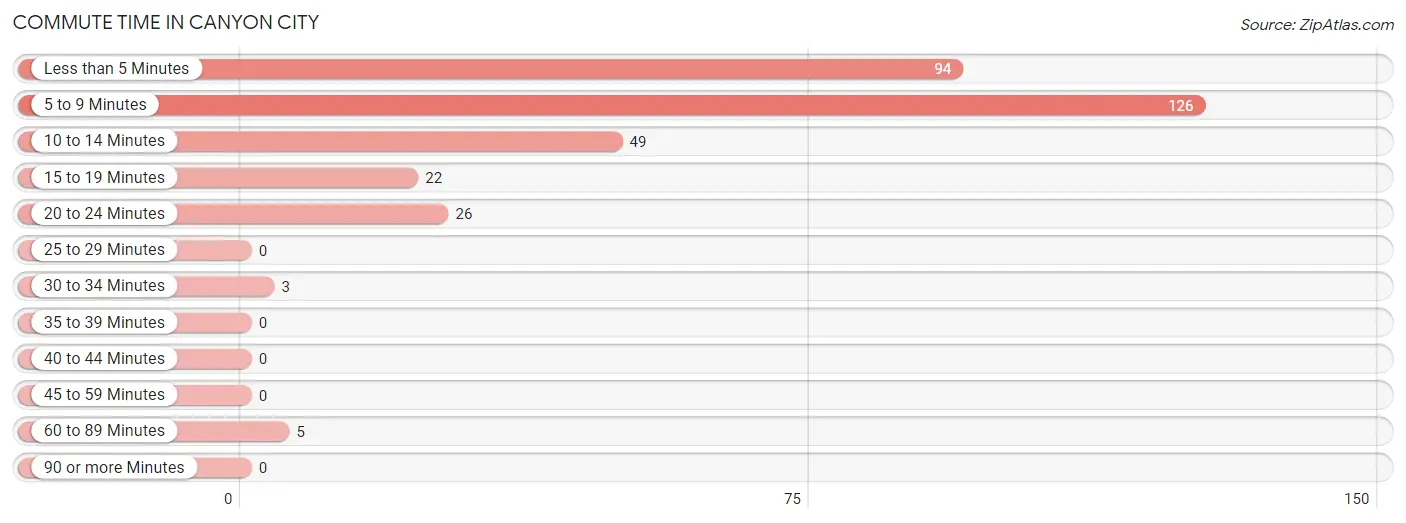
| Commute Time | # Commuters | % Commuters |
| Less than 5 Minutes | 94 | 28.9% |
| 5 to 9 Minutes | 126 | 38.8% |
| 10 to 14 Minutes | 49 | 15.1% |
| 15 to 19 Minutes | 22 | 6.8% |
| 20 to 24 Minutes | 26 | 8.0% |
| 25 to 29 Minutes | 0 | 0.0% |
| 30 to 34 Minutes | 3 | 0.9% |
| 35 to 39 Minutes | 0 | 0.0% |
| 40 to 44 Minutes | 0 | 0.0% |
| 45 to 59 Minutes | 0 | 0.0% |
| 60 to 89 Minutes | 5 | 1.5% |
| 90 or more Minutes | 0 | 0.0% |
Commute Time by Sex in Canyon City
The most common commute times in Canyon City are less than 5 minutes (48 commuters, 30.0%) for males and 5 to 9 minutes (81 commuters, 49.1%) for females.
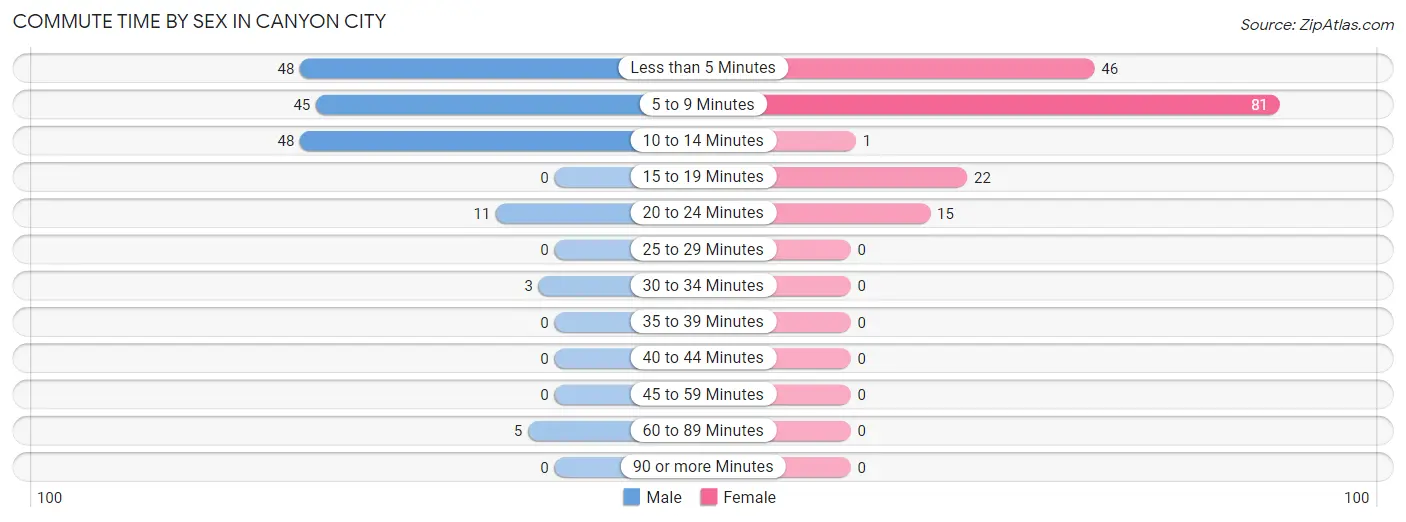
| Commute Time | Male | Female |
| Less than 5 Minutes | 48 (30.0%) | 46 (27.9%) |
| 5 to 9 Minutes | 45 (28.1%) | 81 (49.1%) |
| 10 to 14 Minutes | 48 (30.0%) | 1 (0.6%) |
| 15 to 19 Minutes | 0 (0.0%) | 22 (13.3%) |
| 20 to 24 Minutes | 11 (6.9%) | 15 (9.1%) |
| 25 to 29 Minutes | 0 (0.0%) | 0 (0.0%) |
| 30 to 34 Minutes | 3 (1.9%) | 0 (0.0%) |
| 35 to 39 Minutes | 0 (0.0%) | 0 (0.0%) |
| 40 to 44 Minutes | 0 (0.0%) | 0 (0.0%) |
| 45 to 59 Minutes | 0 (0.0%) | 0 (0.0%) |
| 60 to 89 Minutes | 5 (3.1%) | 0 (0.0%) |
| 90 or more Minutes | 0 (0.0%) | 0 (0.0%) |
Time of Departure to Work by Sex in Canyon City
The most frequent times of departure to work in Canyon City are 7:00 AM to 7:29 AM (50, 31.2%) for males and 6:30 AM to 6:59 AM (52, 31.5%) for females.
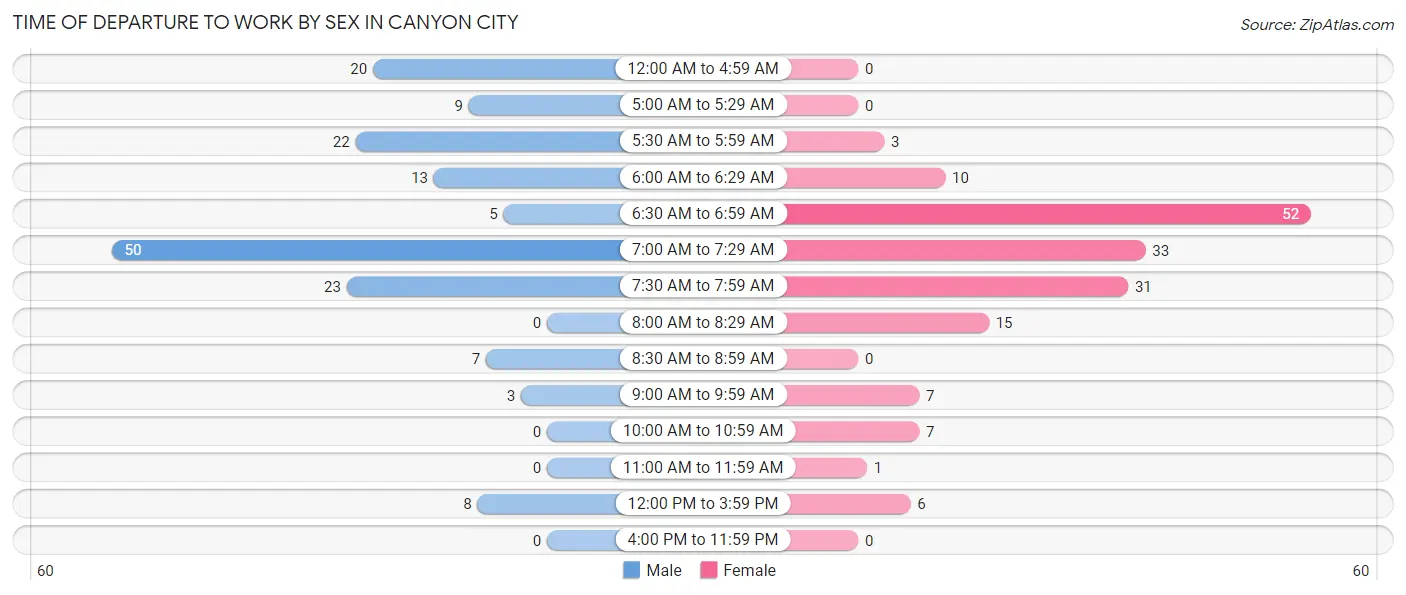
| Time of Departure | Male | Female |
| 12:00 AM to 4:59 AM | 20 (12.5%) | 0 (0.0%) |
| 5:00 AM to 5:29 AM | 9 (5.6%) | 0 (0.0%) |
| 5:30 AM to 5:59 AM | 22 (13.8%) | 3 (1.8%) |
| 6:00 AM to 6:29 AM | 13 (8.1%) | 10 (6.1%) |
| 6:30 AM to 6:59 AM | 5 (3.1%) | 52 (31.5%) |
| 7:00 AM to 7:29 AM | 50 (31.2%) | 33 (20.0%) |
| 7:30 AM to 7:59 AM | 23 (14.4%) | 31 (18.8%) |
| 8:00 AM to 8:29 AM | 0 (0.0%) | 15 (9.1%) |
| 8:30 AM to 8:59 AM | 7 (4.4%) | 0 (0.0%) |
| 9:00 AM to 9:59 AM | 3 (1.9%) | 7 (4.2%) |
| 10:00 AM to 10:59 AM | 0 (0.0%) | 7 (4.2%) |
| 11:00 AM to 11:59 AM | 0 (0.0%) | 1 (0.6%) |
| 12:00 PM to 3:59 PM | 8 (5.0%) | 6 (3.6%) |
| 4:00 PM to 11:59 PM | 0 (0.0%) | 0 (0.0%) |
| Total | 160 (100.0%) | 165 (100.0%) |
Housing Occupancy in Canyon City
Occupancy by Ownership in Canyon City
Of the total 375 dwellings in Canyon City, owner-occupied units account for 292 (77.9%), while renter-occupied units make up 83 (22.1%).
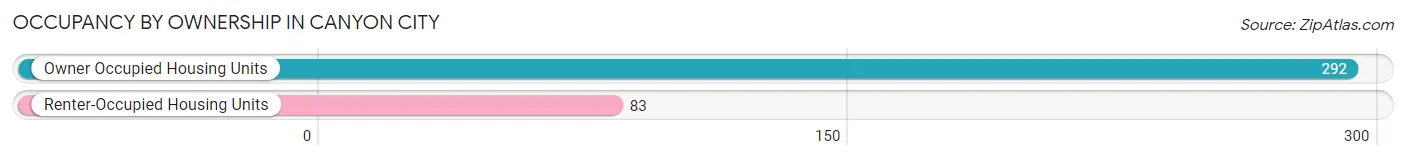
| Occupancy | # Housing Units | % Housing Units |
| Owner Occupied Housing Units | 292 | 77.9% |
| Renter-Occupied Housing Units | 83 | 22.1% |
| Total Occupied Housing Units | 375 | 100.0% |
Occupancy by Household Size in Canyon City
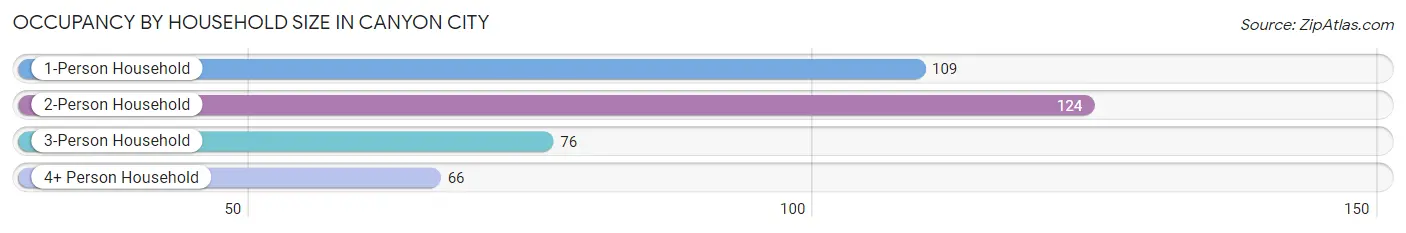
| Household Size | # Housing Units | % Housing Units |
| 1-Person Household | 109 | 29.1% |
| 2-Person Household | 124 | 33.1% |
| 3-Person Household | 76 | 20.3% |
| 4+ Person Household | 66 | 17.6% |
| Total Housing Units | 375 | 100.0% |
Occupancy by Ownership by Household Size in Canyon City
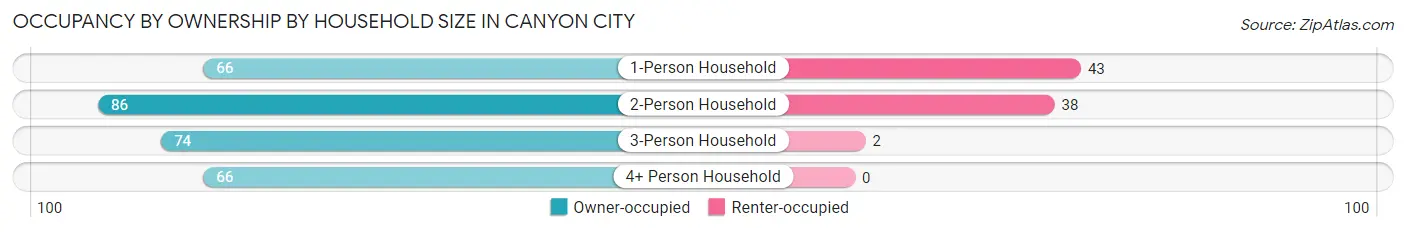
| Household Size | Owner-occupied | Renter-occupied |
| 1-Person Household | 66 (60.6%) | 43 (39.5%) |
| 2-Person Household | 86 (69.4%) | 38 (30.6%) |
| 3-Person Household | 74 (97.4%) | 2 (2.6%) |
| 4+ Person Household | 66 (100.0%) | 0 (0.0%) |
| Total Housing Units | 292 (77.9%) | 83 (22.1%) |
Occupancy by Educational Attainment in Canyon City
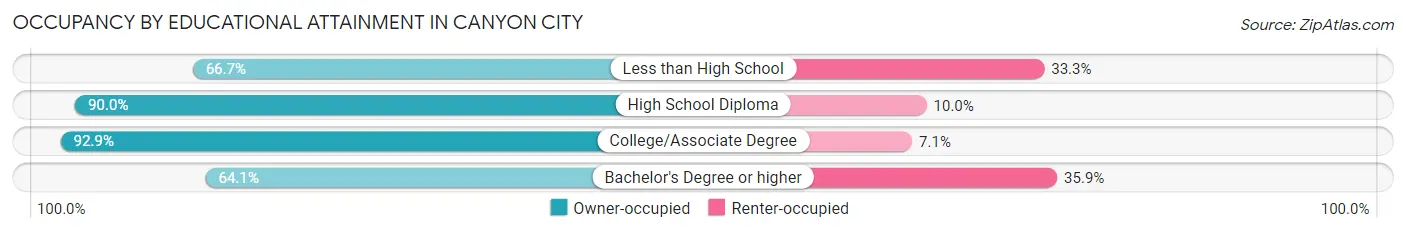
| Household Size | Owner-occupied | Renter-occupied |
| Less than High School | 10 (66.7%) | 5 (33.3%) |
| High School Diploma | 108 (90.0%) | 12 (10.0%) |
| College/Associate Degree | 65 (92.9%) | 5 (7.1%) |
| Bachelor's Degree or higher | 109 (64.1%) | 61 (35.9%) |
Occupancy by Age of Householder in Canyon City
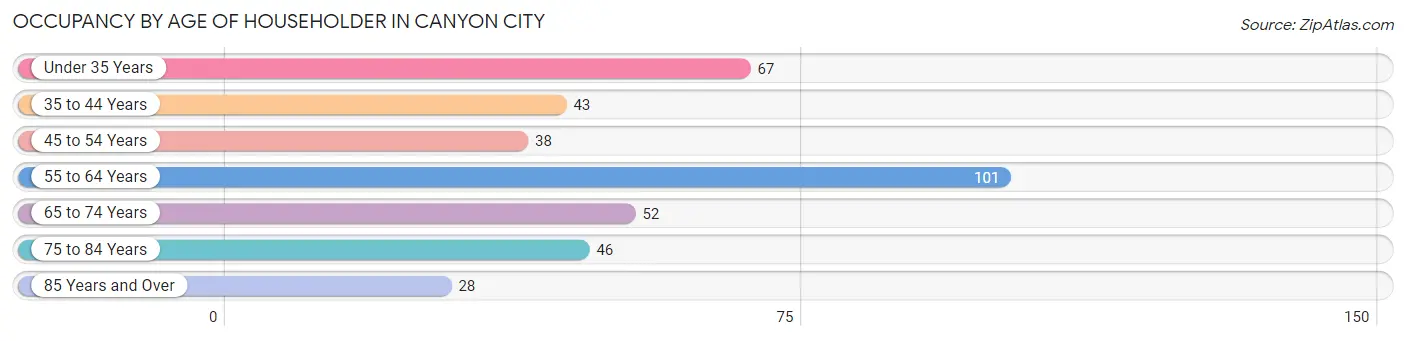
| Age Bracket | # Households | % Households |
| Under 35 Years | 67 | 17.9% |
| 35 to 44 Years | 43 | 11.5% |
| 45 to 54 Years | 38 | 10.1% |
| 55 to 64 Years | 101 | 26.9% |
| 65 to 74 Years | 52 | 13.9% |
| 75 to 84 Years | 46 | 12.3% |
| 85 Years and Over | 28 | 7.5% |
| Total | 375 | 100.0% |
Housing Finances in Canyon City
Median Income by Occupancy in Canyon City
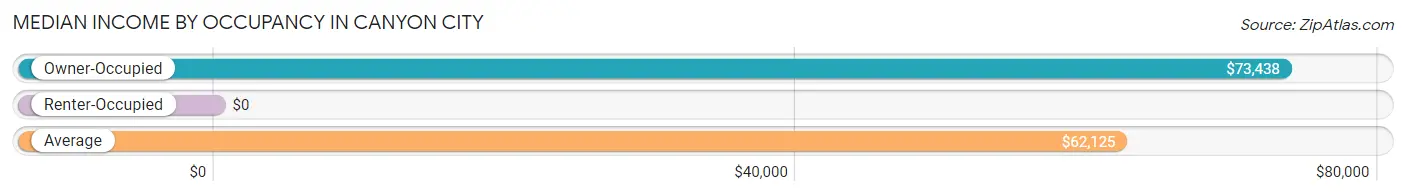
| Occupancy Type | # Households | Median Income |
| Owner-Occupied | 292 (77.9%) | $73,438 |
| Renter-Occupied | 83 (22.1%) | $0 |
| Average | 375 (100.0%) | $62,125 |
Occupancy by Householder Income Bracket in Canyon City
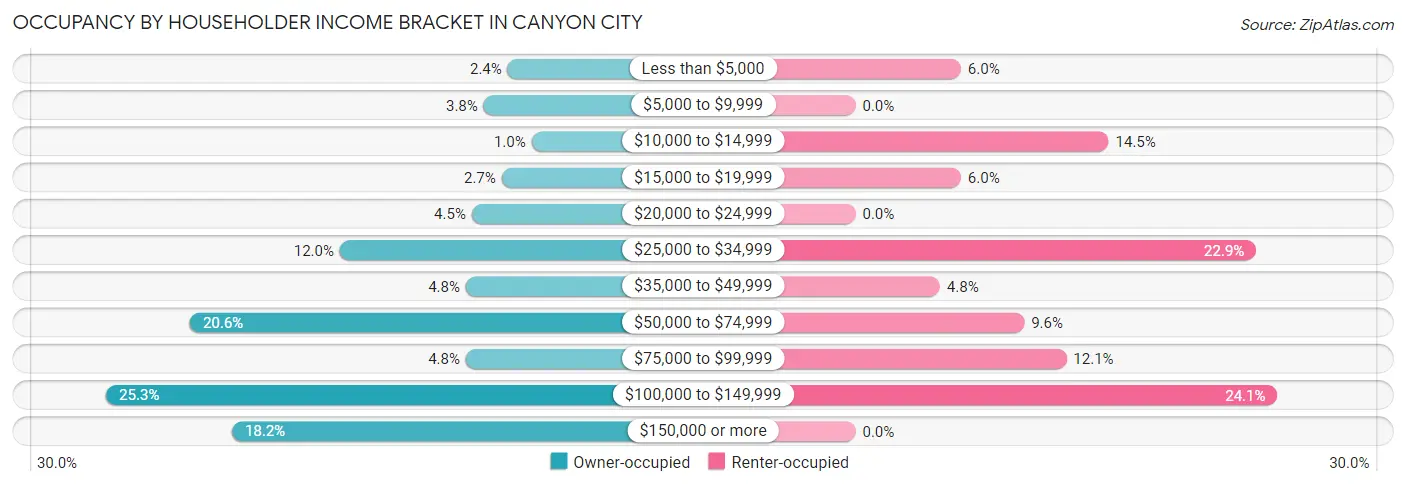
| Income Bracket | Owner-occupied | Renter-occupied |
| Less than $5,000 | 7 (2.4%) | 5 (6.0%) |
| $5,000 to $9,999 | 11 (3.8%) | 0 (0.0%) |
| $10,000 to $14,999 | 3 (1.0%) | 12 (14.5%) |
| $15,000 to $19,999 | 8 (2.7%) | 5 (6.0%) |
| $20,000 to $24,999 | 13 (4.4%) | 0 (0.0%) |
| $25,000 to $34,999 | 35 (12.0%) | 19 (22.9%) |
| $35,000 to $49,999 | 14 (4.8%) | 4 (4.8%) |
| $50,000 to $74,999 | 60 (20.5%) | 8 (9.6%) |
| $75,000 to $99,999 | 14 (4.8%) | 10 (12.0%) |
| $100,000 to $149,999 | 74 (25.3%) | 20 (24.1%) |
| $150,000 or more | 53 (18.1%) | 0 (0.0%) |
| Total | 292 (100.0%) | 83 (100.0%) |
Monthly Housing Cost Tiers in Canyon City
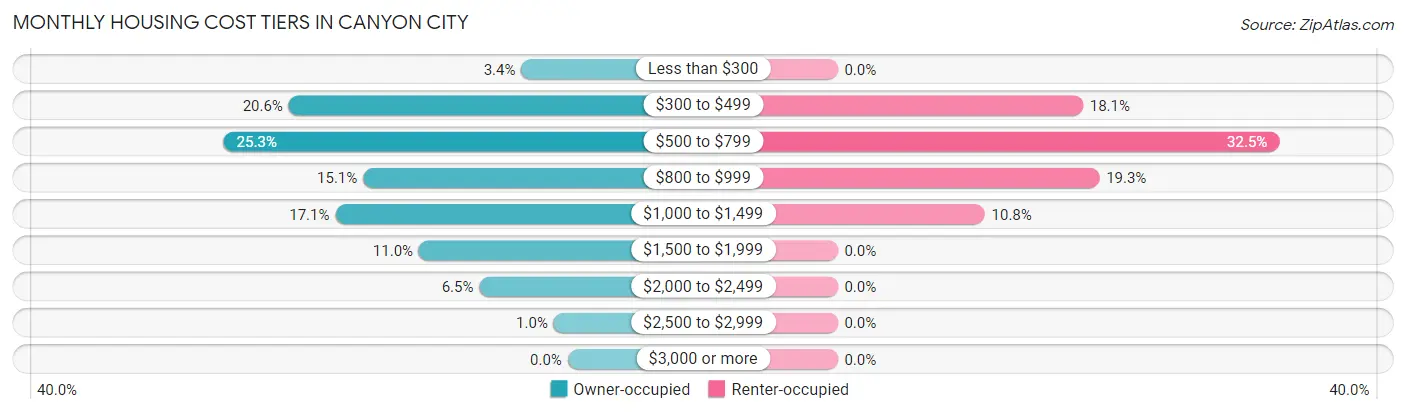
| Monthly Cost | Owner-occupied | Renter-occupied |
| Less than $300 | 10 (3.4%) | 0 (0.0%) |
| $300 to $499 | 60 (20.5%) | 15 (18.1%) |
| $500 to $799 | 74 (25.3%) | 27 (32.5%) |
| $800 to $999 | 44 (15.1%) | 16 (19.3%) |
| $1,000 to $1,499 | 50 (17.1%) | 9 (10.8%) |
| $1,500 to $1,999 | 32 (11.0%) | 0 (0.0%) |
| $2,000 to $2,499 | 19 (6.5%) | 0 (0.0%) |
| $2,500 to $2,999 | 3 (1.0%) | 0 (0.0%) |
| $3,000 or more | 0 (0.0%) | 0 (0.0%) |
| Total | 292 (100.0%) | 83 (100.0%) |
Physical Housing Characteristics in Canyon City
Housing Structures in Canyon City
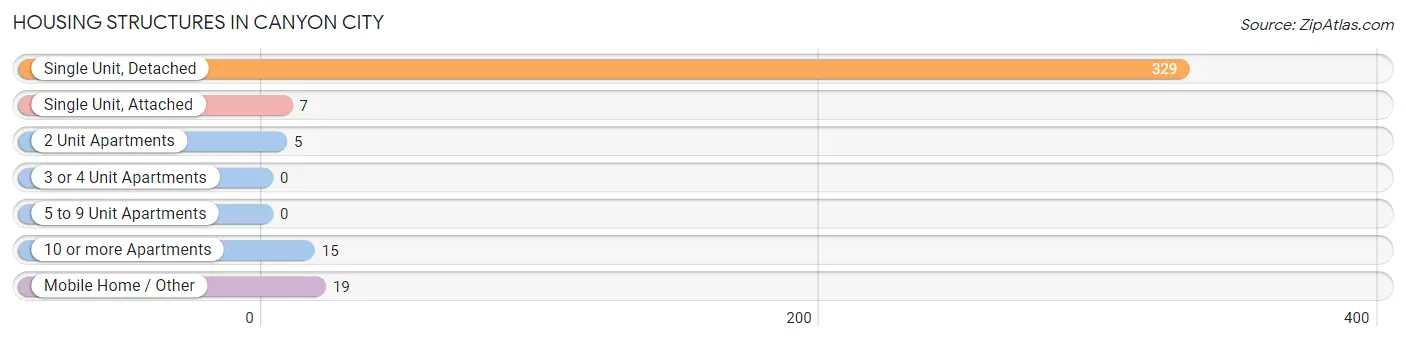
| Structure Type | # Housing Units | % Housing Units |
| Single Unit, Detached | 329 | 87.7% |
| Single Unit, Attached | 7 | 1.9% |
| 2 Unit Apartments | 5 | 1.3% |
| 3 or 4 Unit Apartments | 0 | 0.0% |
| 5 to 9 Unit Apartments | 0 | 0.0% |
| 10 or more Apartments | 15 | 4.0% |
| Mobile Home / Other | 19 | 5.1% |
| Total | 375 | 100.0% |
Housing Structures by Occupancy in Canyon City
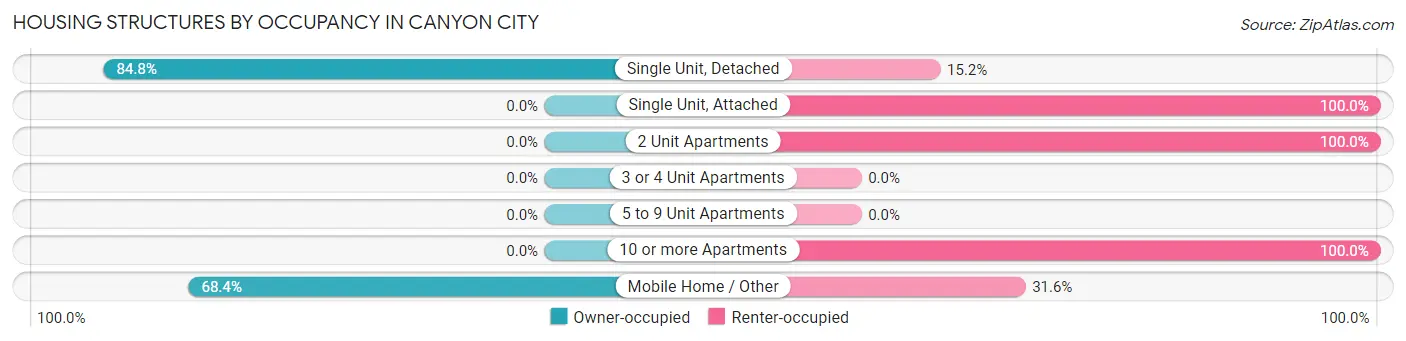
| Structure Type | Owner-occupied | Renter-occupied |
| Single Unit, Detached | 279 (84.8%) | 50 (15.2%) |
| Single Unit, Attached | 0 (0.0%) | 7 (100.0%) |
| 2 Unit Apartments | 0 (0.0%) | 5 (100.0%) |
| 3 or 4 Unit Apartments | 0 (0.0%) | 0 (0.0%) |
| 5 to 9 Unit Apartments | 0 (0.0%) | 0 (0.0%) |
| 10 or more Apartments | 0 (0.0%) | 15 (100.0%) |
| Mobile Home / Other | 13 (68.4%) | 6 (31.6%) |
| Total | 292 (77.9%) | 83 (22.1%) |
Housing Structures by Number of Rooms in Canyon City
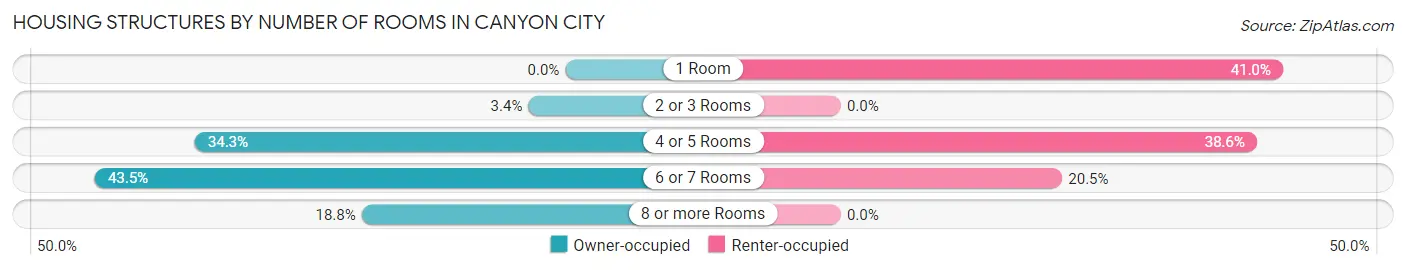
| Number of Rooms | Owner-occupied | Renter-occupied |
| 1 Room | 0 (0.0%) | 34 (41.0%) |
| 2 or 3 Rooms | 10 (3.4%) | 0 (0.0%) |
| 4 or 5 Rooms | 100 (34.3%) | 32 (38.6%) |
| 6 or 7 Rooms | 127 (43.5%) | 17 (20.5%) |
| 8 or more Rooms | 55 (18.8%) | 0 (0.0%) |
| Total | 292 (100.0%) | 83 (100.0%) |
Housing Structure by Heating Type in Canyon City
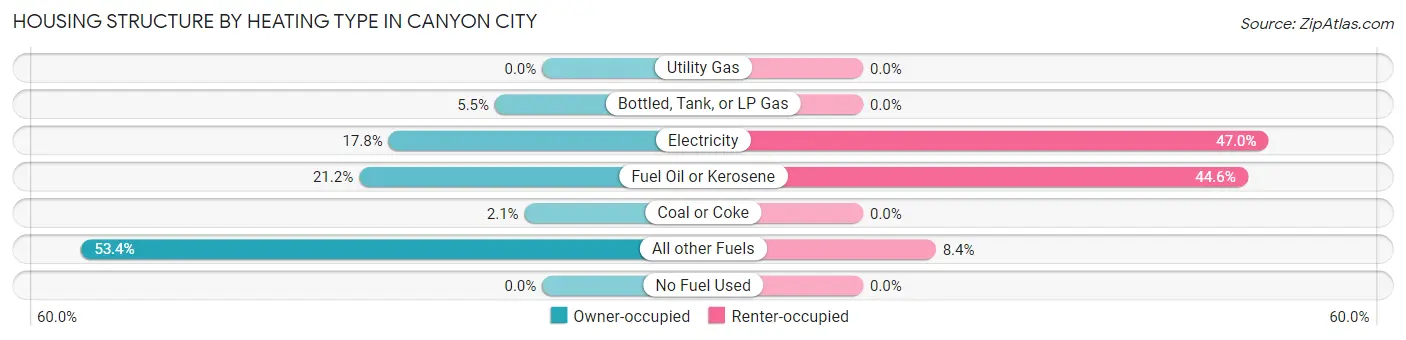
| Heating Type | Owner-occupied | Renter-occupied |
| Utility Gas | 0 (0.0%) | 0 (0.0%) |
| Bottled, Tank, or LP Gas | 16 (5.5%) | 0 (0.0%) |
| Electricity | 52 (17.8%) | 39 (47.0%) |
| Fuel Oil or Kerosene | 62 (21.2%) | 37 (44.6%) |
| Coal or Coke | 6 (2.1%) | 0 (0.0%) |
| All other Fuels | 156 (53.4%) | 7 (8.4%) |
| No Fuel Used | 0 (0.0%) | 0 (0.0%) |
| Total | 292 (100.0%) | 83 (100.0%) |
Household Vehicle Usage in Canyon City
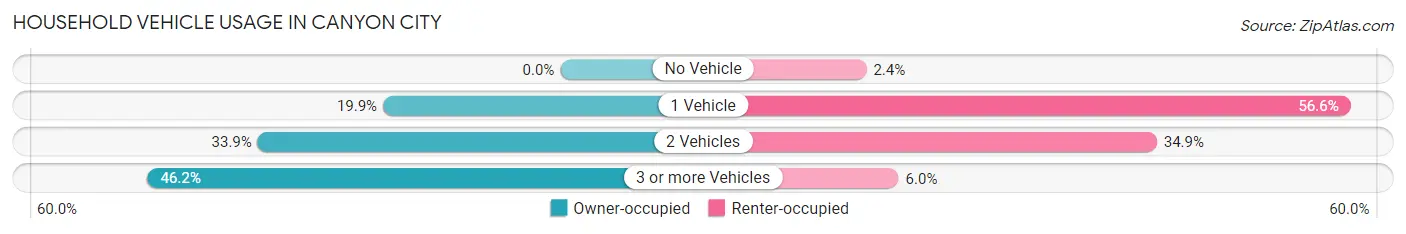
| Vehicles per Household | Owner-occupied | Renter-occupied |
| No Vehicle | 0 (0.0%) | 2 (2.4%) |
| 1 Vehicle | 58 (19.9%) | 47 (56.6%) |
| 2 Vehicles | 99 (33.9%) | 29 (34.9%) |
| 3 or more Vehicles | 135 (46.2%) | 5 (6.0%) |
| Total | 292 (100.0%) | 83 (100.0%) |
Real Estate & Mortgages in Canyon City
Real Estate and Mortgage Overview in Canyon City
| Characteristic | Without Mortgage | With Mortgage |
| Housing Units | 97 | 195 |
| Median Property Value | $126,800 | $182,800 |
| Median Household Income | $56,705 | $47 |
| Monthly Housing Costs | $440 | $0 |
| Real Estate Taxes | $1,359 | $0 |
Property Value by Mortgage Status in Canyon City
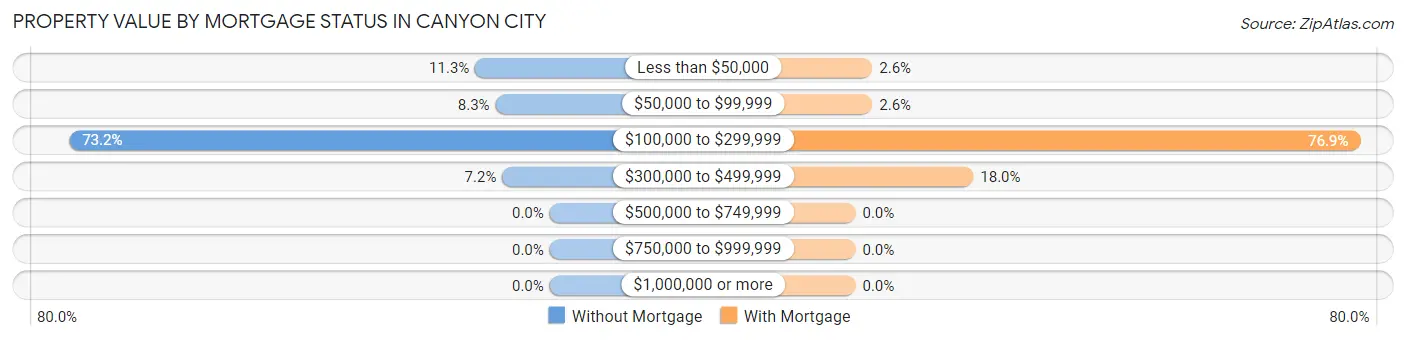
| Property Value | Without Mortgage | With Mortgage |
| Less than $50,000 | 11 (11.3%) | 5 (2.6%) |
| $50,000 to $99,999 | 8 (8.3%) | 5 (2.6%) |
| $100,000 to $299,999 | 71 (73.2%) | 150 (76.9%) |
| $300,000 to $499,999 | 7 (7.2%) | 35 (17.9%) |
| $500,000 to $749,999 | 0 (0.0%) | 0 (0.0%) |
| $750,000 to $999,999 | 0 (0.0%) | 0 (0.0%) |
| $1,000,000 or more | 0 (0.0%) | 0 (0.0%) |
| Total | 97 (100.0%) | 195 (100.0%) |
Household Income by Mortgage Status in Canyon City
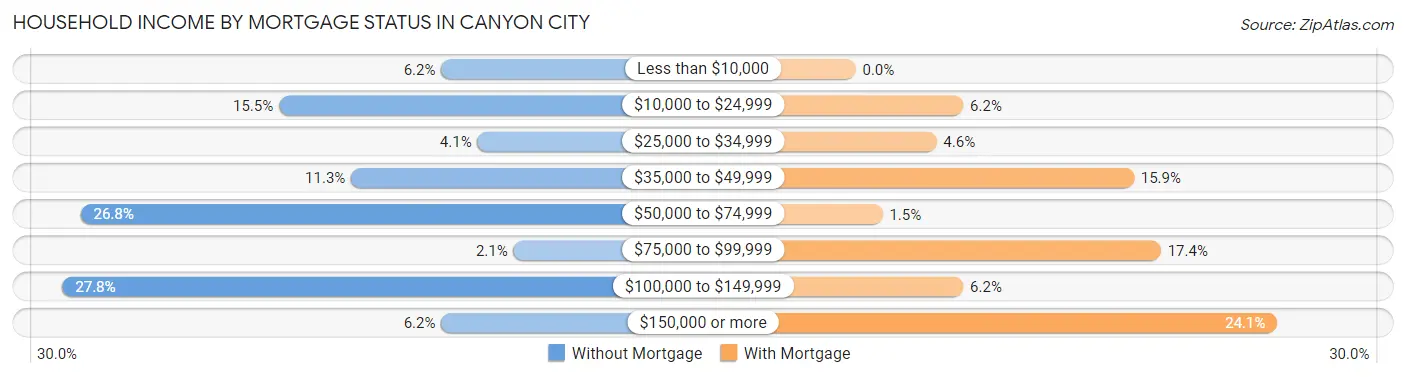
| Household Income | Without Mortgage | With Mortgage |
| Less than $10,000 | 6 (6.2%) | 0 (0.0%) |
| $10,000 to $24,999 | 15 (15.5%) | 12 (6.1%) |
| $25,000 to $34,999 | 4 (4.1%) | 9 (4.6%) |
| $35,000 to $49,999 | 11 (11.3%) | 31 (15.9%) |
| $50,000 to $74,999 | 26 (26.8%) | 3 (1.5%) |
| $75,000 to $99,999 | 2 (2.1%) | 34 (17.4%) |
| $100,000 to $149,999 | 27 (27.8%) | 12 (6.1%) |
| $150,000 or more | 6 (6.2%) | 47 (24.1%) |
| Total | 97 (100.0%) | 195 (100.0%) |
Property Value to Household Income Ratio in Canyon City
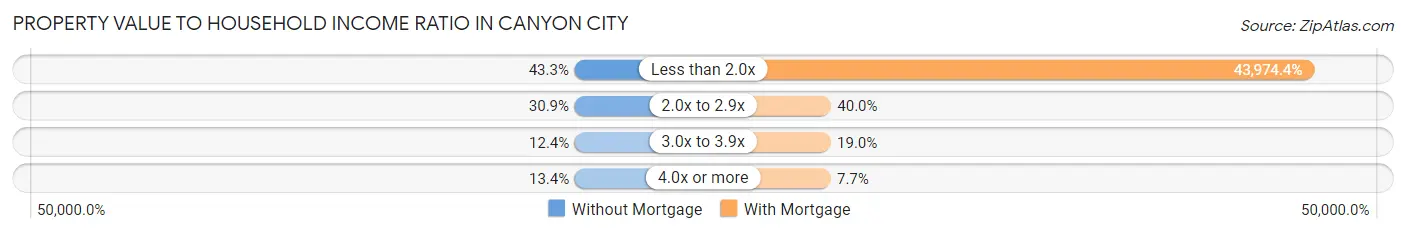
| Value-to-Income Ratio | Without Mortgage | With Mortgage |
| Less than 2.0x | 42 (43.3%) | 85,750 (43,974.4%) |
| 2.0x to 2.9x | 30 (30.9%) | 78 (40.0%) |
| 3.0x to 3.9x | 12 (12.4%) | 37 (19.0%) |
| 4.0x or more | 13 (13.4%) | 15 (7.7%) |
| Total | 97 (100.0%) | 195 (100.0%) |
Real Estate Taxes by Mortgage Status in Canyon City
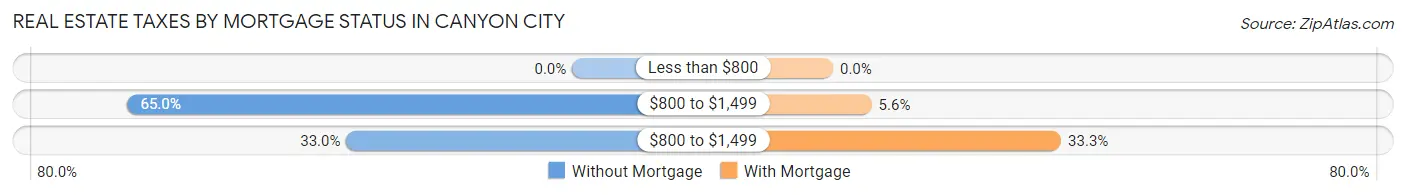
| Property Taxes | Without Mortgage | With Mortgage |
| Less than $800 | 0 (0.0%) | 0 (0.0%) |
| $800 to $1,499 | 63 (64.9%) | 11 (5.6%) |
| $800 to $1,499 | 32 (33.0%) | 65 (33.3%) |
| Total | 97 (100.0%) | 195 (100.0%) |
Health & Disability in Canyon City
Health Insurance Coverage by Age in Canyon City
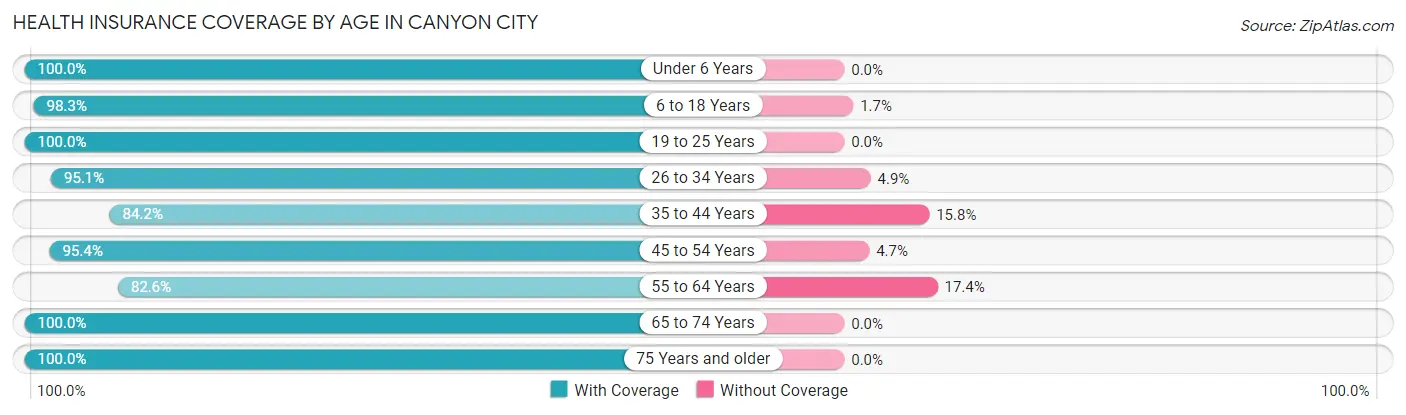
| Age Bracket | With Coverage | Without Coverage |
| Under 6 Years | 67 (100.0%) | 0 (0.0%) |
| 6 to 18 Years | 118 (98.3%) | 2 (1.7%) |
| 19 to 25 Years | 20 (100.0%) | 0 (0.0%) |
| 26 to 34 Years | 97 (95.1%) | 5 (4.9%) |
| 35 to 44 Years | 85 (84.2%) | 16 (15.8%) |
| 45 to 54 Years | 41 (95.4%) | 2 (4.6%) |
| 55 to 64 Years | 152 (82.6%) | 32 (17.4%) |
| 65 to 74 Years | 69 (100.0%) | 0 (0.0%) |
| 75 Years and older | 83 (100.0%) | 0 (0.0%) |
| Total | 732 (92.8%) | 57 (7.2%) |
Health Insurance Coverage by Citizenship Status in Canyon City
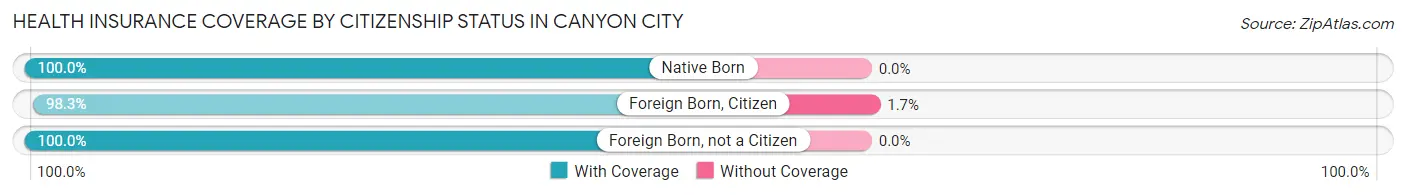
| Citizenship Status | With Coverage | Without Coverage |
| Native Born | 67 (100.0%) | 0 (0.0%) |
| Foreign Born, Citizen | 118 (98.3%) | 2 (1.7%) |
| Foreign Born, not a Citizen | 20 (100.0%) | 0 (0.0%) |
Health Insurance Coverage by Household Income in Canyon City
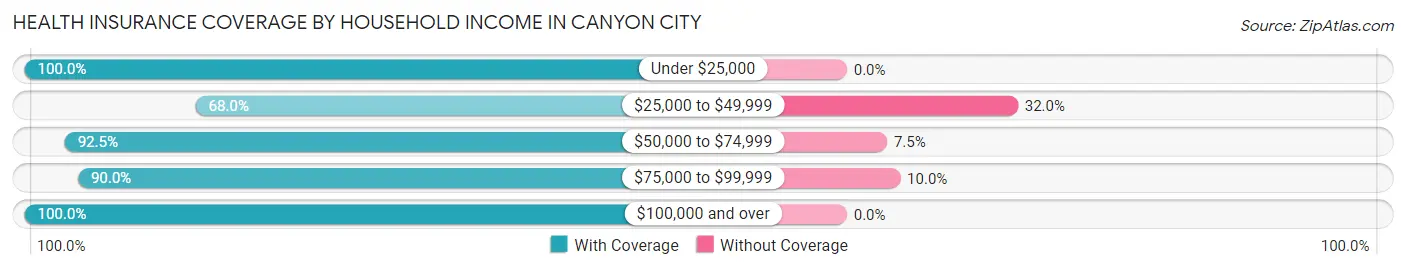
| Household Income | With Coverage | Without Coverage |
| Under $25,000 | 78 (100.0%) | 0 (0.0%) |
| $25,000 to $49,999 | 87 (68.0%) | 41 (32.0%) |
| $50,000 to $74,999 | 135 (92.5%) | 11 (7.5%) |
| $75,000 to $99,999 | 45 (90.0%) | 5 (10.0%) |
| $100,000 and over | 387 (100.0%) | 0 (0.0%) |
Public vs Private Health Insurance Coverage by Age in Canyon City
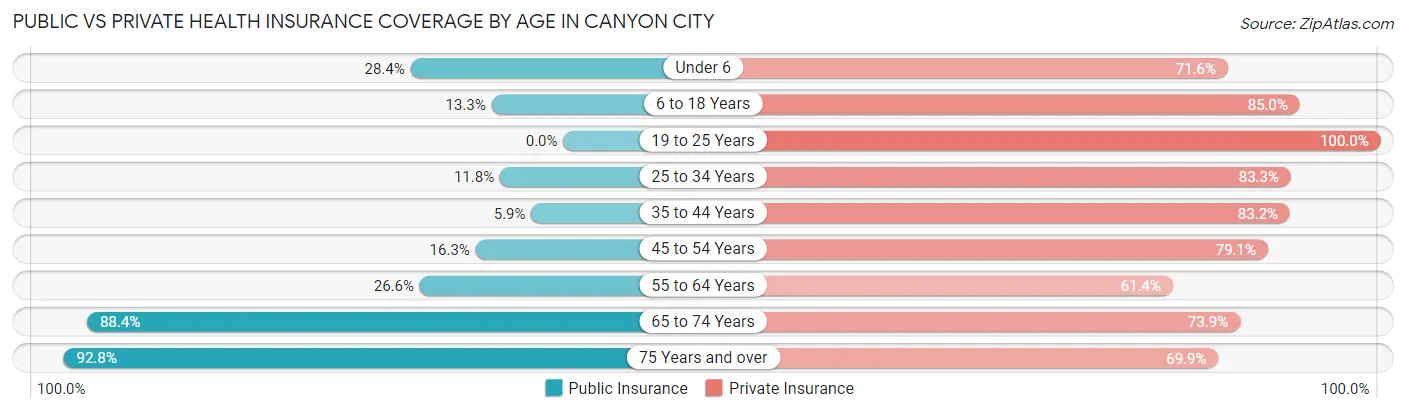
| Age Bracket | Public Insurance | Private Insurance |
| Under 6 | 19 (28.4%) | 48 (71.6%) |
| 6 to 18 Years | 16 (13.3%) | 102 (85.0%) |
| 19 to 25 Years | 0 (0.0%) | 20 (100.0%) |
| 25 to 34 Years | 12 (11.8%) | 85 (83.3%) |
| 35 to 44 Years | 6 (5.9%) | 84 (83.2%) |
| 45 to 54 Years | 7 (16.3%) | 34 (79.1%) |
| 55 to 64 Years | 49 (26.6%) | 113 (61.4%) |
| 65 to 74 Years | 61 (88.4%) | 51 (73.9%) |
| 75 Years and over | 77 (92.8%) | 58 (69.9%) |
| Total | 247 (31.3%) | 595 (75.4%) |
Disability Status by Sex by Age in Canyon City
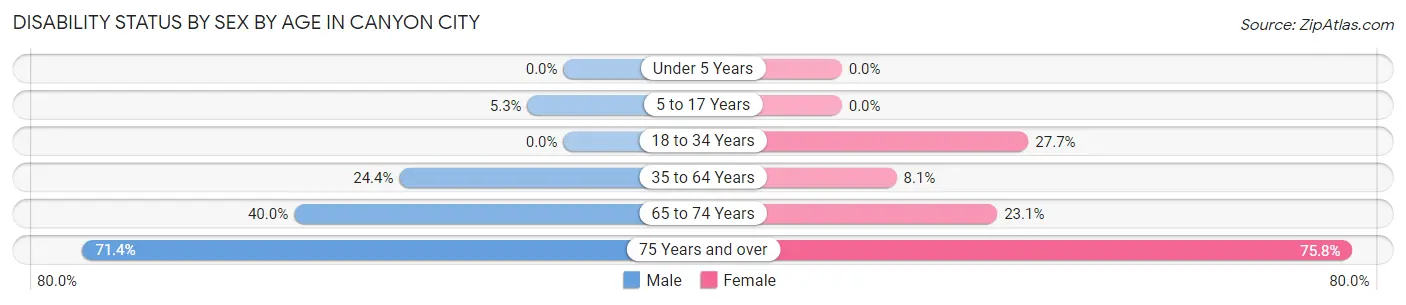
| Age Bracket | Male | Female |
| Under 5 Years | 0 (0.0%) | 0 (0.0%) |
| 5 to 17 Years | 4 (5.3%) | 0 (0.0%) |
| 18 to 34 Years | 0 (0.0%) | 23 (27.7%) |
| 35 to 64 Years | 38 (24.4%) | 14 (8.1%) |
| 65 to 74 Years | 12 (40.0%) | 9 (23.1%) |
| 75 Years and over | 15 (71.4%) | 47 (75.8%) |
Disability Class by Sex by Age in Canyon City
Disability Class: Hearing Difficulty
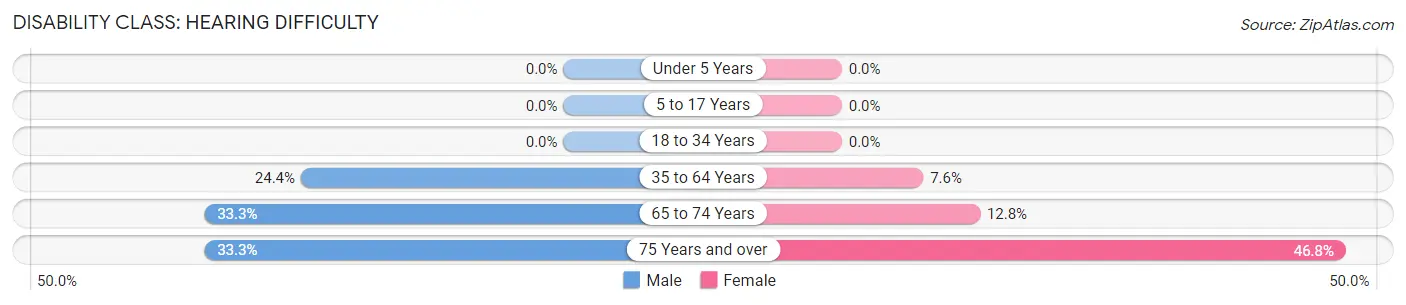
| Age Bracket | Male | Female |
| Under 5 Years | 0 (0.0%) | 0 (0.0%) |
| 5 to 17 Years | 0 (0.0%) | 0 (0.0%) |
| 18 to 34 Years | 0 (0.0%) | 0 (0.0%) |
| 35 to 64 Years | 38 (24.4%) | 13 (7.6%) |
| 65 to 74 Years | 10 (33.3%) | 5 (12.8%) |
| 75 Years and over | 7 (33.3%) | 29 (46.8%) |
Disability Class: Vision Difficulty
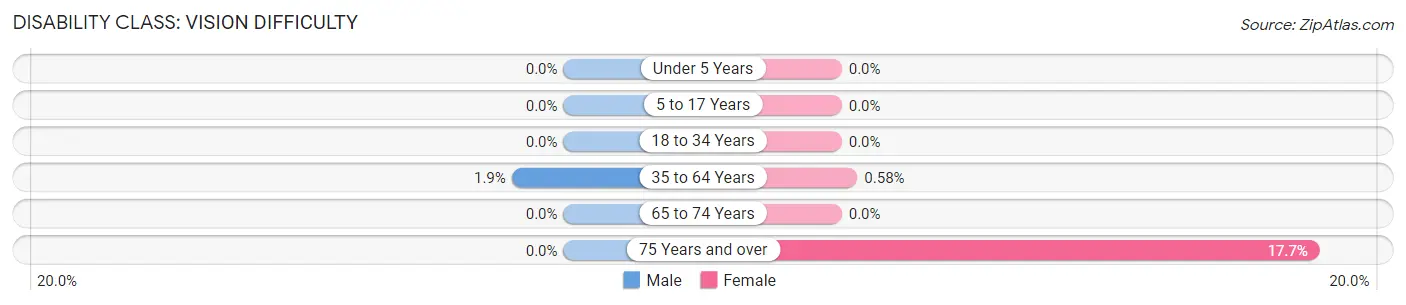
| Age Bracket | Male | Female |
| Under 5 Years | 0 (0.0%) | 0 (0.0%) |
| 5 to 17 Years | 0 (0.0%) | 0 (0.0%) |
| 18 to 34 Years | 0 (0.0%) | 0 (0.0%) |
| 35 to 64 Years | 3 (1.9%) | 1 (0.6%) |
| 65 to 74 Years | 0 (0.0%) | 0 (0.0%) |
| 75 Years and over | 0 (0.0%) | 11 (17.7%) |
Disability Class: Cognitive Difficulty
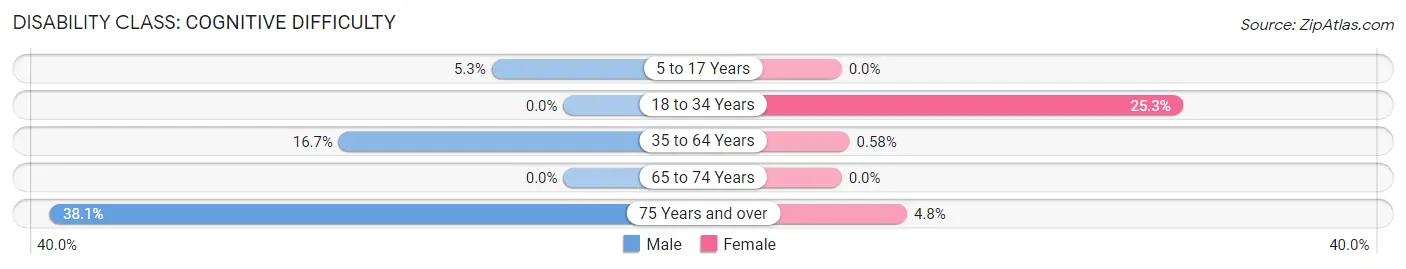
| Age Bracket | Male | Female |
| 5 to 17 Years | 4 (5.3%) | 0 (0.0%) |
| 18 to 34 Years | 0 (0.0%) | 21 (25.3%) |
| 35 to 64 Years | 26 (16.7%) | 1 (0.6%) |
| 65 to 74 Years | 0 (0.0%) | 0 (0.0%) |
| 75 Years and over | 8 (38.1%) | 3 (4.8%) |
Disability Class: Ambulatory Difficulty
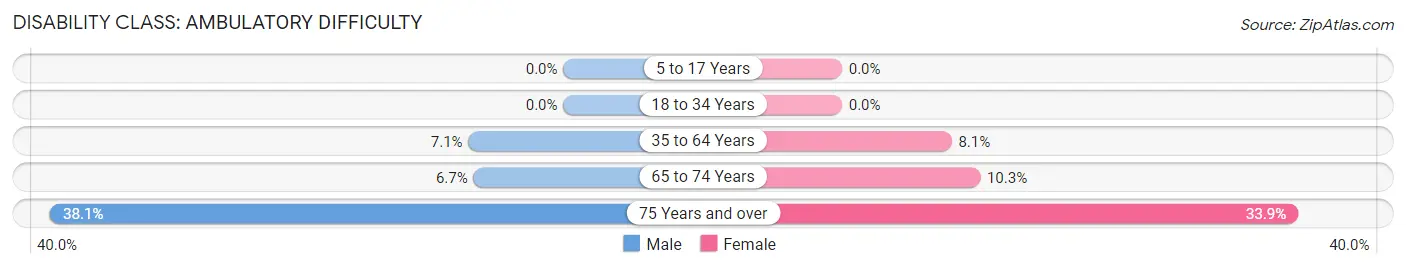
| Age Bracket | Male | Female |
| 5 to 17 Years | 0 (0.0%) | 0 (0.0%) |
| 18 to 34 Years | 0 (0.0%) | 0 (0.0%) |
| 35 to 64 Years | 11 (7.0%) | 14 (8.1%) |
| 65 to 74 Years | 2 (6.7%) | 4 (10.3%) |
| 75 Years and over | 8 (38.1%) | 21 (33.9%) |
Disability Class: Self-Care Difficulty
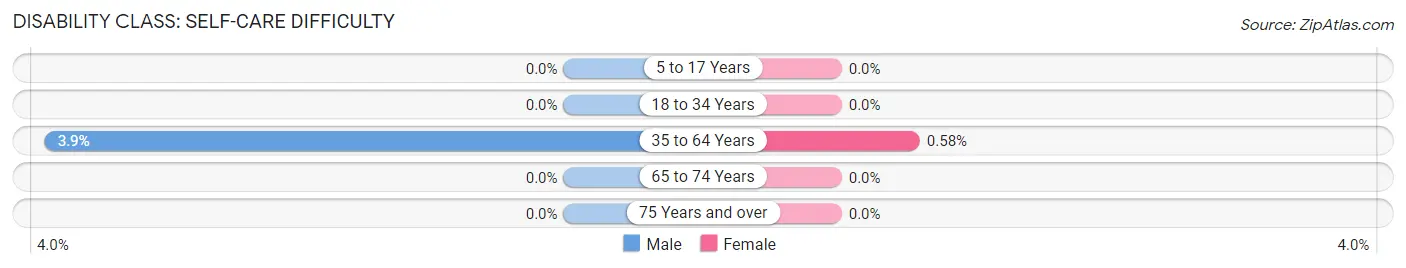
| Age Bracket | Male | Female |
| 5 to 17 Years | 0 (0.0%) | 0 (0.0%) |
| 18 to 34 Years | 0 (0.0%) | 0 (0.0%) |
| 35 to 64 Years | 6 (3.8%) | 1 (0.6%) |
| 65 to 74 Years | 0 (0.0%) | 0 (0.0%) |
| 75 Years and over | 0 (0.0%) | 0 (0.0%) |
Technology Access in Canyon City
Computing Device Access in Canyon City
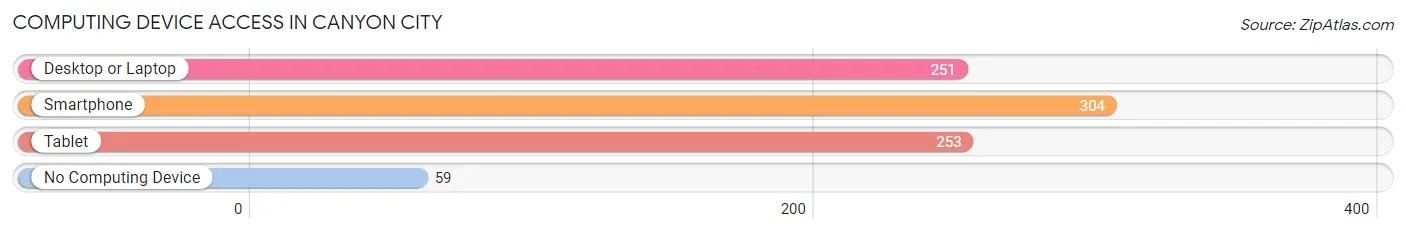
| Device Type | # Households | % Households |
| Desktop or Laptop | 251 | 66.9% |
| Smartphone | 304 | 81.1% |
| Tablet | 253 | 67.5% |
| No Computing Device | 59 | 15.7% |
| Total | 375 | 100.0% |
Internet Access in Canyon City
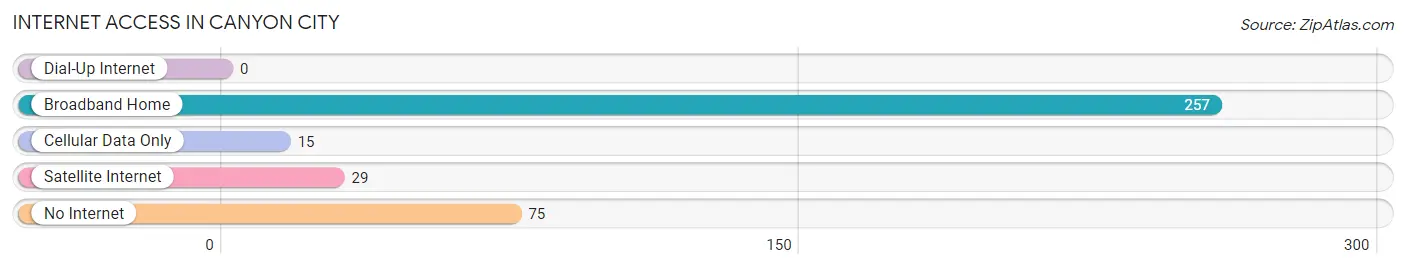
| Internet Type | # Households | % Households |
| Dial-Up Internet | 0 | 0.0% |
| Broadband Home | 257 | 68.5% |
| Cellular Data Only | 15 | 4.0% |
| Satellite Internet | 29 | 7.7% |
| No Internet | 75 | 20.0% |
| Total | 375 | 100.0% |
Canyon City Summary
Canyon City is a small city located in Grant County, Oregon, United States. It is the county seat of Grant County and is located in the Blue Mountains of Eastern Oregon. The city has a population of 1,845 as of the 2010 census.
History
Canyon City was founded in 1864 by a group of miners who were searching for gold in the area. The city was named after the nearby canyon, which was named by the miners. The city was incorporated in 1887 and was the first city in Grant County.
In the late 1800s, Canyon City was a bustling mining town with a population of over 5,000. The city was home to several saloons, hotels, and stores. The city was also home to a number of Chinese immigrants who worked in the mines and on the railroads.
In the early 1900s, the mining industry began to decline and the population of Canyon City began to decrease. The city was also affected by the Great Depression and World War II. By the 1950s, the population had dropped to just over 1,000.
Geography
Canyon City is located in the Blue Mountains of Eastern Oregon. The city is situated at an elevation of 3,845 feet and is surrounded by the John Day River to the north and the Canyon Creek to the south. The city is located approximately 50 miles east of Bend and 100 miles southeast of Portland.
The climate in Canyon City is semi-arid with hot summers and cold winters. The average annual temperature is 46°F and the average annual precipitation is 12.5 inches.
Economy
The economy of Canyon City is largely based on agriculture and tourism. The city is home to several farms and ranches that produce hay, wheat, and other crops. The city is also home to several tourist attractions, including the John Day Fossil Beds National Monument and the Grant County Museum.
The city is also home to several businesses, including a grocery store, a hardware store, and a restaurant. The city is also home to a number of government offices, including the Grant County Courthouse and the Grant County Sheriff's Office.
Demographics
As of the 2010 census, the population of Canyon City was 1,845. The racial makeup of the city was 94.3% White, 0.3% African American, 0.7% Native American, 0.2% Asian, 0.1% Pacific Islander, 0.7% from other races, and 3.0% from two or more races. Hispanic or Latino of any race were 2.2% of the population.
The median income for a household in the city was $31,250 and the median income for a family was $37,500. The per capita income for the city was $17,845. About 16.2% of the population was below the poverty line.
Conclusion
Canyon City is a small city located in Grant County, Oregon. The city has a long history of mining and agriculture and is now largely dependent on tourism and government services. The city has a population of 1,845 and a median income of $31,250. The city is home to several tourist attractions and businesses and is a popular destination for outdoor recreation.
Common Questions
What is the Total Population of Canyon City?
Total Population of Canyon City is 834.
What is the Total Male Population of Canyon City?
Total Male Population of Canyon City is 385.
What is the Total Female Population of Canyon City?
Total Female Population of Canyon City is 449.
What is the Ratio of Males per 100 Females in Canyon City?
There are 85.75 Males per 100 Females in Canyon City.
What is the Ratio of Females per 100 Males in Canyon City?
There are 116.62 Females per 100 Males in Canyon City.
What is the Median Population Age in Canyon City?
Median Population Age in Canyon City is 43.0 Years.
What is the Average Family Size in Canyon City
Average Family Size in Canyon City is 2.7 People.
What is the Average Household Size in Canyon City
Average Household Size in Canyon City is 2.1 People.
What is Per Capita Income in Canyon City?
Per Capita income in Canyon City is $33,843.
What is the Median Family Income in Canyon City?
Median Family Income in Canyon City is $103,024.
What is the Median Household income in Canyon City?
Median Household Income in Canyon City is $62,125.
What is Income or Wage Gap in Canyon City?
Income or Wage Gap in Canyon City is 31.3%.
Women in Canyon City earn 68.7 cents for every dollar earned by a man.
What is Inequality or Gini Index in Canyon City?
Inequality or Gini Index in Canyon City is 0.40.
How Large is the Labor Force in Canyon City?
There are 384 People in the Labor Forcein in Canyon City.
What is the Percentage of People in the Labor Force in Canyon City?
57.1% of People are in the Labor Force in Canyon City.
What is the Unemployment Rate in Canyon City?
Unemployment Rate in Canyon City is 5.5%.