Tigard, OR
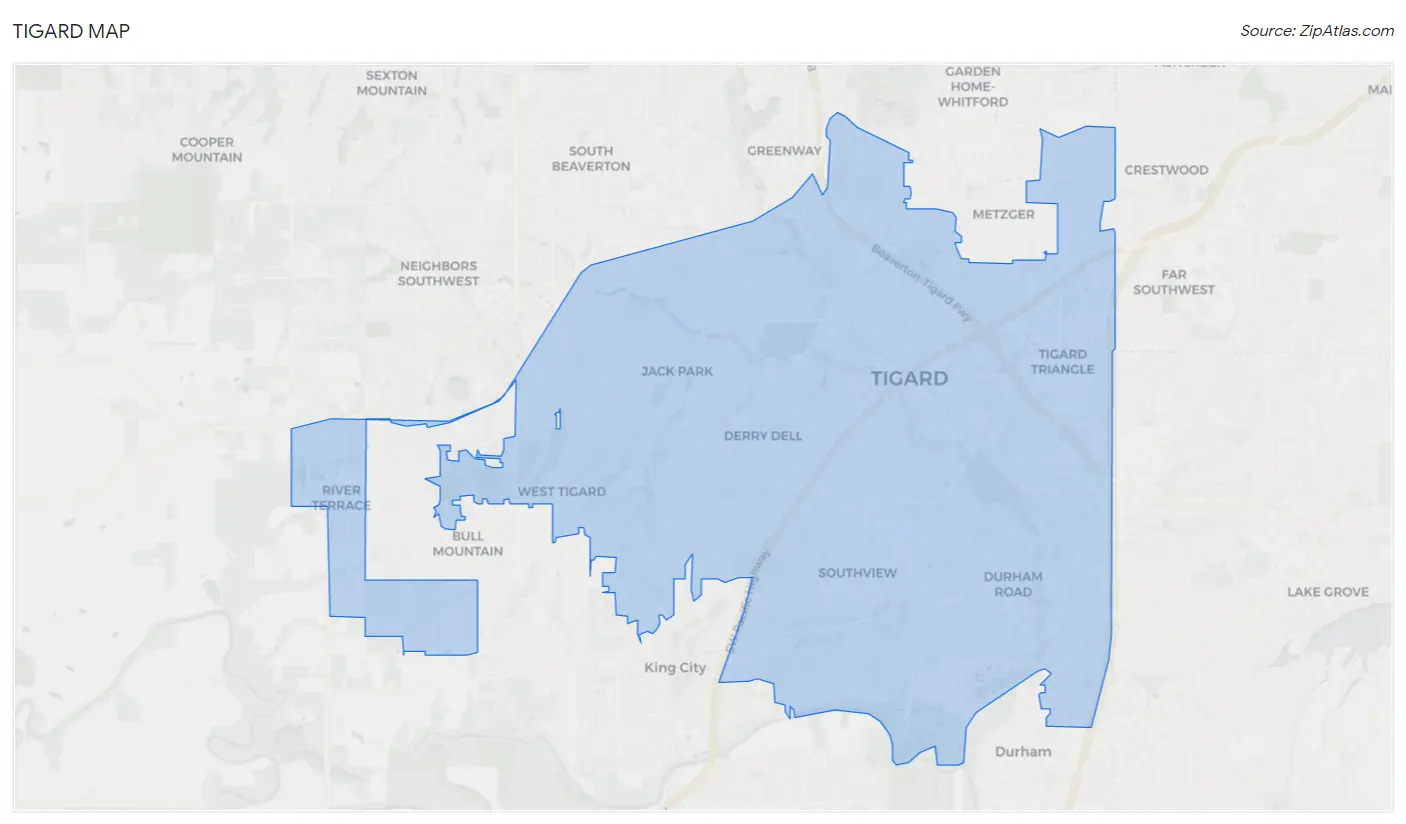
Tigard Map
Tigard Overview
55,161
TOTAL POPULATION
27,997
MALE POPULATION
27,164
FEMALE POPULATION
103.07
MALES / 100 FEMALES
97.02
FEMALES / 100 MALES
38.9
MEDIAN AGE
2.9
AVG FAMILY SIZE
2.4
AVG HOUSEHOLD SIZE
$49,836
PER CAPITA INCOME
$125,216
AVG FAMILY INCOME
$101,354
AVG HOUSEHOLD INCOME
29.8%
WAGE / INCOME GAP [ % ]
70.2¢/ $1
WAGE / INCOME GAP [ $ ]
$10,459
FAMILY INCOME DEFICIT
0.41
INEQUALITY / GINI INDEX
30,995
LABOR FORCE [ PEOPLE ]
68.4%
PERCENT IN LABOR FORCE
5.1%
UNEMPLOYMENT RATE
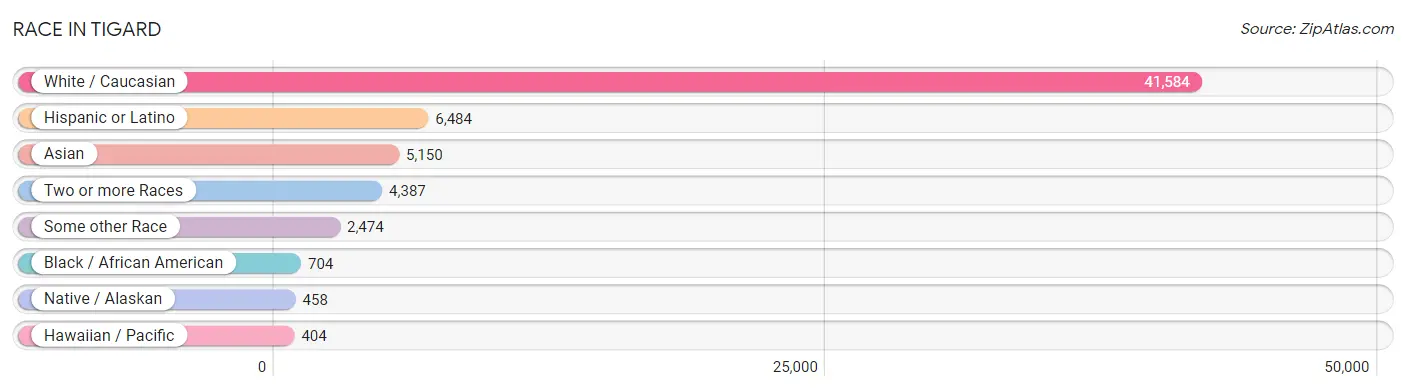
Race in Tigard
The most populous races in Tigard are White / Caucasian (41,584 | 75.4%), Hispanic or Latino (6,484 | 11.7%), and Asian (5,150 | 9.3%).
| Race | # Population | % Population |
| Asian | 5,150 | 9.3% |
| Black / African American | 704 | 1.3% |
| Hawaiian / Pacific | 404 | 0.7% |
| Hispanic or Latino | 6,484 | 11.7% |
| Native / Alaskan | 458 | 0.8% |
| White / Caucasian | 41,584 | 75.4% |
| Two or more Races | 4,387 | 8.0% |
| Some other Race | 2,474 | 4.5% |
| Total | 55,161 | 100.0% |
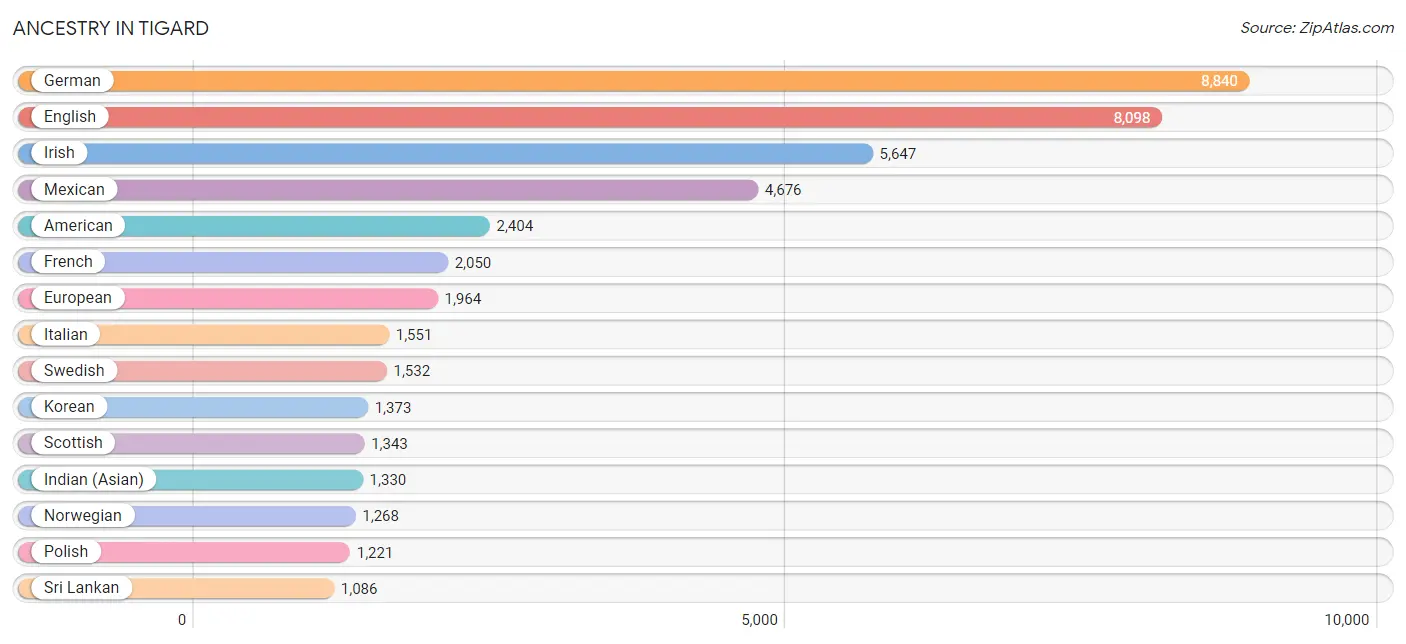
Ancestry in Tigard
The most populous ancestries reported in Tigard are German (8,840 | 16.0%), English (8,098 | 14.7%), Irish (5,647 | 10.2%), Mexican (4,676 | 8.5%), and American (2,404 | 4.4%), together accounting for 53.8% of all Tigard residents.
| Ancestry | # Population | % Population |
| African | 56 | 0.1% |
| Aleut | 27 | 0.1% |
| American | 2,404 | 4.4% |
| Arab | 854 | 1.5% |
| Argentinean | 34 | 0.1% |
| Armenian | 130 | 0.2% |
| Australian | 82 | 0.2% |
| Austrian | 118 | 0.2% |
| Basque | 52 | 0.1% |
| Belgian | 54 | 0.1% |
| Belizean | 9 | 0.0% |
| Bhutanese | 877 | 1.6% |
| Blackfeet | 43 | 0.1% |
| Brazilian | 25 | 0.1% |
| British | 648 | 1.2% |
| Bulgarian | 76 | 0.1% |
| Burmese | 969 | 1.8% |
| Cambodian | 38 | 0.1% |
| Canadian | 198 | 0.4% |
| Celtic | 13 | 0.0% |
| Central American | 419 | 0.8% |
| Central American Indian | 105 | 0.2% |
| Cherokee | 81 | 0.2% |
| Chickasaw | 18 | 0.0% |
| Chippewa | 32 | 0.1% |
| Choctaw | 25 | 0.1% |
| Colombian | 29 | 0.1% |
| Croatian | 120 | 0.2% |
| Cuban | 282 | 0.5% |
| Czech | 332 | 0.6% |
| Czechoslovakian | 236 | 0.4% |
| Danish | 344 | 0.6% |
| Dominican | 76 | 0.1% |
| Dutch | 1,037 | 1.9% |
| Eastern European | 177 | 0.3% |
| Ecuadorian | 42 | 0.1% |
| Egyptian | 106 | 0.2% |
| English | 8,098 | 14.7% |
| Estonian | 6 | 0.0% |
| European | 1,964 | 3.6% |
| Fijian | 9 | 0.0% |
| Filipino | 27 | 0.1% |
| Finnish | 211 | 0.4% |
| French | 2,050 | 3.7% |
| French Canadian | 313 | 0.6% |
| German | 8,840 | 16.0% |
| Greek | 219 | 0.4% |
| Guamanian / Chamorro | 346 | 0.6% |
| Guatemalan | 317 | 0.6% |
| Guyanese | 13 | 0.0% |
| Hungarian | 144 | 0.3% |
| Icelander | 23 | 0.0% |
| Indian (Asian) | 1,330 | 2.4% |
| Inupiat | 38 | 0.1% |
| Iranian | 183 | 0.3% |
| Iraqi | 58 | 0.1% |
| Irish | 5,647 | 10.2% |
| Iroquois | 14 | 0.0% |
| Italian | 1,551 | 2.8% |
| Jamaican | 72 | 0.1% |
| Japanese | 104 | 0.2% |
| Kenyan | 10 | 0.0% |
| Korean | 1,373 | 2.5% |
| Laotian | 137 | 0.3% |
| Latvian | 42 | 0.1% |
| Lebanese | 131 | 0.2% |
| Lithuanian | 53 | 0.1% |
| Malaysian | 106 | 0.2% |
| Mexican | 4,676 | 8.5% |
| Mexican American Indian | 58 | 0.1% |
| Native Hawaiian | 608 | 1.1% |
| Navajo | 127 | 0.2% |
| New Zealander | 18 | 0.0% |
| Nicaraguan | 33 | 0.1% |
| Nigerian | 42 | 0.1% |
| Northern European | 406 | 0.7% |
| Norwegian | 1,268 | 2.3% |
| Pakistani | 222 | 0.4% |
| Peruvian | 207 | 0.4% |
| Polish | 1,221 | 2.2% |
| Portuguese | 255 | 0.5% |
| Puerto Rican | 131 | 0.2% |
| Romanian | 179 | 0.3% |
| Russian | 547 | 1.0% |
| Salvadoran | 69 | 0.1% |
| Scandinavian | 418 | 0.8% |
| Scotch-Irish | 562 | 1.0% |
| Scottish | 1,343 | 2.4% |
| Serbian | 26 | 0.1% |
| Sioux | 16 | 0.0% |
| Slavic | 39 | 0.1% |
| Slovak | 27 | 0.1% |
| Slovene | 21 | 0.0% |
| South African | 7 | 0.0% |
| South American | 354 | 0.6% |
| Spaniard | 184 | 0.3% |
| Spanish | 224 | 0.4% |
| Spanish American Indian | 22 | 0.0% |
| Sri Lankan | 1,086 | 2.0% |
| Subsaharan African | 168 | 0.3% |
| Swedish | 1,532 | 2.8% |
| Swiss | 286 | 0.5% |
| Syrian | 16 | 0.0% |
| Thai | 606 | 1.1% |
| Tongan | 7 | 0.0% |
| Tsimshian | 23 | 0.0% |
| Turkish | 6 | 0.0% |
| Ugandan | 35 | 0.1% |
| Ukrainian | 459 | 0.8% |
| Venezuelan | 42 | 0.1% |
| Welsh | 406 | 0.7% |
| Yugoslavian | 85 | 0.2% | View All 112 Rows |
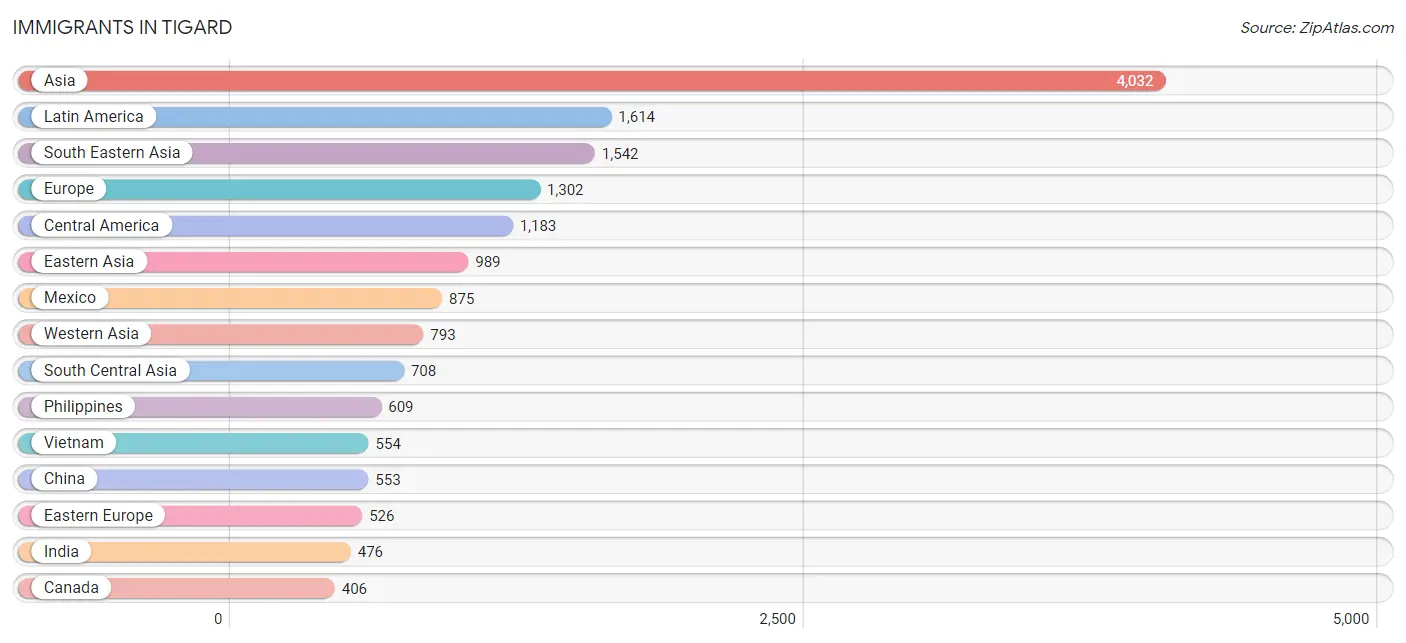
Immigrants in Tigard
The most numerous immigrant groups reported in Tigard came from Asia (4,032 | 7.3%), Latin America (1,614 | 2.9%), South Eastern Asia (1,542 | 2.8%), Europe (1,302 | 2.4%), and Central America (1,183 | 2.1%), together accounting for 17.5% of all Tigard residents.
| Immigration Origin | # Population | % Population |
| Africa | 142 | 0.3% |
| Argentina | 29 | 0.1% |
| Armenia | 64 | 0.1% |
| Asia | 4,032 | 7.3% |
| Australia | 72 | 0.1% |
| Austria | 14 | 0.0% |
| Belarus | 23 | 0.0% |
| Belize | 4 | 0.0% |
| Bosnia and Herzegovina | 80 | 0.2% |
| Brazil | 28 | 0.1% |
| Cambodia | 207 | 0.4% |
| Cameroon | 10 | 0.0% |
| Canada | 406 | 0.7% |
| Caribbean | 118 | 0.2% |
| Central America | 1,183 | 2.1% |
| China | 553 | 1.0% |
| Cuba | 118 | 0.2% |
| Czechoslovakia | 18 | 0.0% |
| Eastern Africa | 46 | 0.1% |
| Eastern Asia | 989 | 1.8% |
| Eastern Europe | 526 | 0.9% |
| Egypt | 33 | 0.1% |
| El Salvador | 55 | 0.1% |
| England | 230 | 0.4% |
| Europe | 1,302 | 2.4% |
| France | 223 | 0.4% |
| Germany | 99 | 0.2% |
| Greece | 34 | 0.1% |
| Guatemala | 238 | 0.4% |
| Hong Kong | 121 | 0.2% |
| India | 476 | 0.9% |
| Indonesia | 82 | 0.2% |
| Iran | 165 | 0.3% |
| Iraq | 289 | 0.5% |
| Israel | 19 | 0.0% |
| Japan | 199 | 0.4% |
| Kenya | 34 | 0.1% |
| Korea | 237 | 0.4% |
| Kuwait | 29 | 0.1% |
| Laos | 52 | 0.1% |
| Latin America | 1,614 | 2.9% |
| Lebanon | 22 | 0.0% |
| Mexico | 875 | 1.6% |
| Micronesia | 186 | 0.3% |
| Middle Africa | 10 | 0.0% |
| Morocco | 11 | 0.0% |
| Nepal | 67 | 0.1% |
| Netherlands | 25 | 0.1% |
| Nicaragua | 11 | 0.0% |
| Nigeria | 17 | 0.0% |
| Northern Africa | 55 | 0.1% |
| Northern Europe | 366 | 0.7% |
| Norway | 8 | 0.0% |
| Oceania | 285 | 0.5% |
| Peru | 203 | 0.4% |
| Philippines | 609 | 1.1% |
| Poland | 127 | 0.2% |
| Romania | 83 | 0.2% |
| Russia | 32 | 0.1% |
| Scotland | 39 | 0.1% |
| Serbia | 22 | 0.0% |
| South Africa | 14 | 0.0% |
| South America | 313 | 0.6% |
| South Central Asia | 708 | 1.3% |
| South Eastern Asia | 1,542 | 2.8% |
| Southern Europe | 49 | 0.1% |
| Spain | 15 | 0.0% |
| Sweden | 28 | 0.1% |
| Syria | 16 | 0.0% |
| Taiwan | 57 | 0.1% |
| Thailand | 38 | 0.1% |
| Turkey | 6 | 0.0% |
| Uganda | 12 | 0.0% |
| Ukraine | 128 | 0.2% |
| Uruguay | 11 | 0.0% |
| Venezuela | 42 | 0.1% |
| Vietnam | 554 | 1.0% |
| Western Africa | 17 | 0.0% |
| Western Asia | 793 | 1.4% |
| Western Europe | 361 | 0.6% |
| Yemen | 50 | 0.1% | View All 81 Rows |
Sex and Age in Tigard
Sex and Age in Tigard
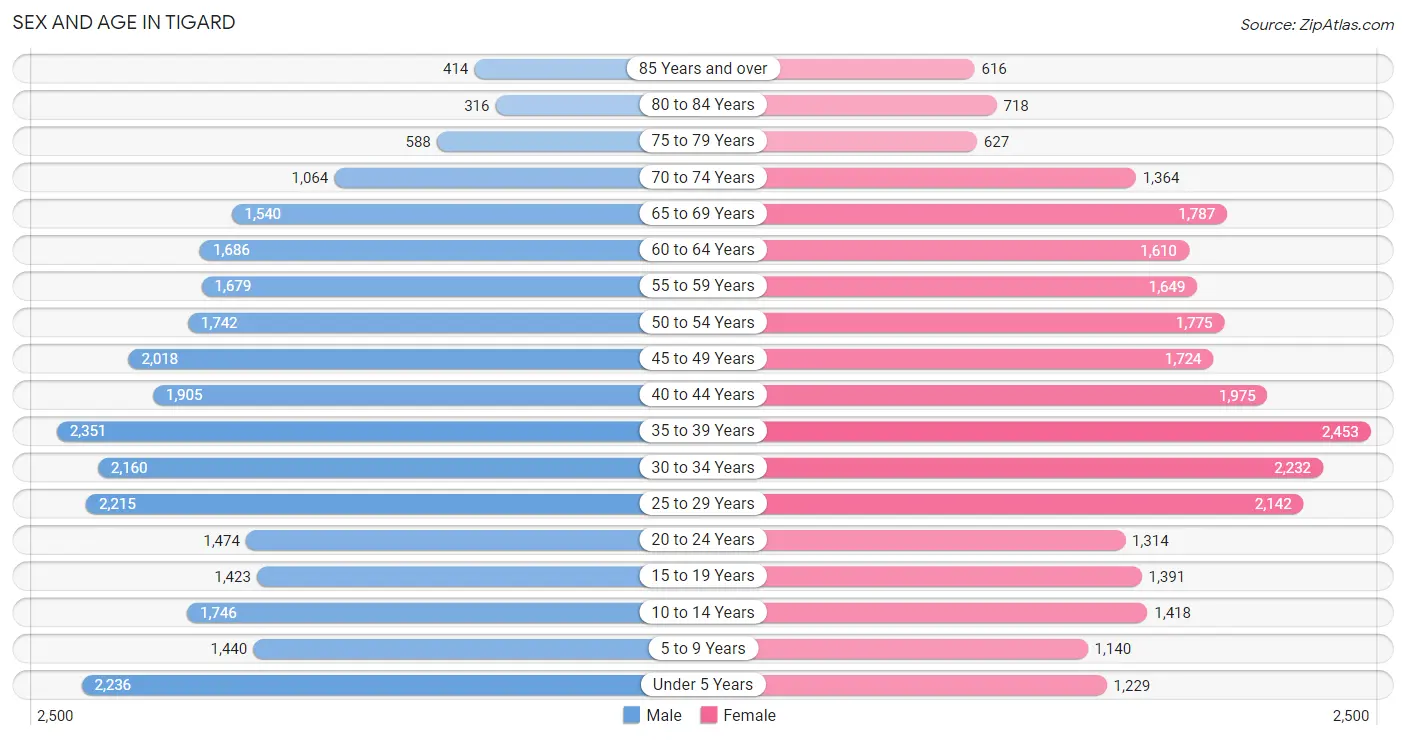
The most populous age groups in Tigard are 35 to 39 Years (2,351 | 8.4%) for men and 35 to 39 Years (2,453 | 9.0%) for women.
| Age Bracket | Male | Female |
| Under 5 Years | 2,236 (8.0%) | 1,229 (4.5%) |
| 5 to 9 Years | 1,440 (5.1%) | 1,140 (4.2%) |
| 10 to 14 Years | 1,746 (6.2%) | 1,418 (5.2%) |
| 15 to 19 Years | 1,423 (5.1%) | 1,391 (5.1%) |
| 20 to 24 Years | 1,474 (5.3%) | 1,314 (4.8%) |
| 25 to 29 Years | 2,215 (7.9%) | 2,142 (7.9%) |
| 30 to 34 Years | 2,160 (7.7%) | 2,232 (8.2%) |
| 35 to 39 Years | 2,351 (8.4%) | 2,453 (9.0%) |
| 40 to 44 Years | 1,905 (6.8%) | 1,975 (7.3%) |
| 45 to 49 Years | 2,018 (7.2%) | 1,724 (6.4%) |
| 50 to 54 Years | 1,742 (6.2%) | 1,775 (6.5%) |
| 55 to 59 Years | 1,679 (6.0%) | 1,649 (6.1%) |
| 60 to 64 Years | 1,686 (6.0%) | 1,610 (5.9%) |
| 65 to 69 Years | 1,540 (5.5%) | 1,787 (6.6%) |
| 70 to 74 Years | 1,064 (3.8%) | 1,364 (5.0%) |
| 75 to 79 Years | 588 (2.1%) | 627 (2.3%) |
| 80 to 84 Years | 316 (1.1%) | 718 (2.6%) |
| 85 Years and over | 414 (1.5%) | 616 (2.3%) |
| Total | 27,997 (100.0%) | 27,164 (100.0%) |
Families and Households in Tigard
Median Family Size in Tigard
The median family size in Tigard is 2.93 persons per family, with married-couple families (11,657 | 79.2%) accounting for the largest median family size of 3.01 persons per family. On the other hand, single male/father families (1,039 | 7.1%) represent the smallest median family size with 2.55 persons per family.

| Family Type | # Families | Family Size |
| Married-Couple | 11,657 (79.2%) | 3.01 |
| Single Male/Father | 1,039 (7.1%) | 2.55 |
| Single Female/Mother | 2,023 (13.7%) | 2.66 |
| Total Families | 14,719 (100.0%) | 2.93 |
Median Household Size in Tigard
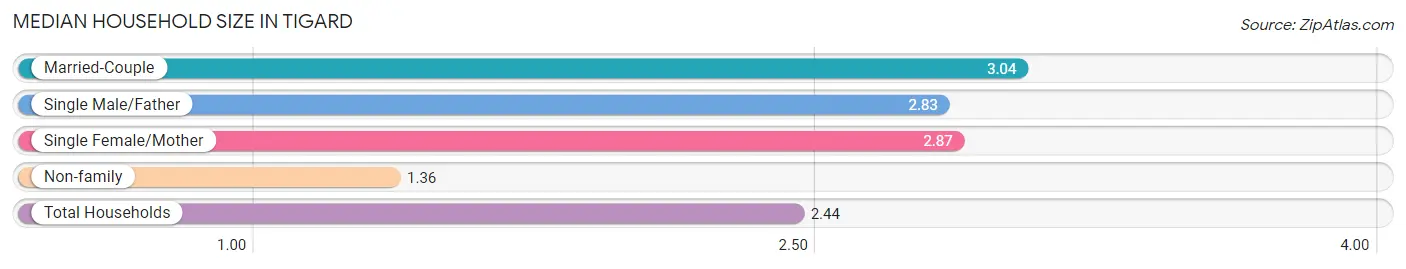
The median household size in Tigard is 2.44 persons per household, with married-couple households (11,657 | 51.9%) accounting for the largest median household size of 3.04 persons per household. non-family households (7,735 | 34.4%) represent the smallest median household size with 1.36 persons per household.
| Household Type | # Households | Household Size |
| Married-Couple | 11,657 (51.9%) | 3.04 |
| Single Male/Father | 1,039 (4.6%) | 2.83 |
| Single Female/Mother | 2,023 (9.0%) | 2.87 |
| Non-family | 7,735 (34.4%) | 1.36 |
| Total Households | 22,454 (100.0%) | 2.44 |
Household Size by Marriage Status in Tigard
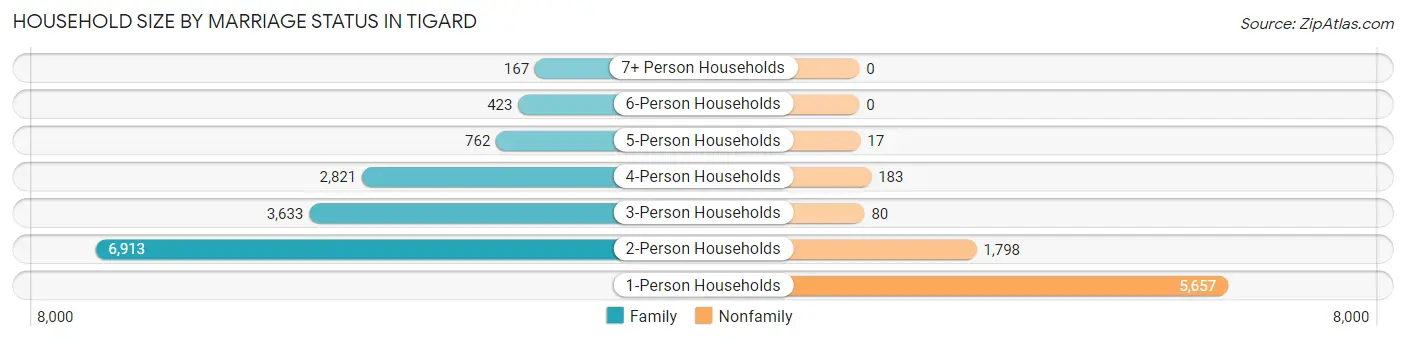
Out of a total of 22,454 households in Tigard, 14,719 (65.5%) are family households, while 7,735 (34.4%) are nonfamily households. The most numerous type of family households are 2-person households, comprising 6,913, and the most common type of nonfamily households are 1-person households, comprising 5,657.
| Household Size | Family Households | Nonfamily Households |
| 1-Person Households | - | 5,657 (25.2%) |
| 2-Person Households | 6,913 (30.8%) | 1,798 (8.0%) |
| 3-Person Households | 3,633 (16.2%) | 80 (0.4%) |
| 4-Person Households | 2,821 (12.6%) | 183 (0.8%) |
| 5-Person Households | 762 (3.4%) | 17 (0.1%) |
| 6-Person Households | 423 (1.9%) | 0 (0.0%) |
| 7+ Person Households | 167 (0.7%) | 0 (0.0%) |
| Total | 14,719 (65.5%) | 7,735 (34.4%) |
Female Fertility in Tigard
Fertility by Age in Tigard
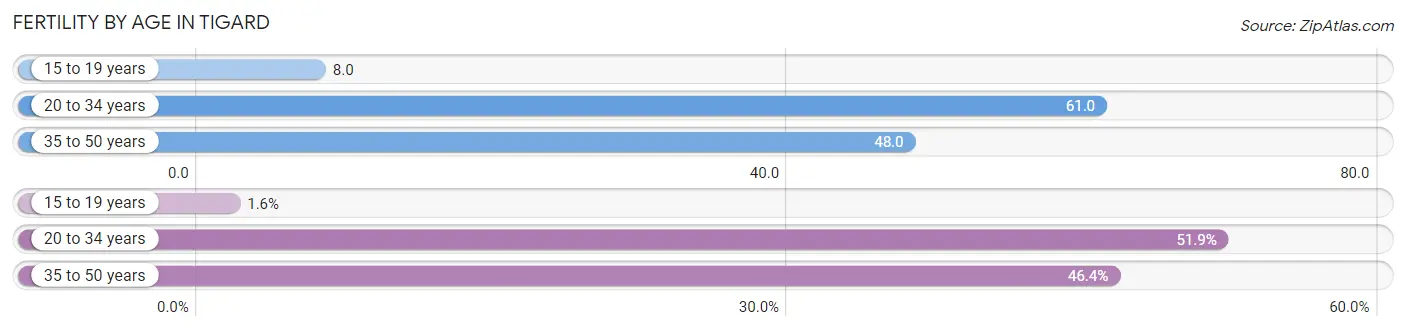
Average fertility rate in Tigard is 49.0 births per 1,000 women. Women in the age bracket of 20 to 34 years have the highest fertility rate with 61.0 births per 1,000 women. Women in the age bracket of 20 to 34 years acount for 51.9% of all women with births.
| Age Bracket | Women with Births | Births / 1,000 Women |
| 15 to 19 years | 11 (1.6%) | 8.0 |
| 20 to 34 years | 348 (51.9%) | 61.0 |
| 35 to 50 years | 311 (46.4%) | 48.0 |
| Total | 670 (100.0%) | 49.0 |
Fertility by Age by Marriage Status in Tigard
82.2% of women with births (670) in Tigard are married. The highest percentage of unmarried women with births falls into 15 to 19 years age bracket with 100.0% of them unmarried at the time of birth, while the lowest percentage of unmarried women with births belong to 20 to 34 years age bracket with 12.1% of them unmarried.
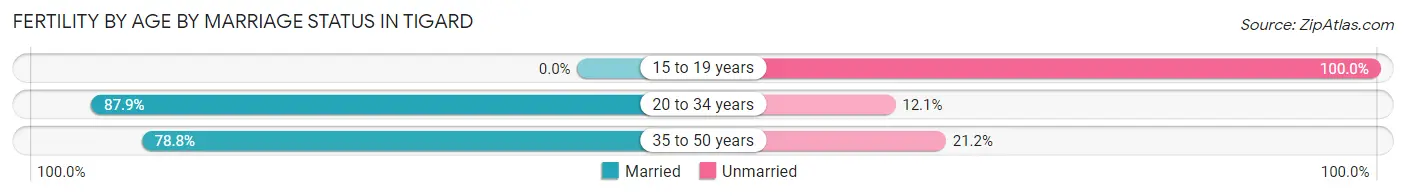
| Age Bracket | Married | Unmarried |
| 15 to 19 years | 0 (0.0%) | 11 (100.0%) |
| 20 to 34 years | 306 (87.9%) | 42 (12.1%) |
| 35 to 50 years | 245 (78.8%) | 66 (21.2%) |
| Total | 551 (82.2%) | 119 (17.8%) |
Fertility by Education in Tigard
Average fertility rate in Tigard is 49.0 births per 1,000 women. Women with the education attainment of bachelor's degree have the highest fertility rate of 76.0 births per 1,000 women, while women with the education attainment of high school diploma have the lowest fertility at 13.0 births per 1,000 women. Women with the education attainment of bachelor's degree represent 46.1% of all women with births.
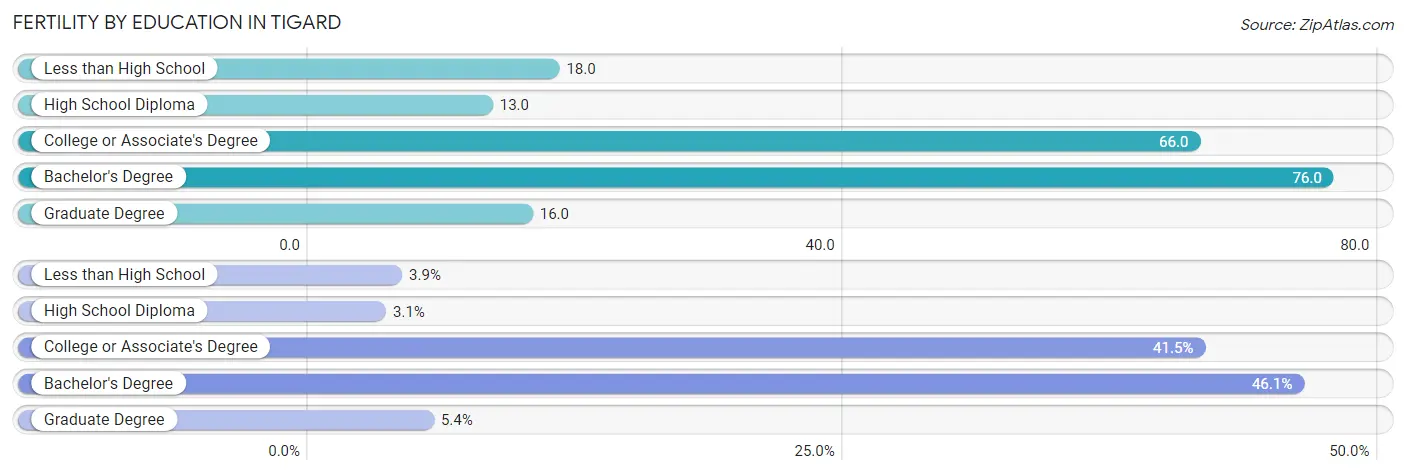
| Educational Attainment | Women with Births | Births / 1,000 Women |
| Less than High School | 26 (3.9%) | 18.0 |
| High School Diploma | 21 (3.1%) | 13.0 |
| College or Associate's Degree | 278 (41.5%) | 66.0 |
| Bachelor's Degree | 309 (46.1%) | 76.0 |
| Graduate Degree | 36 (5.4%) | 16.0 |
| Total | 670 (100.0%) | 49.0 |
Fertility by Education by Marriage Status in Tigard
17.8% of women with births in Tigard are unmarried. Women with the educational attainment of bachelor's degree are most likely to be married with 100.0% of them married at childbirth, while women with the educational attainment of less than high school are least likely to be married with 100.0% of them unmarried at childbirth.
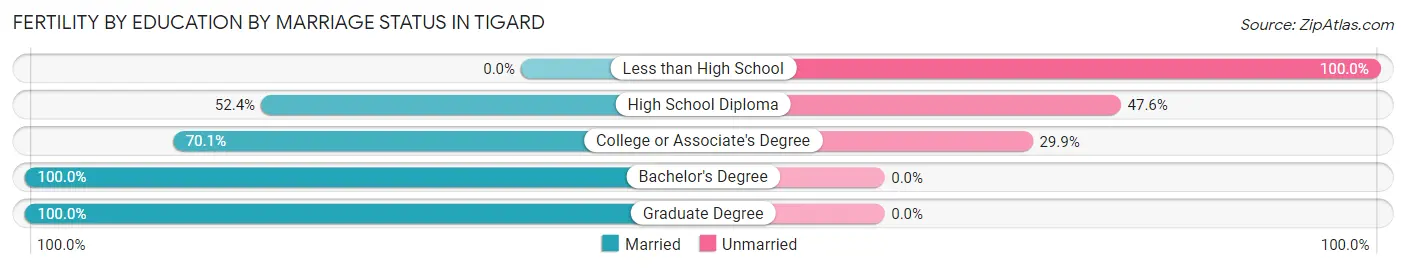
| Educational Attainment | Married | Unmarried |
| Less than High School | 0 (0.0%) | 26 (100.0%) |
| High School Diploma | 11 (52.4%) | 10 (47.6%) |
| College or Associate's Degree | 195 (70.1%) | 83 (29.9%) |
| Bachelor's Degree | 309 (100.0%) | 0 (0.0%) |
| Graduate Degree | 36 (100.0%) | 0 (0.0%) |
| Total | 551 (82.2%) | 119 (17.8%) |
Income in Tigard
Income Overview in Tigard
Per Capita Income in Tigard is $49,836, while median incomes of families and households are $125,216 and $101,354 respectively.
| Characteristic | Number | Measure |
| Per Capita Income | 55,161 | $49,836 |
| Median Family Income | 14,719 | $125,216 |
| Mean Family Income | 14,719 | $141,034 |
| Median Household Income | 22,454 | $101,354 |
| Mean Household Income | 22,454 | $121,446 |
| Income Deficit | 14,719 | $10,459 |
| Wage / Income Gap (%) | 55,161 | 29.84% |
| Wage / Income Gap ($) | 55,161 | 70.16¢ per $1 |
| Gini / Inequality Index | 55,161 | 0.41 |
Earnings by Sex in Tigard
Average Earnings in Tigard are $53,162, $60,547 for men and $42,480 for women, a difference of 29.8%.
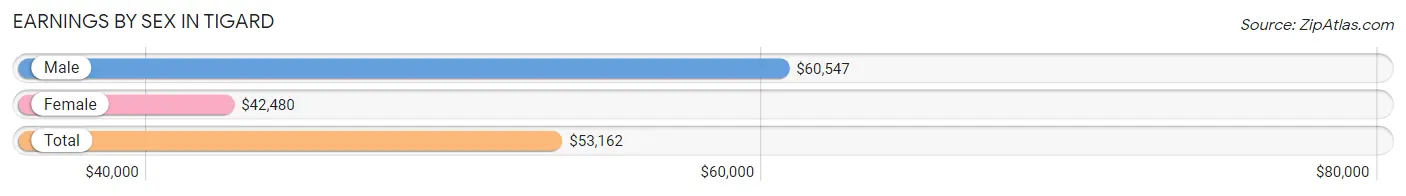
| Sex | Number | Average Earnings |
| Male | 16,762 (52.2%) | $60,547 |
| Female | 15,372 (47.8%) | $42,480 |
| Total | 32,134 (100.0%) | $53,162 |
Earnings by Sex by Income Bracket in Tigard
The most common earnings brackets in Tigard are $100,000+ for men (5,250 | 31.3%) and $100,000+ for women (2,335 | 15.2%).
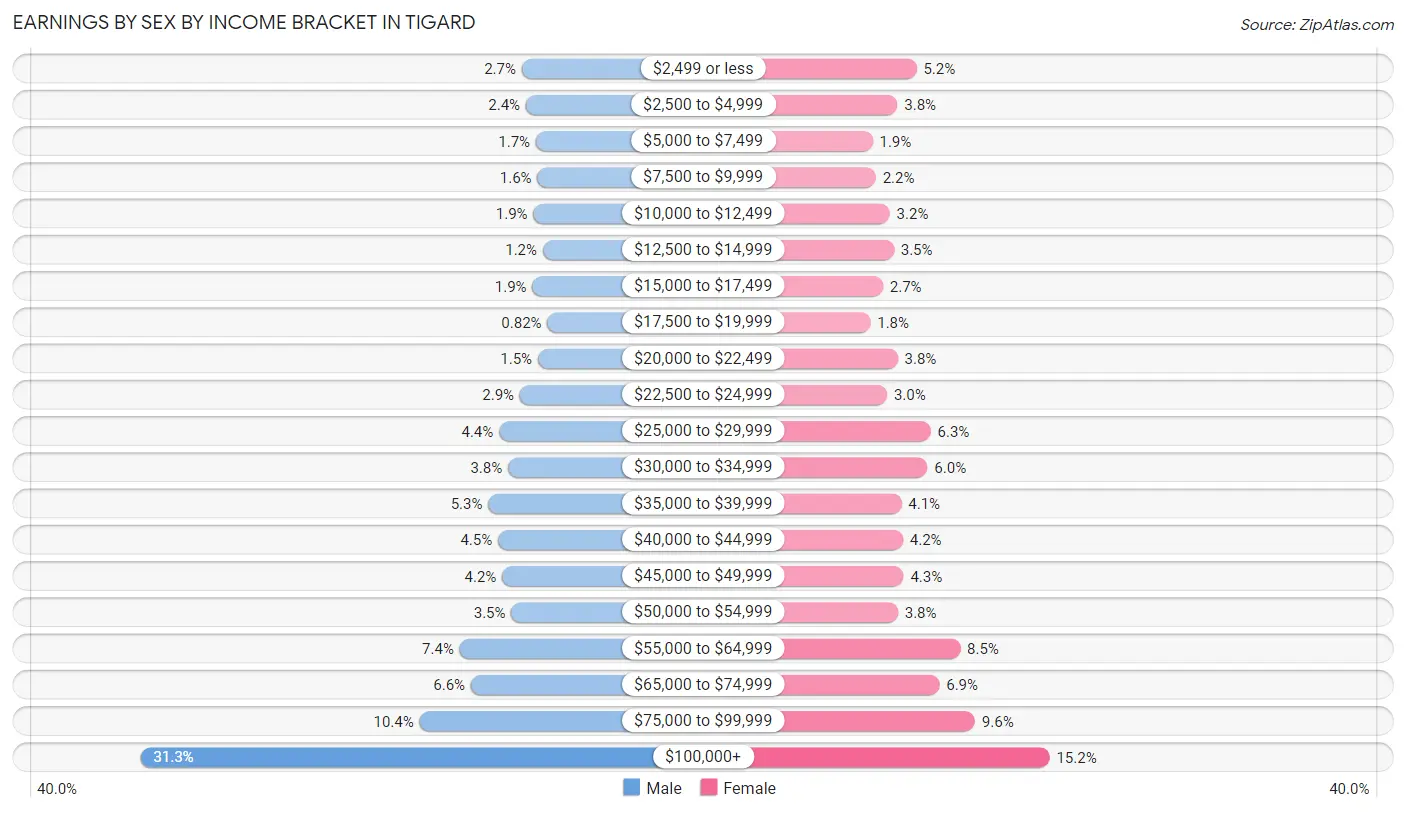
| Income | Male | Female |
| $2,499 or less | 460 (2.7%) | 802 (5.2%) |
| $2,500 to $4,999 | 408 (2.4%) | 583 (3.8%) |
| $5,000 to $7,499 | 281 (1.7%) | 297 (1.9%) |
| $7,500 to $9,999 | 264 (1.6%) | 333 (2.2%) |
| $10,000 to $12,499 | 313 (1.9%) | 494 (3.2%) |
| $12,500 to $14,999 | 195 (1.2%) | 541 (3.5%) |
| $15,000 to $17,499 | 325 (1.9%) | 415 (2.7%) |
| $17,500 to $19,999 | 138 (0.8%) | 271 (1.8%) |
| $20,000 to $22,499 | 256 (1.5%) | 586 (3.8%) |
| $22,500 to $24,999 | 482 (2.9%) | 462 (3.0%) |
| $25,000 to $29,999 | 744 (4.4%) | 965 (6.3%) |
| $30,000 to $34,999 | 632 (3.8%) | 928 (6.0%) |
| $35,000 to $39,999 | 880 (5.2%) | 628 (4.1%) |
| $40,000 to $44,999 | 757 (4.5%) | 645 (4.2%) |
| $45,000 to $49,999 | 706 (4.2%) | 654 (4.3%) |
| $50,000 to $54,999 | 590 (3.5%) | 587 (3.8%) |
| $55,000 to $64,999 | 1,239 (7.4%) | 1,305 (8.5%) |
| $65,000 to $74,999 | 1,098 (6.6%) | 1,066 (6.9%) |
| $75,000 to $99,999 | 1,744 (10.4%) | 1,475 (9.6%) |
| $100,000+ | 5,250 (31.3%) | 2,335 (15.2%) |
| Total | 16,762 (100.0%) | 15,372 (100.0%) |
Earnings by Sex by Educational Attainment in Tigard
Average earnings in Tigard are $68,976 for men and $49,027 for women, a difference of 28.9%. Men with an educational attainment of graduate degree enjoy the highest average annual earnings of $112,929, while those with less than high school education earn the least with $35,375. Women with an educational attainment of graduate degree earn the most with the average annual earnings of $83,567, while those with less than high school education have the smallest earnings of $28,609.
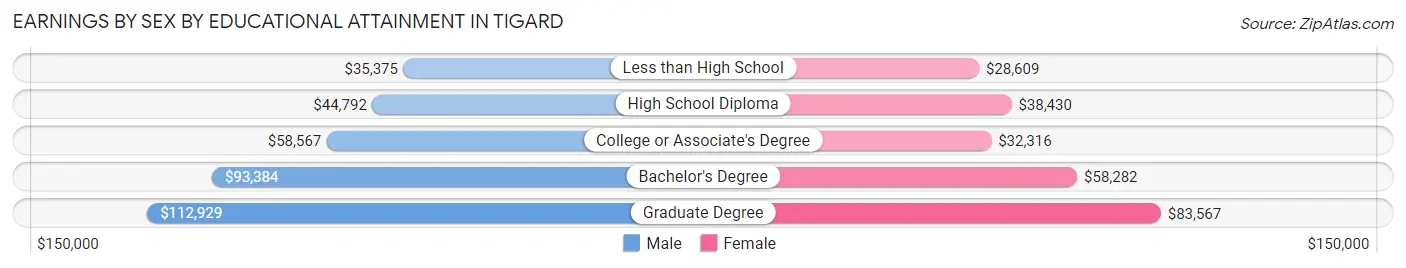
| Educational Attainment | Male Income | Female Income |
| Less than High School | $35,375 | $28,609 |
| High School Diploma | $44,792 | $38,430 |
| College or Associate's Degree | $58,567 | $32,316 |
| Bachelor's Degree | $93,384 | $58,282 |
| Graduate Degree | $112,929 | $83,567 |
| Total | $68,976 | $49,027 |
Family Income in Tigard
Family Income Brackets in Tigard
According to the Tigard family income data, there are 3,930 families falling into the $100,000 to $149,999 income range, which is the most common income bracket and makes up 26.7% of all families. Conversely, the $10,000 to $14,999 income bracket is the least frequent group with only 162 families (1.1%) belonging to this category.
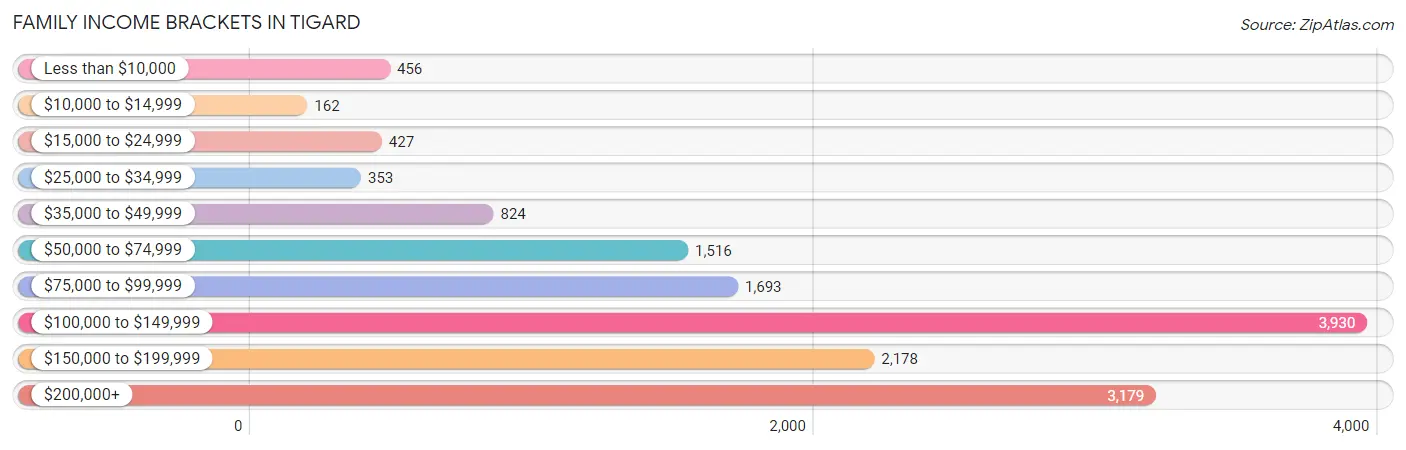
| Income Bracket | # Families | % Families |
| Less than $10,000 | 456 | 3.1% |
| $10,000 to $14,999 | 162 | 1.1% |
| $15,000 to $24,999 | 427 | 2.9% |
| $25,000 to $34,999 | 353 | 2.4% |
| $35,000 to $49,999 | 824 | 5.6% |
| $50,000 to $74,999 | 1,516 | 10.3% |
| $75,000 to $99,999 | 1,693 | 11.5% |
| $100,000 to $149,999 | 3,930 | 26.7% |
| $150,000 to $199,999 | 2,178 | 14.8% |
| $200,000+ | 3,179 | 21.6% |
Family Income by Famaliy Size in Tigard
4-person families (2,682 | 18.2%) account for the highest median family income in Tigard with $156,286 per family, while 2-person families (7,272 | 49.4%) have the highest median income of $49,413 per family member.
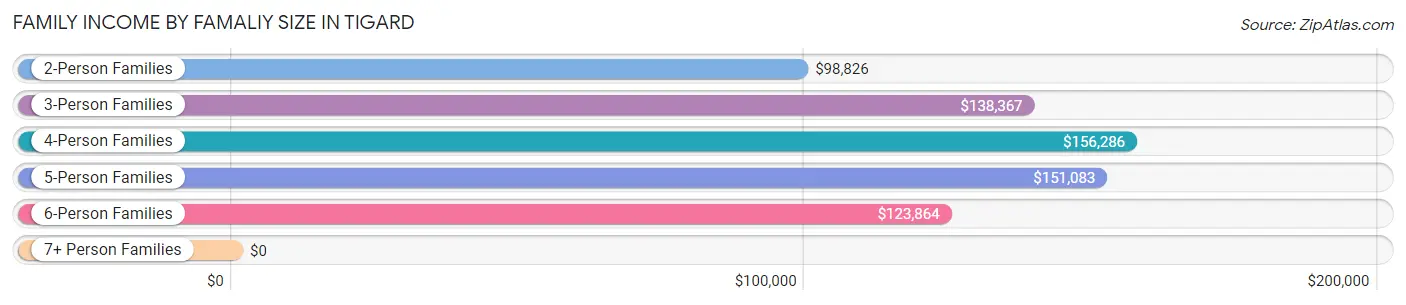
| Income Bracket | # Families | Median Income |
| 2-Person Families | 7,272 (49.4%) | $98,826 |
| 3-Person Families | 3,561 (24.2%) | $138,367 |
| 4-Person Families | 2,682 (18.2%) | $156,286 |
| 5-Person Families | 730 (5.0%) | $151,083 |
| 6-Person Families | 364 (2.5%) | $123,864 |
| 7+ Person Families | 110 (0.7%) | $0 |
| Total | 14,719 (100.0%) | $125,216 |
Family Income by Number of Earners in Tigard
The median family income in Tigard is $125,216, with families comprising 2 earners (7,151) having the highest median family income of $147,703, while families with no earners (2,102) have the lowest median family income of $51,724, accounting for 48.6% and 14.3% of families, respectively.
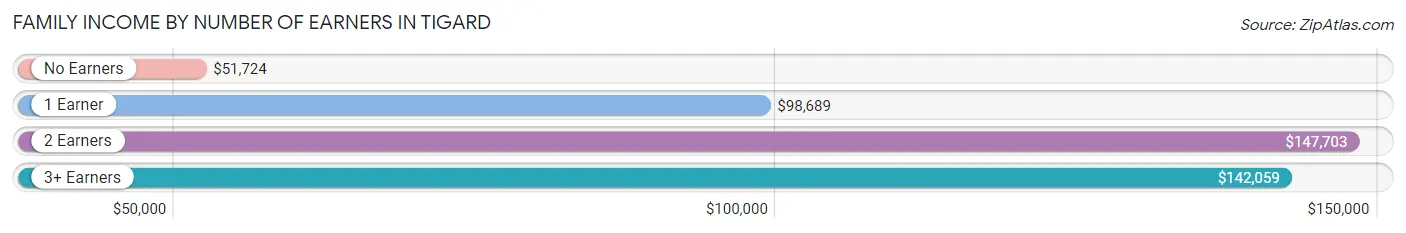
| Number of Earners | # Families | Median Income |
| No Earners | 2,102 (14.3%) | $51,724 |
| 1 Earner | 3,722 (25.3%) | $98,689 |
| 2 Earners | 7,151 (48.6%) | $147,703 |
| 3+ Earners | 1,744 (11.8%) | $142,059 |
| Total | 14,719 (100.0%) | $125,216 |
Household Income in Tigard
Household Income Brackets in Tigard
With 4,873 households falling in the category, the $100,000 to $149,999 income range is the most frequent in Tigard, accounting for 21.7% of all households. In contrast, only 427 households (1.9%) fall into the $10,000 to $14,999 income bracket, making it the least populous group.
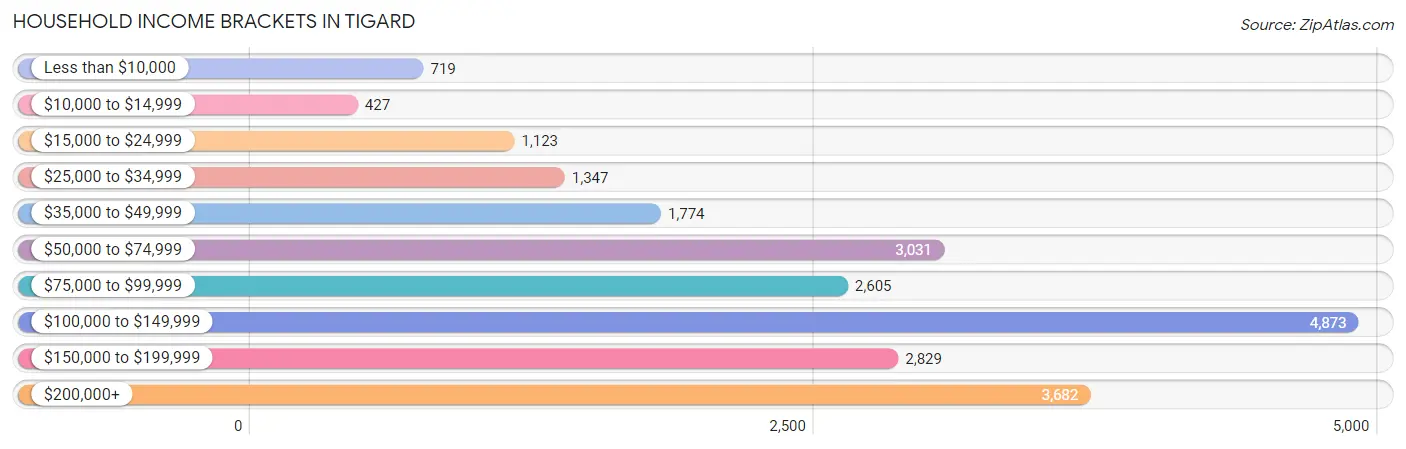
| Income Bracket | # Households | % Households |
| Less than $10,000 | 719 | 3.2% |
| $10,000 to $14,999 | 427 | 1.9% |
| $15,000 to $24,999 | 1,123 | 5.0% |
| $25,000 to $34,999 | 1,347 | 6.0% |
| $35,000 to $49,999 | 1,774 | 7.9% |
| $50,000 to $74,999 | 3,031 | 13.5% |
| $75,000 to $99,999 | 2,605 | 11.6% |
| $100,000 to $149,999 | 4,873 | 21.7% |
| $150,000 to $199,999 | 2,829 | 12.6% |
| $200,000+ | 3,682 | 16.4% |
Household Income by Householder Age in Tigard
The median household income in Tigard is $101,354, with the highest median household income of $126,530 found in the 45 to 64 years age bracket for the primary householder. A total of 7,825 households (34.8%) fall into this category. Meanwhile, the 15 to 24 years age bracket for the primary householder has the lowest median household income of $55,445, with 664 households (3.0%) in this group.
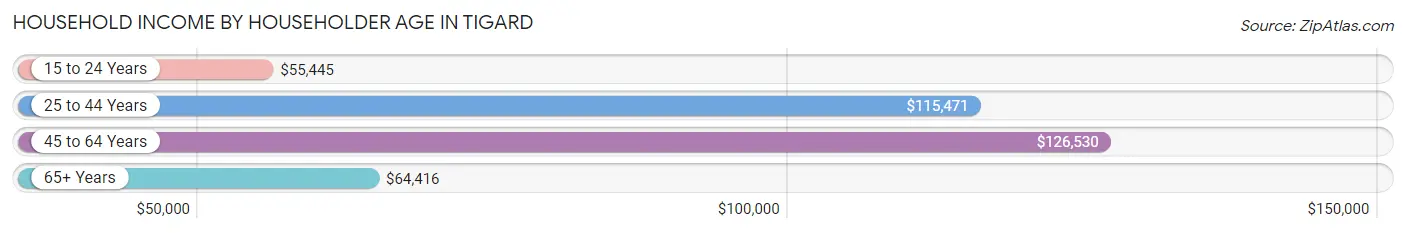
| Income Bracket | # Households | Median Income |
| 15 to 24 Years | 664 (3.0%) | $55,445 |
| 25 to 44 Years | 8,179 (36.4%) | $115,471 |
| 45 to 64 Years | 7,825 (34.8%) | $126,530 |
| 65+ Years | 5,786 (25.8%) | $64,416 |
| Total | 22,454 (100.0%) | $101,354 |
Poverty in Tigard
Income Below Poverty by Sex and Age in Tigard
With 6.7% poverty level for males and 8.9% for females among the residents of Tigard, 5 year old males and 15 year old females are the most vulnerable to poverty, with 82 males (21.9%) and 75 females (22.3%) in their respective age groups living below the poverty level.
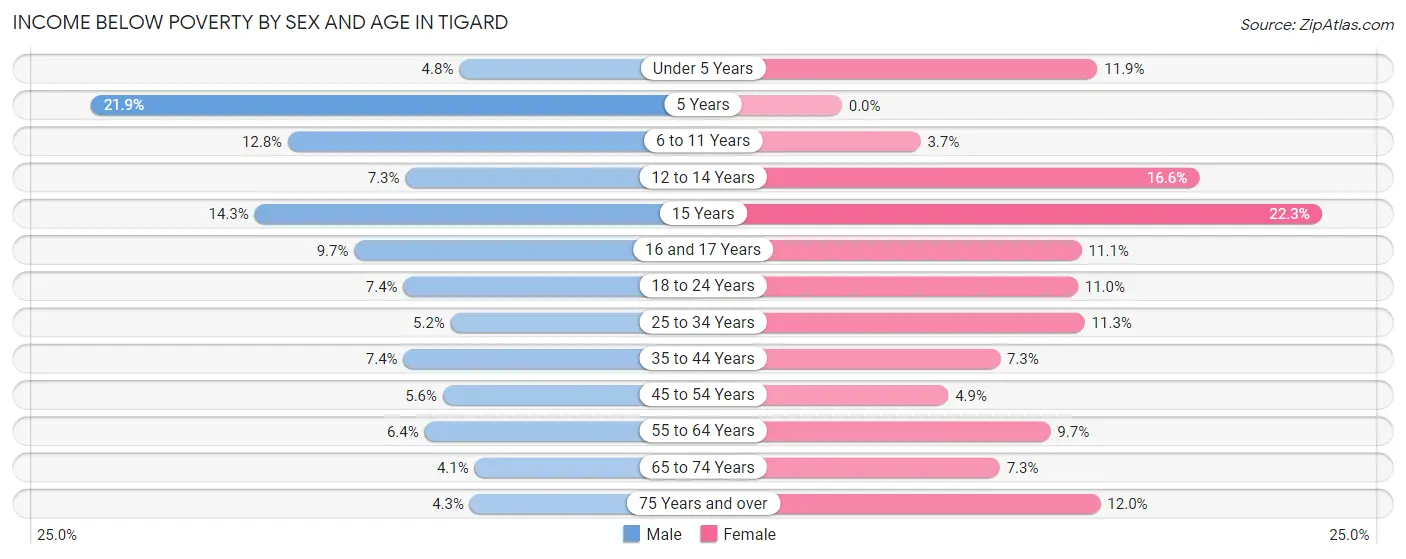
| Age Bracket | Male | Female |
| Under 5 Years | 108 (4.8%) | 130 (11.9%) |
| 5 Years | 82 (21.9%) | 0 (0.0%) |
| 6 to 11 Years | 213 (12.8%) | 54 (3.6%) |
| 12 to 14 Years | 83 (7.3%) | 125 (16.6%) |
| 15 Years | 43 (14.3%) | 75 (22.3%) |
| 16 and 17 Years | 65 (9.7%) | 69 (11.1%) |
| 18 to 24 Years | 143 (7.4%) | 191 (11.0%) |
| 25 to 34 Years | 229 (5.2%) | 493 (11.3%) |
| 35 to 44 Years | 316 (7.4%) | 325 (7.3%) |
| 45 to 54 Years | 209 (5.6%) | 173 (4.9%) |
| 55 to 64 Years | 216 (6.4%) | 315 (9.7%) |
| 65 to 74 Years | 107 (4.1%) | 230 (7.3%) |
| 75 Years and over | 56 (4.3%) | 232 (12.0%) |
| Total | 1,870 (6.7%) | 2,412 (8.9%) |
Income Above Poverty by Sex and Age in Tigard
According to the poverty statistics in Tigard, males aged 65 to 74 years and females aged 5 years are the age groups that are most secure financially, with 95.9% of males and 100.0% of females in these age groups living above the poverty line.
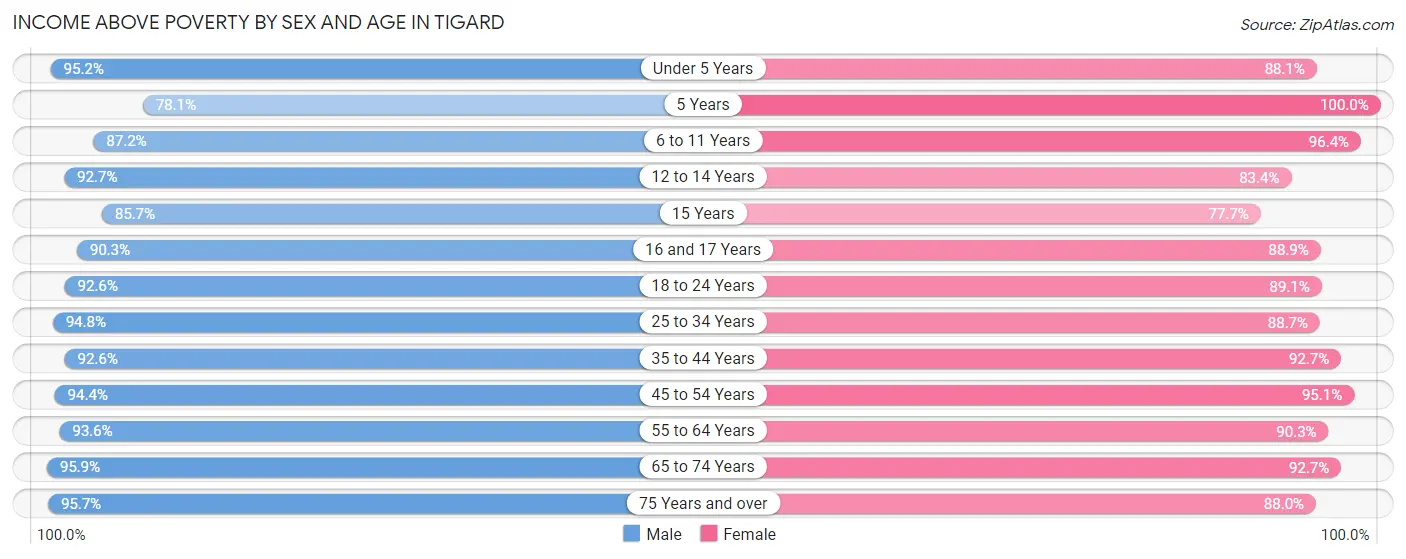
| Age Bracket | Male | Female |
| Under 5 Years | 2,128 (95.2%) | 966 (88.1%) |
| 5 Years | 292 (78.1%) | 311 (100.0%) |
| 6 to 11 Years | 1,454 (87.2%) | 1,427 (96.4%) |
| 12 to 14 Years | 1,049 (92.7%) | 629 (83.4%) |
| 15 Years | 257 (85.7%) | 262 (77.7%) |
| 16 and 17 Years | 605 (90.3%) | 551 (88.9%) |
| 18 to 24 Years | 1,784 (92.6%) | 1,554 (89.0%) |
| 25 to 34 Years | 4,146 (94.8%) | 3,881 (88.7%) |
| 35 to 44 Years | 3,940 (92.6%) | 4,103 (92.7%) |
| 45 to 54 Years | 3,530 (94.4%) | 3,326 (95.1%) |
| 55 to 64 Years | 3,139 (93.6%) | 2,940 (90.3%) |
| 65 to 74 Years | 2,492 (95.9%) | 2,908 (92.7%) |
| 75 Years and over | 1,234 (95.7%) | 1,702 (88.0%) |
| Total | 26,050 (93.3%) | 24,560 (91.1%) |
Income Below Poverty Among Married-Couple Families in Tigard
The poverty statistics for married-couple families in Tigard show that 2.4% or 279 of the total 11,657 families live below the poverty line. Families with 5 or more children have the highest poverty rate of 75.0%, comprising of 39 families. On the other hand, families with 3 or 4 children have the lowest poverty rate of 0.0%, which includes 0 families.
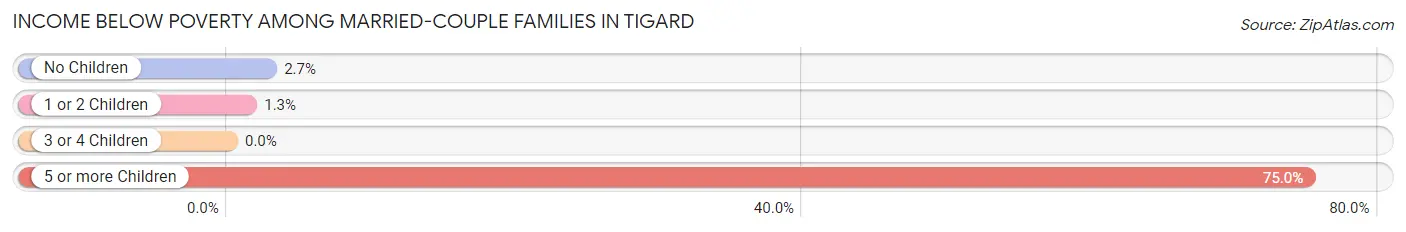
| Children | Above Poverty | Below Poverty |
| No Children | 6,479 (97.3%) | 182 (2.7%) |
| 1 or 2 Children | 4,272 (98.7%) | 58 (1.3%) |
| 3 or 4 Children | 614 (100.0%) | 0 (0.0%) |
| 5 or more Children | 13 (25.0%) | 39 (75.0%) |
| Total | 11,378 (97.6%) | 279 (2.4%) |
Income Below Poverty Among Single-Parent Households in Tigard
According to the poverty data in Tigard, 17.0% or 177 single-father households and 23.0% or 466 single-mother households are living below the poverty line. Among single-father households, those with 1 or 2 children have the highest poverty rate, with 166 households (27.0%) experiencing poverty. Likewise, among single-mother households, those with 1 or 2 children have the highest poverty rate, with 373 households (34.4%) falling below the poverty line.
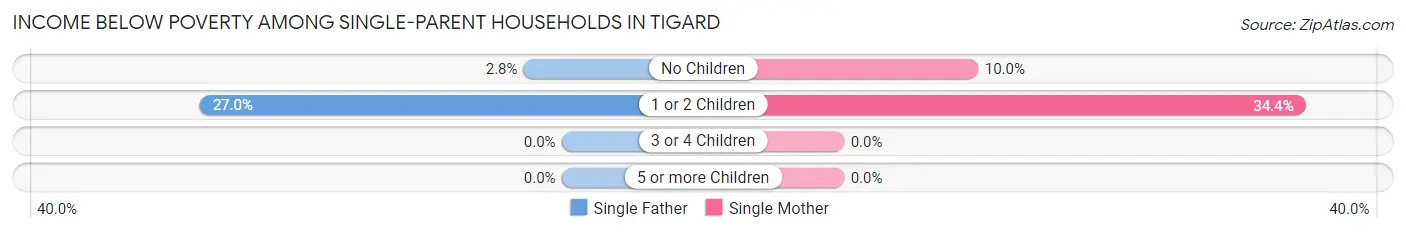
| Children | Single Father | Single Mother |
| No Children | 11 (2.8%) | 93 (10.0%) |
| 1 or 2 Children | 166 (27.0%) | 373 (34.4%) |
| 3 or 4 Children | 0 (0.0%) | 0 (0.0%) |
| 5 or more Children | 0 (0.0%) | 0 (0.0%) |
| Total | 177 (17.0%) | 466 (23.0%) |
Income Below Poverty Among Married-Couple vs Single-Parent Households in Tigard
The poverty data for Tigard shows that 279 of the married-couple family households (2.4%) and 643 of the single-parent households (21.0%) are living below the poverty level. Within the married-couple family households, those with 5 or more children have the highest poverty rate, with 39 households (75.0%) falling below the poverty line. Among the single-parent households, those with 1 or 2 children have the highest poverty rate, with 539 household (31.7%) living below poverty.
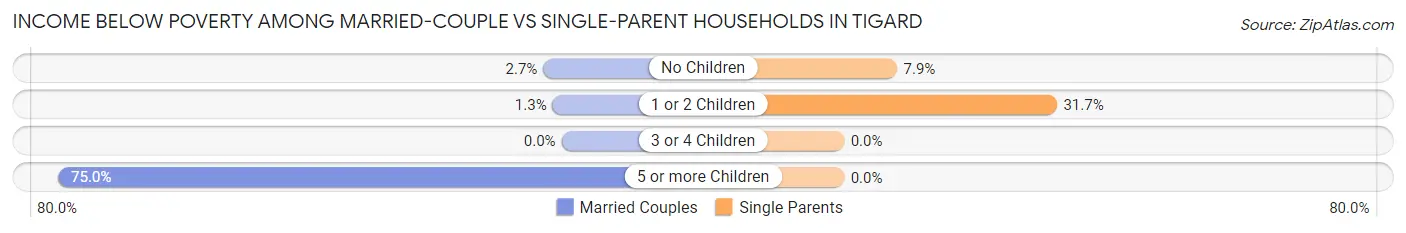
| Children | Married-Couple Families | Single-Parent Households |
| No Children | 182 (2.7%) | 104 (7.9%) |
| 1 or 2 Children | 58 (1.3%) | 539 (31.7%) |
| 3 or 4 Children | 0 (0.0%) | 0 (0.0%) |
| 5 or more Children | 39 (75.0%) | 0 (0.0%) |
| Total | 279 (2.4%) | 643 (21.0%) |
Employment Characteristics in Tigard
Employment by Class of Employer in Tigard
Among the 28,954 employed individuals in Tigard, private company employees (20,212 | 69.8%), not-for-profit organizations (2,704 | 9.3%), and self-employed (not incorporated) (1,632 | 5.6%) make up the most common classes of employment.
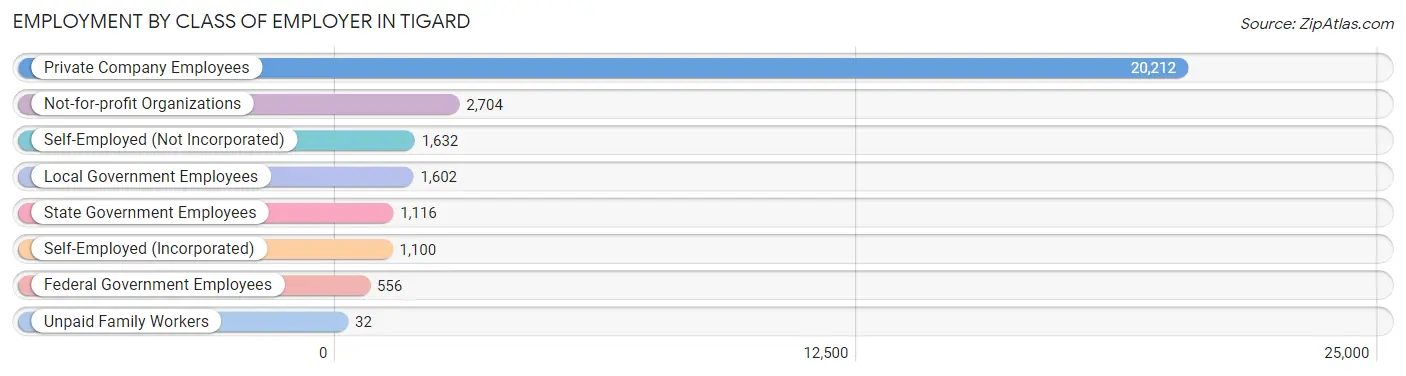
| Employer Class | # Employees | % Employees |
| Private Company Employees | 20,212 | 69.8% |
| Self-Employed (Incorporated) | 1,100 | 3.8% |
| Self-Employed (Not Incorporated) | 1,632 | 5.6% |
| Not-for-profit Organizations | 2,704 | 9.3% |
| Local Government Employees | 1,602 | 5.5% |
| State Government Employees | 1,116 | 3.8% |
| Federal Government Employees | 556 | 1.9% |
| Unpaid Family Workers | 32 | 0.1% |
| Total | 28,954 | 100.0% |
Employment Status by Age in Tigard
According to the labor force statistics for Tigard, out of the total population over 16 years of age (45,314), 68.4% or 30,995 individuals are in the labor force, with 5.1% or 1,581 of them unemployed. The age group with the highest labor force participation rate is 25 to 29 years, with 90.7% or 3,952 individuals in the labor force. Within the labor force, the 65 to 74 years age range has the highest percentage of unemployed individuals, with 13.7% or 218 of them being unemployed.
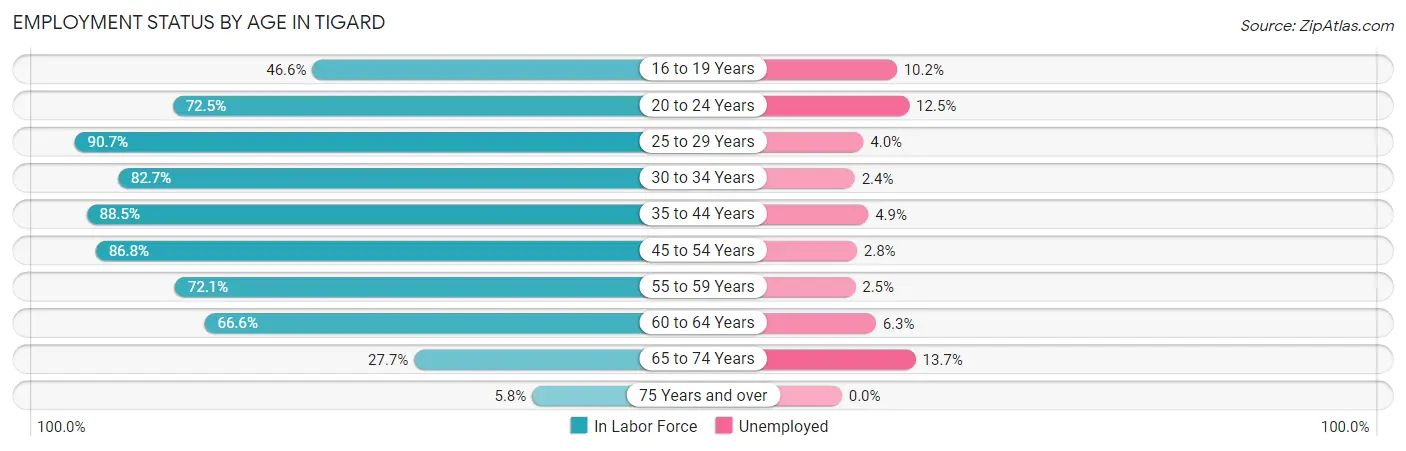
| Age Bracket | In Labor Force | Unemployed |
| 16 to 19 Years | 1,014 (46.6%) | 103 (10.2%) |
| 20 to 24 Years | 2,021 (72.5%) | 253 (12.5%) |
| 25 to 29 Years | 3,952 (90.7%) | 158 (4.0%) |
| 30 to 34 Years | 3,632 (82.7%) | 87 (2.4%) |
| 35 to 44 Years | 7,685 (88.5%) | 377 (4.9%) |
| 45 to 54 Years | 6,301 (86.8%) | 176 (2.8%) |
| 55 to 59 Years | 2,399 (72.1%) | 60 (2.5%) |
| 60 to 64 Years | 2,195 (66.6%) | 138 (6.3%) |
| 65 to 74 Years | 1,594 (27.7%) | 218 (13.7%) |
| 75 Years and over | 190 (5.8%) | 0 (0.0%) |
| Total | 30,995 (68.4%) | 1,581 (5.1%) |
Employment Status by Educational Attainment in Tigard
According to labor force statistics for Tigard, 83.5% of individuals (26,149) out of the total population between 25 and 64 years of age (31,316) are in the labor force, with 3.8% or 994 of them being unemployed. The group with the highest labor force participation rate are those with the educational attainment of bachelor's degree or higher, with 87.7% or 13,604 individuals in the labor force. Within the labor force, individuals with less than high school education have the highest percentage of unemployment, with 9.2% or 97 of them being unemployed.
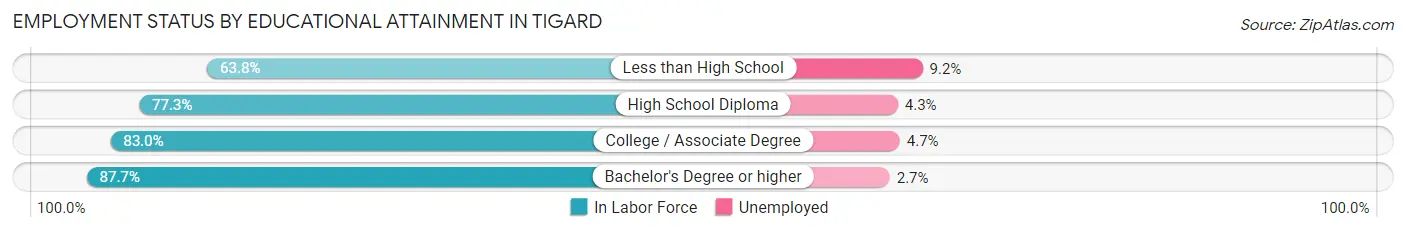
| Educational Attainment | In Labor Force | Unemployed |
| Less than High School | 1,049 (63.8%) | 151 (9.2%) |
| High School Diploma | 3,231 (77.3%) | 180 (4.3%) |
| College / Associate Degree | 8,283 (83.0%) | 469 (4.7%) |
| Bachelor's Degree or higher | 13,604 (87.7%) | 419 (2.7%) |
| Total | 26,149 (83.5%) | 1,190 (3.8%) |
Employment Occupations by Sex in Tigard
Management, Business, Science and Arts Occupations
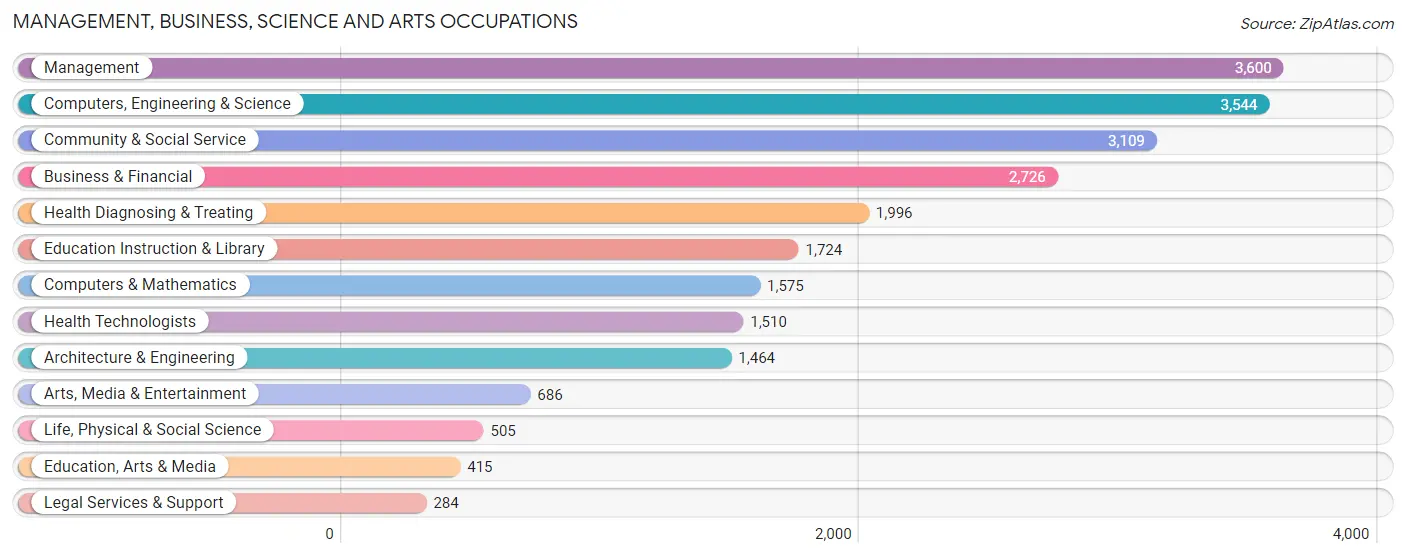
The most common Management, Business, Science and Arts occupations in Tigard are Management (3,600 | 12.2%), Computers, Engineering & Science (3,544 | 12.1%), Community & Social Service (3,109 | 10.6%), Business & Financial (2,726 | 9.3%), and Health Diagnosing & Treating (1,996 | 6.8%).
Management, Business, Science and Arts Occupations by Sex
Within the Management, Business, Science and Arts occupations in Tigard, the most male-oriented occupations are Architecture & Engineering (89.8%), Computers & Mathematics (74.7%), and Computers, Engineering & Science (73.5%), while the most female-oriented occupations are Education Instruction & Library (83.5%), Life, Physical & Social Science (77.4%), and Health Technologists (73.1%).
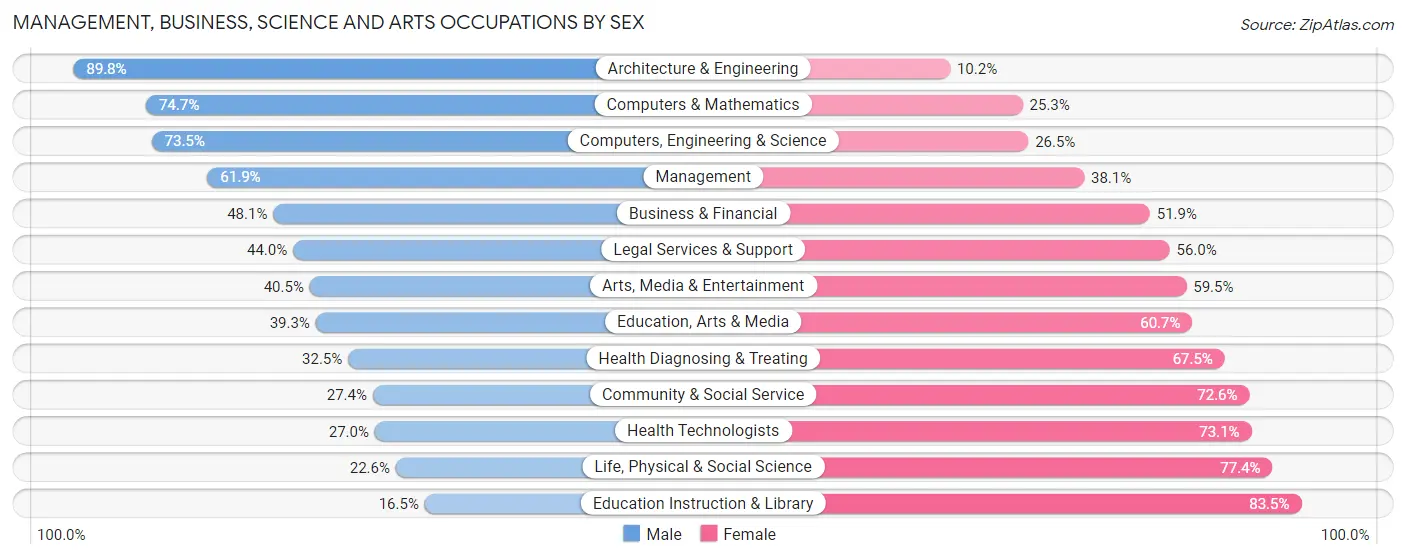
| Occupation | Male | Female |
| Management | 2,227 (61.9%) | 1,373 (38.1%) |
| Business & Financial | 1,312 (48.1%) | 1,414 (51.9%) |
| Computers, Engineering & Science | 2,605 (73.5%) | 939 (26.5%) |
| Computers & Mathematics | 1,176 (74.7%) | 399 (25.3%) |
| Architecture & Engineering | 1,315 (89.8%) | 149 (10.2%) |
| Life, Physical & Social Science | 114 (22.6%) | 391 (77.4%) |
| Community & Social Service | 851 (27.4%) | 2,258 (72.6%) |
| Education, Arts & Media | 163 (39.3%) | 252 (60.7%) |
| Legal Services & Support | 125 (44.0%) | 159 (56.0%) |
| Education Instruction & Library | 285 (16.5%) | 1,439 (83.5%) |
| Arts, Media & Entertainment | 278 (40.5%) | 408 (59.5%) |
| Health Diagnosing & Treating | 649 (32.5%) | 1,347 (67.5%) |
| Health Technologists | 407 (27.0%) | 1,103 (73.1%) |
| Total (Category) | 7,644 (51.0%) | 7,331 (48.9%) |
| Total (Overall) | 15,446 (52.6%) | 13,932 (47.4%) |
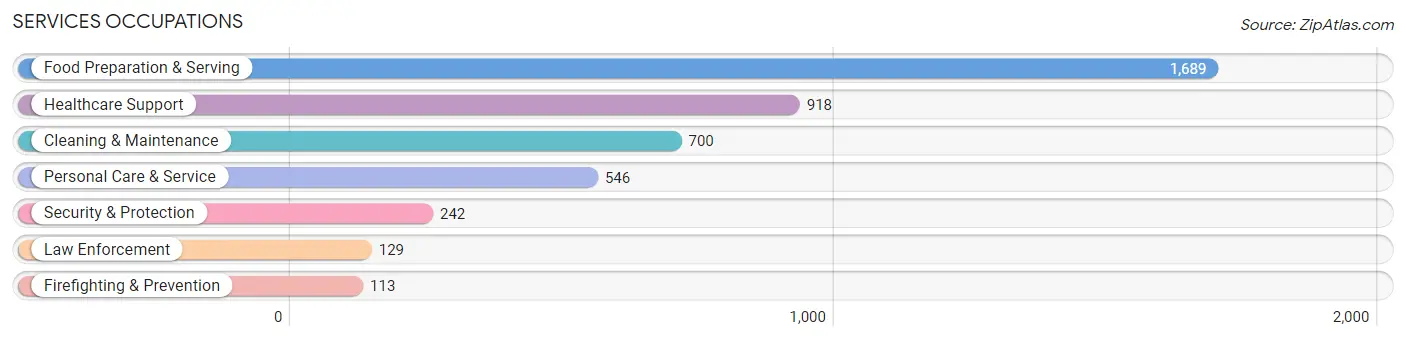
Services Occupations
The most common Services occupations in Tigard are Food Preparation & Serving (1,689 | 5.8%), Healthcare Support (918 | 3.1%), Cleaning & Maintenance (700 | 2.4%), Personal Care & Service (546 | 1.9%), and Security & Protection (242 | 0.8%).
Services Occupations by Sex
Within the Services occupations in Tigard, the most male-oriented occupations are Firefighting & Prevention (87.6%), Security & Protection (80.6%), and Law Enforcement (74.4%), while the most female-oriented occupations are Healthcare Support (88.1%), Personal Care & Service (65.7%), and Food Preparation & Serving (54.6%).
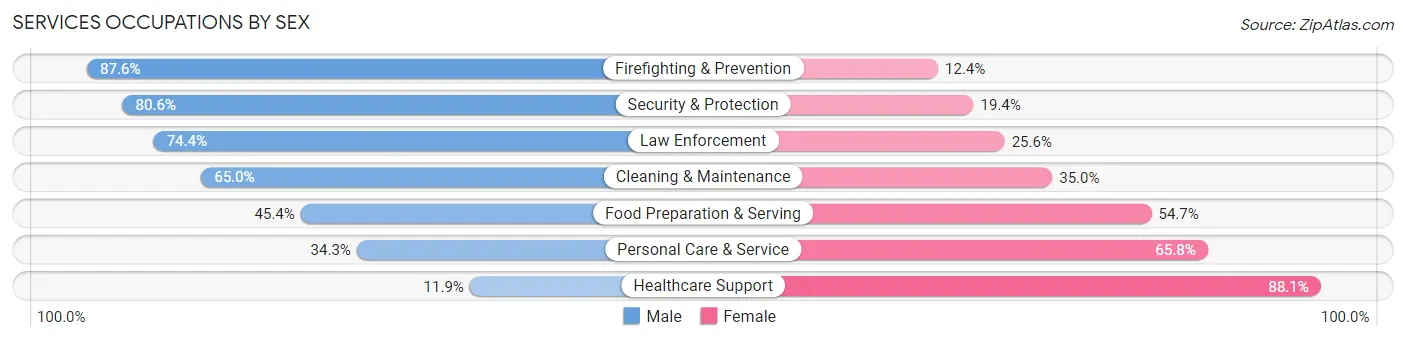
| Occupation | Male | Female |
| Healthcare Support | 109 (11.9%) | 809 (88.1%) |
| Security & Protection | 195 (80.6%) | 47 (19.4%) |
| Firefighting & Prevention | 99 (87.6%) | 14 (12.4%) |
| Law Enforcement | 96 (74.4%) | 33 (25.6%) |
| Food Preparation & Serving | 766 (45.4%) | 923 (54.6%) |
| Cleaning & Maintenance | 455 (65.0%) | 245 (35.0%) |
| Personal Care & Service | 187 (34.3%) | 359 (65.7%) |
| Total (Category) | 1,712 (41.8%) | 2,383 (58.2%) |
| Total (Overall) | 15,446 (52.6%) | 13,932 (47.4%) |
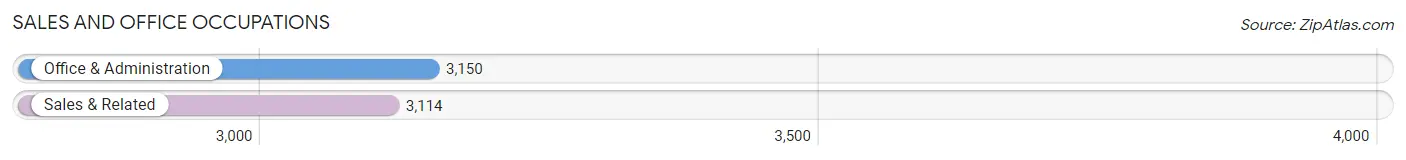
Sales and Office Occupations
The most common Sales and Office occupations in Tigard are Office & Administration (3,150 | 10.7%), and Sales & Related (3,114 | 10.6%).
Sales and Office Occupations by Sex
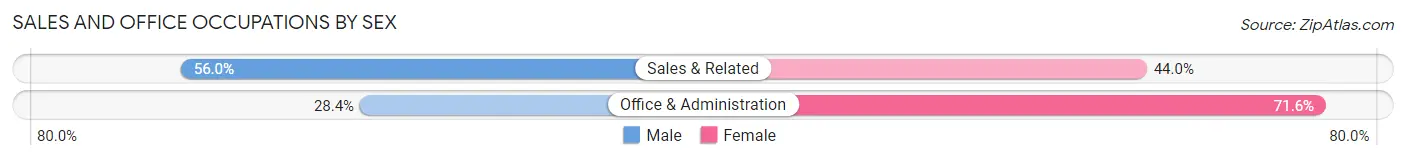
| Occupation | Male | Female |
| Sales & Related | 1,743 (56.0%) | 1,371 (44.0%) |
| Office & Administration | 895 (28.4%) | 2,255 (71.6%) |
| Total (Category) | 2,638 (42.1%) | 3,626 (57.9%) |
| Total (Overall) | 15,446 (52.6%) | 13,932 (47.4%) |
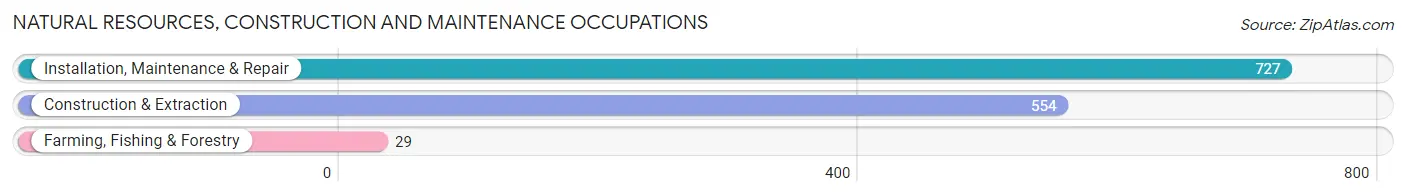
Natural Resources, Construction and Maintenance Occupations
The most common Natural Resources, Construction and Maintenance occupations in Tigard are Installation, Maintenance & Repair (727 | 2.5%), Construction & Extraction (554 | 1.9%), and Farming, Fishing & Forestry (29 | 0.1%).
Natural Resources, Construction and Maintenance Occupations by Sex
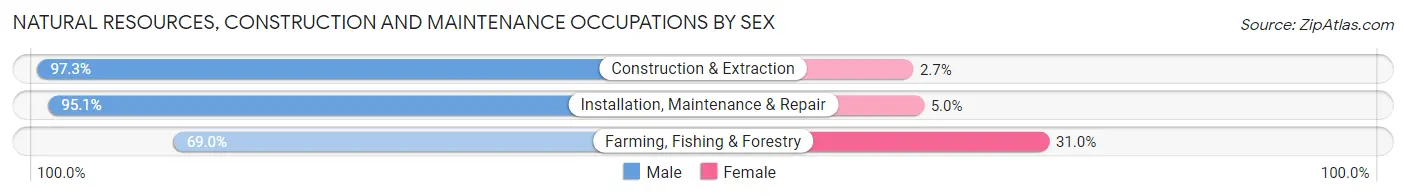
| Occupation | Male | Female |
| Farming, Fishing & Forestry | 20 (69.0%) | 9 (31.0%) |
| Construction & Extraction | 539 (97.3%) | 15 (2.7%) |
| Installation, Maintenance & Repair | 691 (95.1%) | 36 (5.0%) |
| Total (Category) | 1,250 (95.4%) | 60 (4.6%) |
| Total (Overall) | 15,446 (52.6%) | 13,932 (47.4%) |
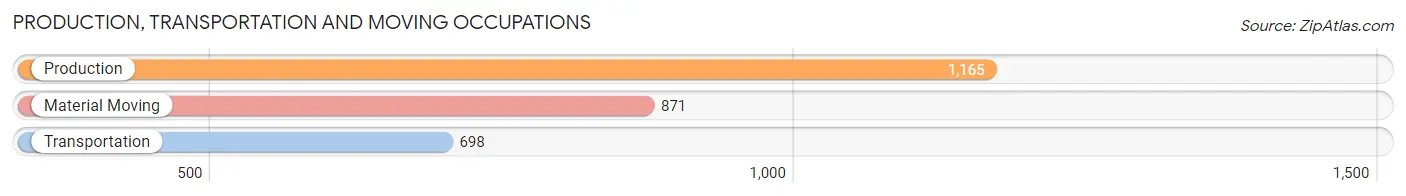
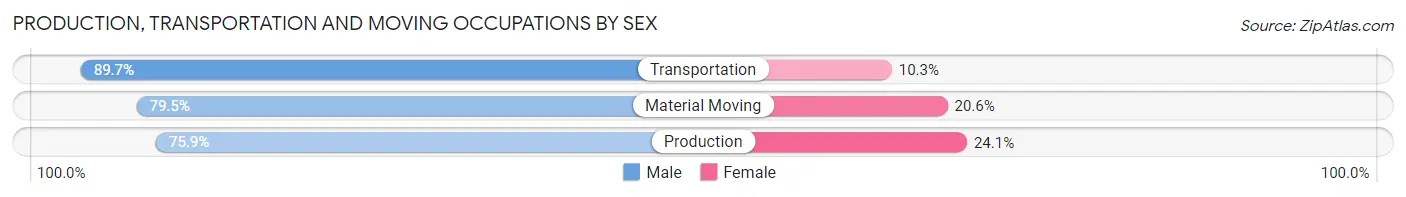
Production, Transportation and Moving Occupations
The most common Production, Transportation and Moving occupations in Tigard are Production (1,165 | 4.0%), Material Moving (871 | 3.0%), and Transportation (698 | 2.4%).
Production, Transportation and Moving Occupations by Sex
| Occupation | Male | Female |
| Production | 884 (75.9%) | 281 (24.1%) |
| Transportation | 626 (89.7%) | 72 (10.3%) |
| Material Moving | 692 (79.4%) | 179 (20.5%) |
| Total (Category) | 2,202 (80.5%) | 532 (19.5%) |
| Total (Overall) | 15,446 (52.6%) | 13,932 (47.4%) |
Employment Industries by Sex in Tigard
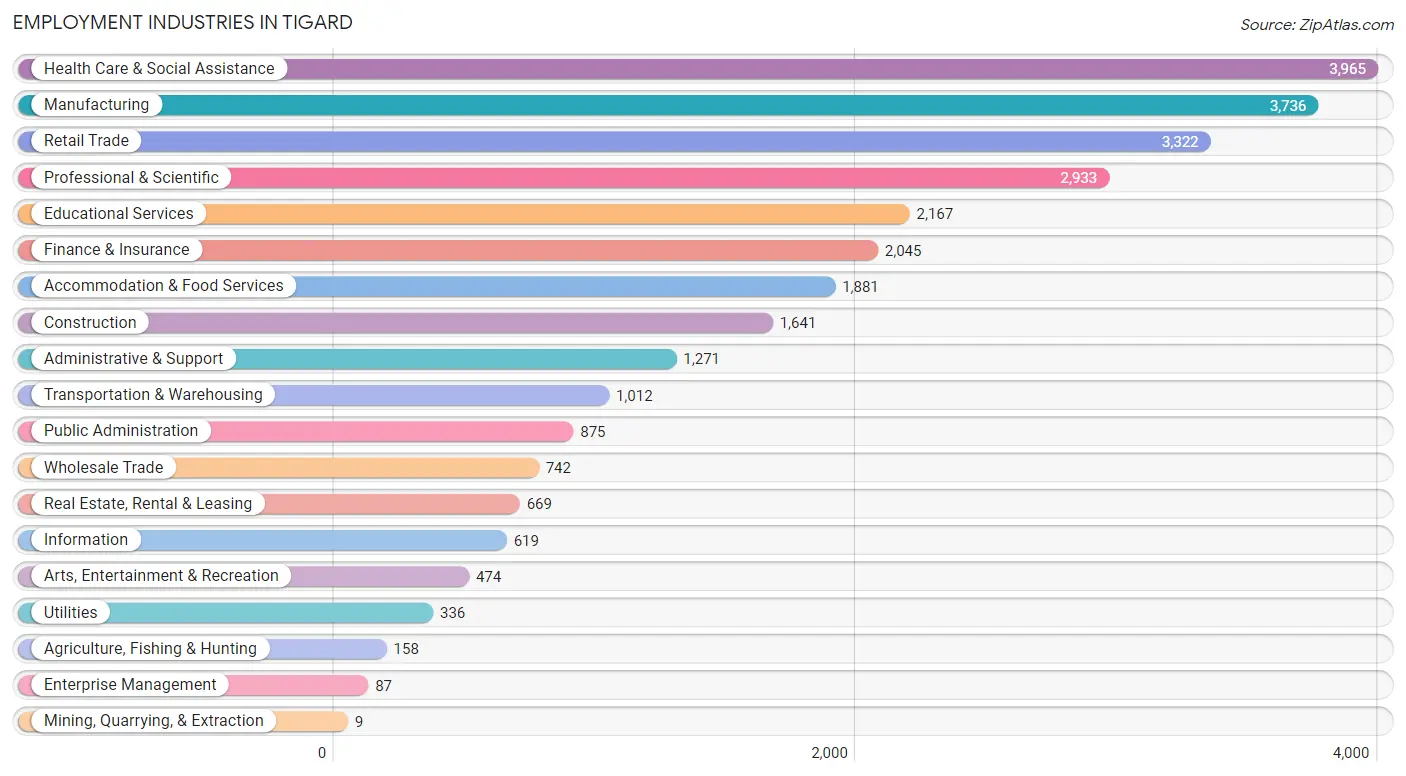
Employment Industries in Tigard
The major employment industries in Tigard include Health Care & Social Assistance (3,965 | 13.5%), Manufacturing (3,736 | 12.7%), Retail Trade (3,322 | 11.3%), Professional & Scientific (2,933 | 10.0%), and Educational Services (2,167 | 7.4%).
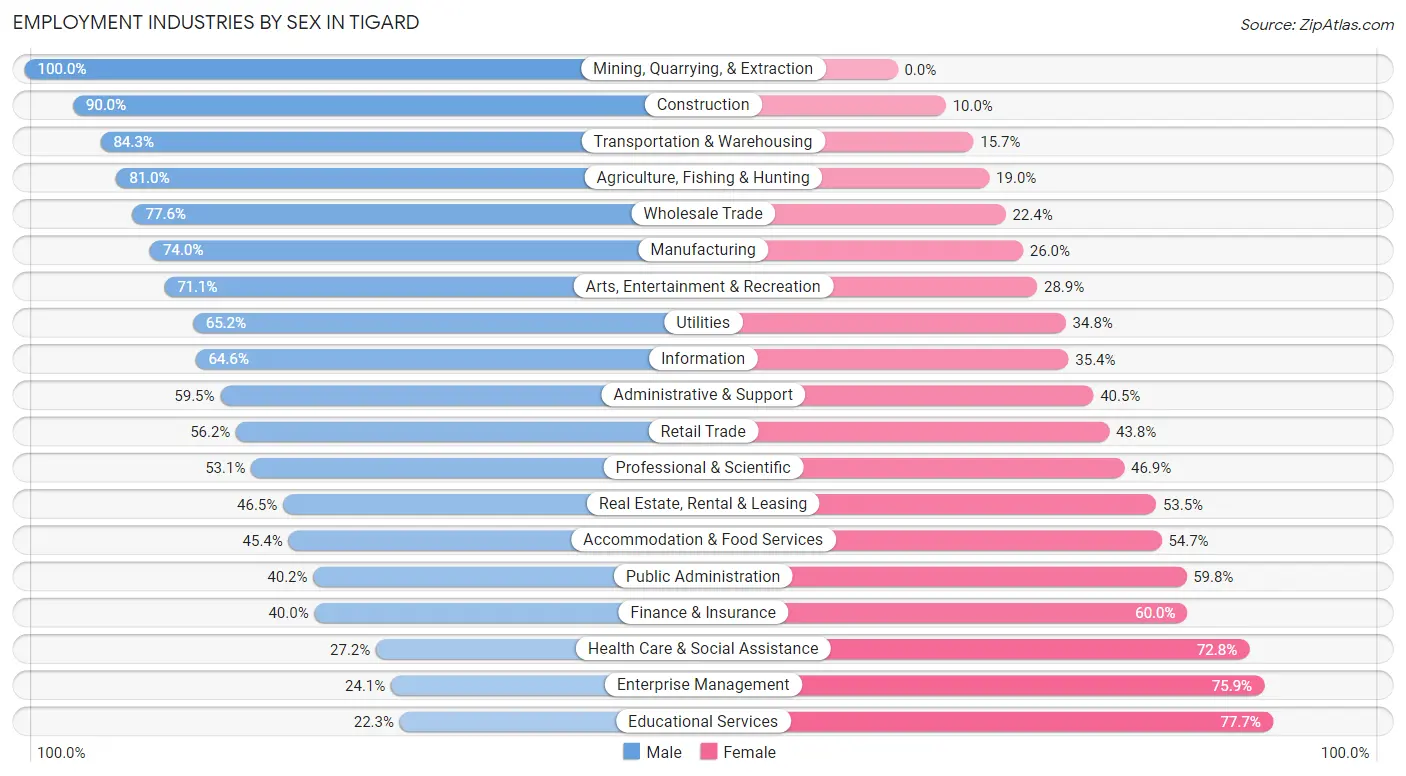
Employment Industries by Sex in Tigard
The Tigard industries that see more men than women are Mining, Quarrying, & Extraction (100.0%), Construction (90.0%), and Transportation & Warehousing (84.3%), whereas the industries that tend to have a higher number of women are Educational Services (77.7%), Enterprise Management (75.9%), and Health Care & Social Assistance (72.8%).
| Industry | Male | Female |
| Agriculture, Fishing & Hunting | 128 (81.0%) | 30 (19.0%) |
| Mining, Quarrying, & Extraction | 9 (100.0%) | 0 (0.0%) |
| Construction | 1,477 (90.0%) | 164 (10.0%) |
| Manufacturing | 2,766 (74.0%) | 970 (26.0%) |
| Wholesale Trade | 576 (77.6%) | 166 (22.4%) |
| Retail Trade | 1,867 (56.2%) | 1,455 (43.8%) |
| Transportation & Warehousing | 853 (84.3%) | 159 (15.7%) |
| Utilities | 219 (65.2%) | 117 (34.8%) |
| Information | 400 (64.6%) | 219 (35.4%) |
| Finance & Insurance | 818 (40.0%) | 1,227 (60.0%) |
| Real Estate, Rental & Leasing | 311 (46.5%) | 358 (53.5%) |
| Professional & Scientific | 1,557 (53.1%) | 1,376 (46.9%) |
| Enterprise Management | 21 (24.1%) | 66 (75.9%) |
| Administrative & Support | 756 (59.5%) | 515 (40.5%) |
| Educational Services | 484 (22.3%) | 1,683 (77.7%) |
| Health Care & Social Assistance | 1,080 (27.2%) | 2,885 (72.8%) |
| Arts, Entertainment & Recreation | 337 (71.1%) | 137 (28.9%) |
| Accommodation & Food Services | 853 (45.4%) | 1,028 (54.6%) |
| Public Administration | 352 (40.2%) | 523 (59.8%) |
| Total | 15,446 (52.6%) | 13,932 (47.4%) |
Education in Tigard
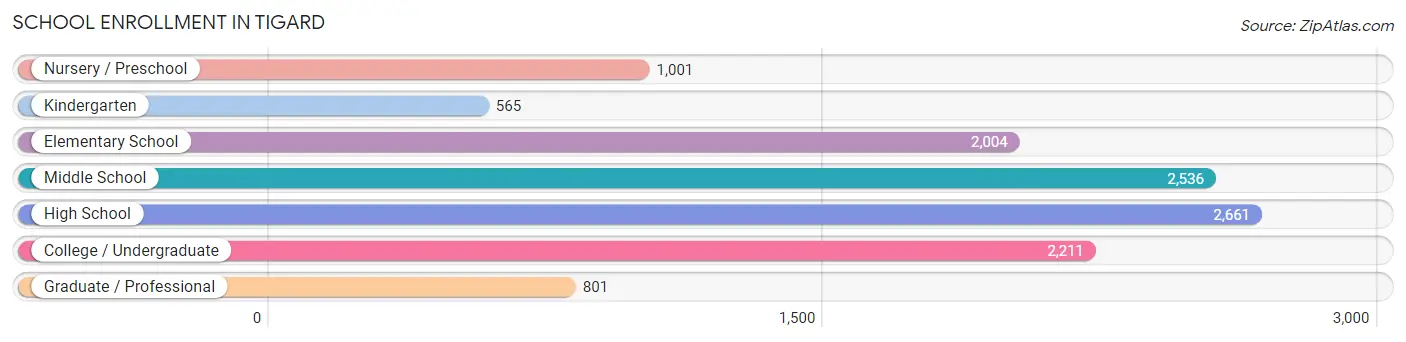
School Enrollment in Tigard
The most common levels of schooling among the 11,779 students in Tigard are high school (2,661 | 22.6%), middle school (2,536 | 21.5%), and college / undergraduate (2,211 | 18.8%).
| School Level | # Students | % Students |
| Nursery / Preschool | 1,001 | 8.5% |
| Kindergarten | 565 | 4.8% |
| Elementary School | 2,004 | 17.0% |
| Middle School | 2,536 | 21.5% |
| High School | 2,661 | 22.6% |
| College / Undergraduate | 2,211 | 18.8% |
| Graduate / Professional | 801 | 6.8% |
| Total | 11,779 | 100.0% |
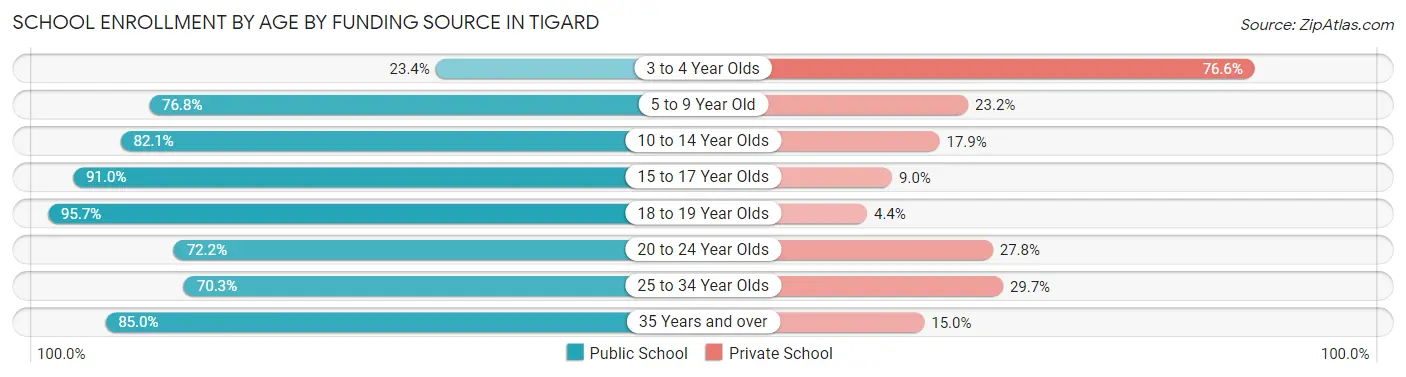
School Enrollment by Age by Funding Source in Tigard
Out of a total of 11,779 students who are enrolled in schools in Tigard, 2,580 (21.9%) attend a private institution, while the remaining 9,199 (78.1%) are enrolled in public schools. The age group of 3 to 4 year olds has the highest likelihood of being enrolled in private schools, with 552 (76.6% in the age bracket) enrolled. Conversely, the age group of 18 to 19 year olds has the lowest likelihood of being enrolled in a private school, with 593 (95.7% in the age bracket) attending a public institution.
| Age Bracket | Public School | Private School |
| 3 to 4 Year Olds | 169 (23.4%) | 552 (76.6%) |
| 5 to 9 Year Old | 1,914 (76.8%) | 578 (23.2%) |
| 10 to 14 Year Olds | 2,599 (82.1%) | 565 (17.9%) |
| 15 to 17 Year Olds | 1,755 (91.0%) | 174 (9.0%) |
| 18 to 19 Year Olds | 593 (95.7%) | 27 (4.3%) |
| 20 to 24 Year Olds | 624 (72.2%) | 240 (27.8%) |
| 25 to 34 Year Olds | 692 (70.3%) | 292 (29.7%) |
| 35 Years and over | 854 (85.0%) | 151 (15.0%) |
| Total | 9,199 (78.1%) | 2,580 (21.9%) |
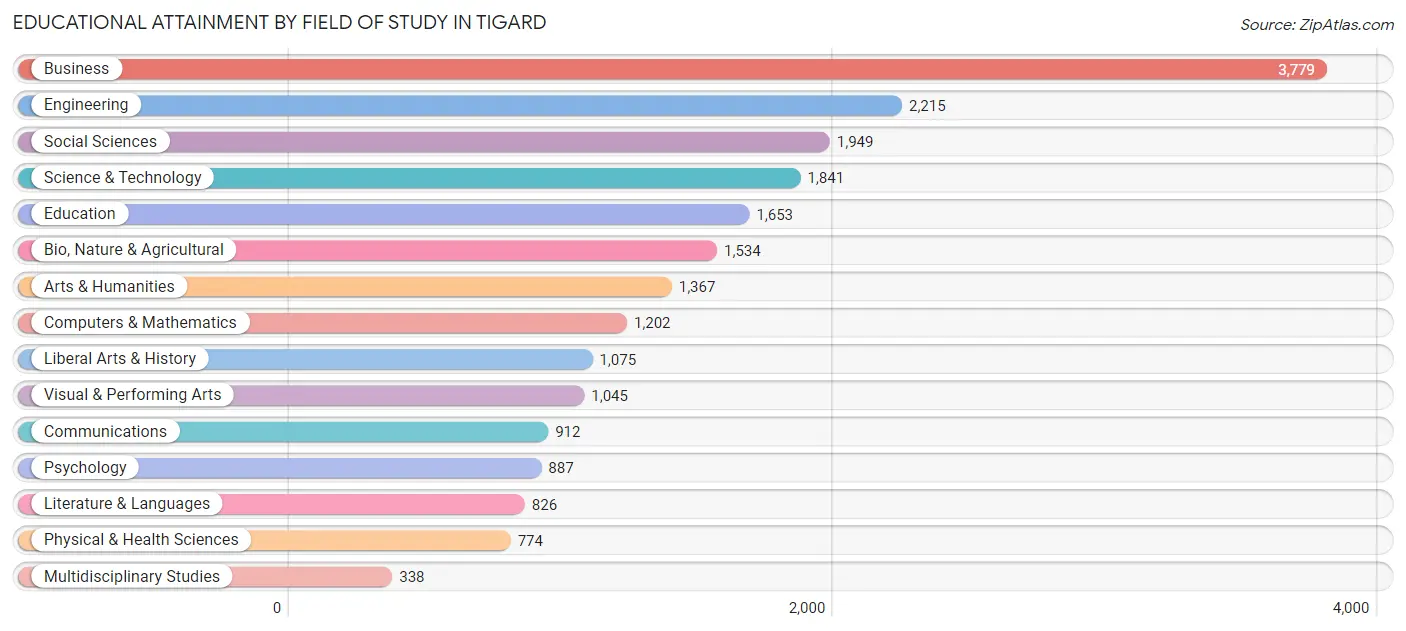
Educational Attainment by Field of Study in Tigard
Business (3,779 | 17.7%), engineering (2,215 | 10.3%), social sciences (1,949 | 9.1%), science & technology (1,841 | 8.6%), and education (1,653 | 7.7%) are the most common fields of study among 21,397 individuals in Tigard who have obtained a bachelor's degree or higher.
| Field of Study | # Graduates | % Graduates |
| Computers & Mathematics | 1,202 | 5.6% |
| Bio, Nature & Agricultural | 1,534 | 7.2% |
| Physical & Health Sciences | 774 | 3.6% |
| Psychology | 887 | 4.2% |
| Social Sciences | 1,949 | 9.1% |
| Engineering | 2,215 | 10.3% |
| Multidisciplinary Studies | 338 | 1.6% |
| Science & Technology | 1,841 | 8.6% |
| Business | 3,779 | 17.7% |
| Education | 1,653 | 7.7% |
| Literature & Languages | 826 | 3.9% |
| Liberal Arts & History | 1,075 | 5.0% |
| Visual & Performing Arts | 1,045 | 4.9% |
| Communications | 912 | 4.3% |
| Arts & Humanities | 1,367 | 6.4% |
| Total | 21,397 | 100.0% |
Transportation & Commute in Tigard
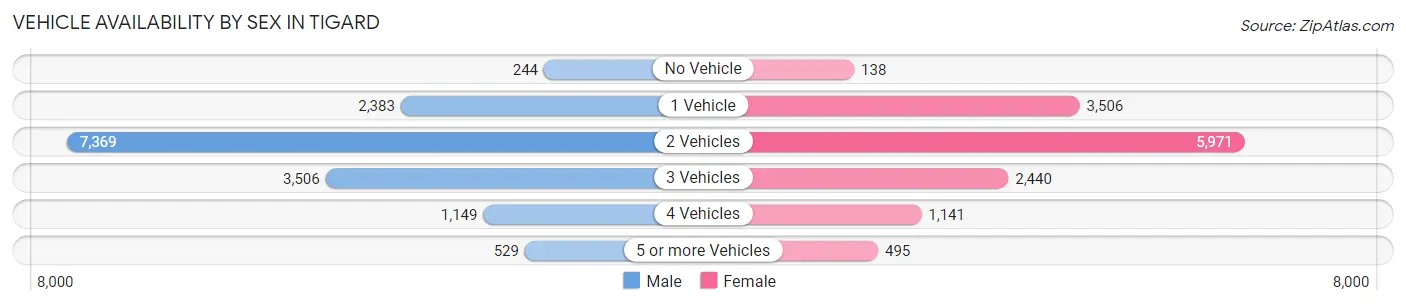
Vehicle Availability by Sex in Tigard
The most prevalent vehicle ownership categories in Tigard are males with 2 vehicles (7,369, accounting for 48.5%) and females with 2 vehicles (5,971, making up 53.8%).
| Vehicles Available | Male | Female |
| No Vehicle | 244 (1.6%) | 138 (1.0%) |
| 1 Vehicle | 2,383 (15.7%) | 3,506 (25.6%) |
| 2 Vehicles | 7,369 (48.5%) | 5,971 (43.6%) |
| 3 Vehicles | 3,506 (23.1%) | 2,440 (17.8%) |
| 4 Vehicles | 1,149 (7.6%) | 1,141 (8.3%) |
| 5 or more Vehicles | 529 (3.5%) | 495 (3.6%) |
| Total | 15,180 (100.0%) | 13,691 (100.0%) |
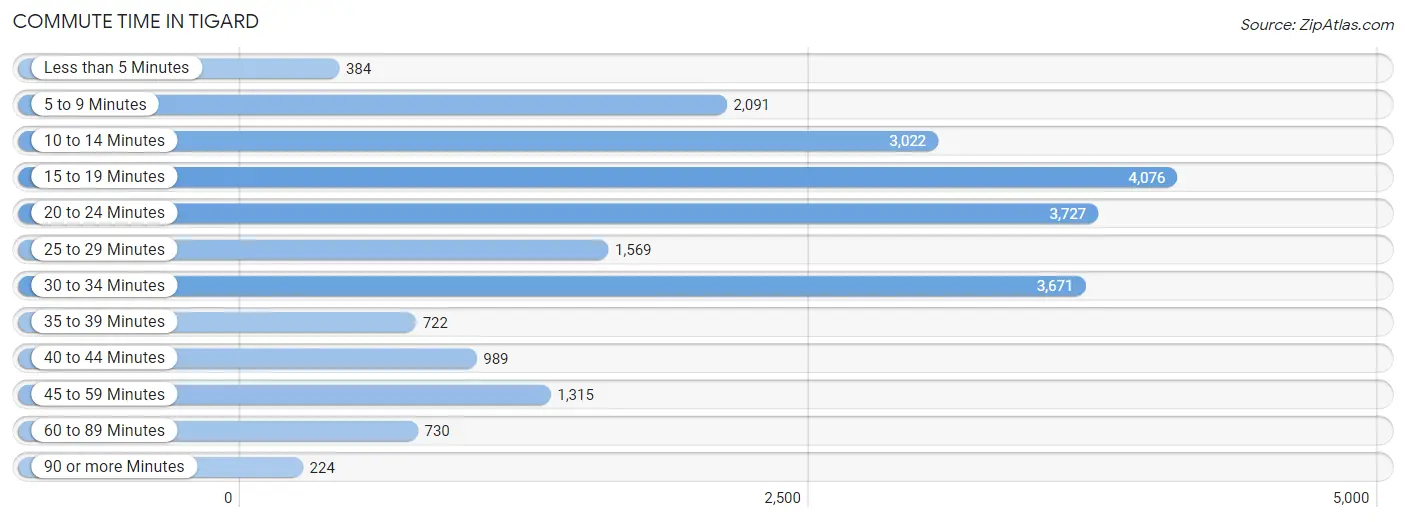
Commute Time in Tigard
The most frequently occuring commute durations in Tigard are 15 to 19 minutes (4,076 commuters, 18.1%), 20 to 24 minutes (3,727 commuters, 16.6%), and 30 to 34 minutes (3,671 commuters, 16.3%).
| Commute Time | # Commuters | % Commuters |
| Less than 5 Minutes | 384 | 1.7% |
| 5 to 9 Minutes | 2,091 | 9.3% |
| 10 to 14 Minutes | 3,022 | 13.4% |
| 15 to 19 Minutes | 4,076 | 18.1% |
| 20 to 24 Minutes | 3,727 | 16.6% |
| 25 to 29 Minutes | 1,569 | 7.0% |
| 30 to 34 Minutes | 3,671 | 16.3% |
| 35 to 39 Minutes | 722 | 3.2% |
| 40 to 44 Minutes | 989 | 4.4% |
| 45 to 59 Minutes | 1,315 | 5.8% |
| 60 to 89 Minutes | 730 | 3.2% |
| 90 or more Minutes | 224 | 1.0% |
Commute Time by Sex in Tigard
The most common commute times in Tigard are 30 to 34 minutes (2,239 commuters, 18.5%) for males and 15 to 19 minutes (1,968 commuters, 18.8%) for females.
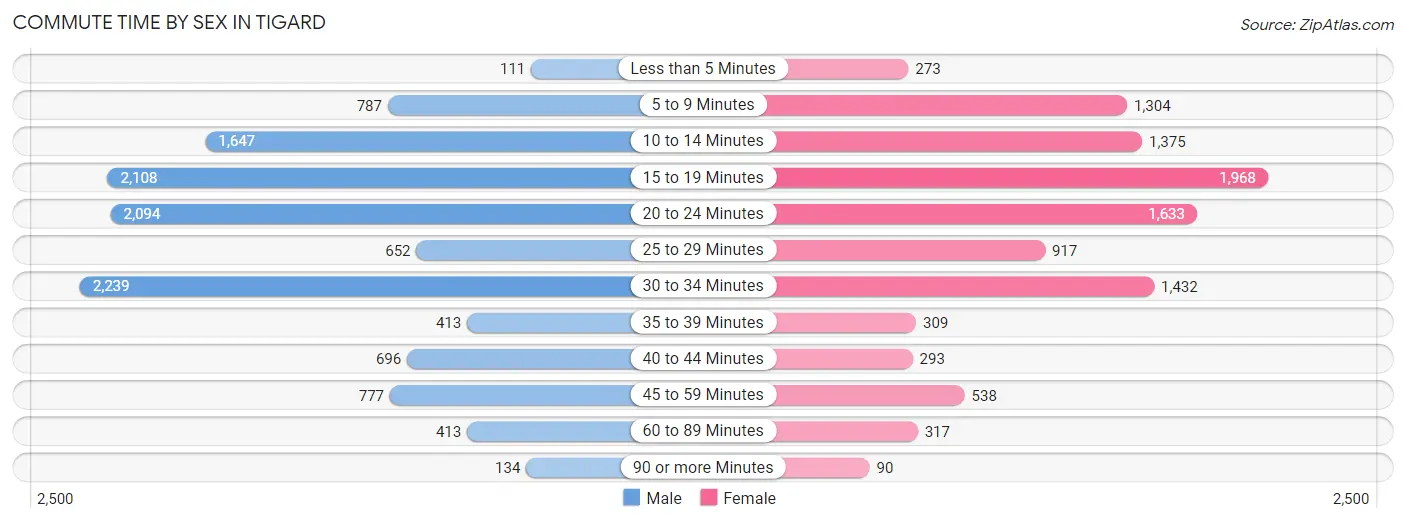
| Commute Time | Male | Female |
| Less than 5 Minutes | 111 (0.9%) | 273 (2.6%) |
| 5 to 9 Minutes | 787 (6.5%) | 1,304 (12.5%) |
| 10 to 14 Minutes | 1,647 (13.6%) | 1,375 (13.2%) |
| 15 to 19 Minutes | 2,108 (17.5%) | 1,968 (18.8%) |
| 20 to 24 Minutes | 2,094 (17.3%) | 1,633 (15.6%) |
| 25 to 29 Minutes | 652 (5.4%) | 917 (8.8%) |
| 30 to 34 Minutes | 2,239 (18.5%) | 1,432 (13.7%) |
| 35 to 39 Minutes | 413 (3.4%) | 309 (3.0%) |
| 40 to 44 Minutes | 696 (5.8%) | 293 (2.8%) |
| 45 to 59 Minutes | 777 (6.4%) | 538 (5.1%) |
| 60 to 89 Minutes | 413 (3.4%) | 317 (3.0%) |
| 90 or more Minutes | 134 (1.1%) | 90 (0.9%) |
Time of Departure to Work by Sex in Tigard
The most frequent times of departure to work in Tigard are 7:00 AM to 7:29 AM (2,014, 16.7%) for males and 7:30 AM to 7:59 AM (1,547, 14.8%) for females.
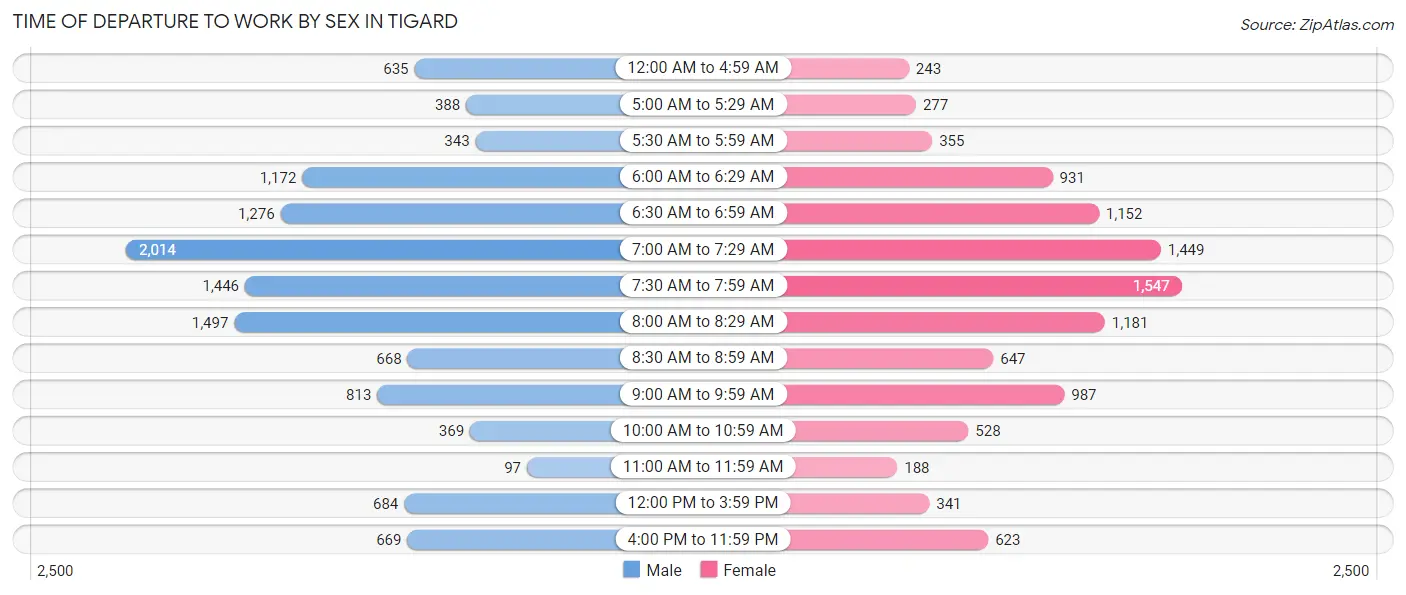
| Time of Departure | Male | Female |
| 12:00 AM to 4:59 AM | 635 (5.3%) | 243 (2.3%) |
| 5:00 AM to 5:29 AM | 388 (3.2%) | 277 (2.6%) |
| 5:30 AM to 5:59 AM | 343 (2.8%) | 355 (3.4%) |
| 6:00 AM to 6:29 AM | 1,172 (9.7%) | 931 (8.9%) |
| 6:30 AM to 6:59 AM | 1,276 (10.6%) | 1,152 (11.0%) |
| 7:00 AM to 7:29 AM | 2,014 (16.7%) | 1,449 (13.9%) |
| 7:30 AM to 7:59 AM | 1,446 (12.0%) | 1,547 (14.8%) |
| 8:00 AM to 8:29 AM | 1,497 (12.4%) | 1,181 (11.3%) |
| 8:30 AM to 8:59 AM | 668 (5.5%) | 647 (6.2%) |
| 9:00 AM to 9:59 AM | 813 (6.7%) | 987 (9.5%) |
| 10:00 AM to 10:59 AM | 369 (3.1%) | 528 (5.1%) |
| 11:00 AM to 11:59 AM | 97 (0.8%) | 188 (1.8%) |
| 12:00 PM to 3:59 PM | 684 (5.7%) | 341 (3.3%) |
| 4:00 PM to 11:59 PM | 669 (5.5%) | 623 (6.0%) |
| Total | 12,071 (100.0%) | 10,449 (100.0%) |
Housing Occupancy in Tigard
Occupancy by Ownership in Tigard
Of the total 22,454 dwellings in Tigard, owner-occupied units account for 13,957 (62.2%), while renter-occupied units make up 8,497 (37.8%).
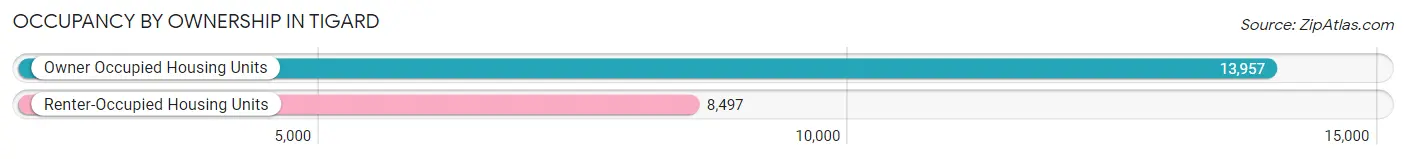
| Occupancy | # Housing Units | % Housing Units |
| Owner Occupied Housing Units | 13,957 | 62.2% |
| Renter-Occupied Housing Units | 8,497 | 37.8% |
| Total Occupied Housing Units | 22,454 | 100.0% |
Occupancy by Household Size in Tigard
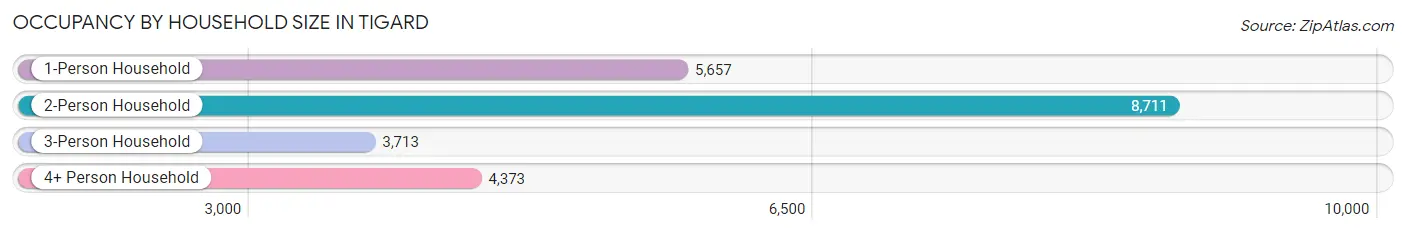
| Household Size | # Housing Units | % Housing Units |
| 1-Person Household | 5,657 | 25.2% |
| 2-Person Household | 8,711 | 38.8% |
| 3-Person Household | 3,713 | 16.5% |
| 4+ Person Household | 4,373 | 19.5% |
| Total Housing Units | 22,454 | 100.0% |
Occupancy by Ownership by Household Size in Tigard

| Household Size | Owner-occupied | Renter-occupied |
| 1-Person Household | 2,368 (41.9%) | 3,289 (58.1%) |
| 2-Person Household | 5,663 (65.0%) | 3,048 (35.0%) |
| 3-Person Household | 2,656 (71.5%) | 1,057 (28.5%) |
| 4+ Person Household | 3,270 (74.8%) | 1,103 (25.2%) |
| Total Housing Units | 13,957 (62.2%) | 8,497 (37.8%) |
Occupancy by Educational Attainment in Tigard
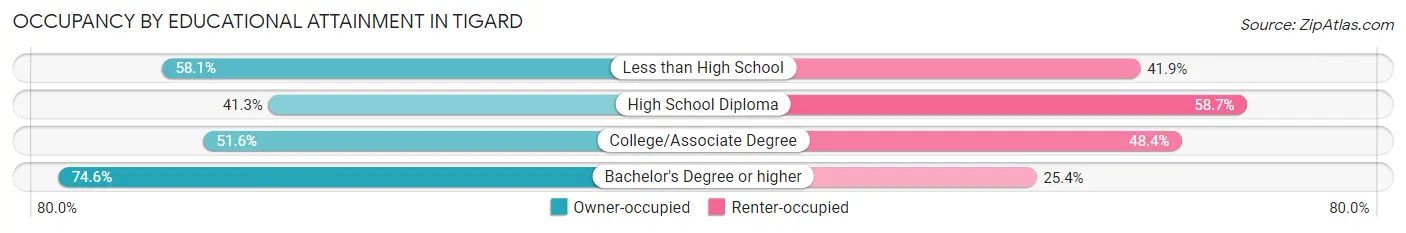
| Household Size | Owner-occupied | Renter-occupied |
| Less than High School | 347 (58.1%) | 250 (41.9%) |
| High School Diploma | 1,290 (41.3%) | 1,835 (58.7%) |
| College/Associate Degree | 3,702 (51.6%) | 3,474 (48.4%) |
| Bachelor's Degree or higher | 8,618 (74.6%) | 2,938 (25.4%) |
Occupancy by Age of Householder in Tigard
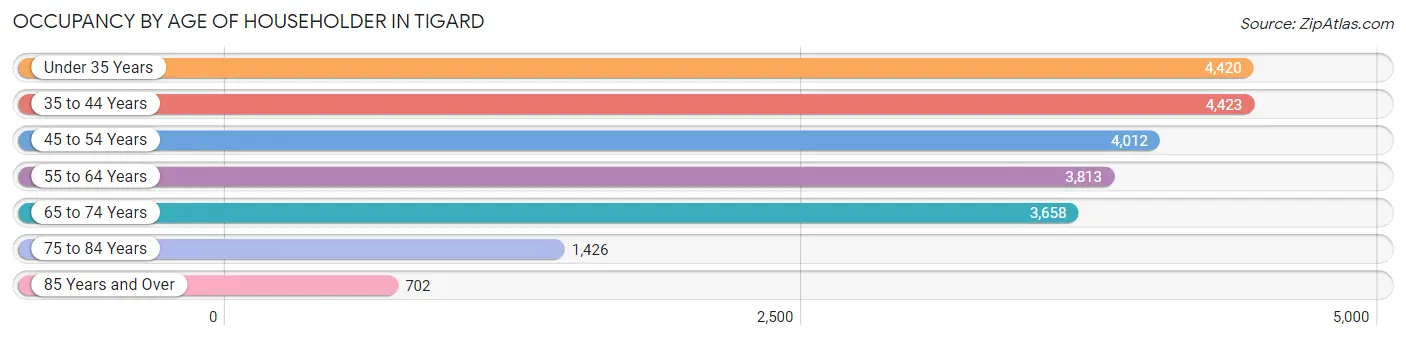
| Age Bracket | # Households | % Households |
| Under 35 Years | 4,420 | 19.7% |
| 35 to 44 Years | 4,423 | 19.7% |
| 45 to 54 Years | 4,012 | 17.9% |
| 55 to 64 Years | 3,813 | 17.0% |
| 65 to 74 Years | 3,658 | 16.3% |
| 75 to 84 Years | 1,426 | 6.4% |
| 85 Years and Over | 702 | 3.1% |
| Total | 22,454 | 100.0% |
Housing Finances in Tigard
Median Income by Occupancy in Tigard
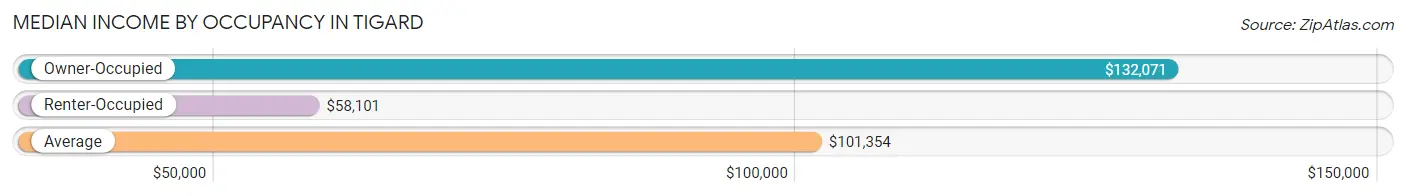
| Occupancy Type | # Households | Median Income |
| Owner-Occupied | 13,957 (62.2%) | $132,071 |
| Renter-Occupied | 8,497 (37.8%) | $58,101 |
| Average | 22,454 (100.0%) | $101,354 |
Occupancy by Householder Income Bracket in Tigard
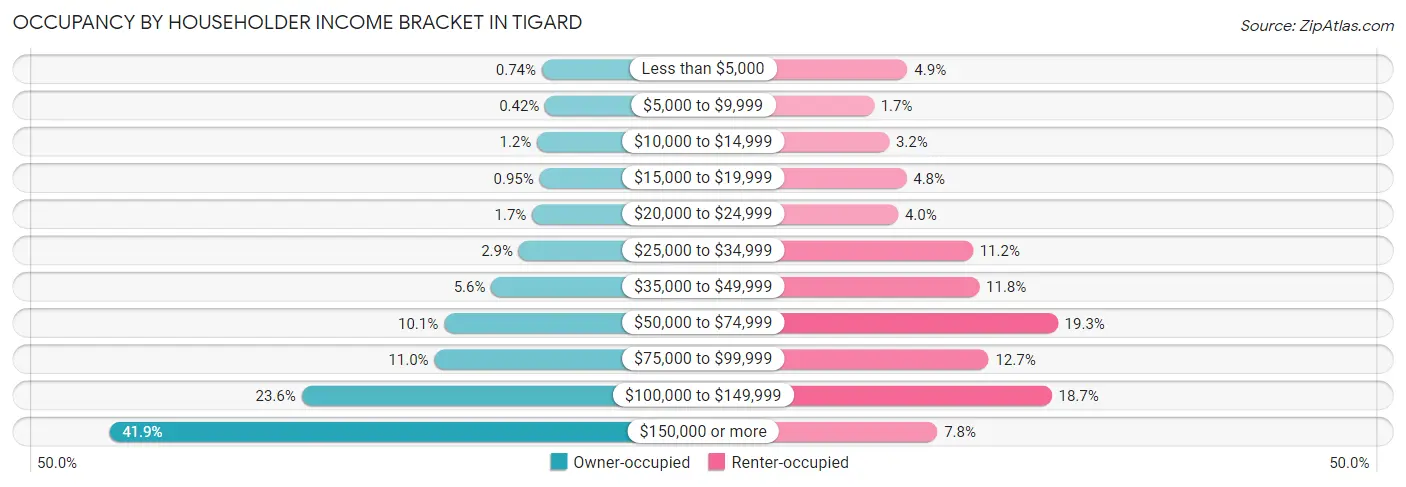
| Income Bracket | Owner-occupied | Renter-occupied |
| Less than $5,000 | 103 (0.7%) | 420 (4.9%) |
| $5,000 to $9,999 | 58 (0.4%) | 147 (1.7%) |
| $10,000 to $14,999 | 166 (1.2%) | 270 (3.2%) |
| $15,000 to $19,999 | 132 (0.9%) | 410 (4.8%) |
| $20,000 to $24,999 | 231 (1.7%) | 343 (4.0%) |
| $25,000 to $34,999 | 409 (2.9%) | 948 (11.2%) |
| $35,000 to $49,999 | 775 (5.6%) | 1,000 (11.8%) |
| $50,000 to $74,999 | 1,402 (10.1%) | 1,636 (19.3%) |
| $75,000 to $99,999 | 1,531 (11.0%) | 1,076 (12.7%) |
| $100,000 to $149,999 | 3,296 (23.6%) | 1,586 (18.7%) |
| $150,000 or more | 5,854 (41.9%) | 661 (7.8%) |
| Total | 13,957 (100.0%) | 8,497 (100.0%) |
Monthly Housing Cost Tiers in Tigard
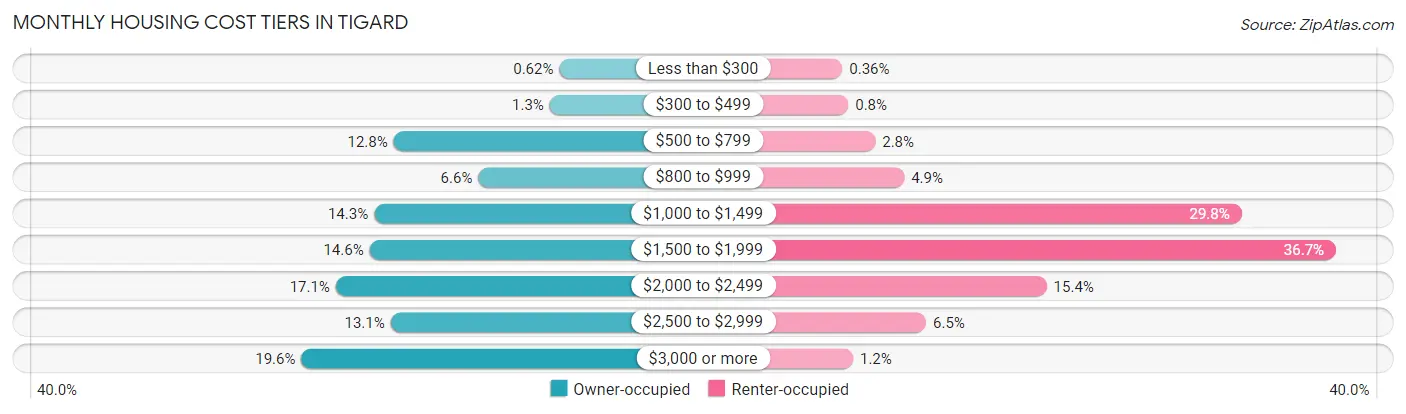
| Monthly Cost | Owner-occupied | Renter-occupied |
| Less than $300 | 87 (0.6%) | 31 (0.4%) |
| $300 to $499 | 185 (1.3%) | 68 (0.8%) |
| $500 to $799 | 1,791 (12.8%) | 237 (2.8%) |
| $800 to $999 | 920 (6.6%) | 418 (4.9%) |
| $1,000 to $1,499 | 1,991 (14.3%) | 2,529 (29.8%) |
| $1,500 to $1,999 | 2,038 (14.6%) | 3,119 (36.7%) |
| $2,000 to $2,499 | 2,385 (17.1%) | 1,309 (15.4%) |
| $2,500 to $2,999 | 1,822 (13.1%) | 555 (6.5%) |
| $3,000 or more | 2,738 (19.6%) | 98 (1.1%) |
| Total | 13,957 (100.0%) | 8,497 (100.0%) |
Physical Housing Characteristics in Tigard
Housing Structures in Tigard
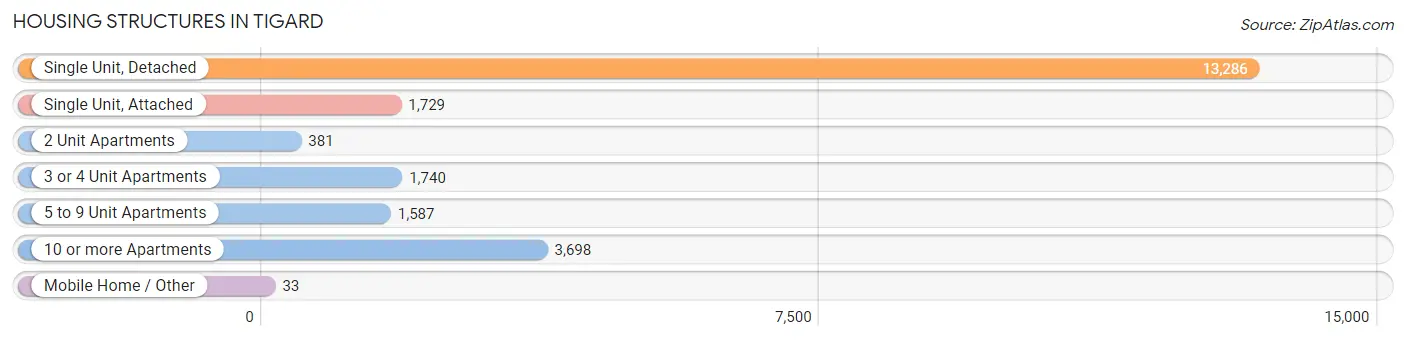
| Structure Type | # Housing Units | % Housing Units |
| Single Unit, Detached | 13,286 | 59.2% |
| Single Unit, Attached | 1,729 | 7.7% |
| 2 Unit Apartments | 381 | 1.7% |
| 3 or 4 Unit Apartments | 1,740 | 7.7% |
| 5 to 9 Unit Apartments | 1,587 | 7.1% |
| 10 or more Apartments | 3,698 | 16.5% |
| Mobile Home / Other | 33 | 0.2% |
| Total | 22,454 | 100.0% |
Housing Structures by Occupancy in Tigard
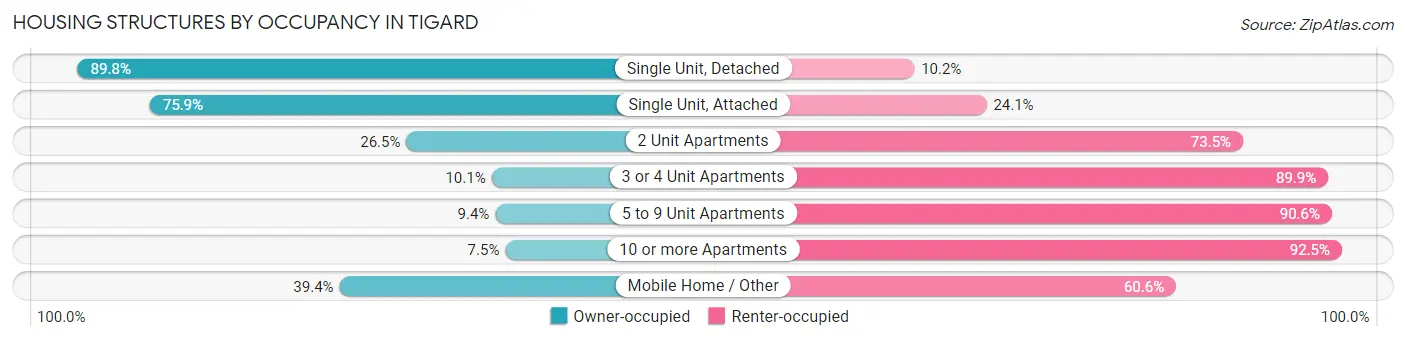
| Structure Type | Owner-occupied | Renter-occupied |
| Single Unit, Detached | 11,930 (89.8%) | 1,356 (10.2%) |
| Single Unit, Attached | 1,312 (75.9%) | 417 (24.1%) |
| 2 Unit Apartments | 101 (26.5%) | 280 (73.5%) |
| 3 or 4 Unit Apartments | 176 (10.1%) | 1,564 (89.9%) |
| 5 to 9 Unit Apartments | 149 (9.4%) | 1,438 (90.6%) |
| 10 or more Apartments | 276 (7.5%) | 3,422 (92.5%) |
| Mobile Home / Other | 13 (39.4%) | 20 (60.6%) |
| Total | 13,957 (62.2%) | 8,497 (37.8%) |
Housing Structures by Number of Rooms in Tigard
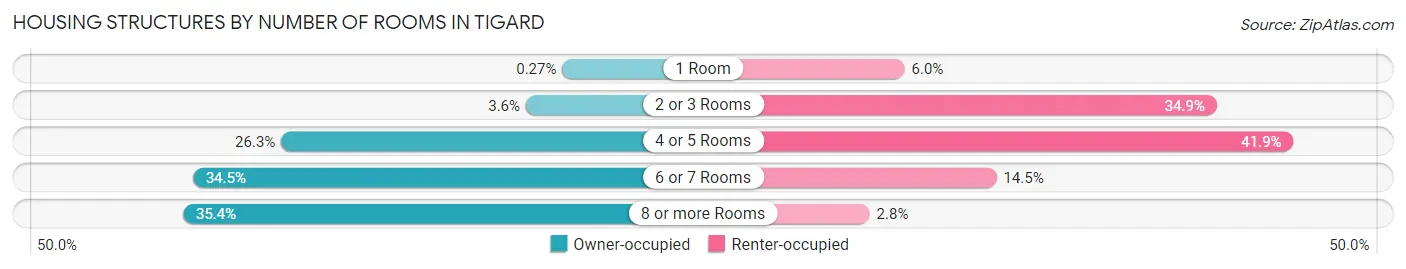
| Number of Rooms | Owner-occupied | Renter-occupied |
| 1 Room | 38 (0.3%) | 508 (6.0%) |
| 2 or 3 Rooms | 508 (3.6%) | 2,961 (34.8%) |
| 4 or 5 Rooms | 3,667 (26.3%) | 3,564 (41.9%) |
| 6 or 7 Rooms | 4,808 (34.4%) | 1,230 (14.5%) |
| 8 or more Rooms | 4,936 (35.4%) | 234 (2.8%) |
| Total | 13,957 (100.0%) | 8,497 (100.0%) |
Housing Structure by Heating Type in Tigard
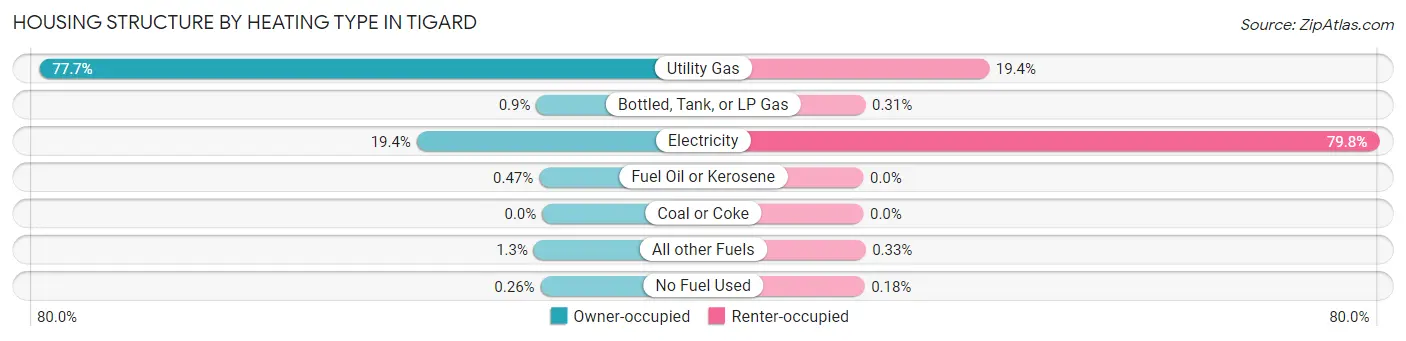
| Heating Type | Owner-occupied | Renter-occupied |
| Utility Gas | 10,846 (77.7%) | 1,652 (19.4%) |
| Bottled, Tank, or LP Gas | 126 (0.9%) | 26 (0.3%) |
| Electricity | 2,706 (19.4%) | 6,776 (79.7%) |
| Fuel Oil or Kerosene | 65 (0.5%) | 0 (0.0%) |
| Coal or Coke | 0 (0.0%) | 0 (0.0%) |
| All other Fuels | 178 (1.3%) | 28 (0.3%) |
| No Fuel Used | 36 (0.3%) | 15 (0.2%) |
| Total | 13,957 (100.0%) | 8,497 (100.0%) |
Household Vehicle Usage in Tigard
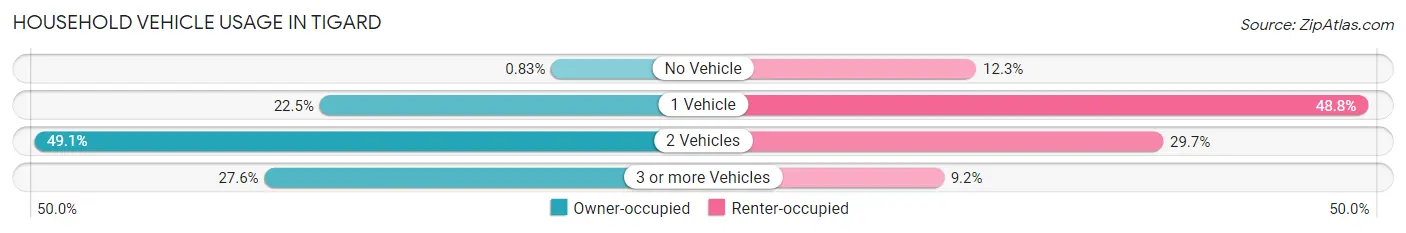
| Vehicles per Household | Owner-occupied | Renter-occupied |
| No Vehicle | 116 (0.8%) | 1,041 (12.2%) |
| 1 Vehicle | 3,133 (22.5%) | 4,149 (48.8%) |
| 2 Vehicles | 6,855 (49.1%) | 2,524 (29.7%) |
| 3 or more Vehicles | 3,853 (27.6%) | 783 (9.2%) |
| Total | 13,957 (100.0%) | 8,497 (100.0%) |
Real Estate & Mortgages in Tigard
Real Estate and Mortgage Overview in Tigard
| Characteristic | Without Mortgage | With Mortgage |
| Housing Units | 3,808 | 10,149 |
| Median Property Value | $547,800 | $516,200 |
| Median Household Income | $91,200 | $4,886 |
| Monthly Housing Costs | $790 | $2,738 |
| Real Estate Taxes | $5,394 | $77 |
Property Value by Mortgage Status in Tigard
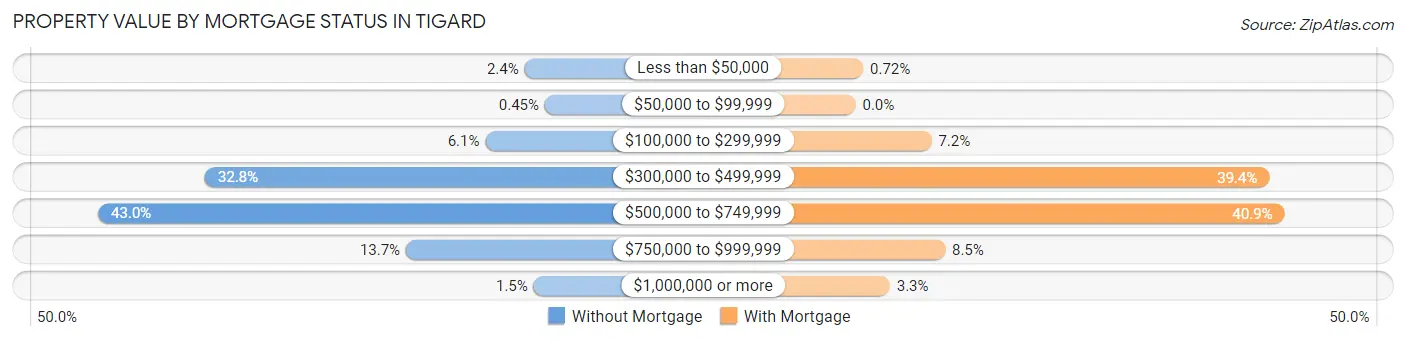
| Property Value | Without Mortgage | With Mortgage |
| Less than $50,000 | 91 (2.4%) | 73 (0.7%) |
| $50,000 to $99,999 | 17 (0.4%) | 0 (0.0%) |
| $100,000 to $299,999 | 233 (6.1%) | 734 (7.2%) |
| $300,000 to $499,999 | 1,250 (32.8%) | 3,999 (39.4%) |
| $500,000 to $749,999 | 1,638 (43.0%) | 4,147 (40.9%) |
| $750,000 to $999,999 | 521 (13.7%) | 865 (8.5%) |
| $1,000,000 or more | 58 (1.5%) | 331 (3.3%) |
| Total | 3,808 (100.0%) | 10,149 (100.0%) |
Household Income by Mortgage Status in Tigard
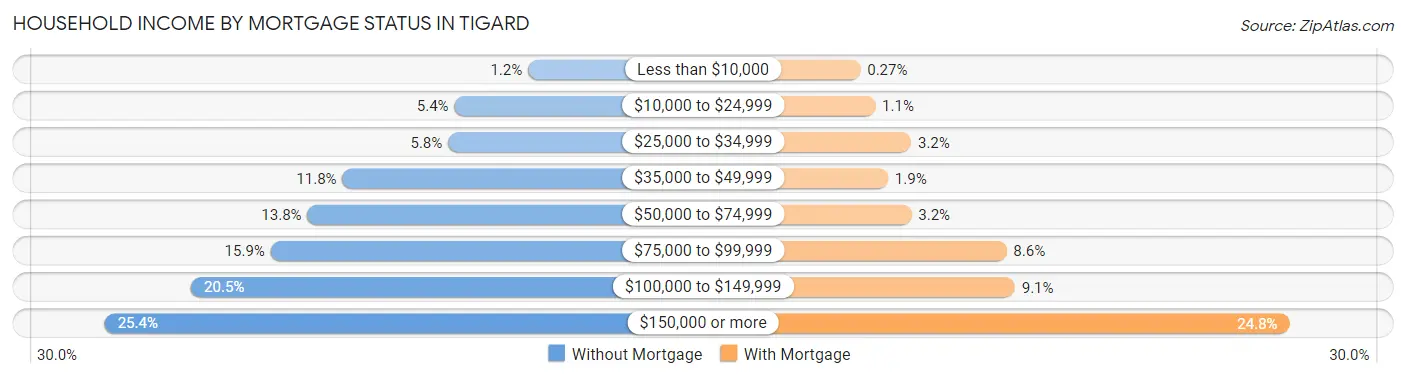
| Household Income | Without Mortgage | With Mortgage |
| Less than $10,000 | 47 (1.2%) | 27 (0.3%) |
| $10,000 to $24,999 | 207 (5.4%) | 114 (1.1%) |
| $25,000 to $34,999 | 221 (5.8%) | 322 (3.2%) |
| $35,000 to $49,999 | 451 (11.8%) | 188 (1.8%) |
| $50,000 to $74,999 | 527 (13.8%) | 324 (3.2%) |
| $75,000 to $99,999 | 607 (15.9%) | 875 (8.6%) |
| $100,000 to $149,999 | 780 (20.5%) | 924 (9.1%) |
| $150,000 or more | 968 (25.4%) | 2,516 (24.8%) |
| Total | 3,808 (100.0%) | 10,149 (100.0%) |
Property Value to Household Income Ratio in Tigard
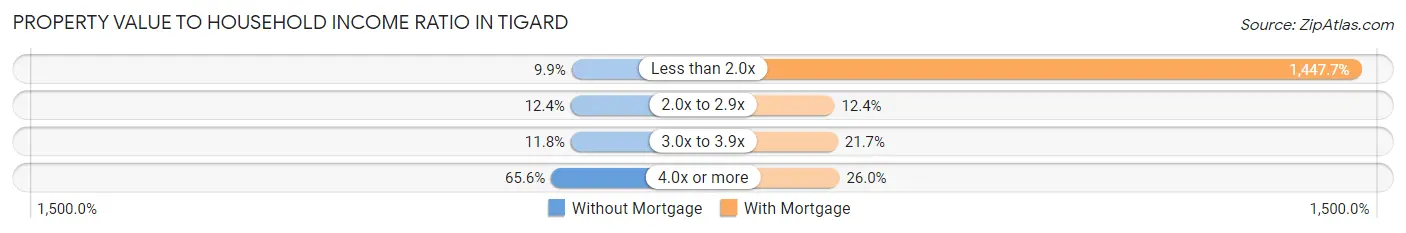
| Value-to-Income Ratio | Without Mortgage | With Mortgage |
| Less than 2.0x | 375 (9.9%) | 146,929 (1,447.7%) |
| 2.0x to 2.9x | 471 (12.4%) | 1,256 (12.4%) |
| 3.0x to 3.9x | 448 (11.8%) | 2,202 (21.7%) |
| 4.0x or more | 2,499 (65.6%) | 2,634 (26.0%) |
| Total | 3,808 (100.0%) | 10,149 (100.0%) |
Real Estate Taxes by Mortgage Status in Tigard
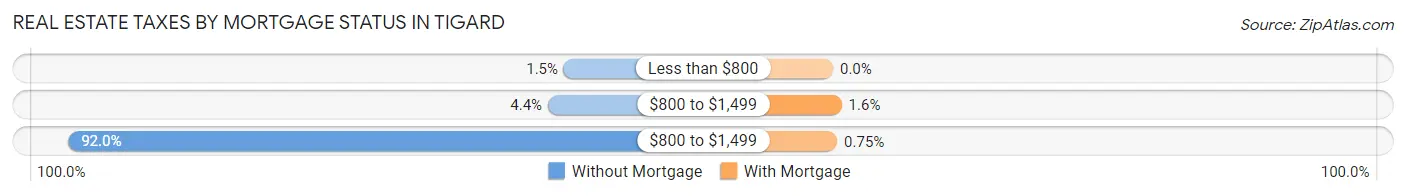
| Property Taxes | Without Mortgage | With Mortgage |
| Less than $800 | 57 (1.5%) | 0 (0.0%) |
| $800 to $1,499 | 168 (4.4%) | 159 (1.6%) |
| $800 to $1,499 | 3,504 (92.0%) | 76 (0.7%) |
| Total | 3,808 (100.0%) | 10,149 (100.0%) |
Health & Disability in Tigard
Health Insurance Coverage by Age in Tigard
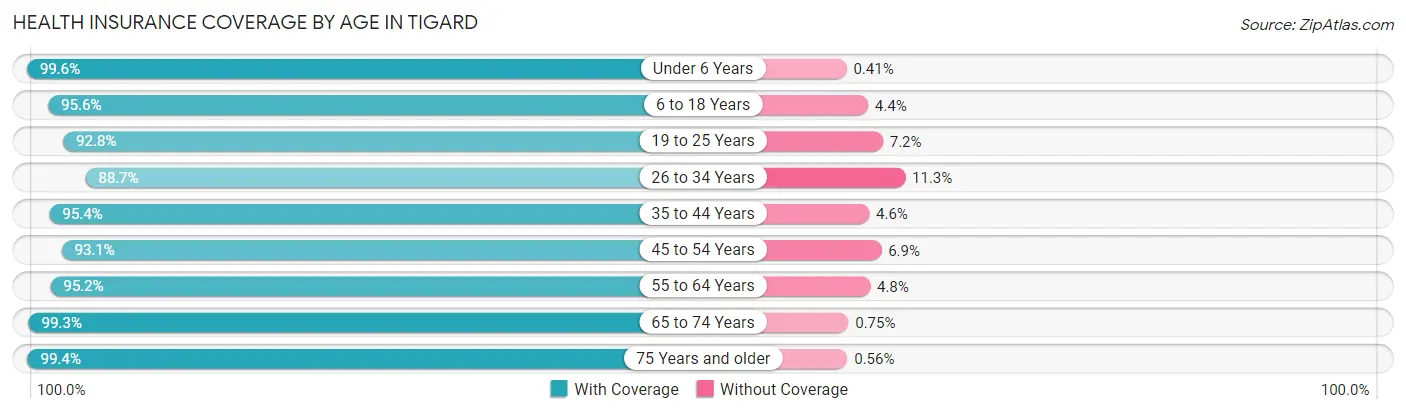
| Age Bracket | With Coverage | Without Coverage |
| Under 6 Years | 4,132 (99.6%) | 17 (0.4%) |
| 6 to 18 Years | 7,178 (95.6%) | 330 (4.4%) |
| 19 to 25 Years | 3,454 (92.8%) | 267 (7.2%) |
| 26 to 34 Years | 7,217 (88.7%) | 923 (11.3%) |
| 35 to 44 Years | 8,282 (95.4%) | 402 (4.6%) |
| 45 to 54 Years | 6,740 (93.1%) | 498 (6.9%) |
| 55 to 64 Years | 6,293 (95.2%) | 317 (4.8%) |
| 65 to 74 Years | 5,694 (99.3%) | 43 (0.7%) |
| 75 Years and older | 3,206 (99.4%) | 18 (0.6%) |
| Total | 52,196 (94.9%) | 2,815 (5.1%) |
Health Insurance Coverage by Citizenship Status in Tigard
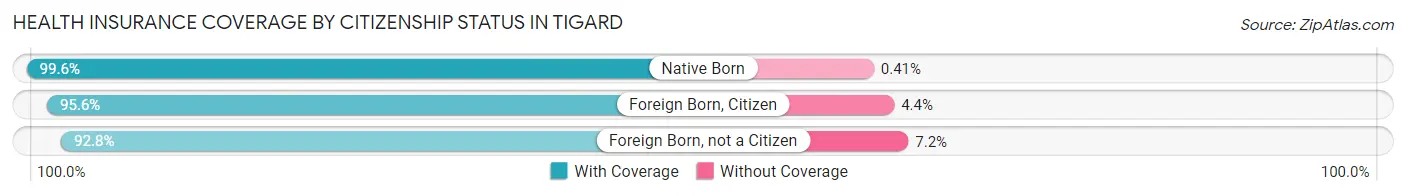
| Citizenship Status | With Coverage | Without Coverage |
| Native Born | 4,132 (99.6%) | 17 (0.4%) |
| Foreign Born, Citizen | 7,178 (95.6%) | 330 (4.4%) |
| Foreign Born, not a Citizen | 3,454 (92.8%) | 267 (7.2%) |
Health Insurance Coverage by Household Income in Tigard
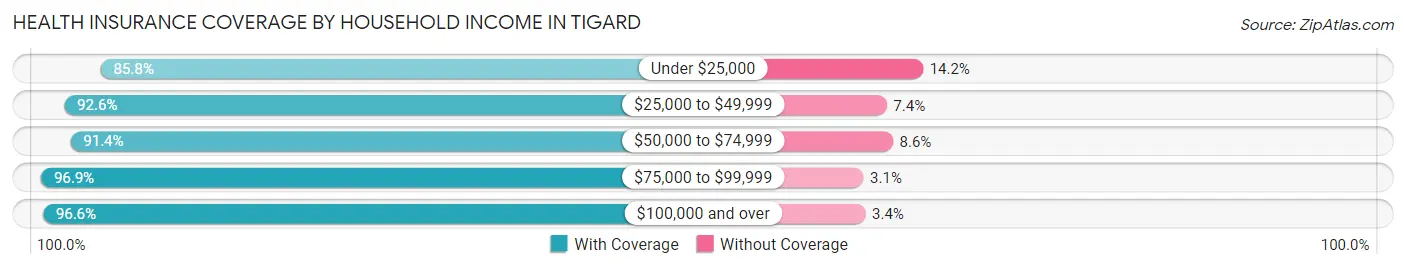
| Household Income | With Coverage | Without Coverage |
| Under $25,000 | 3,186 (85.8%) | 528 (14.2%) |
| $25,000 to $49,999 | 4,765 (92.6%) | 382 (7.4%) |
| $50,000 to $74,999 | 5,837 (91.4%) | 548 (8.6%) |
| $75,000 to $99,999 | 5,682 (96.9%) | 180 (3.1%) |
| $100,000 and over | 32,404 (96.6%) | 1,150 (3.4%) |
Public vs Private Health Insurance Coverage by Age in Tigard
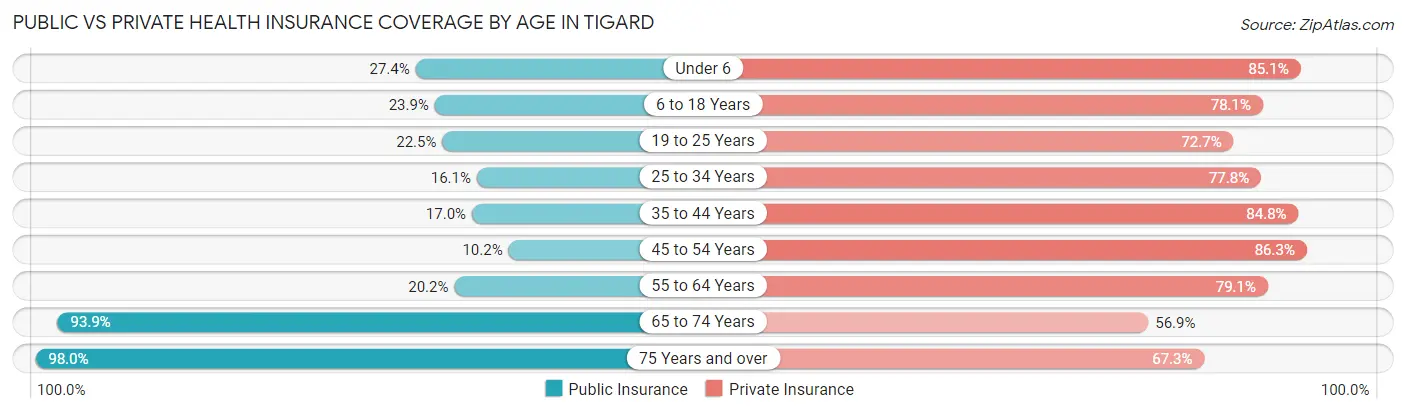
| Age Bracket | Public Insurance | Private Insurance |
| Under 6 | 1,138 (27.4%) | 3,532 (85.1%) |
| 6 to 18 Years | 1,793 (23.9%) | 5,867 (78.1%) |
| 19 to 25 Years | 836 (22.5%) | 2,705 (72.7%) |
| 25 to 34 Years | 1,308 (16.1%) | 6,333 (77.8%) |
| 35 to 44 Years | 1,474 (17.0%) | 7,360 (84.8%) |
| 45 to 54 Years | 737 (10.2%) | 6,246 (86.3%) |
| 55 to 64 Years | 1,338 (20.2%) | 5,226 (79.1%) |
| 65 to 74 Years | 5,387 (93.9%) | 3,264 (56.9%) |
| 75 Years and over | 3,160 (98.0%) | 2,169 (67.3%) |
| Total | 17,171 (31.2%) | 42,702 (77.6%) |
Disability Status by Sex by Age in Tigard
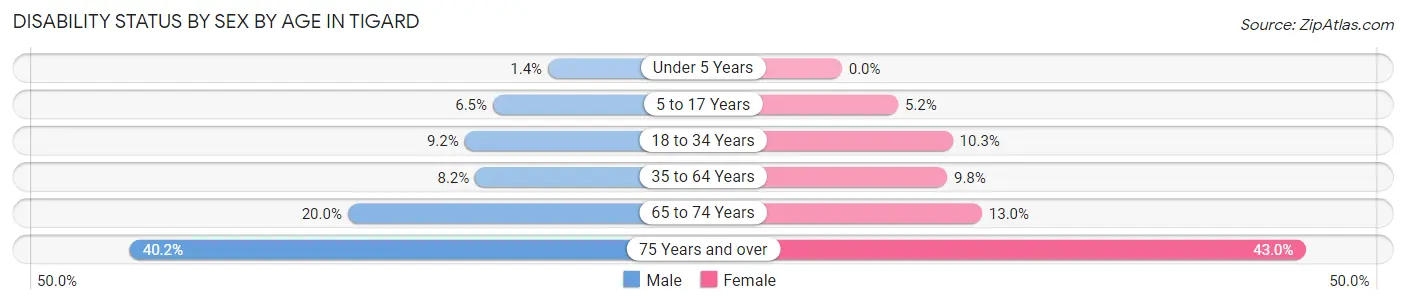
| Age Bracket | Male | Female |
| Under 5 Years | 32 (1.4%) | 0 (0.0%) |
| 5 to 17 Years | 272 (6.5%) | 183 (5.2%) |
| 18 to 34 Years | 578 (9.2%) | 626 (10.3%) |
| 35 to 64 Years | 929 (8.2%) | 1,093 (9.8%) |
| 65 to 74 Years | 520 (20.0%) | 408 (13.0%) |
| 75 Years and over | 519 (40.2%) | 832 (43.0%) |
Disability Class by Sex by Age in Tigard
Disability Class: Hearing Difficulty
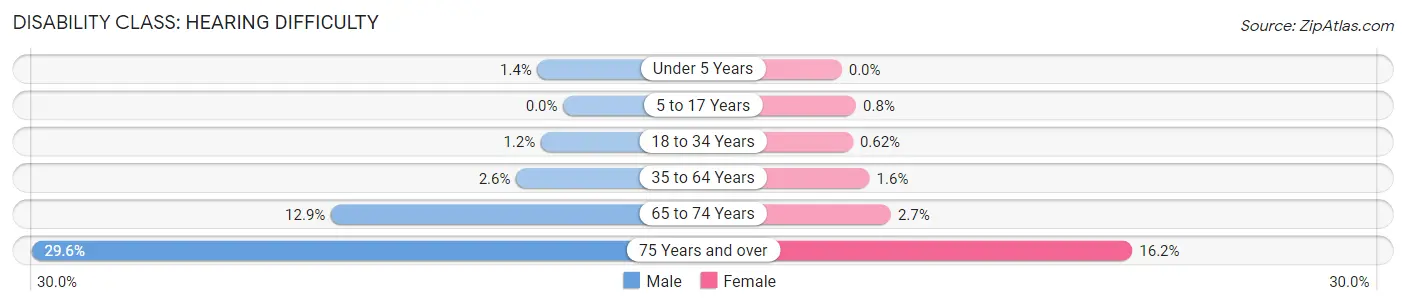
| Age Bracket | Male | Female |
| Under 5 Years | 32 (1.4%) | 0 (0.0%) |
| 5 to 17 Years | 0 (0.0%) | 28 (0.8%) |
| 18 to 34 Years | 78 (1.2%) | 38 (0.6%) |
| 35 to 64 Years | 297 (2.6%) | 173 (1.5%) |
| 65 to 74 Years | 336 (12.9%) | 86 (2.7%) |
| 75 Years and over | 382 (29.6%) | 313 (16.2%) |
Disability Class: Vision Difficulty
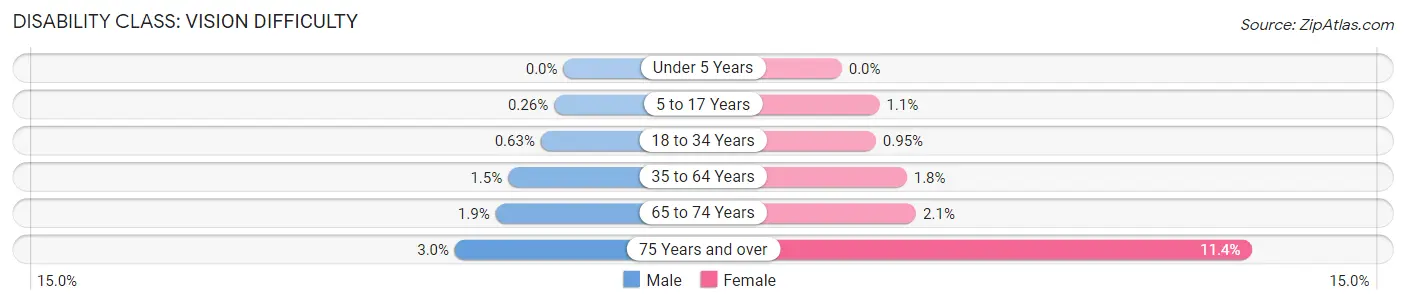
| Age Bracket | Male | Female |
| Under 5 Years | 0 (0.0%) | 0 (0.0%) |
| 5 to 17 Years | 11 (0.3%) | 37 (1.1%) |
| 18 to 34 Years | 40 (0.6%) | 58 (0.9%) |
| 35 to 64 Years | 175 (1.5%) | 202 (1.8%) |
| 65 to 74 Years | 49 (1.9%) | 65 (2.1%) |
| 75 Years and over | 39 (3.0%) | 221 (11.4%) |
Disability Class: Cognitive Difficulty
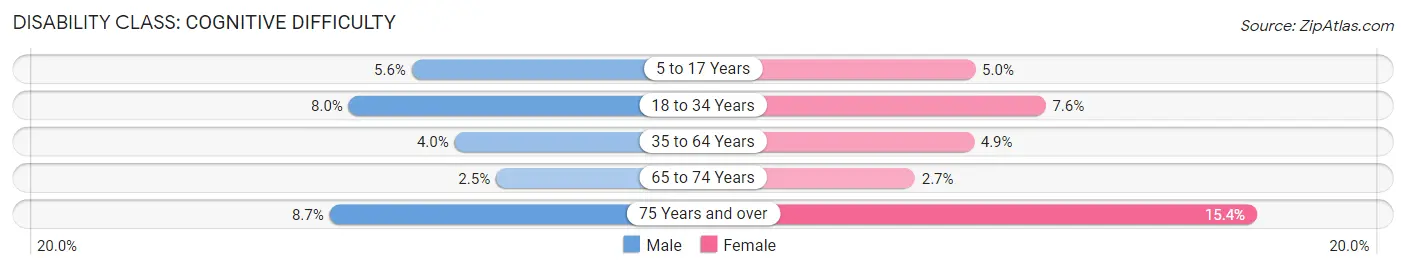
| Age Bracket | Male | Female |
| 5 to 17 Years | 234 (5.6%) | 174 (5.0%) |
| 18 to 34 Years | 502 (8.0%) | 460 (7.6%) |
| 35 to 64 Years | 459 (4.0%) | 548 (4.9%) |
| 65 to 74 Years | 65 (2.5%) | 85 (2.7%) |
| 75 Years and over | 112 (8.7%) | 298 (15.4%) |
Disability Class: Ambulatory Difficulty
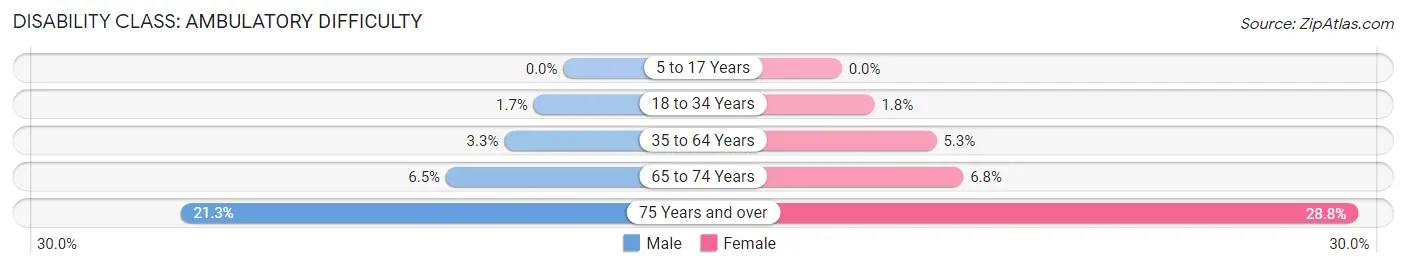
| Age Bracket | Male | Female |
| 5 to 17 Years | 0 (0.0%) | 0 (0.0%) |
| 18 to 34 Years | 104 (1.7%) | 111 (1.8%) |
| 35 to 64 Years | 373 (3.3%) | 589 (5.3%) |
| 65 to 74 Years | 170 (6.5%) | 212 (6.8%) |
| 75 Years and over | 275 (21.3%) | 556 (28.7%) |
Disability Class: Self-Care Difficulty
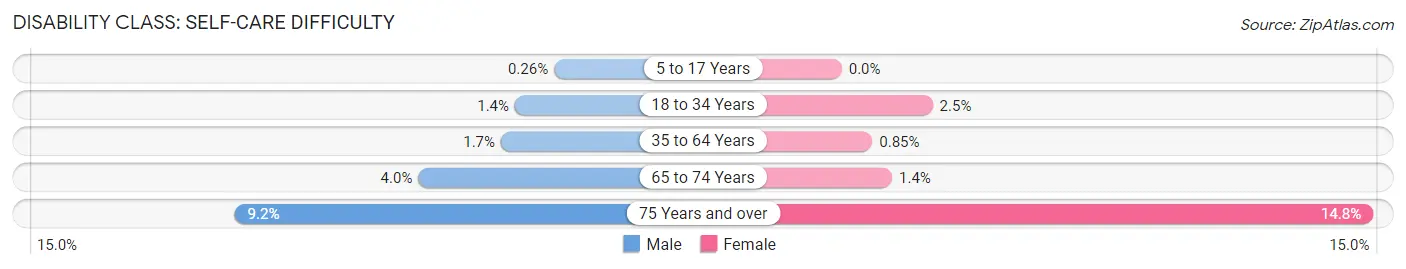
| Age Bracket | Male | Female |
| 5 to 17 Years | 11 (0.3%) | 0 (0.0%) |
| 18 to 34 Years | 85 (1.3%) | 154 (2.5%) |
| 35 to 64 Years | 197 (1.7%) | 95 (0.9%) |
| 65 to 74 Years | 105 (4.0%) | 44 (1.4%) |
| 75 Years and over | 118 (9.1%) | 286 (14.8%) |
Technology Access in Tigard
Computing Device Access in Tigard
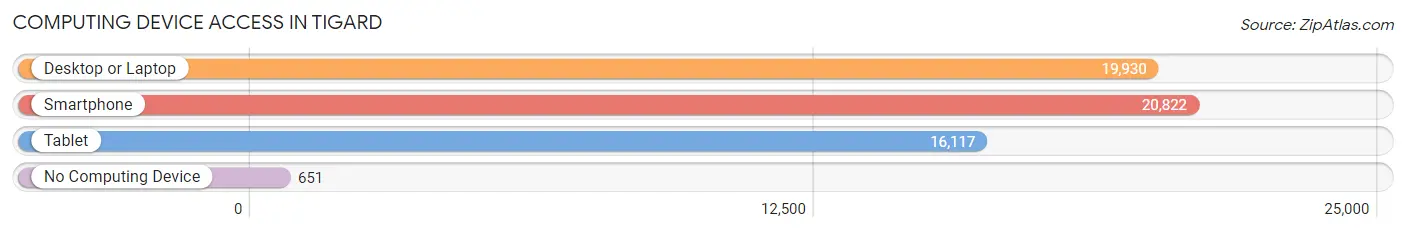
| Device Type | # Households | % Households |
| Desktop or Laptop | 19,930 | 88.8% |
| Smartphone | 20,822 | 92.7% |
| Tablet | 16,117 | 71.8% |
| No Computing Device | 651 | 2.9% |
| Total | 22,454 | 100.0% |
Internet Access in Tigard
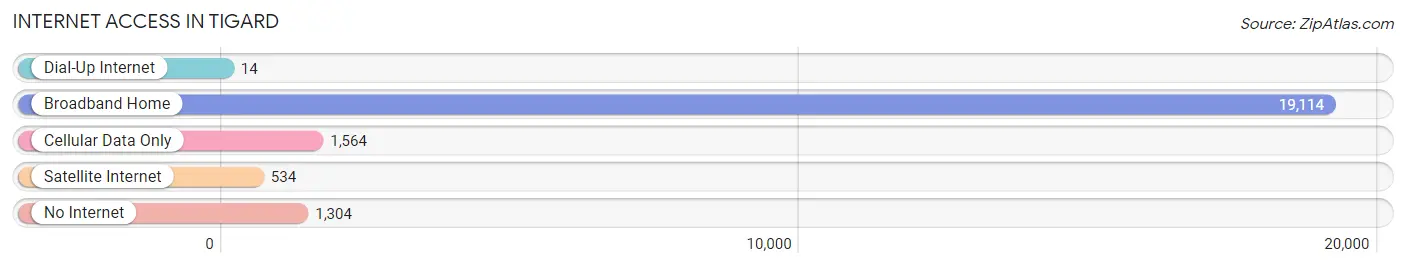
| Internet Type | # Households | % Households |
| Dial-Up Internet | 14 | 0.1% |
| Broadband Home | 19,114 | 85.1% |
| Cellular Data Only | 1,564 | 7.0% |
| Satellite Internet | 534 | 2.4% |
| No Internet | 1,304 | 5.8% |
| Total | 22,454 | 100.0% |
Tigard Summary
Tigard is a city located in Washington County, Oregon, United States. It is a suburb of Portland and is located 12 miles southwest of downtown Portland. As of the 2010 census, the city had a population of 48,035.
History
Tigard was founded in the late 1800s by Wilson M. Tigard, who was a pioneer in the area. He was a farmer and blacksmith who settled in the area in 1852. He built a grist mill and a sawmill on the banks of the Tualatin River. The area was originally known as "Tigardville" and was later changed to "Tigard".
In the early 1900s, the city was a small farming community. The population grew slowly until the 1950s when the city began to experience rapid growth due to the development of the Portland metropolitan area. The city was incorporated in 1961 and has since grown to become one of the largest cities in the Portland metropolitan area.
Geography
Tigard is located in Washington County, Oregon, at the intersection of Interstate 5 and Oregon Route 217. It is located 12 miles southwest of downtown Portland. The city is situated on the banks of the Tualatin River and is surrounded by the Tualatin Valley. The city has a total area of 11.2 square miles, of which 10.9 square miles is land and 0.3 square miles is water.
The city is located in the Tualatin Valley, which is part of the Willamette Valley. The climate is mild and temperate, with warm summers and cool winters. The average annual precipitation is 37.5 inches.
Economy
Tigard is a major economic center in the Portland metropolitan area. The city is home to a variety of businesses, including retail, manufacturing, and technology. The city is also home to several major employers, including Intel, Nike, and Tektronix.
The city's economy is also supported by tourism. The city is home to several attractions, including the Washington Square Mall, the Oregon Zoo, and the Tualatin River National Wildlife Refuge.
Demographics
As of the 2010 census, the city had a population of 48,035. The racial makeup of the city was 77.2% White, 8.2% Asian, 6.3% Hispanic or Latino, 4.2% African American, and 2.7% from other races.
The median household income in the city was $60,945, and the median family income was $71,817. The per capita income was $30,945. The poverty rate was 8.3%.
Conclusion
Tigard is a city located in Washington County, Oregon, United States. It is a suburb of Portland and is located 12 miles southwest of downtown Portland. As of the 2010 census, the city had a population of 48,035. The city was founded in the late 1800s by Wilson M. Tigard and has since grown to become one of the largest cities in the Portland metropolitan area. The city is situated on the banks of the Tualatin River and is surrounded by the Tualatin Valley. The city is a major economic center in the Portland metropolitan area and is home to a variety of businesses, including retail, manufacturing, and technology. The city is also home to several attractions, including the Washington Square Mall, the Oregon Zoo, and the Tualatin River National Wildlife Refuge. The racial makeup of the city was 77.2% White, 8.2% Asian, 6.3% Hispanic or Latino, 4.2% African American, and 2.7% from other races. The median household income in the city was $60,945, and the median family income was $71,817. The per capita income was $30,945. The poverty rate was 8.3%.
Common Questions
What is the Total Population of Tigard?
Total Population of Tigard is 55,161.
What is the Total Male Population of Tigard?
Total Male Population of Tigard is 27,997.
What is the Total Female Population of Tigard?
Total Female Population of Tigard is 27,164.
What is the Ratio of Males per 100 Females in Tigard?
There are 103.07 Males per 100 Females in Tigard.
What is the Ratio of Females per 100 Males in Tigard?
There are 97.02 Females per 100 Males in Tigard.
What is the Median Population Age in Tigard?
Median Population Age in Tigard is 38.9 Years.
What is the Average Family Size in Tigard
Average Family Size in Tigard is 2.9 People.
What is the Average Household Size in Tigard
Average Household Size in Tigard is 2.4 People.
What is Per Capita Income in Tigard?
Per Capita income in Tigard is $49,836.
What is the Median Family Income in Tigard?
Median Family Income in Tigard is $125,216.
What is the Median Household income in Tigard?
Median Household Income in Tigard is $101,354.
What is Income or Wage Gap in Tigard?
Income or Wage Gap in Tigard is 29.8%.
Women in Tigard earn 70.2 cents for every dollar earned by a man.
What is Family Income Deficit in Tigard?
Family Income Deficit in Tigard is $10,459.
Families that are below poverty line in Tigard earn $10,459 less on average than the poverty threshold level.
What is Inequality or Gini Index in Tigard?
Inequality or Gini Index in Tigard is 0.41.
How Large is the Labor Force in Tigard?
There are 30,995 People in the Labor Forcein in Tigard.
What is the Percentage of People in the Labor Force in Tigard?
68.4% of People are in the Labor Force in Tigard.
What is the Unemployment Rate in Tigard?
Unemployment Rate in Tigard is 5.1%.