Rivergrove, OR
Rivergrove Map
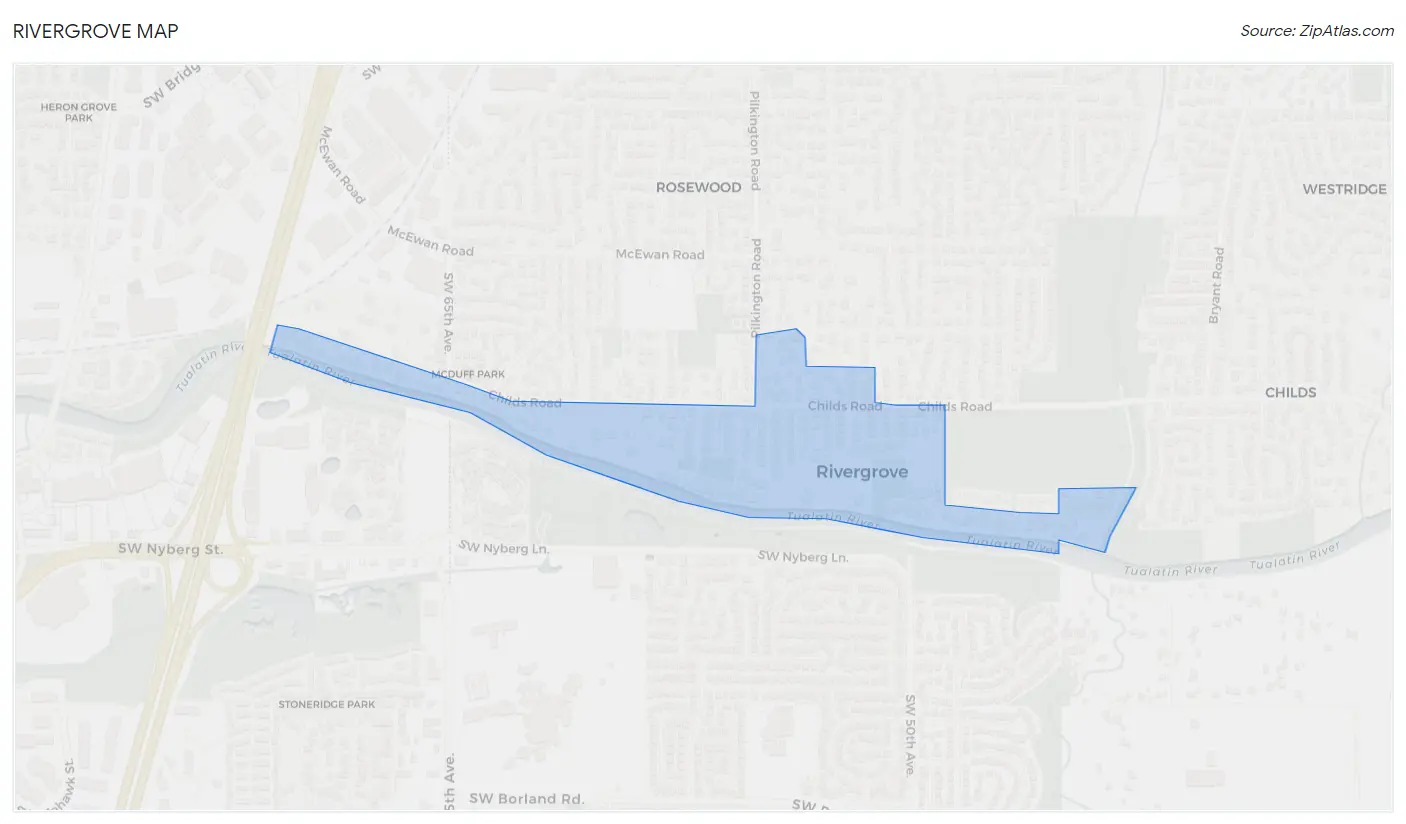
Rivergrove Overview
558
TOTAL POPULATION
288
MALE POPULATION
270
FEMALE POPULATION
106.67
MALES / 100 FEMALES
93.75
FEMALES / 100 MALES
47.8
MEDIAN AGE
2.9
AVG FAMILY SIZE
2.6
AVG HOUSEHOLD SIZE
$77,494
PER CAPITA INCOME
$161,875
AVG FAMILY INCOME
$173,750
AVG HOUSEHOLD INCOME
34.7%
WAGE / INCOME GAP [ % ]
65.3¢/ $1
WAGE / INCOME GAP [ $ ]
0.42
INEQUALITY / GINI INDEX
266
LABOR FORCE [ PEOPLE ]
59.1%
PERCENT IN LABOR FORCE
9.4%
UNEMPLOYMENT RATE
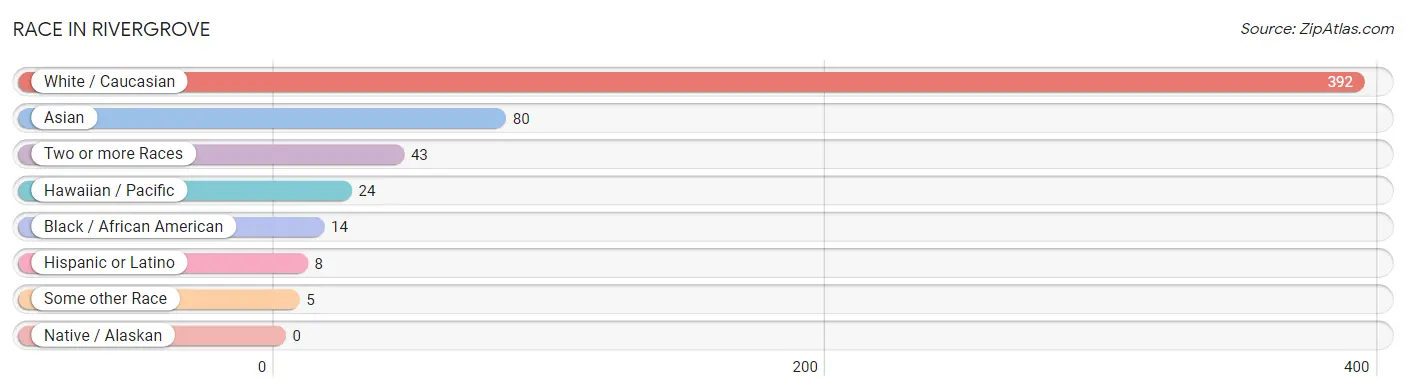
Race in Rivergrove
The most populous races in Rivergrove are White / Caucasian (392 | 70.3%), Asian (80 | 14.3%), and Two or more Races (43 | 7.7%).
| Race | # Population | % Population |
| Asian | 80 | 14.3% |
| Black / African American | 14 | 2.5% |
| Hawaiian / Pacific | 24 | 4.3% |
| Hispanic or Latino | 8 | 1.4% |
| Native / Alaskan | 0 | 0.0% |
| White / Caucasian | 392 | 70.3% |
| Two or more Races | 43 | 7.7% |
| Some other Race | 5 | 0.9% |
| Total | 558 | 100.0% |
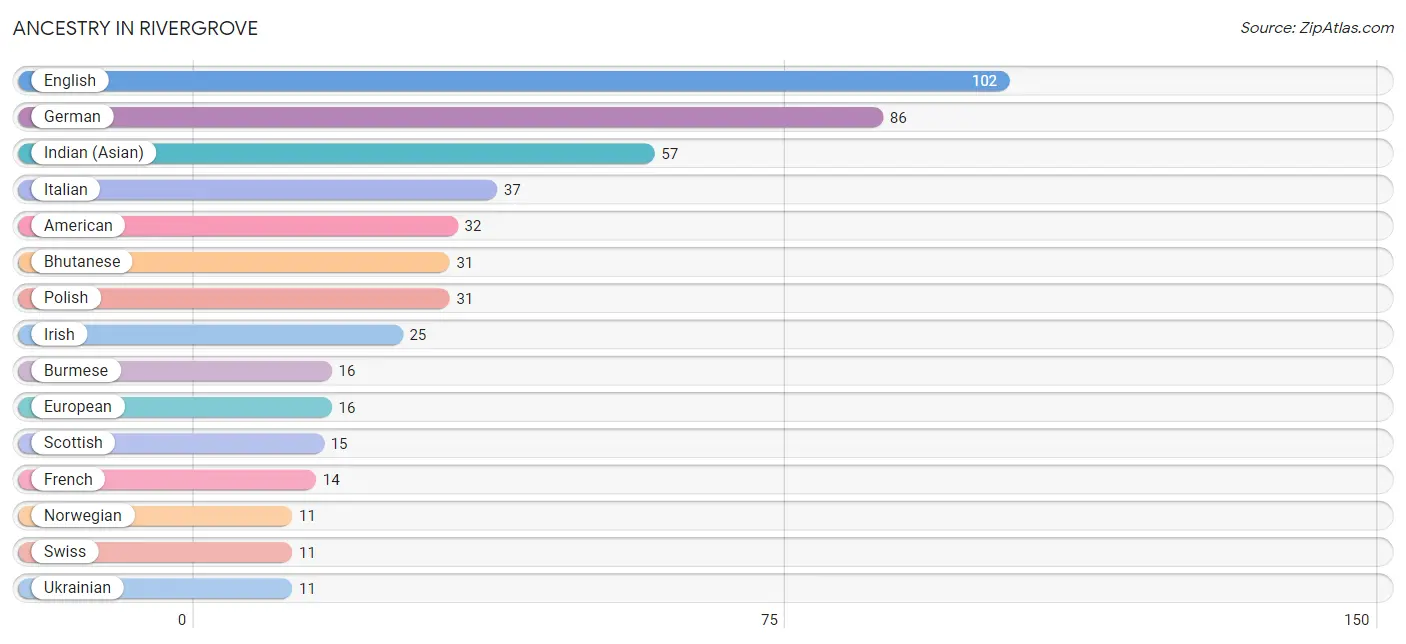
Ancestry in Rivergrove
The most populous ancestries reported in Rivergrove are English (102 | 18.3%), German (86 | 15.4%), Indian (Asian) (57 | 10.2%), Italian (37 | 6.6%), and American (32 | 5.7%), together accounting for 56.3% of all Rivergrove residents.
| Ancestry | # Population | % Population |
| American | 32 | 5.7% |
| Argentinean | 2 | 0.4% |
| Australian | 5 | 0.9% |
| Austrian | 1 | 0.2% |
| Belgian | 5 | 0.9% |
| Bhutanese | 31 | 5.6% |
| British | 5 | 0.9% |
| Burmese | 16 | 2.9% |
| Canadian | 2 | 0.4% |
| Chippewa | 4 | 0.7% |
| Czech | 2 | 0.4% |
| Danish | 5 | 0.9% |
| Dutch | 7 | 1.3% |
| English | 102 | 18.3% |
| European | 16 | 2.9% |
| Filipino | 3 | 0.5% |
| Finnish | 3 | 0.5% |
| French | 14 | 2.5% |
| French Canadian | 2 | 0.4% |
| German | 86 | 15.4% |
| Greek | 4 | 0.7% |
| Indian (Asian) | 57 | 10.2% |
| Iranian | 1 | 0.2% |
| Irish | 25 | 4.5% |
| Italian | 37 | 6.6% |
| Jamaican | 1 | 0.2% |
| Lithuanian | 1 | 0.2% |
| Mexican | 3 | 0.5% |
| Native Hawaiian | 6 | 1.1% |
| Northern European | 1 | 0.2% |
| Norwegian | 11 | 2.0% |
| Okinawan | 2 | 0.4% |
| Polish | 31 | 5.6% |
| Romanian | 1 | 0.2% |
| Russian | 3 | 0.5% |
| Scotch-Irish | 3 | 0.5% |
| Scottish | 15 | 2.7% |
| South American | 2 | 0.4% |
| Spanish | 3 | 0.5% |
| Sri Lankan | 9 | 1.6% |
| Swedish | 7 | 1.3% |
| Swiss | 11 | 2.0% |
| Ukrainian | 11 | 2.0% |
| Welsh | 5 | 0.9% | View All 44 Rows |
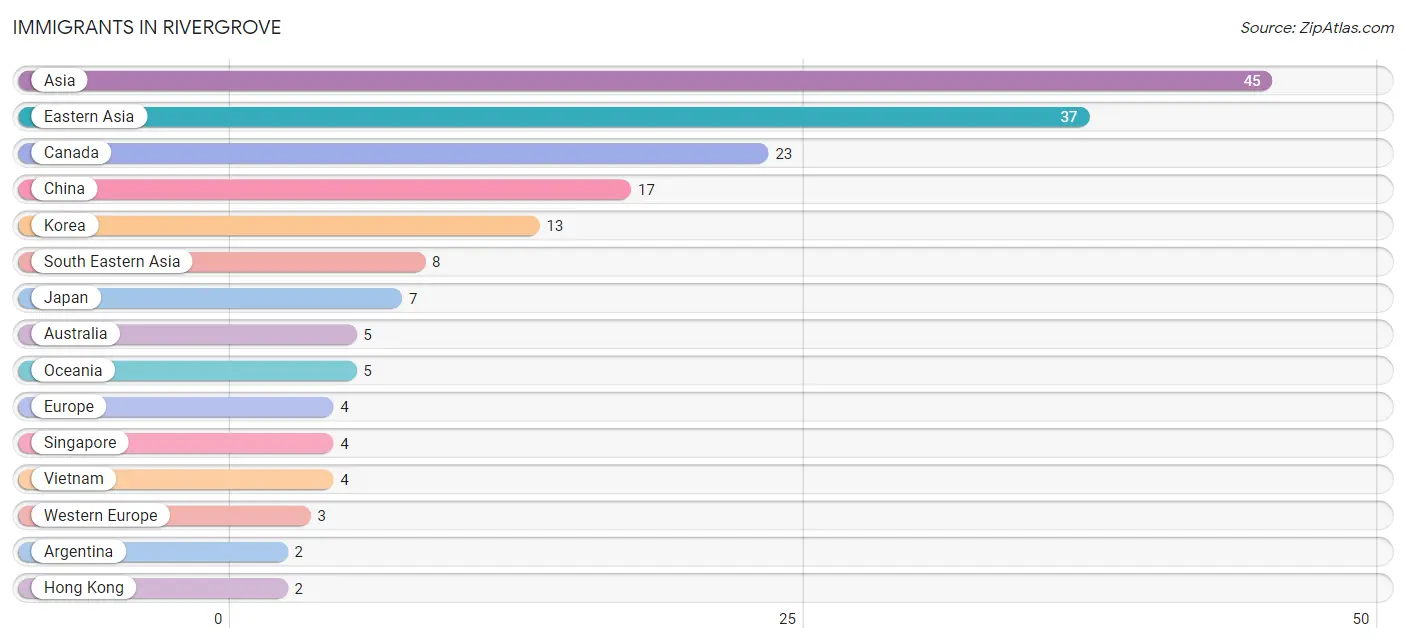
Immigrants in Rivergrove
The most numerous immigrant groups reported in Rivergrove came from Asia (45 | 8.1%), Eastern Asia (37 | 6.6%), Canada (23 | 4.1%), China (17 | 3.0%), and Korea (13 | 2.3%), together accounting for 24.2% of all Rivergrove residents.
| Immigration Origin | # Population | % Population |
| Argentina | 2 | 0.4% |
| Asia | 45 | 8.1% |
| Australia | 5 | 0.9% |
| Canada | 23 | 4.1% |
| China | 17 | 3.0% |
| Eastern Asia | 37 | 6.6% |
| Europe | 4 | 0.7% |
| Germany | 1 | 0.2% |
| Hong Kong | 2 | 0.4% |
| Japan | 7 | 1.3% |
| Korea | 13 | 2.3% |
| Latin America | 2 | 0.4% |
| Northern Europe | 1 | 0.2% |
| Norway | 1 | 0.2% |
| Oceania | 5 | 0.9% |
| Singapore | 4 | 0.7% |
| South America | 2 | 0.4% |
| South Eastern Asia | 8 | 1.4% |
| Switzerland | 2 | 0.4% |
| Taiwan | 1 | 0.2% |
| Vietnam | 4 | 0.7% |
| Western Europe | 3 | 0.5% | View All 22 Rows |
Sex and Age in Rivergrove
Sex and Age in Rivergrove
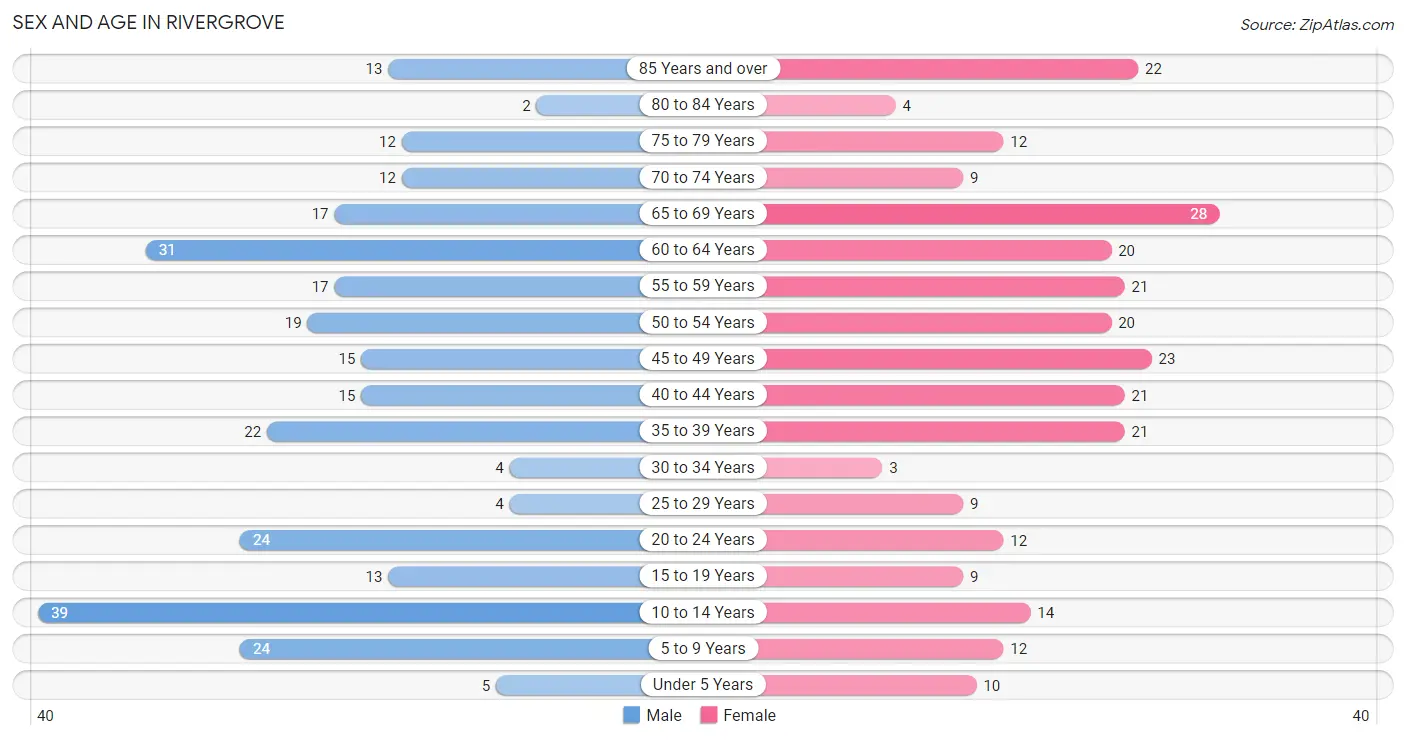
The most populous age groups in Rivergrove are 10 to 14 Years (39 | 13.5%) for men and 65 to 69 Years (28 | 10.4%) for women.
| Age Bracket | Male | Female |
| Under 5 Years | 5 (1.7%) | 10 (3.7%) |
| 5 to 9 Years | 24 (8.3%) | 12 (4.4%) |
| 10 to 14 Years | 39 (13.5%) | 14 (5.2%) |
| 15 to 19 Years | 13 (4.5%) | 9 (3.3%) |
| 20 to 24 Years | 24 (8.3%) | 12 (4.4%) |
| 25 to 29 Years | 4 (1.4%) | 9 (3.3%) |
| 30 to 34 Years | 4 (1.4%) | 3 (1.1%) |
| 35 to 39 Years | 22 (7.6%) | 21 (7.8%) |
| 40 to 44 Years | 15 (5.2%) | 21 (7.8%) |
| 45 to 49 Years | 15 (5.2%) | 23 (8.5%) |
| 50 to 54 Years | 19 (6.6%) | 20 (7.4%) |
| 55 to 59 Years | 17 (5.9%) | 21 (7.8%) |
| 60 to 64 Years | 31 (10.8%) | 20 (7.4%) |
| 65 to 69 Years | 17 (5.9%) | 28 (10.4%) |
| 70 to 74 Years | 12 (4.2%) | 9 (3.3%) |
| 75 to 79 Years | 12 (4.2%) | 12 (4.4%) |
| 80 to 84 Years | 2 (0.7%) | 4 (1.5%) |
| 85 Years and over | 13 (4.5%) | 22 (8.2%) |
| Total | 288 (100.0%) | 270 (100.0%) |
Families and Households in Rivergrove
Median Family Size in Rivergrove
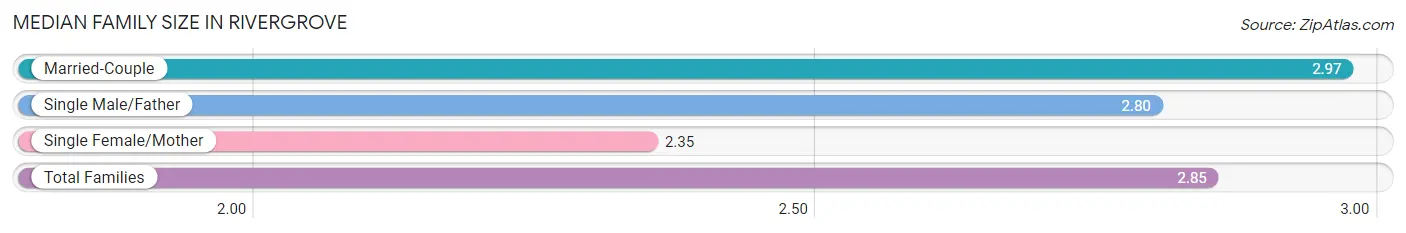
The median family size in Rivergrove is 2.85 persons per family, with married-couple families (131 | 76.2%) accounting for the largest median family size of 2.97 persons per family. On the other hand, single female/mother families (31 | 18.0%) represent the smallest median family size with 2.35 persons per family.
| Family Type | # Families | Family Size |
| Married-Couple | 131 (76.2%) | 2.97 |
| Single Male/Father | 10 (5.8%) | 2.80 |
| Single Female/Mother | 31 (18.0%) | 2.35 |
| Total Families | 172 (100.0%) | 2.85 |
Median Household Size in Rivergrove
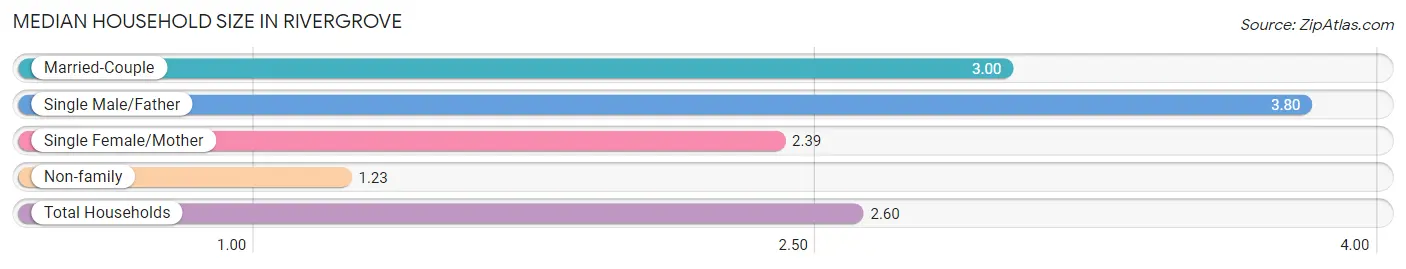
The median household size in Rivergrove is 2.60 persons per household, with single male/father households (10 | 4.6%) accounting for the largest median household size of 3.8 persons per household. non-family households (43 | 20.0%) represent the smallest median household size with 1.23 persons per household.
| Household Type | # Households | Household Size |
| Married-Couple | 131 (60.9%) | 3.00 |
| Single Male/Father | 10 (4.6%) | 3.80 |
| Single Female/Mother | 31 (14.4%) | 2.39 |
| Non-family | 43 (20.0%) | 1.23 |
| Total Households | 215 (100.0%) | 2.60 |
Household Size by Marriage Status in Rivergrove
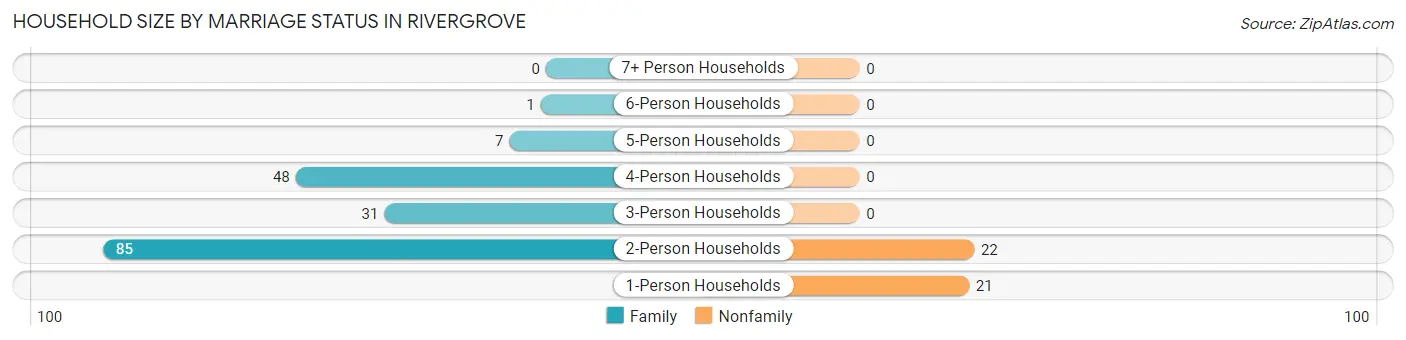
Out of a total of 215 households in Rivergrove, 172 (80.0%) are family households, while 43 (20.0%) are nonfamily households. The most numerous type of family households are 2-person households, comprising 85, and the most common type of nonfamily households are 2-person households, comprising 22.
| Household Size | Family Households | Nonfamily Households |
| 1-Person Households | - | 21 (9.8%) |
| 2-Person Households | 85 (39.5%) | 22 (10.2%) |
| 3-Person Households | 31 (14.4%) | 0 (0.0%) |
| 4-Person Households | 48 (22.3%) | 0 (0.0%) |
| 5-Person Households | 7 (3.3%) | 0 (0.0%) |
| 6-Person Households | 1 (0.5%) | 0 (0.0%) |
| 7+ Person Households | 0 (0.0%) | 0 (0.0%) |
| Total | 172 (80.0%) | 43 (20.0%) |
Female Fertility in Rivergrove
Fertility by Age in Rivergrove
| Age Bracket | Women with Births | Births / 1,000 Women |
| 15 to 19 years | 0 (0.0%) | 0.0 |
| 20 to 34 years | 0 (0.0%) | 0.0 |
| 35 to 50 years | 0 (0.0%) | 0.0 |
| Total | 0 (0.0%) | 0.0 |
Fertility by Age by Marriage Status in Rivergrove
| Age Bracket | Married | Unmarried |
| 15 to 19 years | 0 (0.0%) | 0 (0.0%) |
| 20 to 34 years | 0 (0.0%) | 0 (0.0%) |
| 35 to 50 years | 0 (0.0%) | 0 (0.0%) |
| Total | 0 (0.0%) | 0 (0.0%) |
Fertility by Education in Rivergrove
| Educational Attainment | Women with Births | Births / 1,000 Women |
| Less than High School | 0 (0.0%) | 0.0 |
| High School Diploma | 0 (0.0%) | 0.0 |
| College or Associate's Degree | 0 (0.0%) | 0.0 |
| Bachelor's Degree | 0 (0.0%) | 0.0 |
| Graduate Degree | 0 (0.0%) | 0.0 |
| Total | 0 (0.0%) | 0.0 |
Fertility by Education by Marriage Status in Rivergrove
| Educational Attainment | Married | Unmarried |
| Less than High School | 0 (0.0%) | 0 (0.0%) |
| High School Diploma | 0 (0.0%) | 0 (0.0%) |
| College or Associate's Degree | 0 (0.0%) | 0 (0.0%) |
| Bachelor's Degree | 0 (0.0%) | 0 (0.0%) |
| Graduate Degree | 0 (0.0%) | 0 (0.0%) |
| Total | 0 (0.0%) | 0 (0.0%) |
Income in Rivergrove
Income Overview in Rivergrove
Per Capita Income in Rivergrove is $77,494, while median incomes of families and households are $161,875 and $173,750 respectively.
| Characteristic | Number | Measure |
| Per Capita Income | 558 | $77,494 |
| Median Family Income | 172 | $161,875 |
| Mean Family Income | 172 | $218,908 |
| Median Household Income | 215 | $173,750 |
| Mean Household Income | 215 | $211,703 |
| Income Deficit | 172 | $0 |
| Wage / Income Gap (%) | 558 | 34.73% |
| Wage / Income Gap ($) | 558 | 65.27¢ per $1 |
| Gini / Inequality Index | 558 | 0.42 |
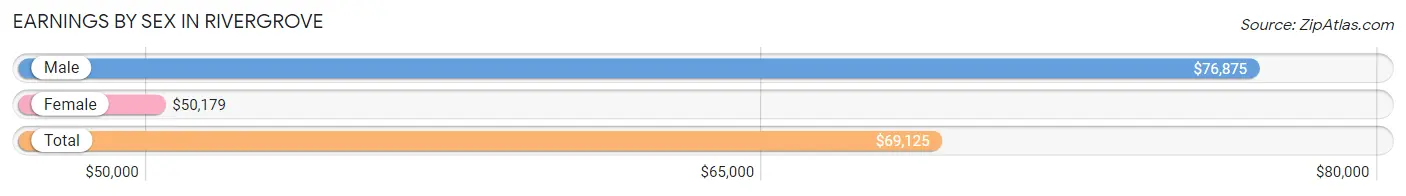
Earnings by Sex in Rivergrove
Average Earnings in Rivergrove are $69,125, $76,875 for men and $50,179 for women, a difference of 34.7%.
| Sex | Number | Average Earnings |
| Male | 163 (58.6%) | $76,875 |
| Female | 115 (41.4%) | $50,179 |
| Total | 278 (100.0%) | $69,125 |
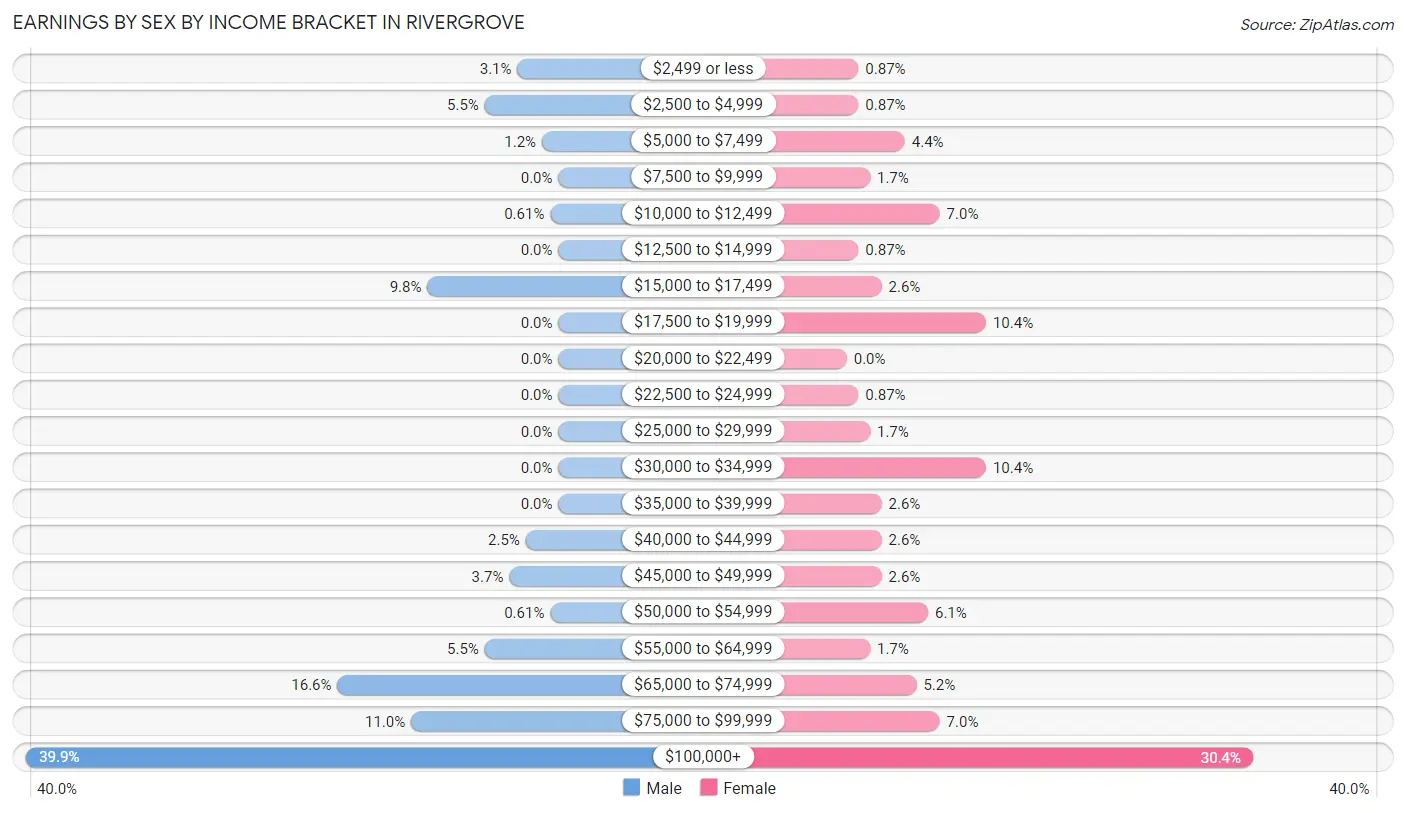
Earnings by Sex by Income Bracket in Rivergrove
The most common earnings brackets in Rivergrove are $100,000+ for men (65 | 39.9%) and $100,000+ for women (35 | 30.4%).
| Income | Male | Female |
| $2,499 or less | 5 (3.1%) | 1 (0.9%) |
| $2,500 to $4,999 | 9 (5.5%) | 1 (0.9%) |
| $5,000 to $7,499 | 2 (1.2%) | 5 (4.3%) |
| $7,500 to $9,999 | 0 (0.0%) | 2 (1.7%) |
| $10,000 to $12,499 | 1 (0.6%) | 8 (7.0%) |
| $12,500 to $14,999 | 0 (0.0%) | 1 (0.9%) |
| $15,000 to $17,499 | 16 (9.8%) | 3 (2.6%) |
| $17,500 to $19,999 | 0 (0.0%) | 12 (10.4%) |
| $20,000 to $22,499 | 0 (0.0%) | 0 (0.0%) |
| $22,500 to $24,999 | 0 (0.0%) | 1 (0.9%) |
| $25,000 to $29,999 | 0 (0.0%) | 2 (1.7%) |
| $30,000 to $34,999 | 0 (0.0%) | 12 (10.4%) |
| $35,000 to $39,999 | 0 (0.0%) | 3 (2.6%) |
| $40,000 to $44,999 | 4 (2.5%) | 3 (2.6%) |
| $45,000 to $49,999 | 6 (3.7%) | 3 (2.6%) |
| $50,000 to $54,999 | 1 (0.6%) | 7 (6.1%) |
| $55,000 to $64,999 | 9 (5.5%) | 2 (1.7%) |
| $65,000 to $74,999 | 27 (16.6%) | 6 (5.2%) |
| $75,000 to $99,999 | 18 (11.0%) | 8 (7.0%) |
| $100,000+ | 65 (39.9%) | 35 (30.4%) |
| Total | 163 (100.0%) | 115 (100.0%) |
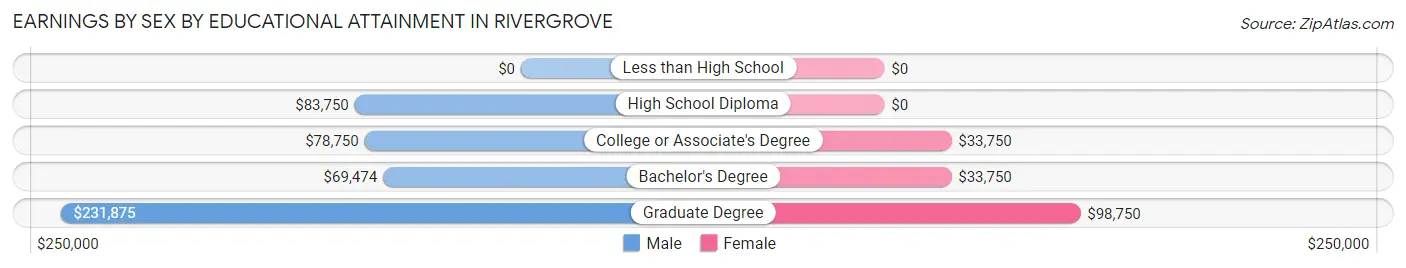
Earnings by Sex by Educational Attainment in Rivergrove
Average earnings in Rivergrove are $86,250 for men and $51,071 for women, a difference of 40.8%. Men with an educational attainment of graduate degree enjoy the highest average annual earnings of $231,875, while those with bachelor's degree education earn the least with $69,474. Women with an educational attainment of graduate degree earn the most with the average annual earnings of $98,750, while those with college or associate's degree education have the smallest earnings of $33,750.
| Educational Attainment | Male Income | Female Income |
| Less than High School | - | - |
| High School Diploma | $83,750 | $0 |
| College or Associate's Degree | $78,750 | $33,750 |
| Bachelor's Degree | $69,474 | $33,750 |
| Graduate Degree | $231,875 | $98,750 |
| Total | $86,250 | $51,071 |
Family Income in Rivergrove
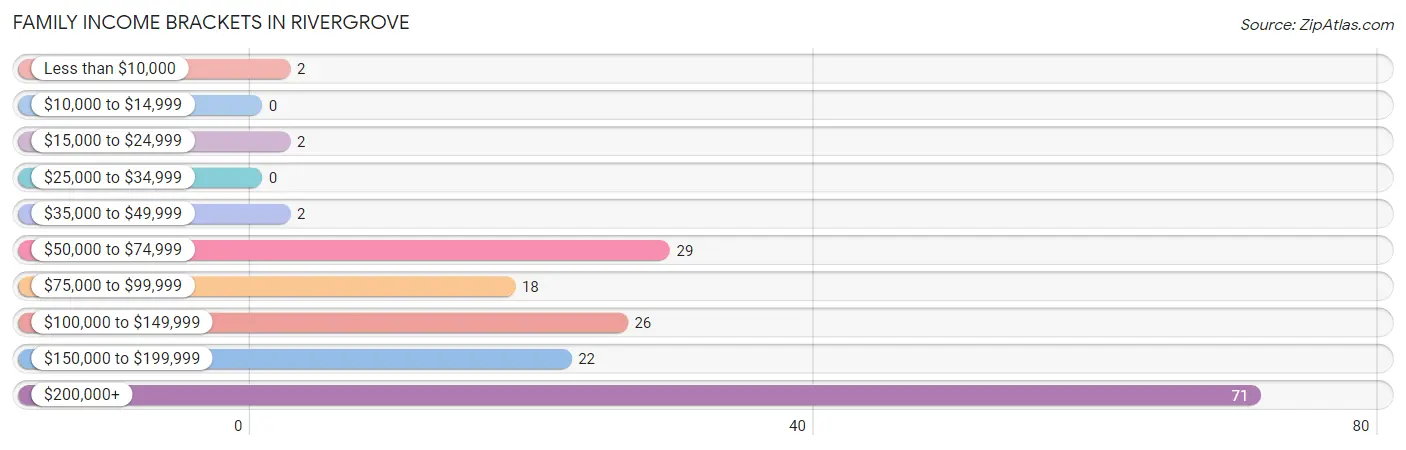
Family Income Brackets in Rivergrove
According to the Rivergrove family income data, there are 71 families falling into the $200,000+ income range, which is the most common income bracket and makes up 41.3% of all families.
| Income Bracket | # Families | % Families |
| Less than $10,000 | 2 | 1.2% |
| $10,000 to $14,999 | 0 | 0.0% |
| $15,000 to $24,999 | 2 | 1.2% |
| $25,000 to $34,999 | 0 | 0.0% |
| $35,000 to $49,999 | 2 | 1.2% |
| $50,000 to $74,999 | 29 | 16.9% |
| $75,000 to $99,999 | 18 | 10.5% |
| $100,000 to $149,999 | 26 | 15.1% |
| $150,000 to $199,999 | 22 | 12.8% |
| $200,000+ | 71 | 41.3% |
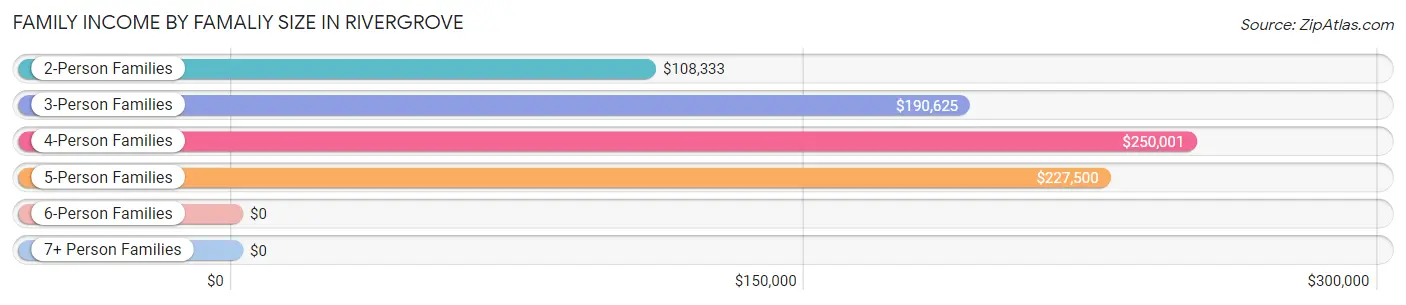
Family Income by Famaliy Size in Rivergrove
4-person families (46 | 26.7%) account for the highest median family income in Rivergrove with $250,001 per family, while 3-person families (23 | 13.4%) have the highest median income of $63,542 per family member.
| Income Bracket | # Families | Median Income |
| 2-Person Families | 96 (55.8%) | $108,333 |
| 3-Person Families | 23 (13.4%) | $190,625 |
| 4-Person Families | 46 (26.7%) | $250,001 |
| 5-Person Families | 6 (3.5%) | $227,500 |
| 6-Person Families | 1 (0.6%) | $0 |
| 7+ Person Families | 0 (0.0%) | $0 |
| Total | 172 (100.0%) | $161,875 |
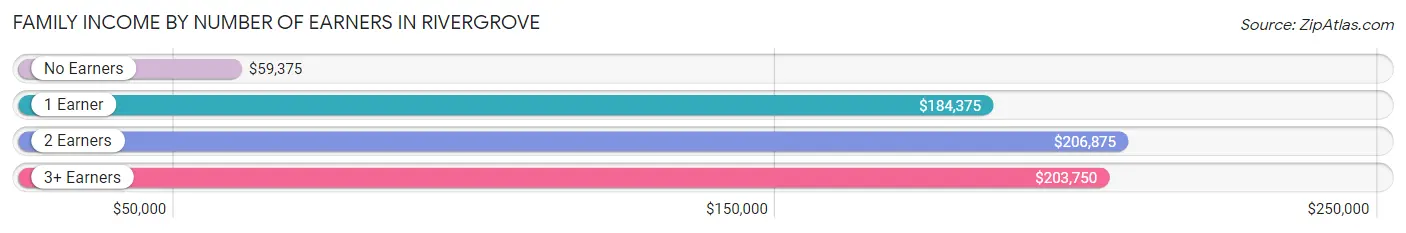
Family Income by Number of Earners in Rivergrove
The median family income in Rivergrove is $161,875, with families comprising 2 earners (72) having the highest median family income of $206,875, while families with no earners (40) have the lowest median family income of $59,375, accounting for 41.9% and 23.3% of families, respectively.
| Number of Earners | # Families | Median Income |
| No Earners | 40 (23.3%) | $59,375 |
| 1 Earner | 49 (28.5%) | $184,375 |
| 2 Earners | 72 (41.9%) | $206,875 |
| 3+ Earners | 11 (6.4%) | $203,750 |
| Total | 172 (100.0%) | $161,875 |
Household Income in Rivergrove
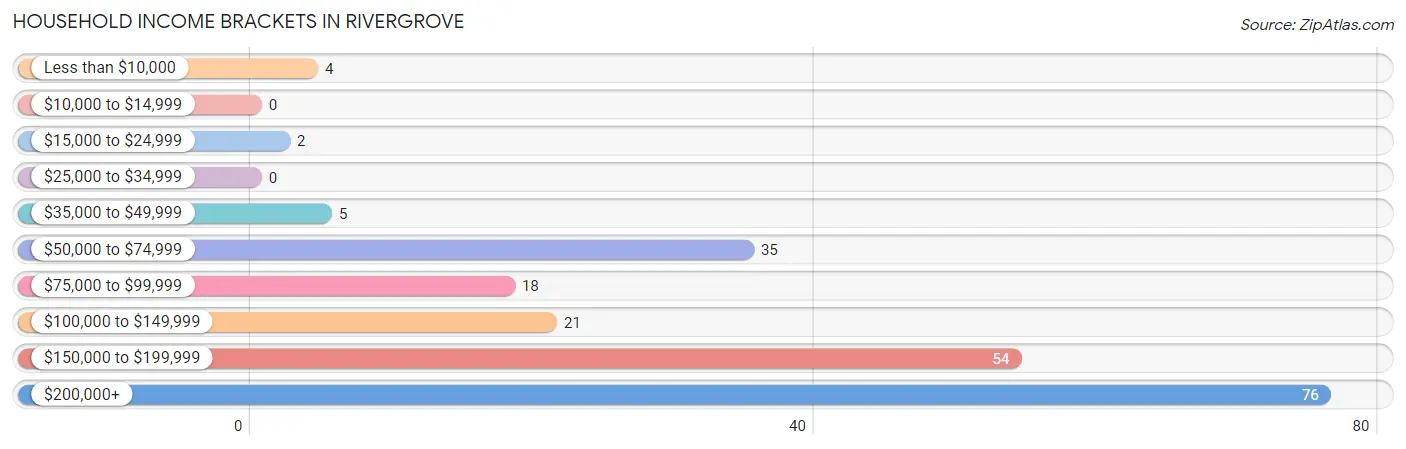
Household Income Brackets in Rivergrove
With 76 households falling in the category, the $200,000+ income range is the most frequent in Rivergrove, accounting for 35.3% of all households.
| Income Bracket | # Households | % Households |
| Less than $10,000 | 4 | 1.9% |
| $10,000 to $14,999 | 0 | 0.0% |
| $15,000 to $24,999 | 2 | 0.9% |
| $25,000 to $34,999 | 0 | 0.0% |
| $35,000 to $49,999 | 5 | 2.3% |
| $50,000 to $74,999 | 35 | 16.3% |
| $75,000 to $99,999 | 18 | 8.4% |
| $100,000 to $149,999 | 21 | 9.8% |
| $150,000 to $199,999 | 54 | 25.1% |
| $200,000+ | 76 | 35.3% |
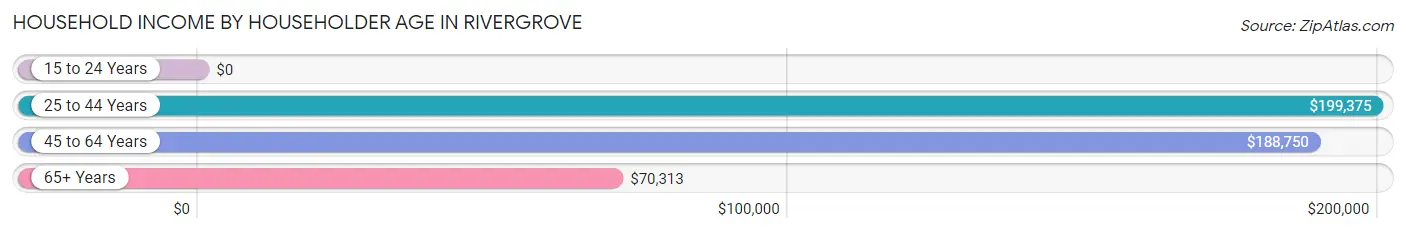
Household Income by Householder Age in Rivergrove
The median household income in Rivergrove is $173,750, with the highest median household income of $199,375 found in the 25 to 44 years age bracket for the primary householder. A total of 49 households (22.8%) fall into this category.
| Income Bracket | # Households | Median Income |
| 15 to 24 Years | 0 (0.0%) | $0 |
| 25 to 44 Years | 49 (22.8%) | $199,375 |
| 45 to 64 Years | 95 (44.2%) | $188,750 |
| 65+ Years | 71 (33.0%) | $70,313 |
| Total | 215 (100.0%) | $173,750 |
Poverty in Rivergrove
Income Below Poverty by Sex and Age in Rivergrove
With 1.4% poverty level for males and 5.2% for females among the residents of Rivergrove, 75 year old and over males and under 5 year old females are the most vulnerable to poverty, with 2 males (7.4%) and 2 females (22.2%) in their respective age groups living below the poverty level.
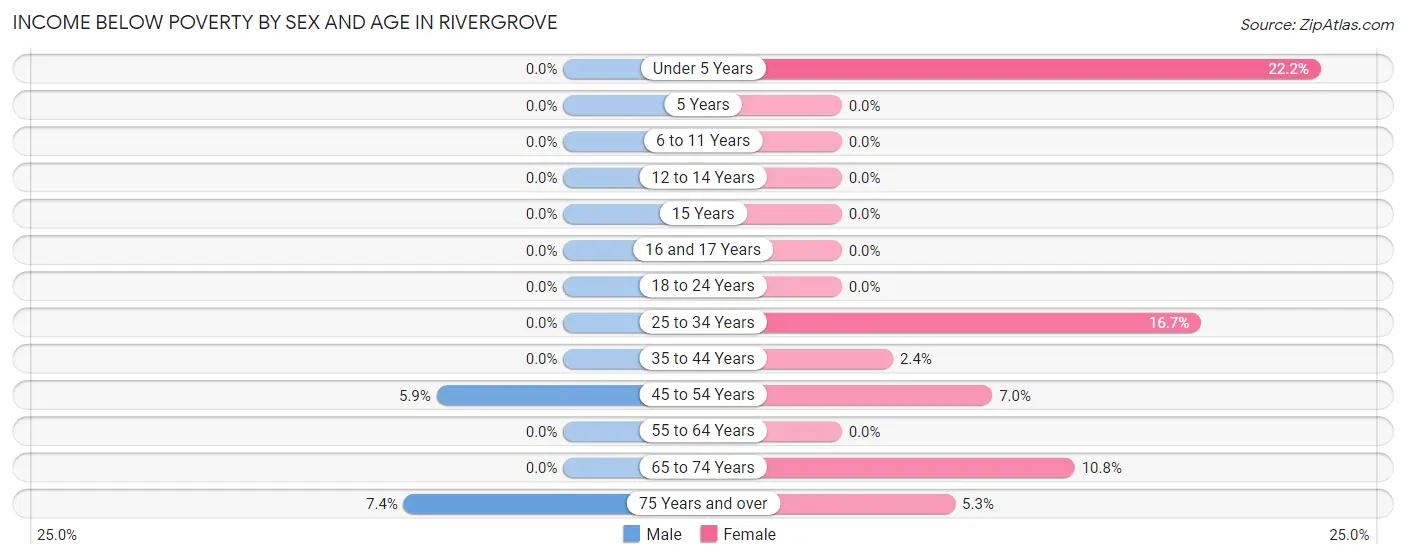
| Age Bracket | Male | Female |
| Under 5 Years | 0 (0.0%) | 2 (22.2%) |
| 5 Years | 0 (0.0%) | 0 (0.0%) |
| 6 to 11 Years | 0 (0.0%) | 0 (0.0%) |
| 12 to 14 Years | 0 (0.0%) | 0 (0.0%) |
| 15 Years | 0 (0.0%) | 0 (0.0%) |
| 16 and 17 Years | 0 (0.0%) | 0 (0.0%) |
| 18 to 24 Years | 0 (0.0%) | 0 (0.0%) |
| 25 to 34 Years | 0 (0.0%) | 2 (16.7%) |
| 35 to 44 Years | 0 (0.0%) | 1 (2.4%) |
| 45 to 54 Years | 2 (5.9%) | 3 (7.0%) |
| 55 to 64 Years | 0 (0.0%) | 0 (0.0%) |
| 65 to 74 Years | 0 (0.0%) | 4 (10.8%) |
| 75 Years and over | 2 (7.4%) | 2 (5.3%) |
| Total | 4 (1.4%) | 14 (5.2%) |
Income Above Poverty by Sex and Age in Rivergrove
According to the poverty statistics in Rivergrove, males aged under 5 years and females aged 5 years are the age groups that are most secure financially, with 100.0% of males and 100.0% of females in these age groups living above the poverty line.
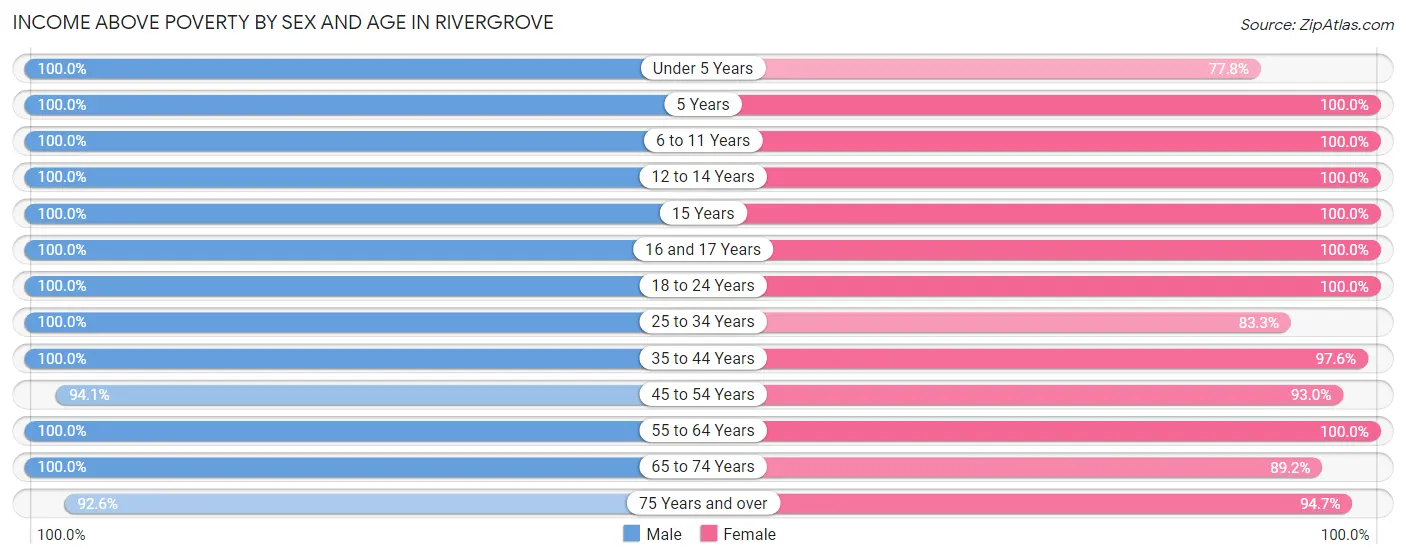
| Age Bracket | Male | Female |
| Under 5 Years | 5 (100.0%) | 7 (77.8%) |
| 5 Years | 5 (100.0%) | 4 (100.0%) |
| 6 to 11 Years | 30 (100.0%) | 16 (100.0%) |
| 12 to 14 Years | 28 (100.0%) | 6 (100.0%) |
| 15 Years | 2 (100.0%) | 2 (100.0%) |
| 16 and 17 Years | 3 (100.0%) | 3 (100.0%) |
| 18 to 24 Years | 32 (100.0%) | 16 (100.0%) |
| 25 to 34 Years | 8 (100.0%) | 10 (83.3%) |
| 35 to 44 Years | 37 (100.0%) | 41 (97.6%) |
| 45 to 54 Years | 32 (94.1%) | 40 (93.0%) |
| 55 to 64 Years | 48 (100.0%) | 41 (100.0%) |
| 65 to 74 Years | 29 (100.0%) | 33 (89.2%) |
| 75 Years and over | 25 (92.6%) | 36 (94.7%) |
| Total | 284 (98.6%) | 255 (94.8%) |
Income Below Poverty Among Married-Couple Families in Rivergrove
The poverty statistics for married-couple families in Rivergrove show that 3.0% or 4 of the total 131 families live below the poverty line. Families with 1 or 2 children have the highest poverty rate of 4.1%, comprising of 2 families. On the other hand, families with 3 or 4 children have the lowest poverty rate of 0.0%, which includes 0 families.
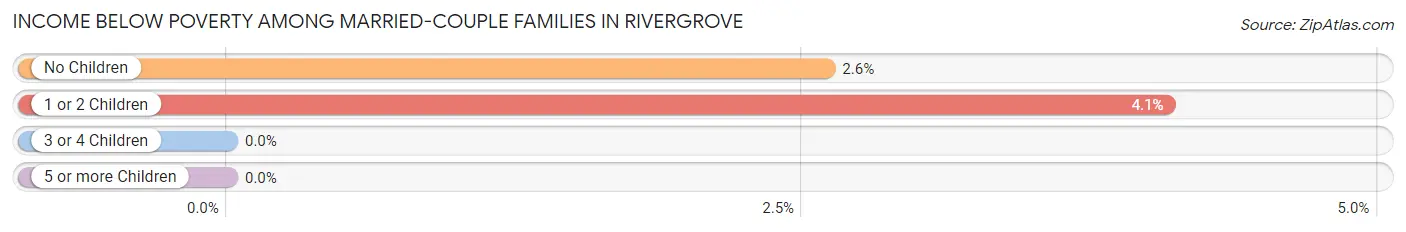
| Children | Above Poverty | Below Poverty |
| No Children | 75 (97.4%) | 2 (2.6%) |
| 1 or 2 Children | 47 (95.9%) | 2 (4.1%) |
| 3 or 4 Children | 5 (100.0%) | 0 (0.0%) |
| 5 or more Children | 0 (0.0%) | 0 (0.0%) |
| Total | 127 (97.0%) | 4 (3.0%) |
Income Below Poverty Among Single-Parent Households in Rivergrove
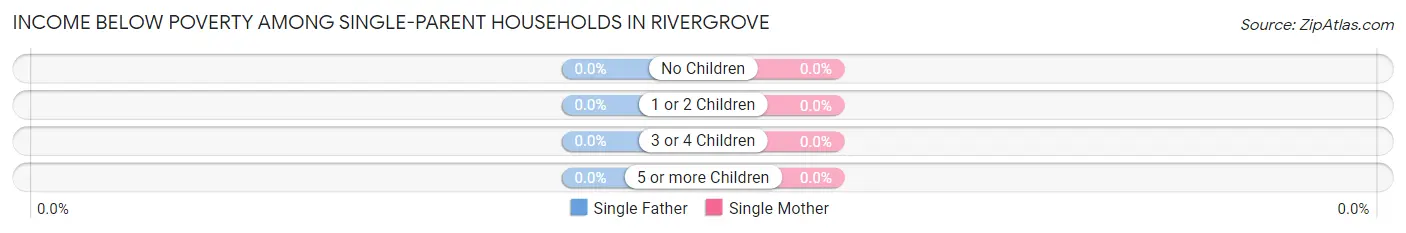
| Children | Single Father | Single Mother |
| No Children | 0 (0.0%) | 0 (0.0%) |
| 1 or 2 Children | 0 (0.0%) | 0 (0.0%) |
| 3 or 4 Children | 0 (0.0%) | 0 (0.0%) |
| 5 or more Children | 0 (0.0%) | 0 (0.0%) |
| Total | 0 (0.0%) | 0 (0.0%) |
Income Below Poverty Among Married-Couple vs Single-Parent Households in Rivergrove
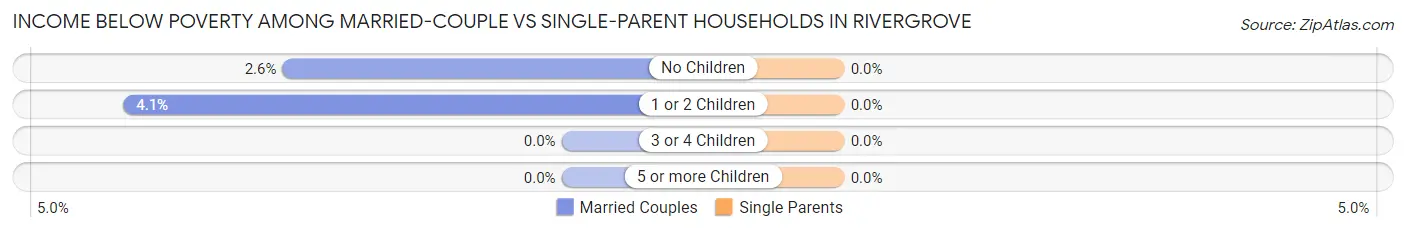
| Children | Married-Couple Families | Single-Parent Households |
| No Children | 2 (2.6%) | 0 (0.0%) |
| 1 or 2 Children | 2 (4.1%) | 0 (0.0%) |
| 3 or 4 Children | 0 (0.0%) | 0 (0.0%) |
| 5 or more Children | 0 (0.0%) | 0 (0.0%) |
| Total | 4 (3.0%) | 0 (0.0%) |
Employment Characteristics in Rivergrove
Employment by Class of Employer in Rivergrove
Among the 239 employed individuals in Rivergrove, private company employees (124 | 51.9%), local government employees (33 | 13.8%), and self-employed (not incorporated) (25 | 10.5%) make up the most common classes of employment.
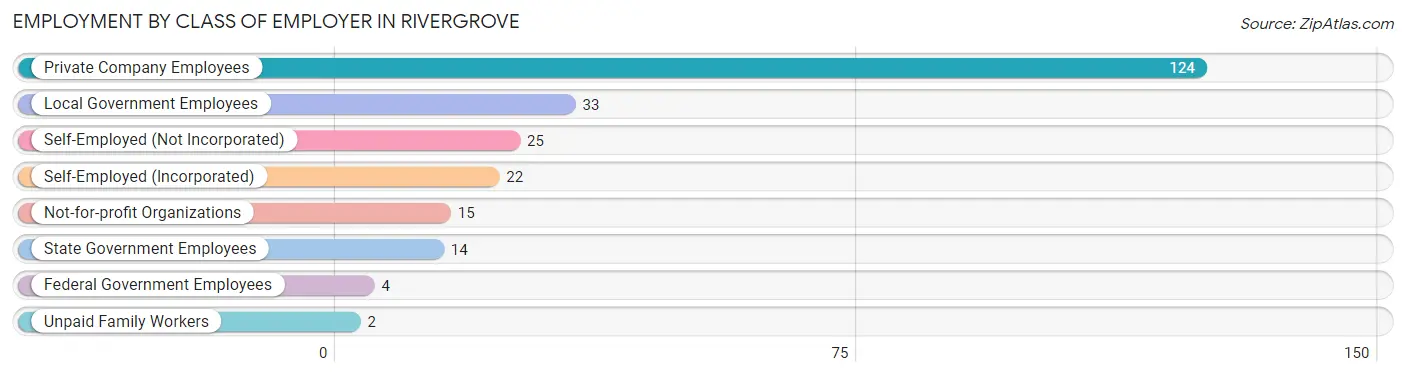
| Employer Class | # Employees | % Employees |
| Private Company Employees | 124 | 51.9% |
| Self-Employed (Incorporated) | 22 | 9.2% |
| Self-Employed (Not Incorporated) | 25 | 10.5% |
| Not-for-profit Organizations | 15 | 6.3% |
| Local Government Employees | 33 | 13.8% |
| State Government Employees | 14 | 5.9% |
| Federal Government Employees | 4 | 1.7% |
| Unpaid Family Workers | 2 | 0.8% |
| Total | 239 | 100.0% |
Employment Status by Age in Rivergrove
According to the labor force statistics for Rivergrove, out of the total population over 16 years of age (450), 59.1% or 266 individuals are in the labor force, with 9.4% or 25 of them unemployed. The age group with the highest labor force participation rate is 30 to 34 years, with 100.0% or 7 individuals in the labor force. Within the labor force, the 20 to 24 years age range has the highest percentage of unemployed individuals, with 66.7% or 16 of them being unemployed.
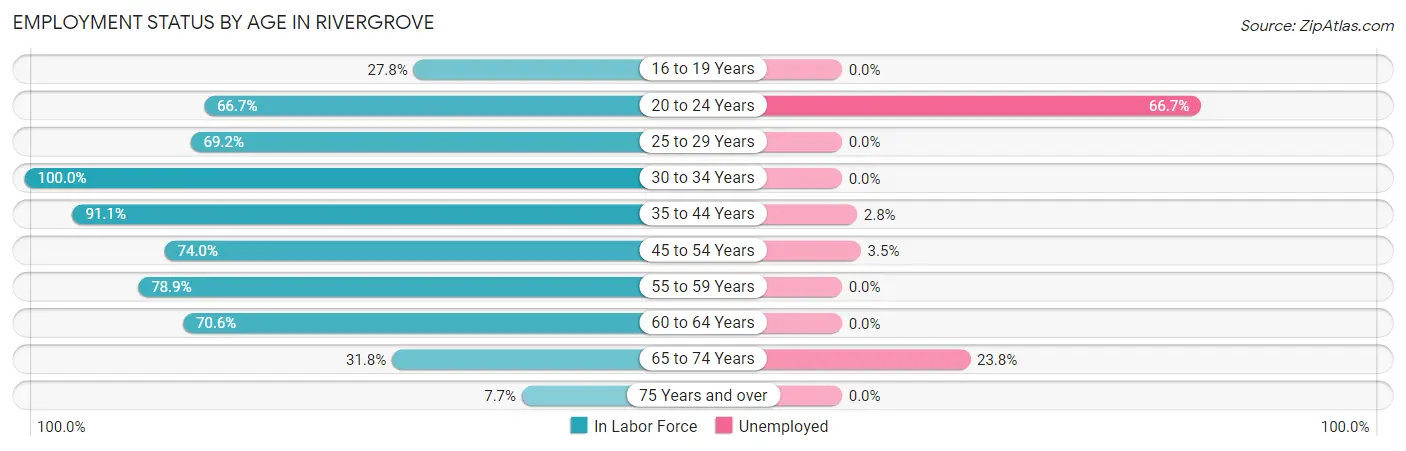
| Age Bracket | In Labor Force | Unemployed |
| 16 to 19 Years | 5 (27.8%) | 0 (0.0%) |
| 20 to 24 Years | 24 (66.7%) | 16 (66.7%) |
| 25 to 29 Years | 9 (69.2%) | 0 (0.0%) |
| 30 to 34 Years | 7 (100.0%) | 0 (0.0%) |
| 35 to 44 Years | 72 (91.1%) | 2 (2.8%) |
| 45 to 54 Years | 57 (74.0%) | 2 (3.5%) |
| 55 to 59 Years | 30 (78.9%) | 0 (0.0%) |
| 60 to 64 Years | 36 (70.6%) | 0 (0.0%) |
| 65 to 74 Years | 21 (31.8%) | 5 (23.8%) |
| 75 Years and over | 5 (7.7%) | 0 (0.0%) |
| Total | 266 (59.1%) | 25 (9.4%) |
Employment Status by Educational Attainment in Rivergrove
According to labor force statistics for Rivergrove, 79.6% of individuals (211) out of the total population between 25 and 64 years of age (265) are in the labor force, with 1.9% or 4 of them being unemployed. The group with the highest labor force participation rate are those with the educational attainment of college / associate degree, with 89.6% or 43 individuals in the labor force. Within the labor force, individuals with bachelor's degree or higher education have the highest percentage of unemployment, with 2.5% or 4 of them being unemployed.
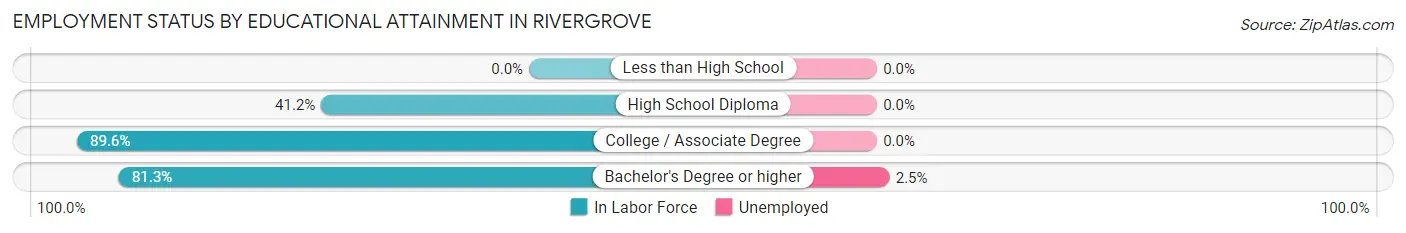
| Educational Attainment | In Labor Force | Unemployed |
| Less than High School | 0 (0.0%) | 0 (0.0%) |
| High School Diploma | 7 (41.2%) | 0 (0.0%) |
| College / Associate Degree | 43 (89.6%) | 0 (0.0%) |
| Bachelor's Degree or higher | 161 (81.3%) | 5 (2.5%) |
| Total | 211 (79.6%) | 5 (1.9%) |
Employment Occupations by Sex in Rivergrove
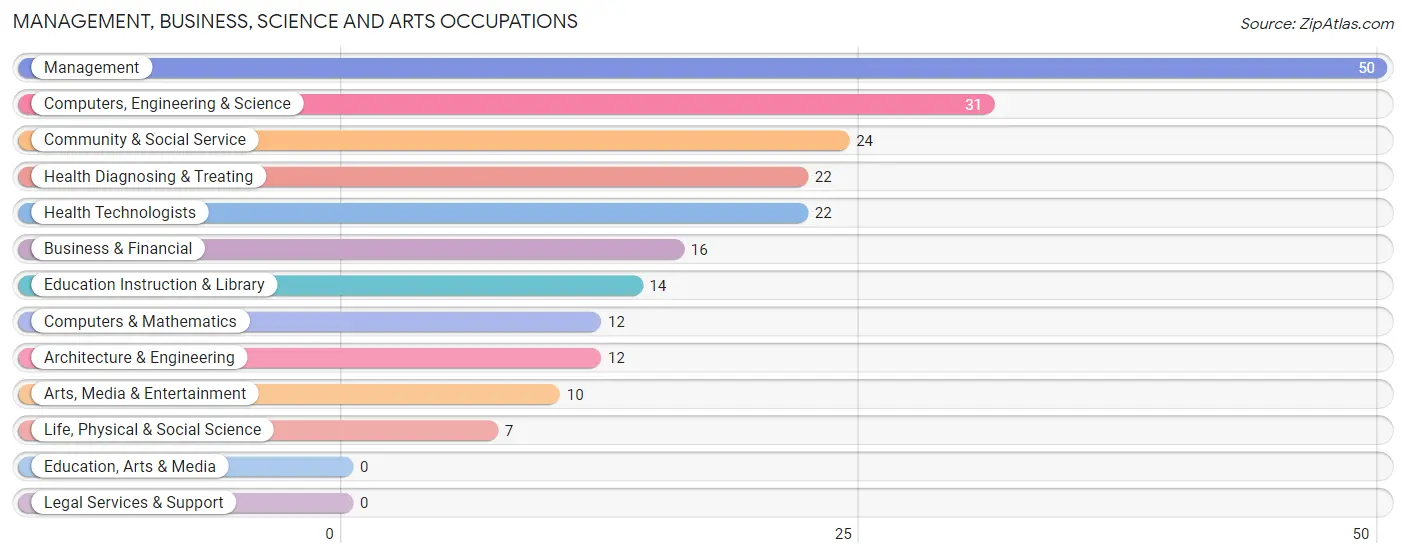
Management, Business, Science and Arts Occupations
The most common Management, Business, Science and Arts occupations in Rivergrove are Management (50 | 20.7%), Computers, Engineering & Science (31 | 12.9%), Community & Social Service (24 | 10.0%), Health Diagnosing & Treating (22 | 9.1%), and Health Technologists (22 | 9.1%).
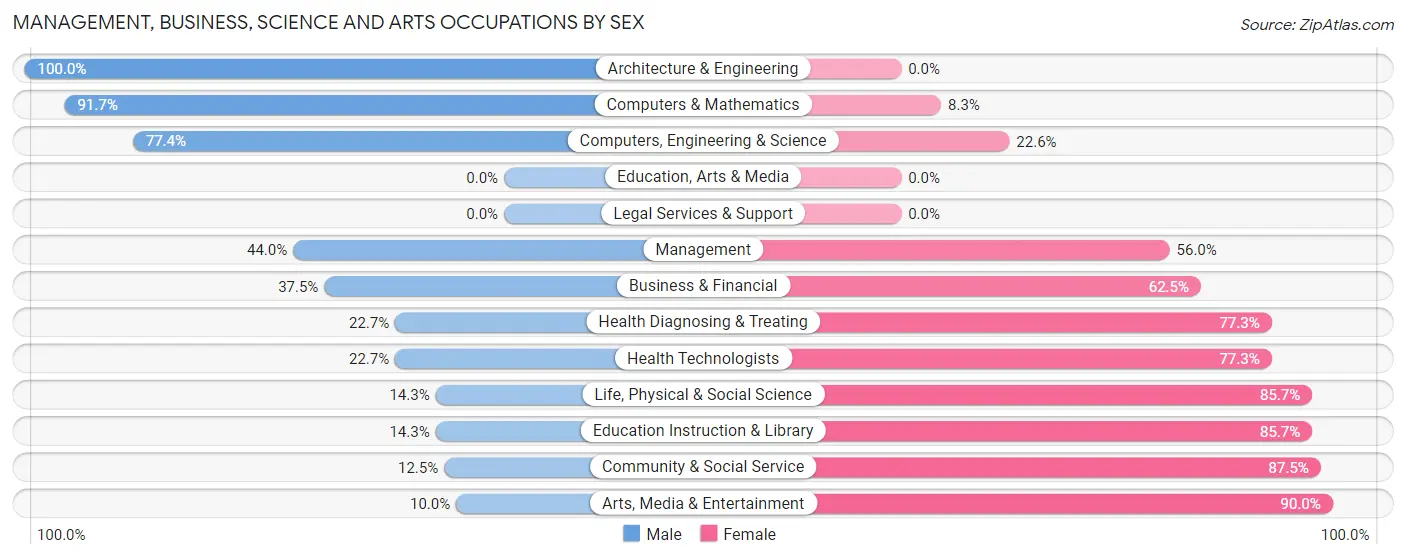
Management, Business, Science and Arts Occupations by Sex
Within the Management, Business, Science and Arts occupations in Rivergrove, the most male-oriented occupations are Architecture & Engineering (100.0%), Computers & Mathematics (91.7%), and Computers, Engineering & Science (77.4%), while the most female-oriented occupations are Arts, Media & Entertainment (90.0%), Community & Social Service (87.5%), and Life, Physical & Social Science (85.7%).
| Occupation | Male | Female |
| Management | 22 (44.0%) | 28 (56.0%) |
| Business & Financial | 6 (37.5%) | 10 (62.5%) |
| Computers, Engineering & Science | 24 (77.4%) | 7 (22.6%) |
| Computers & Mathematics | 11 (91.7%) | 1 (8.3%) |
| Architecture & Engineering | 12 (100.0%) | 0 (0.0%) |
| Life, Physical & Social Science | 1 (14.3%) | 6 (85.7%) |
| Community & Social Service | 3 (12.5%) | 21 (87.5%) |
| Education, Arts & Media | 0 (0.0%) | 0 (0.0%) |
| Legal Services & Support | 0 (0.0%) | 0 (0.0%) |
| Education Instruction & Library | 2 (14.3%) | 12 (85.7%) |
| Arts, Media & Entertainment | 1 (10.0%) | 9 (90.0%) |
| Health Diagnosing & Treating | 5 (22.7%) | 17 (77.3%) |
| Health Technologists | 5 (22.7%) | 17 (77.3%) |
| Total (Category) | 60 (42.0%) | 83 (58.0%) |
| Total (Overall) | 131 (54.4%) | 110 (45.6%) |
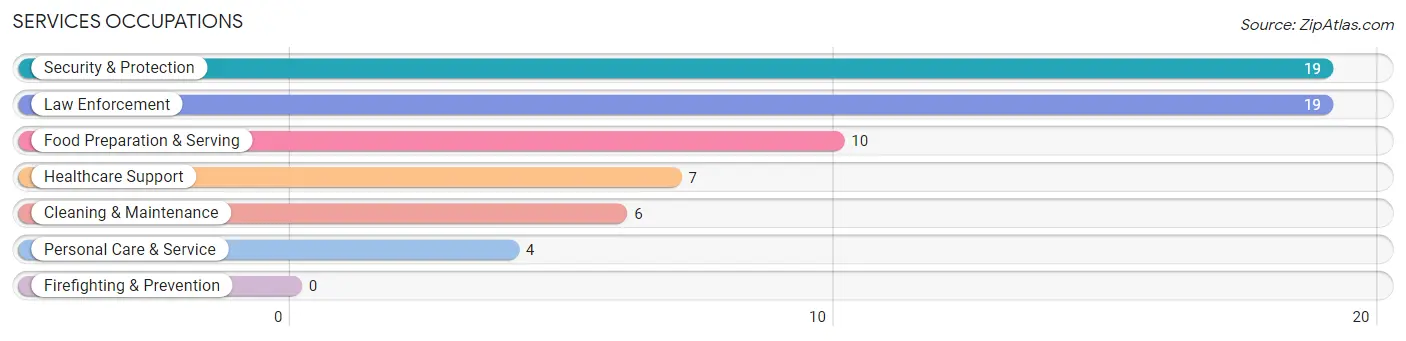
Services Occupations
The most common Services occupations in Rivergrove are Security & Protection (19 | 7.9%), Law Enforcement (19 | 7.9%), Food Preparation & Serving (10 | 4.2%), Healthcare Support (7 | 2.9%), and Cleaning & Maintenance (6 | 2.5%).
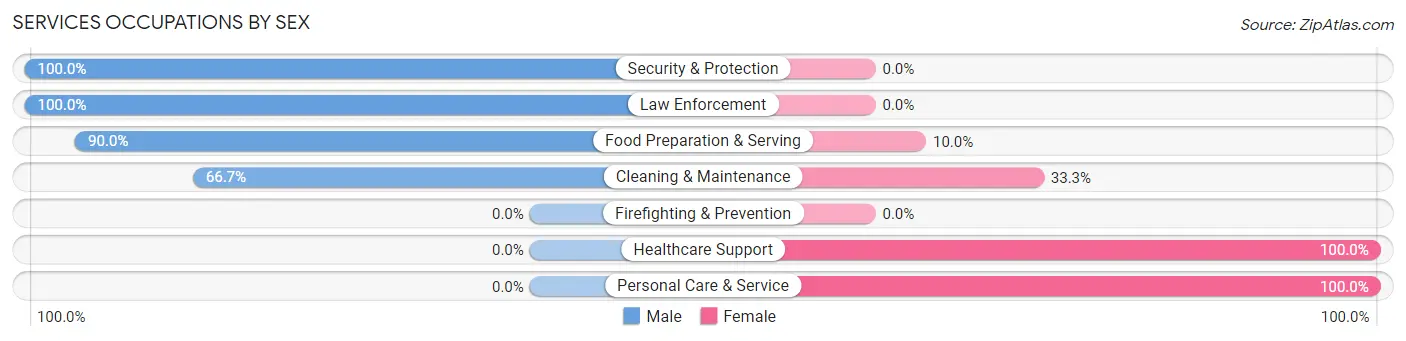
Services Occupations by Sex
Within the Services occupations in Rivergrove, the most male-oriented occupations are Security & Protection (100.0%), Law Enforcement (100.0%), and Food Preparation & Serving (90.0%), while the most female-oriented occupations are Healthcare Support (100.0%), Personal Care & Service (100.0%), and Cleaning & Maintenance (33.3%).
| Occupation | Male | Female |
| Healthcare Support | 0 (0.0%) | 7 (100.0%) |
| Security & Protection | 19 (100.0%) | 0 (0.0%) |
| Firefighting & Prevention | 0 (0.0%) | 0 (0.0%) |
| Law Enforcement | 19 (100.0%) | 0 (0.0%) |
| Food Preparation & Serving | 9 (90.0%) | 1 (10.0%) |
| Cleaning & Maintenance | 4 (66.7%) | 2 (33.3%) |
| Personal Care & Service | 0 (0.0%) | 4 (100.0%) |
| Total (Category) | 32 (69.6%) | 14 (30.4%) |
| Total (Overall) | 131 (54.4%) | 110 (45.6%) |
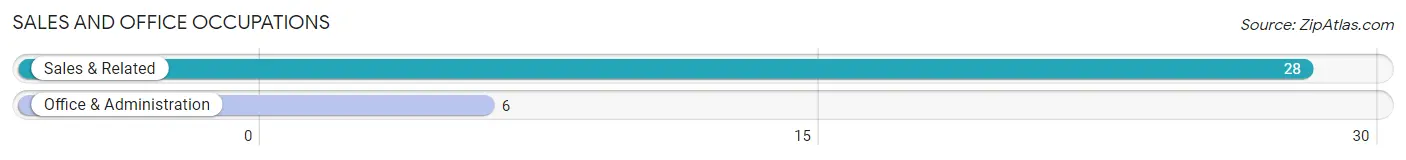
Sales and Office Occupations
The most common Sales and Office occupations in Rivergrove are Sales & Related (28 | 11.6%), and Office & Administration (6 | 2.5%).
Sales and Office Occupations by Sex
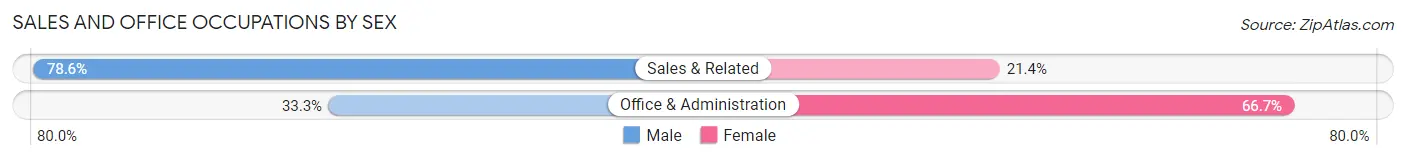
| Occupation | Male | Female |
| Sales & Related | 22 (78.6%) | 6 (21.4%) |
| Office & Administration | 2 (33.3%) | 4 (66.7%) |
| Total (Category) | 24 (70.6%) | 10 (29.4%) |
| Total (Overall) | 131 (54.4%) | 110 (45.6%) |
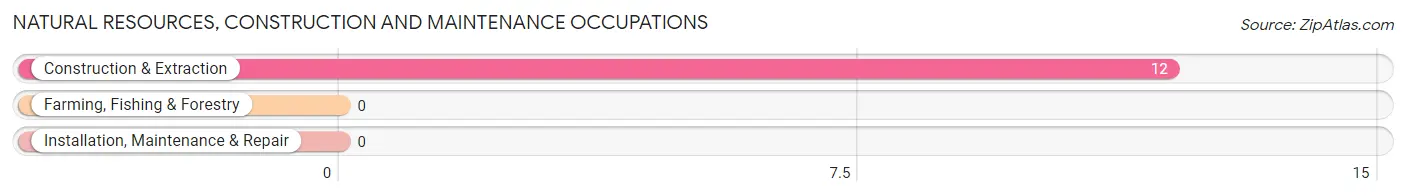
Natural Resources, Construction and Maintenance Occupations
The most common Natural Resources, Construction and Maintenance occupations in Rivergrove are , and Construction & Extraction (12 | 5.0%).
Natural Resources, Construction and Maintenance Occupations by Sex
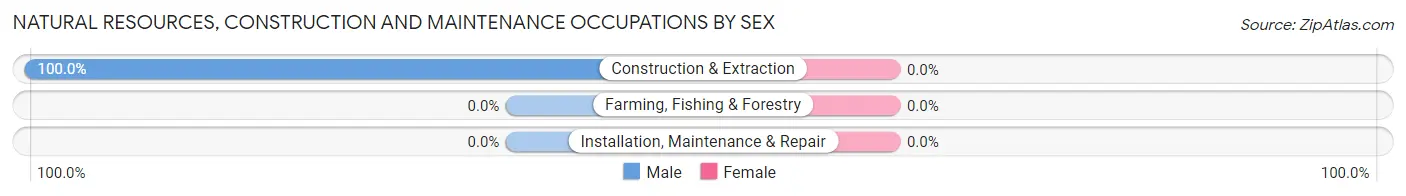
| Occupation | Male | Female |
| Farming, Fishing & Forestry | 0 (0.0%) | 0 (0.0%) |
| Construction & Extraction | 12 (100.0%) | 0 (0.0%) |
| Installation, Maintenance & Repair | 0 (0.0%) | 0 (0.0%) |
| Total (Category) | 12 (100.0%) | 0 (0.0%) |
| Total (Overall) | 131 (54.4%) | 110 (45.6%) |
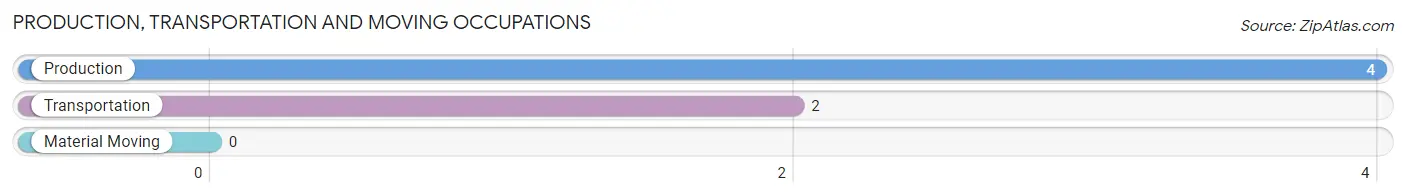
Production, Transportation and Moving Occupations
The most common Production, Transportation and Moving occupations in Rivergrove are Production (4 | 1.7%), and Transportation (2 | 0.8%).
Production, Transportation and Moving Occupations by Sex
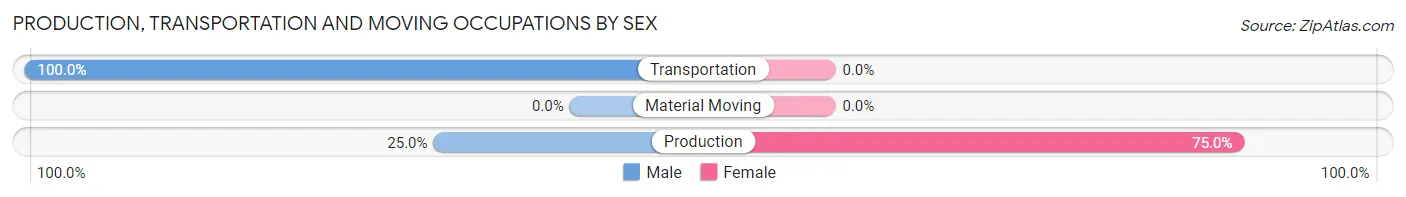
| Occupation | Male | Female |
| Production | 1 (25.0%) | 3 (75.0%) |
| Transportation | 2 (100.0%) | 0 (0.0%) |
| Material Moving | 0 (0.0%) | 0 (0.0%) |
| Total (Category) | 3 (50.0%) | 3 (50.0%) |
| Total (Overall) | 131 (54.4%) | 110 (45.6%) |
Employment Industries by Sex in Rivergrove
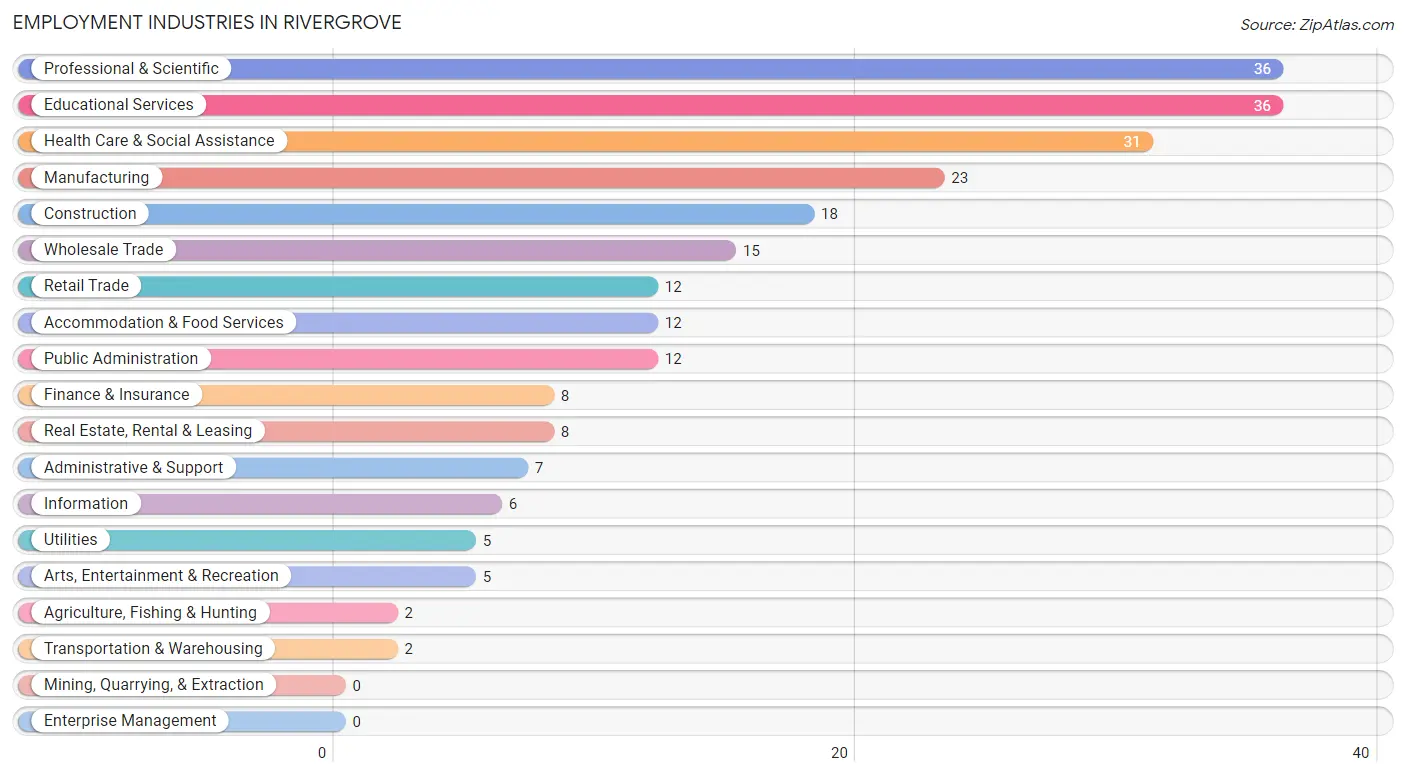
Employment Industries in Rivergrove
The major employment industries in Rivergrove include Professional & Scientific (36 | 14.9%), Educational Services (36 | 14.9%), Health Care & Social Assistance (31 | 12.9%), Manufacturing (23 | 9.5%), and Construction (18 | 7.5%).
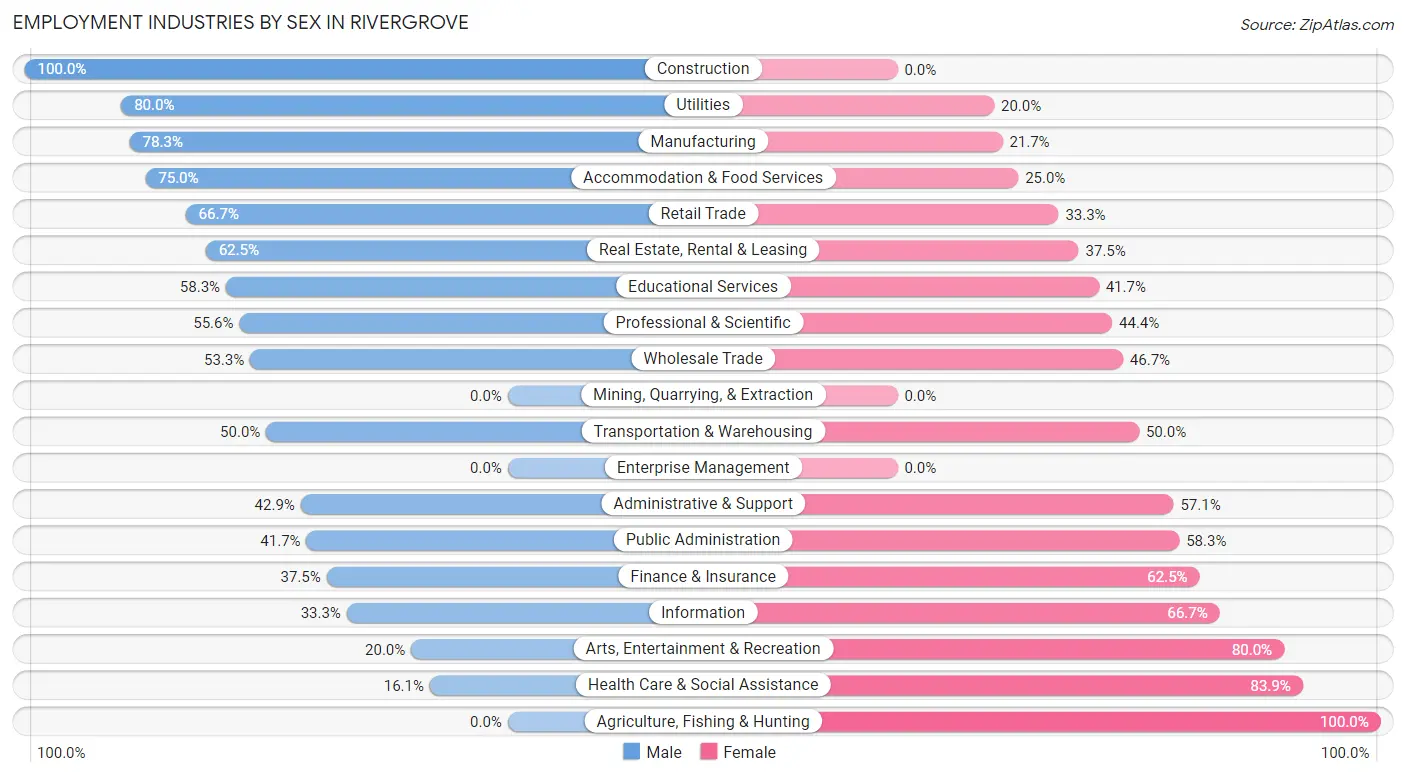
Employment Industries by Sex in Rivergrove
The Rivergrove industries that see more men than women are Construction (100.0%), Utilities (80.0%), and Manufacturing (78.3%), whereas the industries that tend to have a higher number of women are Agriculture, Fishing & Hunting (100.0%), Health Care & Social Assistance (83.9%), and Arts, Entertainment & Recreation (80.0%).
| Industry | Male | Female |
| Agriculture, Fishing & Hunting | 0 (0.0%) | 2 (100.0%) |
| Mining, Quarrying, & Extraction | 0 (0.0%) | 0 (0.0%) |
| Construction | 18 (100.0%) | 0 (0.0%) |
| Manufacturing | 18 (78.3%) | 5 (21.7%) |
| Wholesale Trade | 8 (53.3%) | 7 (46.7%) |
| Retail Trade | 8 (66.7%) | 4 (33.3%) |
| Transportation & Warehousing | 1 (50.0%) | 1 (50.0%) |
| Utilities | 4 (80.0%) | 1 (20.0%) |
| Information | 2 (33.3%) | 4 (66.7%) |
| Finance & Insurance | 3 (37.5%) | 5 (62.5%) |
| Real Estate, Rental & Leasing | 5 (62.5%) | 3 (37.5%) |
| Professional & Scientific | 20 (55.6%) | 16 (44.4%) |
| Enterprise Management | 0 (0.0%) | 0 (0.0%) |
| Administrative & Support | 3 (42.9%) | 4 (57.1%) |
| Educational Services | 21 (58.3%) | 15 (41.7%) |
| Health Care & Social Assistance | 5 (16.1%) | 26 (83.9%) |
| Arts, Entertainment & Recreation | 1 (20.0%) | 4 (80.0%) |
| Accommodation & Food Services | 9 (75.0%) | 3 (25.0%) |
| Public Administration | 5 (41.7%) | 7 (58.3%) |
| Total | 131 (54.4%) | 110 (45.6%) |
Education in Rivergrove
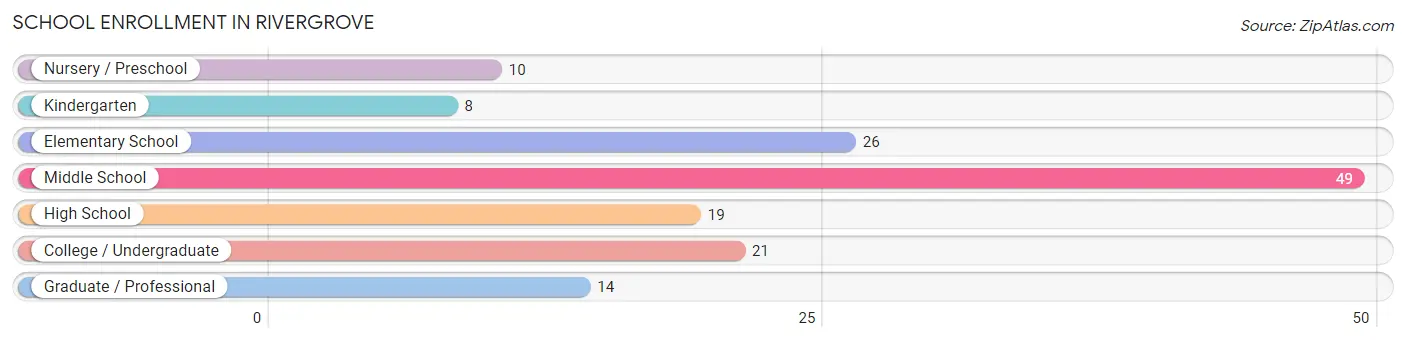
School Enrollment in Rivergrove
The most common levels of schooling among the 147 students in Rivergrove are middle school (49 | 33.3%), elementary school (26 | 17.7%), and college / undergraduate (21 | 14.3%).
| School Level | # Students | % Students |
| Nursery / Preschool | 10 | 6.8% |
| Kindergarten | 8 | 5.4% |
| Elementary School | 26 | 17.7% |
| Middle School | 49 | 33.3% |
| High School | 19 | 12.9% |
| College / Undergraduate | 21 | 14.3% |
| Graduate / Professional | 14 | 9.5% |
| Total | 147 | 100.0% |
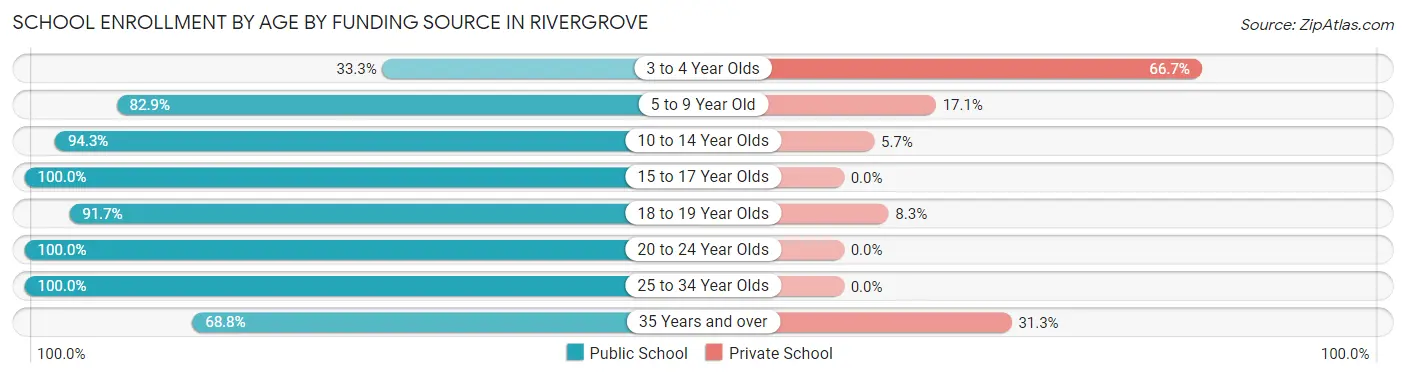
School Enrollment by Age by Funding Source in Rivergrove
Out of a total of 147 students who are enrolled in schools in Rivergrove, 19 (12.9%) attend a private institution, while the remaining 128 (87.1%) are enrolled in public schools. The age group of 3 to 4 year olds has the highest likelihood of being enrolled in private schools, with 4 (66.7% in the age bracket) enrolled. Conversely, the age group of 15 to 17 year olds has the lowest likelihood of being enrolled in a private school, with 10 (100.0% in the age bracket) attending a public institution.
| Age Bracket | Public School | Private School |
| 3 to 4 Year Olds | 2 (33.3%) | 4 (66.7%) |
| 5 to 9 Year Old | 29 (82.9%) | 6 (17.1%) |
| 10 to 14 Year Olds | 50 (94.3%) | 3 (5.7%) |
| 15 to 17 Year Olds | 10 (100.0%) | 0 (0.0%) |
| 18 to 19 Year Olds | 11 (91.7%) | 1 (8.3%) |
| 20 to 24 Year Olds | 12 (100.0%) | 0 (0.0%) |
| 25 to 34 Year Olds | 3 (100.0%) | 0 (0.0%) |
| 35 Years and over | 11 (68.8%) | 5 (31.2%) |
| Total | 128 (87.1%) | 19 (12.9%) |
Educational Attainment by Field of Study in Rivergrove
Business (38 | 12.7%), psychology (30 | 10.0%), social sciences (28 | 9.4%), physical & health sciences (27 | 9.0%), and education (26 | 8.7%) are the most common fields of study among 299 individuals in Rivergrove who have obtained a bachelor's degree or higher.

| Field of Study | # Graduates | % Graduates |
| Computers & Mathematics | 22 | 7.4% |
| Bio, Nature & Agricultural | 23 | 7.7% |
| Physical & Health Sciences | 27 | 9.0% |
| Psychology | 30 | 10.0% |
| Social Sciences | 28 | 9.4% |
| Engineering | 19 | 6.4% |
| Multidisciplinary Studies | 2 | 0.7% |
| Science & Technology | 10 | 3.3% |
| Business | 38 | 12.7% |
| Education | 26 | 8.7% |
| Literature & Languages | 13 | 4.3% |
| Liberal Arts & History | 20 | 6.7% |
| Visual & Performing Arts | 13 | 4.3% |
| Communications | 12 | 4.0% |
| Arts & Humanities | 16 | 5.3% |
| Total | 299 | 100.0% |
Transportation & Commute in Rivergrove
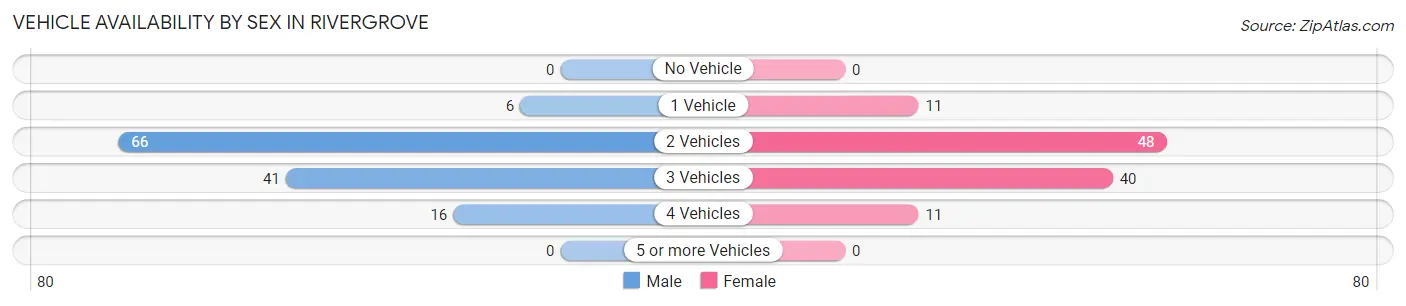
Vehicle Availability by Sex in Rivergrove
The most prevalent vehicle ownership categories in Rivergrove are males with 2 vehicles (66, accounting for 51.2%) and females with 2 vehicles (48, making up 60.0%).
| Vehicles Available | Male | Female |
| No Vehicle | 0 (0.0%) | 0 (0.0%) |
| 1 Vehicle | 6 (4.6%) | 11 (10.0%) |
| 2 Vehicles | 66 (51.2%) | 48 (43.6%) |
| 3 Vehicles | 41 (31.8%) | 40 (36.4%) |
| 4 Vehicles | 16 (12.4%) | 11 (10.0%) |
| 5 or more Vehicles | 0 (0.0%) | 0 (0.0%) |
| Total | 129 (100.0%) | 110 (100.0%) |
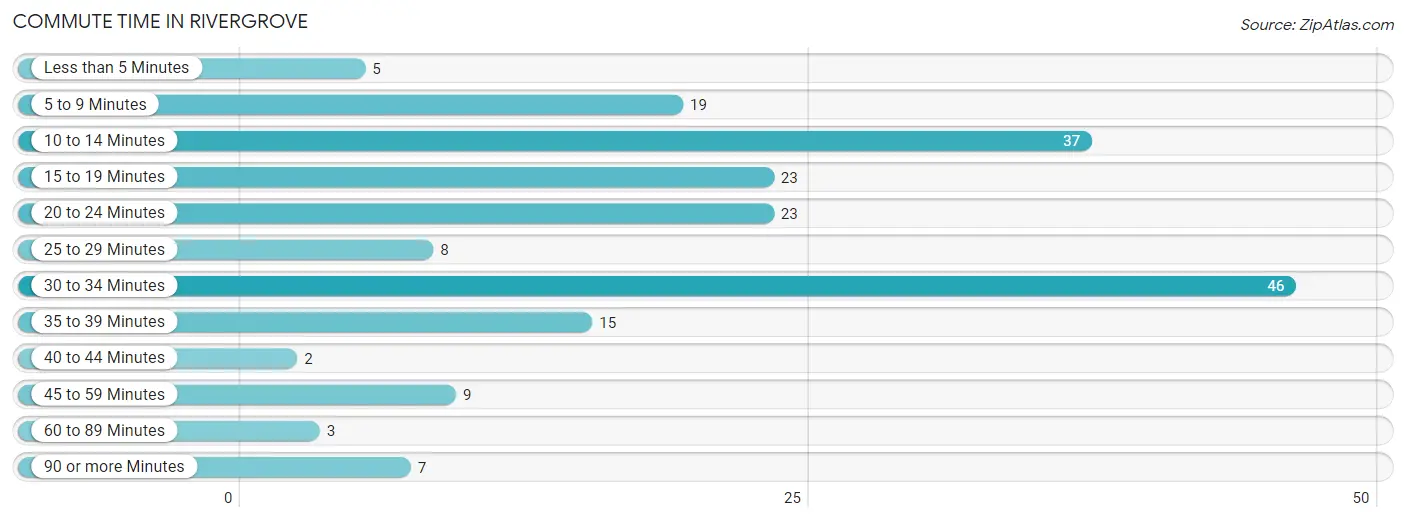
Commute Time in Rivergrove
The most frequently occuring commute durations in Rivergrove are 30 to 34 minutes (46 commuters, 23.4%), 10 to 14 minutes (37 commuters, 18.8%), and 15 to 19 minutes (23 commuters, 11.7%).
| Commute Time | # Commuters | % Commuters |
| Less than 5 Minutes | 5 | 2.5% |
| 5 to 9 Minutes | 19 | 9.6% |
| 10 to 14 Minutes | 37 | 18.8% |
| 15 to 19 Minutes | 23 | 11.7% |
| 20 to 24 Minutes | 23 | 11.7% |
| 25 to 29 Minutes | 8 | 4.1% |
| 30 to 34 Minutes | 46 | 23.4% |
| 35 to 39 Minutes | 15 | 7.6% |
| 40 to 44 Minutes | 2 | 1.0% |
| 45 to 59 Minutes | 9 | 4.6% |
| 60 to 89 Minutes | 3 | 1.5% |
| 90 or more Minutes | 7 | 3.5% |
Commute Time by Sex in Rivergrove
The most common commute times in Rivergrove are 30 to 34 minutes (38 commuters, 36.2%) for males and 10 to 14 minutes (27 commuters, 29.3%) for females.
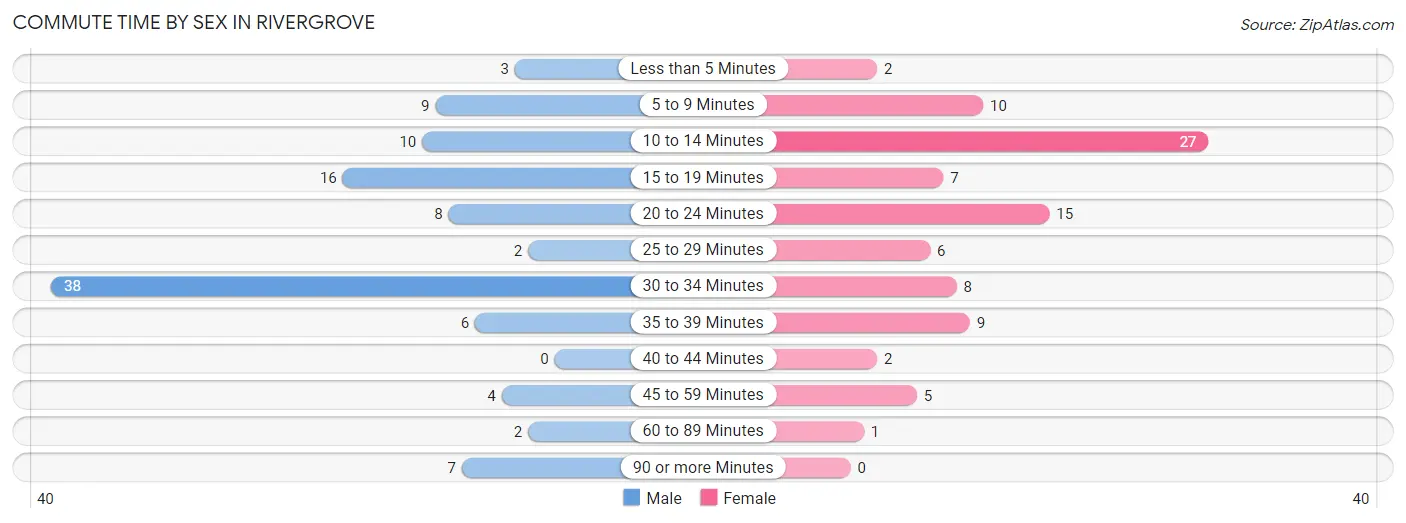
| Commute Time | Male | Female |
| Less than 5 Minutes | 3 (2.9%) | 2 (2.2%) |
| 5 to 9 Minutes | 9 (8.6%) | 10 (10.9%) |
| 10 to 14 Minutes | 10 (9.5%) | 27 (29.3%) |
| 15 to 19 Minutes | 16 (15.2%) | 7 (7.6%) |
| 20 to 24 Minutes | 8 (7.6%) | 15 (16.3%) |
| 25 to 29 Minutes | 2 (1.9%) | 6 (6.5%) |
| 30 to 34 Minutes | 38 (36.2%) | 8 (8.7%) |
| 35 to 39 Minutes | 6 (5.7%) | 9 (9.8%) |
| 40 to 44 Minutes | 0 (0.0%) | 2 (2.2%) |
| 45 to 59 Minutes | 4 (3.8%) | 5 (5.4%) |
| 60 to 89 Minutes | 2 (1.9%) | 1 (1.1%) |
| 90 or more Minutes | 7 (6.7%) | 0 (0.0%) |
Time of Departure to Work by Sex in Rivergrove
The most frequent times of departure to work in Rivergrove are 8:00 AM to 8:29 AM (24, 22.9%) for males and 9:00 AM to 9:59 AM (23, 25.0%) for females.
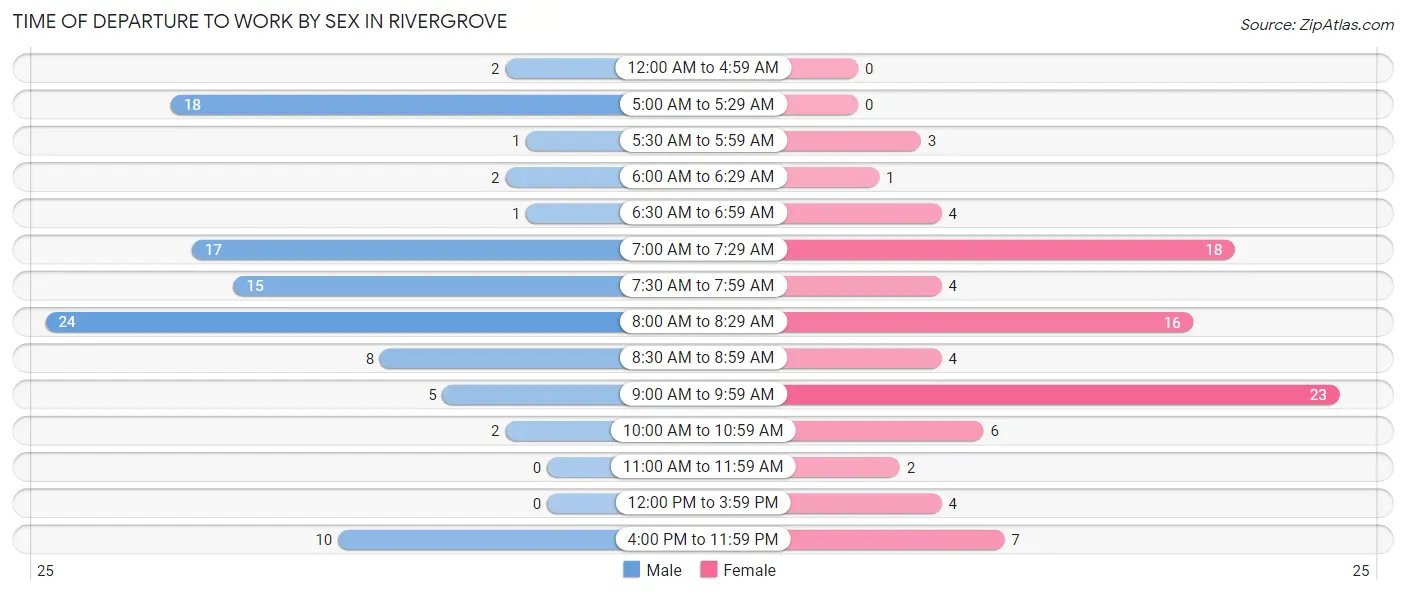
| Time of Departure | Male | Female |
| 12:00 AM to 4:59 AM | 2 (1.9%) | 0 (0.0%) |
| 5:00 AM to 5:29 AM | 18 (17.1%) | 0 (0.0%) |
| 5:30 AM to 5:59 AM | 1 (0.9%) | 3 (3.3%) |
| 6:00 AM to 6:29 AM | 2 (1.9%) | 1 (1.1%) |
| 6:30 AM to 6:59 AM | 1 (0.9%) | 4 (4.3%) |
| 7:00 AM to 7:29 AM | 17 (16.2%) | 18 (19.6%) |
| 7:30 AM to 7:59 AM | 15 (14.3%) | 4 (4.3%) |
| 8:00 AM to 8:29 AM | 24 (22.9%) | 16 (17.4%) |
| 8:30 AM to 8:59 AM | 8 (7.6%) | 4 (4.3%) |
| 9:00 AM to 9:59 AM | 5 (4.8%) | 23 (25.0%) |
| 10:00 AM to 10:59 AM | 2 (1.9%) | 6 (6.5%) |
| 11:00 AM to 11:59 AM | 0 (0.0%) | 2 (2.2%) |
| 12:00 PM to 3:59 PM | 0 (0.0%) | 4 (4.3%) |
| 4:00 PM to 11:59 PM | 10 (9.5%) | 7 (7.6%) |
| Total | 105 (100.0%) | 92 (100.0%) |
Housing Occupancy in Rivergrove
Occupancy by Ownership in Rivergrove
Of the total 215 dwellings in Rivergrove, owner-occupied units account for 194 (90.2%), while renter-occupied units make up 21 (9.8%).
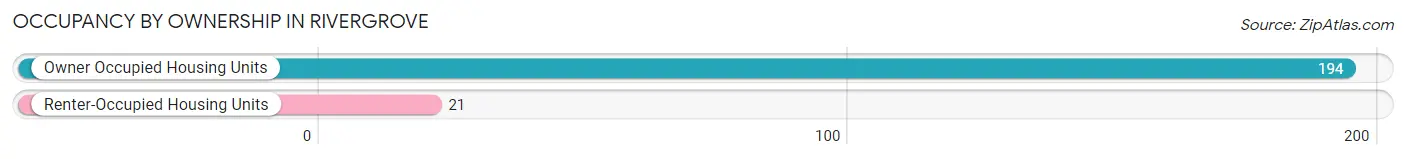
| Occupancy | # Housing Units | % Housing Units |
| Owner Occupied Housing Units | 194 | 90.2% |
| Renter-Occupied Housing Units | 21 | 9.8% |
| Total Occupied Housing Units | 215 | 100.0% |
Occupancy by Household Size in Rivergrove
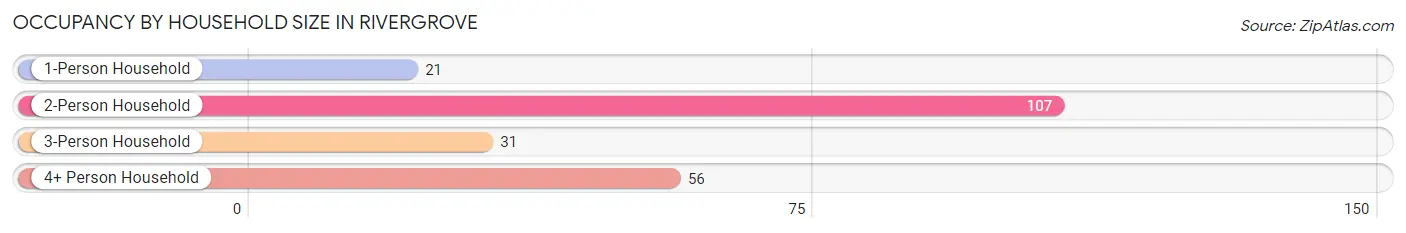
| Household Size | # Housing Units | % Housing Units |
| 1-Person Household | 21 | 9.8% |
| 2-Person Household | 107 | 49.8% |
| 3-Person Household | 31 | 14.4% |
| 4+ Person Household | 56 | 26.1% |
| Total Housing Units | 215 | 100.0% |
Occupancy by Ownership by Household Size in Rivergrove
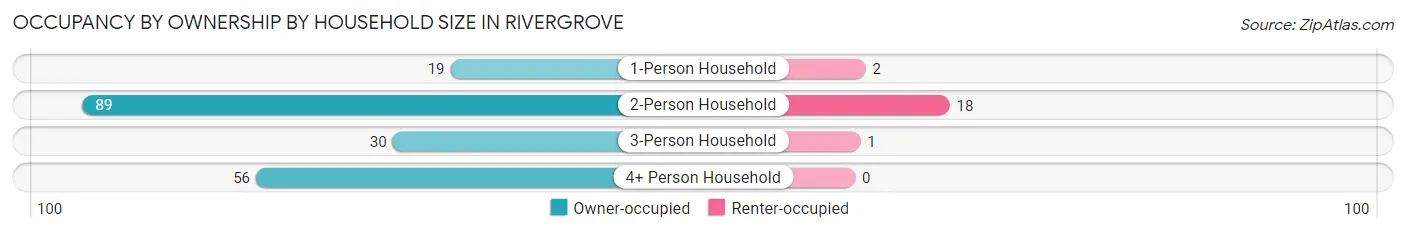
| Household Size | Owner-occupied | Renter-occupied |
| 1-Person Household | 19 (90.5%) | 2 (9.5%) |
| 2-Person Household | 89 (83.2%) | 18 (16.8%) |
| 3-Person Household | 30 (96.8%) | 1 (3.2%) |
| 4+ Person Household | 56 (100.0%) | 0 (0.0%) |
| Total Housing Units | 194 (90.2%) | 21 (9.8%) |
Occupancy by Educational Attainment in Rivergrove
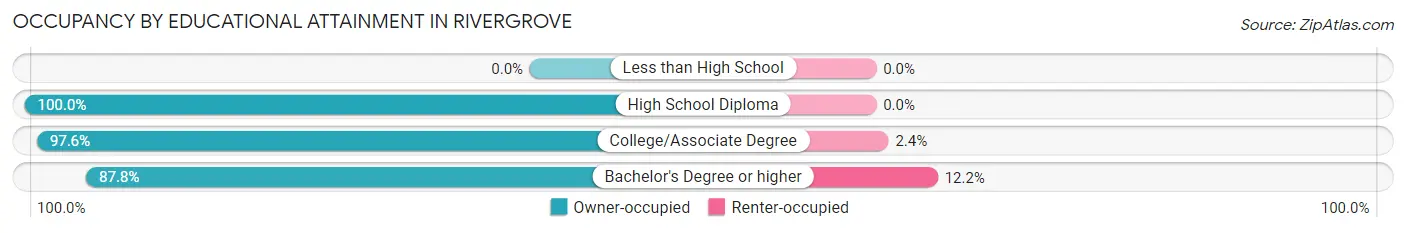
| Household Size | Owner-occupied | Renter-occupied |
| Less than High School | 0 (0.0%) | 0 (0.0%) |
| High School Diploma | 10 (100.0%) | 0 (0.0%) |
| College/Associate Degree | 40 (97.6%) | 1 (2.4%) |
| Bachelor's Degree or higher | 144 (87.8%) | 20 (12.2%) |
Occupancy by Age of Householder in Rivergrove
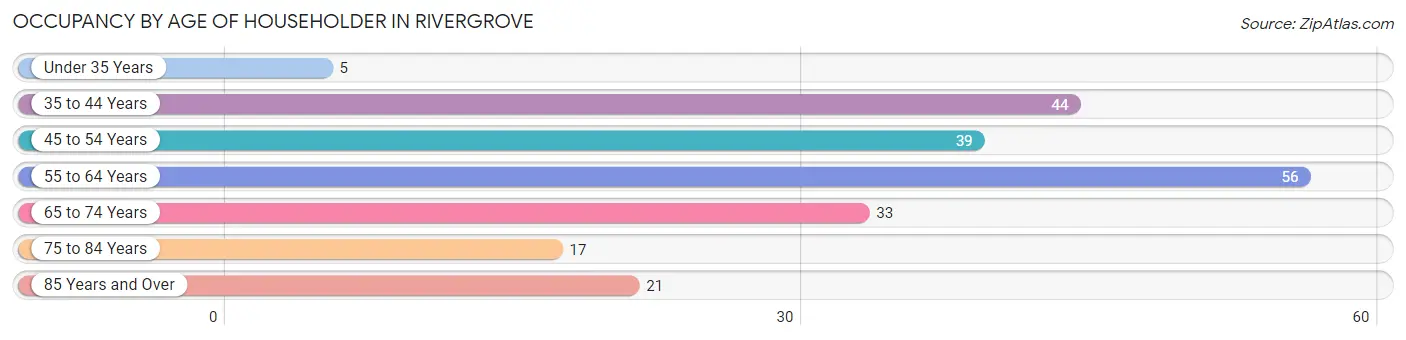
| Age Bracket | # Households | % Households |
| Under 35 Years | 5 | 2.3% |
| 35 to 44 Years | 44 | 20.5% |
| 45 to 54 Years | 39 | 18.1% |
| 55 to 64 Years | 56 | 26.1% |
| 65 to 74 Years | 33 | 15.3% |
| 75 to 84 Years | 17 | 7.9% |
| 85 Years and Over | 21 | 9.8% |
| Total | 215 | 100.0% |
Housing Finances in Rivergrove
Median Income by Occupancy in Rivergrove
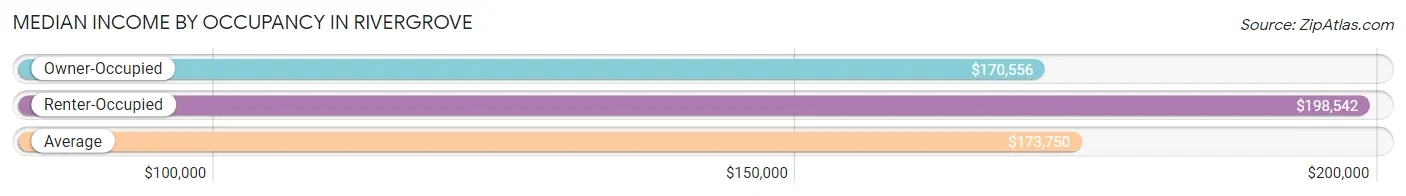
| Occupancy Type | # Households | Median Income |
| Owner-Occupied | 194 (90.2%) | $170,556 |
| Renter-Occupied | 21 (9.8%) | $198,542 |
| Average | 215 (100.0%) | $173,750 |
Occupancy by Householder Income Bracket in Rivergrove
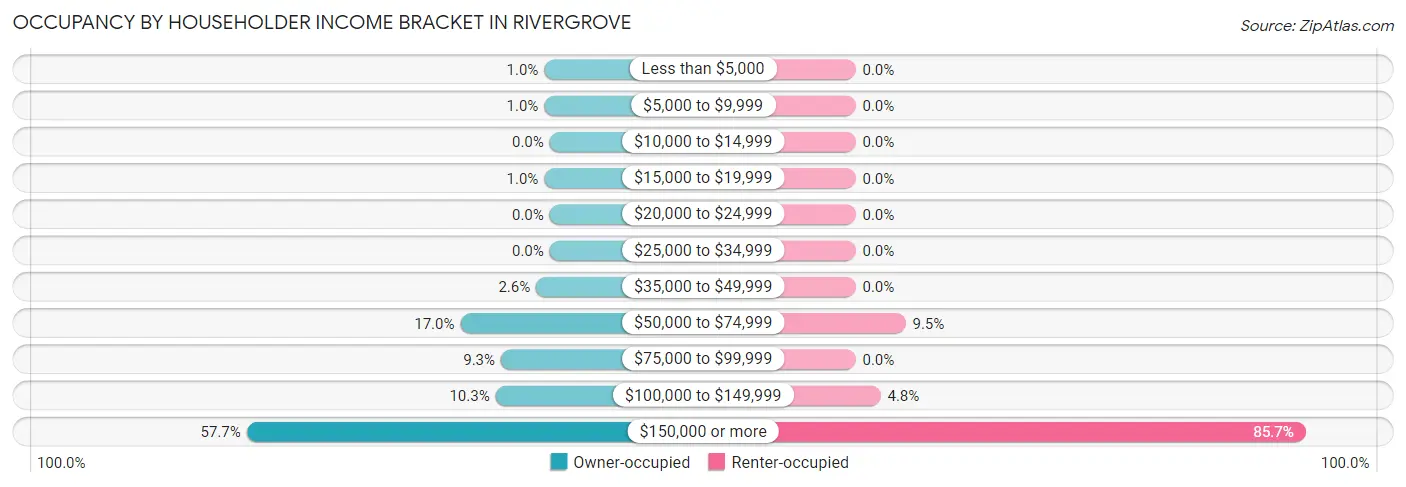
| Income Bracket | Owner-occupied | Renter-occupied |
| Less than $5,000 | 2 (1.0%) | 0 (0.0%) |
| $5,000 to $9,999 | 2 (1.0%) | 0 (0.0%) |
| $10,000 to $14,999 | 0 (0.0%) | 0 (0.0%) |
| $15,000 to $19,999 | 2 (1.0%) | 0 (0.0%) |
| $20,000 to $24,999 | 0 (0.0%) | 0 (0.0%) |
| $25,000 to $34,999 | 0 (0.0%) | 0 (0.0%) |
| $35,000 to $49,999 | 5 (2.6%) | 0 (0.0%) |
| $50,000 to $74,999 | 33 (17.0%) | 2 (9.5%) |
| $75,000 to $99,999 | 18 (9.3%) | 0 (0.0%) |
| $100,000 to $149,999 | 20 (10.3%) | 1 (4.8%) |
| $150,000 or more | 112 (57.7%) | 18 (85.7%) |
| Total | 194 (100.0%) | 21 (100.0%) |
Monthly Housing Cost Tiers in Rivergrove
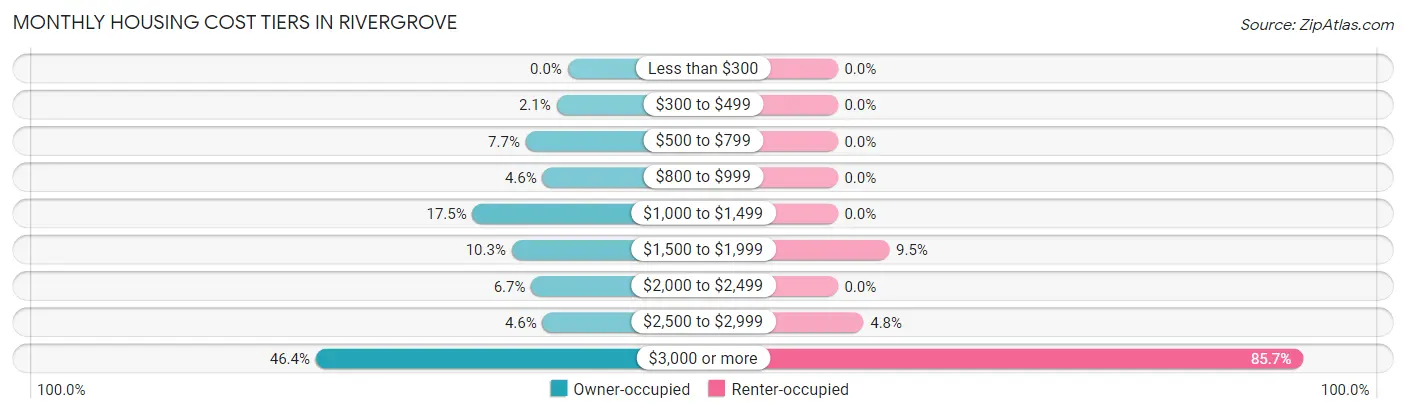
| Monthly Cost | Owner-occupied | Renter-occupied |
| Less than $300 | 0 (0.0%) | 0 (0.0%) |
| $300 to $499 | 4 (2.1%) | 0 (0.0%) |
| $500 to $799 | 15 (7.7%) | 0 (0.0%) |
| $800 to $999 | 9 (4.6%) | 0 (0.0%) |
| $1,000 to $1,499 | 34 (17.5%) | 0 (0.0%) |
| $1,500 to $1,999 | 20 (10.3%) | 2 (9.5%) |
| $2,000 to $2,499 | 13 (6.7%) | 0 (0.0%) |
| $2,500 to $2,999 | 9 (4.6%) | 1 (4.8%) |
| $3,000 or more | 90 (46.4%) | 18 (85.7%) |
| Total | 194 (100.0%) | 21 (100.0%) |
Physical Housing Characteristics in Rivergrove
Housing Structures in Rivergrove
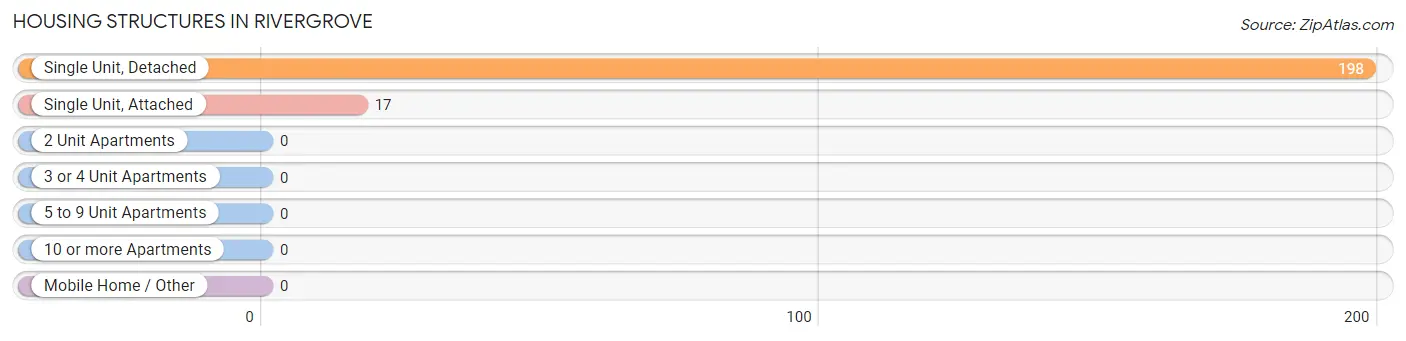
| Structure Type | # Housing Units | % Housing Units |
| Single Unit, Detached | 198 | 92.1% |
| Single Unit, Attached | 17 | 7.9% |
| 2 Unit Apartments | 0 | 0.0% |
| 3 or 4 Unit Apartments | 0 | 0.0% |
| 5 to 9 Unit Apartments | 0 | 0.0% |
| 10 or more Apartments | 0 | 0.0% |
| Mobile Home / Other | 0 | 0.0% |
| Total | 215 | 100.0% |
Housing Structures by Occupancy in Rivergrove
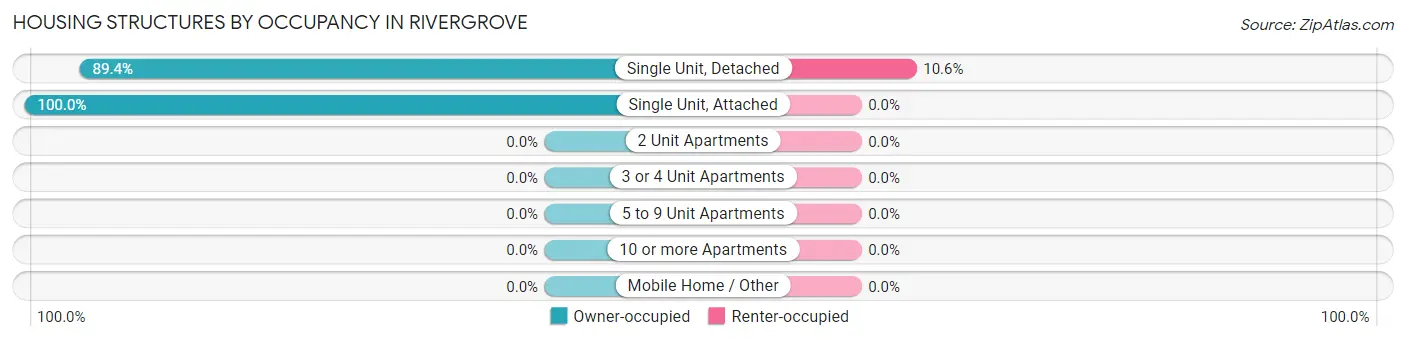
| Structure Type | Owner-occupied | Renter-occupied |
| Single Unit, Detached | 177 (89.4%) | 21 (10.6%) |
| Single Unit, Attached | 17 (100.0%) | 0 (0.0%) |
| 2 Unit Apartments | 0 (0.0%) | 0 (0.0%) |
| 3 or 4 Unit Apartments | 0 (0.0%) | 0 (0.0%) |
| 5 to 9 Unit Apartments | 0 (0.0%) | 0 (0.0%) |
| 10 or more Apartments | 0 (0.0%) | 0 (0.0%) |
| Mobile Home / Other | 0 (0.0%) | 0 (0.0%) |
| Total | 194 (90.2%) | 21 (9.8%) |
Housing Structures by Number of Rooms in Rivergrove
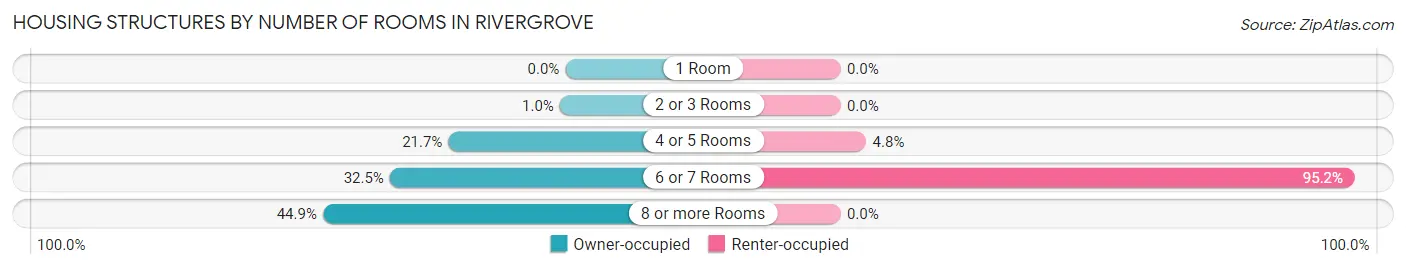
| Number of Rooms | Owner-occupied | Renter-occupied |
| 1 Room | 0 (0.0%) | 0 (0.0%) |
| 2 or 3 Rooms | 2 (1.0%) | 0 (0.0%) |
| 4 or 5 Rooms | 42 (21.6%) | 1 (4.8%) |
| 6 or 7 Rooms | 63 (32.5%) | 20 (95.2%) |
| 8 or more Rooms | 87 (44.9%) | 0 (0.0%) |
| Total | 194 (100.0%) | 21 (100.0%) |
Housing Structure by Heating Type in Rivergrove
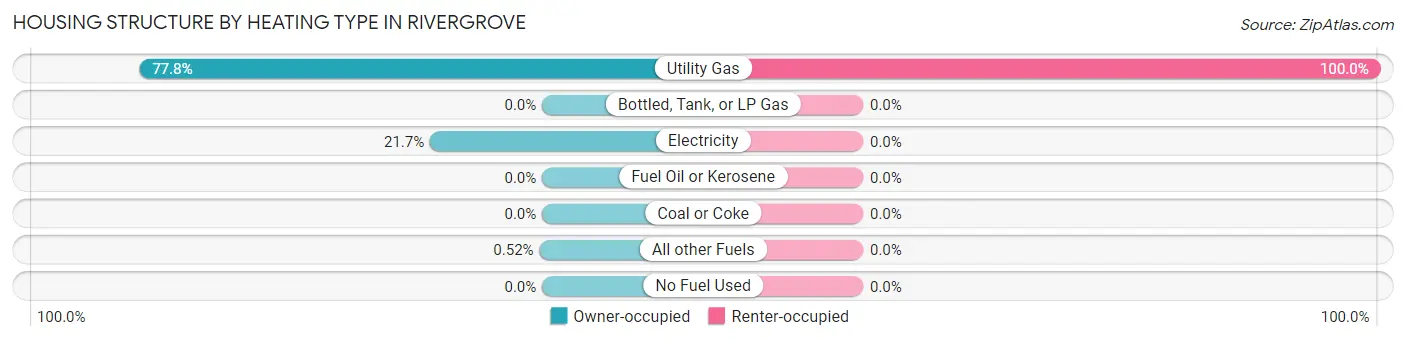
| Heating Type | Owner-occupied | Renter-occupied |
| Utility Gas | 151 (77.8%) | 21 (100.0%) |
| Bottled, Tank, or LP Gas | 0 (0.0%) | 0 (0.0%) |
| Electricity | 42 (21.6%) | 0 (0.0%) |
| Fuel Oil or Kerosene | 0 (0.0%) | 0 (0.0%) |
| Coal or Coke | 0 (0.0%) | 0 (0.0%) |
| All other Fuels | 1 (0.5%) | 0 (0.0%) |
| No Fuel Used | 0 (0.0%) | 0 (0.0%) |
| Total | 194 (100.0%) | 21 (100.0%) |
Household Vehicle Usage in Rivergrove
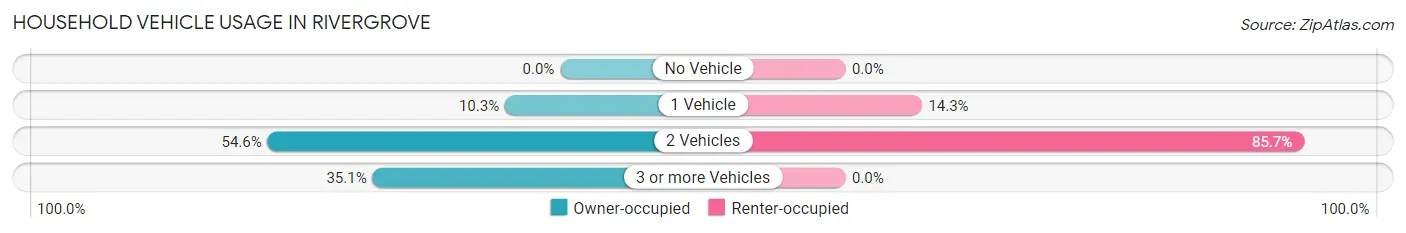
| Vehicles per Household | Owner-occupied | Renter-occupied |
| No Vehicle | 0 (0.0%) | 0 (0.0%) |
| 1 Vehicle | 20 (10.3%) | 3 (14.3%) |
| 2 Vehicles | 106 (54.6%) | 18 (85.7%) |
| 3 or more Vehicles | 68 (35.0%) | 0 (0.0%) |
| Total | 194 (100.0%) | 21 (100.0%) |
Real Estate & Mortgages in Rivergrove
Real Estate and Mortgage Overview in Rivergrove
| Characteristic | Without Mortgage | With Mortgage |
| Housing Units | 56 | 138 |
| Median Property Value | $840,900 | $789,500 |
| Median Household Income | $113,750 | $88 |
| Monthly Housing Costs | $1,040 | $90 |
| Real Estate Taxes | $7,917 | $0 |
Property Value by Mortgage Status in Rivergrove
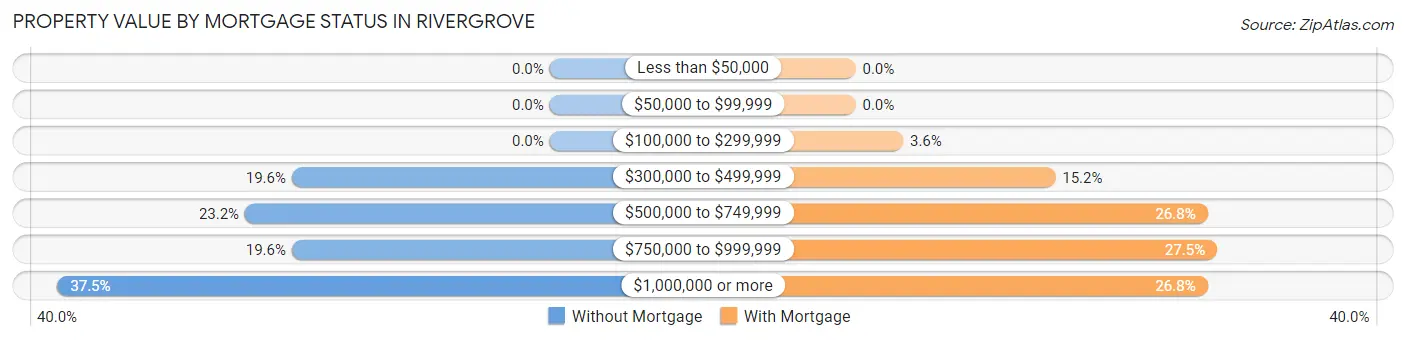
| Property Value | Without Mortgage | With Mortgage |
| Less than $50,000 | 0 (0.0%) | 0 (0.0%) |
| $50,000 to $99,999 | 0 (0.0%) | 0 (0.0%) |
| $100,000 to $299,999 | 0 (0.0%) | 5 (3.6%) |
| $300,000 to $499,999 | 11 (19.6%) | 21 (15.2%) |
| $500,000 to $749,999 | 13 (23.2%) | 37 (26.8%) |
| $750,000 to $999,999 | 11 (19.6%) | 38 (27.5%) |
| $1,000,000 or more | 21 (37.5%) | 37 (26.8%) |
| Total | 56 (100.0%) | 138 (100.0%) |
Household Income by Mortgage Status in Rivergrove
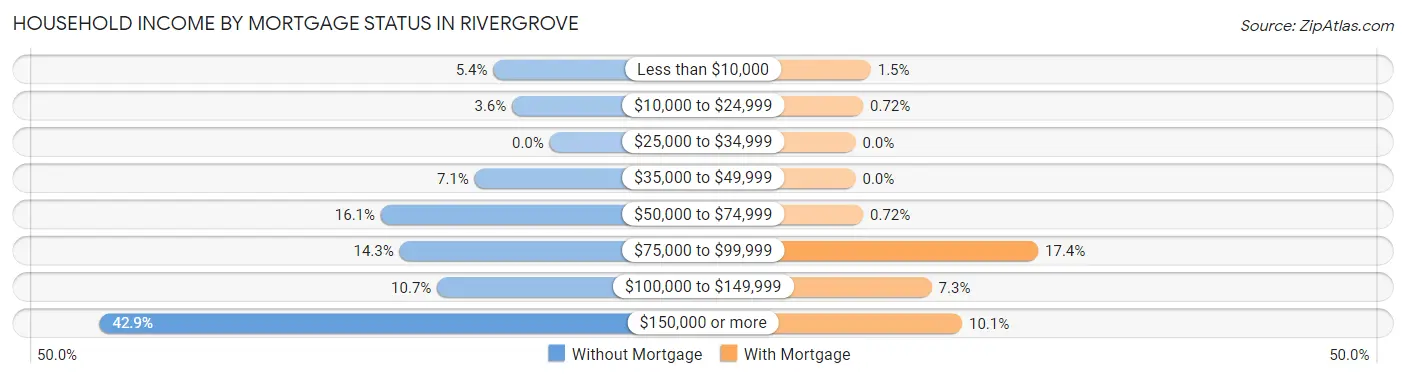
| Household Income | Without Mortgage | With Mortgage |
| Less than $10,000 | 3 (5.4%) | 2 (1.5%) |
| $10,000 to $24,999 | 2 (3.6%) | 1 (0.7%) |
| $25,000 to $34,999 | 0 (0.0%) | 0 (0.0%) |
| $35,000 to $49,999 | 4 (7.1%) | 0 (0.0%) |
| $50,000 to $74,999 | 9 (16.1%) | 1 (0.7%) |
| $75,000 to $99,999 | 8 (14.3%) | 24 (17.4%) |
| $100,000 to $149,999 | 6 (10.7%) | 10 (7.2%) |
| $150,000 or more | 24 (42.9%) | 14 (10.1%) |
| Total | 56 (100.0%) | 138 (100.0%) |
Property Value to Household Income Ratio in Rivergrove
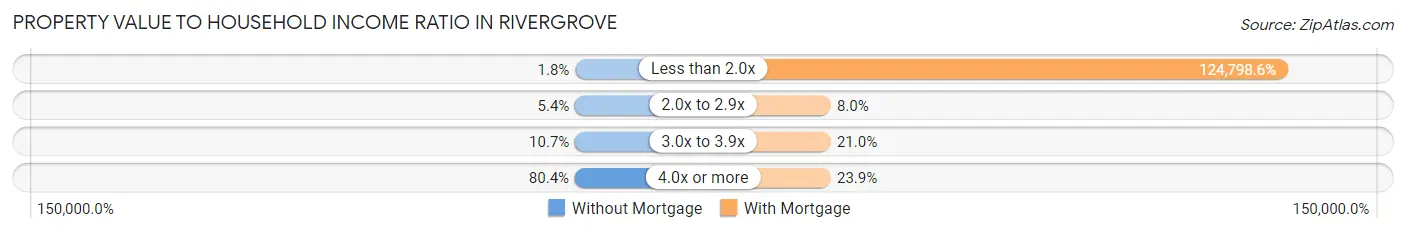
| Value-to-Income Ratio | Without Mortgage | With Mortgage |
| Less than 2.0x | 1 (1.8%) | 172,222 (124,798.6%) |
| 2.0x to 2.9x | 3 (5.4%) | 11 (8.0%) |
| 3.0x to 3.9x | 6 (10.7%) | 29 (21.0%) |
| 4.0x or more | 45 (80.4%) | 33 (23.9%) |
| Total | 56 (100.0%) | 138 (100.0%) |
Real Estate Taxes by Mortgage Status in Rivergrove

| Property Taxes | Without Mortgage | With Mortgage |
| Less than $800 | 0 (0.0%) | 1 (0.7%) |
| $800 to $1,499 | 0 (0.0%) | 0 (0.0%) |
| $800 to $1,499 | 56 (100.0%) | 1 (0.7%) |
| Total | 56 (100.0%) | 138 (100.0%) |
Health & Disability in Rivergrove
Health Insurance Coverage by Age in Rivergrove
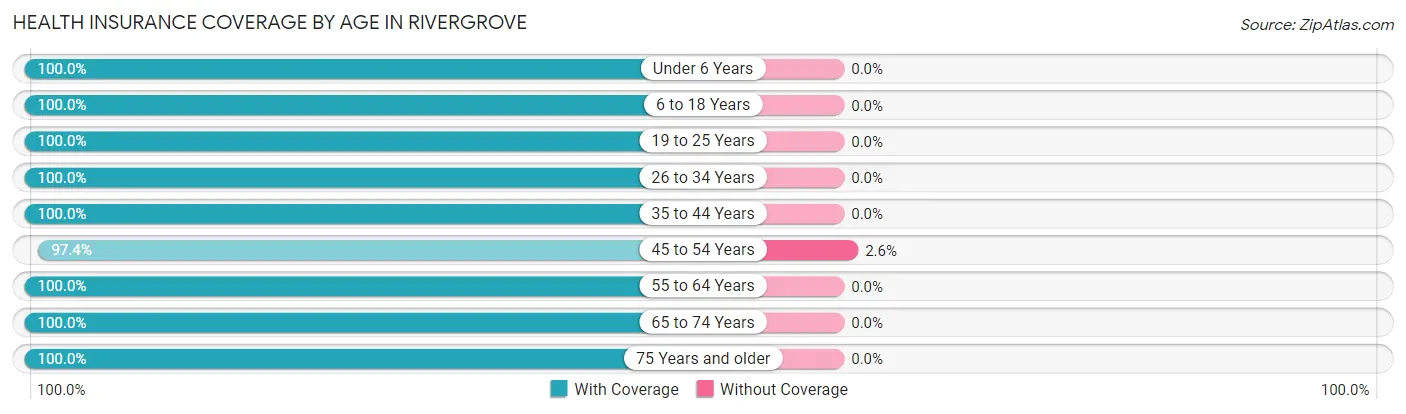
| Age Bracket | With Coverage | Without Coverage |
| Under 6 Years | 24 (100.0%) | 0 (0.0%) |
| 6 to 18 Years | 99 (100.0%) | 0 (0.0%) |
| 19 to 25 Years | 43 (100.0%) | 0 (0.0%) |
| 26 to 34 Years | 16 (100.0%) | 0 (0.0%) |
| 35 to 44 Years | 79 (100.0%) | 0 (0.0%) |
| 45 to 54 Years | 75 (97.4%) | 2 (2.6%) |
| 55 to 64 Years | 89 (100.0%) | 0 (0.0%) |
| 65 to 74 Years | 66 (100.0%) | 0 (0.0%) |
| 75 Years and older | 65 (100.0%) | 0 (0.0%) |
| Total | 556 (99.6%) | 2 (0.4%) |
Health Insurance Coverage by Citizenship Status in Rivergrove
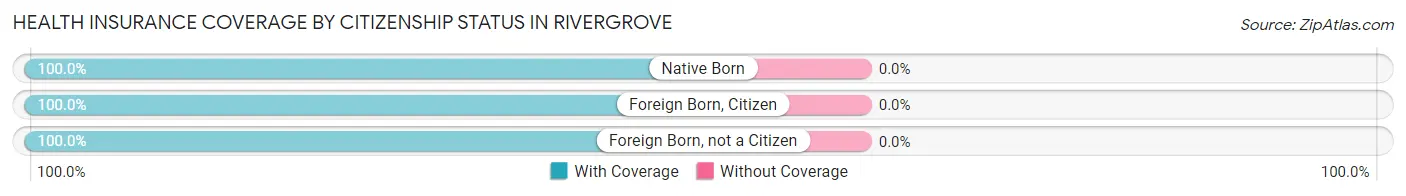
| Citizenship Status | With Coverage | Without Coverage |
| Native Born | 24 (100.0%) | 0 (0.0%) |
| Foreign Born, Citizen | 99 (100.0%) | 0 (0.0%) |
| Foreign Born, not a Citizen | 43 (100.0%) | 0 (0.0%) |
Health Insurance Coverage by Household Income in Rivergrove
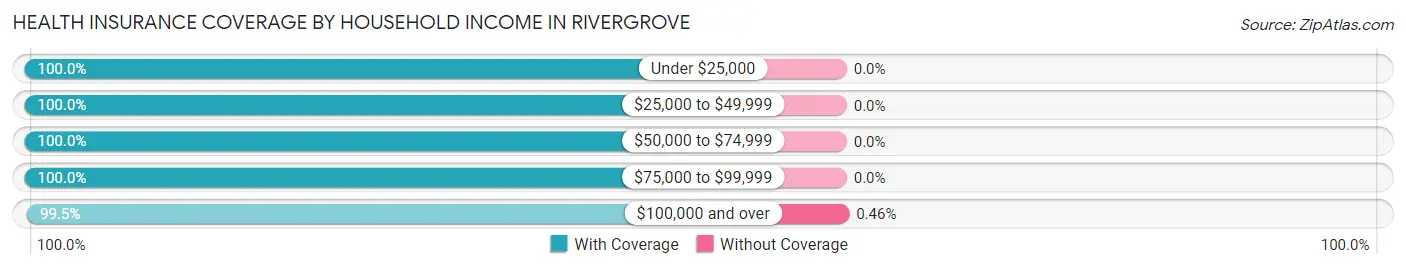
| Household Income | With Coverage | Without Coverage |
| Under $25,000 | 13 (100.0%) | 0 (0.0%) |
| $25,000 to $49,999 | 6 (100.0%) | 0 (0.0%) |
| $50,000 to $74,999 | 59 (100.0%) | 0 (0.0%) |
| $75,000 to $99,999 | 47 (100.0%) | 0 (0.0%) |
| $100,000 and over | 431 (99.5%) | 2 (0.5%) |
Public vs Private Health Insurance Coverage by Age in Rivergrove
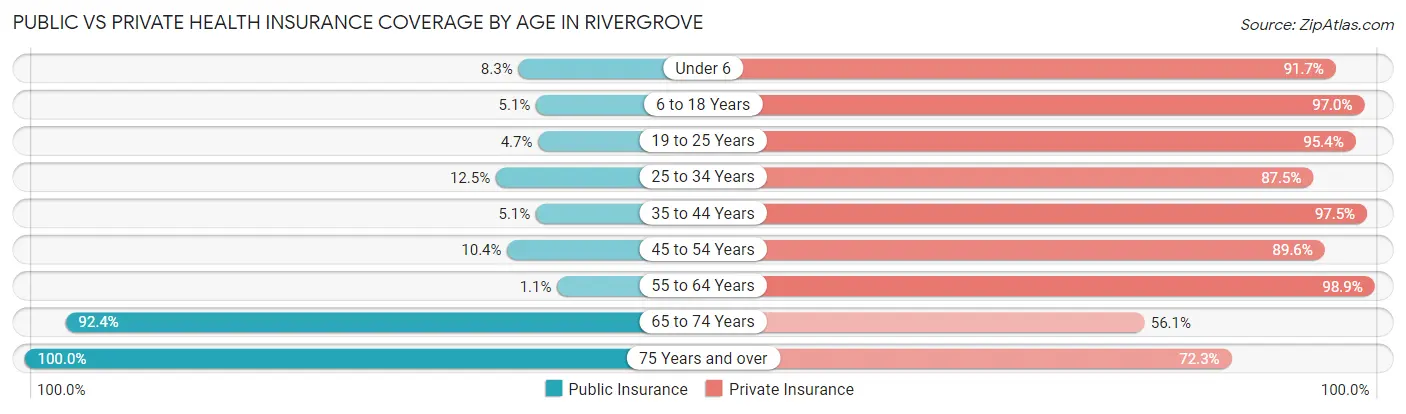
| Age Bracket | Public Insurance | Private Insurance |
| Under 6 | 2 (8.3%) | 22 (91.7%) |
| 6 to 18 Years | 5 (5.1%) | 96 (97.0%) |
| 19 to 25 Years | 2 (4.6%) | 41 (95.4%) |
| 25 to 34 Years | 2 (12.5%) | 14 (87.5%) |
| 35 to 44 Years | 4 (5.1%) | 77 (97.5%) |
| 45 to 54 Years | 8 (10.4%) | 69 (89.6%) |
| 55 to 64 Years | 1 (1.1%) | 88 (98.9%) |
| 65 to 74 Years | 61 (92.4%) | 37 (56.1%) |
| 75 Years and over | 65 (100.0%) | 47 (72.3%) |
| Total | 150 (26.9%) | 491 (88.0%) |
Disability Status by Sex by Age in Rivergrove
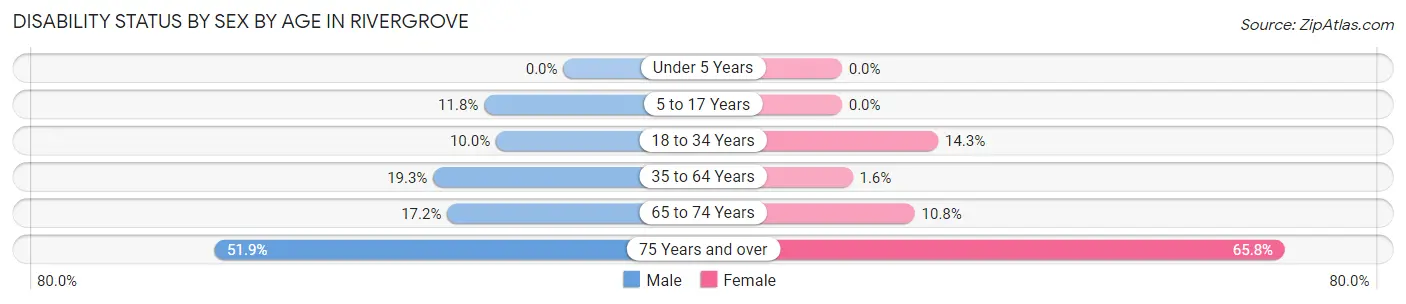
| Age Bracket | Male | Female |
| Under 5 Years | 0 (0.0%) | 0 (0.0%) |
| 5 to 17 Years | 8 (11.8%) | 0 (0.0%) |
| 18 to 34 Years | 4 (10.0%) | 4 (14.3%) |
| 35 to 64 Years | 23 (19.3%) | 2 (1.6%) |
| 65 to 74 Years | 5 (17.2%) | 4 (10.8%) |
| 75 Years and over | 14 (51.8%) | 25 (65.8%) |
Disability Class by Sex by Age in Rivergrove
Disability Class: Hearing Difficulty
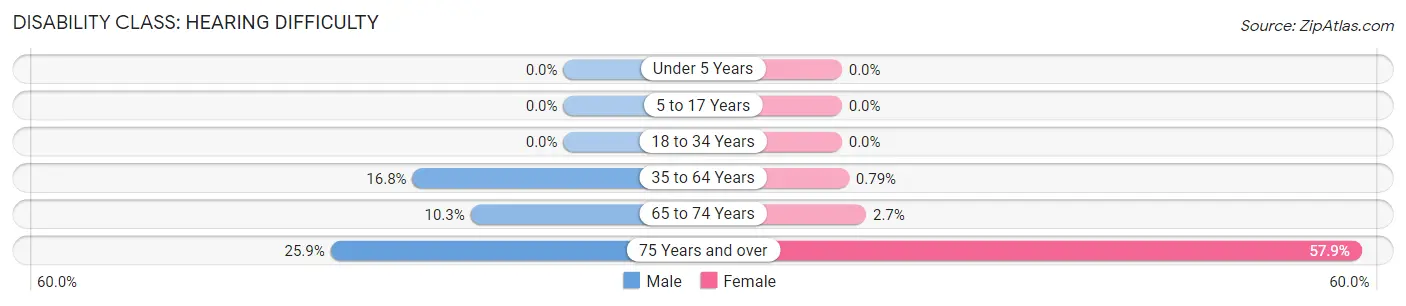
| Age Bracket | Male | Female |
| Under 5 Years | 0 (0.0%) | 0 (0.0%) |
| 5 to 17 Years | 0 (0.0%) | 0 (0.0%) |
| 18 to 34 Years | 0 (0.0%) | 0 (0.0%) |
| 35 to 64 Years | 20 (16.8%) | 1 (0.8%) |
| 65 to 74 Years | 3 (10.3%) | 1 (2.7%) |
| 75 Years and over | 7 (25.9%) | 22 (57.9%) |
Disability Class: Vision Difficulty
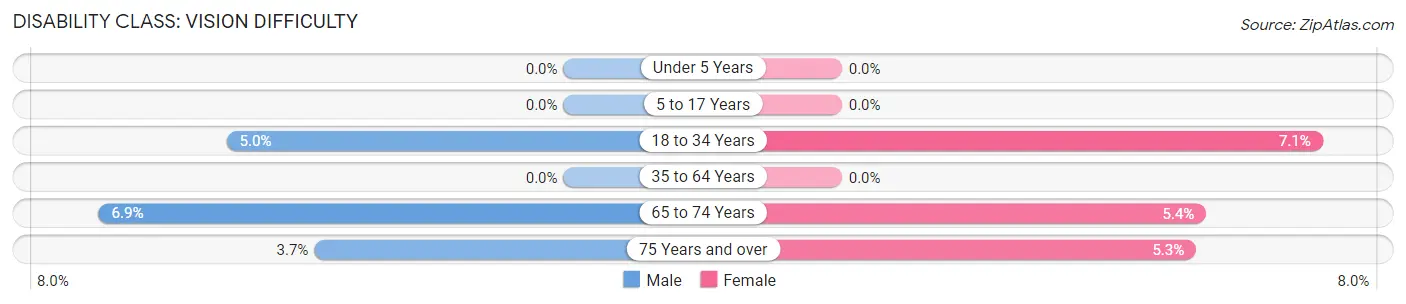
| Age Bracket | Male | Female |
| Under 5 Years | 0 (0.0%) | 0 (0.0%) |
| 5 to 17 Years | 0 (0.0%) | 0 (0.0%) |
| 18 to 34 Years | 2 (5.0%) | 2 (7.1%) |
| 35 to 64 Years | 0 (0.0%) | 0 (0.0%) |
| 65 to 74 Years | 2 (6.9%) | 2 (5.4%) |
| 75 Years and over | 1 (3.7%) | 2 (5.3%) |
Disability Class: Cognitive Difficulty
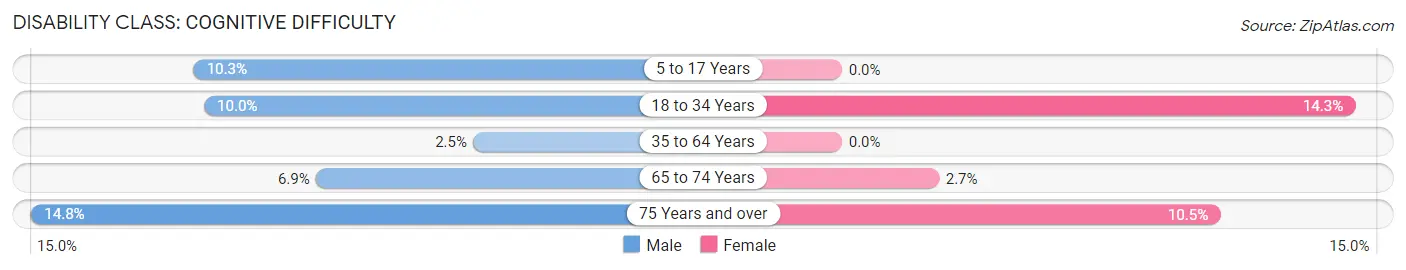
| Age Bracket | Male | Female |
| 5 to 17 Years | 7 (10.3%) | 0 (0.0%) |
| 18 to 34 Years | 4 (10.0%) | 4 (14.3%) |
| 35 to 64 Years | 3 (2.5%) | 0 (0.0%) |
| 65 to 74 Years | 2 (6.9%) | 1 (2.7%) |
| 75 Years and over | 4 (14.8%) | 4 (10.5%) |
Disability Class: Ambulatory Difficulty
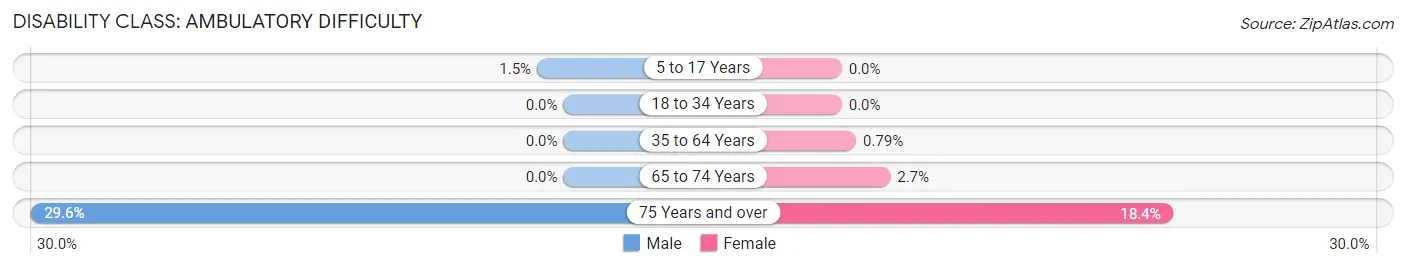
| Age Bracket | Male | Female |
| 5 to 17 Years | 1 (1.5%) | 0 (0.0%) |
| 18 to 34 Years | 0 (0.0%) | 0 (0.0%) |
| 35 to 64 Years | 0 (0.0%) | 1 (0.8%) |
| 65 to 74 Years | 0 (0.0%) | 1 (2.7%) |
| 75 Years and over | 8 (29.6%) | 7 (18.4%) |
Disability Class: Self-Care Difficulty
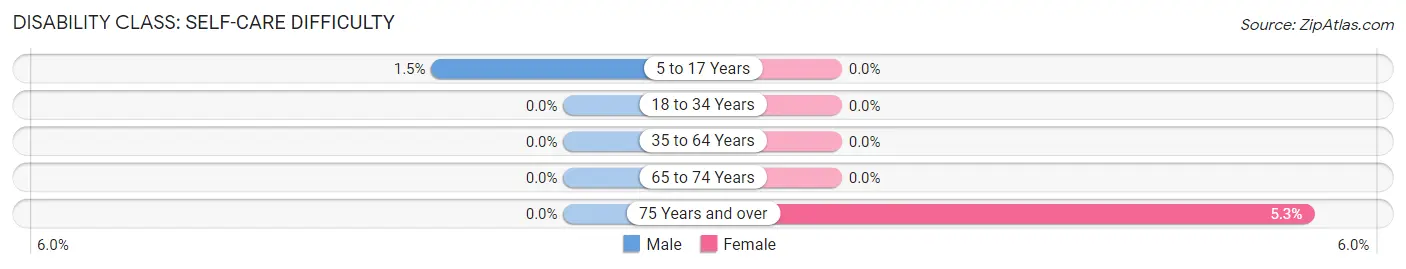
| Age Bracket | Male | Female |
| 5 to 17 Years | 1 (1.5%) | 0 (0.0%) |
| 18 to 34 Years | 0 (0.0%) | 0 (0.0%) |
| 35 to 64 Years | 0 (0.0%) | 0 (0.0%) |
| 65 to 74 Years | 0 (0.0%) | 0 (0.0%) |
| 75 Years and over | 0 (0.0%) | 2 (5.3%) |
Technology Access in Rivergrove
Computing Device Access in Rivergrove
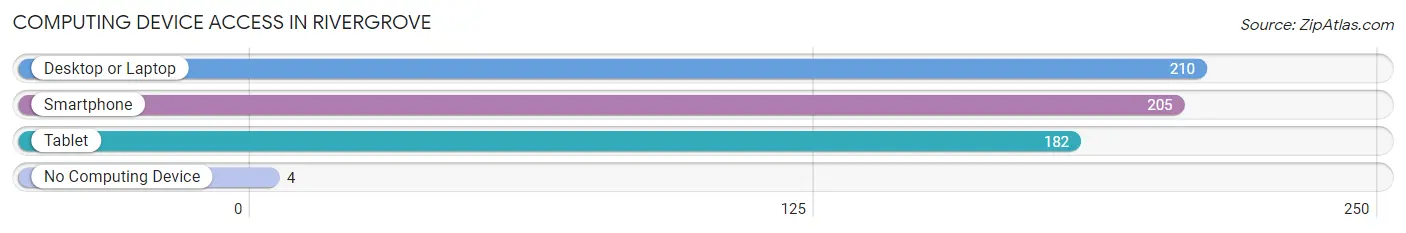
| Device Type | # Households | % Households |
| Desktop or Laptop | 210 | 97.7% |
| Smartphone | 205 | 95.4% |
| Tablet | 182 | 84.7% |
| No Computing Device | 4 | 1.9% |
| Total | 215 | 100.0% |
Internet Access in Rivergrove
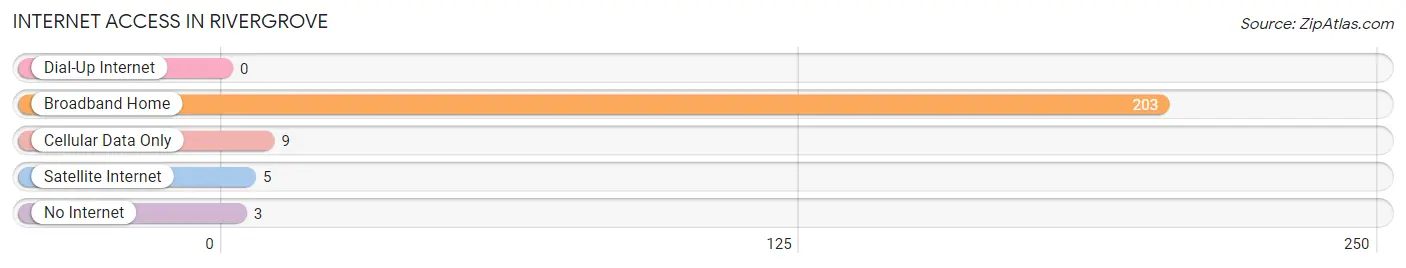
| Internet Type | # Households | % Households |
| Dial-Up Internet | 0 | 0.0% |
| Broadband Home | 203 | 94.4% |
| Cellular Data Only | 9 | 4.2% |
| Satellite Internet | 5 | 2.3% |
| No Internet | 3 | 1.4% |
| Total | 215 | 100.0% |
Rivergrove Summary
Grove, Oregon is a small city located in Clackamas County, Oregon, United States. It is located in the foothills of the Cascade Mountains, about 20 miles south of Portland. The population was 8,719 at the 2010 census.
History
The area that is now known as Rivergrove was first settled in the late 1800s by a group of German immigrants. The area was originally known as “German Town” and was home to a number of German-speaking families. In the early 1900s, the area was renamed “Rivergrove” after the nearby river.
The city was officially incorporated in 1951 and has since grown to become a thriving community. The city is known for its small-town charm and its close proximity to Portland.
Geography
Rivergrove is located in Clackamas County, Oregon, United States. It is located in the foothills of the Cascade Mountains, about 20 miles south of Portland. The city is situated on the banks of the Tualatin River, which is a tributary of the Willamette River.
The city has a total area of 2.2 square miles, all of which is land. The city is located at an elevation of approximately 200 feet above sea level.
Economy
The economy of Rivergrove is largely based on the service industry. The city is home to a number of small businesses, including restaurants, retail stores, and professional services. The city is also home to a number of technology companies, including Intel and Tektronix.
Demographics
As of the 2010 census, the population of Rivergrove was 8,719. The racial makeup of the city was 87.3% White, 4.2% Asian, 2.2% African American, 0.4% Native American, 0.1% Pacific Islander, and 4.8% from other races. Hispanic or Latino of any race were 6.3% of the population.
The median income for a household in the city was $63,917, and the median income for a family was $76,917. The per capita income for the city was $30,917. About 4.2% of families and 5.7% of the population were below the poverty line, including 6.3% of those under age 18 and 4.2% of those age 65 or over.
Rivergrove is a small city with a rich history and a vibrant economy. The city is home to a diverse population and is a great place to live and work. With its close proximity to Portland, Rivergrove is an ideal place to call home.
Common Questions
What is the Total Population of Rivergrove?
Total Population of Rivergrove is 558.
What is the Total Male Population of Rivergrove?
Total Male Population of Rivergrove is 288.
What is the Total Female Population of Rivergrove?
Total Female Population of Rivergrove is 270.
What is the Ratio of Males per 100 Females in Rivergrove?
There are 106.67 Males per 100 Females in Rivergrove.
What is the Ratio of Females per 100 Males in Rivergrove?
There are 93.75 Females per 100 Males in Rivergrove.
What is the Median Population Age in Rivergrove?
Median Population Age in Rivergrove is 47.8 Years.
What is the Average Family Size in Rivergrove
Average Family Size in Rivergrove is 2.9 People.
What is the Average Household Size in Rivergrove
Average Household Size in Rivergrove is 2.6 People.
What is Per Capita Income in Rivergrove?
Per Capita income in Rivergrove is $77,494.
What is the Median Family Income in Rivergrove?
Median Family Income in Rivergrove is $161,875.
What is the Median Household income in Rivergrove?
Median Household Income in Rivergrove is $173,750.
What is Income or Wage Gap in Rivergrove?
Income or Wage Gap in Rivergrove is 34.7%.
Women in Rivergrove earn 65.3 cents for every dollar earned by a man.
What is Inequality or Gini Index in Rivergrove?
Inequality or Gini Index in Rivergrove is 0.42.
How Large is the Labor Force in Rivergrove?
There are 266 People in the Labor Forcein in Rivergrove.
What is the Percentage of People in the Labor Force in Rivergrove?
59.1% of People are in the Labor Force in Rivergrove.
What is the Unemployment Rate in Rivergrove?
Unemployment Rate in Rivergrove is 9.4%.